 Christina Blevins1
 Geraldine Busquets-Vass1,2*
 Mario A. Pardo3
 Diane Gendron4
 Jeff K. Jacobsen5Francisco Gómez-Díaz6Héctor Pérez-Puig7Christian Daniel Ortega-Ortiz8Gisela Heckel9
 Jorge Urbán R10
 Lorena Viloria-Gómora10
 Seth D. Newsome1
- 1Biology Department, University of New Mexico, Albuquerque, NM, United States
- 2Laboratorio de Macroecología Marina, Centro de Investigación Científica y Educación Superior de Ensenada, Unidad La Paz, La Paz, Mexico
- 3Laboratorio de Macroecología Marina, Consejo Nacional de Ciencia y Tecnología - Centro de Investigación Científica y Educación Superior de Ensenada, Unidad La Paz, La Paz, Mexico
- 4Instituto Politécnico Nacional, Centro Interdisciplinario de Ciencias Marinas, La Paz, Mexico
- 5VE Enterprises, Arcata, CA, United States
- 6Museo de la Ballena y Ciencias Marinas, La Paz, Mexico
- 7Marine Mammal Program, Prescott College Kino Bay Center for Cultural and Ecological Studies, Bahía de Kino, Mexico
- 8Facultad de Ciencias Marinas, Universidad de Colima, Manzanillo, Mexico
- 9Departamento de Biología de la Conservación, Centro de Investigación Científica y de Educación Superior de Ensenada, Ensenada, Mexico
- 10Departamento Académico de Ciencias Marinas y Costeras, Universidad Autónoma de Baja California Sur, La Paz, Mexico
Migration is a complex behavior that has evolved in multiple taxonomic groups as a means of accessing productive foraging grounds and environmentally stable areas suitable for reproduction. For migratory whales that forage throughout the year because of their high energetic demands, changes in the abundance of prey in different areas along their migratory route(s) can have serious implications for individual fitness and population viability. Thus, identifying the regions these species use to forage and breed while evaluating their migratory plasticity at the individual level can provide key information for their management and conservation. Serial stable isotope analysis of whale baleen, a continuously growing but metabolically inert tissue, has proven useful in generating individual migratory and foraging records over several years prior to death. We measured carbon (δ13C) and nitrogen (δ15N) isotope values along the length of baleen plates collected from thirteen blue whales of different sex and age classes, representing the largest collection analyzed to date in the northeast Pacific Ocean. Adult females exhibited relatively stable seasonal movements between temperate latitude foraging grounds and subtropical breeding grounds, although two skipped migration one year and subsequently moved to the same subtropical breeding ground near the Costa Rica Dome, potentially to give birth. Adult males exhibited two movement strategies with most remaining at temperate latitudes for 3-4 years before death, while two migrated to subtropical breeding grounds. In contrast, movement patterns in juveniles were erratic. These results are potentially driven by the energetic requirements during pregnancy and nursing in adult females, intra-specific competition among adult males, and inexperience in locating prey in juveniles. We also describe baleen δ15N patterns in recently weaned whales (<16.5m) that reflect switching from the consumption of milk to solid food (krill). In addition, baleen δ13C data suggest that weaned whales continue to use stored nutrients (blubber) acquired during the nursing period long after they are weaned. These results broaden our understanding of habitat selection in this species, highlight the importance of nursing for the critical period after weaning, and indicate that the Costa Rica Dome is an important calving region for this endangered population.
Introduction
For many species, a single habitat does not provide enough resources throughout the annual life cycle to survive and reproduce (Dingle and Drake, 2007; Bauer et al., 2009; Chapman et al., 2014). Migration, the periodic and directional movement among different geographic areas, is a behavior that evolved in a variety of invertebrate and vertebrate taxonomic groups. It is a common ecological phenomenon that increases the probability of survival and reproductive success because animals can take advantage of seasonal pulses in resource availability and/or utilize habitats that provide protection from predators (Dingle and Drake, 2007; Bauer et al., 2009; Shaw and Couzin, 2013; Chapman et al., 2014). Migration is often linked to the reproduction strategies used by animals, which can be generally divided into income breeding and capital breeding. Income breeders continuously ingest nutrients throughout migration for survival and reproduction, while capital breeders use stored resources to reproduce (Jönsson, 1997; Langin et al., 2006). While understanding the relationship between migratory patterns and breeding strategies is a fundamental aspect of a species’ ecology, our ability to study animal migration and habitat use has logistical limitations, including the high cost of satellite tags to track individual movement and the low temporal residency of tags on whale bodies, difficulty of obtaining in situ observations, and the lack of long-term databases that describe inter-individual variability in migratory patterns. These limitations are especially common in wide-ranging and cryptic marine organisms.
Resources in marine pelagic ecosystems are generally patchily distributed. In particular areas and seasons, however, oceanographic conditions can generate consistent and reliable primary production that is targeted by large aggregations of consumers. Consequently, some income breeding species with high energetic demands migrate long distances to access these productive foraging areas. For example, the population of blue whales (Balaenoptera musculus) in the northeast Pacific Ocean migrates seasonally and feeds year round in highly productive ecosystems like the California Current Ecosystem (summer-fall) (Palacios et al., 2019; Rockwood et al., 2020), the Gulf of California (winter-spring) (Gendron, 1992; Gendron, 2002; Sears et al., 2013; Busquets-Vass et al., 2021), and the Costa Rica Dome (winter-spring) (Mate et al., 1999) where seasonal aggregations of their primary prey (euphausiids) occur in high abundance (Gendron, 1992; Fiedler et al., 1998; Fiedler, 2002; Croll et al., 2005; Lluch-Cota et al., 2007; Matteson, 2009). In contrast to strict capital breeders that may fast for months on the wintering/breeding grounds (i.e., southern right whales, Eubalaena australis, Carroll et al., 2021), blue whales likely fast for short periods of time while transiting between summer and winter foraging grounds (Bailey et al., 2009). This strategy makes blue whales particularly vulnerable to changes in resource availability because of their high energetic requirements (Acevedo-Gutiérrez et al., 2002), and whales in poor body condition are frequently observed during years characterized by low primary productivity (Casillas-López, 2016; Wachtendonk et al., 2022). Studies that address individual migratory and dietary strategies of this species are needed to better understand habitat use, and how this varies among age and sex categories, which in turn would provide information on population dynamics that are critical to their management and conservation.
Studying the migratory and dietary strategies of baleen whales is challenging due to their wide range distribution and long dive patterns, which limit observation. The development of satellite tagging technology (Mate et al., 1999; Palacios et al., 2019) and analysis of intrinsic biomarkers (Busquets-Vass et al., 2017; Busquets-Vass et al., 2021) have emerged in response to the growing need for data on migratory marine mammal populations (Hobson, 1999; Newsome et al., 2010). Specifically, the use of stable isotope analysis (SIA) has increased exponentially in the past three decades to study the foraging ecology (Bentaleb et al., 2011; Witteveen et al., 2012; Fleming et al., 2016; Busquets-Vass et al., 2021), habitat use (Gendron et al., 2001; Gauffier et al., 2020), migratory patterns (Lee et al., 2005; Busquets-Vass et al., 2017), and physiology (Schell et al., 1989; Busquets-Vass et al., 2017) of this elusive taxonomic group. Several factors influence variation in carbon (δ13C) and nitrogen (δ15N) isotope values of animals, including: (1) spatial and temporal variation in the isotopic composition of the base of the food web can cascade up food chains to top consumers like marine mammals; (2) physiologically-mediated isotopic discrimination that occurs between a consumer and its diet; and (3) physiological controls on isotopic incorporation and growth rates for metabolically active and inactive tissues, respectively. Metabolically active tissues record the diet ingested from minutes/hours (CO2), weeks (blood), months (skin, muscle) to years (bone collagen) (Hobson and Clark, 1993; Hobson, 1999; Newsome et al., 2010). In contrast, metabolically inert but continuously growing tissues (e.g., whiskers, baleen) can be sub-sampled to create a longitudinal ecological and eco-physiological record for a single individual animal (Hobson and Schell, 1998; Hobson, 1999; Wunder, 2012; Busquets-Vass et al., 2017).
In the northeast Pacific Ocean, blue whales generally use the California Current Ecosystem (CCE) (Figure 1) in summer and fall (Mate et al., 1999; Etnoyer et al., 2006; Calambokidis et al., 2009a), which is considered the main foraging ground for this population. Most whales migrate south to spend the winter and spring in one of two regions: a well-described calving ground in the Gulf of California (GC) (Gendron, 2002; Sears et al., 2013), or the Costa Rica Dome (CRD) (Mate et al., 1999; Matteson, 2009), where calves have also been observed, but less is known about this potentially important breeding area. These three ecosystems exhibit contrasting baseline δ15N values, which are recorded in blue whale tissues (i.e., skin and baleen) and their primary prey (i.e., krill and lanternfish) found in these areas (Busquets-Vass et al., 2017; Busquets-Vass et al., 2021). These baseline differences have been used to assess blue whale migratory strategies and quantify the relative importance of prey from different regions to the diet of blue whales (Busquets-Vass et al., 2017; Busquets-Vass et al., 2021). For example, adult females migrated seasonally among ecosystems, whereas some males remained within the CCE during at least the ~4 years represented in baleen records (Busquets-Vass et al., 2017). Furthermore, mixing models based on isotope analysis of skin and potential prey that most whales forage in the CCE, but there are subgroups of whales that forego migration and remain within the CRD or the GC for at least a year (Busquets-Vass et al., 2021). Collectively, these studies provide strong evidence that blue whales exhibit individual migratory and foraging strategies that are likely sex- and age-specific. Further analysis of serially sub-sampled baleen plates collected from different age and sex categories could provide additional information on how blue whales use different regions in the northeast Pacific Ocean, which could help identify critical foraging and breeding grounds for this endangered species (Cooke, 2018).
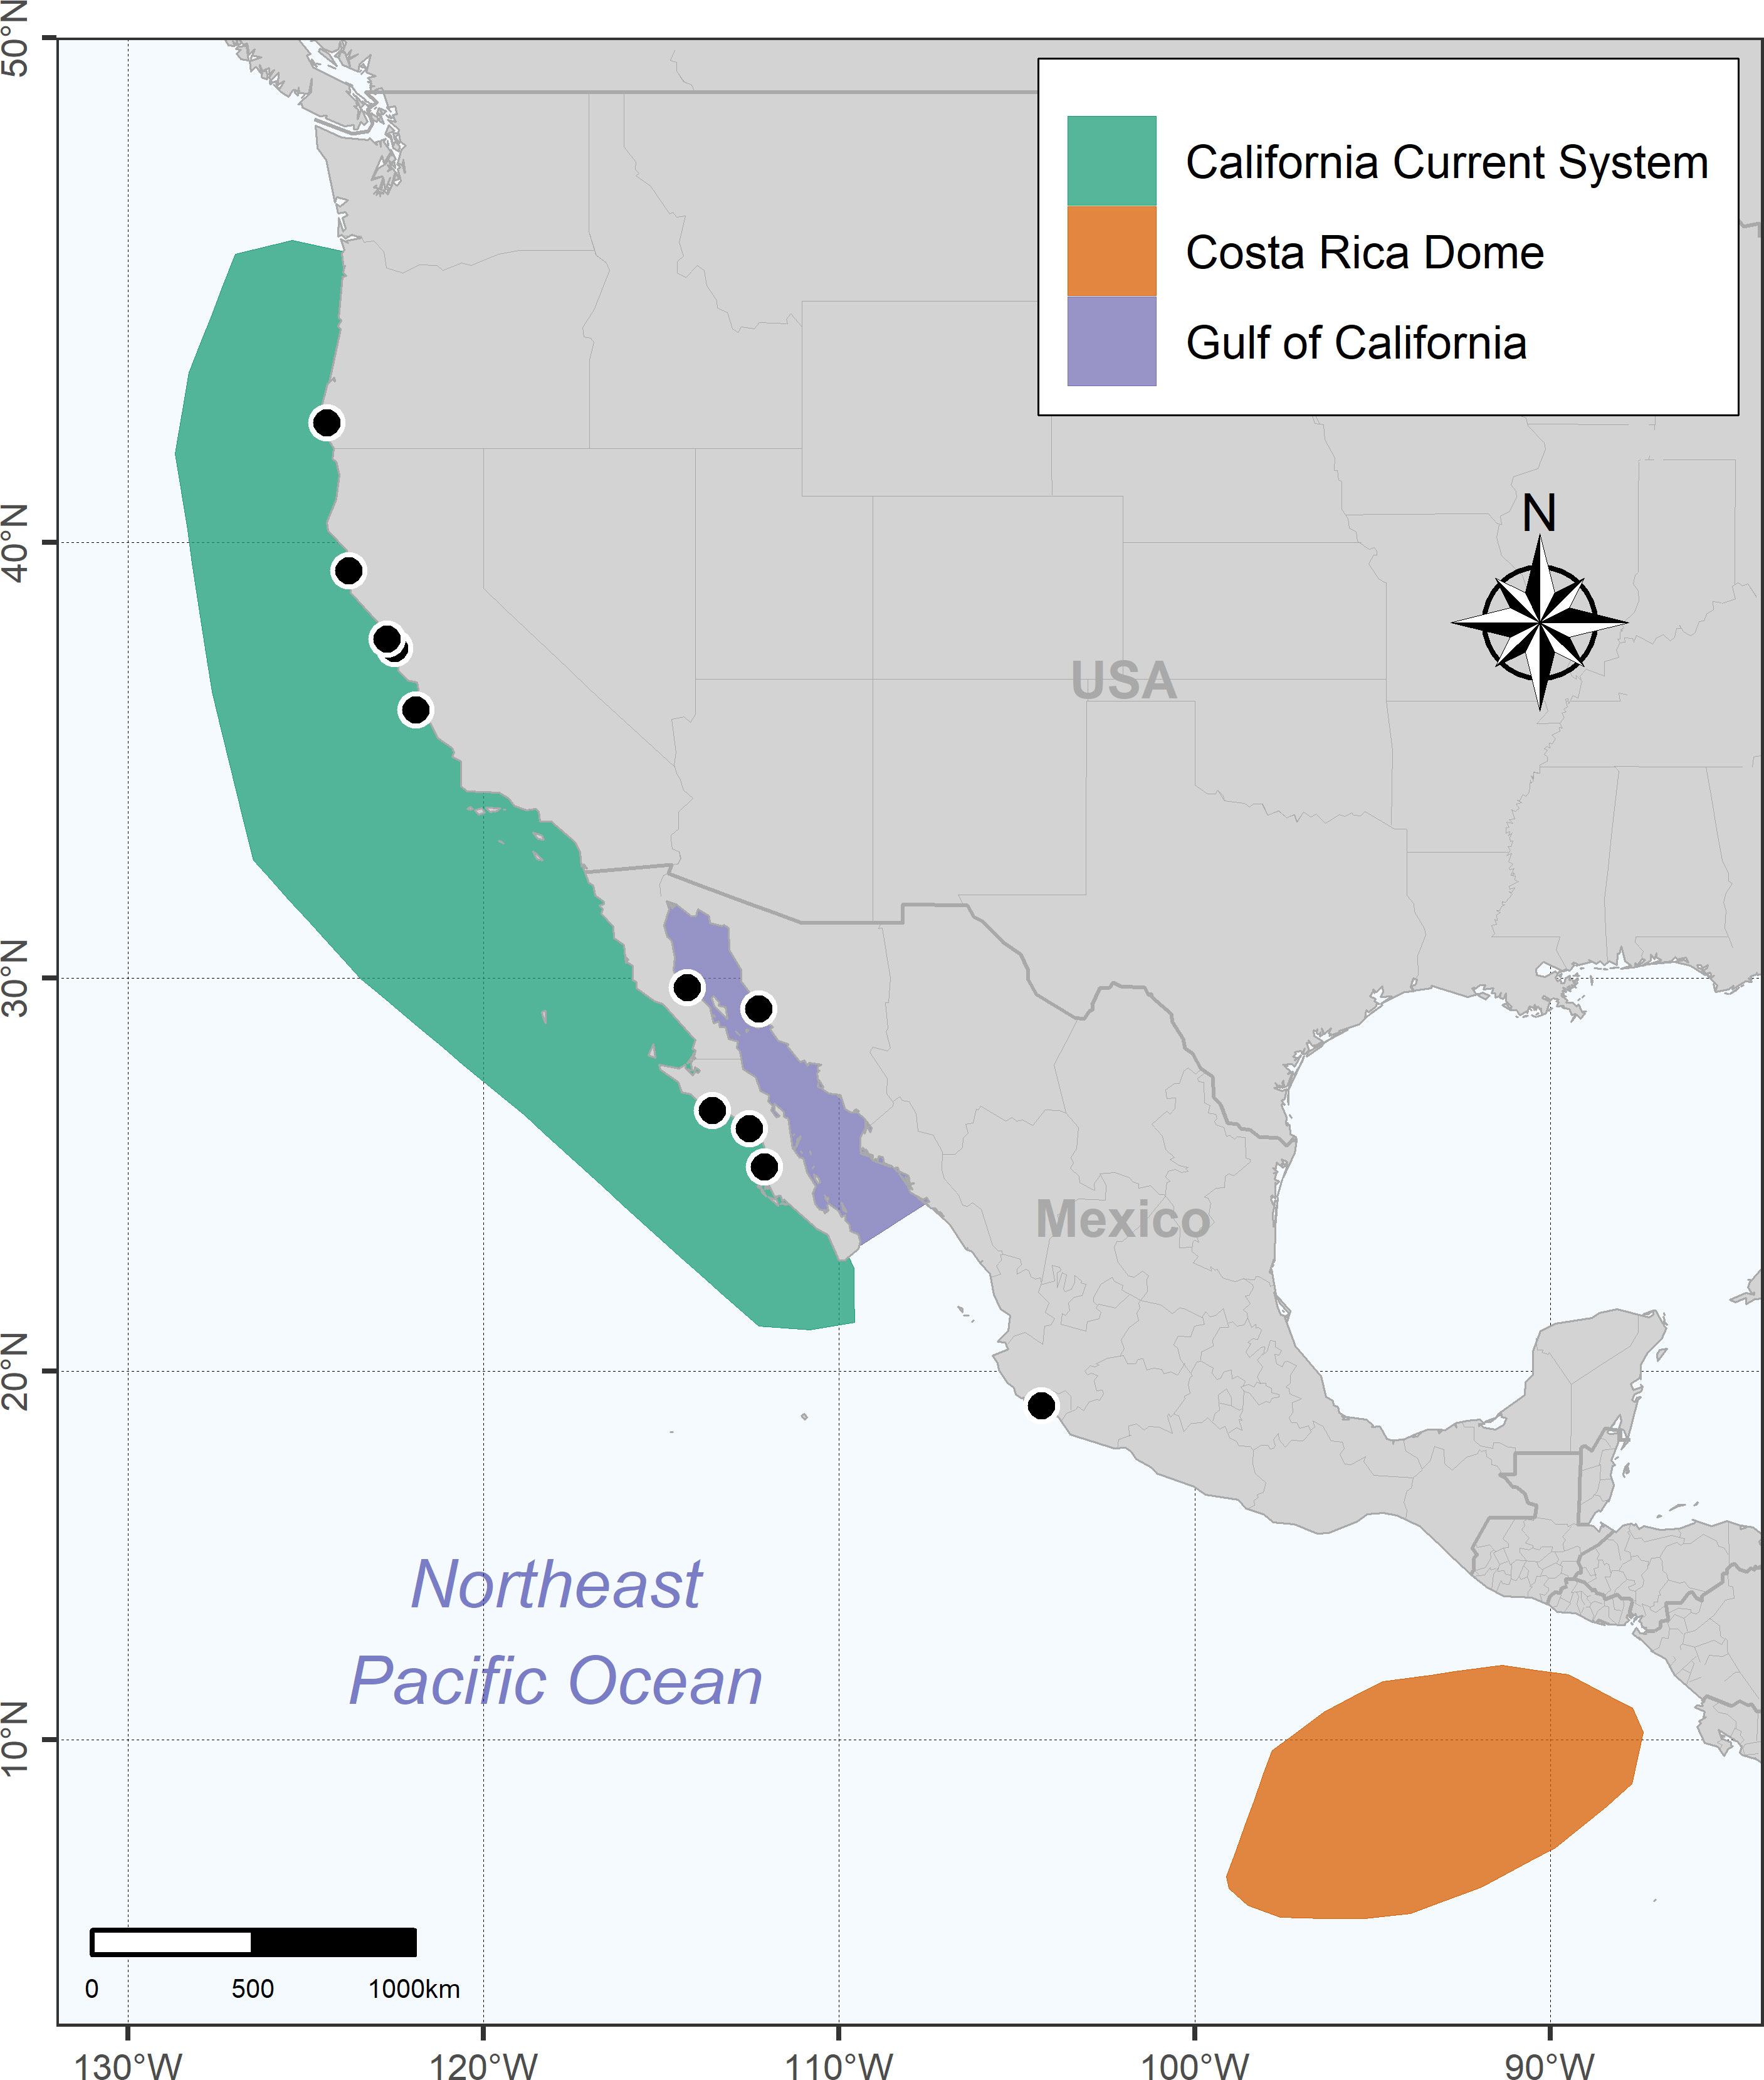
Figure 1 Map showing the twelve stranding locations (black dots) from which blue whale baleen plates were collected. Note that the exact stranding location for whale F was not available, although it was confirmed that the stranding occurred somewhere in California, USA, in the 80s. The map also shows the regions that blue whale typically visit in the northeast Pacific Ocean, including the California Current Ecosystem (CCE), Gulf of California (GC), and Costa Rica Dome (CRD).
The aim of this study was to characterize the individual migratory patterns and dietary strategies of blue whales of different sex and age categories via δ13C and δ15N analysis of sub-sampled baleen plates collected from thirteen stranded blue whales in the northeast Pacific Ocean. We analyzed oscillations in both isotope systems at seasonal and interannual scales, estimated the isotopic niche size of each whale, and used mixing models to quantify the relative contribution of different foraging regions to each whale’s diet. Our results suggest that whales of different sex and age classes generally showed different migratory strategies; however, we found some degree of individual variation within these categories. We also identified how δ13C and δ15N patterns in recently weaned blue whales provide insights into the critical transition from the consumption of milk to solid foods, and show that nutrients obtained during nursing are essential for the survival of young whales long after they are weaned. Overall, these results provide novel information on the ecology of this endangered cetacean that can contribute to the further refinement of management plans.
Materials and methods
Sample collection
Baleen plates were collected directly from dead whales or obtained from museums and stranding networks (Table 1) under special permits issued by Mexican (Secretaría de Medio Ambiente y Recursos Naturales-SEMARNAT) and U.S. (National Oceanic and Atmospheric Administration-National Marine Fisheries Service- NOAA/NMFS) government agencies. Samples were transported via the Convention on International Trade in Endangered Species of Wild Fauna and Flora (CITES) permits (CITES import permit-19US774223/9 and export permit-MX102653). A total of 13 baleen plates from 4 adult males, 3 adult females, 1 juvenile female, 1 juvenile male, 3 recently weaned whales, one male of unknown age, but likely an adult, were analyzed for this study. Whale L (Table 1) was submerged in water when sampling occurred and the entire plate could not be collected, so only a portion of the distal section of the plate was available for analysis. These plates were collected over 33 years (1985-2019) and represent the largest collection of baleen plates from a single blue whale population in the world (Figure 1).
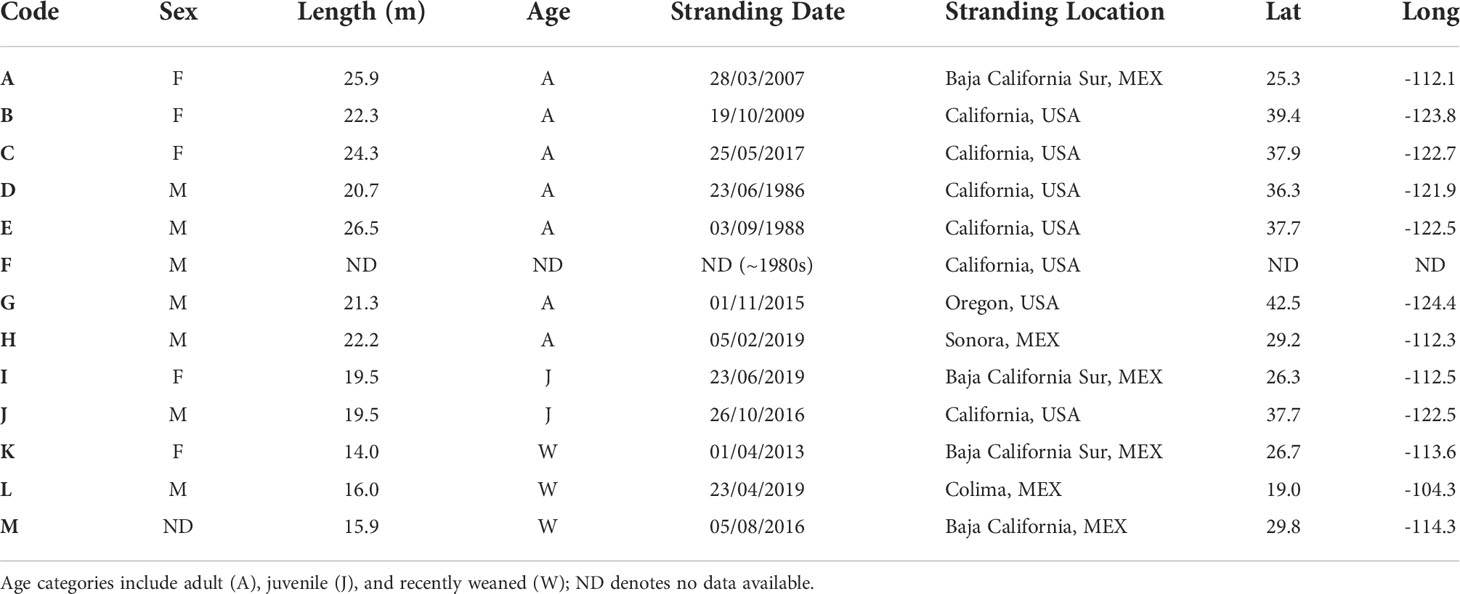
Table 1 Baleen plates collected from dead blue whales in the northeast Pacific Ocean.
Sample preparation
Multiple adjacent plates were collected from each individual and a knife was used to cut through the soft tissue that binds them together. Soft tissue was scraped from the top of each plate using a scalpel or removed by hand. To remove surface contaminants, baleen plates were rinsed with a 2:1 chloroform methanol solvent solution. Plates were then dried and covered in aluminum foil to avoid contamination before sub-sampling for stable isotope analysis.
Baleen plates are comprised of keratin, a metabolically inert tissue that continuously grows transversally and can be sub-sampled to create a longitudinal ecological and eco-physiological record of each whale over the course of ~4-5 years prior to death, depending on the baleen length. A previous study estimated the mean ( ± SD) growth rate of baleen for eastern Pacific blue whales to be 15.5 ± 2.2 cm yr-1 (Busquets-Vass et al., 2017), and similar values have been estimated for North Atlantic blue whales (~13.5 cm yr-1; Trueman et al., 2019). Baleen plates were sub-sectioned into ~1 cm intervals using a measuring tape positioned along the outer edge of each plate. Samples of keratin powder were collected from each centimeter using a Dremel rotary drill on the outer edge of the plate. This sampling strategy integrates the cortex and the medulla of the baleen (Rita et al., 2019) into a single integrated sample and follows the methodology previously used for sampling blue whale baleen plates (Busquets-Vass et al., 2017). We started at the proximal edge that was embedded in the whale´s gum, which represents the most recently synthesized tissue. Due to the uniform growth of baleen, this sampling strategy yielded samples that approximately represent equal time intervals (Busquets-Vass et al., 2017). Plates and equipment were cleaned between collection of each sub-sample with ethanol. Each powdered sub-sample was stored in sterilized and labeled plastic microcentrifuge tubes. Previous studies have shown that adjacent baleen plates in gray whales (Eschrichtius robustus; Caraveo-Patiño and Soto, 2005) and plates from opposing sides of the mouth in bowhead whales (Balaena mysticetus; Schell et al., 1989) exhibit consistent isotope values, therefore we assumed that each baleen plate yields a reliable multi-year record of the foraging history of each blue whale. Moreover, the growth rate of baleen located in different sections of the rack (filtering apparatus) of Balaenopterids is constant, thus we assumed the isotope values of baleen plates collected from different sections of the rack are comparable (García-Vernet et al., 2018; Aguilar and Borrell, 2021).
Stable isotope analysis
Approximately 0.5–0.6 mg of each baleen sub-sample was weighed into tin capsules. Carbon (δ13C) and nitrogen (δ15N) isotope values were measured with a Costech 4010 elemental analyzer (Valencia, CA) coupled to Delta V Plus isotope ratio mass spectrometer (Bremen, Germany) at the University of New Mexico Center for Stable Isotopes (Albuquerque, NM). Isotope data are reported as delta (δ) values, which are calculated with the formula: δ13C or δ15N = 1000 [(Rsample/Rstandard)—1], where R = 13C/12C or 15N/14N ratio of sample and standard. Values are in units of parts per thousand, or per mil (‰). The internationally accepted standards are Vienna-Pee Dee Belemnite limestone (V-PDB) for δ13C and atmospheric N2 for δ15N. Within-run analytical precision (SD) was estimated via analysis of two proteinaceous internal reference materials, which was ±0.2‰ for both δ13C and δ15N. We also measured the weight percent carbon and nitrogen concentration of each sample and used the C/N ratio as a proxy of sample macromolecular composition (Logan et al., 2008). We analyzed isotope values of seven baleen plates (Table 1: C–M) and used published values from Busquets-Vass et al. (2017) for six whales (Table 1: A, B, D–G). To organize the entire collection of baleen plates by age class, the letter codes used by Busquets-Vass et al. (2017) were modified to complement the larger dataset reported here.
Analysis of temporal oscillations in isotope values of adult and juvenile whales
Temporal variation in isotope values along baleen plates was evaluated by estimating interannual and seasonal Bayesian random effects on each time series of δ13C (Suess Corrected δ13C, see section below) or δ15N using an integrated nested Laplace approximation (INLA; Rue et al., 2009) with the package R-INLA for the R language (R Core Team, 2021). The longitudinal nature of the data, and therefore the lack of independency between consecutive values, was acknowledged by introducing a random walk effect (RW) of the Julian day as the main process (Rue and Held, 2005; Gómez-Rubio, 2020). We tested for first and second order random walks and chose the one with lowest Watanabe-Akaike Information Criterion (WAIC; Rue and Held, 2005; Gómez-Rubio, 2020). The default precision of the intercept was set to the analytical precision of δ13C or δ15N measurements (SD = 0.2‰). The aim of this analysis was to characterize the temporal trends in each isotope system, separating the interannual and the seasonal signals, which would show the migration consistency and amplitude between contrasting foraging regions. A higher hyper-standard deviation (HSD) of the random effects would mean a stronger effect of that scale on that animal, and that such temporal scale explains a high proportion of the variability (Rue and Held, 2005; Rue et al., 2009; Gómez-Rubio, 2020). In this case, HSD values would be comparable only between whales within the same isotope system and in the same temporal scale. The latter condition is because the seasonal and interannual scales are independent signals and therefore, it is possible that an animal has a strong consistent seasonal variation, but very low interannual variation, and vice versa.
For fitting these models, the length (cm) of each baleen plate was converted into a temporal axis by using the date of stranding as the initial reference to infer the specific months and years contained in each plate. We used the available estimation of blue whale baleen growth rate (15.5 ± 2.2 cm y-1; Busquets-Vass et al., 2017) and converted each sequential sampling point into a Julian day. We fitted the interannual and seasonal models only for adult and juvenile whales with stranding date information (nine baleen plates total). We did not have stranding information for whale F, which exhibited isotopic oscillations that were like those of adult males (see Results), thus we assume this animal was an adult male. Therefore, for whale F, we could only estimate the number of years represented by the baleen plate, but not specific dates.
Spatial baseline gradients among the ecosystems that blue whales use in the northeast Pacific have been reviewed in previous papers and show that the GC has higher δ15N values (14.4–16.9‰) than the CCE (11.9–12.9‰), while the CRD (9.2–11.4‰) has the lowest baseline δ15N values of the three regions (Williams et al., 2014; Busquets-Vass et al., 2017; Busquets-Vass et al., 2021). We used published prey isotope data to assign sections of each baleen plate to a specific foraging region, corrected for trophic discrimination (see Materials and Methods: Isotope Mixing Models), and estimate the expected isotope values of baleen if the tissue was isotopically equilibrated to each foraging region (Busquets-Vass et al., 2017; Busquets-Vass et al., 2021). This was only possible for δ15N data because of the extensive overlap in δ13C values of potential prey among regions (Busquets-Vass et al., 2017; Busquets-Vass et al., 2021). We used previously published δ15N data of all recognized primary prey for blue whales from each foraging region (Busquets-Vass et al., 2017; Busquets-Vass et al., 2021). Blue whale diets have been described in the northeast Pacific via “in situ” observations and analysis of fecal samples collected in the GC, CCE, and CRD. In the CCE, blue whales primarily feed on dense aggregations of two temperate krill species (Thysanoessa spinifera and Euphausia pacifica) (Fiedler et al., 1998; Croll et al., 2005; Nickels et al., 2018). In the GC, blue whales feed on a combination of dense aggregations of the subtropical krill (Nyctiphanes simplex) (Gendron, 1992; Del Angel-Rodríguez, 1997) and lanternfish (Family: Myctophidae) (Jiménez-Pinedo, 2010), whereas in the CRD whales have been observed feeding on krill of unknown species (Matteson, 2009).
To characterize the migratory strategies of blue whales, we assumed that the spatial gradients in potential blue whale prey among foraging regions were relatively stable through time. This assumption has been addressed in previous papers (Busquets-Vass et al., 2017; Busquets-Vass et al., 2021). Briefly, blue whale prey isotope values in the CCE are consistent between sites (Monterey Bay, Northern California Current, British Columbia) and across decades (1994, 2000-2001, 2013) (Sydeman et al., 1997; Miller, 2006; Becker et al., 2007; Hipfner et al., 2010; Carle, 2014). Previous work has also shown that zooplankton δ15N values in the CCE are consistent over decadal scales (Rau et al., 2003). In the GC, there are marked latitudinal baseline gradients in δ15N north and south of Midriff Islands (Díaz-Gamboa et al., 2018), which produces a large range in krill δ15N values (Busquets-Vass et al., 2017; Busquets-Vass et al., 2021). In addition, the opportunistic consumption of lanternfish also results in higher values in blue whale tissues in this region compared to the CCE and CRD. Therefore, baleen δ15N values as low as ~14‰ and as high as ~17‰ indicate foraging within the GC (Figure 2). Krill collected in the CRD have lower δ15N values compared to the GC and CCE (Williams, 2013; Williams et al., 2014), and δ15N data from blue whale individuals that forage in this region are consistently lower in comparison to whales that forage in the GC and CCE (Busquets-Vass et al., 2017; Busquets-Vass et al., 2021).
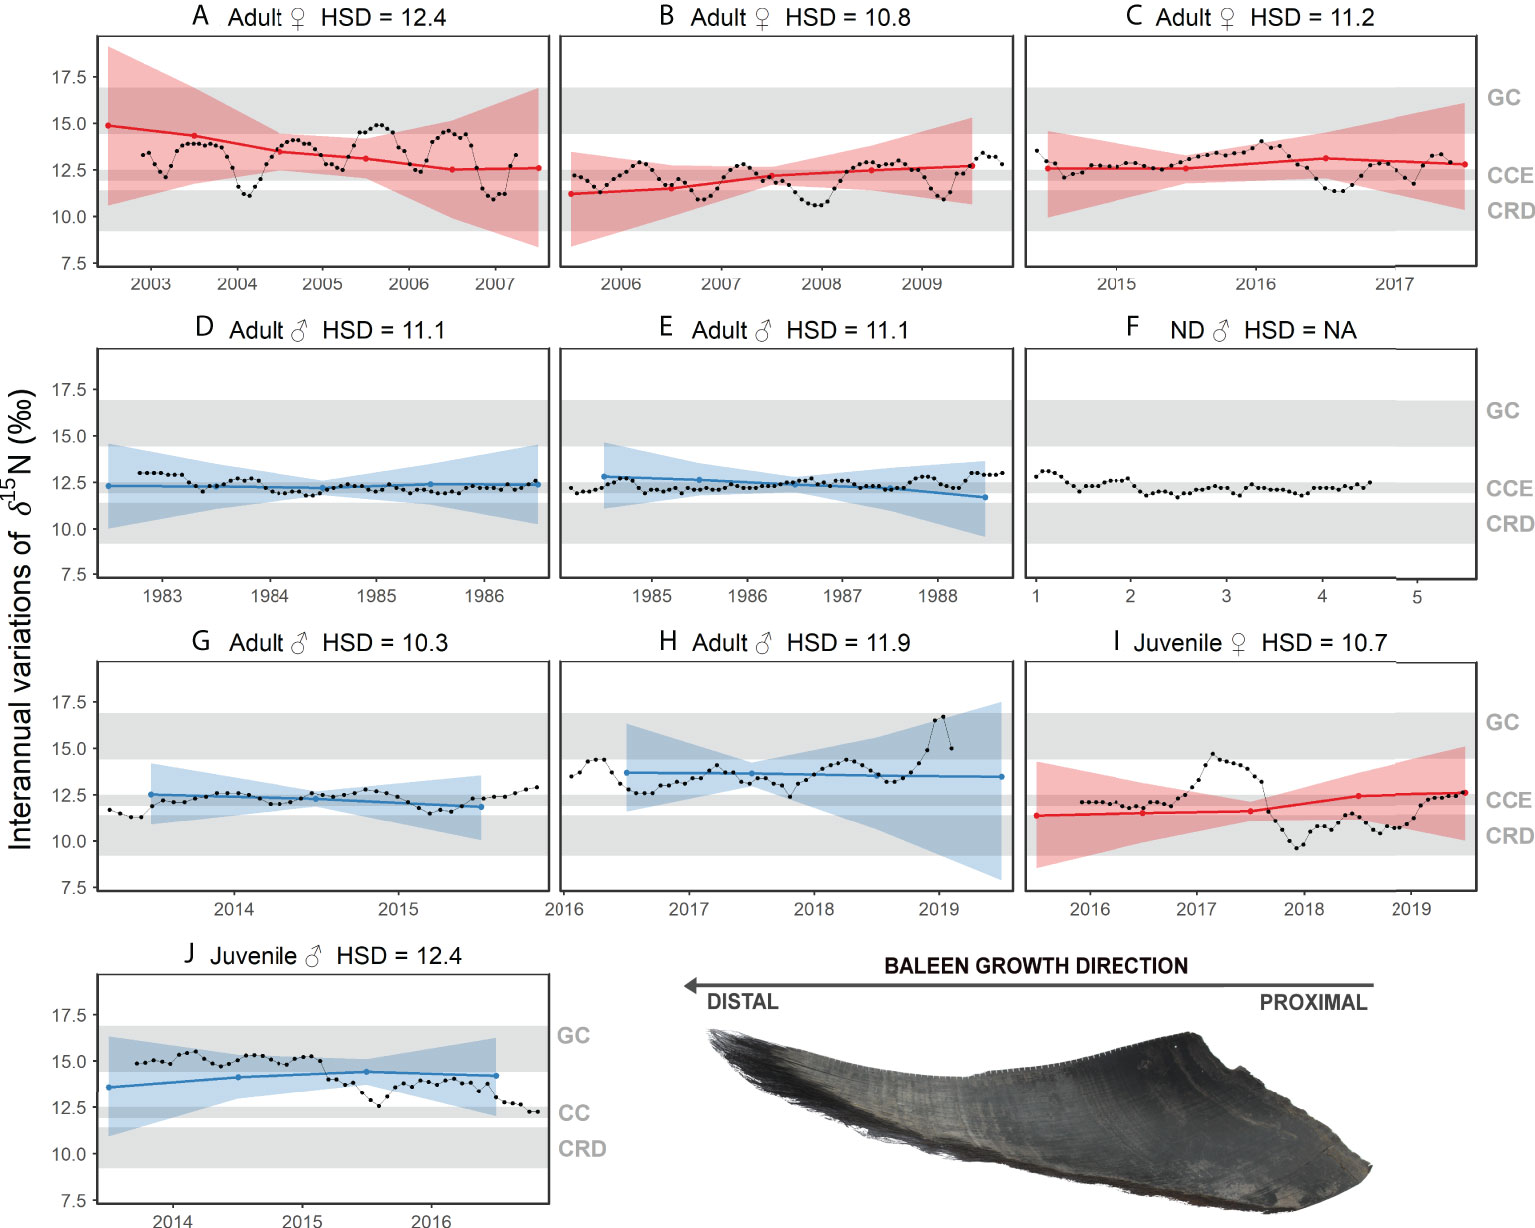
Figure 2 Interannual random effects on δ15N values along nine individual blue whale baleen plates as a function of time. The hyper-standard deviation (HSD) of the random-effect likelihoods is reported for each whale. Colors represent females (red), and males (blue). Colored dots and lines are the medians of the random effects, and colored shaded areas are the 95%-credible intervals. Gray shading represents the expected δ15N values of baleen of blue whales foraging in the Gulf of California (GC), California Current Ecosystem (CCE), and the Costa Rica Dome (CRD). Figure shows whales (A–J). HSD could not be estimated for whale (F) given the lack of information on stranding date, so the temporal scale corresponds to the number of years reflected in the baleen record.
Suess effect corrections
We used the SuessR package for R language to correct baleen δ13C values for the Suess Effect (Clark et al., 2021). This package was designed specifically for regional Suess Effect corrections for marine organisms. Blue whales in the northeast Pacific are distributed as far north as the Gulf of Alaska (Calambokidis et al., 2009a), therefore we selected the corrections for this region and assumed they remained constant at lower latitudes. For adult whales of known stranding date, we used the sequential Julian day calculated for modeling purposes; see Analysis of Temporal Oscillations in Isotope Values of Adult and Juvenile Whales in the Materials and Methods section. For whale F, we did not know the exact stranding date, but this individual died in the 1980s, so we used the mean Suess effect corrections applied to whales D and E that died in the same decade. In the case of recently weaned whales, we only had information on stranding year, which ranged from 2013–2019, so we used a mean correction of 1.1‰ based on the SuessR package corrections for each stranding year. All temporal models and statistical analysis used Suess corrected baleen δ13C values.
Nursing period versus weaning period in weaned whales
Whales K, L, and M were identified as recently weaned animals since they were less than 16.5 m in total length (Table 1). We identified a steep decrease in δ15N located after the oldest section of the baleen plates, likely reflecting the weaning period (Hobson and Schell, 1998; Caraveo-Patiño et al., 2007; Lysiak, 2009). Baleen growth rates decrease with age in gray whales (Sumich, 2001) and southern right whales (Best and Schell, 1996). In the case of blue whales, there are no estimates of baleen growth rates for young animals, therefore we were unable to estimate the temporal resolution contained within the baleen of this age group. Instead, we analyzed the oscillations along the baleen in reference to length in centimeters, where zero represents the section of the baleen plate that was embedded in the gum and represents the most recently formed tissue. We estimated the magnitude of the decrease in nitrogen isotope values associated with weaning by comparing the posterior means of δ15N values in the section of the baleen before (potential nursing period) and after the steep decrease (weaning section) (see Results) with a one-way Bayesian analysis of variance (ANOVAB) (Kéry, 2010).
Comparison of sex and age classes
Global isotopic variation among sex and age classes was evaluated by comparing mean Suess corrected δ13C and δ15N values with ANOVAB for each isotope system separately. Age class categorization of adult and juvenile whales was based on the total length compiled from stranding records, while the recently weaned category was identified using both the length of the whale and the presence of the δ15N patterns described above. We excluded whale F as no age class data were available for this individual. The analysis estimates the posterior distributions of each sex and age class means from normal likelihoods. We then estimated the posterior distributions of the differences between all possible sex and age group pairs. From those posteriors, we estimated the proportion of iterations below and above zero and the highest of those two values represents the probability that a given age class pair is different (Gelman et al., 2014).
Isotopic niche estimates
The isotopic niche width of each individual whale was estimated via standard ellipse areas (SEA in ‰2 units) that contained 95% of the data using the SIBER package for R language (Jackson et al., 2011). SEA were estimated using the Suess corrected δ13C and δ15N covariance matrix. For inter-individual comparisons, we estimated the Bayesian SEA (SEAB) fitted using Bayesian approximations within SIBER, and we also determined the percent overlap among ellipses of different whales.
Isotope mixing models
Foraging strategies of each individual blue whale were characterized using isotope mixing models based on δ15N data and analyzed in a Bayesian framework with the package MixSIAR for R language (Stock and Semmens, 2018). Suess corrected δ13C data were not used because of lack of differences in the carbon isotope composition of potential prey (Busquets-Vass et al., 2021). We excluded the nursing period from the model for recently weaned whales K, L, and M (see Results). The variables used in the mixing models included: δ15N of the baleen plates from each individual whale, prey δ15N from previously published literature (Busquets-Vass et al., 2017; Busquets-Vass et al., 2021), and mean ( ± SD) δ15N trophic (tissue-diet) discrimination factor (Δ15N) previously estimated to be 1.8 ± 0.3‰ for blue whales (Busquets-Vass et al., 2017). Model parameters had non-informative priors and posterior distributions were generated with a Markov Chain Monte-Carlo (MCMC) set as follows: chains = 5, chain length = 1,000,000 iterations, burn-in phase = 300,000 iterations, thinning = one iteration retained each 50. The error structure chosen for all models (process multiplied by residual error) was selected based on analysis by Stock and Semmens (2016). For model selection, we compared six different model structures using Watanabe-Akaike Information Criterion (WAIC) and Leave-One-Out (LOO) Cross-Validation Information Criterion. Models with low LOO values have a better fit while the Akaike Weights based on WAIC scores indicate the probability of the model given the data (Burnham et al., 2002; Stock and Semmens, 2016). Model structure was set as follows: (1) null model in which no factors were evaluated, (2) individual whale set as fixed effect, (3) sex and/or age set as a fixed effect, (4) individual whale set as a random effect, (5) sex and/or age class set as a random effect, and (6) individual whale set as a random effect and sex and/or age nested into individual whale.
Results
Temporal trends in baleen Suess corrected δ13C and δ15N
The interannual and seasonal random effects in δ15N along baleen plates showed variability between whales of different sex and age classes (Figures 2, 3) based on HSD values. Adult female A exhibited the highest interannual (12.3) and seasonal (2.3) HSD, and the oscillations in δ15N along its baleen suggest this whale visited all three regions, GC, CCE, and CRD (Figures 2A, 3A). Interannually, this whale showed a consistent decline in δ15N between 2003 and 2007, suggesting a gradual increasing tendency to use the CRD (Figure 2A). Interestingly, the seasonal δ15N peak occurred typically during early boreal summer, suggesting this individual was visiting the GC mostly during summer (Figure 3A). Adult male H had the second highest interannual and seasonal HSD, however, this whale only visited the GC and CCE in a seasonal pattern (Figure 2H). The seasonal peak in δ15N occurred in December and January, indicating that this whale visited the GC mainly during the boreal winter (Figure 3H). Adult females B and C had intermediate interannual and seasonal HSD (Figures 2B, C, 3B, C). Adult female B typically visited the CCE and CRD in a relatively consistent seasonal pattern (Figure 2B), whereas female C used all three regions in a less predictable pattern (Figure 2C). Adult whale B exhibited lower δ15N values during September and October, indicating that this whale typically visited the CRD during these months (Figure 3B). Female C had lower values in January and July (Figure 3C), suggesting this whale did not follow consistent seasonal migratory patterns, and thus visited the CRD in different months (Figure 2C). It is important to note that adult females A and B skipped migration during 2003–2004 and 2008–2009, respectively (Figures 2A, B).
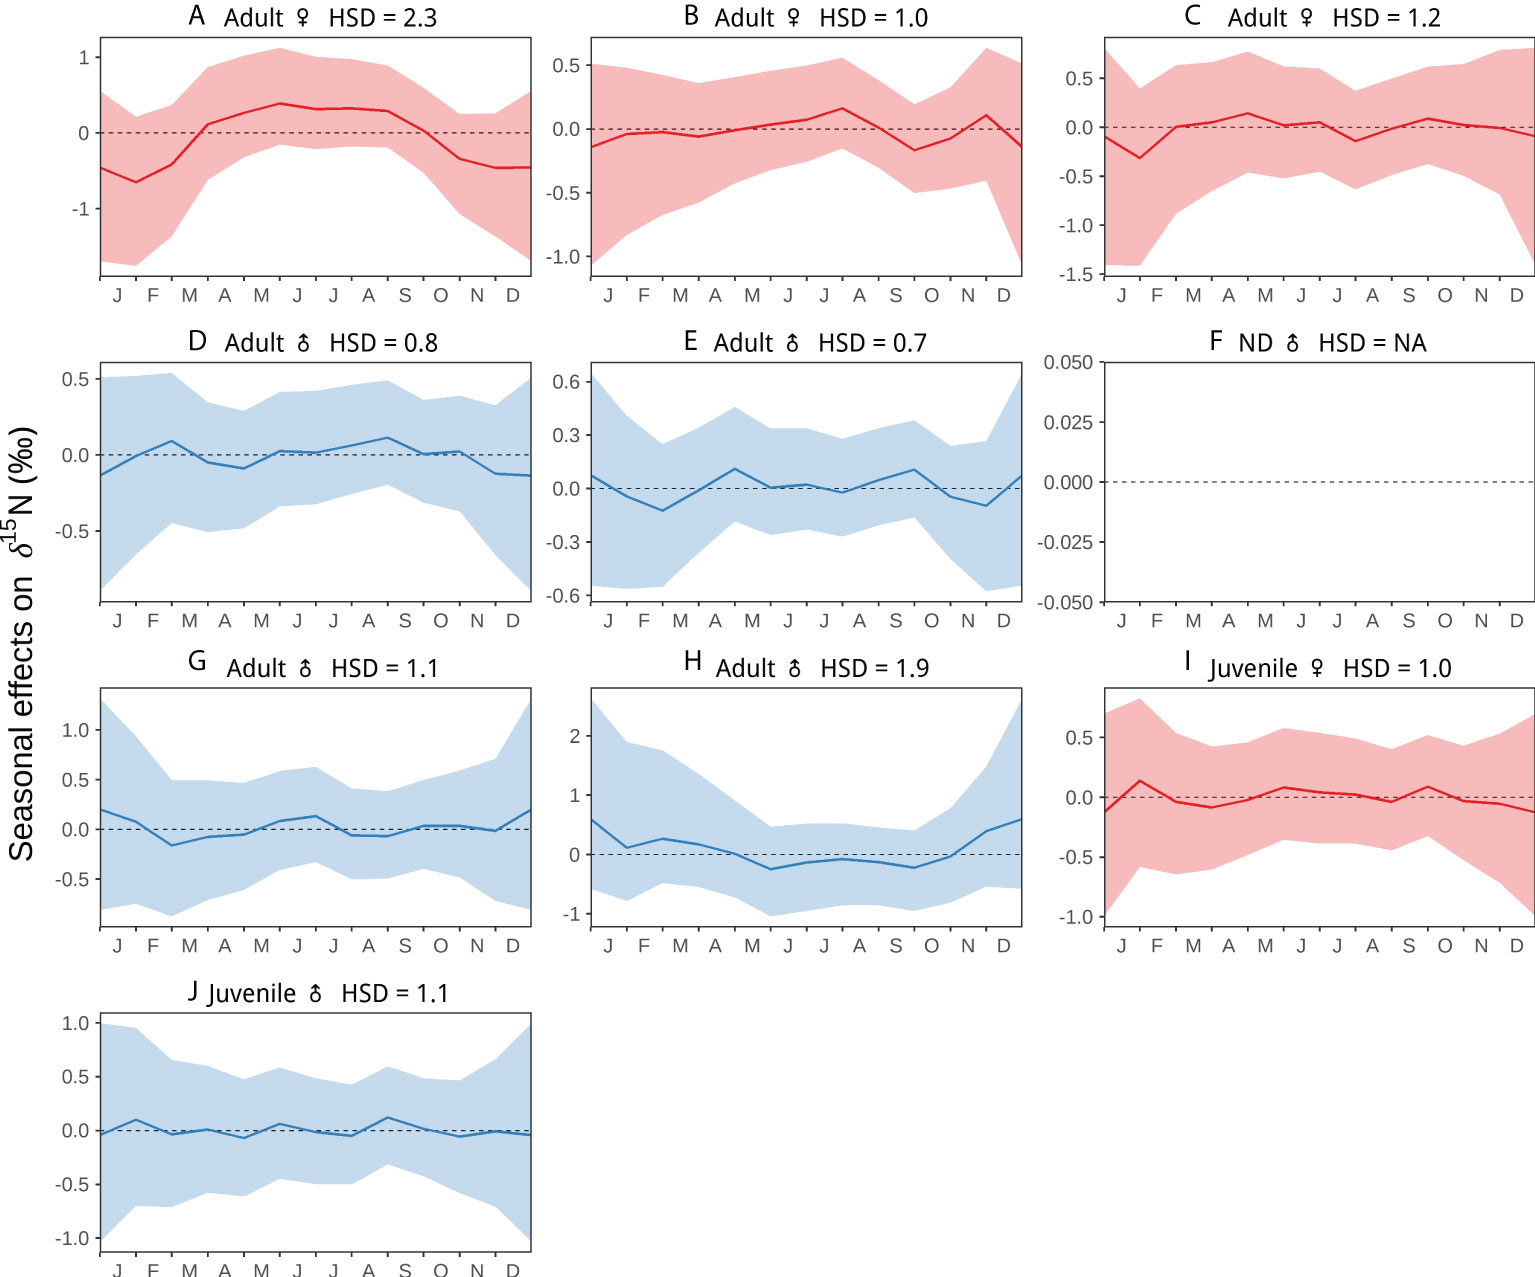
Figure 3 Seasonal random effects on δ15N values along nine individual blue whale baleen plates as a function of time. The hyper-standard deviation (HSD) of the random-effect likelihoods is reported for each whale. Colors represent females (red), and males (blue). Colored dots and lines are the medians of the random effects, and colored shaded areas are the 95%-credible intervals. Figure shows whales (A–J). This analysis was not possible for whale (F) given the lack of information on stranding date.
Adult males D and E had intermediate interannual HDS and the lowest seasonal HSD (Figures 2D, E, 3D, E). δ15N values along the baleen of these males were surprisingly consistent and remained within a 1‰ range, indicating both males remained within the CCE during 3–4 years prior to death (Figures 3D, E). For male whale F (unknown stranding date), we were unable to run the interannual and seasonal models, however, this whale showed near identical patterns to adult males D and E (Figure 2F). Adult whale G exhibited intermediate interannual HSD and relatively high seasonal HSD (Figures 2G, 3G). The patterns in δ15N indicate this whale migrated at least twice to the CRD, and typically remained within the CCE (Figure 2G). The seasonally lower δ15N values occurred in February and March, suggesting that this whale visited the CRD during the boreal winter (Figure 3G). Juvenile whales migrated among foraging regions, but no clear patterns were observed (Figures 2I, J), and they exhibited intermediate interannual and seasonal HSD in comparison to the adult whales (Figures 2I, J, 3I, J). The juvenile female I remained several months in the CCE (2016-2017) and in the CRD (2018-2019) (Figure 2I), whereas Juvenile male J remained mostly within the GC (Figure 2J).
Although less pronounced or consistent, Suess corrected δ13C values also exhibited some temporal variation among individuals, both interannually and seasonally (Figures 4, 5) which in general matched those of δ15N (Figures 2, 3), but with lower variation in the values. The ranges in Suess corrected δ13C values observed in whales that moved among different foraging regions (Figures 4A–C, G, H), overlapped with those of the whales that remained in the CCE (Figures 4D–F) based on oscillations (or lack thereof) in δ15N (Figure 2). In comparison to adults, juvenile and recently weaned whales had lower Suess corrected δ13C values (Figures 4, 6) (see Results, Ontogenetic Comparisons).
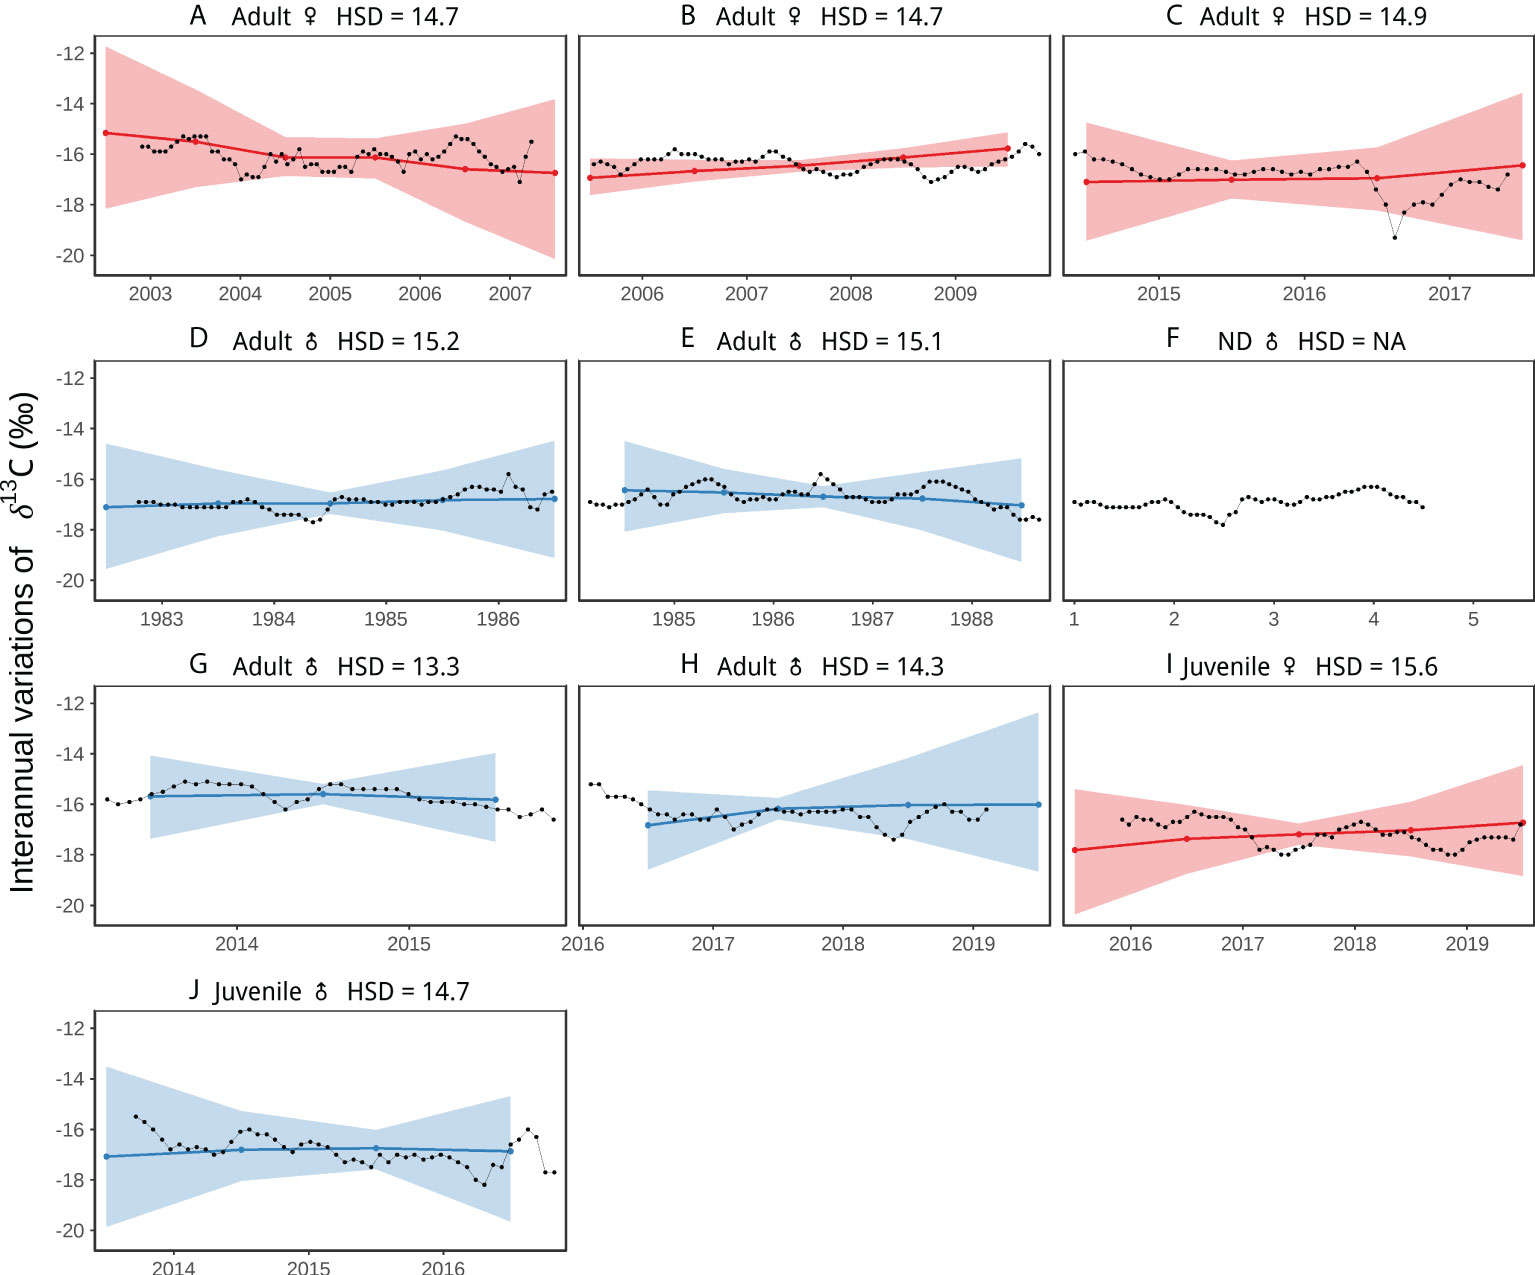
Figure 4 Interannual random effects on Suess corrected δ13C values along nine individual blue whale baleen plates as a function of time. The hyper-standard deviation (HSD) of the random-effect likelihoods is reported for each whale. Colors represent females (red), and males (blue). Colored dots and lines are the medians of the random effects, and colored shaded areas are the 95%-credible intervals. Figure shows whales (A–J). HSD could not be estimated for whale (F) given the lack of information on stranding date, so the temporal scale corresponds to the number of years reflected in the baleen record.
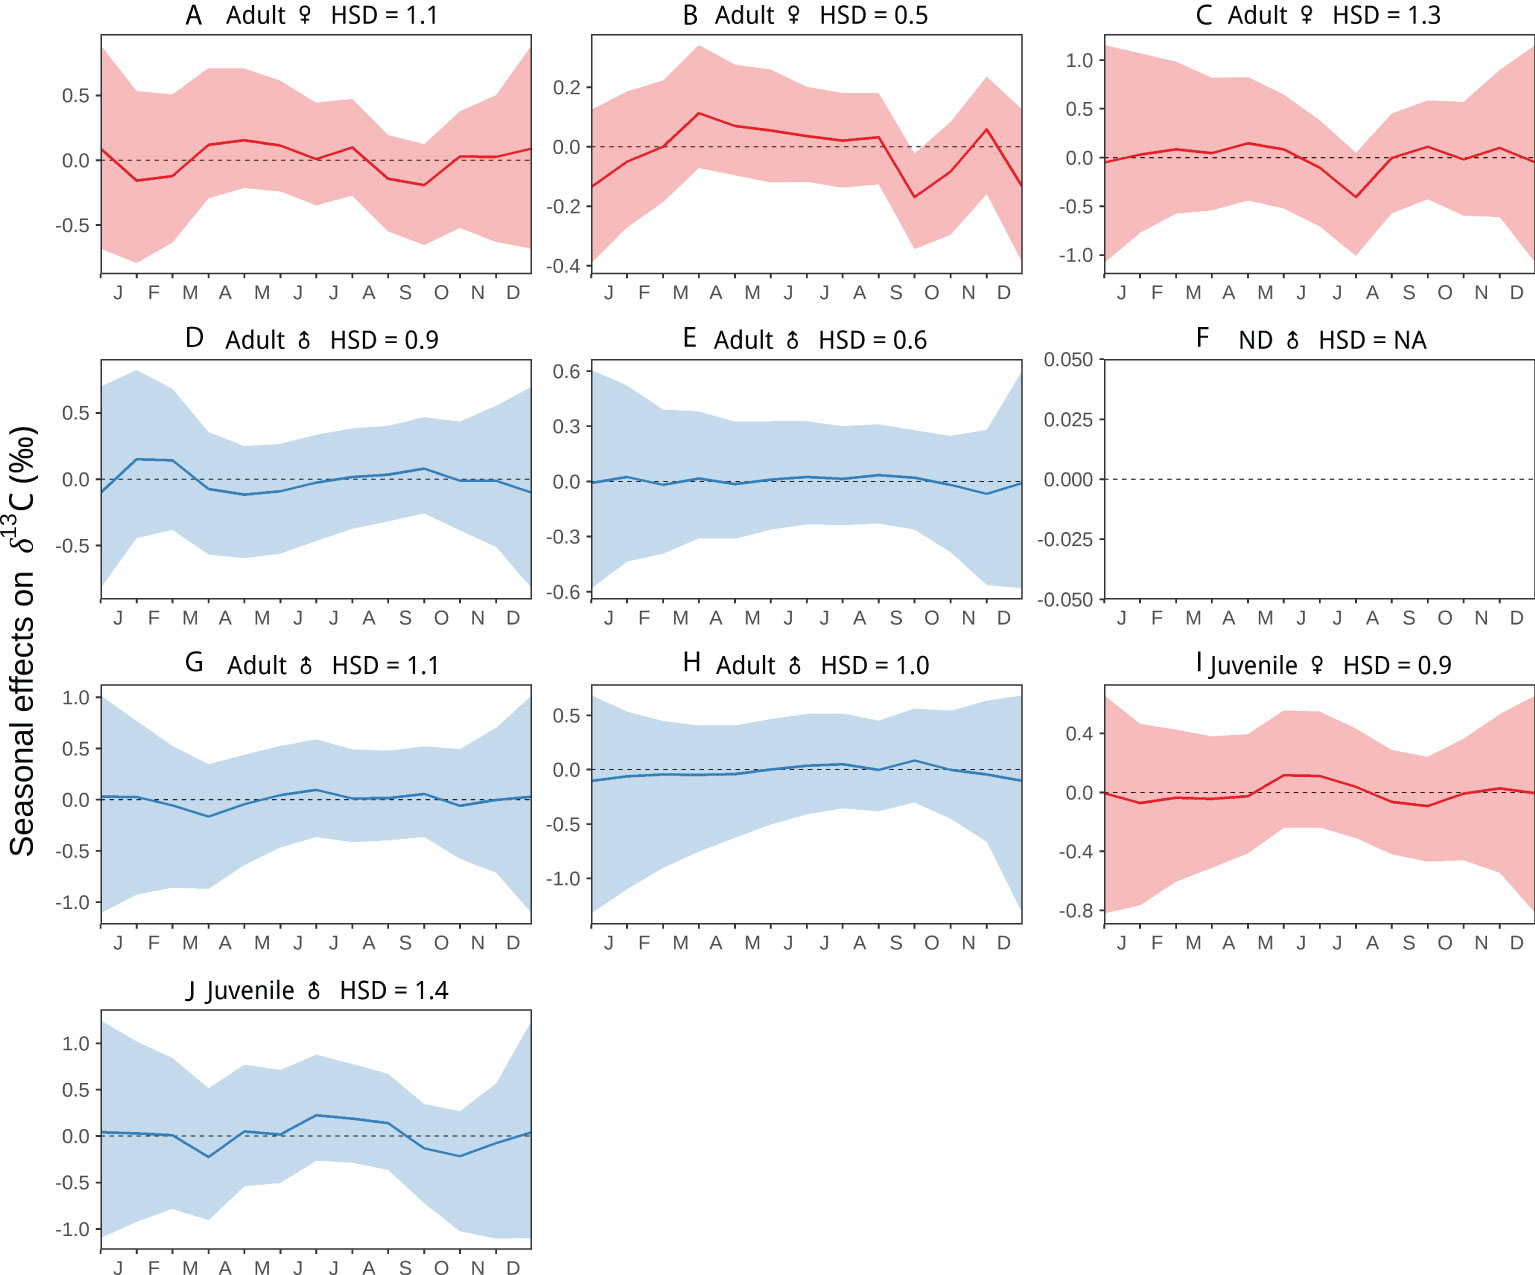
Figure 5 Seasonal random effects on Suess corrected δ13C along nine individual blue whale baleen plates as a function of time. The hyper-standard deviation (HSD) of the random-effect likelihoods is reported for each whale. Colors represent females (red), and males (blue). Colored dots and lines are the medians of the random effects, and colored shaded areas are the 95%-credible intervals. Figure shows whales (A–J). HSD could not be estimated for whale (F) given the lack of information on stranding date, so the temporal scale corresponds to the number of years reflected in the baleen record.
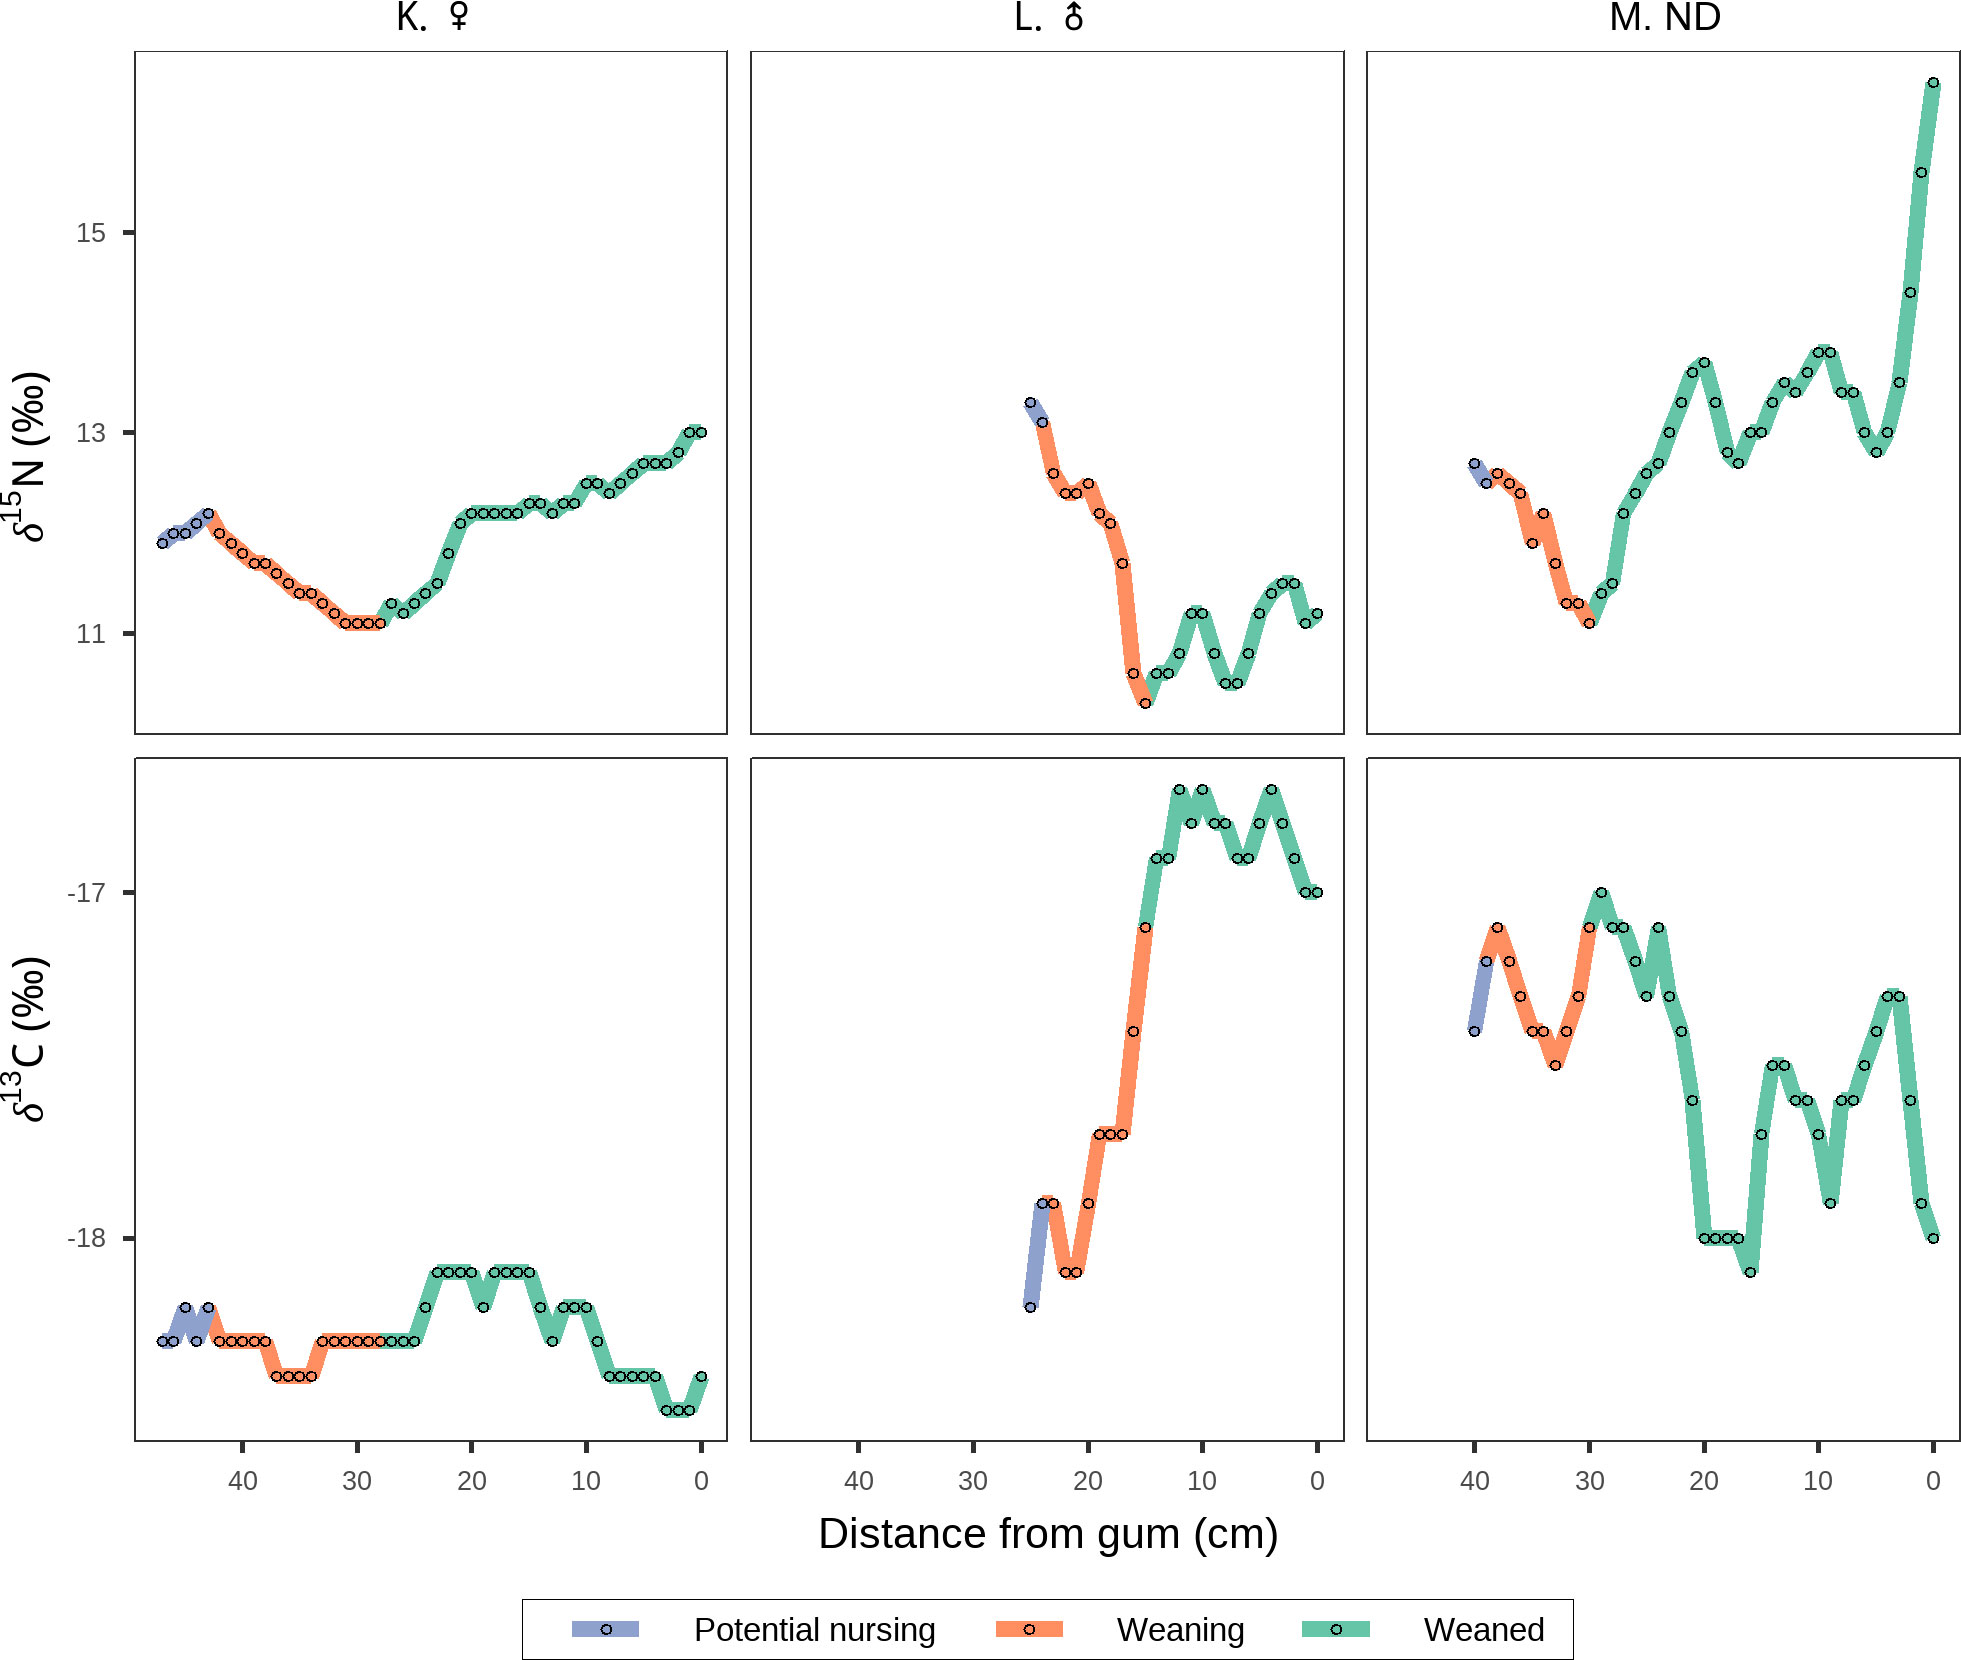
Figure 6 δ15N and Suess corrected δ13C oscillations along the baleen plates of recently weaned whales. Colors indicate likely periods of potential nursing (purple), weaning (orange), and active foraging/weaned (green). Figure shows whales K, L and M.
Nursing and weaning comparisons
The baleen record from the three recently weaned whales exhibited a marked decrease in δ15N values (Figures 6K–M), that we identified as the weaning period, when they switched from nursing to active foraging (Hobson and Schell, 1998; Caraveo-Patiño et al., 2007; Lysiak, 2009). As such, we defined the nursing period as the section of the baleen plate formed before the observed decrease in δ15N values (Figures 6K–M). During weaning, all three whales showed a decrease in δ15N indicating they were actively feeding on prey in the CRD (Figures 6K–M). Once weaned, whale K migrated to the CCE (Figure 6K), whale M moved to the CCE and then entered the GC ~2-3 months before death (Figure 6M), and whale L stayed several months in the CRD (Figure 6L). It is important to note that for whale L we only had a portion of the oldest section of the baleen plate (see Materials and Methods), and therefore lacked isotopic data reflecting the northward migration into the southwestern Mexican coast where the whale was struck and killed by a cargo ship.
The nursing period was characterized by higher estimates of δ15N posterior means (Mean = 12.4‰; Credible Intervals: 2.5% = 12.3‰, 97.5% = 12.6‰) compared to the post-weaning period (Mean = 11.3‰, Credible Intervals: 2.5% = 11.2‰, 97.5% = 11.4‰). The posterior mean estimate of the difference in δ15N values between the nursing and post-weaning periods was 1.1‰ (Credible Intervals: 2.5% = 0.8‰, 97.5% = 1.3‰) with 100% probability of being higher during the nursing period. Suess corrected δ13C values also varied along the baleen of recently weaned whales (Figure 6). All recently weaned whales showed consistently low Suess corrected δ13C values that remained within a ~1‰ range along the entire baleen record prior to death (Figure 6).
Ontogenetic comparisons
The posterior mean estimates of δ15N and Suess corrected δ13C for each baleen plate and the posterior estimations of the difference in δ15N and Suess corrected δ13C among baleen plates from different age classes in the northeast Pacific are shown in Supplementary Table 1 and Supplementary Table 2. The probabilities of difference in mean δ15N values between whales from different sex and age classes was 82% to 100%, but differences only ranged from 0.1‰ to 0.8‰ (Supplementary Table 2). For δ15N, the largest contrast was between juveniles and recently weaned whales, with the former having a higher posterior mean (13.0‰; range: 12.7 to 13.3‰) compared to the latter (12.2‰; range: 12.0 to 12.4‰). For Suess corrected δ13C, adult females and males had values that were 0.6 to 1.4‰ higher than juveniles and recently weaned whales, with a probability of difference of 100‰ (Supplementary Table 1, Supplementary Table 2). Juvenile whales also had Suess corrected δ13C values that were 0.8‰ higher than recently weaned whales (Supplementary Table 1, Supplementary Table 2). Adult females and males had similar Suess corrected δ13C and δ15N values that only differed by 0.1‰ for both isotope systems (Supplementary Table 2).
Isotopic niche
Isotopic niche widths among the thirteen blue whales ranged from 1.2‰2 to 11.1‰2 (Supplementary Table 3; Figure 7). Juveniles whale I (11.1‰2, Figure 7I) and juvenile whale J (9.0‰2, Figure 7J) had the largest isotopic niches. Three adult males, whales D, E and G, and weaned whale K (2.3‰2, Figure 7D; 2.1‰2, Figure 7E; 3.3‰2, Figure 7G; 1.2‰2, Figure 7K) had smaller isotopic niches. Whale F had the smallest isotopic niche (2.0‰2, Figure 7F), the age of this whale was unknown, but isotopic data suggests this whale was an adult. Three adult whales, A, C, and H (Figures 7A, C, H), that migrated among all three foraging regions had similar isotopic niche widths (~7.0‰2). Female adult whale B (Figure 7B), that migrated mainly between the CCE and CRD, had intermediate isotopic niche width (4.0‰2). Lastly, weaned whales L and M also exhibited intermediate isotopic niche width (Figures 7L, M). The overlap among the isotopic niche width of individual whales varied from 0% to 100% (Supplementary Table 4). The isotopic niche of recently weaned whale K only overlapped with whale C (Figures 7K, C; Supplementary Table 4), whale J (Figure 7; Supplementary Table 4) and with recently weaned whales L and M (Figures 7L, M; Supplementary Table 4). It is important to recognize that the degree of overlap among the isotopic niches of different individuals was driven by variations in Suess corrected δ13C (not δ15N).
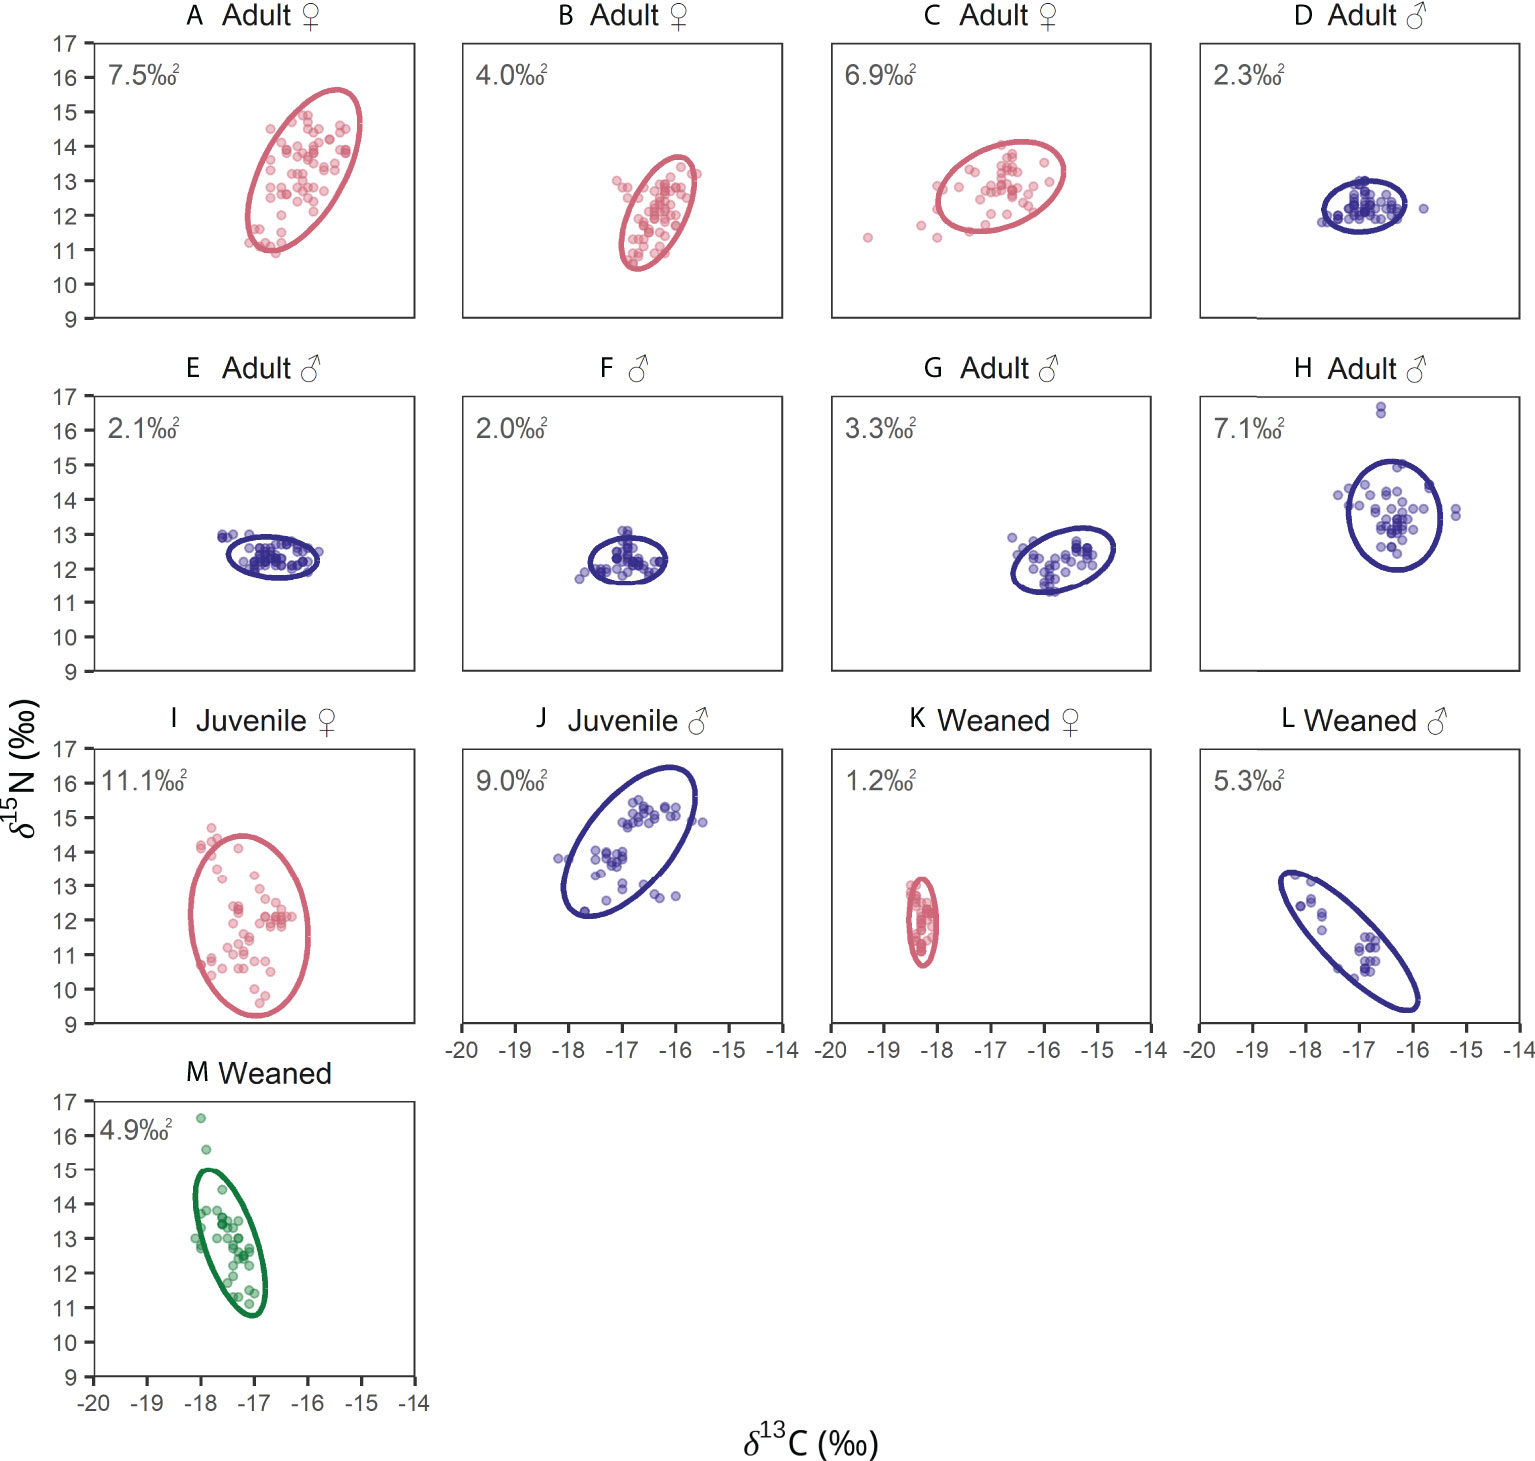
Figure 7 Isotopic niche width (solid lines-SEA‰2) of blue whales in the northeast Pacific. δ13C values were Suess corrected for isotopic niche estimations. Color indicates sex of the whale: females (red), blue (males), and sex not identified (green); posterior mean estimates of SEAB (‰2) are reported for each whale in the top-left of the panels. Figure shows whales (A–M).
Dietary isotopic mixing models
The model with the lowest LOOic and highest probability of prediction was Model 4 (Supplementary Table 5), which had whale ID set as a random effect. The second-best model was Model 6 with whale ID set as a random effect and sex and/or age nested into whale ID (Supplementary Table 5). The posterior estimates of the relative contribution of the three foraging regions (GC, CCE, CRD) to the diet of the thirteen different blue whales using Model 4, and to the different sex/age classes using Model 6, are shown in Supplementary Tables 6, 7 as well as Figure 7 and Supplementary Figure 1. A common trend observed in Model 4 and Model 6 was the consistent intermediate to high dietary contribution of prey from the CRD to the diets of adult females (~31–50%), juveniles (~37–67%), and recently weaned whales (~26–53%). In contrast, the contribution of CRD prey was negligible (4–8%) for adult males D, E, F, and G (Supplementary Table 6; Figure 8), and only 17% when data for all males was combined (Supplementary Table 7, Supplementary Figure 1). Dietary contributions of prey from the CCE varied among whales of different sex and/or age categories (Supplementary Table 7, Supplementary Figure 1). The highest contributions from the CCE were observed in adult males D, E, F, G (89–94%) and recently weaned whale K (70%) (Supplementary Table 6; Figure 8). Intermediate contributions of prey from the CCE were observed in whales B, C, and L (40–50%) (Supplementary Table 6; Figures 8B, C, L), and the lowest contributions (4–15%) in whales A, H, I, J, and M (Supplementary Table 6; Figure 8). Prey from the GC provided intermediate to high contributions to the diets of whales A, C, H, J, and M (25–59%), and low to negligible contributions to the diets of whales B, D, E, F, G, K, L (3–11%) (Supplementary Table 6; Figure 8).
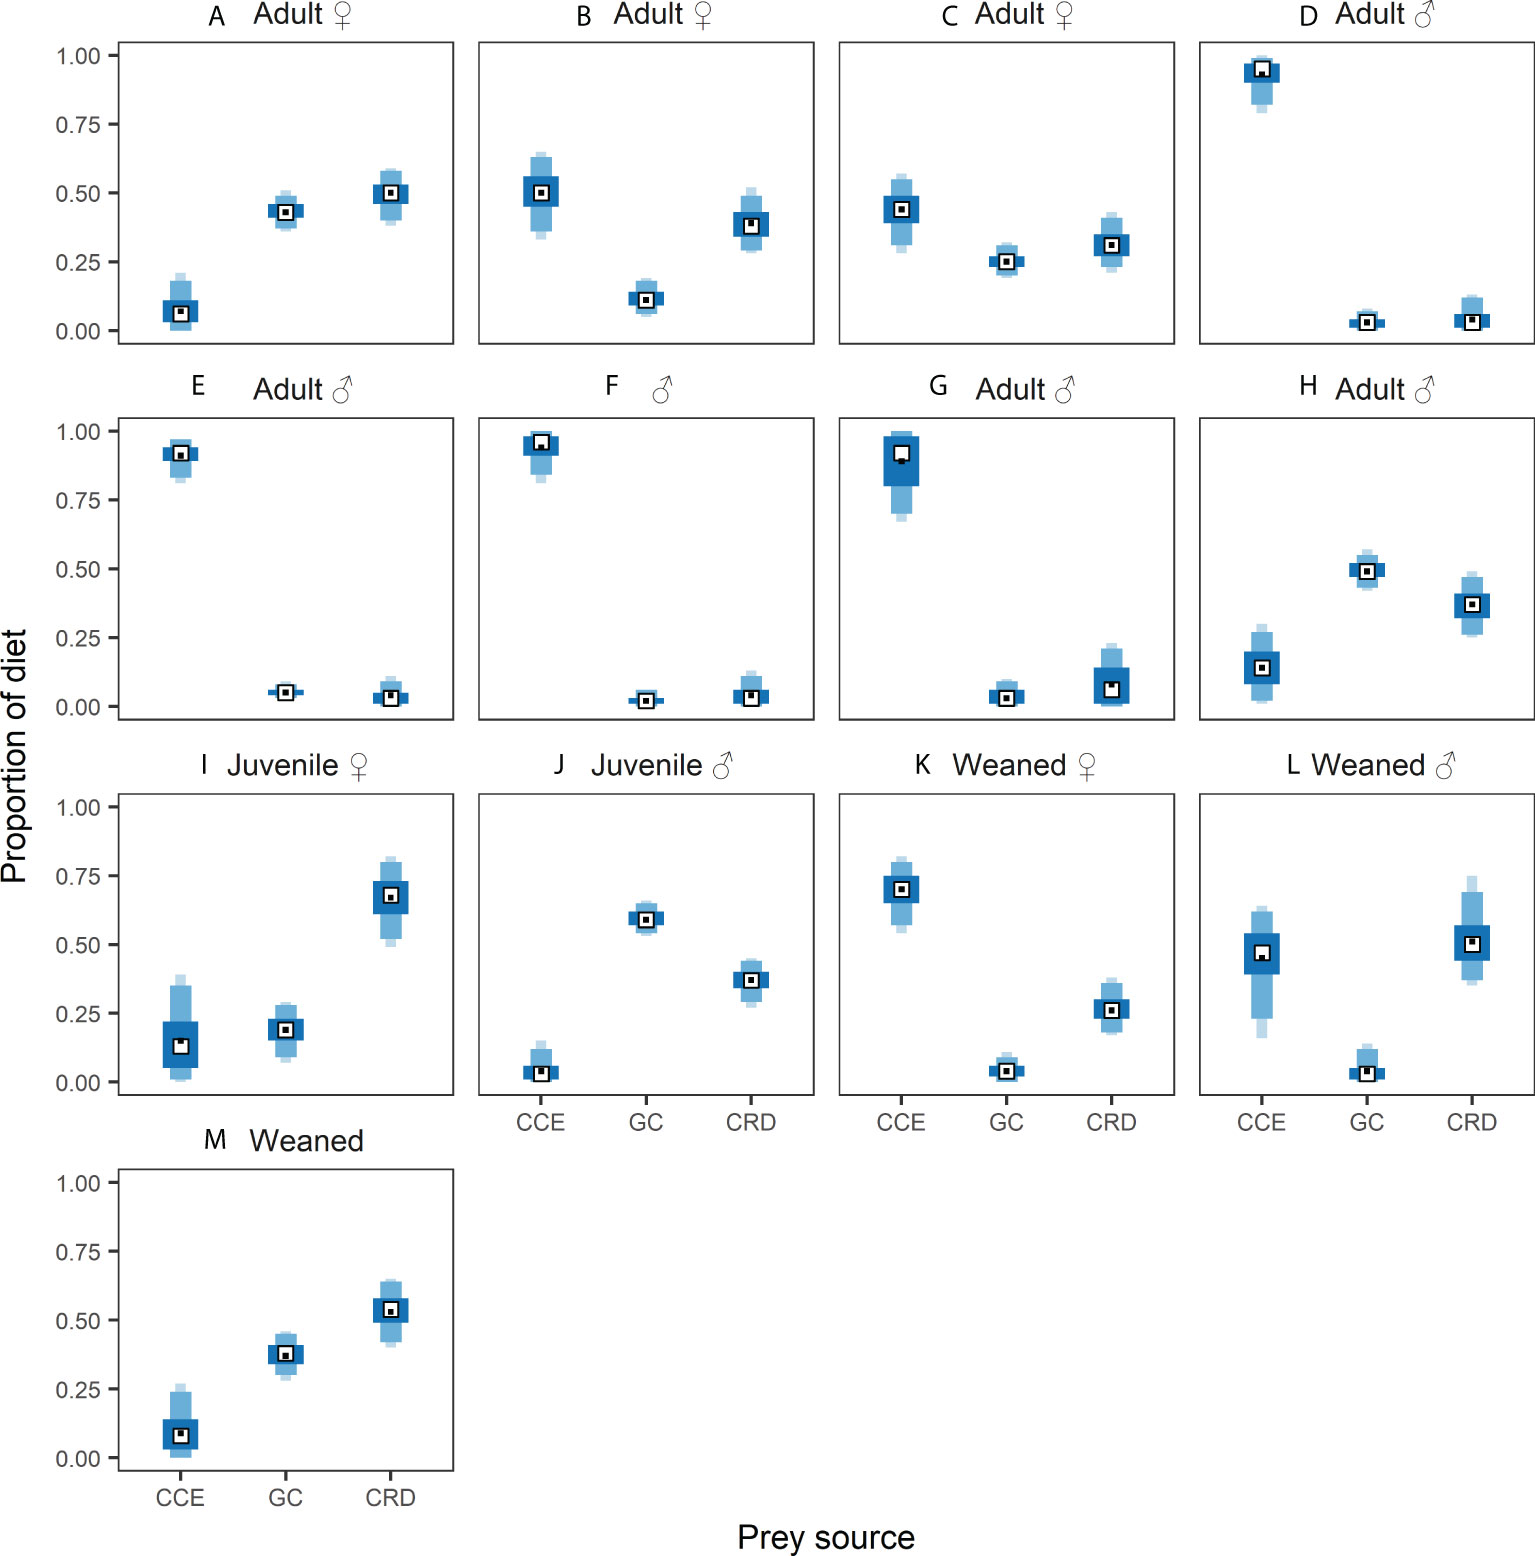
Figure 8 Standardized posterior probabilities of the relative contribution of prey sources from the California Current Ecosystem (CCE), Gulf of California (GC), and Costa Rica Dome (CRD) to blue whales in the northeast Pacific Ocean. Each plot shows the mean (black dot), median (white square) and shaded boxes represent the 50%, 75% and 95% and 95% credible intervals from dark to light blue. Figure shows whales A-M.
Discussion
Age-sex specific migratory and foraging strategies
Our results suggest that blue whale migratory strategies vary by sex and age, a finding supported by other lines of evidence including sex ratios and photographic identifications in the GC as well as acoustic data (Stafford et al., 2001; Gendron, 2002; Oleson et al., 2007a; Costa-Urrutia et al., 2013; Ugalde de la Cruz, 2015). We found that adult females potentially migrate among different foraging regions in a relatively stable interannual and seasonal pattern (Figures 2A, B), with some degree of inter-individual variation in the regions they use during migration (Figure 2C). For example, mixing models showed that female adult whale C foraged in all regions, whereas female adult whale A foraged in the GC and CRD, and whale B foraged predominantly in the CCE and CRD (Supplementary Table 6; Figures 8A–C). These findings are in agreement with the high year-to-year site fidelity of some adult females but rare sightings of other females in the GC (Gendron, 2002; Ugalde de la Cruz, 2015), which indicates inter-individual variation in the use of wintering grounds.
Inter-individual variation in seasonal migratory patterns can increase habitat partitioning among adult females, thus decreasing intraspecific competition for resources during periods of high energetic demand associated with reproduction (pregnancy and nursing). Such seasonal competition for resources likely influences differential use of the two alternative wintering regions, GC or CRD, which can be used also during the summer (adult female A, Figure 3A). This type of behavior has also been observed in other migratory mammals. For example, population size in caribou (Rangifer tarandus) was a determinant for wintering area selection in two different herds that undertook long-distance migrations, indicating that intraspecific competition is a significant driver of migratory plasticity in mammals (Le Corre et al., 2020). Another factor that may play an important role in interannual variation of migratory patterns is seasonal prey availability within specific regions. Acoustic data (i.e., local onset and cessation of blue whale calls) show that blue whales adjust their arrival and departure in the CCE in response to krill abundance (Szesciorka et al., 2020), that in turn is directly affected by climate variability.
An interesting pattern in two adult females (A and B) was the evidence that these individuals skipped seasonal migration. Whale A skipped migration in 2003-04 and remained within the GC, while Whale B skipped migration in 2008-09 and remained within CCE (Figures 2A, B). A plausible explanation for this irregular movement pattern is that there were enough resources in these ecosystems to support adult females for several months. Interestingly, both Female A and B migrated to the CRD (Figures 2A, B) after skipping migration, perhaps to give birth. Calves have been observed in the CRD (Calambokidis et al., 2009b; Hoyt, 2009), and while it is not currently known how important this region is for reproduction, our results support the hypothesis that the CRD is a commonly used calving ground like the GC (Gendron, 2002; Sears et al., 2013). These results are supported by studies that described partial migration in humpback whales (Megaptera novaeangliae; Brown et al., 1995) and North Atlantic right whales (Eubalaena glacialis; Gowan et al., 2019), showing that some females may skip migration because of the high energetic costs associated with reproduction. Partial migration has also been described in fin whales (Balaenoptera physalus) near Svalbard, Norway. Out of 25 tagged fin whales, 10 remained within the tagging region and 15 migrated southwards. Although the sex of the fin whales was not reported, that study noted that southward movements of some whales could be a consequence of body condition, sex, resource availability during migration, and breeding condition (Lydersen et al., 2020).
Adult males exhibited different migratory strategies in comparison to adult females. Two confirmed adult males (D and E) and one male (F) of unknown age, but most likely an adult based on similarity in δ15N patterns to the other two adult males, remained within the CCE for at least 3-4 years before death (Figure 2). Male G remained mostly within the CCE but migrated twice to the CRD (Figure 2G), whereas whale H migrated annually among CCE and GC. Mixing models showed that the resources in the CCE made the largest contribution (89–94%) to the diet of most males, except male H that had a higher contribution from the GC (49%) (Supplementary Table 6, Figure 8). Busquets-Vass et al. (2017) proposed that male blue whales in the eastern Pacific Ocean may use two distinct migratory strategies, but the potential drivers of these two strategies were not evaluated. The addition of data for more individuals reported here suggests that a combination of energetic requirements and intraspecific competition may explain individual variation in migratory strategies among males. Migrating to warmer waters can be energetically challenging for blue whales, as calculations of their lower critical temperatures show that they invest substantially more energy dissipating heat in warmer (i.e., CRD/GC) versus colder (i.e., CCE) waters (Lavigne et al., 1990). Intraspecific competition to remain within the CCE could result in larger (older) males outcompeting smaller (younger) males, which migrate longer distances and possibly follow adult females to the wintering grounds in the GC or CRD. This scenario could be beneficial for younger males by increasing the probability of mating on the wintering grounds. Whale trios consisting of one female and two males have been observed in the CCE and this association may indicate reproductive behavior (Schall et al., 2020). Remarkably, courtship behavior has been observed in the Loreto Bay National Park and near the Midriff Islands within the GC in spring (i.e., April) (Gendron pers. comm.; Pérez-Puig pers. comm.). While songs that may be associated with reproduction are produced by blue whales year-round, suggesting blue whale mating can occur opportunistically any time of the year (Stafford et al., 2001; Oleson et al., 2007a; Oleson et al., 2007b; Schall et al., 2020), the most common mating season is summer and autumn based on the mating activity reported in the CCE (Calambokidis et al., 2007; Schall et al., 2020) and the common observations of calves during the winter and spring within the GC (Gendron, 2002; Sears et al., 2013).
As mentioned above, climate variability likely impacts whale migration and distribution. During El Niño Southern Oscillation (ENSO) events, blue whale population density in the northeast Pacific Ocean decreases in equatorial areas and the distribution of whales retracts to more northern waters in the central CCE, the GC, and north of the Equatorial Countercurrent thermocline ridge (Pardo et al., 2015). Whales D–F stranded in the 1980s, a decade that included one of the most severe El Niño Southern Oscillation (ENSO) events in 1982–1983. The impact of this ENSO event, however, was not consistent throughout the eastern Pacific Ocean. For example, phytoplankton biomass in the GC did not decline during the 1982–1983 ENSO (Santamaría del Ángel et al., 1994), and observations of large aggregations of cetaceans and seabirds were recorded in the Canal de Ballenas in the northern GC (Tershy et al., 1991). Assuming productivity decreased in the CCE during this ENSO event, we would expect Whales D–F to migrate to the GC during the winter, but these males remained within the CCE. Baleen plates from contemporaneous adult females are not available, however, photographic data collected from 1970-2011 in the CCE (summer-fall) and GC (winter-spring) shows that adult females are twice as common as adult males (F:M sex ratio 1.8:1.0) during the peak of the seasonal migration (Gendron, 2002; Costa-Urrutia et al., 2013; Ugalde de la Cruz, 2015), indicating that migration is a more common behavior in females than males. In addition, acoustic data show year-round detections of vocalizations (or calls) (Stafford et al., 2001) produced exclusively by males (Oleson et al., 2007a; Oleson et al., 2007b), which also supports the hypothesis that males and females potentially use different movement strategies, and that males may remain in specific regions for several years without migrating.
Like adult females, juvenile and recently weaned whales also showed plastic migratory patterns based on measured isotope values (Figure 2) and mixing models (Figure 7). A common pattern for these age categories was to remain within the same region for several months or years (Figures 2I, J), which might result from inexperience as younger whales must learn behavioral skills from migratory adults (likely females) to locate prey. This explanation is supported by previous work showing that blue whales rely on memory of long-term average conditions to migrate to specific regions in the northeast Pacific Ocean (Abrahms et al., 2019), and this would imply that young whales must learn to follow adults or gradually memorize the locations of seasonal krill aggregations.
Patterns in isotopic niches of blue whales (Supplementary Table 3, Supplementary Table 4, Figure 7) further support our inferences of their migratory and feeding strategies based on baleen δ15N. Adult females A and C, adult male H, and both juveniles exhibited the largest isotopic niches, reflecting movement among different regions in the northeast Pacific Ocean. The other three adult males, female B, and all recently weaned whales had the narrowest isotopic niche, likely due to more restricted movements and feeding within a single region.
Our results also show that significant latitudinal variation in baseline δ15N values across the GC may allow for the identification of foraging in the northern versus southern areas of this region. The northern region of the GC located at ~28 latitude has a δ15N baseline ~2‰ higher than the southern region (Díaz-Gamboa et al., 2018). Blue whales typically use the southern region of the GC (Gendron, 2002), however, whales H (adult male) and M (recently weaned whale) stranded in the northern region and the last few subsamples of baleen in both individuals deposited prior to death had anomalously high δ15N values (Figure 2). This baseline gradient in the GC results in a large range of nearly 3‰ in krill δ15N values (12.6‰ to 15.4‰) across this region (Busquets-Vass et al., 2017; Busquets-Vass et al., 2021). After application of an appropriate trophic discrimination factor, baleen δ15N values as low as 14‰ and as high as 17‰ likely represents foraging in the GC. These south to north gradients in δ15N might be useful to detect small-scale movement within the GC.
Finally, isotope-based approaches to study the ecology and eco-physiology of marine mammals must consider seasonal or interannual variation in baseline isotope values of primary producers (Newsome et al., 2010). The baleen δ15N results from adult males and adult females show that the foraging regions among which they migrate (GC, CCE and CRD) have relatively consistent values throughout the seasons and years (Figure 2). The range in δ15N values of adult males that remained within the CCE for at least three years during 1983–1986 (Figure 2D) and 1985–1988 (Figure 2E) were similar to baleen from another adult male deposited during 2013–2016 (Figure 2G) and the adult female baleen plates deposited during a wider range of years from 2003 to 2017 (Figure 2). A similar pattern of consistency is also observed in the data for the CRD (Figure 2).
Cow-calf nutrient transfer
When coupled with estimates of age based on body length (Table 1), conspicuous shifts in δ15N values along the baleen plates of whales K, L, and M (Figure 6) suggest they were recently weaned individuals whose baleen record reflected a combination of the nursing period and post-weaning independent foraging (Figure 6). Similar classification criteria have been used to identify nursing in the baleen plates of bowhead (Hobson and Schell, 1998), gray (Caraveo-Patiño et al., 2007), and right (Lysiak, 2009) whales. The consumption of milk in marine mammals results in higher δ15N values in the offspring’s tissues relative to their mothers (Newsome et al., 2006; Newsome et al., 2009; Valenzuela et al., 2010; Elorriaga-Verplancken et al., 2013), a pattern akin to trophic discrimination in nitrogen isotope values between consumers and their prey (DeNiro and Epstein, 1981; Gannes et al., 1998). The decrease in δ15N of 1.1‰ observed in the baleen records of each recently weaned whale (Figures 6K–M) likely represents a switch from the consumption of milk to independent foraging, a pattern that has been observed in both cetaceans and pinnipeds (Newsome et al., 2006; Newsome et al., 2009). In addition, the relatively invariant isotopic record of whale K (Figure 6K), the smallest whale in our dataset (~14m), is characterized by exceptionally low Suess corrected δ13C values relative to adult females, suggesting this individual may be younger than the other two recently weaned whales. The low δ15N values observed in these baleen records after the switch to independent foraging suggest that all three young animals were born in the CRD, highlighting the importance of this region as a potential nursery ground for the eastern Pacific blue whale population.
The interannual and seasonal patterns (Figures 4, 5) in baleen Suess corrected δ13C values of adult whales were similar but of lower magnitude than δ15N (Figures 2, 3) and were not useful to characterize movement patterns. Suess corrected δ13C data were useful, however, for identifying ontogenetic stages. For example, recently weaned whales had Suess corrected δ13C values that were on average 1.5‰ to 1.7‰ lower than adult females and males, respectively (Supplementary Table 1 and Supplementary Table 2). Whale milk has an extremely high fat content of ~30–40% (Ohta et al., 1953; White, 1953) in comparison to terrestrial mammals (~3–15%; Pietrzak-Fiećko and Kamelska-Sadowska, 2020), and lipids have significantly lower Suess corrected δ13C values relative to proteins because of fractionation during the oxidation of pyruvate to acetyl coenzyme A (DeNiro and Epstein, 1977). For example, Suess corrected δ13C values of lipids in fin whale milk are ~4‰ lower than those of milk proteins (Borrell et al., 2016). Since calves consume such high amounts of lipids, they may synthesize non-essential amino acids from 13C-depleted lipid carbon to sustain rapid growth (Newsome et al., 2014). Furthermore, the persistently low Suess corrected δ13C values in the baleen record of recently weaned whales that are foraging independently suggest they rely on accrued maternal resources, likely stored as blubber while nursing, that are catabolized in the months after they are weaned. This pattern highlights the importance of the nursing period (Perrin et al., 2009) in the survival of young blue whales.
Conclusion
Previous work on a limited set of baleen plates suggested sex-specific migratory strategies (Busquets-Vass et al., 2017), but the larger dataset presented here in conjunction with other lines of evidence (Stafford et al., 2001; Gendron, 2002; Oleson et al., 2007a; Costa-Urrutia et al., 2013; Ugalde de la Cruz, 2015), provide even stronger support for this hypothesis. Our results indicate that adult female blue whales migrate seasonally, but that their use of different regions can vary interannually and are possibly driven by energetic requirements associated with reproductive status, intraspecific competition, and seasonal krill abundance on summer and winter foraging grounds. Our results also suggest that the CRD is an important nursery ground for the eastern Pacific Ocean blue whale population. For adult males, complete or partial migration may be linked to age and status, in which intraspecific competition for resources and access to females for reproduction are key factors influencing their movements. For juvenile and recently weaned whales, irregular migration patterns may be more common due to inexperience in locating prey. Finally, the longitudinal isotopic records captured in baleen plates from young recently weaned animals (<16.5 m) were useful to identify the switch in diet from milk to krill during weaning, as well as to assess the importance of maternal resources likely stored as blubber and used by young whales for months after they are weaned. Additionally, our results also indicate that the CRD may be as important as the GC as a breeding ground for this population. We anticipate this information will be useful for designing effective management plans for this endangered species in the northeast Pacific Ocean.
Data availability statement
The raw data supporting the conclusions of this article will be made available by the authors, without undue reservation.
Ethics statement
Ethical review and approval was not required for the animal study because we used baleen plates collected from stranded blue whales. All baleen specimens were collected directly from stranded whales or obtained from museums and stranding networks under special permits issued by Mexican (Secretaría de Medio Ambiente y Recursos Naturales-SEMARNAT) and U.S. (National Oceanic and Atmospheric Administration-National Marine Fisheries Service- NOAA/NMFS) government agencies. Baleen plates were transported via the Convention on International Trade in Endangered Species of Wild Fauna and Flora (CITES) permits (CITES import permit-19US774223/9 and export permit-MX102653).
Author contributions
CB, GB-V, and SDN conceived the project scope and design, and were responsible of drafting the text. MP conducted the temporal modeling analysis. CB conducted statistical analysis with GB-V and SN supervision. CB, GB-V, DG, JKJ, FG-D, HP-P, CO-O, GH, JUR, and LV-G, were involved in collecting, cleaning, organizing, and processing samples. All authors contributed to the manuscript preparation and revision and approved its submission.
Funding
GBV received funding support to measure stable isotopes along blue whale baleen plates from (i) The Monterey Bay Chapter of the American Cetacean Society (2014), and (ii) The Society for Marine Mammalogy - Small Grants in Aid of Research (2017). GBV also received financial support from a Postdoctoral grant from the Consejo Nacional de Ciencia y Tecnología (CONACYT) (2019-000012-01EXTV-00449, support number 740658) in México. The funders had no role in the design or conduction of the study; collection, processing, analyses, or interpretation of the data; preparation, review, or approval of the manuscript; or decision to submit the manuscript for publication.
Acknowledgments
We would like to thank the institutions that facilitated the use of tissues samples and issued the permits to collect and process these samples: the Cal Poly Humboldt – Cal Poly Vertebrate Museum, Humboldt State Marine Mammal Stranding Program (Dawn Goley, Director), Museo de la Ballena y Ciencias del Mar, the California Department of Parks and Recreation-Prairie Creek Redwoods State Park, Marine Mammal Program of Prescott College Kino Bay Center for Cultural and Ecological Studies, Facultad de Ciencias Marinas-Universidad de Colima, Investigación y Conservación de Mamífero Marinos de Ensenada, Programa de Investigación de Mamíferos Marinos - Universidad Autónoma de Baja California Sur, The Marine Mammal Center (NMFS Office of Protected Resources’ Marine Mammal Health and Stranding Response Program-MMHSRP, permit number 18786), The Marine Mammal Institute at Oregon State University, NOAA/NMFS, SEMARNAT and CITES. This research would not have been possible without the help of all the personnel from the former institutions, the Stranding Network of California, and the Center for Stable Isotopes of the University of New Mexico who participated in the collection and processing of the tissue samples. We would also like to thank the John H. Prescott Marine Mammal Rescue Assistance Grant Program that has provided grants to the stranding networks. J. Rice, J. Loomis, B. Halaska, M. Tengler, J. Isbell, and T. Holmes collaborated during the process of locating and sending baleen plates for this study and we are very beholden for their support. We would also like to give special recognition to K. Robertson who helped with the logistics of sample transportation and the sex identification of an important baleen sample at the genetics lab in NOAA’s Southwest Fisheries Science Center.
Conflict of interest
The authors declare that the research was conducted in the absence of any commercial or financial relationships that could be construed as a potential conflict of interest.
Publisher’s note
All claims expressed in this article are solely those of the authors and do not necessarily represent those of their affiliated organizations, or those of the publisher, the editors and the reviewers. Any product that may be evaluated in this article, or claim that may be made by its manufacturer, is not guaranteed or endorsed by the publisher.
Supplementary material
The Supplementary Material for this article can be found online at: https://www.frontiersin.org/articles/10.3389/fmars.2022.944918/full#supplementary-material
References
Abrahms B., Hazen E. L., Aikens E. O., Savoca M. S., Goldbogen J. A., Bograd S. J., et al. (2019). Memory and resource tracking drive blue whale migrations. Proc. Natl. Acad. Sci. U.S.A. 116, 5582–5587. doi: 10.1073/pnas.1819031116
Acevedo-Gutiérrez A., Croll D. A., Tershy B. R. (2002). High feeding costs limit dive time in the largest whale. J. Exp. Biol. 205, 1747–1753. doi: 10.1242/jeb.205.12.1747
Aguilar A., Borrell A. (2021). Growth of baleen along the baleen rack is constant in balaenopterid whales. Polar. Biol. 44, 1223–1225. doi: 10.1007/s00300-021-02877-6
Bailey H., Mate B., Palacios D., Irvine L., Bograd S., Costa D. (2009). Behavioural estimation of blue whale movements in the Northeast Pacific from state-space model analysis of satellite tracks. Endang. Species. Res. 10, 93–106. doi: 10.3354/esr00239
Bauer S., Barta Z., Ens B. J., Hays G. C., McNamara J. M., Klaassen M. (2009). Animal migration: linking models and data beyond taxonomic limits. Biol. Lett. 5, 433–435. doi: 10.1098/rsbl.2009.0324
Becker B., Peery M., Beissinger S. (2007). Ocean climate and prey availability affect the trophic level and reproductive success of the marbled murrelet, an endangered seabird. Mar. Ecol. Prog. Ser. 329, 267–279. doi: 10.3354/meps09269
Bentaleb I., Martin C., Vrac M., Mate B., Mayzaud P., Siret D., et al. (2011). Foraging ecology of Mediterranean fin whales in a changing environment elucidated by satellitetracking and baleen plate stable isotopes. Mar. Ecol. Prog. Ser. 438, 285–302. doi: 10.3354/meps09269
Best P. B., Schell D. M. (1996). Stable isotopes in southern right whale (Eubalaena australis) baleen as indicators of seasonal movements, feeding and growth. Mar. Biol. 124, 483–494. doi: 10.1007/BF00351030
Borrell A., Gómez-Campos E., Aguilar A. (2016). Influence of reproduction on stable-isotope ratios: nitrogen and carbon isotope discrimination between mothers, fetuses, and milk in the fin whale, a capital breeder. Physiol. Biochem. Zool. 89, 41–50. doi: 10.1086/684632
Brown M. R., Corkeron P. J., Hale P. T., Schultz K. W., Bryden M. M. (1995). Evidence for a sex-segregated migration in the humpback whale (Megaptera novaeangliae). Proc. R. Soc Lond. B. 259, 229–234. doi: 10.1098/rspb.1995.0034
Burnham K. P., Anderson D. R., Burnham K. P. (2002). Model selection and multimodel inference: a practical information-theoretic approach. 2nd ed (New York: Springer).
Busquets-Vass G., Newsome S. D., Calambokidis J., Serra-Valente G., Jacobsen J. K., Aguíñiga-García S., et al. (2017). Estimating blue whale skin isotopic incorporation rates and baleen growth rates: Implications for assessing diet and movement patterns in mysticetes. PloS One 12, e0177880. doi: 10.1371/journal.pone.0177880
Busquets-Vass G., Newsome S. D., Pardo M. A., Calambokidis J., Aguíñiga-García S., Páez-Rosas D., et al. (2021). Isotope-based inferences of the seasonal foraging and migratory strategies of blue whales in the eastern pacific ocean. Mar. Environ. Res. 163, 105201. doi: 10.1016/j.marenvres.2020.105201
Calambokidis J., Barlow J., Ford J. K. B., Chandler T. E., Douglas A. B. (2009a). Insights into the population structure of blue whales in the Eastern north pacific from recent sightings and photographic identification. Mar. Mamm. Sci. 25, 816–832. doi: 10.1111/j.1748-7692.2009.00298.x
Calambokidis J., Mate B., Oleson E. M., Irvine L. M., Hayslip C., Douglas A. B. (2009b). The Costa Rica dome as a winter feeding and breeding areas for north pacific blue whales. oral presentation in 18th biennial conference on the biology of marine mammals. Soc. Mar. Mammal.
Calambokidis J., Schorr G. S., Steiger G. H., Francis J., Bakhtiari M., Marshall G., et al. (2007). Insights into the underwater diving, feeding, and calling behavior of blue whales from a suction-Cup-Attached video-imaging tag (Crittercam). Mar. Technol. Soc J. 41, 19–29. doi: 10.4031/002533207787441980
Caraveo-Patiño J., Hobson K. A., Soto L. A. (2007). Feeding ecology of gray whales inferred from stable-carbon and nitrogen isotopic analysis of baleen plates. Hydrobiologia 586, 17–25. doi: 10.1007/s10750-006-0477-5
Caraveo-Patiño J., Soto L. A. (2005). Stable carbon isotope ratios for the gray whale (Eschrichtius robustus) in the breeding grounds of Baja California sur, Mexico. Hydrobiologia 539, 99–104. doi: 10.1007/s10750-004-3370-0
Carle R. D. (2014). Seasonal and sex-specific diet in rhinoceros auklets (San Jose, California, United States of America: The Faculty of Moss Landing Marine Laboratories). doi: 10.31979/etd.mq72-vbhn
Carroll E. L., Dunshea G., Ott P. H., Valenzuela L. O., Baker C. S., Childerhouse S. J., et al. (2021). Variation in δ3C and δ15N values of mothers and their calves across southern right whale nursery grounds: The effects of nutritional stress? Mar. Mam. Sci. 38, 12871. doi: 10.1111/mms.12871
Casillas-López C. (2016). Condición corporal de la ballena azul (Balaenoptera musculus) con base en un índice visual a partir de fotografías (Jalisco, México: University of Guadalajara).
Chapman B. B., Hulthén K., Wellenreuther M., Hansson L. A., Nilsson J. Å., Brönmark C. (2014). “Patterns of animal migration”, in Animal movement across scales. Eds. Hansson L. A., Åkesson S. (Oxford, United Kingdom: Oxford University Press), 11–35. doi: 10.1093/acprof:oso/9780199677184.003.0002
Clark C. T., Cape M. R., Shapley M. D., Mueter F. J., Finney B. P., Misarti N. (2021). SuessR: Regional corrections for the effects of anthropogenic CO2 on δ13C data from marine organisms. Methods Ecol. Evol. 12, 1508–1520. doi: 10.1111/2041-210X.13622
Cooke J. G. (2018). “Balaenoptera musculus,” in The IUCN red list of threatened species 2018. (United Kingdom, 2018: e.T2477A156923585) doi: 10.2305/IUCN.UK.2018-2
Costa-Urrutia P., Sanvito S., Victoria-Cota N., Enríquez-Paredes L., Gendron D. (2013). Fine-scale population structure of blue whale wintering aggregations in the gulf of California. PloS One 8, e58315. doi: 10.1371/journal.pone.0058315
Croll D., Marinovic B., Benson S., Chavez F., Black N., Ternullo R., et al. (2005). From wind to whales: Trophic links in a coastal upwelling system. Mar. Ecol. Prog. Ser. 289, 117–130. doi: 10.3354/meps289117
Del Ángel-Rodríguez J. A. (1997). Hábitos alimentarios y distribución espacio-temporal de los rorcuales común (Balaenoptera physalus) y azul (Balaenoptera musculus) en la Bahía de la Paz, B.C.S., México (México: Centro Interdisciplinario de Ciencias Marinas-Instituto Politécnico Nacional).
DeNiro M. J., Epstein S. (1977). Mechanism of carbon isotope fractionation associated with lipid synthesis. Science 197, 261–263. doi: 10.1126/science.327543
DeNiro M. J., Epstein S. (1981). Influence of diet on the distribution of nitrogen isotopes in animals. Geochim. Cosmochim. Acta 45, 341–351. doi: 10.1016/0016-7037(81)90244-1
Díaz-Gamboa R. E., Gendron D., Busquets-Vass G. (2018). Isotopic niche width differentiation between common bottlenose dolphin ecotypes and sperm whales in the gulf of California. Mar. Mam. Sci. 34, 440–457. doi: 10.1111/mms.12465
Elorriaga-Verplancken F., Aurioles-Gamboa D., Newsome S. D., Martínez-Díaz S. F. (2013). δ15N and δ13C values in dental collagen as a proxy for age- and sex-related variation in foraging strategies of California sea lions. Mar. Biol. 160, 641–652. doi: 10.1007/s00227-012-2119-y
Etnoyer P., Canny D., Mate B. R., Morgan L. E., Ortega-Ortiz J. G., Nichols W. J. (2006). Sea-Surface temperature gradients across blue whale and sea turtle foraging trajectories off the Baja California peninsula, Mexico. Deep Sea Res. Part II: Top. Stud. Oceanogr. 53, 340–358. doi: 10.1016/j.dsr2.2006.01.010
Fiedler P. C. (2002). The annual cycle and biological effects of the Costa Rica dome. Deep-Sea Res. PT II 49, 321–338. doi: 10.1016/S0967-0637(01)00057-7
Fiedler P. C., Reilly S. B., Hewitt R. P., Demer D., Philbrick V. A., Smith S., et al. (1998). Blue whale habitat and prey in the California channel islands. Deep Sea Res. Part II: Top. Stud. Oceanogr. 45, 1781–1801. doi: 10.1016/S0967-0645(98)80017-9
Fleming A. H., Clark C. T., Calambokidis J., Barlow J. (2016). Humpback whale diets respond to variance in ocean climate and ecosystem conditions in the California current. Glob. Change Biol. 22, 1214–1224. doi: 10.1111/gcb.13171
Gannes L. Z., del Rio C. M., Koch P. (1998). Natural abundance variations in stable isotopes and their potential uses in animal physiological ecology. Comp. Biochem. Physiol. Part A. Mol. Integr. Physiol. 119, 725–737. doi: 10.1016/S1095-6433(98)01016-2
García-Vernet R., Sant P., Víkingsson G., Borrell A., Aguilar A. (2018). Are stable isotope ratios and oscillations consistent in all baleen plates along the filtering apparatus? validation of an increasingly used methodology. Rapid Commun. Mass. Spectrom. 32, 1257–1262. doi: 10.1002/rcm.8169
Gauffier P., Borrell A., Silva M. A., Víkingsson G. A., López A., Giménez J., et al. (2020). Wait your turn, north Atlantic fin whales share a common feeding ground sequentially. Mar. Environ. Res. 155, 104884. doi: 10.1016/j.marenvres.2020.104884
Gelman A., Carlin J. B., Stern H. S., Dunson D. B., Vehtari A., Rubin D. B. (2014). Bayesian Data analysis, third ed (Boca Raton, Florida, USA: Chapman and Hall/CRC), 675.
Gendron D. (1992). Population structure of daytime surface swarms of nyctiphanes simplex (Crustacea: Euphausiacea) in the gulf of California, Mexico. Mar. Ecol. Prog. Ser. 87, 1–6. doi: 10.3354/meps087001
Gendron D. (2002). Ecología poblacional de la ballena azul, balaenoptera musculus, de la península de Baja California (Baja California, México: Centro de Investigación Científica y de Educación Superior de Ensenada).
Gendron D., Aguíñiga S., Carriquiry J. D. (2001). δ15N and δ13C in skin biopsy samples: A note on their applicability for examining the relative trophic level in three rorqual species δ. J. Cetacean Res. Manage. 3, 1–4.
Gómez-Rubio V. (2020). Bayesian Inference with inla. 1st ed (New York, United States of America: Taylor and Francis, CRC Press). doi: 10.1201/9781315175584
Gowan T. A., Ortega-Ortiz J. G., Hostetler J. A., Hamilton P. K., Knowlton A. R., Jackson K. A., et al. (2019). Temporal and demographic variation in partial migration of the north Atlantic right whale. Sci. Rep. 9, 353. doi: 10.1038/s41598-018-36723-3
Hipfner J. M., Dale J., McGraw K. J. (2010). Yolk carotenoids and stable isotopes reveal links among environment, foraging behavior, and seabird breeding success. Oecologia 163, 351–360. doi: 10.1007/s00442-010-1618-0
Hobson K. A. (1999). Tracing origins and migration of wildlife using stable isotopes: a review. Oecologia 120, 314–326. doi: 10.1007/s004420050865
Hobson K. A., Clark R. G. (1993). Turnover of 13C in cellular and plasma fractions of blood: Implications for nondestructive sampling in avian dietary studies. Auk 110, 638–641. doi: 10.2307/4088430
Hobson K. A., Schell D. M. (1998). Stable carbon and nitrogen isotope patterns in baleen from eastern Arctic bowhead whales. Can. J. Fish. Aquat. Sci. 55, 7. doi: 10.1139/cjfas-55-12-2601
Hoyt E. (2009) The blue whale, balaenoptera musculus: an endangered species thriving on the Costa Rica dome. an illustration submitted to the convention on biological diversity. Available at: www.cbd.int/cms/ui/forums/attachment.aspx?id=73.
Jackson A. L., Inger R., Parnell A. C., Bearhop S. (2011). Comparing isotopic niche widths among and within communities: SIBER - stable isotope Bayesian ellipses in r: Bayesian isotopic niche metrics. J. Anim. Ecol. 80, 595–602. doi: 10.1111/j.1365-2656.2011.01806.x
Jiménez-Pinedo N. C. (2010). Hábitos alimentarios y relación interespecífica entre la ballena azul (Balaenoptera musculus) y la ballena de aleta (B. physalus) en el suroeste del golfo de California (México: Centro Interdisciplinario de Ciencias Marinas-Instituto Politécnico Nacional).
Jönsson K. I. (1997). Capital and income breeding as alternative tactics of resource use in reproduction. Oikos 78, 57–66. doi: 10.2307/3545800
Kéry M. (2010). Introduction to WinBUGS for ecologists: a Bayesian approach to regression, ANOVA, mixed models and related analyses. 1st ed (Amsterdam; Boston: Elsevier).
Langin K. M., Norris D. R., Kyser T. K., Marra P. P., Ratcliffe L. M. (2006). Capital versus income breeding in a migratory passerine bird: evidence from stable-carbon isotopes. Can. J. Zool. 84, 947–953. doi: 10.1139/z06-080
Lavigne D. M., Innes S., Worthy G. A. J., Edwards E. F. (1990). Lower critical temperatures of blue whales, balaenoptera musculus. J. Theor. Biol. 144, 249–257. doi: 10.1016/S0022-5193(05)80323-6
Le Corre M., Dussault C., Côté S. D. (2020). Where to spend the winter? the role of intraspecific competition and climate in determining the selection of wintering areas by migratory caribou. Oikos 129, 512–525. doi: 10.1111/oik.06668
Lee S., Schell D., McDonald T., Richardson W. (2005). Regional and seasonal feeding by bowhead whales balaena mysticetus as indicated by stable isotope ratios. Mar. Ecol. Prog. Ser. 285, 271–287. doi: 10.3354/meps285271
Lluch-Cota S. E., Aragón-Noriega E. A., Arreguín-Sánchez F., Aurioles-Gamboa D., Jesús Bautista-Romero J., Brusca R. C., et al. (2007). The gulf of California: Review of ecosystem status and sustainability challenges. Prog. Oceanogr. 73, 1–26. doi: 10.1016/j.pocean.2007.01.013
Logan J. M., Jardine T. D., Miller T. J., Bunn S. E., Cunjak R. A., Lutcavage M. E. (2008). Lipid corrections in carbon and nitrogen stable isotope analyses: comparison of chemical extraction and modelling methods. J. Anim. Ecol. 77, 838–846. doi: 10.1111/j.1365-2656.2008.01394.x
Lydersen C., Vacquié−Garcia J., Heide−Jørgensen P., Øien N., Guinet C., Kovacs K. M. (2020). Autumn movements of fin whales (Balaenoptera physalus) from Svalbard, Norway, revealed by satellite tracking. Sci. Rep. 10, 16966. doi: 10.1038/s41598-020-73996-z
Lysiak N. S. (2009). Investigations into the migration and foraging ecology of north Atlantic right whales with stable isotope geochemistry of baleen and zooplankton (Massachusetts, United States: Boston University).
Mate B. R., Lagerquist B. A., Calambokidis J. (1999). Movements of north pacific blue whales during the feeding season off southern California and their southern fall migration. Mar. Mamm. Sci. 15, 1246–1257. doi: 10.1111/j.1748-7692.1999.tb00888.x
Matteson R. (2009). The Costa Rica dome: A study of physics, zooplankton, and blue whales (Oregon, United States: Oregon State University), S.
Miller T. W. (2006). Trophic dynamics of marine nekton and zooplankton in the northern California current pelagic ecosystem (Oregon, United States of America: Oregon State University).
Newsome S. D., Clementz M. T., Koch P. L. (2010). Using stable isotope biogeochemistry to study marine mammal ecology. Mar. Mamm. Sci 6 (3), 509–572. doi: 10.1111/j.1748-7692.2009.00354.x
Newsome S., Etnier M., Monson D., Fogel M. (2009). Retrospective characterization of ontogenetic shifts in killer whale diets via δ13C and δ15N analysis of teeth. Mar. Ecol. Prog. Ser. 374, 229–242. doi: 10.3354/meps07747
Newsome S. D., Koch P. L., Etnier M. A., Aurioles-Gamboa D. (2006). Using carbon and nitrogen isotope values to investigate maternal strategies in northeast pacific otariids. Mar. Mamm. Sci. 22, 556–572. doi: 10.1111/j.1748-7692.2006.00043.x
Newsome S. D., Wolf N., Peters J., Fogel M. L. (2014). Amino acid 13C analysis shows flexibility in the routing of dietary protein and lipids to the tissue of an omnivore. Integr. Comp. Biol. 54, 890–902. doi: 10.1093/icb/icu106
Nickels C. F., Sala L. M., Ohman M. D. (2018). The morphology of euphausiid mandibles used to assess selective predation by blue whales in the southern sector of the California current system. J. Crustacean Biol. 38, 563–573. doi: 10.1093/jcbiol/ruy062
Ohta K., Watarai T., Oishi T., Ueshiba Y., Hirose S., Yoshizawa T., et al. (1953). Composition of fin whale milk. Proc. Jpn. Acad. 29, 392–398. doi: 10.2183/pjab1945.29.392
Oleson E., Calambokidis J., Burgess W., McDonald M., LeDuc C., Hildebrand J. A. (2007a). Behavioral context of call production by eastern north pacific blue whales. Mar. Ecol. Prog. Ser. 330, 269–284. doi: 10.3354/meps330269
Oleson E., Wiggins S. M., Hildebrand J. A. (2007b). Temporal separation of blue whale call types on a southern California feeding ground. Anim. Behav. 74, 881–894. doi: 10.1016/j.anbehav.2007.01.022
Palacios D. M., Bailey H., Becker E. A., Bograd S. J., DeAngelis M. L., Forney K. A., et al. (2019). Ecological correlates of blue whale movement behavior and its predictability in the California current ecosystem during the summer-fall feeding season. Mov. Ecol. 7, 26. doi: 10.1186/s40462-019-0164-6
Pardo M. A., Gerrodette T., Beier E., Gendron D., Forney K. A., Chivers S. J., et al. (2015). Inferring cetacean population densities from the absolute dynamic topography of the ocean in a hierarchical Bayesian framework. PloS One 10, e0120727. doi: 10.1371/journal.pone.0120727
Perrin W. F., Thewissen J. G. M., Würsig B. G. (2009). Encyclopedia of marine mammals. 2nd ed. London: Academic.
Pietrzak-Fiećko R., Kamelska-Sadowska A. M. (2020). The comparison of nutritional value of human milk with other mammals’ milk. Nutrients 12, 1404. doi: 10.3390/nu12051404
Rau G. H., Ohman M. D., Pierrot-Bults A. (2003). Linking nitrogen dynamics to climate variability off central California: a 51-year record based on 15N/14N in CalCOFI zooplankton. Deep-Sea Res. PT II 50, 2431–2447. doi: 10.1016/S0967-0645(03)00128-0
R Core Team (2021). R: A language and environment for statistical computing (Vienna, Austria: R Foundation for Statistical Computing). Available at: https://www.R-project.org/.
Rita D., Borrell A., Víkingsson G., Aguilar A. (2019). Histological structure of baleen plates and its relevance to sampling for stable isotope studies. Mammal. Biol. 99, 63–70. doi: 10.1016/j.mambio.2019.10.004
Rockwood R. C., Elliott M. L., Saenz B., Nur N., Jahncke J. (2020). Modeling predator and prey hotspots: Management implications of baleen whale co-occurrence with krill in central California. PloS One 15, e0235603. doi: 10.1371/journal.pone.0235603
Rue H., Held L. (2005). Gaussian Markov Random fields: theory and applications (Boca Raton: Chapman & Hall/CRC).
Rue H., Martino S., Chopin N. (2009). Approximate Bayesian inference for latent Gaussian models by using integrated nested Laplace approximations. J. R. Stat. Soc. Ser. B. Stat. Methodol. 71, 319–392. doi: 10.1111/j.1467-9868.2008.00700.x
Santamaría del Ángel E., Alvarez-Borrego S., Müller-Karger F. E. (1994). The 1982–1984 El niño in the gulf of California as seen in coastal zone color scanner imagery. J. Geophys. Res. 99, 7423. doi: 10.1029/93JC02147
Schall E., Di Iorio L., Berchok C., Filún D., Bedriñana-Romano L., Buchan S. J., et al. (2020). Visual and passive acoustic observations of blue whale trios from two distinct populations. Mar. Mam. Sci. 36, 365–374. doi: 10.1111/mms.12643
Schell D. M., Saupe S. M., Haubenstock N. (1989). Bowhead whale (Balaena mysticetus) growth and feeding as estimated by δ13C techniques. Mar. Biol. 103, 433–443. doi: 10.1007/BF00399575
Sears R., Ramp C., Douglas A., Calambokidis J. (2013). Reproductive parameters of eastern north pacific blue whales balaenoptera musculus. Endanger. Species Res. 22, 23–31. doi: 10.3354/esr00532
Shaw A. K., Couzin I. D. (2013). Migration or residency? the evolution of movement behavior and information usage in seasonal environments. Am. Nat. 181, 114–124. doi: 10.1086/668600
Stafford K. M., Nieukirk S. L., Fox C. G. (2001). Geographic and seasonal variation of blue whale calls in the north pacific. J. Cetacean Res. Manage. 3, 65–76.
Stock B. C., Semmens B. X. (2016). Unifying error structures in commonly used biotracer mixing models. Ecology 97, 2562–2569. doi: 10.1002/ecy.1517
Stock B. C., Semmens B. X. (2018). Analyzing mixing systems using a new generation of Bayesian tracer mixing models. Peerj 6, e5096. doi: 10.7717/peerj.5096
Sumich J. L. (2001). Growth of baleen of a rehabilitating gray whale calf. Aquat. Mamm. 27.3, 234–238.
Sydeman W. J., Hobson K. A., Pyle P., McLaren E. B. (1997). Trophic relationships among seabirds in central California: combined stable isotope and conventional dietary approach. Condor. 99, 327–336. doi: 10.2307/1369938
Szesciorka A. R., Ballance L. T., Širović A., Rice A., Ohman M. D., Hildebrand J. A., et al. (2020). Timing is everything: Drivers of interannual variability in blue whale migration. Sci. Rep. 10, 7710. doi: 10.1038/s41598-020-64855-y
Tershy B., Breese D., Alvarez-Borrego S. (1991). Increase in cetacean and seabird numbers in the canal de ballenas during an El niño-southern oscillation event. Mar. Ecol. Prog. Ser. 69, 299–302. doi: 10.3354/meps069299
Trueman C. N., Jackson A. L., Chadwick K. S., Coombs E. J., Feyrer L. J., Magozzi S., et al. (2019). Combining simulation modeling and stable isotope analyses to reconstruct the last known movements of one of nature’s giants. PeerJ 7, e7912. doi: 10.7717/peerj.7912
Ugalde de la Cruz A. (2015). Movimientos migratorios, estructura poblacional y tasa de supervivencia de las ballenas azules del pacífico noreste con base en datos de fotoidentificación (México: Centro Interdisciplinario de Ciencias Marinas-Instituto Politécnico Nacional).
Valenzuela L. O., Sironi M., Rowntree V. J. (2010). Interannual variation in the stable isotope differences between mothers and their calves in southern right whales (Eubalaena australis). Aquat. Mamm. 36, 138–147. doi: 10.1578/AM.36.2.2010.138
Wachtendonk R., Calambokidis J., Flynn K. (2022). Blue whale body condition assessed over a 14-Year period in the NE Pacific: Annual variation and connection to measures of ocean productivity. Front. Mar. Sci. 9, 847032. doi: 10.3389/fmars.2022.847032
Williams R. (2013). Trophic ecology of oxygen minimum zone zooplankton revealed by carbon and nitrogen stable isotopes (United States: University of Rhode Island).
Williams R. L., Wakeham S., McKinney R., Wishner K. F. (2014). Trophic ecology and vertical patterns of carbon and nitrogen stable isotopes in zooplankton from oxygen minimum zone regions. Deep-Sea Res. PT I. 90, 36–47. doi: 10.1016/j.dsr.2014.04.008
Witteveen B. H., Worthy G. A. J., Foy R. J., Wynne K. M. (2012). Modeling the diet of humpback whales: An approach using stable carbon and nitrogen isotopes in a Bayesian mixing model. Mar. Mamm. Sci. 28, E233–E250. doi: 10.1111/j.1748-7692.2011.00508.x
Keywords: blue whales, migratory strategies, feeding ecology, stable isotopes, baleen plates, intraspecific competition, nutrient transfer, northeast Pacific ocean
Citation: Blevins C, Busquets-Vass G, Pardo MA, Gendron D, Jacobsen JK, Gómez-Díaz F, Pérez-Puig H, Ortega-Ortiz CD, Heckel G, Urbán R J, Viloria-Gómora L and Newsome SD (2022) Sex- and age-specific migratory strategies of blue whales in the northeast Pacific Ocean. Front. Mar. Sci. 9:944918. doi: 10.3389/fmars.2022.944918
Received: 16 May 2022; Accepted: 08 August 2022;
Published: 02 September 2022.
Edited by:
Mónica A. Silva, University of the Azores, PortugalReviewed by:
Alex Aguilar, University of Barcelona, Spain;Kerri J. Smith, Dalhousie University, CanadaCopyright © 2022 Blevins, Busquets-Vass, Pardo, Gendron, Jacobsen, Gómez-Díaz, Pérez-Puig, Ortega-Ortiz, Heckel, Urbán R., Viloria-Gómora and Newsome. This is an open-access article distributed under the terms of the Creative Commons Attribution License (CC BY). The use, distribution or reproduction in other forums is permitted, provided the original author(s) and the copyright owner(s) are credited and that the original publication in this journal is cited, in accordance with accepted academic practice. No use, distribution or reproduction is permitted which does not comply with these terms.
*Correspondence: Geraldine Busquets-Vass, Z2VyYWxkaW5lLmJ1c3F1ZXRzQGdtYWlsLmNvbQ==