 Yu Dun1
 Yingjie Cao
 Yingxue Xuan
- 1Institute of Hydrogeology & Environmental Geology, Chinese Academy of Geological Sciences & Key Laboratory of Groundwater Remediation of Hebei Province and China Geological Survey, Shijiazhuang, China
- 2Research Institute for Environmental Innovation (Tianjin Binhai), Tianjin, China
- 3Shenzhen Branch of PowerChina HuaDong Engineering Corporation Limited, Hangzhou, China
- 4School of Environmental Science and Engineering, Sun Yat-Sen University & Southern Marine Science and Engineering Guangdong Laboratory (Zhuhai), Guangzhou, China
- 5State Key Laboratory of Environmental Criteria and Risk Assessment, Chinese Research Academy of Environmental Sciences, Beijing, China
Coastal aquifers play key roles in providing freshwater resources to maintain the social and economic development in coastal areas. However, climate change and human activities have dramatically affected the quantities and qualities of groundwater in coastal aquifers. In this study, stoichiometric analysis of hydrogeochemistry, multivariate analysis, and isotopic trancing techniques were used to reveal the local hydrochemistry characteristics, the natural and anthropogenic origins, and the major hydrochemical evolution in a typical coastal aquifer located in the Pearl River estuary. According to hydrogeological conditions and groundwater burial conditions, the aquifer was divided into three zones, namely, semiconfined fissure groundwater (SFGW), recharged fissure groundwater (RFGW), and porous medium groundwater (PGW). Seawater intrusion, ion exchange, water–rock reaction, and human activities were the main controlling factors affecting the characteristics of groundwater, but there were significant differences in the main controlling effects of different zones. Among them, the samples from the SFGW was severely affected by seawater intrusion, and the contributions of seawater ranged from 6% to 97%. Obvious cation exchange process occurred during the seawater intrusion. The hydrochemical characteristics of the PGW and the RFGW were mainly controlled by water–rock interaction. In addition, human activities had further influence on the hydrochemical characteristics of groundwater, which resulted in elevated nitrate–nitrogen (NO3−–N). The mean NO3–N concentrations in the PGW and the SFGW were 6.58 and 3.07 mg/L, respectively. Furthermore, the δ15N–NO3− and δ18O–NO3− values in these two regions ranged from +2.35‰ to +27.54‰ and from +0.39‰ to +18.95‰, respectively, indicating that the anthropogenic input contributed to the increased nitrate. Redox analysis and dual nitrogen isotopic evidence indicated that denitrification was the predominant biogeochemical process in the PGW and the RFGW. This study highlights the impacts of seawater intrusion and anthropogenic inputs on hydrochemical evolution and nitrogen behaviors in coastal groundwater, which provides a scientific basis for the management of groundwater resources in coastal aquifers.
1 Introduction
Globally, population concentrating in coastal areas has significantly increased due to the geographical advantages provided in these areas and the large development of industrial activities (Xiong et al., 2020). It is estimated that 50%–70% of the global population lives along coastal areas that only account for approximately 5% of world’s surface area (Council, 2007; Steyl and Dennis, 2010). Water resources are key factors of sustainable development, and coastal aquifers provide freshwater to more than one billion people lived in these areas (Small and Nicholls, 2003; Ferguson and Gleeson, 2012). However, climate change and human activities have dramatically affected the quantities and qualities of groundwater in coastal aquifers. For example, saltwater intrusion exacerbated by groundwater extraction and rising sea levels would degrade the quality and the quantity of freshwater available in coastal aquifers (Argamasilla et al., 2017; Parizi et al., 2019; Abd-Elaty et al., 2020; Rakib et al., 2020). Human activities, such as industry, agriculture, and urbanization would also affect groundwater resources (Wakida and Lerner, 2005; Wei et al., 2020). Among these factors, the impact of human activities on water resources is anticipated to increase over the next few decades and to be more significant than that of climate change (Vörösmarty et al., 2000; Lin et al., 2016). Urbanized coastal aquifer acts as a reservoir for “pollution collection” and “pollution transport,” which records changes in pollutants under anthropogenic impacts and has become pools of reactive major or trace elements and hotspots of regional pollution (Hale et al., 2014; Zhang et al., 2015; Lin et al., 2017; Huang et al., 2021). Therefore, it is essential to investigate the groundwater quality, distribution, and transformations of major pollutants in a highly urbanized coastal aquifer suffered from both the seawater intrusion and the anthropogenic pollutant inputs, which could be helpful to the groundwater resource management.
In general, the environmental fate of major pollutants such as nitrogen, organic matters, and trace metals depends on redox condition in aquifers (Appelo and Dimier, 2004; Wang et al., 2016). The redox processes in groundwater generally include the reduction of O2, NO3−, Mn(IV), Fe(III), SO42−, and CO2 (Froelich et al., 1979; Schüring et al., 2000). Among these processes, denitrification (reduction of NO3− to N2O/N2), methanogenesis, and sulfate reduction are the major redox processes in the coastal aquifer due to the lack of O2 (Huang et al., 2022b). However, the redox processes in the coastal aquifer have relatively spatial and temporal heterogeneity that are mainly influenced by terrestrial pollutants and saltwater intrusion (Wei and Lin, 2021). How to reveal the redox processes in groundwater and clarify the controlling factors are a huge challenge. Stable isotopic technology is recognized as a powerful tool for understanding the origins of water and dissolved constituents, and the biogeochemical processes in the groundwater (Kendall, 1998; Cook and Herczeg, 2000). For example, dual isotopes (δ15N and δ18O) of nitrate have commonly been utilized to quantify the nitrate sources and to identify the occurrence of nitrogen transformations (Fukada et al., 2003; Choi et al., 2007; Hosono et al., 2013; Weng et al., 2017; Lin et al., 2021). The ratios of the δ15N and δ18O values in the remaining nitrate are assumed to be close to 1.5:1 or even 2:1 if denitrification occurred (Mengis et al., 1999; Kendall et al., 2007). Thus, in order to identify the redox processes and the environmental fate of major pollutants in the groundwater, coupled nitrogen and oxygen isotopes technique of nitrate was used in this study.
Shenzhen, located along the east bank of the Pearl River Estuary in China, is a typical city that has undergone rapid urbanization. Because of the special geographical conditions, there are no large rivers, large lakes, and large reservoirs in Shenzhen. The per capita water resources are<200 m3, which is roughly 1/11 of the average level of China and lower than the world water crisis standard (Chen et al., 2020), showing a serious shortage of local water resources. The groundwater resources in the coastal aquifer of Shenzhen are underutilized, and the amount of groundwater supply was only 2.8×10⁶ m3/year (SMWB, 2019). Regional groundwater budget and numerical simulation showed that estimated average groundwater recharge was approximately 12% of annual precipitation (Lancia et al., 2019). As a strategic water resource and environmental asset, it is urgent to evaluate the water quality and major pollutants in the local aquifer. Although recent studies on the evolution of resources and chemistry in the groundwater have been conducted in Shenzhen city, including the effects of sewers on the amount of groundwater (Lancia et al., 2020), and the groundwater chemistry and its main geochemical factors (Shi et al., 2018), it is still unclear which major biogeochemical processes are likely to contribute to the environmental fate of major pollutants under the impacts of seawater intrusion and anthropogenic activities. Therefore, in this study, hydrogeochemical and isotope techniques were used in the coastal aquifer to (1) characterize the hydrogeochemistry, (2) identify the sources of major and trace elements, and (3) identify the major biogeochemical processes of the hydrochemical evolution suffered from seawater intrusion and anthropogenic disturbance.
2 Study Site
The study area is located in the east coast of the Pearl River Estuary (Figure 1). The total area is 186.88 km2 with a 29.9-km-long coastline. The topography of the study area is generally steep, declining from the east hill zone (100–150 m) to the west coastline (5–25 m). The climate is a typical subtropical monsoon climate with annual average precipitation of 1,935.8 mm and annual average temperature of 23.0°C.
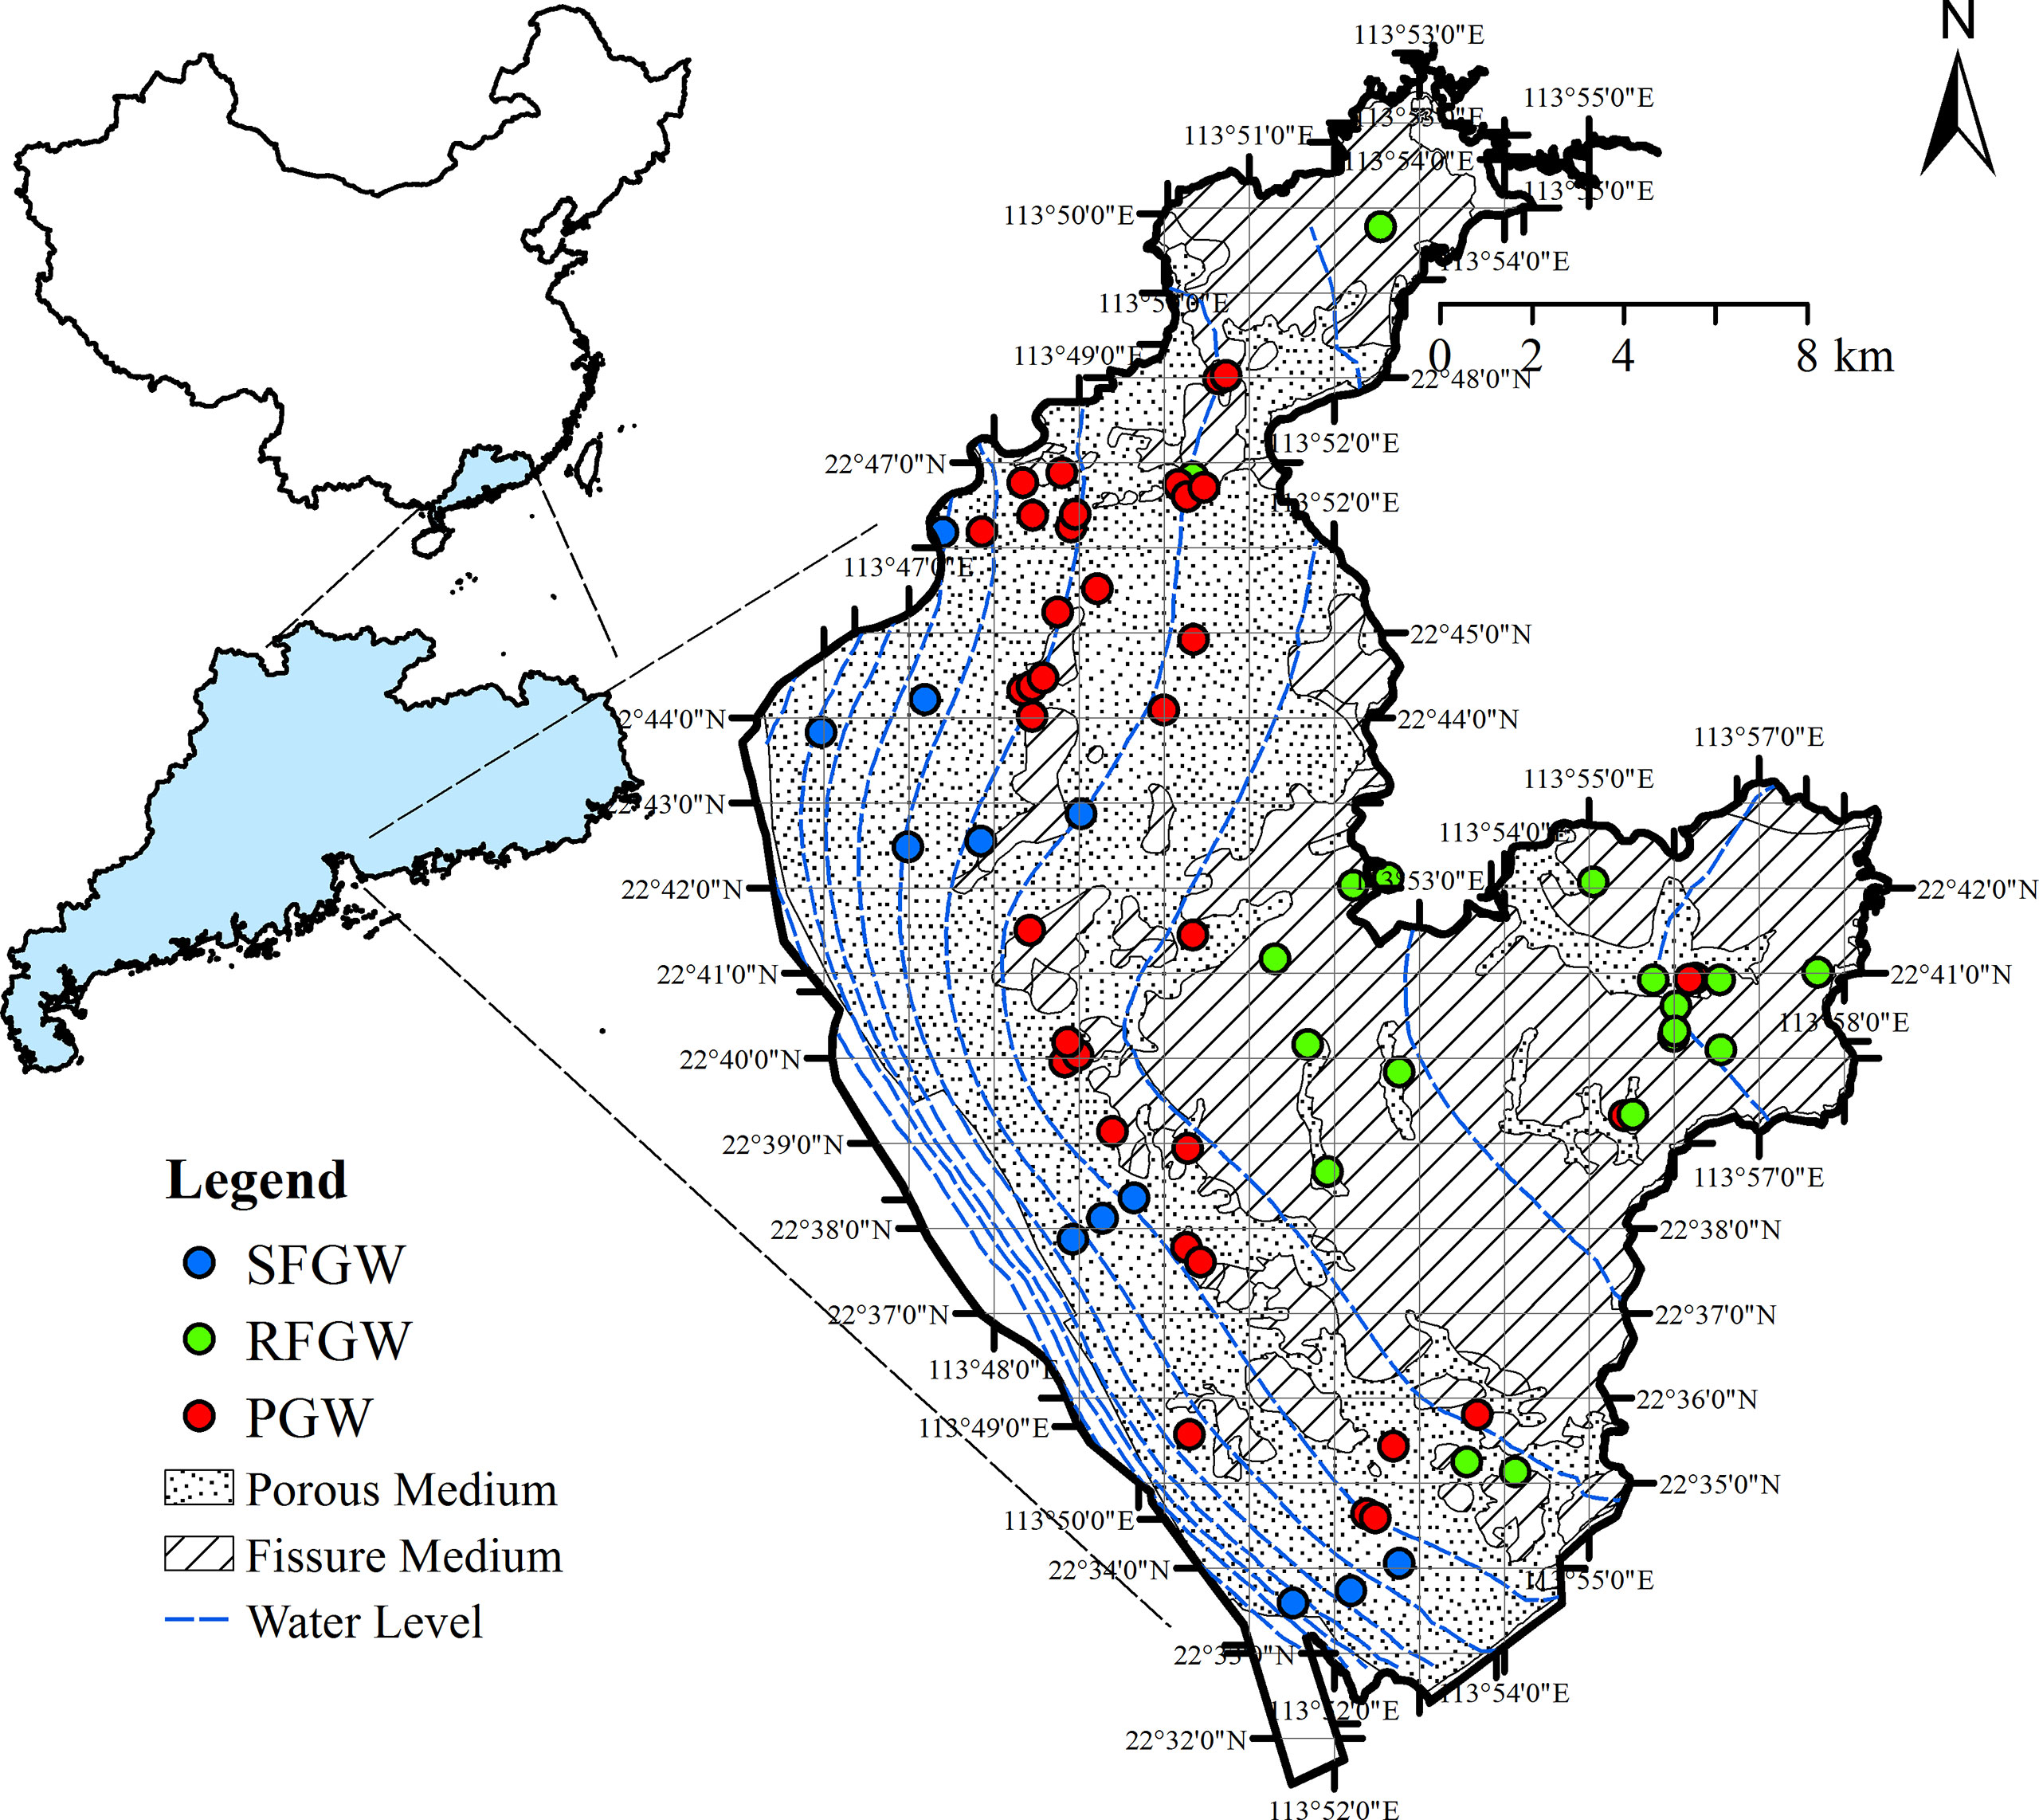
Figure 1 Sampling and geology map and groundwater flow field.
Triassic–Jurassic sedimentary formation contains interbedded sedimentary successions of glutenite, sandstones, and siltstones outcrops in the north and the east part of this study area (Figure 1). The west part is mainly overlaid by a thin clay layer (aquitard) and quaternary sediment with a thickness of 2–5 m in sequence (Figure 1). This fissure medium constitutes the major part of aquifer (FGW, fissure groundwater) in the study area (Han et al., 2009). The characteristics of the aquitard in this study indicated that the west region is the semiconfined fissure groundwater, and the north and east regions are the recharge zone of fissure groundwater. Therefore, the FGW could be further defined as two subzones, the FGW that could be recharged by precipitation (RFGW) and the semiconfined FGW (SFGW) (Figure 1). The overlaying quaternary sediment is recognized as the porous medium aquifer (PGW, porous groundwater, Figure 1). The PGW has relatively poor vertical hydraulic connection with the FGW but receives lateral recharge from the FGW. In addition, diffuse recharge by precipitation and river are also important recharge sources for the FGW.As one of China’s current national key economic development regions, Shenzhen city is a complex urbanized region with population dynamics, intense economic activities, and innovative clusters (Hui et al., 2018; Gao, 2019). In the study area, the gross domestic product (GDP) has increased from 182.95 billion in 2007 to 345.32 billion in 2017. The rapid economic and social development caused remarkable increased sewage inputs in the past decades, which resulted in the deterioration of local groundwater system.
3 Materials and Methods
3.1 Field Procedures
The spatial distributions of major elements, trace metals, and pollutants in the study area were investigated based on 57 sampling sites those that were collected in June 2015 (Figure 1). Groundwater samples were mainly collected from domestic and industrial wells. The well information, such as well depth, location, and operating interval, was recorded by questionnaire surveys. Based on the geology conditions, groundwater samples were classified into two groups: groundwater from the north and east recharge zone of fissure aquifer (RFGW, 20 samples) and groundwater from the west porous aquifer (PGW, 37 samples). Hydrochemistry data of 12 samples from the semiconfined fissure aquifer (SFGW) were compiled and reported by Jiang et al. (2009).
Field parameters for groundwater samples, including temperature (T), pH, electric conductivity (EC), redox potential (Eh), oxidation reduction potential (ORP), and dissolved oxygen (DO), were measured in situ using portable equipment (YSI EXO2 Multiparameter Sondes). Alkalinity was also determined on-site using the Gran titration method. Before sampling, the groundwater was pumped from the well until the EC value remained constant. Samples used for testing NH4+ concentrations were filtered by a 0.45-μm syringe-tip filter and then were acidified with reagent-quality HCl to a pH of approximately 4.0 to avoid NH4+ volatilization. Samples for trace metal analysis were filtered through vacuum filtration with 0.45-μm membranes and acidified with reagent-quality HNO3 to pH<2 on site. Samples for analyses of the major ion (Na+, K+, Mg2+, Ca2+, Cl-, SO42−, and NO3−) concentrations and the isotopes of nitrate (δ15N–NO3− and δ18O–NO3−) were filtered by 0.45-μm membranes and collected in 100-ml polyethylene bottles. Once filtered and acidified, the samples were kept cold by an ice bag in the field. All samples were brought back to the laboratory and stored at 4°C before further analysis.
3.2 Laboratory and Statistical Analysis
Dissolved cations (Na+, K+, Mg2+, and Ca2+) and anions (Cl−, SO42−, and NO3−) concentrations were measured using ion chromatography (Thermo Fisher ICS-900) with limit of detection of 0.01 mg/L. Sample replicates were chosen at random, and all fell within 5% for major compositions. Trace metals including Fe and Mn were analyzed by inductively coupled plasma mass spectrometry (ICP-MS, NexION 350D, PerkinElmer, USA).
The δ15N–NO3− and δ18O–NO3− values were determined using the bacterial denitrifier method (Sigman et al., 2001; Casciotti et al., 2002). Briefly, the NO3− in the groundwater samples was converted to N2O by denitrifying bacteria that lack N2O-reductase activity. Then, the N2O was extracted and purified through a precon system, and δ15N–NO3− and δ18O–NO3− were analyzed using an isotope ratio mass spectrometer (Thermo Fisher DELTA-V Advantage). Three international references (IAEA-N3, USGS34, and USG35) were used to correct the isotope values of samples. The analytical precisions for δ15N–NO3− and δ18O–NO3− were ±0.4‰ and ±0.5‰, respectively.Descriptive statistics and factor analysis were conducted using SPSS version 22.0. One-way ANOVA was used to test the spatial differences in major ion concentrations, trace metal concentrations, pollutant concentrations, and nitrogen and oxygen isotopes in nitrate with significance at p<0.05. Factor analysis was employed to unravel the underlying data set through the reduced new variables, and the significant factors affecting the characteristics of water chemistry were analyzed. The map of sampling sites was generated using ArcGIS 10.2.
4 Results
4.1 Field Parameter and Major Element
During the sampling period, for the samples from the FGW, the temperature ranged from 25.0. to 28.9°C. Wide ranges for EC, pH, and ORP were observed. EC ranged from 62 to 534 μs/cm, with an average of 197 μs/cm. Most samples were acidic with an averaged pH value of 5.45. ORP ranged from −116 to +311 mV, and its mean value was −53 mV. For the samples from the PGW, the temperature was relatively higher, with a range from 26.5°C to 31.5°C. Elevated EC has been observed and ranged from 283 to 2220 μs/cm, with an average of 793 μs/cm. The pH was also higher than that from the fissure groundwater, with an average of 6.44. The ORP had a wide range from −602 to +281 mV.
The Piper plot was employed here to identify groundwater hydrochemical patterns (Figure 2). For the samples from the PGW, the cation was dominated by Ca2+ (mean=1.68 mmol/L) and Na+ (mean=2.10 mmol/L), and the anion was dominated by HCO3− (mean=0.79 mmol/L). The hydrochemical pattern was Ca–HCO3. The order of abundance (expressed by meq/L) of the major cations was Ca2+>Na+>Mg2+>K+, and the order of abundance for the major anions was HCO3−>Cl−>SO42−. For the samples from the RFGW, the cation was also dominated by Ca2+ (mean=0.35 mmol/L) and Na+ (mean=0.46 mmol/L), and the anion was dominated by HCO3− (mean=0.79 mmol/L). The hydrochemical pattern was Ca–HCO3, which was similar to that in the PGW. The order of abundance of major cations was Ca2+>Na+>Mg2+>K+, and the order of abundance for the major anions was HCO3−>Cl−>SO42−. High salinization was identified in the SFGW samples, and the hydrochemical pattern was Na–Cl. Prevalent cations were Na+ and K+, and the most abundant anion was Cl−.

Figure 2 Piper Plot of groundwater samples in the study area.
4.2 Trace Metals Concentrations
Groundwater trace metal concentrations had a wide range within the aquifer (Figure 3), for instance, Fe (3.60–2,687.66 μg/L), Mn (0.65–569.86 μg/L), Ba (3.30–174.32 μg/L), Zn (0.23–99.28 μg/L), Al (0.11–80.91 μg/L), Cr (0.73–17.06 μg/L), As (0.25–38.04 μg/L), Ni (0.21–28.15 μg/L), Mo (0.02–14.21 μg/L), Se (0.00–6.99 μg/L), Cu (0.17–3.93 μg/L), Co (0.0.1–13.22 μg/L), Pb (0.00–7.86 μg/L), Cd (0.00–0.37 μg/L), and Be (0.00–1.00 μg/L). Among the 15 trace metals analyzed, Ni, Pb, and Cd are the most toxic. According to the WHO drinking water guidelines (WHO, 2011), the highest admissible concentrations of Ni, Pb, and Cd are 70, 10, and 3 μg/L, respectively. In our study area, concentrations of Ni and Pb in all the samples were below the guideline values of WHO; only one sample had Cd of 0.375 ug/L that was higher than the guideline value.
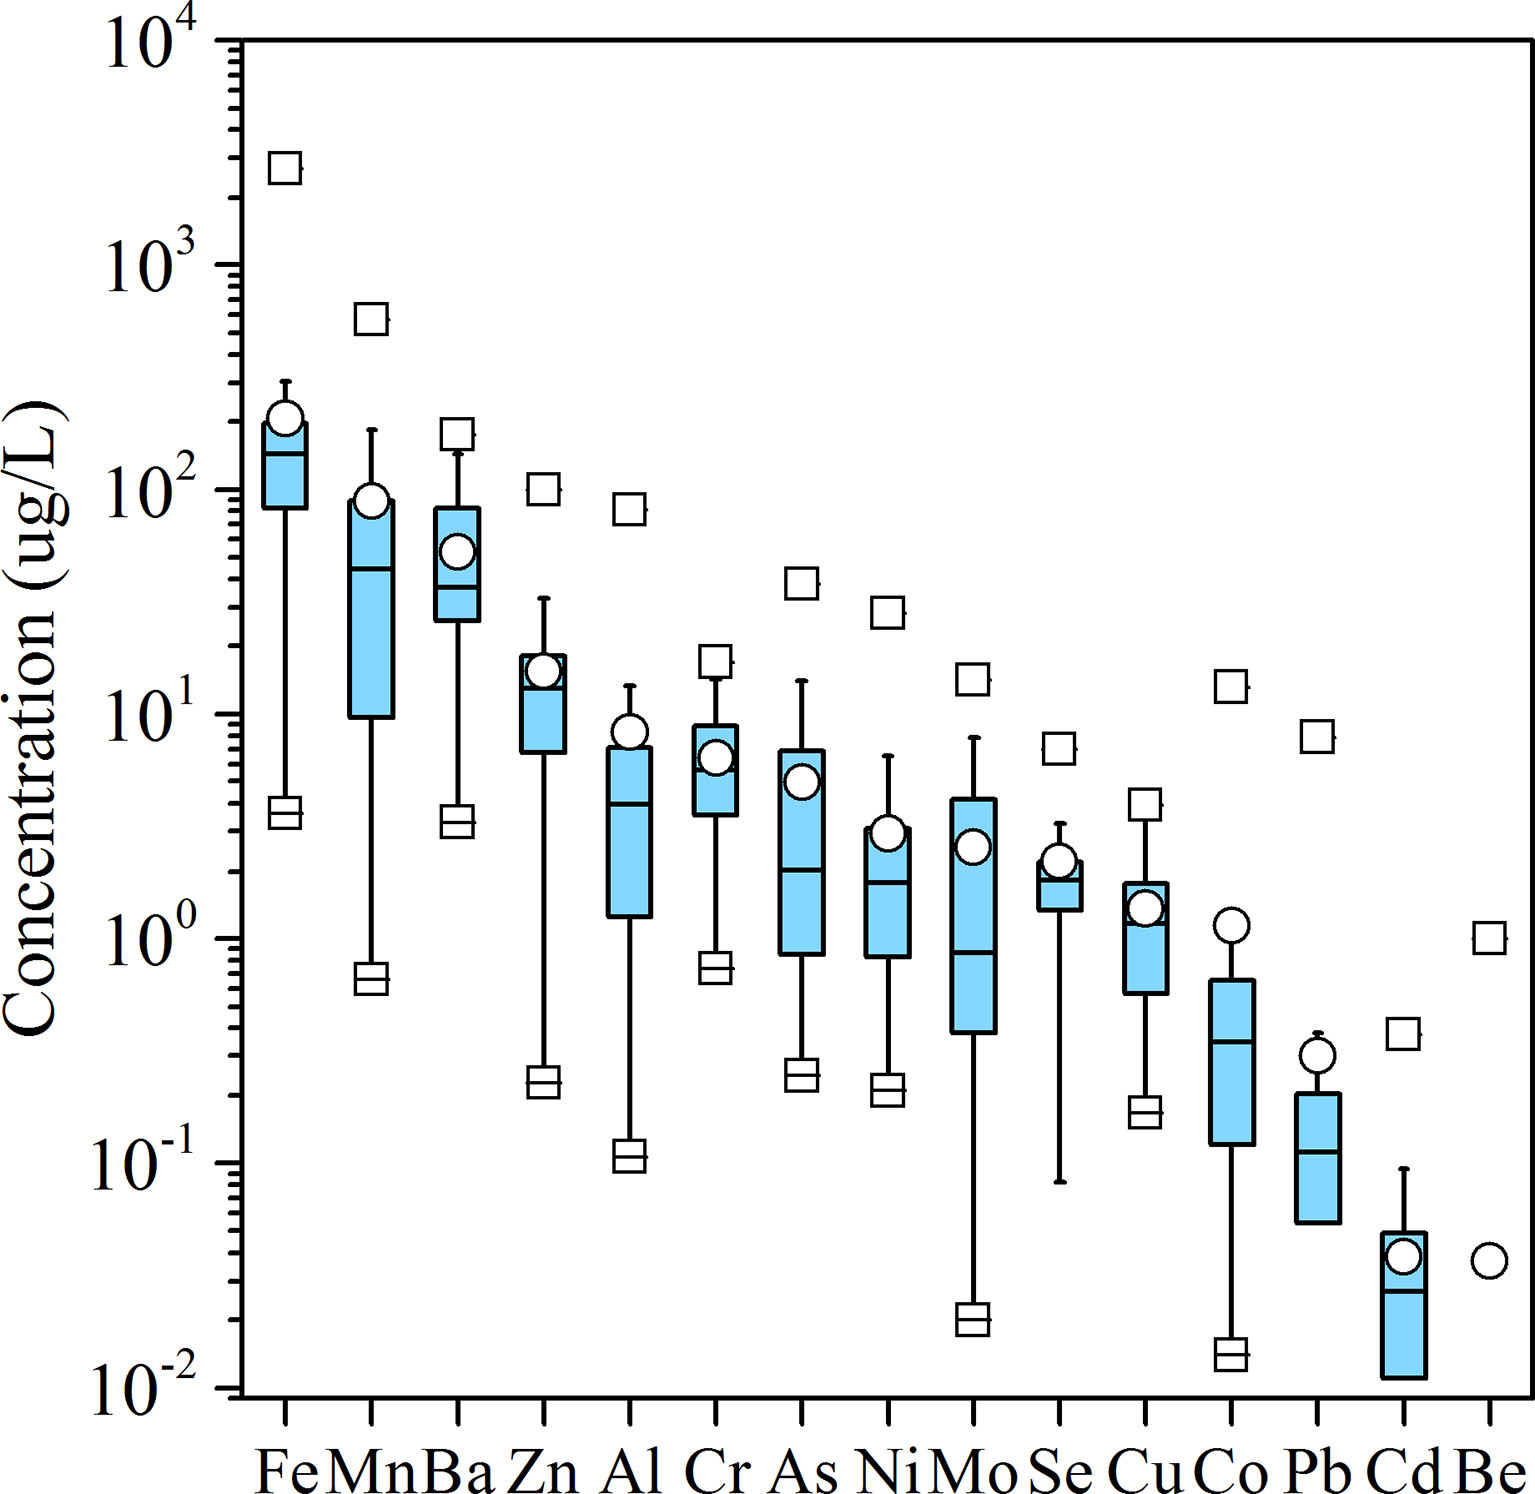
Figure 3 Boxplots of trace metal concentrations (μg/L) in groundwater in the study area. Logarithmic coordinates are used for the y-axis due to the large variation in concentration ranges.
4.3 Pollutant Concentrations and Isotope Signatures
Nitrogen (NH4–N, NO2–N, NO3–N, and TN) concentrations showed significant spatial distributions (Figure 4). The NO3–N was detected in both the PGW and the SFGW with averaged concentrations of 6.58 and 3.07 mg/L, respectively. The NH4–N was mainly detected in the PGW with an averaged concentration of 8.21 mg/L. The NO2–N was also detected in PGW with an averaged concentration of 0.40 mg/L. As a whole, NO3–N was the predominant species of dissolved inorganic nitrogen in the RFGW, and NH4–N was the predominant species in the PGW, while the DFGW samples were free of nitrogen contamination. The COD concentrations of groundwater ranged from 0.1 to 75.0 mg/L, which showed spatial variations. The range of COD concentrations in the PGW was from 0.1 to 75.0 mg/L with an average of 21.9 mg/L, while the range of COD concentrations was from 0.1 to 57 mg/L with an average of 26.7 mg/L in the RFGW. The δ15N–NO3− and δ18O–NO3− values in the PGW ranged from +12.81‰ to +27.54‰ and from 7.54‰ to +18.95‰, respectively, while for the samples from the RFGW, the δ15N–NO3− and δ18O–NO3− values ranged from +2.35‰ to +15.79‰ and from +0.39‰ to +9.96‰, respectively.
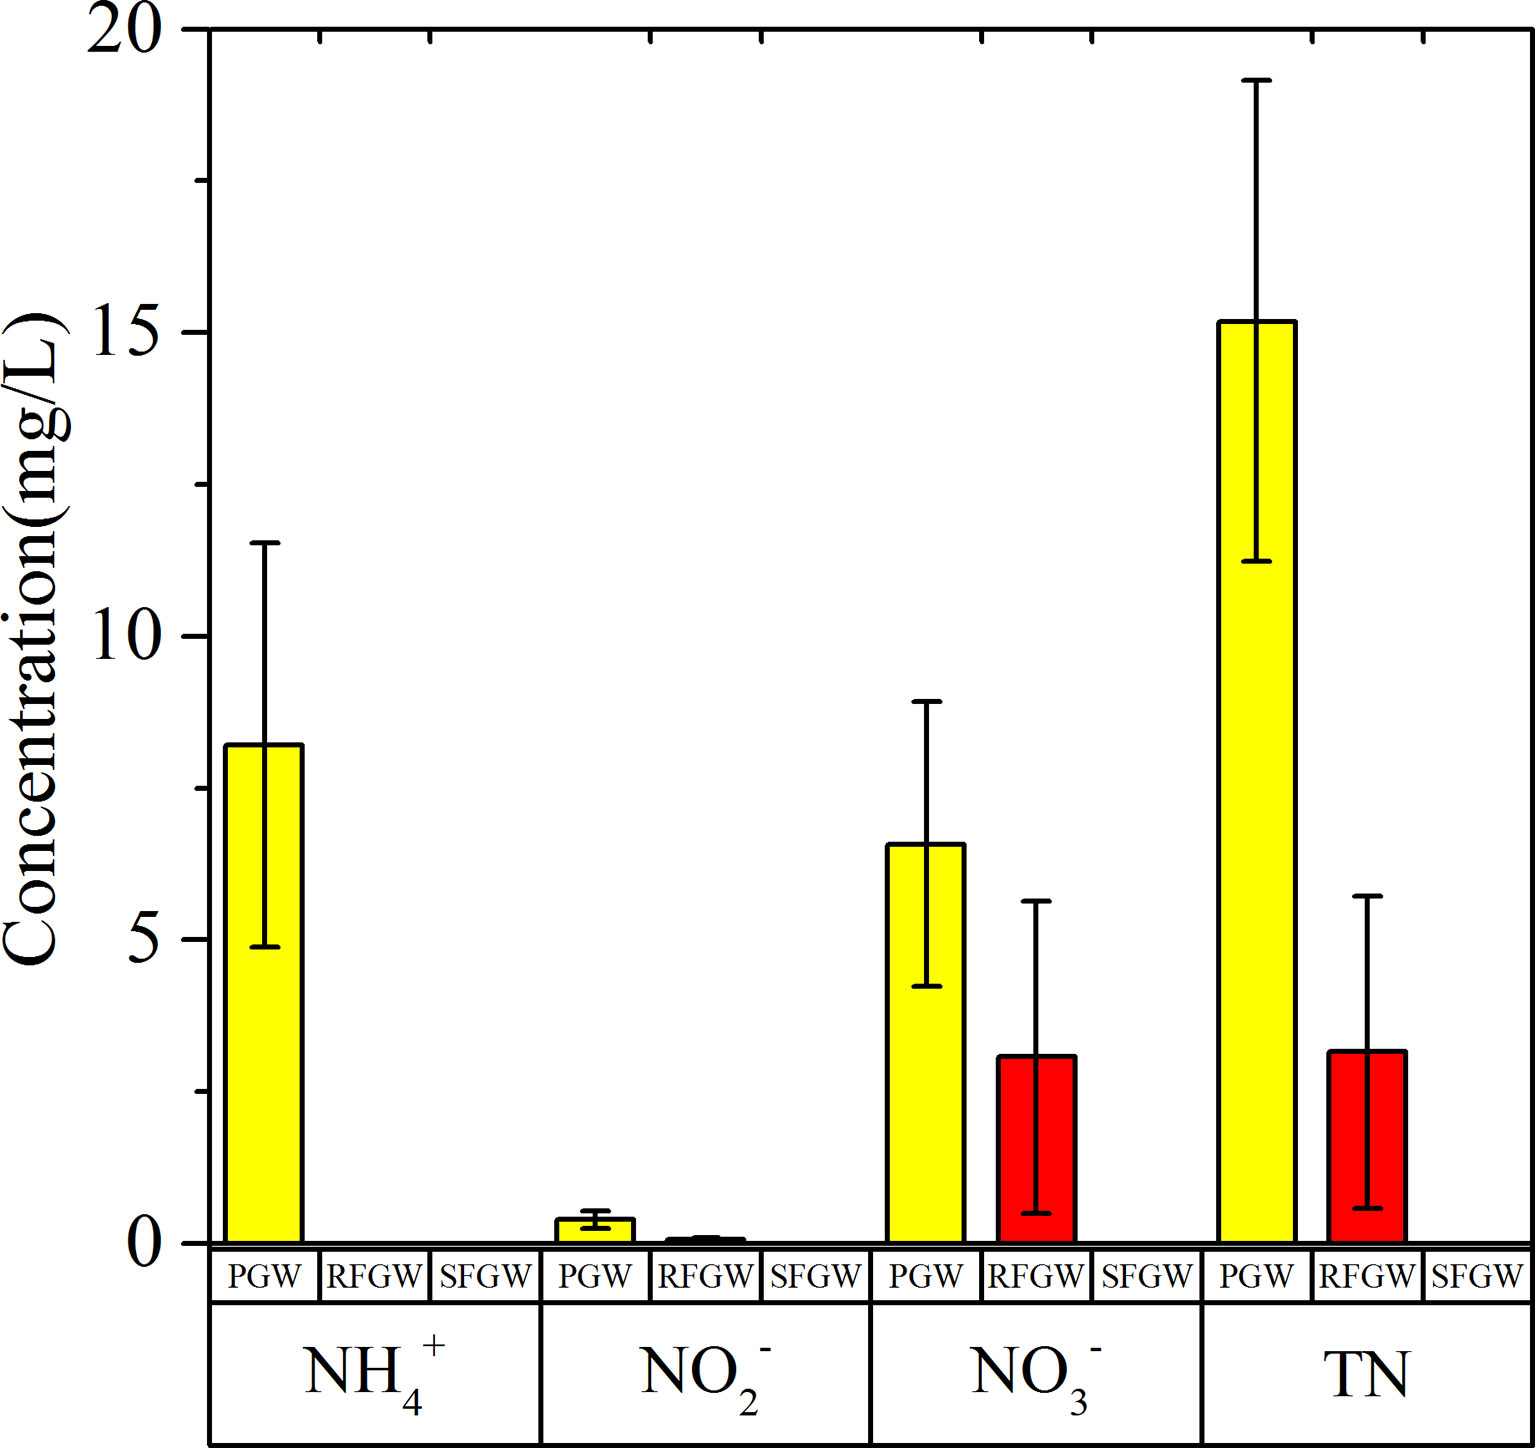
Figure 4 Nitrogen variations in the groundwater of the study area.
5 Discussion
5.1 Characteristics of Dual Isotopes in Nitrate in Coastal Groundwater
As results showed, NO3−–N was the dominant N form and major pollutant in the coastal groundwater. The characteristics of dual isotopes of NO3− (δ15N–NO3− and δ18O–NO3−) could provide evidence of origins and major transformation process of nitrate. In this study, the mean values of δ15N–NO3− and δ18O–NO3− in this study were 16.4 ± 5.7‰ and 10.0 ± 3.6‰, respectively. These values were comparable to those reported in previous studies on groundwater in the Pearl River Delta. For example, the δ15N–NO3− and δ18O−NO3− in coastal aquifer system of Guangzhou ranged from +9.25‰ to +31.99‰ and from −2.83‰ to +16.74‰, respectively (Li et al., 2019b); the δ15N–NO3− and δ18O–NO3− in shallow groundwater of Dongguan ranged from +6.68‰ to +26.23‰ and from −6.59‰ to +13.72‰, respectively (Li et al., 2020). In addition, the mean values of δ15N–NO3− and δ18O–NO3− in the coastal groundwater of this study was higher than those reported in the shallow groundwater (+12.4 ± 0.4‰ and +8.2 ± 0.1‰) and was lower than those reported in the deep groundwater of the southern ocean (+21 ± 0.7‰ and +11 ± 0.9‰) (Wong et al., 2014). However, compared to surface water in the estuarine and coastal ecosystems, the δ15N–NO3− in groundwater showed higher values (Ye et al., 2016; Archana et al., 2018). This finding suggested that sewage effluents (δ15N>+10‰) or denitrification was likely to be responsible for the elevated δ15N–NO3− values in the groundwater.
5.2 Origins of Major and Trace Elements
The data set for the three groups was analyzed separately by R-mode factor analysis, and different factors were identified for the RFGW, the PGW, and the SFGW. ORP is excluded from all the analysis because it is highly skewed and has no improvement by BOX-COX transformation. NH4+ is also excluded from the analysis for the RFGW and the SFGW because the samples in the RFGW and the SFGW were free of ammonium pollution. COD and NO3− data are missing for SFGW so that only major ions such as Na+, K+, Ca2+, Mg2+, HCO3−, Cl−, and SO42− are included for the SFGW factor analysis. Four factors are identified for the RFGW and the PGW, while only two factors were identified for the SFGW. The parameters with factor loadings >0.6 or<−0.6 and factor meanings are listed in Table 1. Based on the loadings, the first and second factors can be grouped as the groundwater salinization factors, and the third and fourth factors can be grouped as the pollution factors.
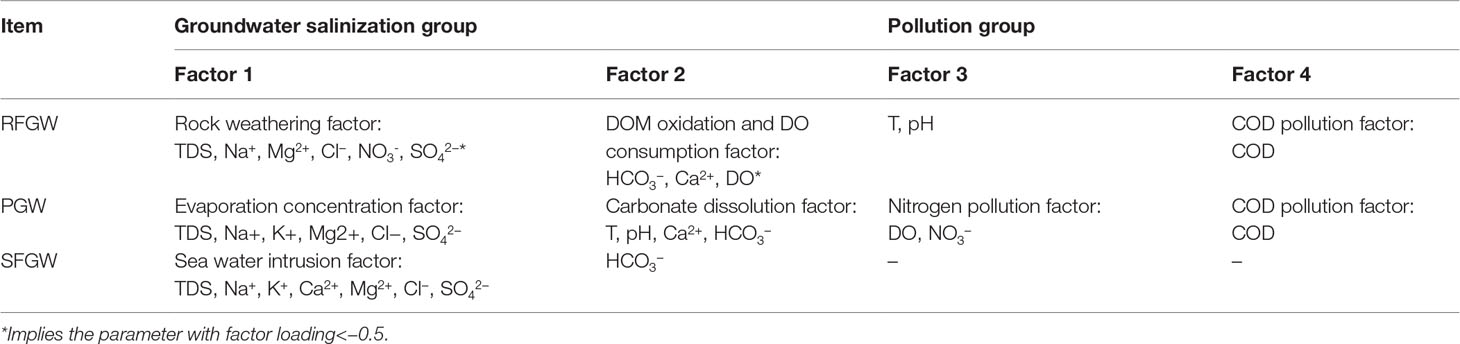
Table 1 Results of factors analysis in the different aquifers.
5.2.1 Natural Origin
(1) Natural origin of major elements
The first factor group (factor 1 and 2) identified was mainly related to the groundwater salinization processes, although each has some different meanings for the RFGW, the PGW and the SFGW (Table 1). In the recharge zone of fissure aquifer (RFGW), factor 1 had high positive loadings on TDS, Na+, Ca2+, Mg2+, Cl-, NO2- and NO3- and was recognized as “rock weathering” factor, which indicated that the water-rock reaction was the main factor contributing to TDS. The sea water indicator SO42- showed a negative loading, which indicated that the increase of TDS had no relation with the sea water. In addition, NO3- showed a positive loading on factor 1, implying natural (non-anthropogenic) origin of NO3- such as precipitation deposition. Factor 2 with high positive loadings on HCO3- and negative loadings on DO represented the occurrence of DOM oxidation and DO consumption processes. The corrosive CO2 released by oxidation of DOM could promote the dissolution of carbonate and silicate, which resulted in the increases of HCO3- and Ca2+. The first factor identified for the PGW had positive loadings on TDS, Na+, K+, Ca2+, Mg2+, Cl- and SO42- (Table 1) and was recognized as “rock weathering and evaporation concentration” factor. Factor 2 for the PGW had high loadings on T, pH, Ca2+ and HCO3-. This factor was recognized as “carbonate dissolution factor”. The factor analysis results indicated that carbonate dissolution, mixing with seawater and evaporation were major factors that resulted in the increase of TDS for the PGW. The first factor identified for the SFGW had positive loadings on TDS, Na+, K+, Ca2+, Mg2+, Cl- and SO42- (Table 1) and was recognized as “sea water intrusion” factor. In addition, the Gibbs plot showed that all the samples came from the SFGW were located in the sea water zone, which indicated that the major elements in the SFGW was affected by severe seawater intrusion (Figure 5).
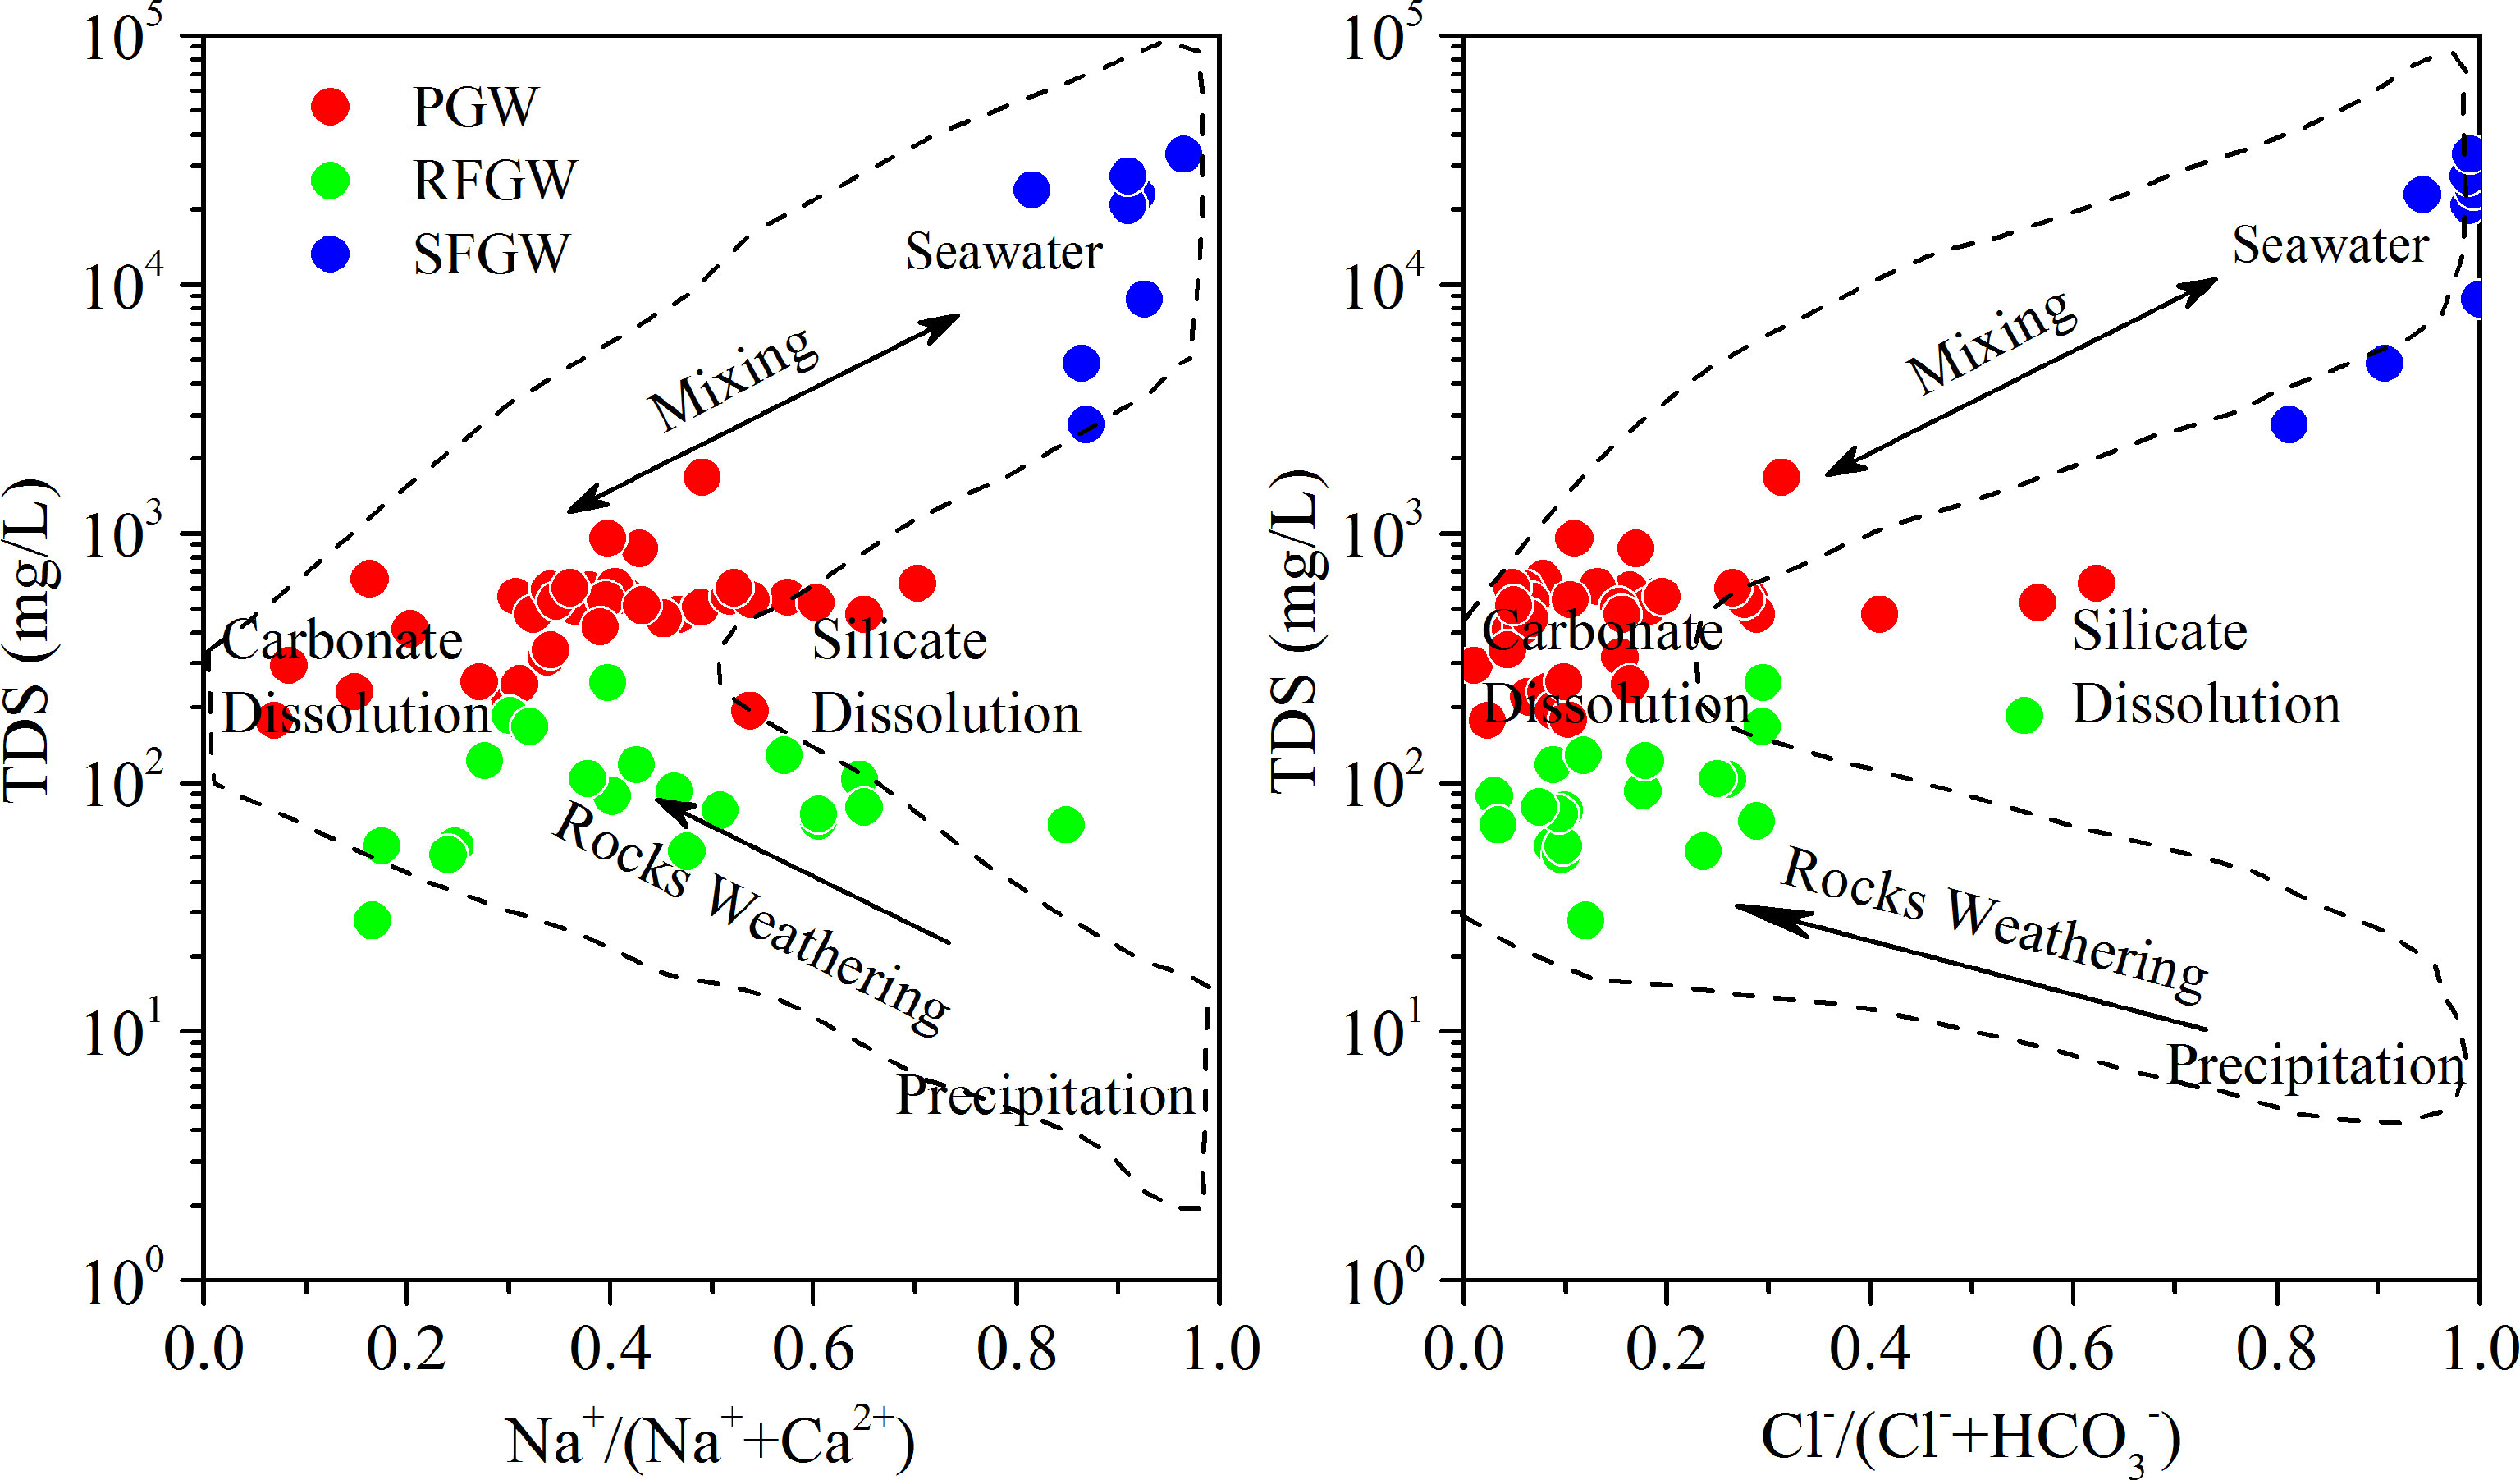
Figure 5 Modified Gibbs plot. The Na+/(Na++Ca2+), Cl−/(Cl-+HCO3−) is calculated by weight concentrations in mg/L.
(2) Natural origin of trace elements
Because the relative low concentrations and low mobility of trace metals, the origin of trace metals were expected to originating natural input rather than anthropogenic input in this study area. Previous studies have documented the contents of trace metal in the Quaternary sediments of the Pearl River Delta (PRD) (Wang et al., 2016), which found that Fe and Mn showed the largest abundance, followed by Ba, Cr, Zn, Ni, Cu, Pb, Co, Mo, Cd in the solid phase. Similar abundance of trace metals with Fe > Mn > Ba > Zn > Al > Cr >As > Ni > Mo > Se >Cu >Co >Pb >Cd > Be were observed in the dissolved phase in this study area (Figure 3), which indicated that the origin of trace elements in the groundwater was sedimentary deposits. In addition, previous studies suggested that the mobility of trace metals in the groundwater was limited by adsorption on various solid phases of sediments, including sedimentary organic matter, carbonate phases, Fe-Mn oxides, and other minerals, which was strongly depended on pH variability (Wang et al., 2016; Liénart et al., 2018). Trace metals would mobilize when pH values were low, and most of heavy metals would be entirely adsorbed when pH values were as high as 7 (Appelo and Postma, 2005b). Although significant amounts of heavy metals were found in the groundwater in this study, no significant correlation was identified between the concentrations of any heavy metal and the pH (Figure 6), which indicated that pH was not the major factor affecting the mobility of heavy metals in this groundwater system. This results was likely because pH values were circum-neutral or slightly alkaline caused by marine influences and the possible presence of dissolved ammonia in the groundwater (Wang et al., 2016; Huang et al., 2022a).
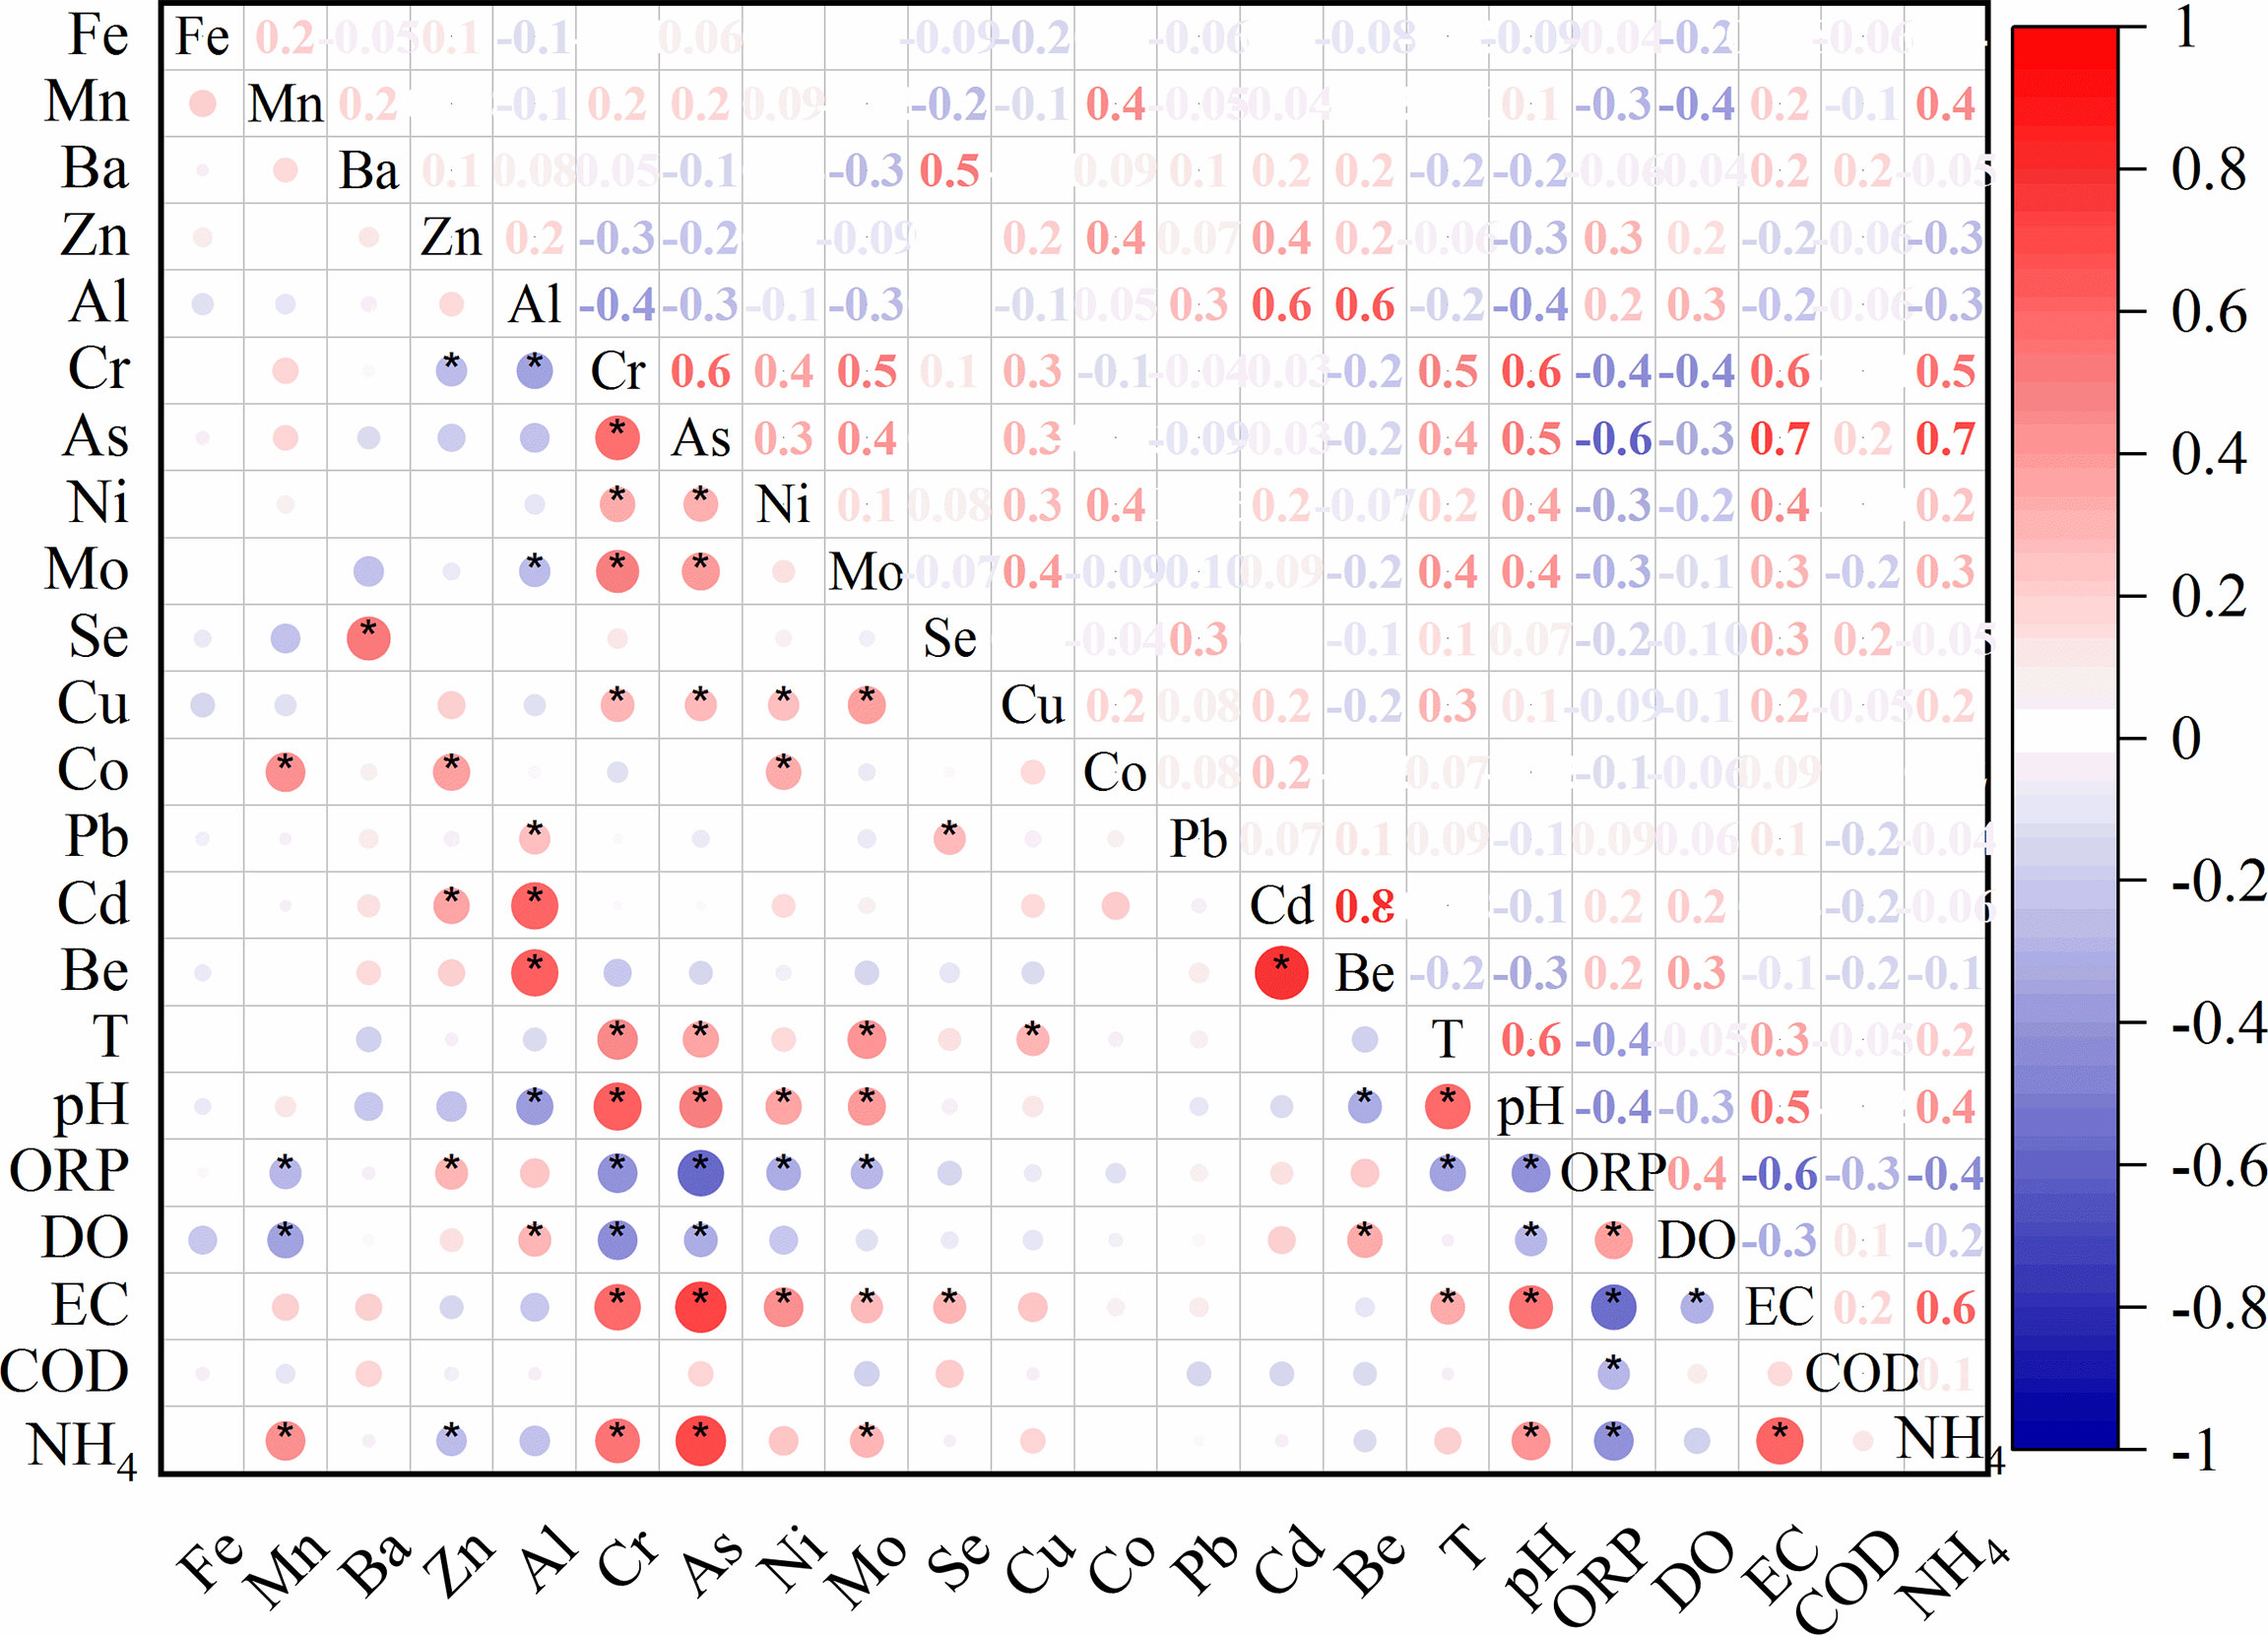
Figure 6 Matrixes of Person correlations between trace metals and other field parameters in this study area. Red and blue dots inside the squares correspond to the negative and positive correlations with p<0.05, respectively. Light-colored small dots represent low correlations, while darker-colored large dots correspond to higher correlations. Missing dots inside the squares indicate an insignificant relationship between the pairwise variables.
5.2.2 Anthropogenic Input
Deterioration of groundwater quality could be expressed by the pollution factor group (factors 3 and 4 in Table 1. Factor 4 with loading on COD was identified for both the RFGW and the PGW, indicating ubiquitous organic pollution in the local groundwater. Averaged COD concentrations of the RFGW and the PGW were 26.65 and 21.85 mg/L, respectively. In addition, factor 3 showed different meanings for the RFGW and the PGW. For the RFGW, only nitrate was detected, and the averaged concentration was approximately 0.22 mmol/L (3.08 mg N/L), which was lower than that of the WHO drinking water standard (10 mg N/L). As described by factor 1, the natural origin of nitrate came from precipitation deposition. Compared with the RFGW, elevated nitrate, nitrite, and ammonium were detected in the samples from the PGW. For the PGW, the averaged concentrations of nitrate, nitrite, and ammonium were 0.47, 0.03, and 0.59 mmol/L, respectively. From the N loading perspective, 20% of the PGW samples have exceeded the WHO drinking water standard. The isotope signals of δ15N–NO3− and δ18O–NO3− values in the PGW showed higher values and within the expected range of manure and sewage zones (Figure 10A), indicating that the infiltration of manure and sewage caused by human activities was mainly responsible for the increase in nitrate in the groundwater. In addition, the more severe environmental problem for the PGW samples was caused by high ammonium concentrations. Averaged NH4+ concentration of the PGW samples was 0.59 mmol/L (8.26 mg N/L), which was higher than the values that were defined by the standard for groundwater quality in China (type V: 1.5 mg N/L). Previous studies have showed that the extremely high ammonium concentration originated from N-bearing organic matter mineralization in the west bank of the Pearl River estuary (Jiao et al., 2010; Wang and Jiao, 2012; Wang et al., 2013; Li et al., 2019b). This study found that the high ammonium with natural origins also existed in the east bank of the Pearl River estuary. However, our previous study showed that mineral dissolution was mainly controlled by acid rain caused by human activities in the eastern Pearl River Delta (Li et al., 2020). Therefore, the indirect impact of anthropogenic activities (e.g., acid rain) on groundwater chemistry might be more responsible for the accumulation of nitrogen in the groundwater.
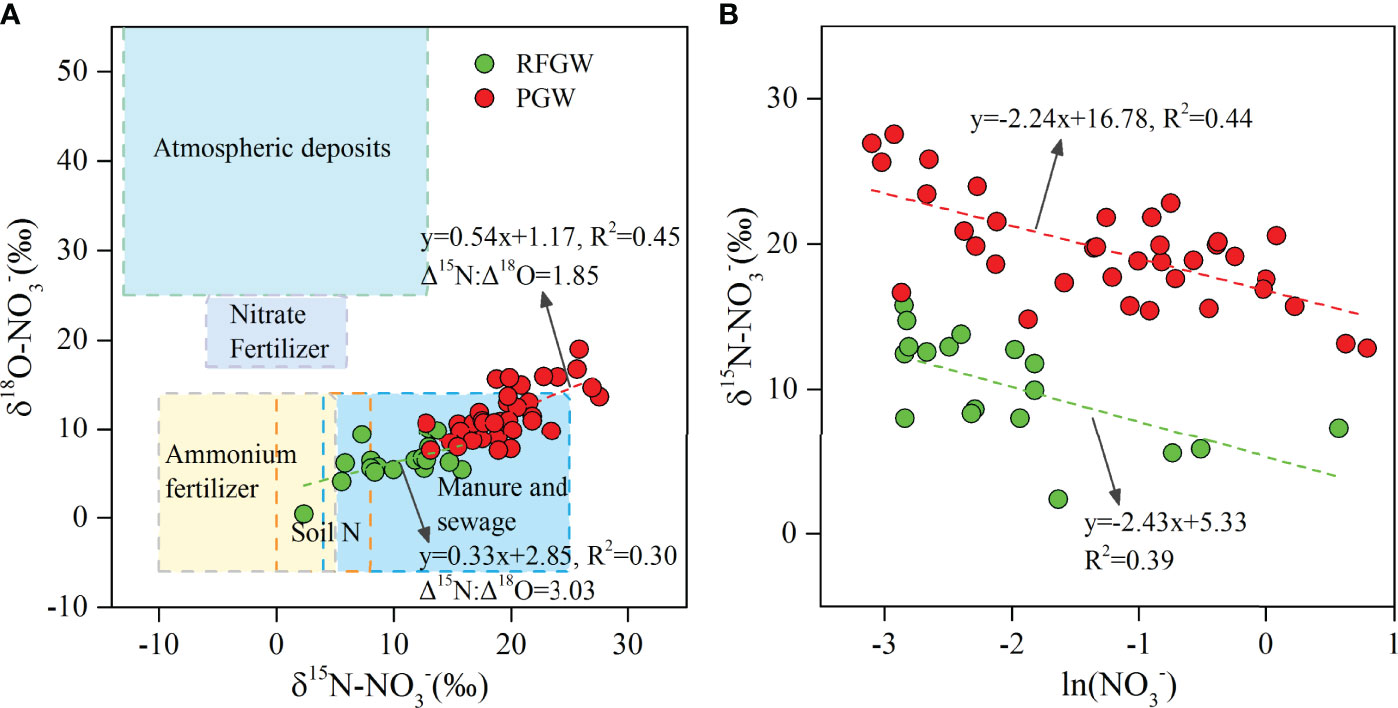
Figure 10 Plot of δ15N–NO3− versus δ18O–NO3−(A) and δ15N–NO3− versus Ln(NO3−) (B). The typical ranges of potential nitrate sources were taken from Xue et al. (2009).
5.3 Hydrochemical Evolution and Nitrogen Behaviors
Gibbs plots displaying the weight ratios of Na+/(Na++Ca2+) and Cl−/(Cl−+HCO3−) against the TDS values have been widely employed to assess the dominant factors of soluble ions in the surface waters, such as precipitation, river water, and bedrock mineralogy (Gibbs, 1970; Feth and Gibbs, 1971). However, total key factors that controlled hydrochemical evolution in the groundwater were unlikely to be identified from the original Gibbs diagram due to the complexity of groundwater environments. Therefore, the natural processes defining the hydrochemical evolution of groundwater have been reassessed by Marandi and Shand (2018), which are shown in a modified version (Figure 5). It was observed that all groundwater samples from the PGW and the RFGW fell into the rock weathering dominance zone. Among the rock weathering processes, carbonate dissolution was recognized as the dominant factor, while silicate dissolution by precipitation was responsible for some of the samples. The samples from the SFGW were located in the region of seawater, which evidenced seawater intrusion. In addition, the large variations of Na+/(Na++Ca2+) suggested that cation exchange might have an influence on the cation exchange of Na+ and Ca2+ content in the groundwater (Liu et al., 2015). Therefore, the cation exchange during mixing, water–rock interaction, and redox processes could not be revealed by Gibbs plot but are important factors affecting the specification and behavior of redox couples.
5.3.1 Mixing Process and Ion Exchange
Generally, Cl− can be used to estimate the contribution of seawater in the confined aquifers by the mixing equation shown below (Appelo and Postma, 2005):
where mCl,sample, mCl,fresh, and mCl,sea are the Cl− concentration in the sample, freshwater, and seawater, respectively. fsea is the fraction of seawater in the aquifer. Based on mixing Equation 1, the fraction of seawater contributions in the groundwater ranged from<1% to 97%. Specifically, the semiconfined fissure aquifer (SFGW, 12 samples) suffered from severe seawater intrusion with seawater fraction from 6% to 97%. Samples from the PGW and the RFGW were almost free of seawater intrusion with seawater fraction smaller than 1.5%.
During the mixing of seawater and fresh groundwater, the cation-exchange process could significantly alter the major cation compositions according to the Equations 2 and 3:
The plot of (Na++K+–Cl−) against [Ca2++Mg2+–(HCO3−+CO32−+SO42−)] was usually used to explain the possibility of cation exchange in groundwater (Liu et al., 2015; Li et al., 2019c). However, carbonic, sulfuric, and nitric acid participated in carbonate mineral and silicate mineral weathering, which resulted in the enrichment of Ca2+ and Mg2+ contents in the groundwater in this study area. Thus, we regarded [Ca2++Mg2+–(HCO3−+CO32−+NO3−+SO42−)] as one of the coordinate axes. The diagram of (Na++K+–Cl−) versus [Ca2++Mg2+–(HCO3−+CO32−+NO3−+SO42−)] depicted a negative linear correlation (Figure 7A), which demonstrated that the cation exchange between Na+, K+ and Ca2+, Mg2+ occurred in the groundwater. However, in the SFGW, the excess Ca2+ came from cation exchange that precipitated with HCO3− into CaCO3, leading to the SFGW samples deviating from the 1:1 line as shown in Figure 7A.
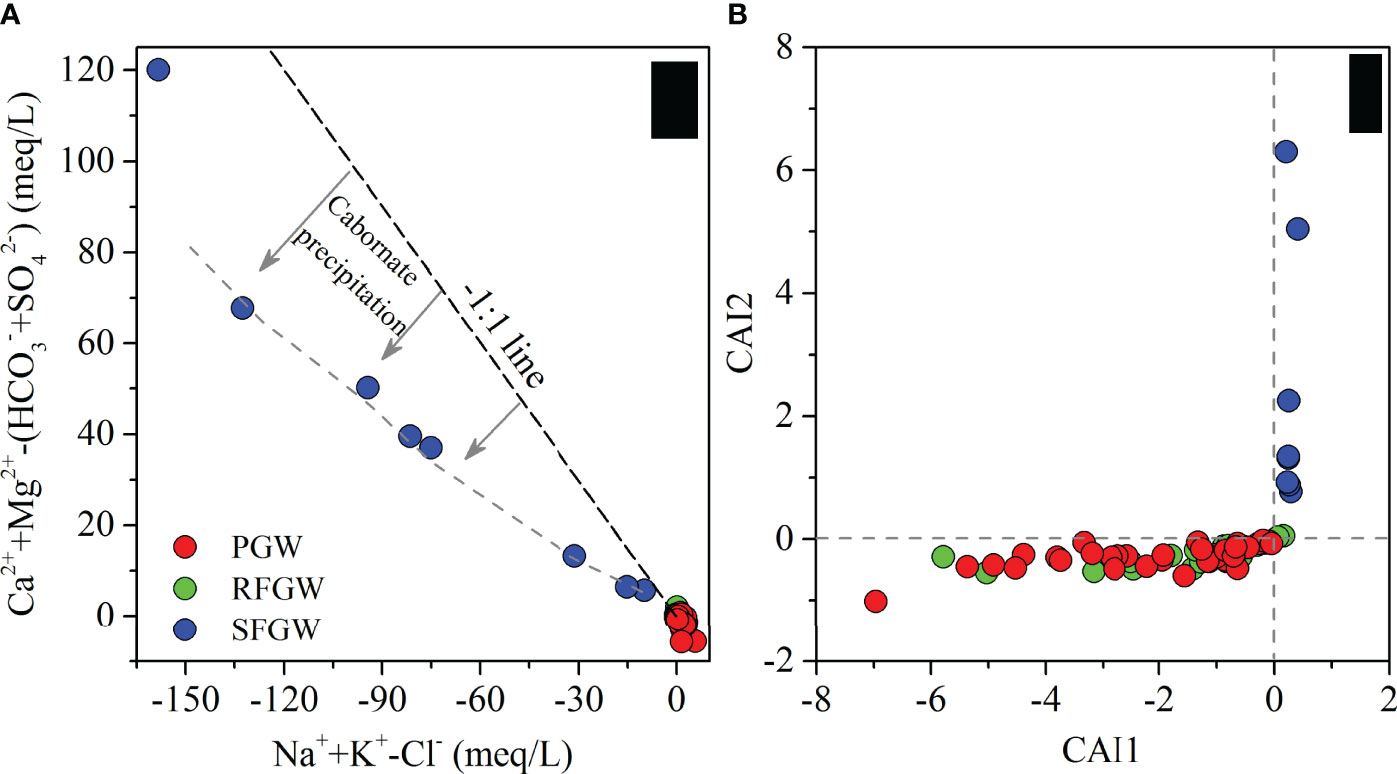
Figure 7 Stoichiometric relation between major ions (A) and scatter plot of CAI1 and CAI2 for groundwater samples (B).
The chloro-alkaline indices CAI1 = [Cl−–(Na++K+)]/Cl− and CAI2 = [Cl−–(Na++K+)]/(HCO3−+CO32−+SO42−+NO3−) (Schoeller, 1964; Schoeller, 1977) were also applied to analyze cation-exchange processes (Figure 7B). The positive values of the two indices suggested the occurrence of cation exchange expressed as Equation 2, while negative values of the two indices could be obtained when cation exchange expressed as Equation 3 occurred. The CAI1 and CAI2 for all samples from the SFGW showed positive values, which ranged from 0.21 to 0.40 and from 0.77 to 6.30, respectively. The exchange of Na+ and K+ from the water with Ca2+ and Mg2+ of the aquifer medium in the SFGW did occur during the seawater infiltration. However, the CAI1 and CAI2 for the RFGW and the PGW samples showed negative values, indicating that the process could be expressed by Equation 3.
5.3.2 Water–Rock Interaction
The stoichiometric relationships among major ions could give further explanation of the influence of water–rock interaction on hydrochemistry in groundwater. The ratios of Na+ and Cl- (in meq/L) in seawater was close to 0.86, while the congruent dissolution of halite or exogenous input of NaCl resulted in the ratios of Na+ and Cl− close to 1:1. In Figure 8A, the ratios of Na+ and Cl− of the SFGW samples were close to 0.86, which confirmed the occurrence of seawater intrusion. For the PGW and the RFGW, some samples located along the 1:1 line, indicating the existence of halite or exogenous input of NaCl. The excess of Na+ implied the dissolution of albite (NaAlSi3O8) and Na-feldspar (NaAlSi3O8) caused by carbonic, sulfuric, and even nitric acid, which are the sources of (Na++K+) contents in groundwater. In Figure 8B, most of the samples deviated from the 1:1 line of Ca2+ and SO42−, indicating the absence of gypsum in the aquifer. The excess of Ca2+ indicated that the carbonate dissolution was the dominant process that contributed most of Ca2+. This result could be further proved by the stoichiometric analysis of (Ca2++Mg2+) and HCO3−. In Figure 8C, most of the samples from the PGW and the RFGW were located along the 1:1 carbonate dissolution line, which demonstrated that the dissolution of calcite and dolomite dominated in this study area. However, acid rain emerged as an important environmental problem in Southern China since the 1980s, as previous studies documented (He et al., 2002; Larssen et al., 2006; Zhang et al., 2010). SO2 and NOx are the main components in acid rain, which participate in carbonate mineral and silicate mineral weathering (Cao et al., 2020). In this study, the stoichiometric relation between (Ca2++Mg2+) and (HCO3−+SO42−) showed that lots of samples were located above the 1:1 line (Figure 8D). The excess of (HCO3−+SO42−) compared to (Ca2++Mg2+) illustrated the occurrence of silicate weathering in the PGW and the RFGW.
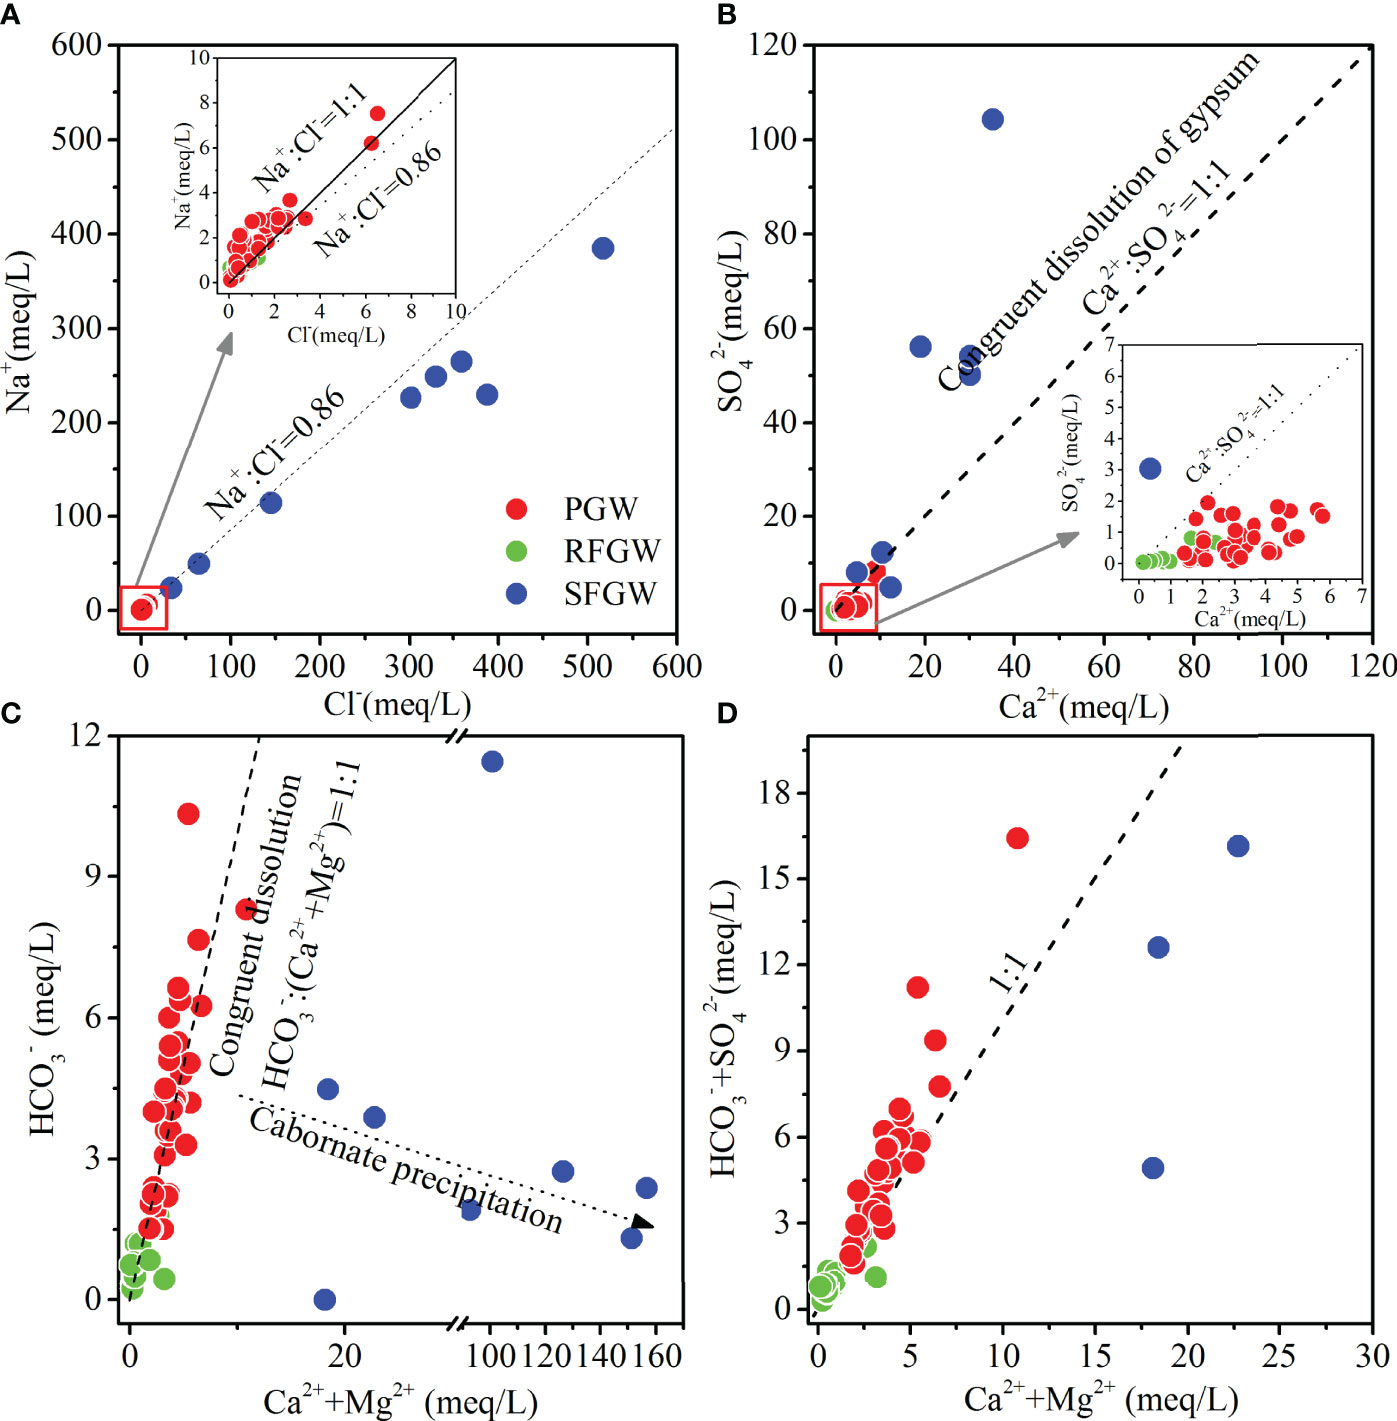
Figure 8 Stoichiometric relation between Na+ and Cl−(A), SO42−, and Ca2+(B), Ca2++Mg2+ and HCO3−(C), and Ca2++Mg2+ and HCO3−+SO42−(D).
5.3.3 Redox Process and Nitrogen Behaviors
(1) The Redox Conditions
The fates of nitrogen and trace metals in groundwater are determined by the redox conditions. Under the ample supply of organic matter, the sequence of redox reactions is arranged as the depletion of dissolved oxygen (DO), reduction of nitrate (NO3−), emergence of manganese (Mn) and iron (Fe) with lower valence (+2), reduction of sulfate (SO42−), and finally the generation of methane (CH4) (Appelo and Postma, 2005b; Rivett et al., 2008). In this study, redox diagrams (pH–pe diagrams) were employed to evaluate the groundwater redox conditions and dominant species of nitrogen and trace metals. The dominant species theoretically controlled by the pH and pe was N2 for nitrogen (Figure 9A), Fe (+2) in the RFGW and Fe (+3) in the PGW for iron (Figure 9B), and SO42− (+6) for sulfur (Figure 9C). Thus, it could be deduced that the redox condition was in the state of reduction in NO3− (denitrification) and even reduction in Fe and Mn in the RFGW. However, due to the complex interaction of the electron acceptor and donor and lack of equilibrium between different redox couples in the aquifer, NO3− was still represented as the electron acceptor in the groundwater. The following part is mainly focused on the fate of NO3−.
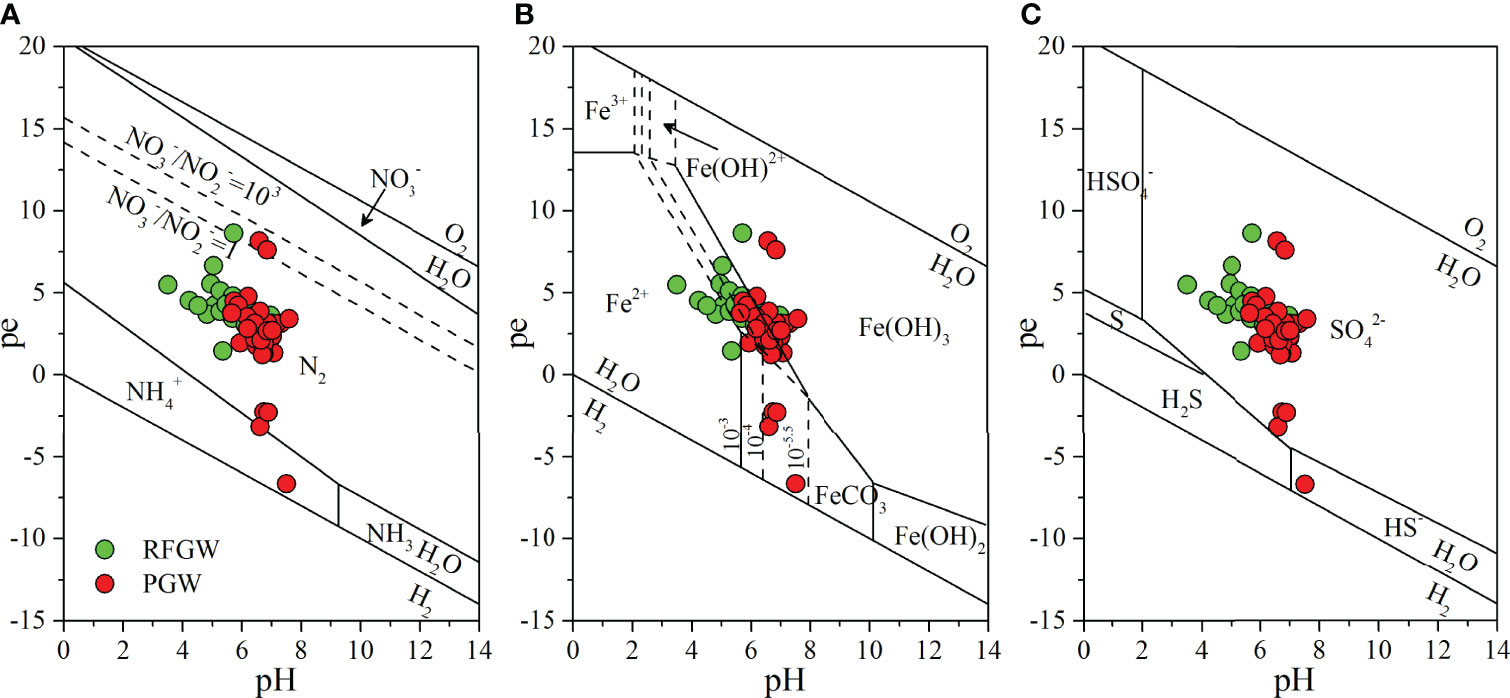
Figure 9 Redox diagram of nitrogen (A), iron (B), and sulfur (C).
(2) NO3− Behavior Revealed by Stable Isotopes Technique
The stable isotopic signatures of NO3− (δ15N–NO3− and δ18O–NO3−) were widely used to identify the nitrate sources and the occurrence of denitrification (Xue et al., 2009; Lin and Lin, 2022). Source identification showed that the δ15N–NO3− and δ18O–NO3− values in the groundwater fell in the range of manure and sewage zone (Figure 10A), which suggested that anthropogenic origin such as manure and sewage dominated in both the RFGW and the PGW. This result indicated that the local groundwater quality has been deteriorated by human activities. The deviation of both δ15N–NO3− and δ18O–NO3− forms the characteristic values of a typical pollutant source, indicating that the nitrogen transformations, such as denitrification, have been altering the initial N and O isotopes values.
Denitrification generally resulted in the removal of NO3− in aquifer. Based on the Rayleigh fractionation principle, the heavy isotopes 18O and 15N is more enriched in the residual nitrate when the removal of NO3− occurred. Thus, during the denitrification, a negative linear relationship between δ15N–NO3− and Ln(NO3−) (Fenton et al., 2009; Otero et al., 2009; Li et al., 2019a), and the ratios of fractionation factors (Δδ15N/Δδ18O) varying from 1.3 to 2.1 (Fukada et al., 2003), could be detected. In our study area, for both the PGW and the RFGW, significant positive correlations between δ15N–NO3− and δ18O–NO3− (Figure 10A) combined with the negative correlations between δ15N–NO3− values and Ln(NO3−) (Figure 10B) were observed, which confirmed the existence of denitrification in these regions. In addition, the ratios between δ15N–NO3− and δ18O–NO3− were 1.85 for the PGW and 3.03 for the RFGW, respectively, which indicated that the denitrification signal was stronger for the PGW than that of the RFGW. This result acted in accordance with the redox condition analysis, which has found that the reduced environment was stronger for the PGW than that for the RFGW. Therefore, denitrification was a non-negligible biogeochemical process for the removal of NO3− in the aquifer, and our study highlights the elevated denitrification process in coastal groundwater that suffered from seawater intrusion and anthropogenic inputs.
6 Conclusion
Coastal aquifers play key roles in providing freshwater resources to maintain the social and economic development in coastal areas. As one of the current national key economic development regions in China, Shenzhen city is a complex urbanized region with population dynamics, intense economic activities, and innovative clusters. It is of great scientific and practical significance to evaluate the possibility of coastal groundwater resources as strategic reserve water resources. In this study, stoichiometric analysis of hydrogeochemistry, multivariate analysis, and isotopic trancing techniques were combined to reveal the local hydrochemistry characteristics, its natural and human-activity-induced controlling factors, and the major hydrochemical evolution in a typical coastal aquifer located in the Pearl River estuary.
Seawater intrusion, ion exchange, water–rock reaction, and human activities were the main controlling factors that affected the characteristics of groundwater in this study area, but there were significant differences in the predominant controlling effects of different zones. High salinization was identified in the SFGW samples, and the hydrochemical pattern was Na–Cl. Prevalent cations were Na+ and K+, and the most abundant anion was Cl−. It revealed that SFGW was severely affected by seawater intrusion. Mass balance analysis based on Cl− showed that the contribution of seawater was between 6% and 97%. Obvious cation exchange process occurred during the seawater intrusion. The hydrochemical characteristics of the PGW and the RFGW were mainly controlled by water–rock interaction. Human activities had further influences on the hydrochemical characteristics of groundwater, resulting in elevated nitrate. Redox analysis deduced that the redox condition was in the state of reduction in NO3− (denitrification) and even reduction in Fe and Mn in the RFGW. Furthermore, dual nitrogen isotope tracing techniques reveal that the denitrification did occur in the PGW and the RFGW. Denitrification was the major process that controlled the transformation of nitrogen. This research provides a scientific basis for the management of groundwater resources in coastal aquifers.
Data Availability Statement
The raw data supporting the conclusions of this article will be made available by the authors, without undue reservation.
Author Contributions
YD: formal analysis, investigation, writing—original draft, and writing—review and editing. JL: formal analysis, investigation, and writing—reviewing. RW: methodology investigation and writing—reviewing. JW: investigation and writing—editing; QZ: formal analysis and investigation. YC: funding acquisition, investigation, and writing—review and editing; YZ: methodology, writing—review and editing. YX: supervision, methodology, project administration, and writing—review and editing.
Funding
This study was supported by the National Natural Science Foundation of China (Grant No. 42077154), the GuangDong Basic and Applied Basic Research Foundation of China (Grant No. 2021A1515110372), the China Postdoctoral Science Foundation (2021M693588), and National Key Research and Development Program of China (2019YFC1805304).
Conflict of Interest
Authors RW and JW are/were employed by PowerChina Huadong Engineering Corporation Limited.
The remaining authors declare that the research was conducted in the absence of any commercial or financial relationships that could be construed as a potential conflict of interest.
Publisher’s Note
All claims expressed in this article are solely those of the authors and do not necessarily represent those of their affiliated organizations, or those of the publisher, the editors and the reviewers. Any product that may be evaluated in this article, or claim that may be made by its manufacturer, is not guaranteed or endorsed by the publisher.
References
Abd-Elaty I., Abd-Elhamid H. F., Qahman K. (2020). Coastal Aquifer Protection From Saltwater Intrusion Using Abstraction of Brackish Water and Recharge of Treated Wastewater: Case Study of the Gaza Aquifer. J. Hydrolog. Eng. 25 (7). 05020012. doi: 10.1061/(ASCE)HE.1943-5584.0001927
Appelo and Dimier 2004 Prepared for: Division of Systems Analysis and Regulatory Effectiveness Office of Nuclear Regulatory Research US Nuclear Regulatory Commission Washington, DC 20555–0001
Appelo C. A. J., Postma D (2005) Geochemistry, Groundwater and Pollution. Sediment. Geol. 220 (3), 256–270. doi: 10.2136/vzj2005.1110br
Archana A., Thibodeau B., Geeraert N., Xu M. N, Kao S. J., Baker D. M. (2018). Nitrogen Sources and Cycling Revealed by Dual Isotopes of Nitrate in a Complex Urbanized Environment. Water Res. 142, 459–470. doi: 10.1016/j.watres.2018.06.004
Argamasilla M., Barberá J. A., Andreo B. (2017). Factors Controlling Groundwater Salinization and Hydrogeochemical Processes in Coastal Aquifers From Southern Spain. Sci. Total. Environ. 580, 50–68. doi: 10.1016/j.scitotenv.2016.11.173
Cao Y., Xuan Y., Tang C., Guan S., Peng Y. (2020). Temporary and Net Sinks of Atmospheric CO2 Due to Chemical Weathering in Subtropical Catchment With Mixing Carbonate and Silicate Lithology. Biogeosciences 17 (14), 3875–3890. doi: 10.5194/bg-17-3875-2020
Casciotti K. L., Sigman D. M., Hastings M. G., Böhlke J. K., Hilkert A. (2002). Measurement of the Oxygen Isotopic Composition of Nitrate in Seawater and Freshwater Using the Denitrifier Method. Analytical. Chem. 74 (19), 4905–4912. doi: 10.1021/ac020113w
Chen X. C., Li F., Li X. Q., Hu Y. H., Hu P. P. (2020). Evaluating and Mapping Water Supply and Demand for Sustainable Urban Ecosystem Management in Shenzhen, China. J. Clean. Product. 251, 11. doi: 10.1016/j.jclepro.2019.119754
Choi W-J., Han G-H., Lee S-M., Lee G-T., Yoon K-S, Choi S-M, et al. (2007). Impact of Land-Use Types on Nitrate Concentration and δ15n in Unconfined Groundwater in Rural Areas of Korea. Agricult. Ecosyst. Environ. 120 (2-4), 259–268. doi: 10.1016/j.agee.2006.10.002
Cook P. G., Herczeg A. L. (2000). Environmental Tracers in Subsurface Hydrology Kluwer, Dordrecht (Springer US), 397–424.
Council N. R. (2007). Mitigating Shore Erosion Along Sheltered Coasts Vol. 188 (Washington, DC: The National Academies Press).
Fenton O., Richards K. G., Kirwan L., Khalil M. I., Healy M. G. (2009). Factors Affecting Nitrate Distribution in Shallow Groundwater Under a Beef Farm in South Eastern Ireland. J. Environ. Manag. 90 (10), 3135–3146. doi: 10.1016/j.jenvman.2009.05.024
Ferguson G., Gleeson T. (2012). Vulnerability of Coastal Aquifers to Groundwater Use and Climate Change. Nat. Climate Change 2 (5), 342–345. doi: 10.1038/nclimate1413
Feth J. H., Gibbs R. J. (1971). Mechanisms Controlling World Water Chemistry: Evaporation-Crystallization Process. Science 172 (3985), 870–872. doi: 10.1126/science.172.3985.870
Froelich P. N., Klinkhammer G. P., Bender M. L., Luedtke N. A., Heath G. R., Cullen D., et al. (1979). Early Oxidation of Organic Matter in Pelagic Sediments of the Eastern Equatorial Atlantic: Suboxic Diagenesis. Geochimica. Cosmochimica. Acta 43 (7), 1075–1090. doi: 10.1016/0016-7037(79)90095-4
Fukada T., Hiscock K. M., Dennis P. F., Grischek T. (2003). A Dual Isotope Approach to Identify Denitrification in Groundwater at a River-Bank Infiltration Site. Water Res. 37 (13), 3070–3078. doi: 10.1016/S0043-1354(03)00176-3
Gao T. (2019)A Review of Research on Tourism Integration in Guangdong-Hong Kong-Macao Greater Bay Area, Proceedings of the 2019 3rd International Conference on Education, Culture and Social Development (ICECSD 2019). Atlantis Press, 253–262
Gibbs R. J. (1970). Mechanisms Controlling World Water Chemistry. Science 17, 1088–1090. doi: 10.1126/science.170.3962.1088
Hale R. L., Turnbull L., Earl S., Grimm N., Riha K., Michalski G., et al. (2014). Sources and Transport of Nitrogen in Arid Urban Watersheds. Environ. Sci. Technol. 48 (11), 6211–6219. doi: 10.1021/es501039t
Han H. F., Jiang F. Y., Wang Y. (2009). Groundwater Chemistry Evolution and Its Indication Under the Effect of Seawater Intrusion:A Case Study at Bao’an District of Shenzhen City. Saf. Environ. Eng. 16(04). 1–5. doi: 1671-1556(2009)04-0001-05
He K., Huo H., Zhang Q. (2002). Urban Air Pollution in China: Current Status, Characteristics, and Progress. Annu. Rev. Energy Environ. 27 (1), 397–431. doi: 10.1146/annurev.energy.27.122001.083421
Hosono T., Tokunaga T., Kagabu M., Nakata H., Orishikida T., Lin I. T., et al. (2013). The Use of Delta15n and Delta18o Tracers With an Understanding of Groundwater Flow Dynamics for Evaluating the Origins and Attenuation Mechanisms of Nitrate Pollution. Water Res. 47 (8), 2661–2675. doi: 10.1016/j.watres.2013.02.020
Huang F., Lin X., Hu W., Zeng F, Yin K (2021)Nitrogen cycling processes in sediments of the pearl river estuary: spatial variations, controlling factors, and environmental implications.Catena, 206, 105545 doi: 10.1016/j.catena.2021.105545
Huang F., Lin X., Yin K. (2022a). Effects of Algal-Derived Organic Matter on Sediment Nitrogen Mineralization and Immobilization in a Eutrophic Estuary. Ecol. Indic. 138, 108813. doi: 10.1016/j.ecolind.2022.1088131
Huang F., Lin X., Yin K. (2022b). Effects of Marine Produced Organic Matter on the Potential Estuarine Capacity of NOx– Removal. Sci. Total. Environ. 812, 151471. doi: 10.1016/j.scitotenv.2021.151471
Hui E. C. M., Li X., Chen T., Lang W. (2018). Deciphering the Spatial Structure of China’s Megacity Region: A New Bay Area-The Guangdong-Hong Kong-Macao Greater Bay Area in the Making. Cities. 105: 102168. doi: 10.1016/j.cities.2018.10.011
Jiang F., Han H., Chen J., Wang Y. (2009). Indication of Trace Elements and Isotopes in Groundwater to Seawater Intrusion and Groundwater Origin: A Case Study at Bao’an District of Shenzhen City, Guangdong Province. J. East. China Univ. Technol. (Natural. Science). 32 (3), 253–260. doi: 1674-3504(2009)03-253-08
Jiao J., Wang Y., Cherry J., Wang X, Zhi B, Du H, et al. (2010). Abnormally High Ammonium of Natural Origin in a Coastal Aquifer-Aquitard System in the Pearl River Delta, China. Environ. Sci. Technol. 44 (19), 7470–7475. doi: 10.1021/es1021697
Kendall C., Elliott E. M., Wankel S. D. (2007). Tracing Anthropogenic Inputs of Nitrogen to Ecosystems, Stable Isotopes in Ecology and Environmental Science, 2nd Edn. Blackwell Publishing, London375–449.
Lancia M., Zheng C., He X., Lerner D. N., Andrews C. (2020). Groundwater Complexity in Urban Catchments: Shenzhen, Southern China. Groundwater 58 (3), 470–481. doi: 10.1111/gwat.12935
Lancia M., Zheng C., Yi S., Lerner D. N., Andrews C. (2019). Analysis of Groundwater Resources in Densely Populated Urban Watersheds With a Complex Tectonic Setting: Shenzhen, Southern China. Hydrogeol. J. 27 (1), 183–194. doi: 10.1007/S10040-018-1867-2
Larssen T., Lydersen E, Tang D., He Y, Gao J., Liu H., et al. (2006). Acid Rain in China. Environ. Sci. Technol. 40 (2), 418–425. doi: 10.1021/es0626133
Liénart C., Savoye N., Bozec Y., Breton E., Conan P., David V., et al. (2018). Dynamics of Particulate Organic Matter Composition in Coastal Systems: Forcing of Spatio-Temporal Variability at Multi-Systems Scale. Prog. Oceanogr. 162, 271–289. doi: 10.13140/RG.2.2.35042.94405
Li C., Li S. L., Yue F. J., Liu J., Zhong J., Yan Z. F., et al. (2019a). Identification of Sources and Transformations of Nitrate in the Xijiang River Using Nitrate Isotopes and Bayesian Model. Sci. Total. Environ. 646, 801–810. doi: 10.1016/j.scitotenv.2018.07.345
Li X., Tang C., Cao Y, Li X. (2019b). Carbon, Nitrogen and Sulfur Isotopic Features and the Associated Geochemical Processes in a Coastal Aquifer System of the Pearl River Delta,China. J. Hydrol. 575, 986–998. doi: 10.1016/j.jhydrol.2019.05.092
Li Z., Yang Q., Ma H., Li S., Martin J. D. (2019c). Isotopic and Geochemical Interpretation of Groundwater Under the Influences of Anthropogenic Activities. J. Hydrol. 576, 685–697. doi: 10.1016/j.jhydrol.2019.06.037
Lin X., Jiang X., Li X., Gao J., Liu M., Hou L., et al. (2016). Nitrogen Mineralization and Immobilization in Sediments of the East China Sea: Spatiotemporal Variations and Environmental Implications. J. Geophys. Res.: Biogeosci. 121 (11), 2842–2855. doi: 10.1002/2016JG003499
Lin X., Lu K., Hardison A. K., Liu Z., Gardner W. S. (2021). Membrane Inlet Mass Spectrometry Method (REOX/MIMS) to Measure 15N-Nitrate in Isotope-Enrichment Experiments. Ecol. Indic. 126, 107639. doi: 10.1016/j.ecolind.2021.107639
Lin X., Li X., Gao D., Liu M., Cheng L. (2017). Ammonium Production and Removal in the Sediments of Shanghai River Networks: Spatiotemporal Variations, Controlling Factors, and Environmental Implications. J. Geophys. Res.: Biogeosci. 122 (10), 2461–2478. doi: 10.1002/2017JG003769
Lin G., Lin X. (2022). Bait Input Altered Microbial Community Structure and Increased Greenhouse Gases Production in Coastal Wetland Sediment. Water Res., 118520 218. doi: 10.1016/j.watres.2022.118520
Li X., Tang C., Cao Y., Li D. (2020). A Multiple Isotope (H, O, N, C and S) Approach to Elucidate the Hydrochemical Evolution of Shallow Groundwater in a Rapidly Urbanized Area of the Pearl River Delta, China. Sci. Total. Environ. 724, 137930. doi: 10.1016/j.scitotenv.2020.137930
Liu F., Song X., Yang L., Han D., Zhang Y., Ma Y.,, et al. (2015). The Role of Anthropogenic and Natural Factors in Shaping the Geochemical Evolution of Groundwater in the Subei Lake Basin, Ordos Energy Base, Northwestern China. Sci. Total. Environ. 538, 327–340. doi: 10.1016/j.scitotenv.2015.08.057
Marandi A., Shand P. (2018). Groundwater Chemistry and the Gibbs Diagram. Appl. Geochem. 97, 209–212. doi: 10.1016/j.apgeochem.2018.07.009
Mengis M., Schif S. L., Harris M., English M. C., Maclean A. and (1999). Multiple Geochemical and Isotopic Approaches for Assessing Ground Water NO3- Elimination in a Riparian Zone. Groundwater 37 (3), 448–457. doi: 10.1111/j.1745-6584.1999.tb01124.x
Otero N., Torrentó C., Soler A., Menció A., Mas-Pla J. (2009). Monitoring Groundwater Nitrate Attenuation in a Regional System Coupling Hydrogeology With Multi-Isotopic Methods: The Case of Plana De Vic (Osona, Spain). Agricult. Ecosyst. Environ. 133 (1-2), 103–113. doi: 10.1016/j.agee.2009.05.007
Parizi E., Hosseini S. M., Ataie-Ashtiani B., Simmons C. T. (2019). Vulnerability Mapping of Coastal Aquifers to Seawater Intrusion: Review, Development and Application. J. Hydrol. 570, 555–573. doi: 10.1016/j.jhydrol.2018.12.021
Rakib M. A., Sasaki J., Matsuda H., Quraishi S. B., Mahmud M. J., Bodrud-Doza M., et al. (2020). Groundwater Salinization and Associated Co-Contamination Risk Increase Severe Drinking Water Vulnerabilities in the Southwestern Coast of Bangladesh. Chemosphere 246, 125646. doi: 10.1016/j.chemosphere.2019.125646
Rivett M. O., Buss S. R., Morgan P., Smith J. W. N., Bemment C. D. (2008). Nitrate Attenuation in Groundwater: A Review of Biogeochemical Controlling Processes. Water Res. 42 (16), 4215–4232. doi: 10.1016/j.watres.2008.07.020
Schoeller H. J. (1977). “Charpter 15-Geochemistry of Ground Water,” in Ground-Water Studies - An International Guide for Research and Practice. Eds. Brown R. H., Konoplyantsev A. A., Ineson J., Kovalevsky V. S. (Paris: The UNESCO Press).
Schüring J., Schlieker M., Hencke J. (2000). Redox Fronts in Aquifer Systems and Parameters Controlling Their Dimensions (Berlin Heidelberg: Springer), 135–151.
Shi X., Wang Y., Jiao J. J., Zhong J., Wen H., Dong R. (2018). Assessing Major Factors Affecting Shallow Groundwater Geochemical Evolution in a Highly Urbanized Coastal Area of Shenzhen City, China. J. Geochem. Explor. 184, 17–27. doi: 10.1016/j.gexplo.2017.10.003
Sigman D. M., Casciotti K. L., Andreani M., Barford C., Galanter M. B. J. K., Böhlke J. K., Casciotti, (2001). A Bacterial Method for the Nitrogen Isotopic Analysis of Nitrate in Seawater and Freshwater. Analytical. Chem. 73 (17), 4145–4153. doi: 10.1021/ac010088e
Small C., Nicholls R. J. (2003). A Global Analysis of Human Settlement in Coastal Zones. J. Coast. Res. 19 (3), 584–599. doi: 10.2307/4299200
Steyl G., Dennis I. (2010). Review of Coastal-Area Aquifers in Africa. Hydrogeol. J. 18 (1), 217–225. doi: 10.1007/s10040-009-0545-9
Vörösmarty C. J., Green P., Salisbury J., Lammers R. B. (2000). Global Water Resources: Vulnerability From Climate Change and Population Growth. Science 289 (5477), 284. doi: 10.1126/science.289.5477.284
Wakida F. T., Lerner D. N. (2005). Non-Agricultural Sources of Groundwater Nitrate: A Review and Case Study. Water Res. 39 (1), 3–16. doi: 10.1016/j.watres.2004.07.026
Wang Y., Jiao J. J. (2012). Origin of Groundwater Salinity and Hydrogeochemical Processes in the Confined Quaternary Aquifer of the Pearl River Delta, China. J. Hydrol. 438-439, 112–124. doi: 10.1016/j.jhydrol.2012.03.008
Wang Y., Jiao J. J., Cherry J. A., Lee C. M. (2013). Contribution of the Aquitard to the Regional Groundwater Hydrochemistry of the Underlying Confined Aquifer in the Pearl River Delta, China. Sci. total. Environ. 461-462, 663–671. doi: 10.1016/j.scitotenv.2013.05.046
Wang Y., Jiao J. J., Zhang K., Zhou Y. (2016). Enrichment and Mechanisms of Heavy Metal Mobility in a Coastal Quaternary Groundwater System of the Pearl River Delta, China. Sci. Total. Environ. 545–546, 493–502. doi: 10.1016/j.scitotenv.2015.12.019
Wei H., Gao D., Liu Y., Lin X. (2020). Sediment Nitrate Reduction Processes in Response to Environmental Gradients Along an Urban River-Estuary-Sea Continuum. Sci. Total. Environ. 718, 137185. doi: 10.1016/j.scitotenv.2020.137185
Wei H., Lin X. (2021). Shifts in the Relative Abundance and Potential Rates of Sediment Ammonia-Oxidizing Archaea and Bacteria Along Environmental Gradients of an Urban River–Estuary–Adjacent Sea Continuum. Sci. Total. Environ. 771, 144824. doi: 10.1016/j.scitotenv.2020.144824
Weng T. N., Liu C. W., Kao Y. H., Hsiao S. S. (2017). Isotopic Evidence of Nitrogen Sources and Nitrogen Transformation in Arsenic-Contaminated Groundwater. Sci. Total. Environ. 578, 167–185. doi: 10.1016/j.scitotenv.2016.11.013
Wong W. W., Grace M. R., Cartwright I., Cook P. L. M. (2014). Sources and Fate of Nitrate in a Groundwater-Fed Estuary Elucidated Using Stable Isotope Ratios of Nitrogen and Oxygen. Limnol. Oceanogr. 59 (5), 1493–1509. doi: 10.4319/lo.2014.59.5.1493
Xiong G. Y., Chen G. Q., Xu X. Y., Liu W. Q., Fu T. F., Khokiattiwong S., et al. (2020). A Comparative Study on Hydrochemical Evolution and Quality of Groundwater in Coastal Areas of Thailand and Bangladesh. J. Asian Earth Sci. 195, 104336. doi: 10.1021/ac010088e
Xue D., Botte J., Baets B. D., Accoe F., Boeckx P.(2009). Present Limitations and Future Prospects of Stable Isotope Methods for Nitrate Source Identification in Surface- and Groundwater. Water Res. 43 (5), 1159–1170. doi: 10.1016/j.watres.2008.12.048
Ye F., Jia G., Xie L., Wei G., Xu J. (2016). Isotope Constraints on Seasonal Dynamics of Dissolved and Particulate N in the Pearl River Estuary, South China. J. Geophys. Res. 121 (12) 8689–8705. doi: 10.1002/2016JC012066
Zhang X. M., Chai F. H., Wang S. L., Sun X. Z. (2010). Research Progress of Acid Precipitation in China. Res. Environ. Sci 23(5): 527–532. doi: 1001-6929(2010)05-0527-06
Keywords: coastal aquifers, nitrogen cycling, groundwater, seawater intrusion, anthropogenic inputs
Citation: Dun Y, Ling J, Wang R, Wei J, Zhou Q, Cao Y, Zhang Y and Xuan Y (2022) Hydrochemical Evolution and Nitrogen Behaviors in Coastal Groundwater Suffered From Seawater Intrusion and Anthropogenic Inputs. Front. Mar. Sci. 9:945330. doi: 10.3389/fmars.2022.945330
Received: 16 May 2022; Accepted: 01 June 2022;
Published: 14 July 2022.
Edited by:
Xianbiao Lin, Ocean University of China, ChinaReviewed by:
Dengzhou Gao, East China Normal University, ChinaXiaoli Zhang, Yantai Institute of Coastal Zone Research (CAS), China
Copyright © 2022 Dun, Ling, Wang, Wei, Zhou, Cao, Zhang and Xuan. This is an open-access article distributed under the terms of the Creative Commons Attribution License (CC BY). The use, distribution or reproduction in other forums is permitted, provided the original author(s) and the copyright owner(s) are credited and that the original publication in this journal is cited, in accordance with accepted academic practice. No use, distribution or reproduction is permitted which does not comply with these terms.
*Correspondence: Yingxue Xuan, eHVhbnl4M0BtYWlsLnN5c3UuZWR1LmNu