 Huabin Zhou1
 Chunxue Yu
- 1Research Center for Eco-environmental Engineering, Dongguan University of Technology, Dongguan, China
- 2Guangdong Provincial Key Laboratory of Water Quality Improvement and Ecological Restoration for Watersheds, School of Ecology, Environment and Resources, Guangdong University of Technology, Guangzhou, China
- 3Chinese Academy of Environmental Planning, Beijing, China
Hydrologic (water temperature) and hydrodynamic (water depth, flow velocity, and Froude number) factors affect fish spawning activities, and spawning grounds provide suitable hydrologic and hydrodynamic conditions for fish spawning to occur. However, locating fish spawning grounds is encumbered by uncertainty, particularly for pelagic spawners. This may be because such fish species have unique hydrologic and hydrodynamic requirements during their spawning periods, resulting in the wide-ranging approaches used to locate their spawning grounds. Accordingly, this study was designed to accurately locate fish spawning grounds through means of spatial suitability evaluation. For this experiment, the four major “Asian carp” target species were selected in the Dongta spawning reach, a tributary of the Pearl River. First, we investigated the historical information on the location of the spawning reaches. An acoustic doppler current profiler (ADCP) was used to measure topographic and hydrodynamic data of the spawning reaches during the spawning period. Then, based on the spatial clustering method, cluster analysis on spatial attributes (water depth, flow velocity, water temperature, and Froude number) was conducted on potential spawning grounds. The cluster analysis method uses k-means clustering; a method often employed to classify large amounts of data. Finally, we analyzed and evaluated the spatial suitability of spawning reaches by combining fish spawning suitability curves to obtain spatial preferences associated with fish spawning activities. Proportionally, results revealed a high suitability (>0.4) area (60.86%). Moreover, spawning suitability in curved river sections and deep pools in straight river sections were significantly higher than bifurcated sections. Furthermore, areas near the riverbanks were more suitable than mid-course sections of the river. Finally, the locations of six potential Asian carp spawning grounds were determined according to their spatial suitability. This study provides technical support to accurately locate spawning grounds for the fish that produce drifting eggs.
1 Introduction
Fish spawning grounds play an important role in fish reproduction by providing suitable environmental conditions. Fish species that produce drifting eggs have particularly high topographic, hydrodynamic, and hydrologic preferences associated with their spawning cycles (Nilsson et al., 2005; Kemp et al., 2011; Górski et al., 2012; Baumgartner et al., 2014). This will cause some spatial uncertainty in locating spawning grounds (Winfield et al., 2015; Langangen et al., 2016). Additionally, anthropogenic activities (i.e., river damming, sand mining, shipping, etc.) have led to a decline in suitable spawning grounds (Quinones et al., 2015). It is therefore critical to locate these spawning grounds to restore and protect targeted fish species (Boucek et al., 2017; Miesner et al., 2022).
Initially, locating spawning grounds was based mainly on the information and experience of fishermen (DeCelles et al., 2017); however, the limitation of this approach is that it can only determine an approximate spawning ground range. Thereafter, the location of spawning grounds has been determined through the collection of fish eggs (Fuji et al., 2020). This approach is effective in identifying the spawning grounds of fish that build nests and attach their eggs to a specific substrates (i.e., pebbles or vegetation). For example, Moir et al. (2006) compared the channel morphologies and hydraulic functioning of six study sites used by spawning Atlantic salmon, and determined the location of spawning sites by a handheld global positioning system (GPS). However, the effectiveness of this approach is greatly reduced for drifting fish eggs. The Survey Team of Spawning Grounds of Domestic Fishes in Yangtze River uses DNA detection technology to judge the developmental stages of collected fish eggs. Then the developmental time of collected eggs can be estimated based on the stage, which equals to the time between spawning and sampling. Combined with the flow rate and collection location, the drifting distance of the eggs can be determined. In the direction of the river, the survey team speculated that longitudinal length of spawning ground ranges from 20 river kilometers to 70 river kilometers (Survey Team of Spawning Grounds of Domestic Fishes in Changjiang River, 1982). Additionally, Hayer et al. (2021) located grass carp spawning grounds, which ranged from 47 to 107 river kilometers. These studies have provided good technical support for the protection of fish species that produce drifting eggs. However, maintaining the ecosystem health of such largescale spawning grounds necessitates enormous amounts of water and applicable resources, subsequently leading to a conflict between water resource management and ecological protection.
To resolve this issue, progressively more studies have focused on how to accurately locate the spawning grounds of fish that produce drifting eggs (Yi et al., 1988a; Coulter et al., 2016; Zhu et al., 2018; Embke et al., 2019). The difficulty in locating the spawning grounds for fish producing drifting eggs can be concluded as two reasons. First, it has been reported that a certain level of error exists in estimating the development status of drifting eggs (Coulter et al., 2013; Embke et al., 2016). This is a biological issue that must further be developed and resolved. Second, it is difficult to estimate the distance that drifting eggs drift (Stuart and Sharpe, 2020). This is because the process is affected by many environmental factors (i.e., velocity, flow, egg weight fluctuation, etc.) (Schiemer et al., 2002; Ekau et al., 2010; Boavida et al., 2018; Sparks et al., 2019; Chen et al., 2021). Fish spawning usually occurs when the environmental factors are all suitable. Thus, calculating the comprehensive state of these environmental factors in different space positions is an alternative solution to find the location for fish spawning. It would be more judicious to deduce spawning ground locations by evaluating the spatial suitability of spawning grounds.
This study proposes a method to locate spawning grounds of fish that produce drifting eggs based on spatial clustering. The method involves measuring hydrologic and hydrodynamic data during fish spawning periods in the study area. Cluster analysis is used to classify the data according to similarity. Data are divided into clusters with similar hydrologic and hydrodynamic characteristics. The data is then combined with suitability curves, wherein suitability values of hydrologic and hydrodynamic factors in each cluster are calculated. The spatial suitability of fish spawning in these clusters can then be determined through a size comparison of suitability values. Using this method, we can determine highly suitable fish spawning ground areas that produce drifting eggs.
2 Materials and methods
2.1 Study area
Dongta spawning reach in Xijiang River is selected as a case to carry out the research. Based on existing research, Dongta spawning reach is the second largest existing spawning area in China, and very important spawning area for Asian carp in Pearl River (Wan et al., 2018; Liu et al., 2022). Meanwhile, this reach will be designated as an ecological reserve according to the local Fisheries and Fisheries Administration, which is of great significance to the reproduction and protection of fish in the Pearl River. It is situated within the middle reaches of the Pearl River Basin, namely, at the confluence of the Yujiang, Xuanjiang, and Qianjiang Rivers (Figure 1). The terrain here is diverse, with alternating deep pools and shallows. Dongta spawning reach has abundant water. The annual average flow is 5266m3/s. The average annual rainfall is 1717.5mm. This exceptional geographical location provides fish with sources of abundant food, suitable hydrodynamic conditions, etc. The migration and spawning of fish during spawning seasons mainly occur in the section of the river below the Datengxia Reservoir. For this reason, we chose the 4 river kilometers downstream of the Datengxia Reservoir as the starting, to 18 river kilometers downstream (covering upstream and downstream of the Dongta Village) as the case study area.
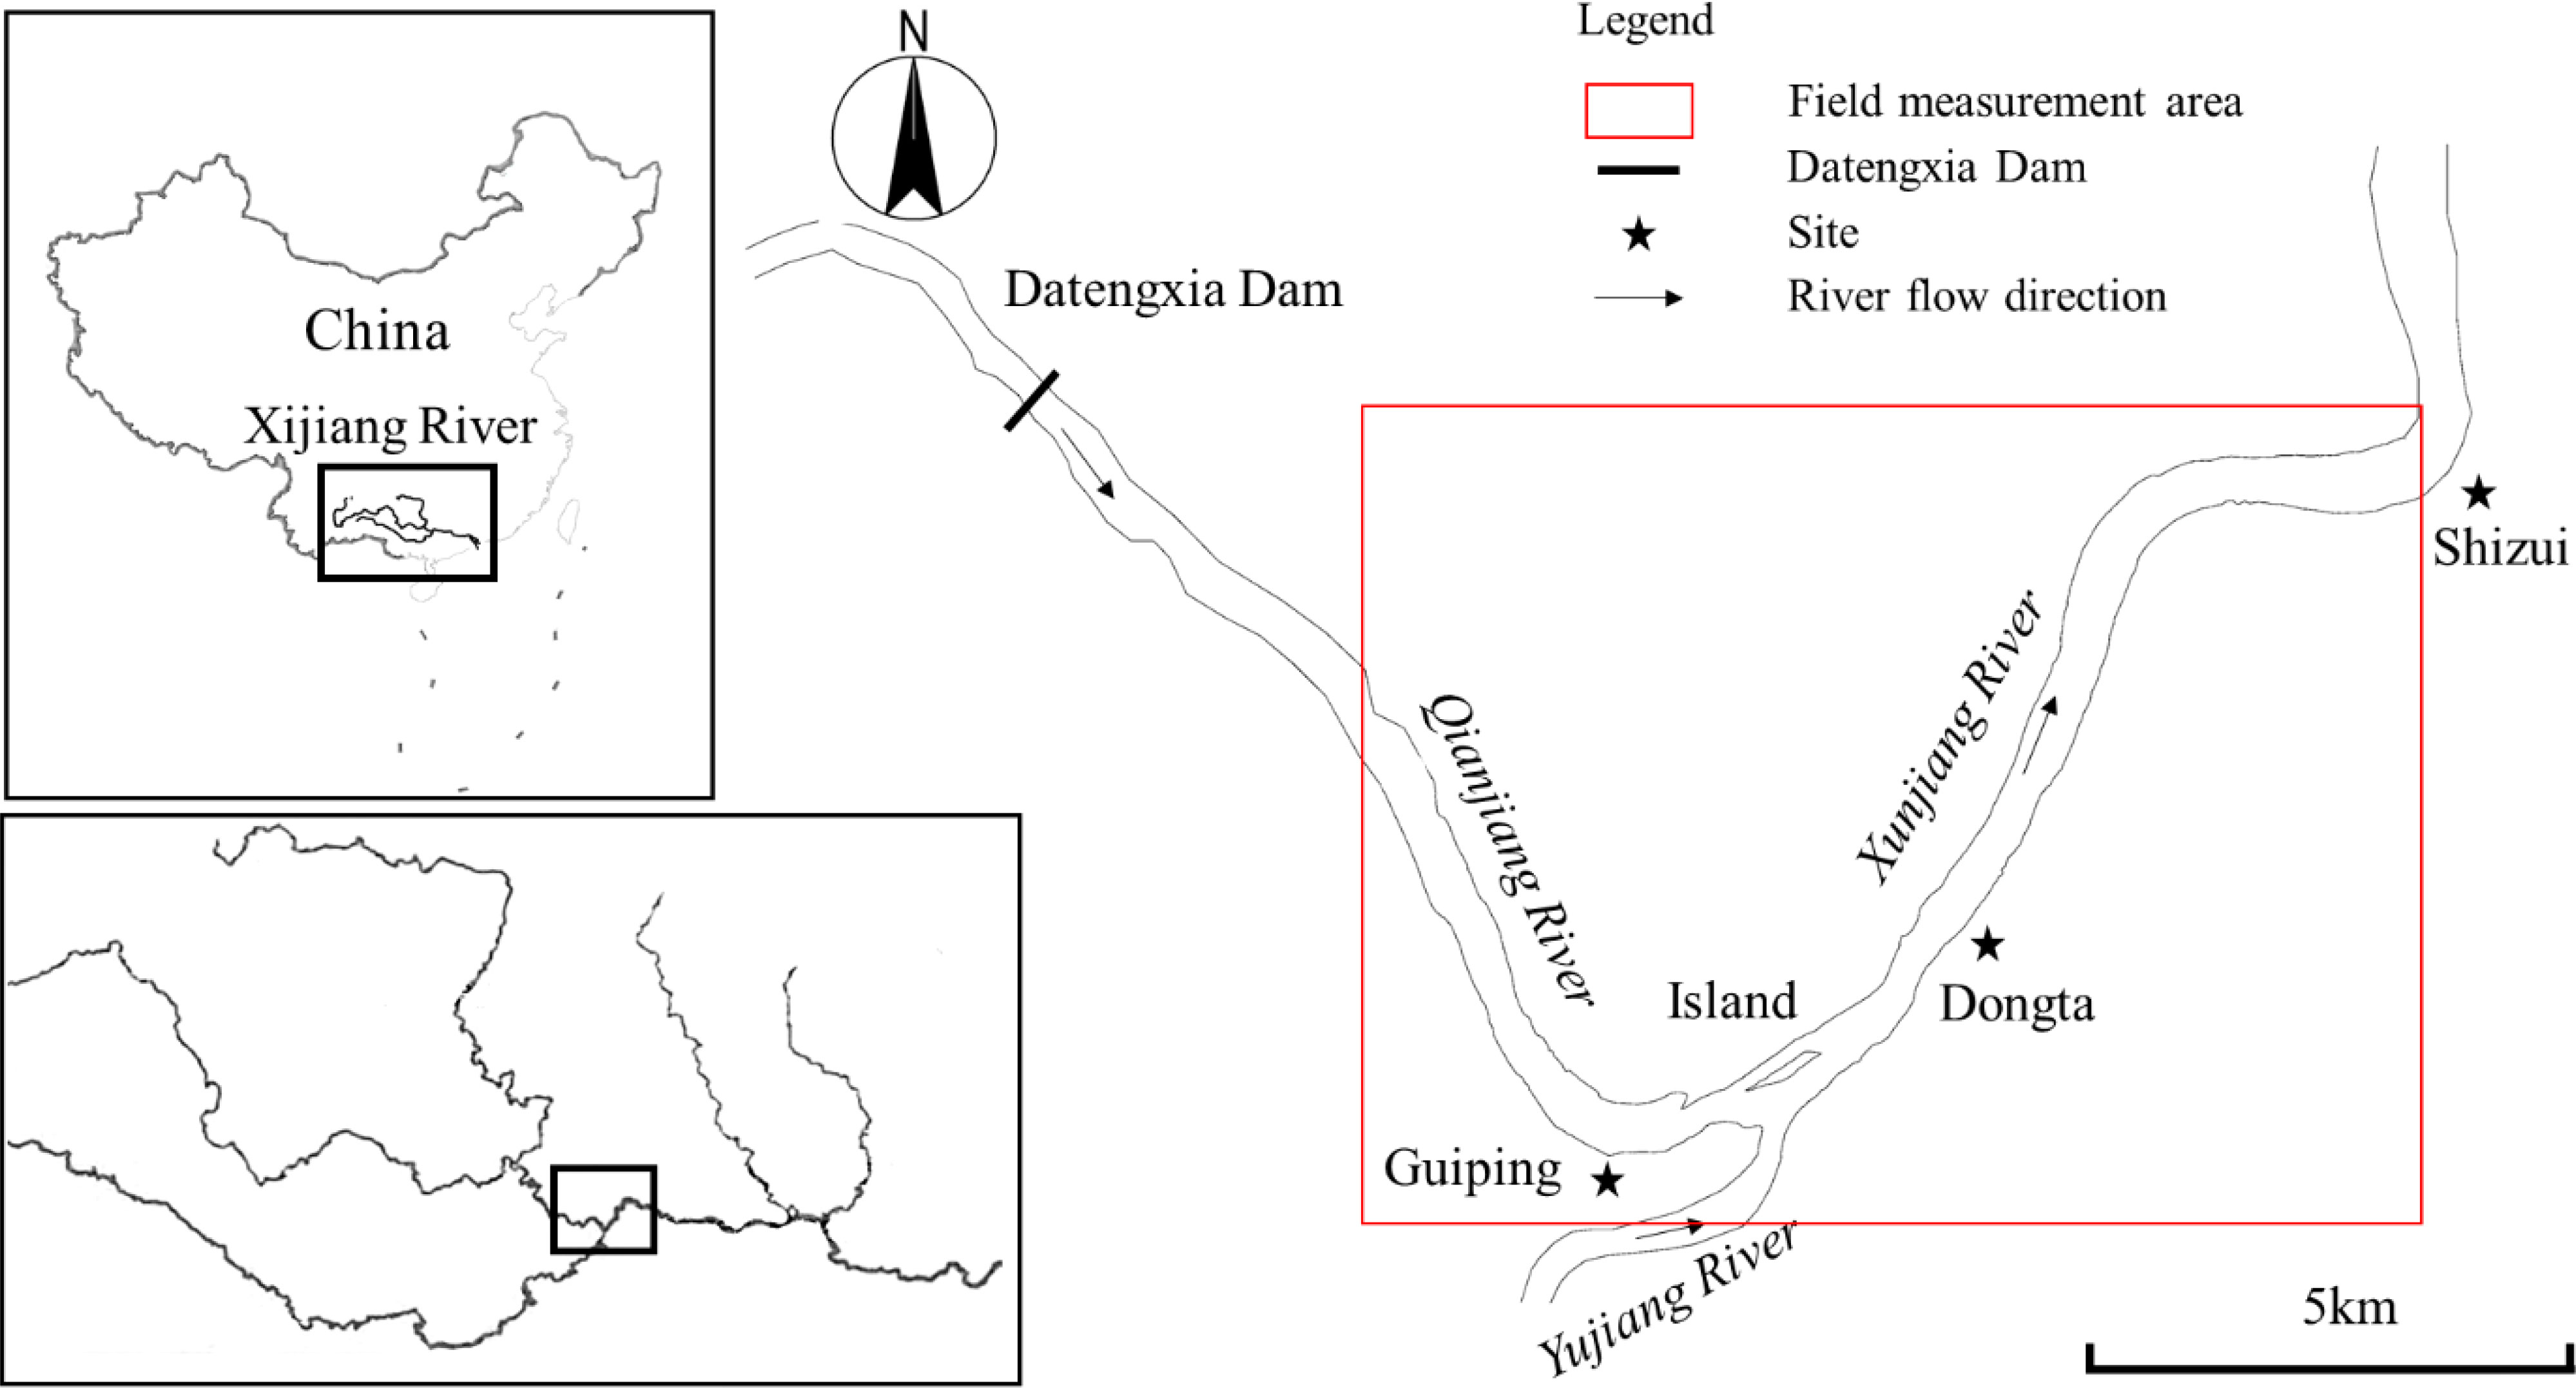
Figure 1 Location of the study area.
2.2 Data collection
Asian carp were the target species investigated in this study. Asian carp comprise of four typical fish species, bighead carp (Hypophthalmichthys nobilis), black carp (Mylopharyngodon piceus), grass carp (Ctenopharyngodon idellus), and silver carp (Hypophthalmichthys molitrix) that produce drifting eggs. Owing to their rapid growth and strong disease resistance, Asian carp are the main targets of freshwater aquaculture and fishing activities. The Dongta spawning reach is one of the main Asian carp spawning areas in China (Wan et al., 2018). The method used in this study necessitated the collection two section data sources: 1) hydrologic, hydrodynamic, and topographic data of the Dongta spawning reach and 2) suitability curves that characterize the hydrologic and hydrodynamic demands of Asian carp during spawning.
On the one hand, according to Cai et al. (2017), June is the spawning time of the Asian carps. Thus, the investigation was completed during June, 2019. An acoustic doppler current profiler (ADCP) was used to obtain topographic and hydrodynamic data of the spawning reaches to measure flow fields. The ADCP was RiverRay sailing ADCP. The system frequency of the sensor is 600 kHz. The beam structure is planar four beam. The communication baud rate used for measurement is 115200. To obtain the hydrological and hydrodynamic data of the spawning period of Asian carp, we chose to conduct field data collection on two days, June 4 and 5, 2019. Considering the size of the study area, we conducted field sampling in the shortest possible time. The climate and hydrological changes during these two days are small. On June 4, the temperature during the day (for safety reasons, the sampling time was arranged during the day) was 29~33°C. There was no rainfall during sampling. The discharge of Dahuangjiangkou hydrological station (located about 20 kilometers downstream of the sampling area) is 10300m3/s. The water level is 25.05m. On June 5, the daytime temperature was 28~33°C, which was basically the same as on June 4. There was no rain. The discharge of the Dahuangjiangkou hydrological station was 9340 m3/s, a decrease of 960 m3/s compared with that on the 4th, and the change rate was 9.3%. The water level is 24.21m, which is 0.84m lower than that on the 4th, and the change rate is 3.4% Therefore, the range of climatic and hydrological variability is acceptable. The hydrological and hydrodynamic data collected on these two days are valid. The data comes from the China Meteorological Administration (https://weather.cma.cn/) and the Bureau of Hydrology and Water Resources of the Pearl River Water Resources Commission (http://www.zwswj.com/cms/).
The specific data collection method used was as follows: Prior to taking measurements, monitoring cross sections were first established in the study area. Sections were spaced 200 m apart to ensure that no two adjacent sections overlapped. There were 78 cross sections in total. The ADCP and GPS device were fastened to a ship, which was used to measure flow field data along preset cross sections. During the measurement process, the measuring ship sails along the preset cross-sections. The ship carries acoustic doppler current profiler (ADCP) and Global Positioning System (GPS) at the same time. ADCP is used to measure cross-sectional flow field data. WinRiver II was used for data collection and post processing. GPS was used for navigation, providing necessary ship parameters (i.e., ship speed, forward azimuth, and distance) and assisting in improving the accuracy of flow field measurements. The ADCP was used to extract data following measurements, wherein velocity profiles were measured each time a sound wave was emitted. A velocity profile has multiple measuring points at different water depths. Multiple velocity profile contained cross-sectional data. The cross-sectional data were exported as ASCII data files in WinRiver II. Velocity profile were extracted every 50 m from the cross-sectional data, which were determined based on the actual width of the river within the study area. Measuring point data (taken 0.45m below the water surface) were extracted on the velocity profile for investigation. This was because Asian carp spawning activities take place close to the river surface (Deters et al., 2013).
The ADCP collects a variety of flow field data at measuring points. According to previous studies, the hydrologic and hydrodynamic data to be sampled in this study were determined before the sampling work. We investigate and summarize previous studies on the assessment of the suitability of spawning grounds for Asian carp, and found that the most commonly used water environmental indicators in existing studies were water depth, flow velocity, water temperature and Froude number. Therefore, in this study, the sampling plan was formulated including four indicators of water depth, flow velocity, water temperature and Froude number. The water temperature was the temperature of the measuring points near the water surface. The water depth was the water depth at the location of the velocity profile (i.e., measuring points). The flow velocity was the flow velocity at the measuring points. The Froude number was obtained using the following formula:
where Fr is the Froude number; V is the velocity of the measuring point (m/s); g is gravitational acceleration (9.81m/s-2); D is the water depth at the location of the measuring point (m).
On the other hand, the study also collected suitability curves of Asian carp. Suitability curves have widely been used in fish spawning ground research. They reflect the available range of fish respective to the hydrologic and hydrodynamic factors. Since studying the suitability of the spawning grounds of Asian carp, we collected the suitability curve of the spawning period of Asian carp. The suitability curves of Asian carp in the middle reaches of the Yangtze River were finally adopted. The middle reaches of the Yangtze River and the study area belong to the monsoon climate. The annual flood season and non-flood season are basically the same with our study area. The spawning of Asian carp generally occurs during the flood season. In addition, the research technology for the suitability of Asian carp in the middle reaches of the Yangtze River is very mature (Yi et al., 2010). Therefore, it is appropriate to cite the suitability curve of Asian carp in the middle reaches of the Yangtze River. Considering the actual Asian carp spawning demands, the four most common indicators were selected for this study: water depth, flow velocity, water temperature, and Froude number. Yu et al. (2018) investigated hydrologic and hydrodynamic characteristics of Asian carp spawning grounds, establishing water depth, flow velocity, and Froude number suitability curves during spawning periods (Figure 2). At present, researchers generally believe that Asian carp spawning activities can typically occur when river water temperature reaches 18°C or above. The optimal temperature range for spawning is 20~24°C. After the water temperature exceeds 24°C, hatching rates decrease rapidly. Temperature suitability begins to decrease (Yi et al., 1988b; Li et al., 2013; Wang et al., 2020). Water temperature suitability curves during Asian carp spawning periods were determined accordingly. Suitability curves collected in this study were piecewise functions. The suitability curves of water depth, flow velocity, and Froude number comprised of 10 segments, while the water temperature suitability curve comprised of five segments.
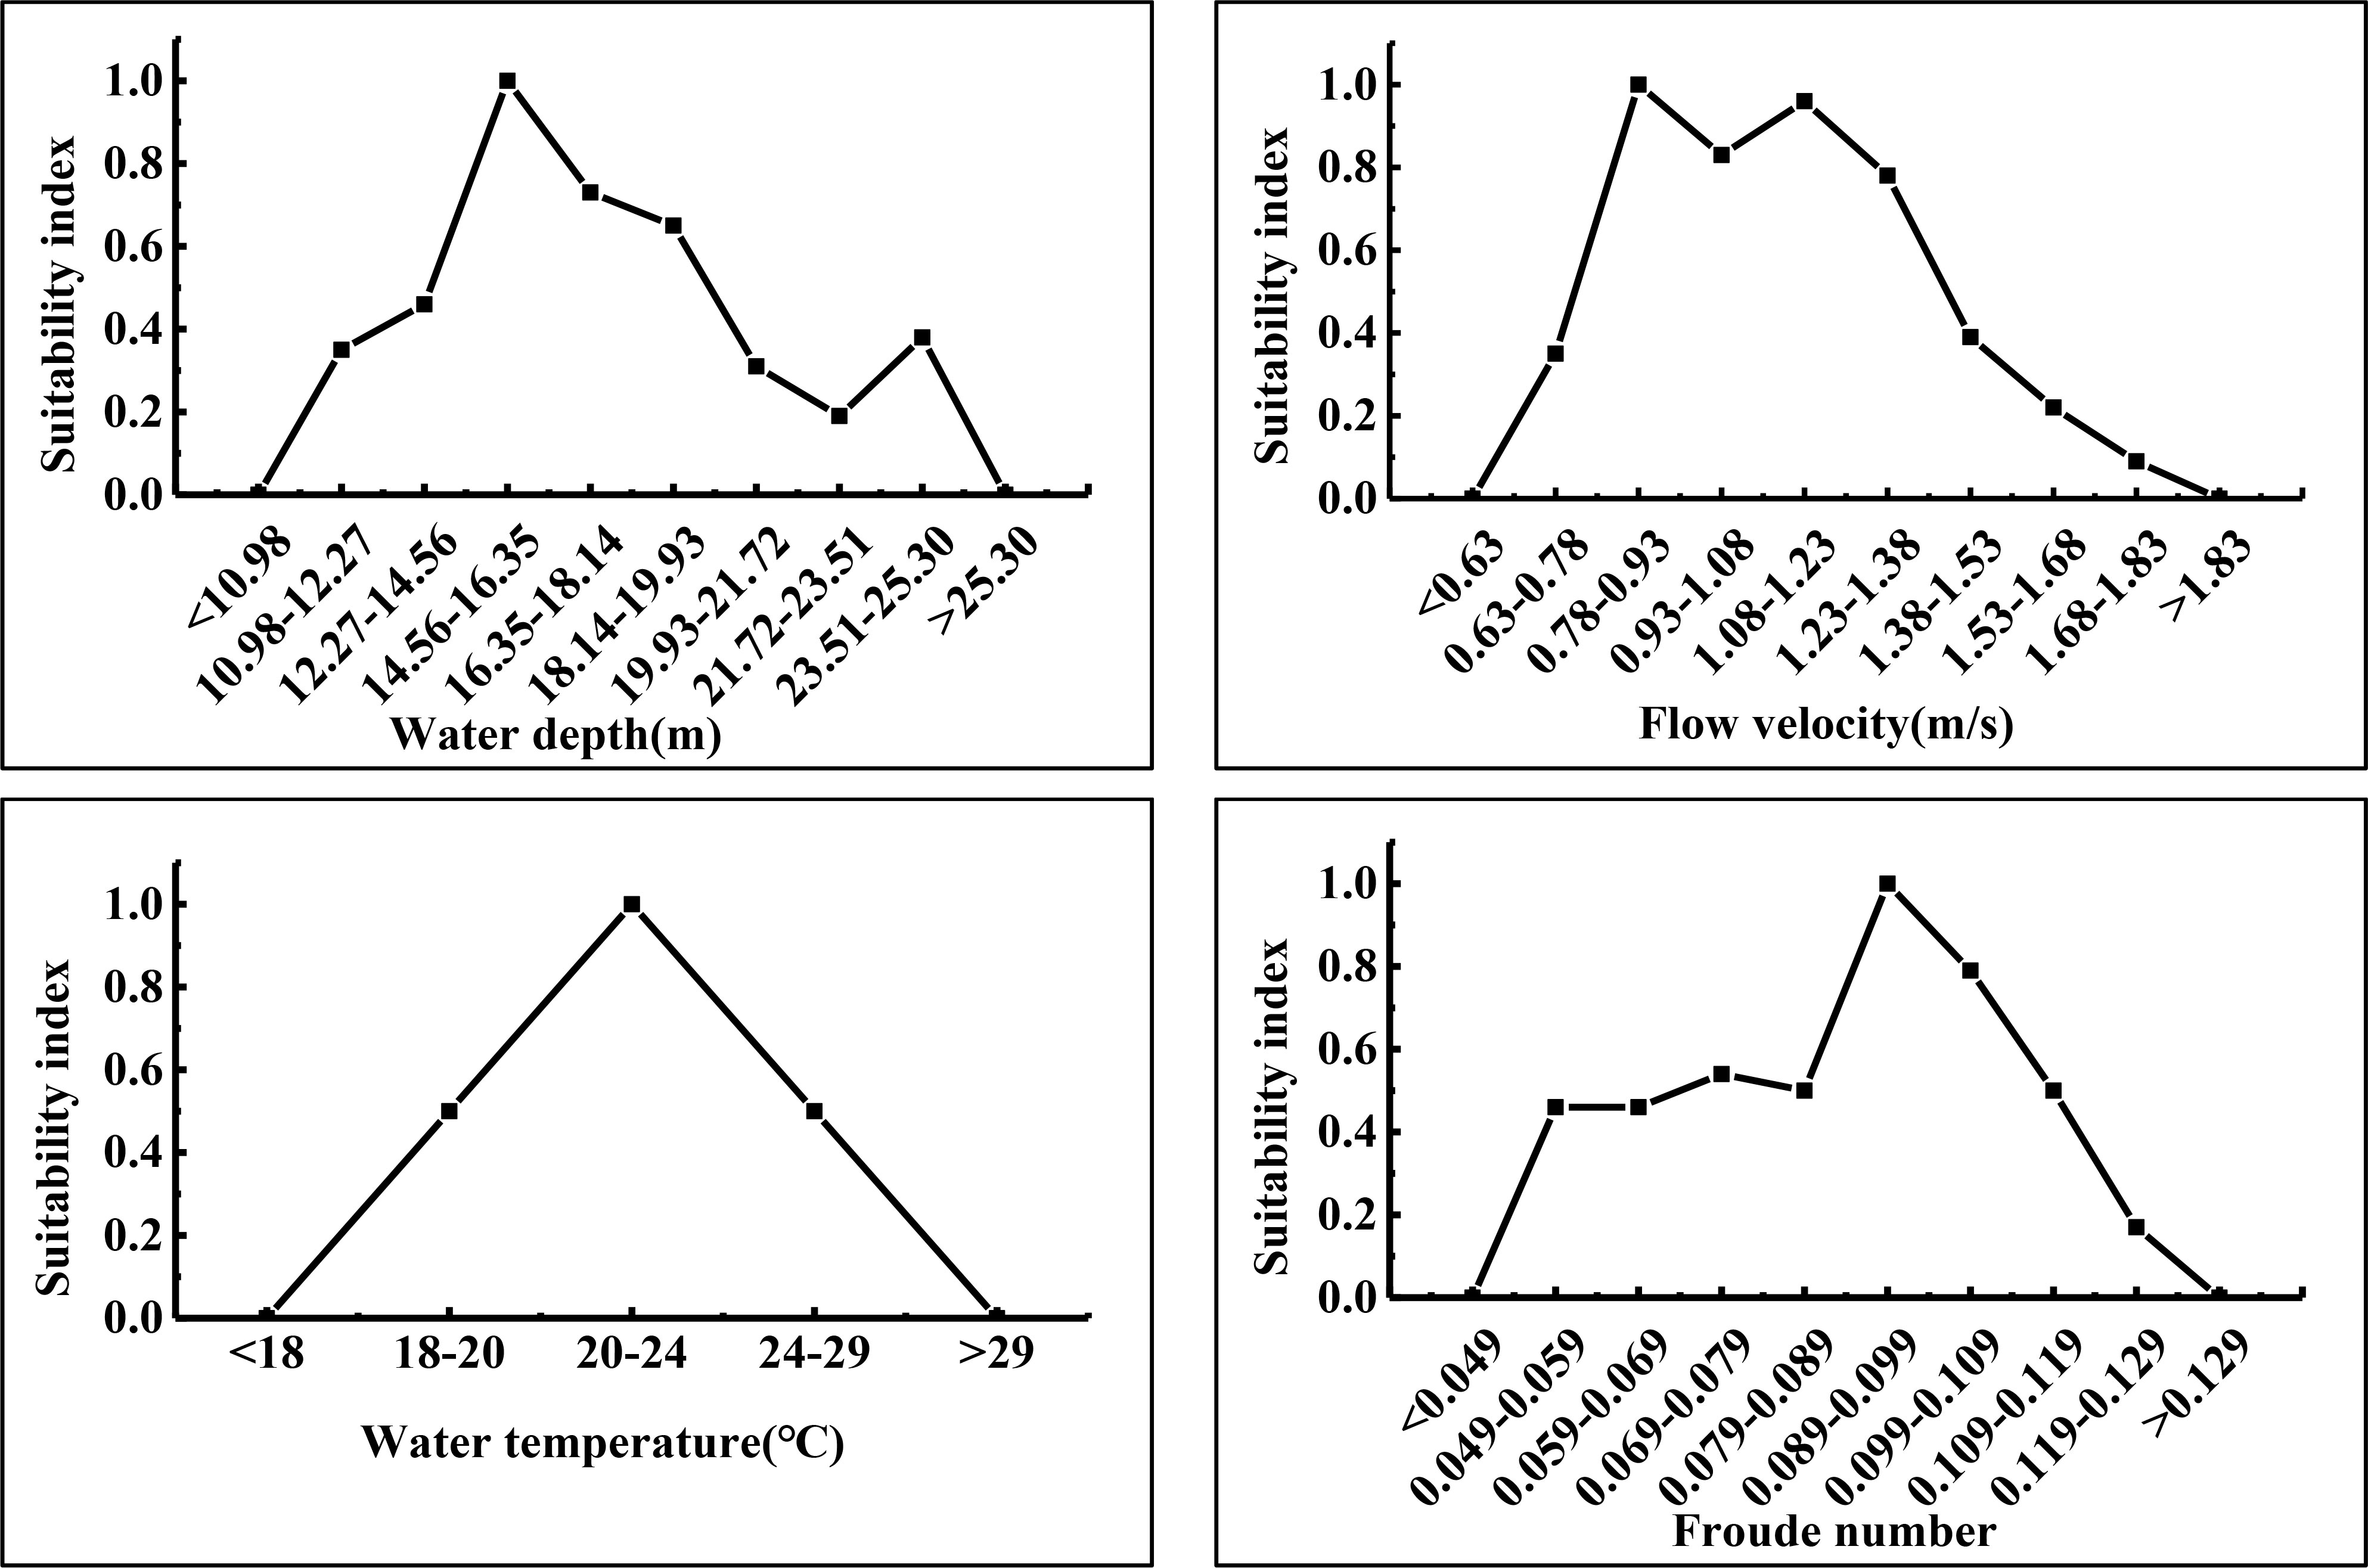
Figure 2 Suitability curves during Asian carp spawning periods.
2.3 Cluster analysis
This section describes how we conducted cluster analysis on all the measuring points extracted above. k-means clustering was used as the cluster analysis method, which is a commonly used and unsupervised classification method (MacQueen, 1967; Sabetian et al., 2021). Its effectiveness is due to its independent nature and how it can accurately calculate all data (Koonsanit et al., 2012; Alrabeei et al., 2021). Euclidean distance is typically used to calculate distance. It can quickly group measuring point data sets into multiple clusters composed of measuring point data that are similar to hydrologic and hydrodynamic characteristics. K-means clustering is suitable for the cluster analysis of a large amount of data (Jain, 2010), which satisfied the cluster analysis requirements of the large number of measuring data points used in this study. Additionally, the number of clusters and cluster centers must be determined prior to employing k-means clustering. We used the Davies–Bouldin index (DBI) to evaluate the cluster analysis methods (Davies and Bouldin, 1979), which was calculated as follows:
where k is the number of clusters; Ni and Nj are the average distances from all points in the clusters to their cluster centers (within the range of cluster dispersion); Mi,j is the distance between cluster centers. The smaller the index value is, the more compact the clusters will be and the further their centers will be dispersed (Sitompul et al., 2019). For DBI, the smallest number of clusters is regarded as the optimal number of clusters.
To visualize clustering results, this study used the measuring point as the center, employing two straight lines parallel to flow direction at 25 m left and right of the measuring point, while using the two midlines of the upper and lower cross-sections as well as cross-sections where the measuring point is located. These four lines form a unit (a quadrilateral) as shown in Figure 3. The area of each unit is equal. The flow field state (including water depth, flow velocity, water temperature, and Froude number) of the entire unit is represented by the value of the central measuring point. When drawing the spatial distribution map of the clusters, the units in each cluster were colored the same. Adjacent units belonging to the same cluster were amalgamated into one unit. The map provides different colored flow field distributions. In this way, a spatial distribution map of different hydrologic and hydrodynamic characteristics was generated on the basis of the original flow field.
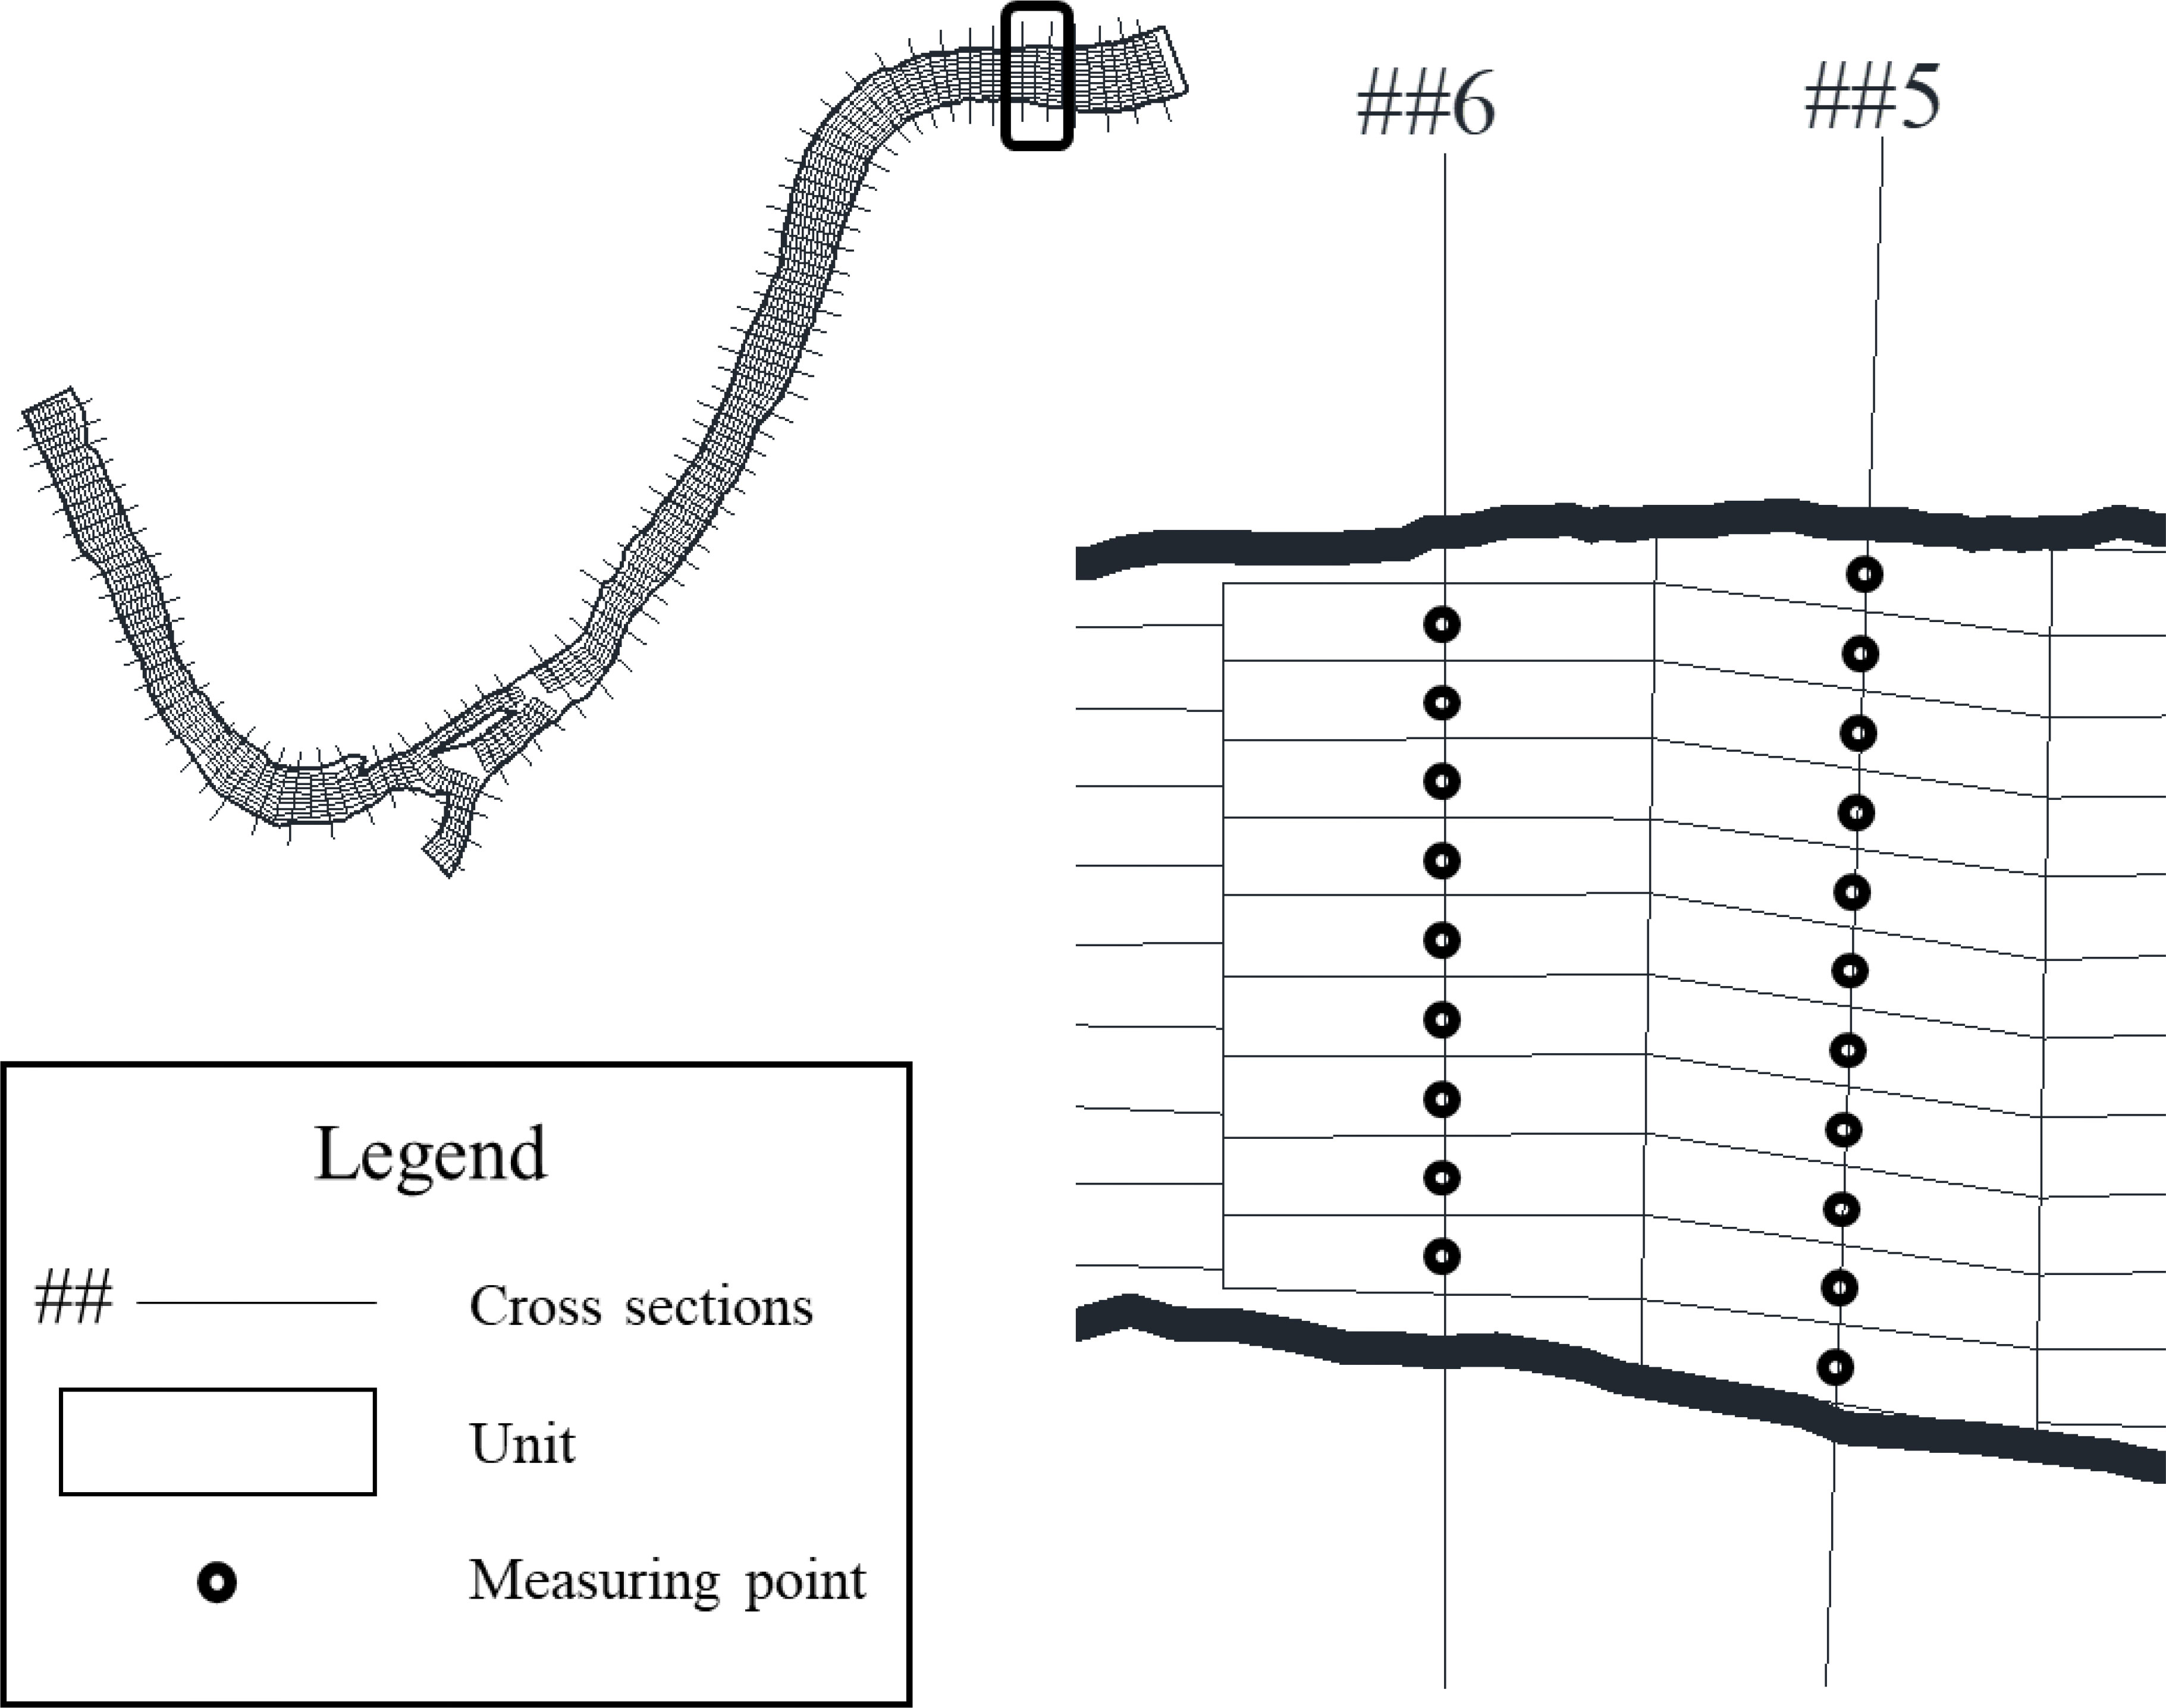
Figure 3 Cluster unit graph.
Calculating fish spawning spatial suitability values
A suitability value is a criterion that characterizes Asian carp spawning period suitability. The clusters formed by cluster analysis showed differing hydrologic and hydrodynamic characteristics. Combined with suitability curves, suitability values of single and total hydrologic and hydrodynamic factors in each cluster can be calculated. The following describes the specific calculation method used in this study. The formula for calculating the suitability value of a single factor is as follows:
The formula for calculating the total suitability value is as follows:
where Asingle is the single factor suitable value; ɑ is the number of suitability curve segments covered by the factor value range; is the sum of suitability values that correspond to a suitability curve segment covered by the factor value range; Atotal is the total suitable value; b is the number of factors. The suitability values of different hydrologic and hydrodynamic characteristic clusters were calculated and compared. The larger the suitability value is, the more suitable the area of the cluster will be for Asian carp spawning activities.
3 Result and discussion
3.1 Overall data analysis
3.1.1 Morphological river characteristics
Some studies have shown that the overall morphologic complexity of spawning reach is significantly higher than that of non-spawning grounds (e.g., Crowder and Diplas, 2002). Asian carp spawning grounds are typically divided into multiple types: straight section, curved section, branched section, etc. (Li et al., 2010). The direction and velocity of these river sections are variable. The flow pattern is relatively turbulent, with back flow, slow flow, and rapid flow. Researchers have shown that river reaches under certain flow conditions (such as turbulent flow, high-flow event and so on) are favorable for Asian carp spawning (Crowder and Diplas, 2002; Li et al., 2010). Figure 4 shows the morphologic characteristics of the study area, including two straight sections, two curved sections, and one branched section. Field measurements showed that the appearance of the pools and riffles of curved section I and straight section II alternated. Branched section III bifurcated at an island where tributaries converge, making its flow field extremely complex. Deep pools formed from scouring in the convex bank of curved section IV where large tracts of rocky beaches are located. There were only slight elevation changes between the streambed and shape of the river along its course for straight section V. As shown in Table 1 and Figure 4, the river comprises of complex and diverse cross-sectional shapes. It was therefore concluded that the river section selected for this study is composed of straight, curved, and branched sections as well as various cross-sectional shapes, making this river suitable for Asian carp spawning activities.
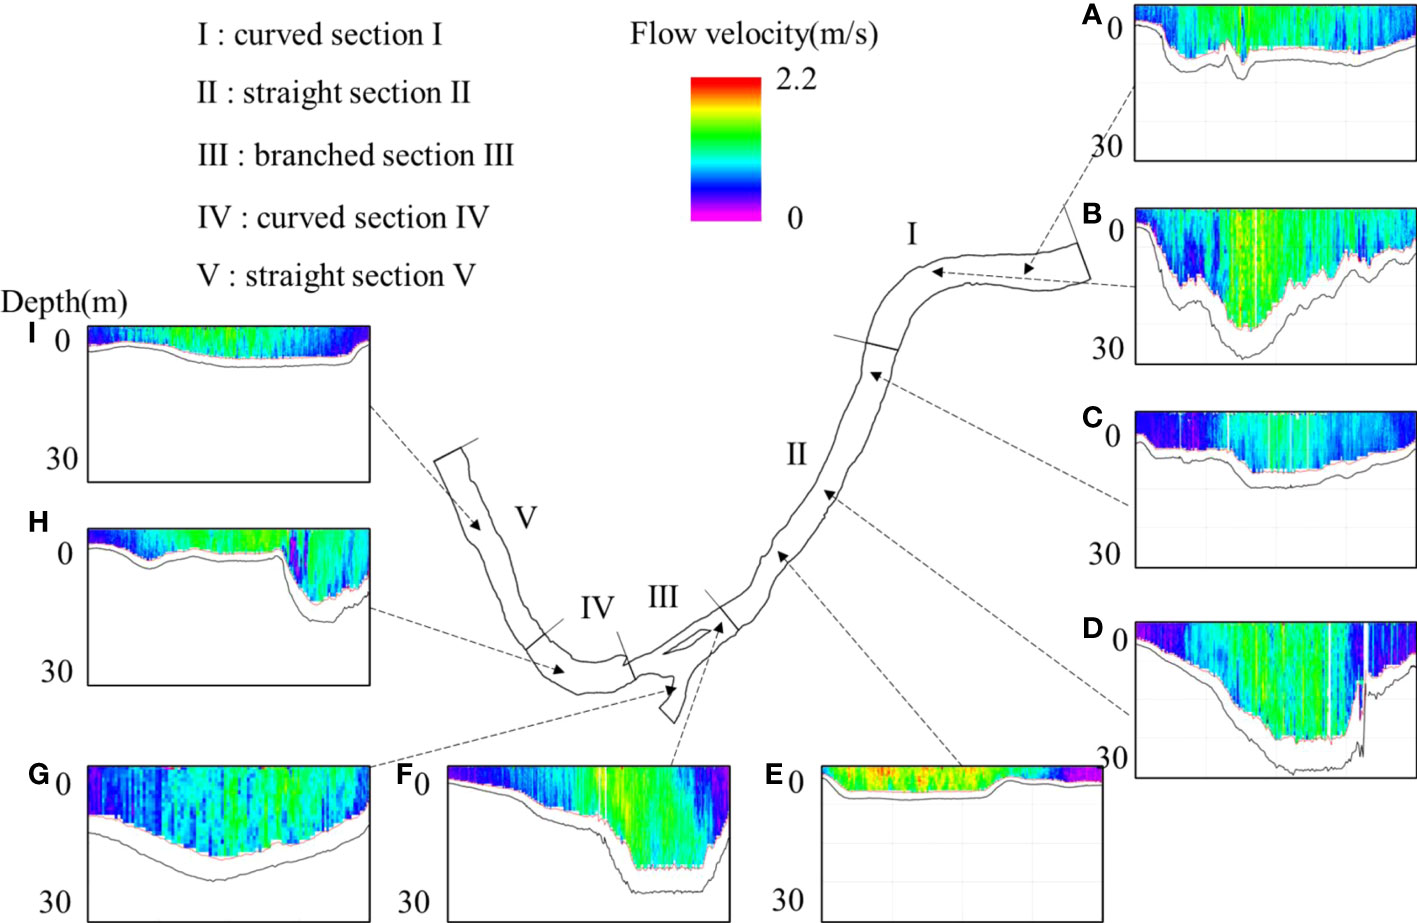
Figure 4 Plan and typical cross-sectional characteristics of the study area. (A–I) Directionally represent the downstream to upstream reaches along the study area.
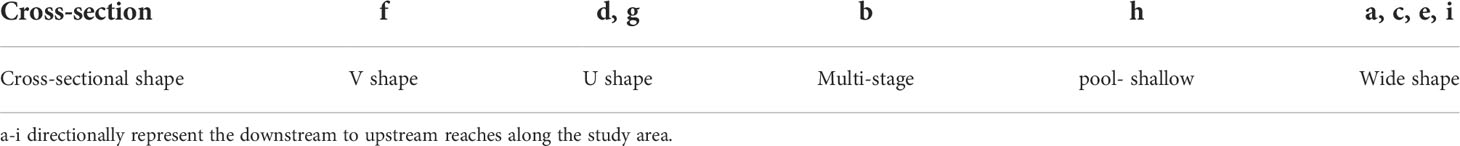
Table 1 Cross-sectional shape.
3.1.2 Hydrologic and hydro-dynamic characteristics
Table 2 provides all measured data of the study area. A total of 78 cross sections and 585 measuring points, where each measuring point includes water depth, flow velocity, and water temperature, were calculated along with the Froude number. The size range of each hydraulic factor collected should cover the range of suitability curve (suitability Index greater than zero). The data collected on site are as follows: Water depth is 2.44~30.36m; Flow velocity is 0.14~4.09m/s; Water temperature is 25.38~28.50°C; Froude number is 0.013~0.523 (see Table 2). The range of suitability curve was as follows: Water depth was 10.98~25.30m; Flow velocity is 0.63~1.83m/s; Water temperature is 18~29°C; Froude number is 0.049~0.129 (see Figure 2). Among them, water temperature is one of most important factors that trigger the spawning of Asian carp, and is within the range of suitability curve for Asian carp (20~24°C;). The other sampled indicators are greater than range.
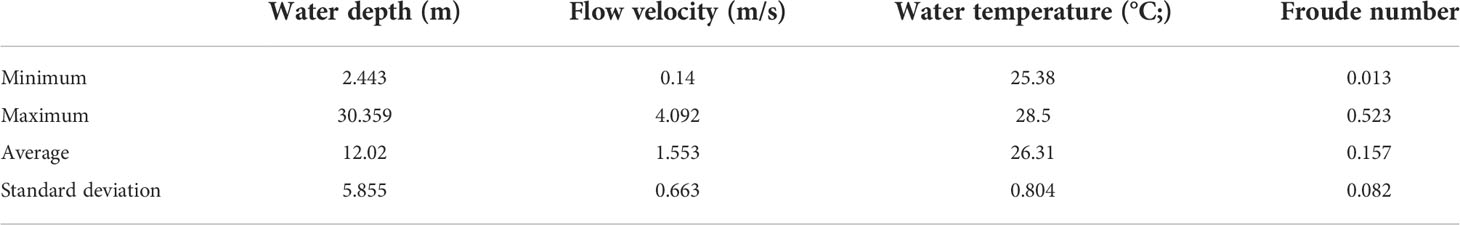
Table 2 Distribution of measured data.
The histogram (Figure 5) shows that the frequency distribution of water depth, flow velocity, and Froude number was close to normal distribution. However, water temperature was not. Water depth distribution was skewed to the right. The frequency distribution of flow velocity was similar to normal distribution. The distribution of the Froude number was skewed to the right. Water temperature was mainly distributed (skewed) to the left, which may indicate that the sampling area was too small. However, different areas exhibited a degree of distinction. This study used a total of 564 measuring points with water depths between 2 and 22m, accounting for approximately 93.33%. There were 495 measuring points with flow velocities between 0.2 and 2.2 m/s, accounting for approximately 84.62%. There were 509 measuring points whose water temperatures were between 25.4 and 27.2°C;, accounting for approximately 87.01%. Finally, there were 477 measuring points with Froude number between 0.025 and 0.225, accounting for approximately 81.54%.
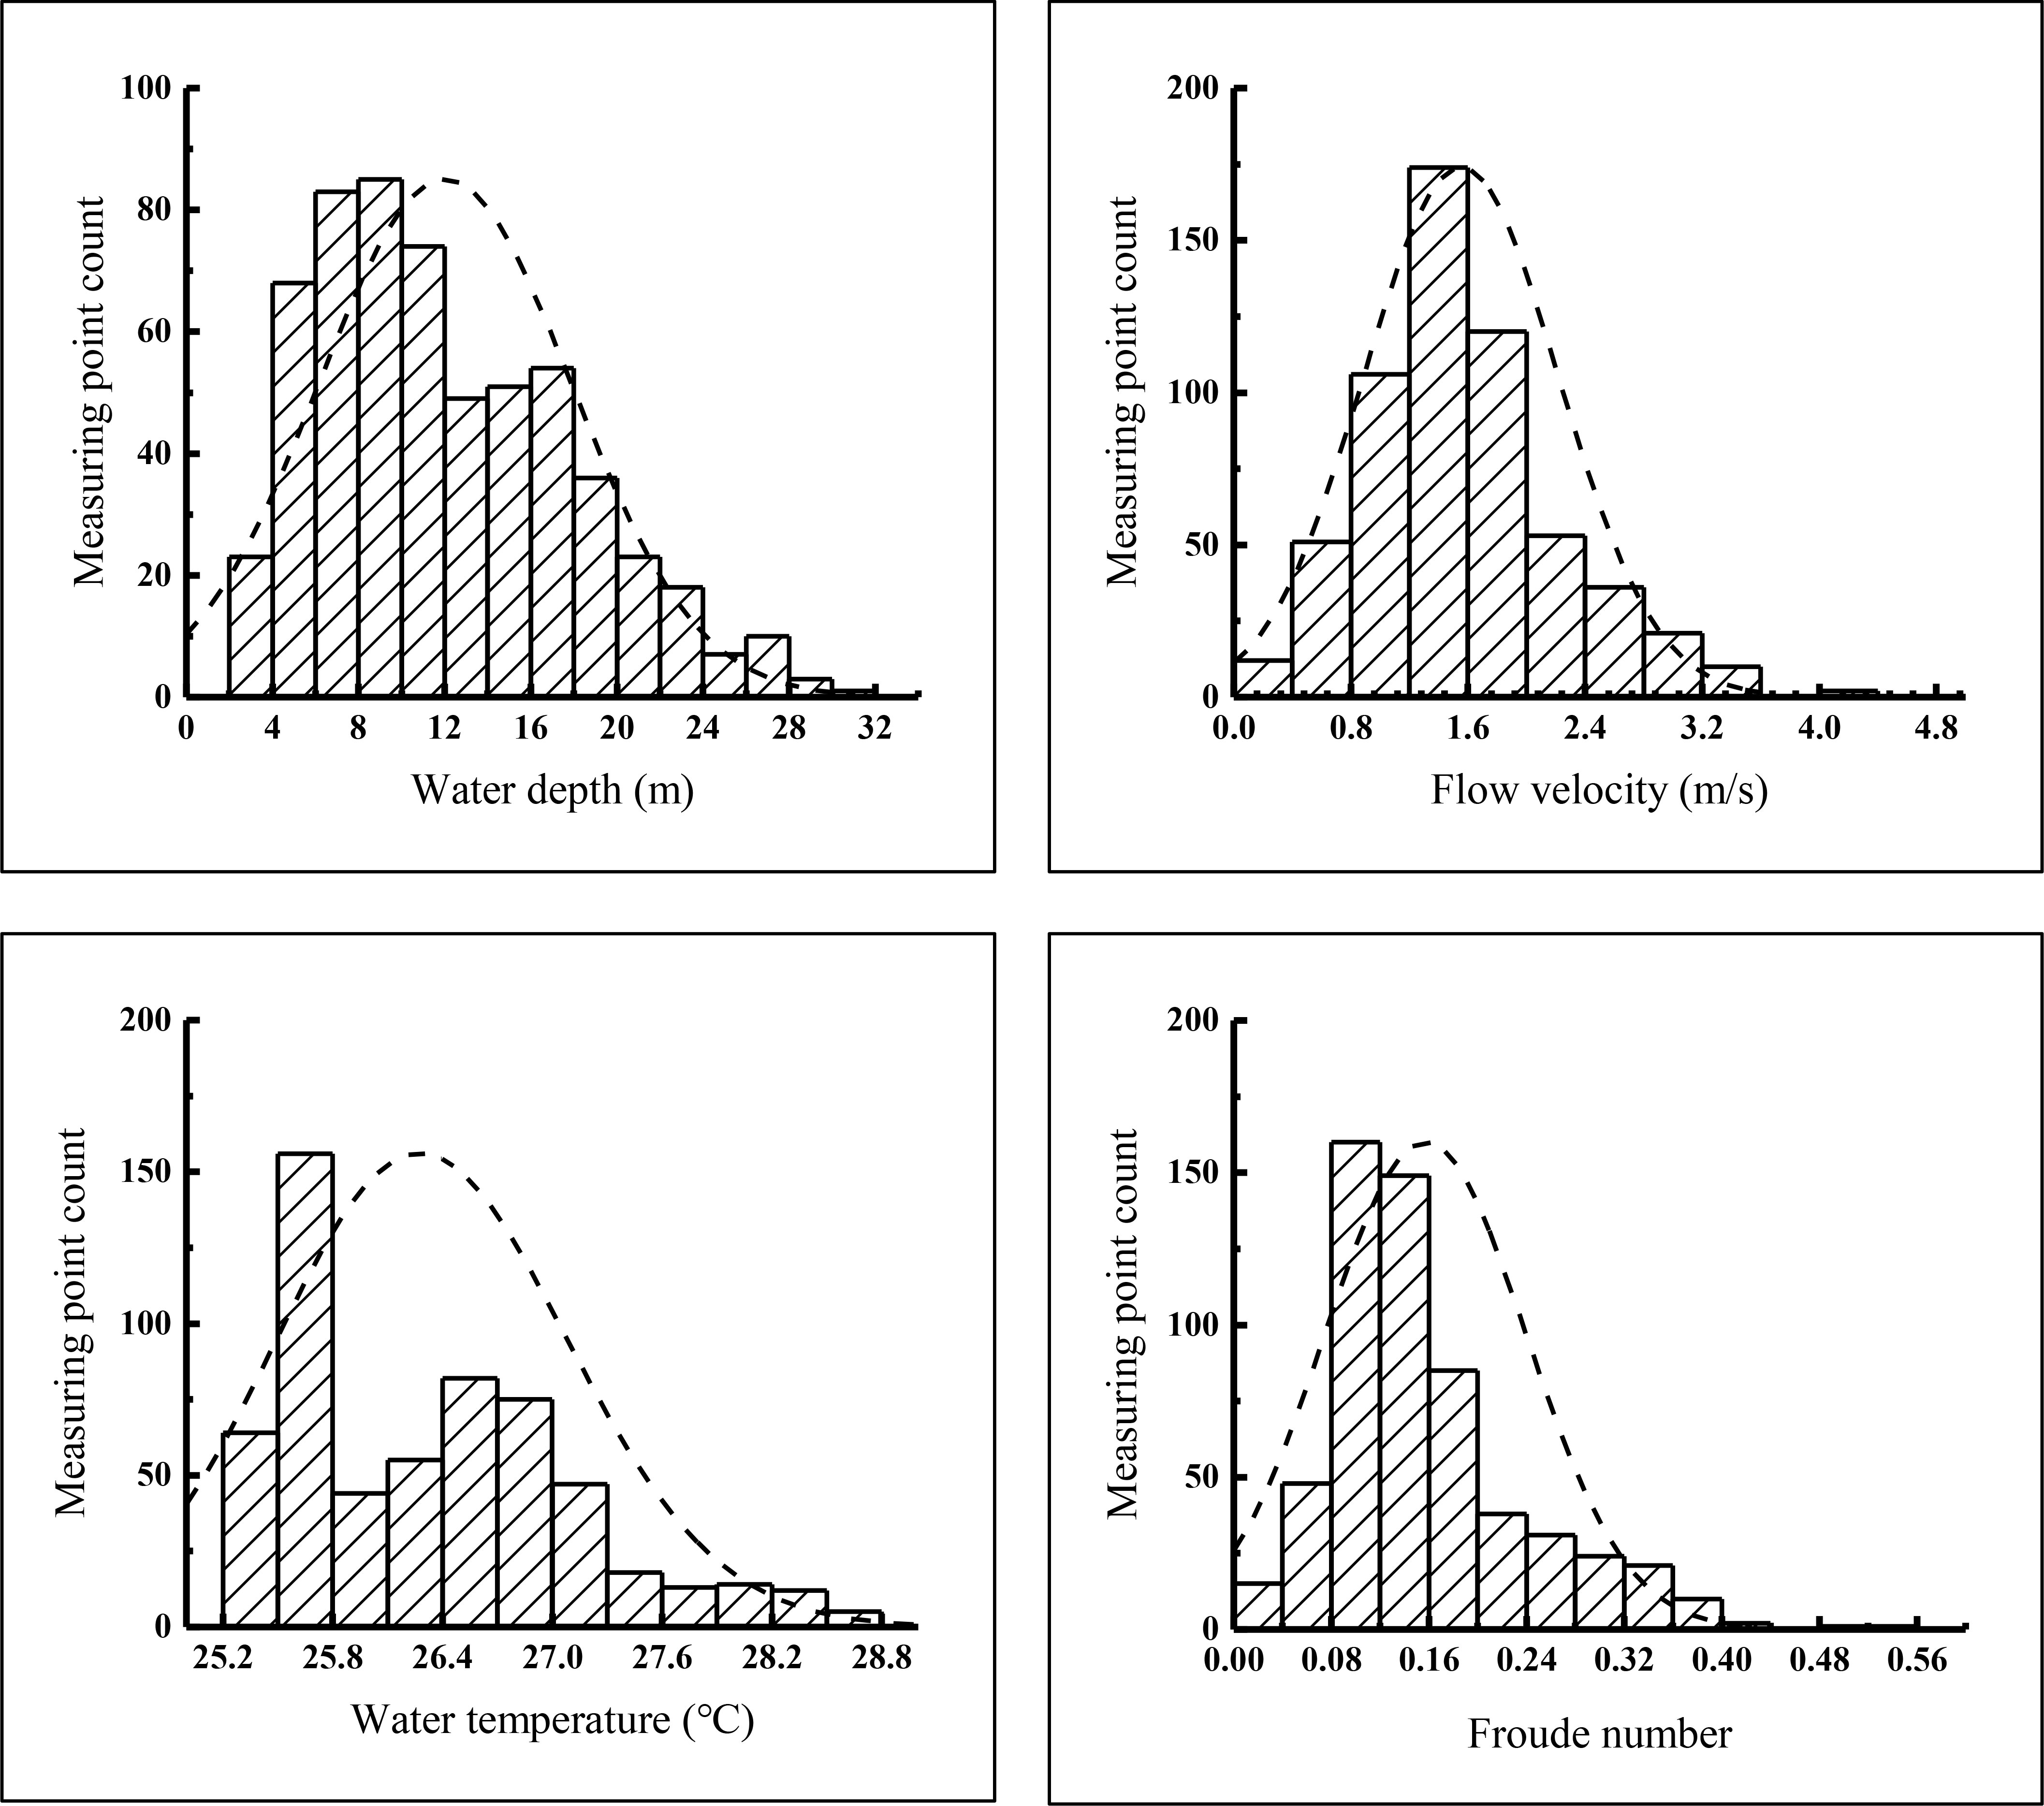
Figure 5 Water depth, flow velocity, water temperature, and Froude number data segmentation observed during spawning.
As shown in Figure 6, the maximum water depth, the average water depth, and the average flow velocity of each cross section were extracted along the main stem of the river, after which a thalweg line was constructed in a longitudinal direction. The upstream average flow velocity was generally greater than the downstream average flow velocity, while the upstream average water depth was less than the downstream average water depth (Figure 6). Riffles dominated the upstream area. Water depth in most areas was less than the average water depth (12.02m) in the study area. In branched section III, pools and riffles near the island alternately appeared. The water in this section is turbulent, forming a complex flow field. Moreover, flow velocity was significantly higher compared to other areas. This may be due to topographic changes (i.e., river islands, tributary confluence, etc.). Pools and riffles dominated the downstream reaches. There were two pools with water depths of 30.36m and 28.26m in curved section I and straight section II, respectively. The complex flow field that had formed within the complex river terrain provides habitat, foraging, reproduction, and shelter for fish.
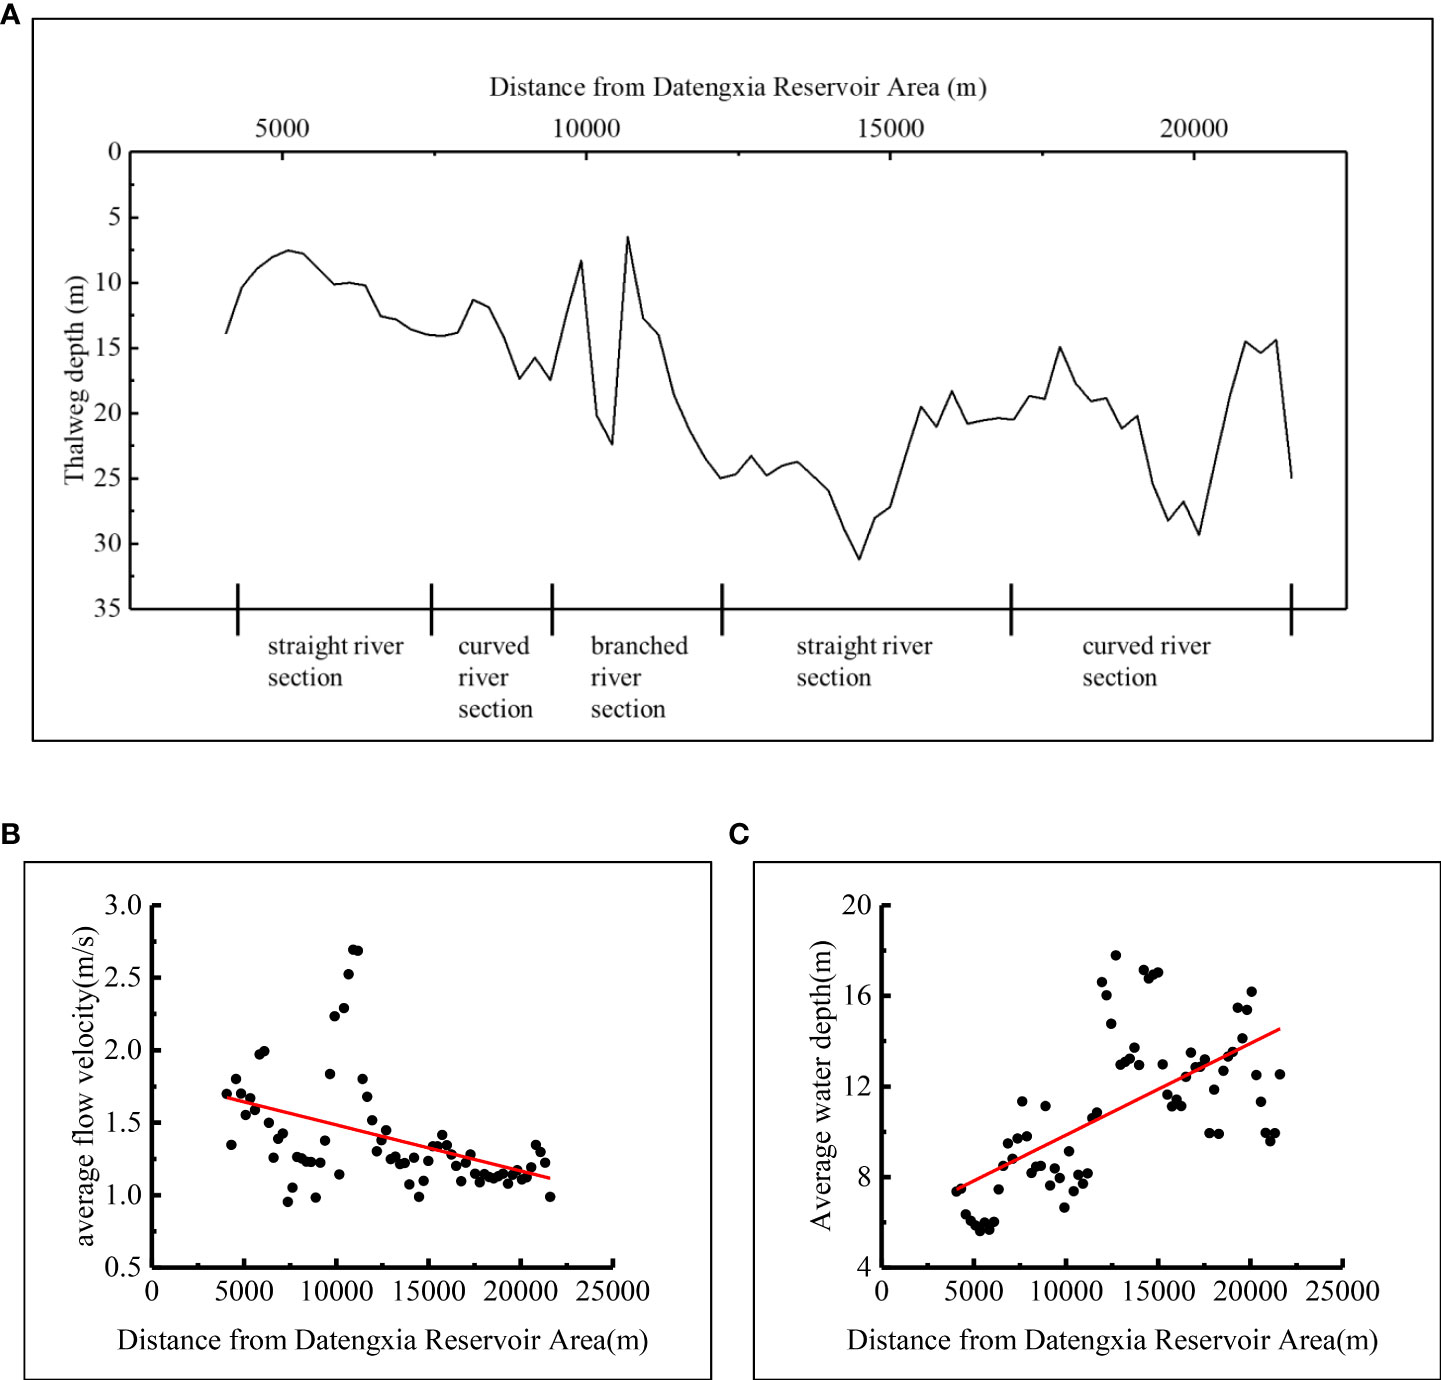
Figure 6 Flow characteristics of the river section selected for this study. The mileage number of the Datengxia Dam is 0 river kilometer. (A) Thalweg depth; (B) average flow velocity at cross sections; (C) average water depth at cross sections.
3.2 Cluster analysis
3.2.1 Determining optimal cluster numbers
This study partitioned hydrologic and hydrodynamic factors into a set of distinct clusters, where the number of clusters ranged from 2 to 20. The DBI was employed to evaluate the optimal number of partitions. The “evalclusters” function in MATLAB was used for calculations. From this, we obtained the relationship between the DBI and the number of clusters (Figure 7). As the number of clusters increased, the overall DBI trend decreased before slightly increasing again. The DBI value was lowest when there were 10 clusters (0.95), and the clustering effect was better. Additionally, three and 17 clusters were observed with apparent troughs in the index series. The clustering scale was determined by how flow field characteristics were distinguished at each scale and for the convenience of discussion. Hydraulic characteristics of three clusters will have less detail than 10 clusters. On the other hand, hydraulic characteristics of 17 clusters would be similar to that of 10 clusters, namely, providing no greater detail. Therefore, 10 was determined to be the initial k value of k-means clustering.
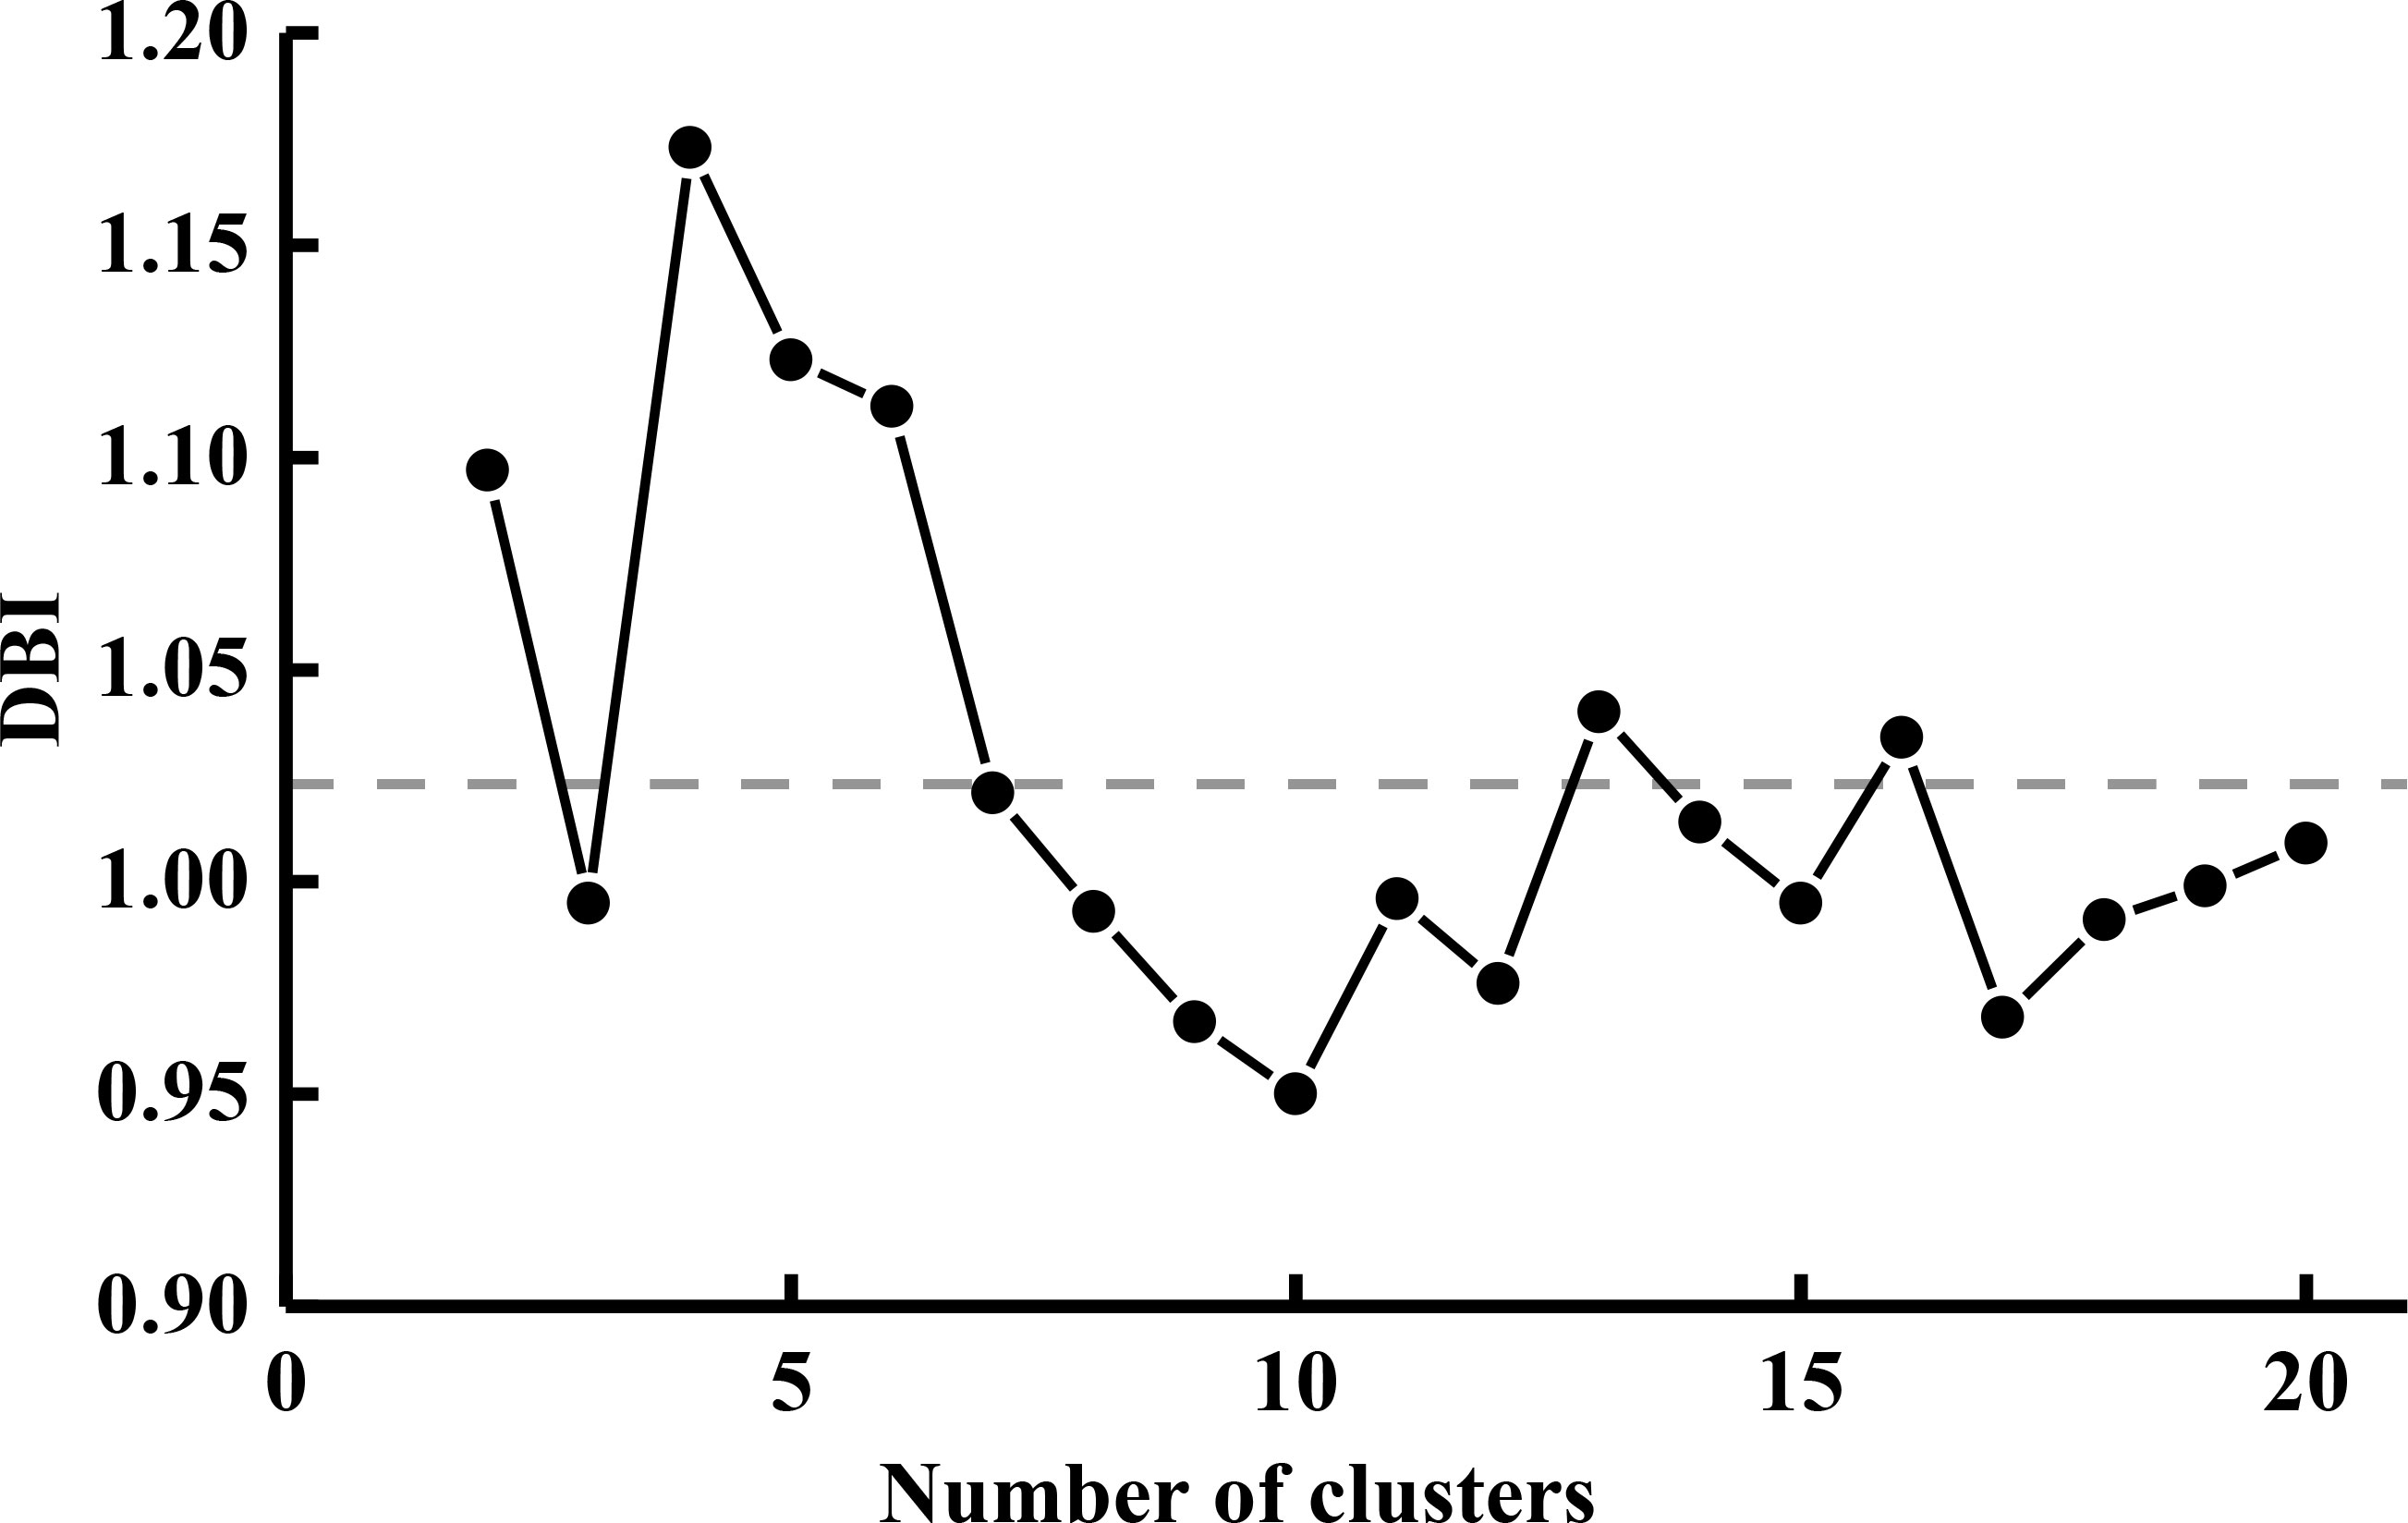
Figure 7 The Davies-Bouldin index evaluating clustering efficiency against the number of clusters. Lower index values indicate better clustering results. The dotted line represents the mean value of the index.
3.2.2 K-means clustering results
Data retrieved from the 585 measurement points were divided into 10 clusters, 10 being the number of clusters selected for k-means clustering. After being divided into 10 clusters, the statistical hydrologic and hydrodynamic characteristics of each cluster were determined (see Table 3 and Figure 8).
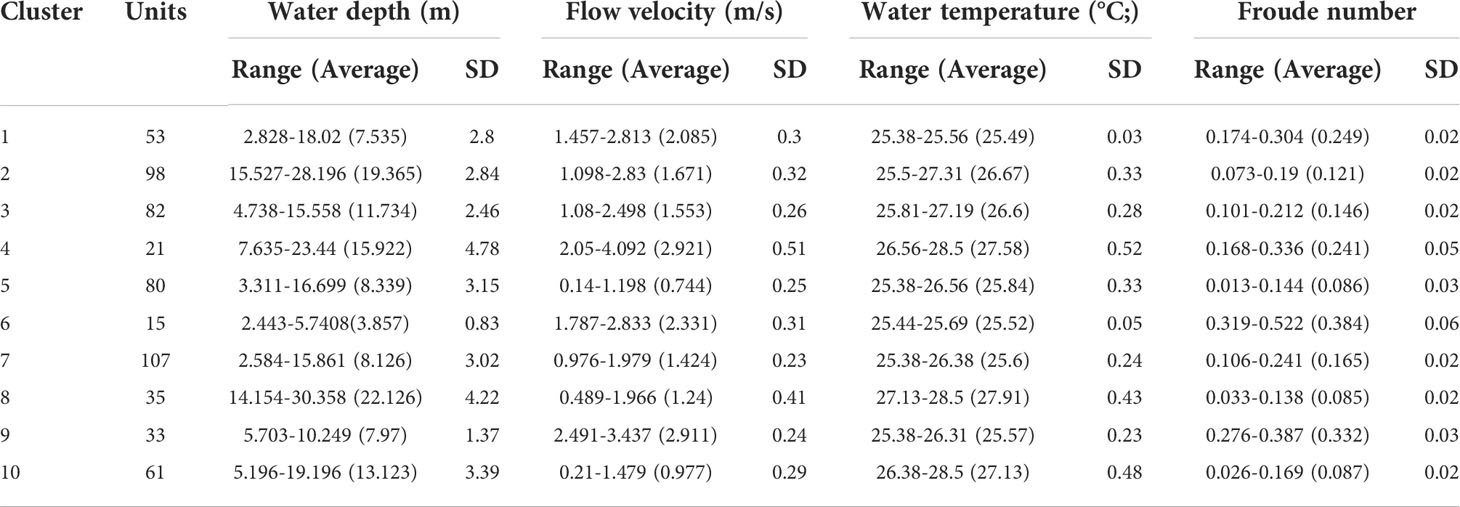
Table 3 Statistical characteristics of hydrologic and hydrodynamic quantities in each cluster.
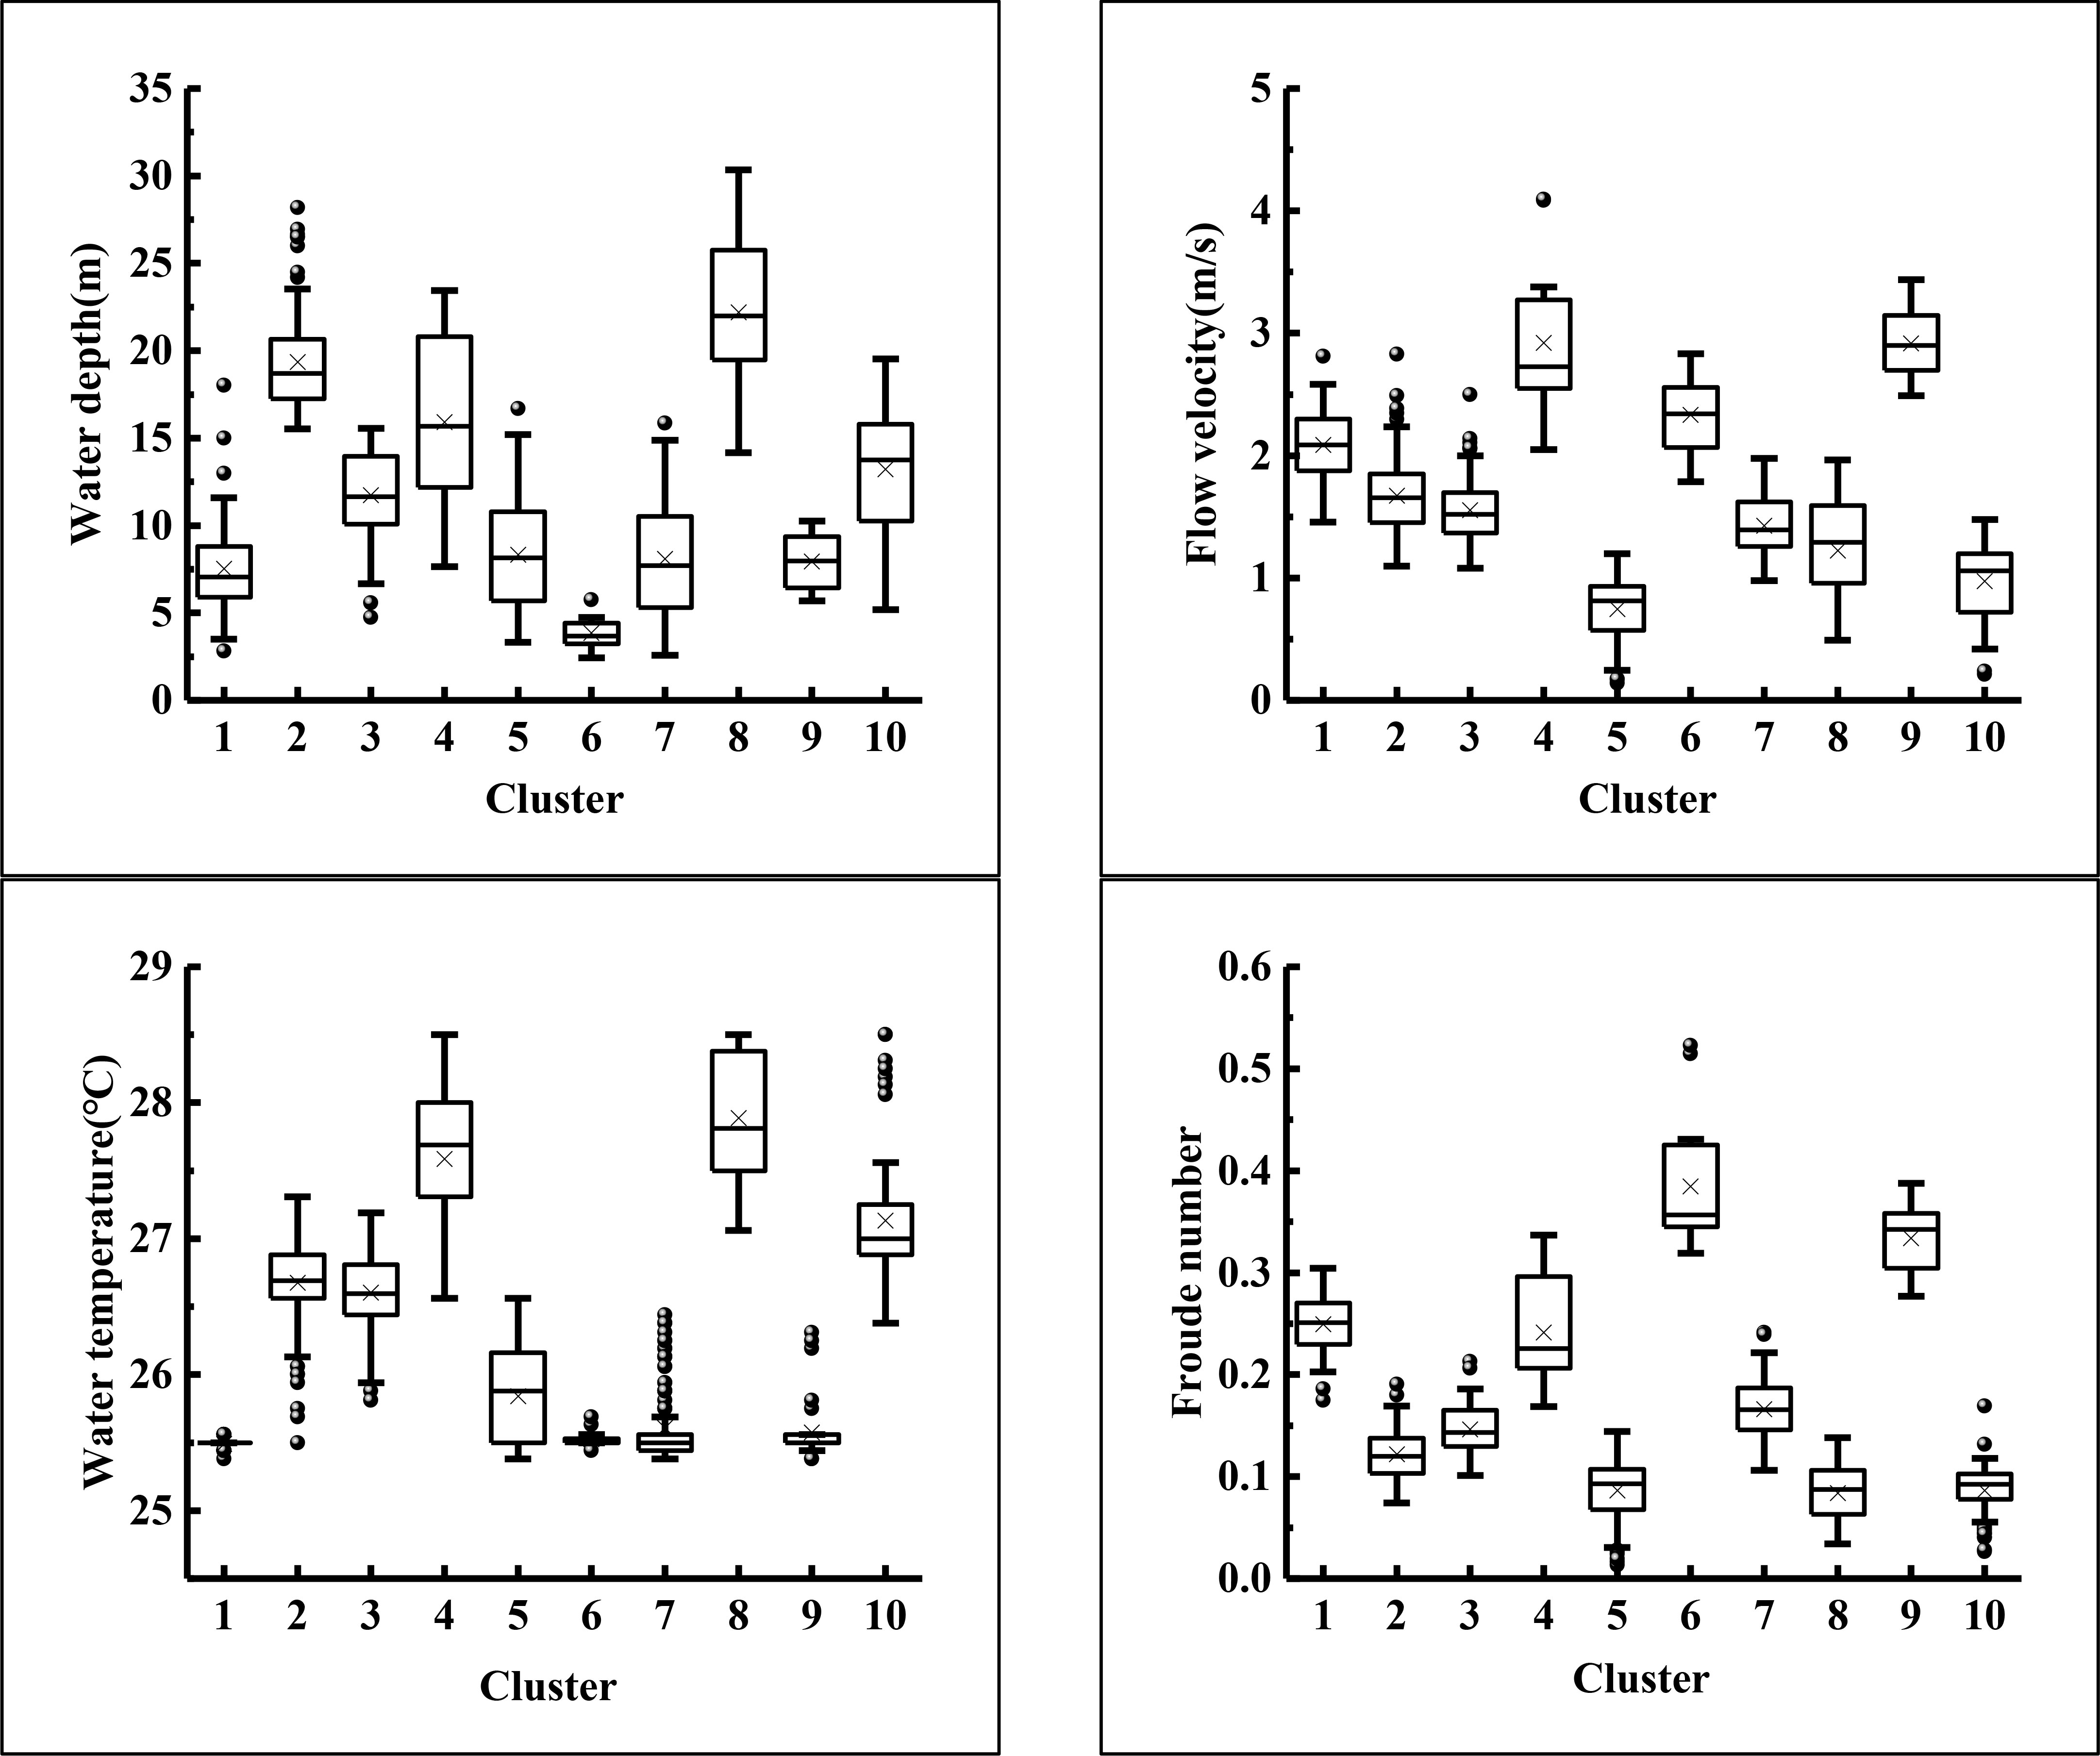
Figure 8 Characteristics of the 10 hydrologic and hydrodynamic types as determined by cluster analysis (see the Materials and Methods section for more detail). Each cluster defined by four hydrologic and hydrodynamic factors: water depth, flow velocity, water temperature, and Froude number. Cross shapes show the average value of each factor in a cluster, which indicates the average position of a cluster. Box plots show the parameter dispersion values in the clusters. For box plots, lines represent the lower, median, and upper quartiles. Whiskers are the lines extending from the two opposite ends of the box plots, showing the range of the remaining data. Outliers are the data whose index value exceeds the whiskers (where whisker length is limited to 1.5 of the interquartile).
To ascertain the hydrologic and hydrodynamic characteristics of the 10 clusters, the data were sorted according to the numerical value and then divided into three (i.e., at one-third and two-third positions). Among them, average values of the hydrologic and hydrodynamic data of the various clusters were divided into high (a value greater than two-thirds), medium (a value between one-third and two-thirds), and low (a value less than one-third). For example, if the average water depth of a cluster is higher than two-thirds, the water depth of this cluster is defined as being high. By analogy, hydrologic and hydrodynamic characteristics of each cluster are shown in Table 4. The water depth tri-sectional quantile group was 2.44~8.47m, 8.47~14.39m, and 14.39~30.36m. The flow velocity tri-sectional quantile group was 0.14~1.24m/s, 1.24~1.70m/s, and 1.71~4.09m/s. The water temperature tri-sectional quantile group was 25.4~25.6°C;, 25.6~26.7°C;, and 26.7~28.5°C;. The Froude number tri-sectional quantile group was 0.013-0.114, 0.114-0.166, and 0.166-0.522.
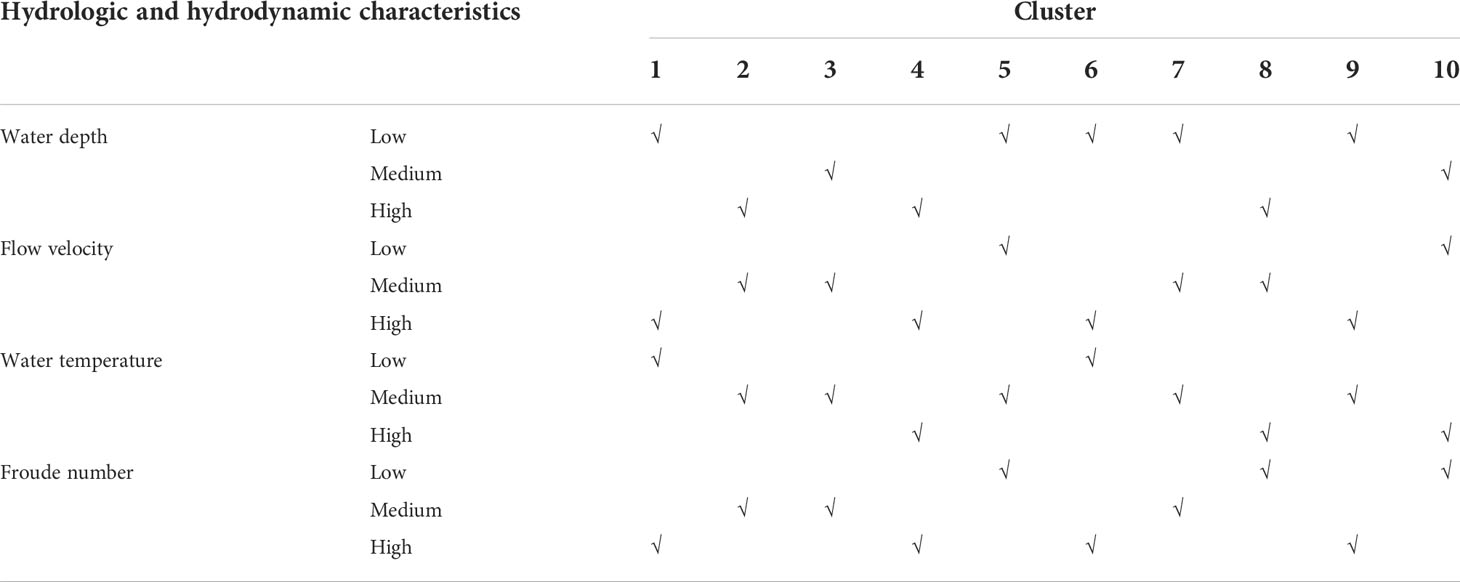
Table 4 Hydrologic and hydrodynamic characteristics of the 10 clusters.
3.2.3 Determining the spatial distribution of clusters
K-means analysis was used to construct the spatial distribution of the 10 clusters. A map of summary statistics was constructed, showing the measured hydrodynamic clusters at each geographical position. In the study area, significant spatial differences were observed in the 10 clusters representing areas of hydrologic and hydrodynamic characteristics. As shown in Figure 9, each cluster can basically be connected into blocks in space. The 10 clusters can be described as follows:
1. Cluster 1 is located at the upstream and downstream reaches of branched section III and the convex bank of curved section IV and straight section V. Compared to the other clusters, this cluster was characterized by low water depth, high flow velocity, low water temperature, and a high Froude number.
2. Cluster 2 is located at mid-course section of the river between curved section I and straight section II. This cluster is characterized by high water depth, medium flow velocity, medium water temperature, and a medium Froude number.
3. Cluster 3 is also located at the mid-course section of the river between curved section I and straight section II and is spaced apart from cluster 2. Its characteristics are similar to cluster 2 (i.e., medium flow velocity, medium water temperature, and a medium Froude number) except for water depth (i.e., medium). This cluster reflects the alternate appearance of pools and riffles in curved section I and straight section II.
4. Cluster 4 is located on the right side of the branched section III island and upstream of straight section II, where space is extremely limited. It is characterized by high water depth, high flow velocity, high water temperature, and a high Froude number.
5. Cluster 5 is located on the left bank of curved section I and straight section II and on the right bank of curved section IV and straight section V. It is characterized by low water depth, lowest flow velocity, medium water temperature, and a low Froude number.
6. Cluster 6 is located at branched section III and straight section V, which is extremely restricted spatially. It is characterized by lowest water depth, high flow velocity, low water temperature, and the highest Froude number.
7. Most of cluster 7 is located at curved section IV and straight section V, while a small proportion of it is on the left bank of curved section I and straight section II where it intermittently shares space with cluster 5. It is characterized by low water depth, medium flow velocity, medium water temperature, and a medium Froude number.
8. Cluster 8 is located at the confluence of the tributaries and the right bank of straight line II. It is characterized by the highest water depth, medium flow velocity, high water temperature, and a low Froude number.
9. Cluster 9 is located at branched section III and straight section V, and its distribution is similar to that of cluster 6, where space is also extremely limited. It is characterized by low water depth, the highest flow velocity, medium water temperature, and a high Froude number.
10. Cluster 10 is located on the right bank of curved section I and straight section II. It is characterized by medium water depth, low flow velocity, high water temperature, and a low Froude number.
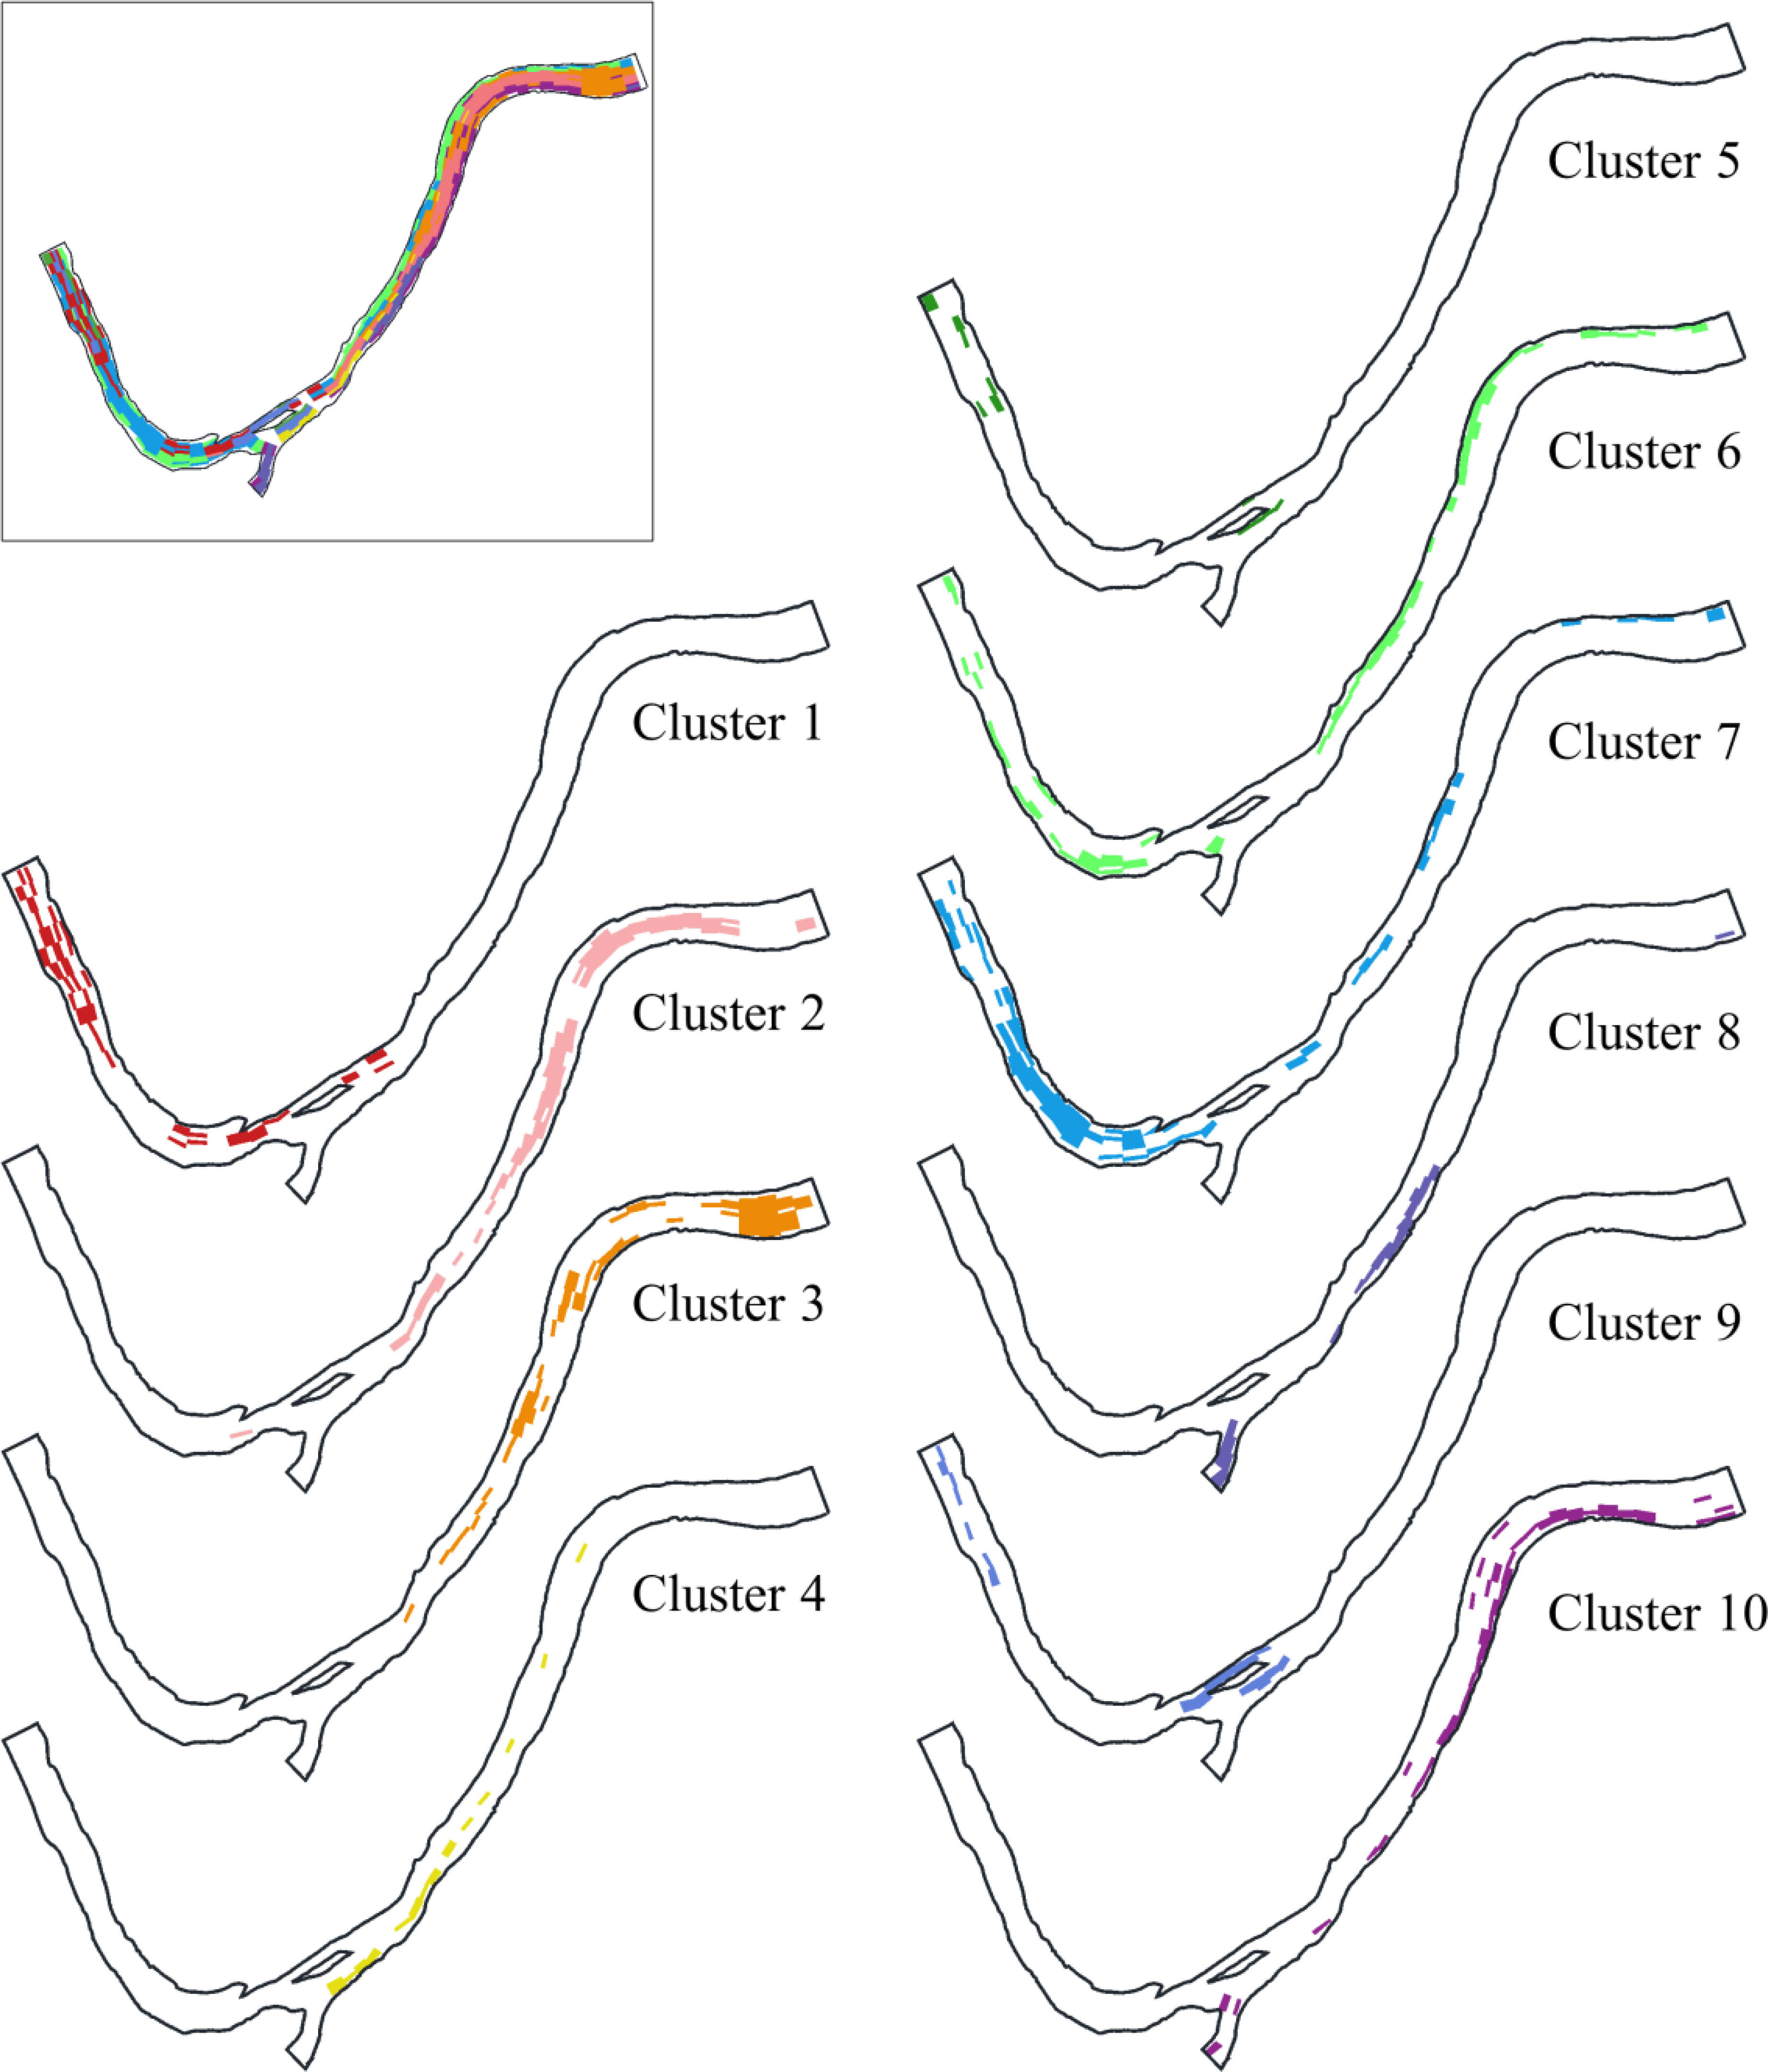
Figure 9 Distribution map illustrating areas of hydrologic and hydrodynamic characteristics for each cluster.
3.3 Determining the location of fish spawning grounds
This section attempts to accurately locate fish spawning grounds by evaluating the suitability of fish spawning in each cluster. We used a 95% confidence interval for each hydrologic and hydrodynamic factor range of each cluster to calculate the suitability value of each hydrologic and hydrodynamic factor (see Figure 10). To more easily interpret the evaluation results of fish spawning ground suitability, we refer to previous studies (Gillenwater et al., 2006; Yi et al., 2016; Zhou et al., 2019) to divide suitability values into two classes, representing areas of high (a suitability value greater than 0.4) and low (a suitability value less than 0.4) suitability. Cluster 2, cluster 3, cluster 5, cluster 8, and cluster 10 indicated high suitability, with suitability values of 0.485, 0.410, 0.466, 0.467, and 0.510, respectively. Cluster 1, cluster 4, cluster 6, cluster 7, and cluster 9 indicated low suitability, with suitability values of 0.236, 0.238, 0.136, 0.365, and 0.125, respectively. Proportionally, the high suitability area was 60.86%, which was higher than that of the low suitability area (39.14%).
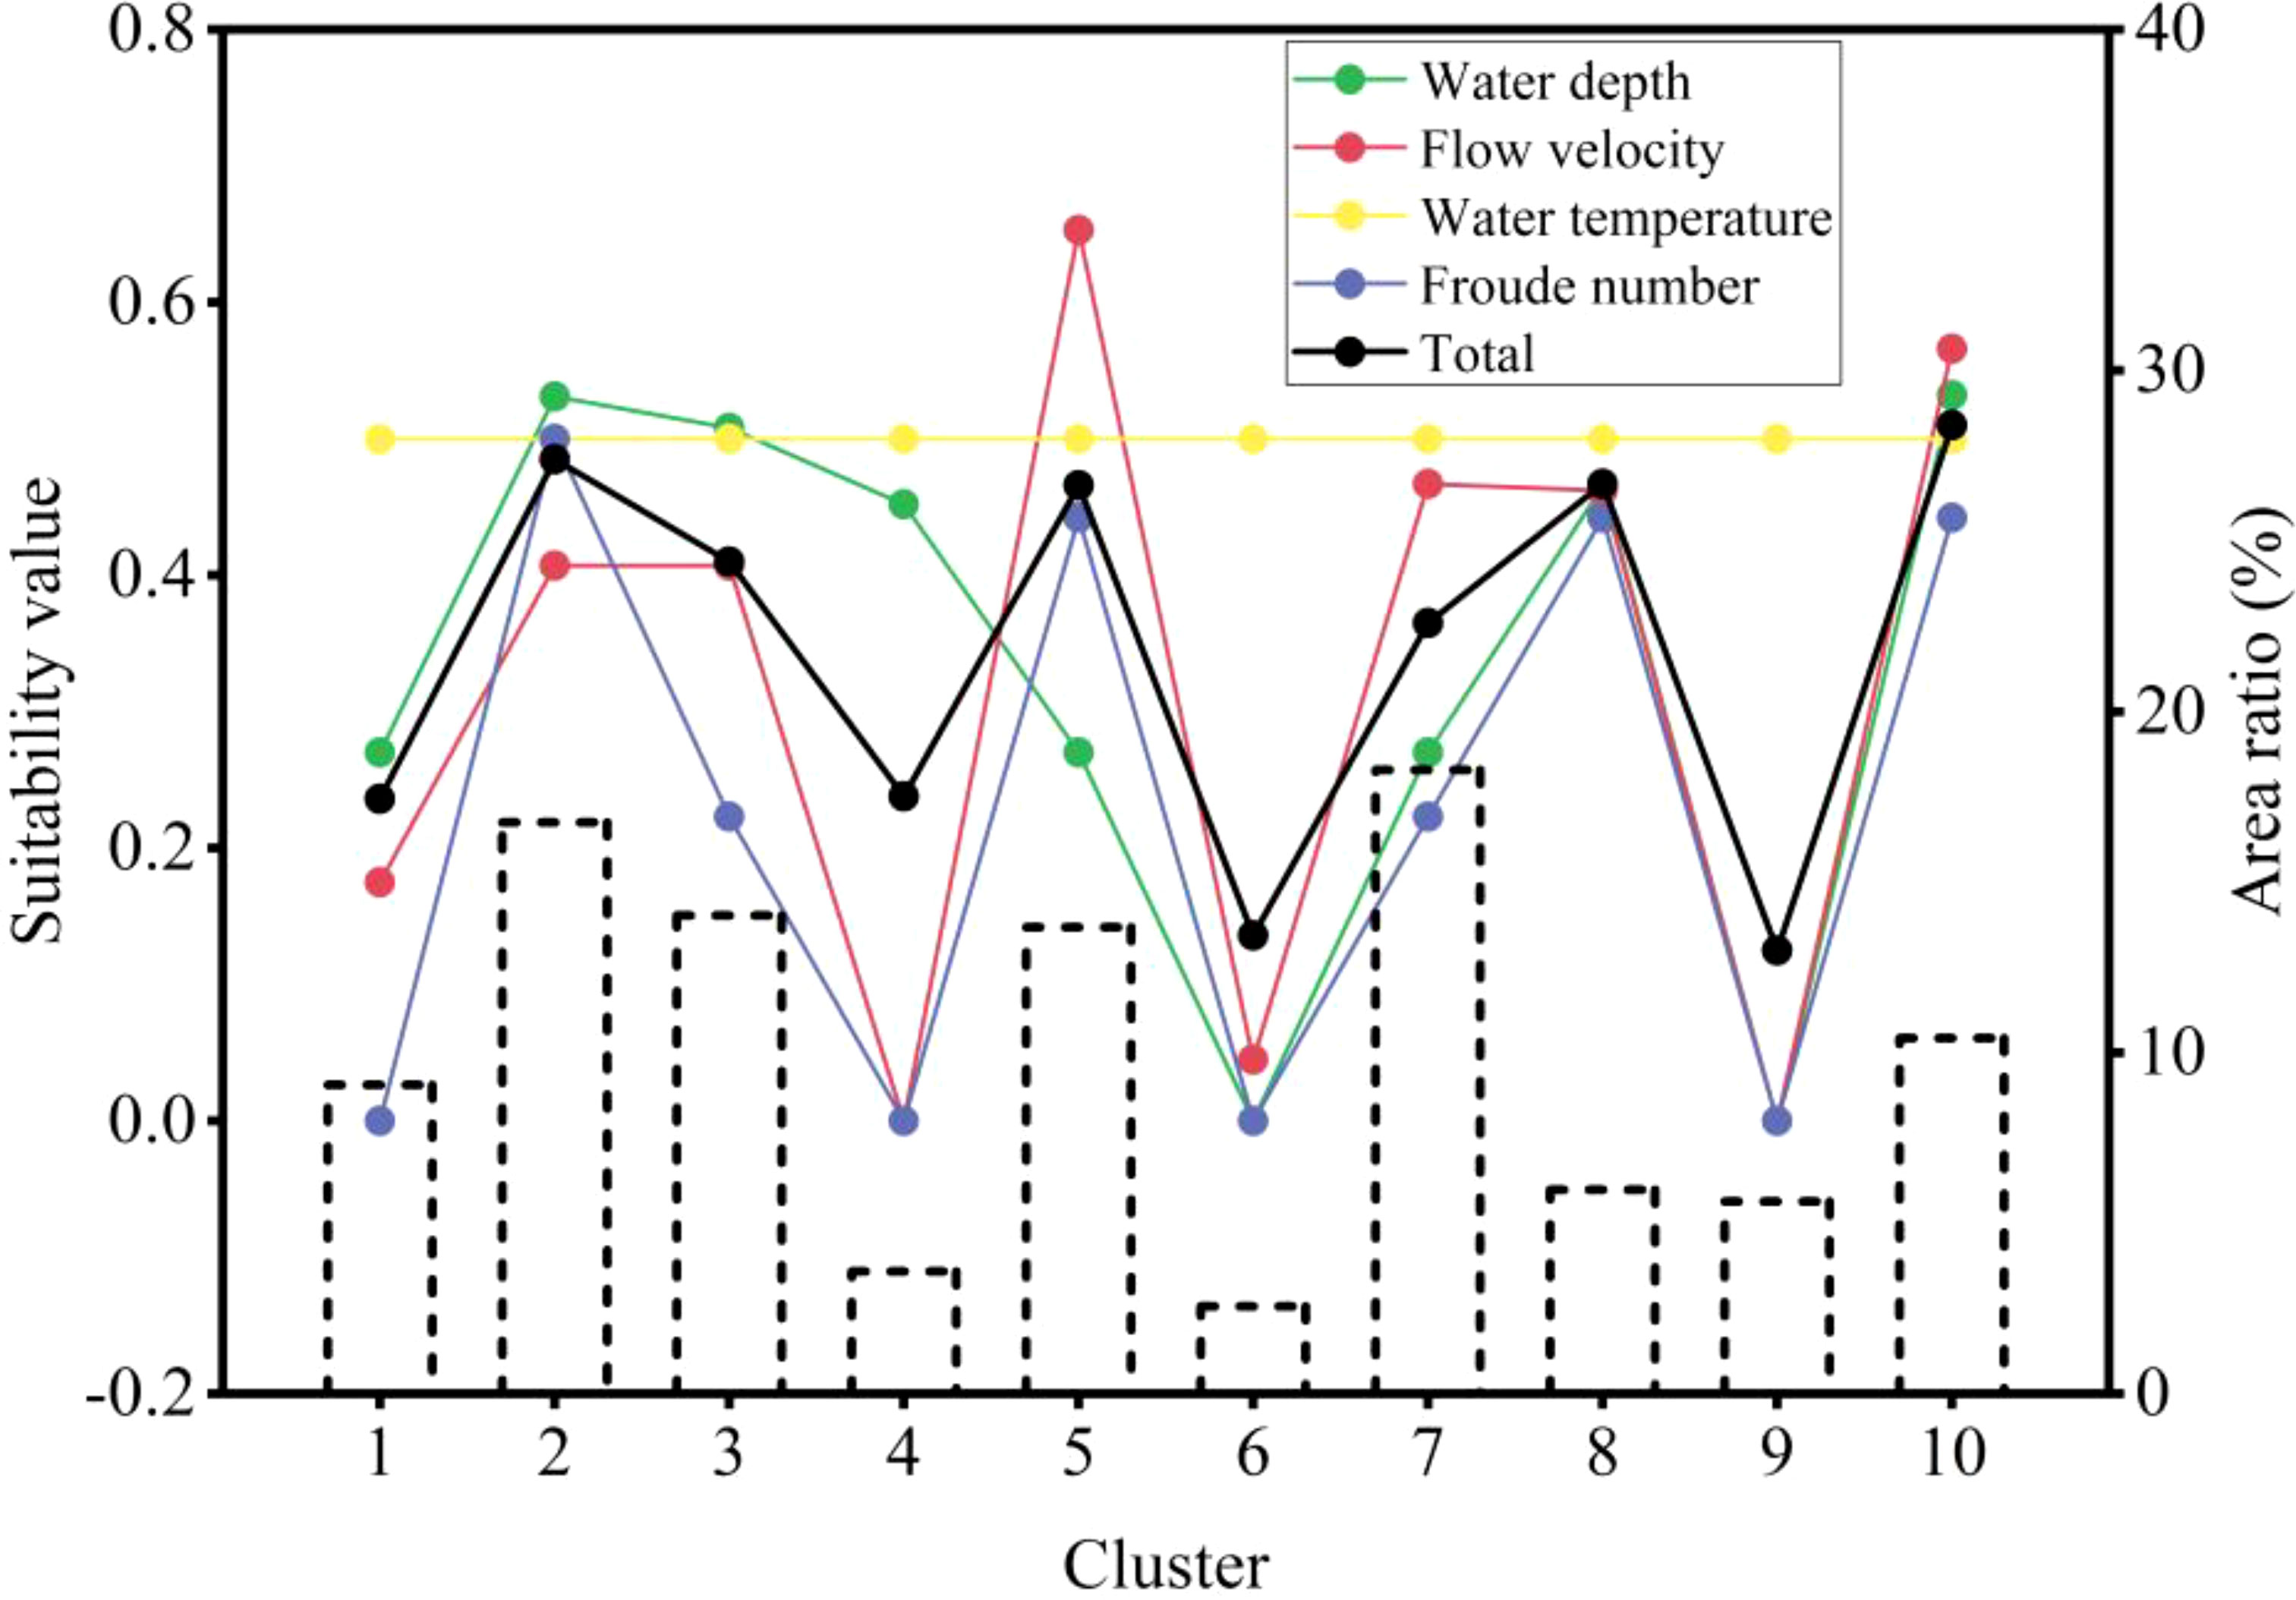
Figure 10 Suitability values and Area ratio of each cluster. The line chart uses the left ordinate. The histogram uses the ordinate on the right. The line chart shows the suitability values of water depth, flow velocity, water temperature, Froude number, and total for ten clusters of spawning grounds. The histogram represents the area proportion (%) of ten clusters.
Curved section I and straight section II yielded the highest suitability cluster values among the different river shapes, accounting for 95% and 81.15% of the total area, respectively (see Table 5). A comparison between upstream curved section IV and straight section V indicated that these two river sections are characterized by deep pools and large vertical water depth changes. Additionally, highly suitable areas were mainly distributed in areas near both riverbanks. For example, cluster 5 was mainly distributed on the left bank of curved section I and straight section II; cluster 8 was mainly distributed on the right bank of straight section II; cluster 10 was mainly distributed on the right bank of curved section I and straight section II. In the study area, Asian carp spawning grounds are likely to be distributed near both riverbanks of curved section I and straight section II. By comparing the suitability values of the different areas, spawning suitability was significantly higher in specific six areas (Figure 11). These six areas were as follows: the concave bank of curved section IV, the tributary confluence of branched section III, the junction of straight section II and branched section III, the right bank of straight section II, the concave bank of curved section I, and the right bank of curved section I. Therefore, these six areas are likely to be Asian carp spawning grounds.
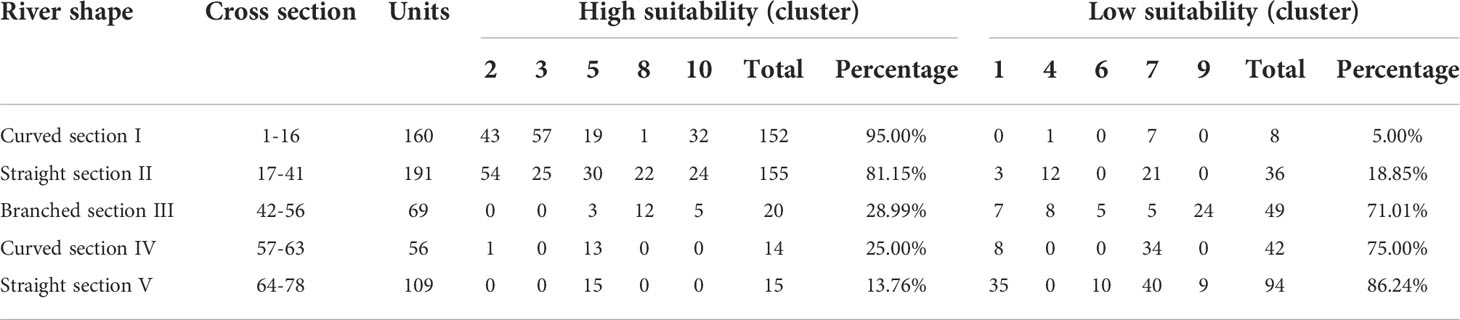
Table 5 Suitability values of the different river shapes.
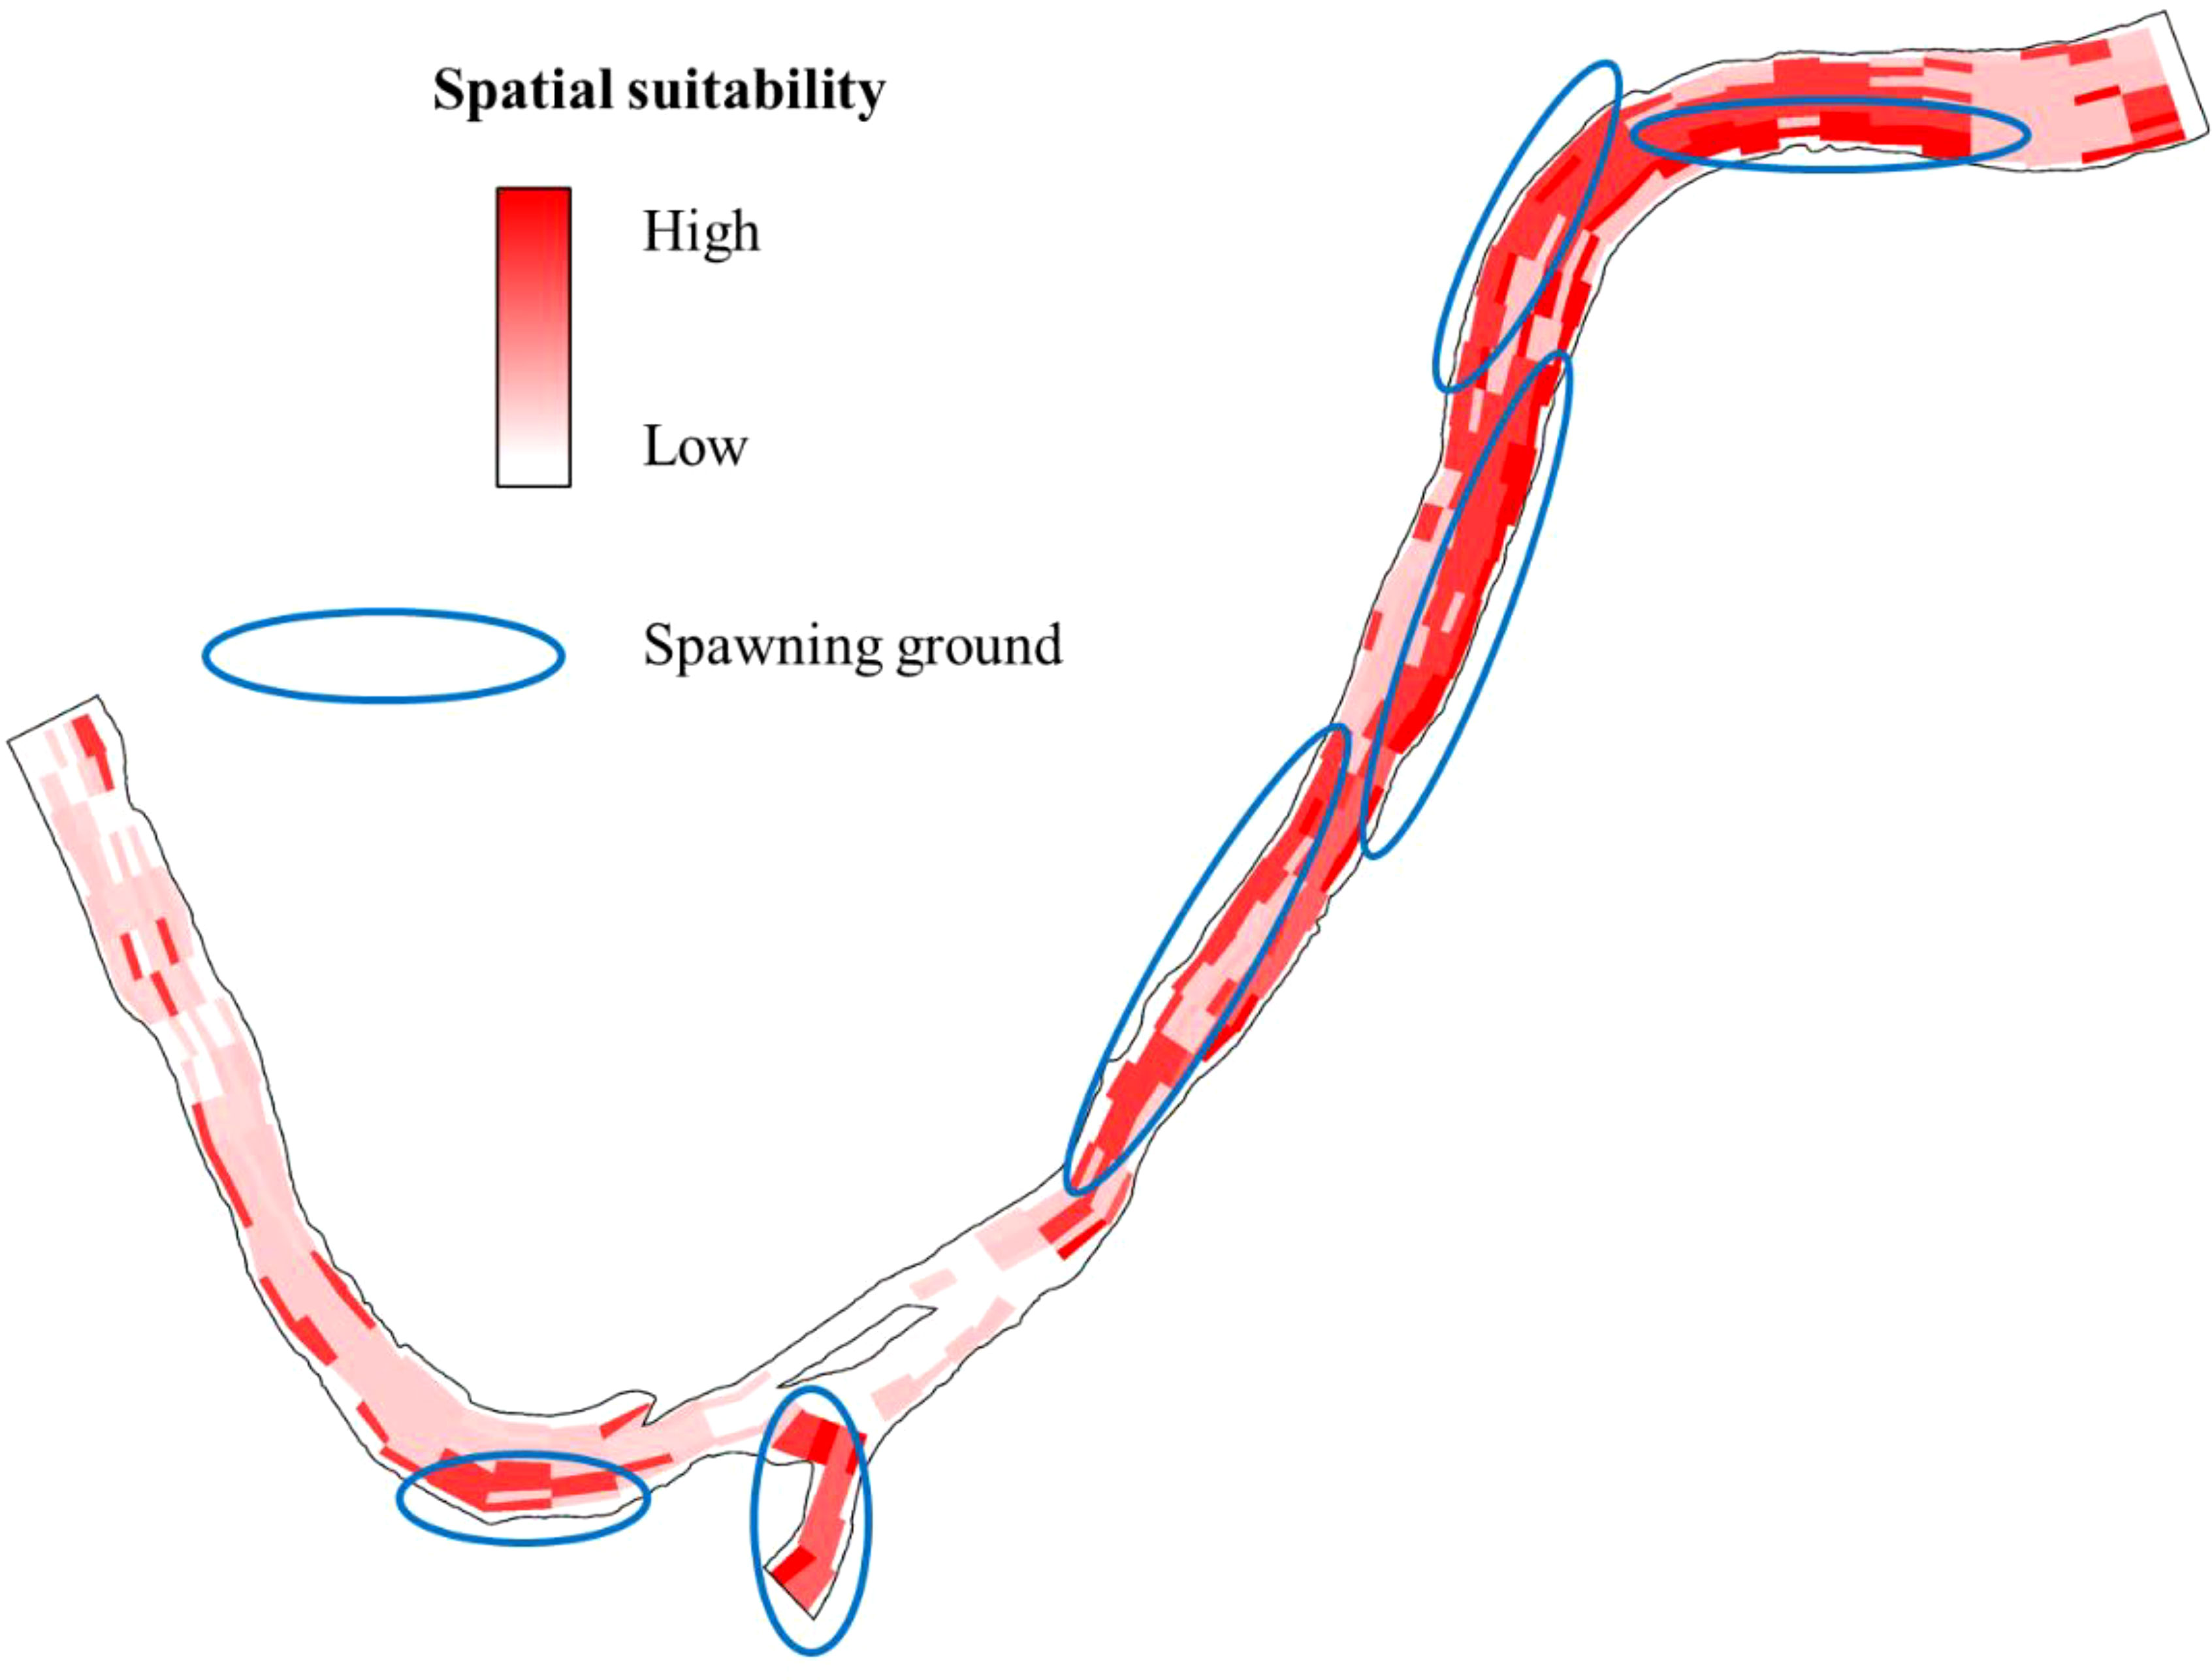
Figure 11 Spatial suitability distribution map of Asian carp spawning activities.
4 Conclusions
Hydrologic and hydrodynamic factors have an important influence on fish spawning. This study measured hydrologic and hydrodynamic data of Asian carp that spawn in the Dongta spawning reach. In total, 78 sections were measured, and 585 measurement points were selected, where water depth, flow velocity, water temperature, and Froude number data were taken at each measurement point. The 585 measurement points were classified into 10 clusters based on similarity using the cluster analysis method. The hydrologic and hydrodynamic characteristics of each cluster differed, while spatial distribution characteristics of each cluster also differed. Suitability values of each influencing factor and the total suitability of each class cluster were calculated by comparing hydrologic and hydrodynamic factor demands during the fish spawning period. A high suitability value means that hydrologic and hydrodynamic clustering conditions are suitable for fish spawning and reproduction. Thus, potential Asian carp spawning grounds can be determined. Results from this study showed that six potential Asian carp spawning grounds were found based on their spatial suitability. In addition, we found that the high suitability area of Asian carp spawning accounted for 61% in the Dongta spawning reach. In the future, we will use hydrodynamic model to simulating the changes of hydrologic (water temperature) and hydrodynamic (water depth, flow velocity, and Froude number) factors under different runoff and reservoir operation strategies. The area of high suitability area in the river was maintained through ecological regulation during the spawning period of Asian carp. The aim of this study was to provide technical support for accurately locating Asian carp spawning grounds. Furthermore, this study offers a reference for locating spawning grounds of Asian carp.
Data availability statement
The raw data supporting the conclusions of this article will be made available by the authors, without undue reservation.
Author contributions
HZ conceived the work, performed the analysis and wrote the manuscript. ZX and YZ discussed the results. CY and XH provided guidance on the overall direction of the work. All authors reviewed the manuscript and approved the submitted version.
Funding
This study was supported by the National Key R&D Program of China (no. 2017YFC0405900) and the National Natural Science Foundation of China (no. 51909036; 51979042; 51709045).
Conflict of interest
The author claims that the submitted work has not been published or accepted for publication or considered for publication elsewhere. Whether in whole or in large part, the work complies with the legal requirements of the host country, including those relating to protection and benefits, and the journal’s policy on these matters. All authors and relevant institutions have read the submission version of the manuscript and approved the submission of the manuscript, and all persons with authorship have been included.
The remaining authors declare that the research was conducted in the absence of any commercial or financial relationships that could be constructed as a potential conflict of interest.
Publisher’s note
All claims expressed in this article are solely those of the authors and do not necessarily represent those of their affiliated organizations, or those of the publisher, the editors and the reviewers. Any product that may be evaluated in this article, or claim that may be made by its manufacturer, is not guaranteed or endorsed by the publisher.
References
Alrabeei S., Subbey S., Gundersen S., Gjoaeter H. (2021). Spatial and temporal patterns of capelin (Mallotus villosus) spawning sites in the barents Sea. Fish. Res. 244, 106117. doi: 10.1016/j.fishres.2021.106117
Baumgartner L. J., Conallin J., Wooden I., Campbell B., Gee R., Robinson W. A., et al. (2014). Using flow guilds of freshwater fish in an adaptive management framework to simplify environmental flow delivery for semi-arid riverine systems. Fish. Fish. 15 (3), 410–427. doi: 10.1111/faf.12023
Boavida I., Jesus J. B., Pereira V., Santos C., Lopes M., Cortes R. M. V. (2018). Fulfilling spawning flow requirements for potamodromous cyprinids in a restored river segment. Sci. Total Environ. 635, 567–575. doi: 10.1016/j.scitotenv.2018.04.167
Boucek R. E., Leone E., Bickford J., Walters-Burnsed S., Lowerre-Barbieri S. (2017). More than just a spawning location: Examining fine scale space use of two estuarine fish species at a spawning aggregation site. Front. Mar. Sci. 4. doi: 10.3389/fmars.2017.00355
Cai Y. P., Yang Z., Xu W. (2017). Effect of water temperature variation after impoundment of the three gorges reservoir on natural reproduction of the four major Chinese carps. Adv. Eng. Sci. 49 (1), 70–77. doi: 10.15961/j.jsuese.2017.01.009
Chen Q., Zhang J., Chen Y., Mo K. L., Wang J., Tang L., et al. (2021). Inducing flow velocities to manage fish reproduction in regulated rivers. Engineering 7 (2), 178–186. doi: 10.1016/j.eng.2020.06.013
Coulter A. A., Keller D., Amberg J. J., Bailey E. J., Goforth R. R. (2013). Phenotypic plasticity in the spawning traits of bigheaded carp (Hypophthalmichthys spp.) in novel ecosystems. Freshw. Biol. 58 (5), 1029–1037. doi: 10.1111/fwb.12106
Coulter A. A., Keller D., Bailey E. J., Goforth R. R. (2016). Predictors of bigheaded carp drifting egg density and spawning activity in an invaded, free-flowing river. J. Great Lakes Res. 42 (1), 83–89. doi: 10.1016/j.jglr.2015.10.009
Crowder D. W., Diplas P. (2002). Vorticity and circulation: Spatial metrics for evaluating flow complexity in stream habitats. Can. J. Fish. Aquat. Sci. 59 (4), 633–645. doi: 10.1139/f02-037
Davies D. L., Bouldin D. W. (1979). “A cluster separation measure,” in IEEE transactions on pattern analysis and machine intelligence, Vol. 1. 224–227. doi: 10.1109/TPAMI.1979.4766909
DeCelles G. R., Martins D., Zemeckis D. R., Steven X. C. (2017). Using fishermen’s ecological knowledge to map Atlantic cod spawning grounds on georges bank. ICES J. Mar. Sci. 74 (6), 1587–1601. doi: 10.1093/icesjms/fsx031
Deters J. E., Chapman D. C., McElroy B. (2013). Location and timing of Asian carp spawning in the lower Missouri river. Environ. Biol. Fish. 96 (5), 617–629. doi: 10.1007/s10641-012-0052-z
Ekau W., Auel H., Pörtner H. O., Gilbert D. (2010). Impacts of hypoxia on the structure and processes in pelagic communities (zooplankton, macro-invertebrates and fish). Biogeosciences 7 (5), 1669–1699. doi: 10.5194/bg-7-1669-2010
Embke H. S., Kocovsky P. M., Garcia T., Christine M. M., Song S. Q. (2019). Modeling framework to estimate spawning and hatching locations of pelagically spawned eggs. Can. J. Fish. Aquat. Sci. 76 (4), 597–607. doi: 10.1139/cjfas-2018-0047
Embke H. S., Kocovsky P. M., Richter C. A., Jeremy J. P., Christine M. M., Song S. Q. (2016). First direct confirmation of grass carp spawning in a great lakes tributary. J. Great Lakes Res. 42 (4), 899–903. doi: 10.1016/j.jglr.2016.05.002
Fuji T., Kurita Y., Suyama S., Daisuke A. (2020). Estimating the spawning ground of pacific saury Cololabis saira by using the distribution and geographical variation in maturation status of adult fish during the main spawning season. Fish. Oceanogr. 30 (4), 382–396. doi: 10.1111/fog.12525
Gillenwater D., Granata T., Zika U. (2006). GIS-based modeling of spawning habitat suitability for walleye in the Sandusky river, Ohio, and implications for dam removal and river restoration. Ecol. Eng. 28 (3), 311–323. doi: 10.1016/j.ecoleng.2006.08.003
Górski K., Van den Bosch L. V., Van de Wolfshaar K. E., Middelkoop H., Nagelkerke L. A. J., Filippov O. V., et al. (2012). Post-damming flow regime development in a large lowland river (Volga, Russian federation): Implications for floodplain inundation and fisheries. River Res. Appl. 28 (8), 1121–1134. doi: 10.1002/rra.1499
Hayer C. A., Bayless M. F., Richter C. A., George A. E., Chapman D. C. (2021). Grass carp reproduction in small tributaries of Truman reservoir, Missouri: Implications for establishment in novel habitats. North Am. J. Fish. Manage. doi: 10.1002/nafm.10670
Jain A. K. (2010). Data clustering: 50 years beyond K-means. Pattern recognit. Lett. 31 (8), 651–666. doi: 10.1007/978-3-540-87479-9_3
Kemp P., Sear D., Collins A., Naden P., Jones I. (2011). The impacts of fine sediment on riverine fish. Hydrol. process. 25 (11), 1800–1821. doi: 10.1002/hyp.7940
Koonsanit K., Jaruskulchai C., Eiumnoh A. (2012). Determination of the initialization number of clusters in K-means clustering application using co-occurrence statistics techniques for multispectral satellite imagery. Int. J. Inf. Electron. Eng. 2 (5), 785–789. doi: 10.7763/IJIEE.2012.V2.208
Langangen Ø., Ottersen G., Ciannelli L., Vikebø F. B., Stige L. C. (2016). Reproductive strategy of a migratory fish stock: Implications of spatial variations in natural mortality. Can. J. Fish. Aquat. Sci. 73 (12), 1742–1749. doi: 10.1139/cjfas-2015-0321
Li M., Gao X., Yang S., Duan Z., Cao W., Liu H. (2013). Effects of environmental factors on natural reproduction of the four major Chinese carps in the Yangtze river, China. Zool. Sci. 30 (4), 296–303. doi: 10.2108/zsj.30.296
Liu Q. F., Lai Z. N., Liu E. C., Wu Z., Gao Y. (2022). Studies on influencing factors of phytoplankton functional groups composition and ecological status of the dongta spawning grounds in the pearl river, China. Appl. Ecol. AND Environ. Res. 20 (2), 1477–1501.
Li J., Xia Z. Q., Wang Y. S., Zheng Q. (2010). Study on river morphology and flow characteristics of four major Chinese carps spawning grounds in the middle reach of the Yangtze river. J. Sichuan Univ. (Eng Sci. Edition) 42, 63–70. doi: 10.1590/S0100-83582011000500002
MacQueen J. (1967). “Some methods for classification and analysis of multivariate observations,” in In Proceedings of the fifth Berkeley symposium on mathematical. Stat and Prob. 1, 281–297.
Miesner A. K., Brune S., Pieper P., Koul V., Baehr J., Schrum C. (2022). Exploring the potential of forecasting fish distributions in the north East Atlantic with a dynamic earth system model, exemplified by the suitable spawning habitat of blue whiting. Front. Mar. Sci. 8, 777427. doi: 10.3389/fmars.2021.777427
Moir H. J., Gibbins C. N., Soulsby C., Webb J. H. (2006). Discharge and hydraulic interactions in contrasting channel morphologies and their influence on site utilization by spawning Atlantic salmon (Salmo salar). Can. J. Fish. Aquat. Sci. 63 (11), 2567–2585. doi: 10.1139/f06-137
Nilsson C., Reidy C. A., Dynesius M., Revenga C. (2005). Fragmentation and flow regulation of the world's large river systems. Science 3085720, 405–408. doi: 10.1126/science.1107887
Quinones R. M., Grantham T. E., Harvey B. N., Kiernan J. D., Klasson M., Wintzer A. P., et al. (2015). Dam removal and anadromous salmonid (Oncorhynchus spp.) conservation in California. Rev. Fish. Biol. Fish. 25 (1), 195–215. doi: 10.1007/s11160-014-9359-5
Sabetian A., Zhang J., Campbell M., Walter R., Allen H., Reid M., et al. (2021). Fish nearshore habitat-use patterns as ecological indicators of nursery quality. Ecol. Indic. 131, 108225. doi: 10.1016/j.ecolind.2021.108225
Schiemer F., Keckeis H., Kamler E. (2002). The early life history stages of riverine fish: ecophysiological and environmental bottlenecks. Comparative Biochemistry and Physiology Part A: Molecular & Integrative Physiology 133, 3, 439–449. doi: 10.1016/S1095-6433(02)00246-5
Sitompul B. J. D., Sitompul O. S., Sihombing P. (2019). “Enhancement clustering evaluation result of davies-bouldin index with determining initial centroid of k-means algorithm,” in In Journal of Physics: Conference Series, Vol. 1235. 012–015. doi: 10.1088/1742-6596/1235/1/012015
Sparks M. M., Falke J. A., Quinn T. P., Adkison M. D., Schindler D. E., Bartz K., et al. (2019). Influences of spawning timing, water temperature, and climatic warming on early life history phenology in western Alaska sockeye salmon. Can. J. Fish. Aquat. Sci. 76 (1), 123–135. doi: 10.1139/cjfas-2017-0468
Stuart I. G., Sharpe C. P. (2020). Riverine spawning, long distance larval drift, and floodplain recruitment of a pelagophilic fish: A case study of golden perch (Macquaria ambigua) in the arid darling river, Australia. Aquat. Conserv.: Mar. Freshw. Ecosyst. 30 (4), 675–690. doi: 10.1002/aqc.3311
Survey Team of Spawning Grounds of Domestic Fishes in Changjiang River (1982). A survey on the spawning grounds of the “four famous Chinese carps” in the changjiang river after dammed by the key water control project at gezhouba. J. Fish. China 6 (4), 287–305.
Wang Y., Zhang N., Wang D., Wu J. (2020). Impacts of cascade reservoirs on Yangtze river water temperature: Assessment and ecological implications. J. Hydrol. 590, 125240. doi: 10.1016/j.jhydrol.2020.125240
Wan D., Xie H., Yang F., Shi Y., Ma X. (2018). “Ecological operation objectives for four major Chinese carps spawning in the xijiang river,” in In MATEC Web of Conferences. EDP Sciences, Vol. 246. 01067. doi: 10.1051/matecconf/201824601067
Winfield I. J., van Rijn J., Valley R. D. (2015). Hydroacoustic quantification and assessment of spawning grounds of a lake salmonid in a eutrophicated water body. Ecol. Inf. 30, 235–240. doi: 10.1016/j.ecoinf.2015.05.009
Yi B., Liang Z., Yu Z., Lin R., He M. (1988a). “A comparative study on the early development of grass carp, black carp, silver carp, and big head of the Yangtze river,” in Gezhouba water control project and four famous fishes in Yangtze river (Wuhan, China: Hubei Science and Technology Press), 111–135.
Yi Y., Sun J., Zhang S. (2016). A habitat suitability model for Chinese sturgeon determined using the generalized additive method. J. hydrol. 534, 11–18. doi: 10.1016/j.jhydrol.2015.12.055
Yi Y., Wang Z., Yang Z. (2010). Impact of the gezhouba and three gorges dams on habitat suitability of carps in the Yangtze river. J. Hydrol. 387 (3-4), 283–291. doi: 10.1016/j.jhydrol.2010.04.018
Yi B., Yu Z., Liang Z., Shen S. (1988b). “The distribution, natural conditions, and breeding production of the spawning ground of four famous freshwater fishes on the main stream of the Yangtze river,” in In proceedings of the 4th Chinese oceanological and limnological science conference (Beijing (China: Science press), 181–190.
Yu L., Lin J., Chen D., Duan X., Peng Q., Liu S. (2018). Ecological flow assessment to improve the spawning habitat for the four major species of carp of the Yangtze river: A study on habitat suitability based on ultrasonic telemetry. Water 10 (5), 600. doi: 10.3390/w10050600
Zhou Z., Deng Y., Li Y., An R. (2019). The ecological water demand of schizothorax in Tibet based on habitat area and connectivity. Int. J. Environ. Res. Public Health 16 (17), 3045. doi: 10.3390/ijerph16173045
Keywords: hydrologic factor, hydrodynamic factor, spawning ground, location, spatial clustering
Citation: Zhou H, Yu C, Xu Z, Zheng Y and Hou X (2022) Spatial suitability evaluation of spawning reach revealing the location preference for fish producing drifting eggs. Front. Mar. Sci. 9:947908. doi: 10.3389/fmars.2022.947908
Received: 19 May 2022; Accepted: 17 August 2022;
Published: 06 September 2022.
Edited by:
Tian Xie, Beijing Normal University, ChinaReviewed by:
P. Ryan Jackson, United States Geological Survey (USGS), United StatesYali Zhang, Chinese Academy of Sciences (CAS), China
Copyright © 2022 Zhou, Yu, Xu, Zheng and Hou. This is an open-access article distributed under the terms of the Creative Commons Attribution License (CC BY). The use, distribution or reproduction in other forums is permitted, provided the original author(s) and the copyright owner(s) are credited and that the original publication in this journal is cited, in accordance with accepted academic practice. No use, distribution or reproduction is permitted which does not comply with these terms.
*Correspondence: Chunxue Yu, eXVjeEBkZ3V0LmVkdS5jbg==; Xiaoshu Hou, aG91eHNAY2FlcC5vcmcuY24=