 Yanxu Sun1,2
 Seok-Hyun Youn3
 Hyun Joo Oh3
 Hui-Tae Joo3
 Yejin Kim1
 Jae Joong Kang1
 Dabin Lee1
 Kwanwoo Kim1
 Hyo Keun Jang1
 Naeun Jo1
 Mi Sun Yun4
 Linhe Sun5
 Sang Heon Lee1*
- 1Department of Oceanography, Pusan National University, Busan, South Korea
- 2Graduate School of Environmental Science, Hokkaido University, Sapporo, Japan
- 3Oceanic Climate & Ecology Research Division, National Institute of Fisheries Science, Busan, South Korea
- 4Institute for Advanced Marine Research, China University of Geosciences, Guangzhou, China
- 5Institute of Botany, Jiangsu Province and Chinese Academy of Sciences (Nanjing Botanical Garden Mem. Sun Yat-Sen), Nanjing, China
The spatial and temporal environmental conditions in the southern coastal waters of Korea (SCWK) as a complex area, which is influenced by both ocean currents and anthropogenic nutrient inputs, are highly variable. The impacts of environmental factors on the distribution of phytoplankton community structure in the SCWK remain unclear. Based on high-performance liquid chromatography (HPLC) analysis of a variety of photosynthetic pigments, spatial and temporal variations in phytoplankton community compositions were investigated in the SCWK. Cluster analysis, correlation analysis, and generalized additive models (GAMs) were used to explore the major phytoplankton groups and their response patterns to temperature, salinity, depth, and macronutrients. The results indicated that diatoms were the absolute dominant groups in the SCWK for all seasons, especially in cold seasons. Diatoms mainly concentrated at 1% light depths, while high chlorophyll-a concentrations (>3 µg/L) occurred at 100% and 30% light depths with good light conditions. Both clustering and correlation analyses showed that diatoms had a strong positive correlation with macronutrients such as dissolved inorganic nitrogen (DIN), dissolved inorganic phosphate (DIP), and dissolved silica (DSi). The temperature and salinity discrepancy between surface and bottom layers in summer caused a strong water stratification resulting in blocking nutrient-rich bottom water upwelling and leading cyanobacteria to become the dominant groups at 100% and 30% light depths in summer. Consistently, the cyanobacteria were highly associated with high temperature and low salinity in the correlation analysis and GAM results. Compared with diatom-predominant sites, cryptophytes and diatom-dominated sites are characterized by higher average excess nitrate (ExN). Further research on the responses of small-sized prokaryotic phytoplankton especially cyanobacteria to environmental variations and their primary production contributions would warrant a better understanding of the SCWK ecosystem.
Introduction
Phytoplankton as primary producers contribute approximately 50% of the global primary production and play a pivotal role in marine food webs as well as in the biogeochemical cycling of aquatic ecosystems (Fehling et al., 2012; Falkowski and Raven, 2013). The distribution of environmental factors has a major impact on phytoplankton composition and abundance (Eppley et al., 1969; Kilham and Hecky, 1988). The growth of phytoplankton is often limited by one or more environmental factors, which has been well established in previous studies (Sommer, 1994; Smayda, 1997; Olsen et al., 2001). One of the research hotspots of phytoplankton is to use the phytoplankton community as a useful indicator to investigate the long-term impact of global warming and the anthropogenic impacts on the marine ecosystem (Boyce et al., 2010; Salmaso et al., 2012; Barton et al., 2016; Ajani et al., 2020).
The southern coastal waters of Korea (SCWK) is a complex system influenced by both ocean currents and anthropogenic nutrient inputs. Nutrients derived from the ocean are mainly inflowed by water masses in different directions, represented by Changjiang diluted water (CDW) from the world’s second largest Changjiang (or Yangtze) river from the south, Yellow Sea Cold Water (YSCW) from the west, and the Kuroshio Water (KW) from the east (Jeong et al., 2001; Affan and Lee, 2004; Min et al., 2012). The Nakdong and Seomjin rivers are the main rivers in the southern coastal area of the Korean Peninsula. Through those rivers, agricultural and industrial water discharged by human activities is also an important source of nutrient inputs for the SCWK (Lee et al., 2018; Baek et al., 2019). In addition, bivalve mollusks (oysters and ark shells) and fish farms in the Nakdong River estuary lead to the accumulation of organic matter in sediments which is also one of the major nutrient sources in the eastern SCWK waters (Baek et al., 2020). Generally, the environmental conditions vary from the eastern part to the western part and from the surface layer to the bottom layer in the SCWK. These various water masses cause heterogeneous and complex environmental characteristics temporally and spatially (Zhang et al., 1996; Baek et al., 2020).
Previous studies on the phytoplankton community usually divided geographically SCWK into the southern waters of the Korean Peninsula (Kang et al., 1999; Baek et al., 2020) and the adjacent waters of Jeju Island (Yoon, 2003; Affan and Lee, 2004; Boopathi et al., 2015; Kim et al., 2019) for a regional comparison. These studies used microscopic methods to mainly analyze the large-cell phytoplankton groups (e.g., diatoms), but small-cell phytoplankton (e.g., cyanobacteria) are usually ignored because it is difficult to fix these cells with standard methods (Mackey et al., 1996). These traditional approaches resulted in the lack of overall understanding of the phytoplankton community and abundance in the SCWK, both in terms of spatial distribution and groups. In terms of time, most previous studies on phytoplankton community structure in the SCWK focused primarily on short-term seasonal variations at the surface layer (Yoon, 2003; Affan and Lee, 2004; Boopathi et al., 2015). To date, no studies have been performed on phytoplankton communities encompassing the entire euphotic zone for all seasons in the SCWK.
Based on pigment analysis through high-performance liquid chromatography (HPLC), this study adopted a new analysis method, 1) investigated four typical phytoplankton groups and their different environmental characteristics in the SCWK by cluster analysis, and then 2) explored how environmental factors influence major phytoplankton distributions by correlation analysis and generalized additive models (GAMs). The major aims of this study were to comprehensively understand the distribution of phytoplankton communities in the SCWK from the temporal and spatial dimensions and to explain mechanistically how seasonal variability in environmental factors impacts phytoplankton community structure in the SCWK ecosystem.
Materials and methods
Sampling sites and water samplings
Twelve cruises were seasonally conducted in the SCWK for four seasons from 2018 to 2020 (Table 1). The sampling sites for these cruises are shown in Figure 1, which cover the southern waters of the Korean Peninsula and the waters around Jeju Island. Water samples (sampling points) for measurements of phytoplankton pigments and physicochemical parameters (temperature, salinity, and major nutrients; DIN, DIP, and DSi) were obtained from three light depths (100%, 30%, and 1% penetration of surface irradiance, PAR), using a CTD/rosette sampler fitted with Niskin bottles. The light depths were determined at each station based on Lambert–Beer’s law. Light depths (30% and 1%) were calculated by a Secchi disk using a vertical attenuation coefficient (Kd = 1.7/Secchi depth) described in Poole and Atkins (1929). The vertical hydrographic measurements (temperature and salinity) were collected using SBE9/11 CTD (Sea-Bird Electronics, Bellevue, WA, USA) sensors.
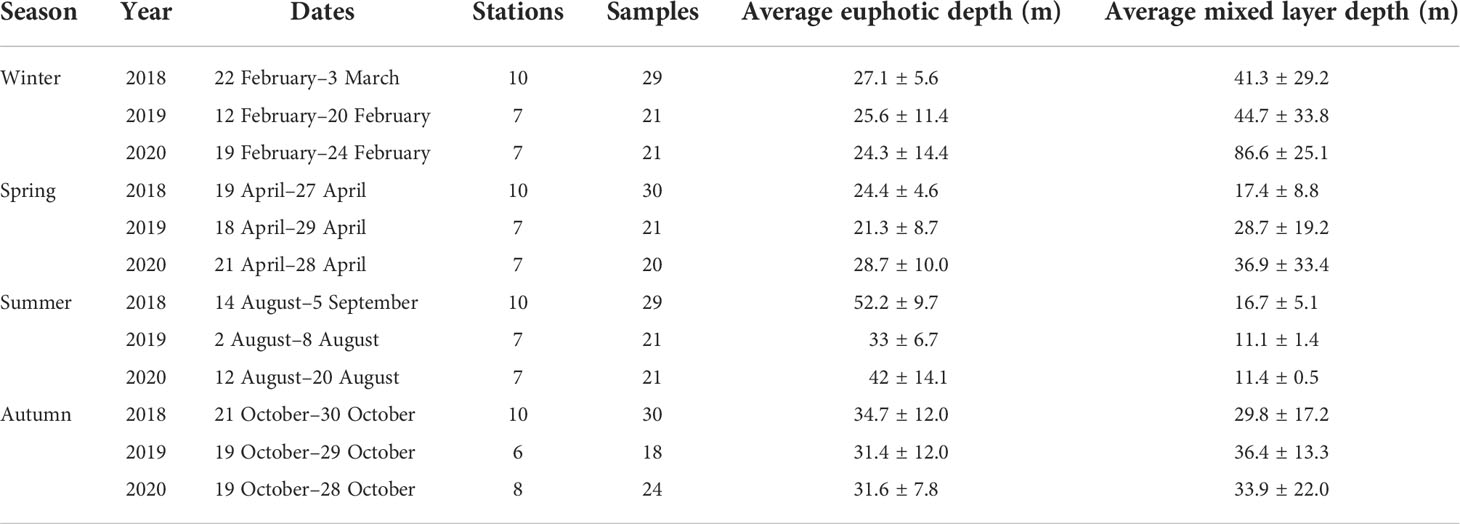
Table 1 Summary of samples collected during each cruise period, 2018–2020.
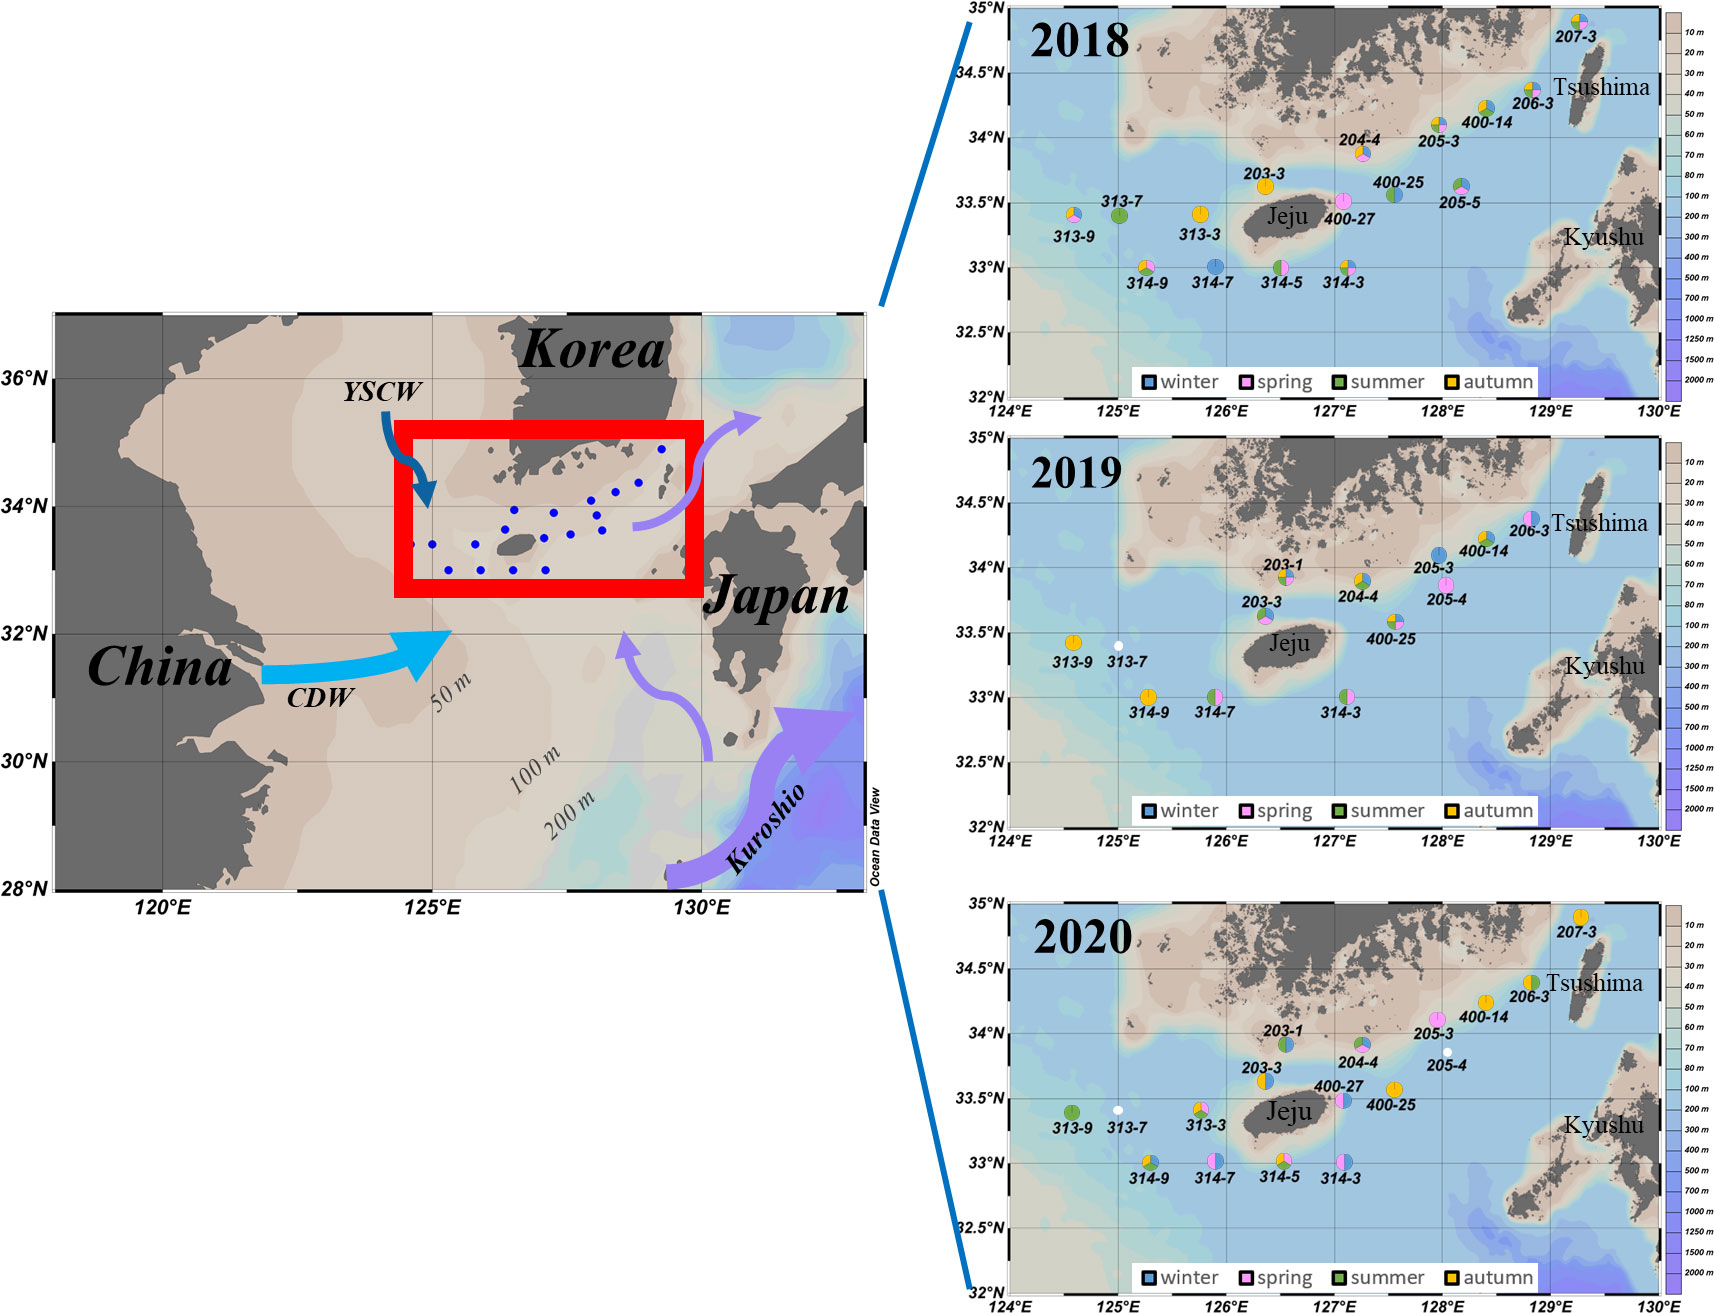
Figure 1 Sampling stations in the southern coastal waters of Korea (SCWK), 2018–2020. The annual sampling sites (right images) were the sum of four cruises in that year. The colors of the sites represented the sampling seasons of that year. Blank indicated missing data.
Water samples for dissolved inorganic nutrients including ammonium (NH4+), nitrate (NOx = NO2− + NO3−), phosphate and silica at the three light depths were obtained from Niskin bottles at all the sampling sites. After the seawater samples were filtered through GF/F filters (Whatman, Maidstone, United Kingdom; 0.7 μm pore), the filtrated samples were transferred into polyethylene bottles which were kept under frozen conditions (−80°C) until analysis. The nutrient concentrations were determined using an automatic analyzer (QuAAtro, Bran+Luebbe, Germany) at the National Institute of Fisheries Science (NIFS), Korea. Dissolved inorganic phosphate (DIP) was PO43-, dissolved silica (DSi) was Si(OH)4, and dissolved inorganic nitrogen (DIN) concentrations were calculated as the sum of NH4+, NO2−, and NO3−. Excess nitrate (ExN) in nutrient samples was calculated using the formula: ExN = DIN − (DIP * R) (Wong et al., 1998), where R is the Redfield N:P ratio of 16 (Redfield, 1934). Density-mixed layer depth (or isopycnal layer depth, MLD) was calculated by a formula described in de Boyer Montégut et al. (2004).
In addition, because water samples were collected from 100%, 30%, and 1% light depths, the average values of environmental parameters and all the nutrients derived from the three different light depths were used in this study for the statistical analysis (Table 3).
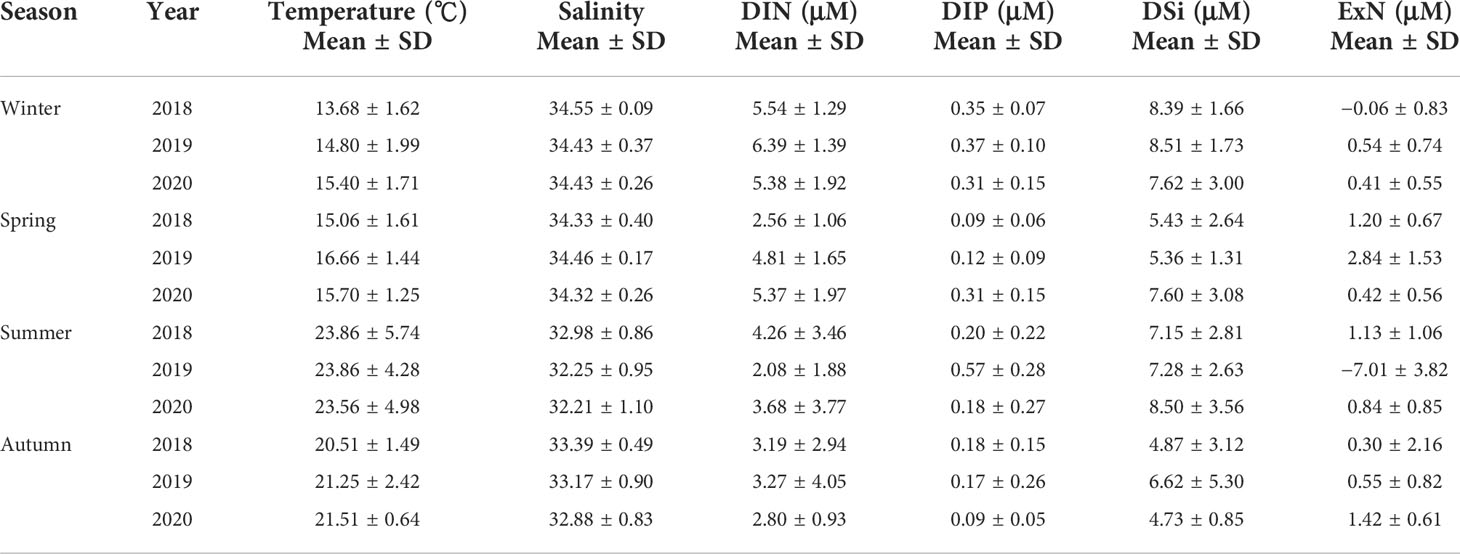
Table 3 Temperature, salinity, and dissolved inorganic nutrient concentrations at the euphotic depths (100%, 30%, and 1%) of the water column in the SCWK, 2018–2020.
Pigment concentrations and CHEMTAX analysis
Samples for phytoplankton pigment concentrations were filtered through 47-mm GF/F filters, stored in a deep freezer (−80°C), and transferred to the home laboratory at Pusan National University, Busan, Korea, immediately after the cruise. Pigments were extracted in 100% acetone (5 ml) with canthaxanthin (100 µl) as an internal standard, and the specific pigment methods are described in Kang et al. (2018) and Kim et al. (2020). Quantification was performed using standards from DHI water (Denmark), and the following pigments were detected and quantified: chlorophyll-a, peridinin (perid), 19′-butanoyloxy-fucoxanthin (19but), fucoxanthin (fuco), 19′-hexanoyloxy-fucoxanthin (19hex), neoxanthin (neo), prasinoxanthin (prasin), violaxanthin (viola), alloxanthin (allo), lutein, zeaxanthin (zea), and chlorophyll-b (chl_b). The concentrations of pigments in the samples were calculated as follows: Concentration = Area × Rf × (Ve/Vs) [µg L−1], where Rf (standard response factor) was calculated based on the standard pigment and dividing the concentration of the standard by the measured peak area [µg L−1 area−1], Area is the area of the peak [area], Ve is AIS/(peak area of IS added to sample) × (Volume of IS added to sample) [L], Vs is the volume of the filtered water sample [L], AIS is the peak area of IS when 1 ml of IS is mixed with 300 µl of H2O, and IS is the internal standard (canthaxanthin) (Lee et al., 2011).
The input pigment ratio matrix (Table 2) used in the CHEMTAX calculation was based on the Korean Peninsula pigment ratio (Lee et al., 2011). CHEMTAX used an iteration and steepest descent algorithm to find the best fit (minimum residual) of the data to an initial pigment ratio matrix of chlorophyll-a ratios for each phytoplankton community (Mackey et al., 1997). More details on deriving the appropriate proportions of phytoplankton groups from chlorophyll-a, using the CHEMTAX program, are described in detail in our earlier work (Sun et al., 2022).
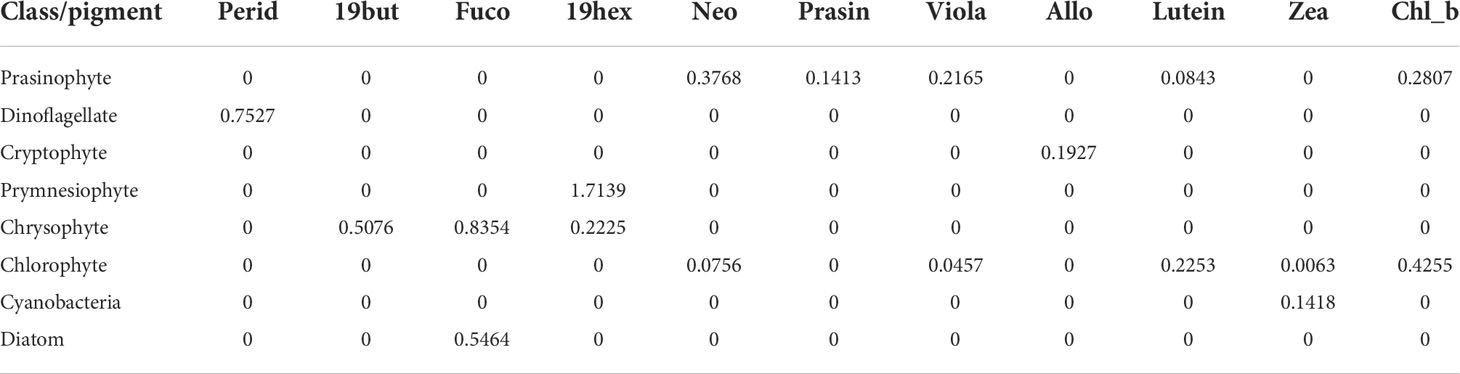
Table 2 Initial pigment ratios to the total chlorophyll-a for eight taxonomic groups based on CHEMTAX analysis.
Statistical analysis
The relative contributions of each phytoplankton group to the total chlorophyll-a in the euphotic zone from 2018 to 2020 were classified by cluster analysis using SPSS (version 24.0). All 285 sampling points were divided into four clusters by k-means cluster iterative algorithm (Pham et al., 2005). After the cluster analysis, we used the average chlorophyll-a concentrations at that site if there were chlorophyll-a concentration data at different times at the same site. Environmental factors (temperature, salinity, depth, DIN, DIP, Si(OH)4, and ExN) and chlorophyll-a concentrations of the four clusters were visualized as raincloud plots (Allen et al., 2021). A correlation matrix (based on Pearson correlation) was also produced between environmental factors and phytoplankton community structure and visualized as a heatmap. The correlation coefficients were divided into three clusters according to hierarchical clustering, and the methods are described in Stefanescu et al. (2021). All statistical analyses were performed using the function “corrplot” in R (Wei, 2016). To determine the effectiveness in addressing the non-linear relationship between response variables (phytoplankton group contributions) and explanatory variables (environmental factors), response curves for GAMs with Gaussian distributions were generated (Hastie and Tibshirani, 1986). The GAM formations were as follows: Y = α + s(X), where Y represents the contribution of three dominant phytoplankton groups, namely, diatoms, cryptophytes, and cyanobacteria, to the total chlorophyll-a; X represents environmental factors; α is the grand mean of dominant phytoplankton group contribution; and s is the smooth function of each parameter. To avoid overfitting, the maximum of basic dimension (k) was constrained within 5. The details of GAMs are described in Sun et al. (2022). The GAM modeling function from the “mgcv” package was used in this study (Wood and Wood, 2015).
Results
Variations of environment factors, phytoplankton biomass, and community structure
The average temperature in the SCWK from 2018 to 2020 was the highest in summer and the lowest in winter and ranged from 23.56°C ± 4.98°C to 23.86°C ± 5.74°C and from 13.68°C ± 1.62°C to 15.40°C ± 1.71°C, respectively. The average salinity was the highest in winter and spring (>34) and the lowest in summer (<33) from 2018 to 2020. Nutrient concentrations showed obviously annual and seasonal differences from 2018 to 2020 for all seasons. DIN and DIP concentrations in winter were higher than those in other seasons, and the average concentrations were over 5 and 0.3 µM, respectively, for DIN and DIP. DIN concentrations in spring 2018 and summer 2019 at 2.56 ± 1.06 and 2.08 ± 1.88 µM, respectively, were lower than those in the same periods of the other 2 years. DIP concentrations were 0.57 ± 0.28 µM in summer 2019, which were significantly (p < 0.05, t-test) higher than those in 2018 and 2020. DSi concentrations in winter and summer were higher than those in spring and autumn, and the average concentrations in winter and summer were all over 7 µM in these 3 years. The average ExN values were all higher than 0 µM except for winter 2018 and summer 2019. The most obvious ExN difference was in the summer periods among the seasons, which were at 1.13 ± 1.06, −7.01 ± 3.82, and 0.84 ± 0.85 µM in 2018, 2019, and 2020, respectively (Table 3).
From 2018 to 2020, the monthly average chlorophyll-a concentrations from 100% to 1% light depths were the highest (>0.9 µg/L) in spring and autumn except spring 2020 and the lowest (<0.5 µg/L) in summer (Figure 2A).
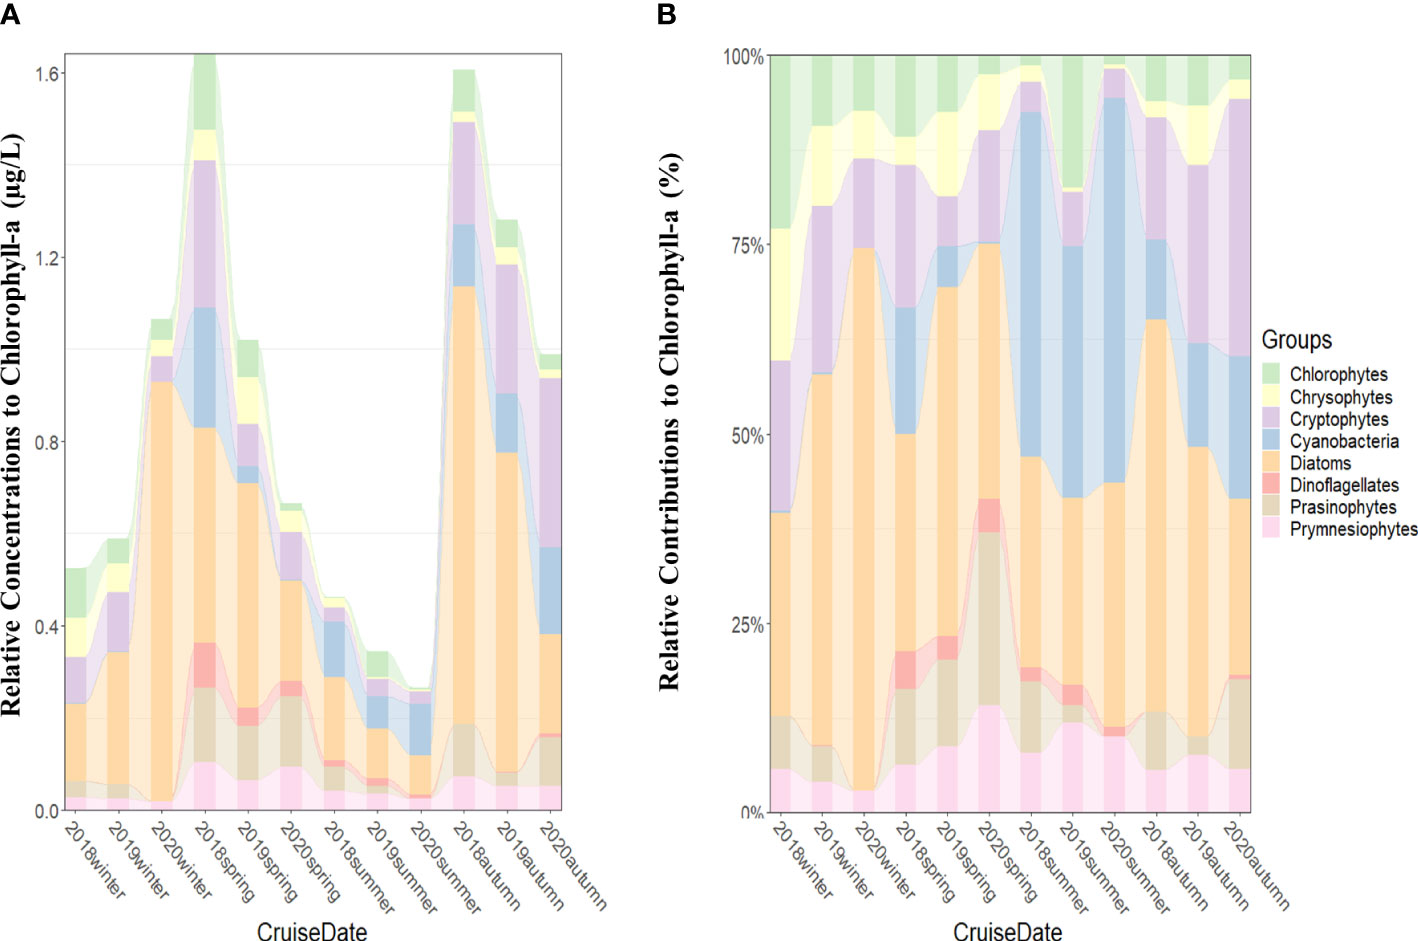
Figure 2 Seasonal phytoplankton groups and chlorophyll-a concentrations (μg/L) (A) and contributions of phytoplankton groups to total chlorophyll-a concentrations (B) averaged from all the stations for each cruise period in the SCWK, 2018–2020.
In terms of average (2018–2020) relative contributions to total chlorophyll-a, diatoms (37.9%), cryptophytes (16.2%), and cyanobacteria (15.2%) were the major taxa. On the other hand, the remaining phytoplankton groups (prasinophytes, chlorophytes, prymnesiophytes, chrysophytes, and dinoflagellates) contributed less than 10% each to total biomass.
Considerable variabilities were found in absolute chlorophyll-a concentrations among seasons throughout the 3 years (Figure 2A). Diatoms were the main dominant groups in all seasons except summer (Figures 2A, B). High chlorophyll-a concentrations (>1.0 µg/L) were observed in winter 2020, and diatom contributions were over 70% (Figures 2A, B). Although diatoms still maintained certain contributions, cyanobacteria replaced diatoms as the dominant groups in the summer of 2018 (45.5% ± 32.2%), 2019 (33.3% ± 25.0%), and 2020 (50.8% ± 35.1%) (Figure 2B). Cryptophytes as one of the main dominant groups were observed in all seasons, and their average contributions in cold winter (averaged 18%) and autumn (averaged 25%) were higher than in summer (averaged 5%) from 2018 to 2020 (Figure 2B). Other phytoplankton groups represented by chlorophytes, chrysophytes, prymnesiophytes, and prasinophytes were not the main dominant groups in SCWK, but they also had considerable contributions to the total chlorophyll-a at some times from 2018 to 2020. The contributions of chlorophytes were 23.0% ± 10.1% in winter 2018 and 17.5% ± 7.5% in summer 2019. Chrysophytes and prasinophytes contributed 17.3% ± 11.2% in winter 2018 and 22.8% ± 2.9% in spring 2020, respectively (Figure 2B). Prymnesiophytes were observed in all seasons and showed a trend of high concentration (averaged 0.09 µg/L) in spring and low concentration (averaged 0.02 µg/L) in winter (Figure 2A).
Relationship between phytoplankton community structure and environmental factors
Cluster I (n = 38) assembled those sampling points where cyanobacteria (69.6% ± 17.0%) were the major contributors to chlorophyll-a, mainly during summertime (Figures 3A, C). Cluster I chlorophyll-a concentrations at the westernmost points (<0.1 µg/L) were relatively lower than those of other points both at 100% and 30% light depths. The average chlorophyll-a concentrations at 30% light depths were higher than those at 100% light depths, and the highest concentrations (>0.3 µg/L) were observed around Jeju Island areas (Figure 3B). From the light depth distribution, cyanobacteria were mainly distributed at 100% light depths (n = 22) and 30% light depths (n = 15) (Figure 3D).
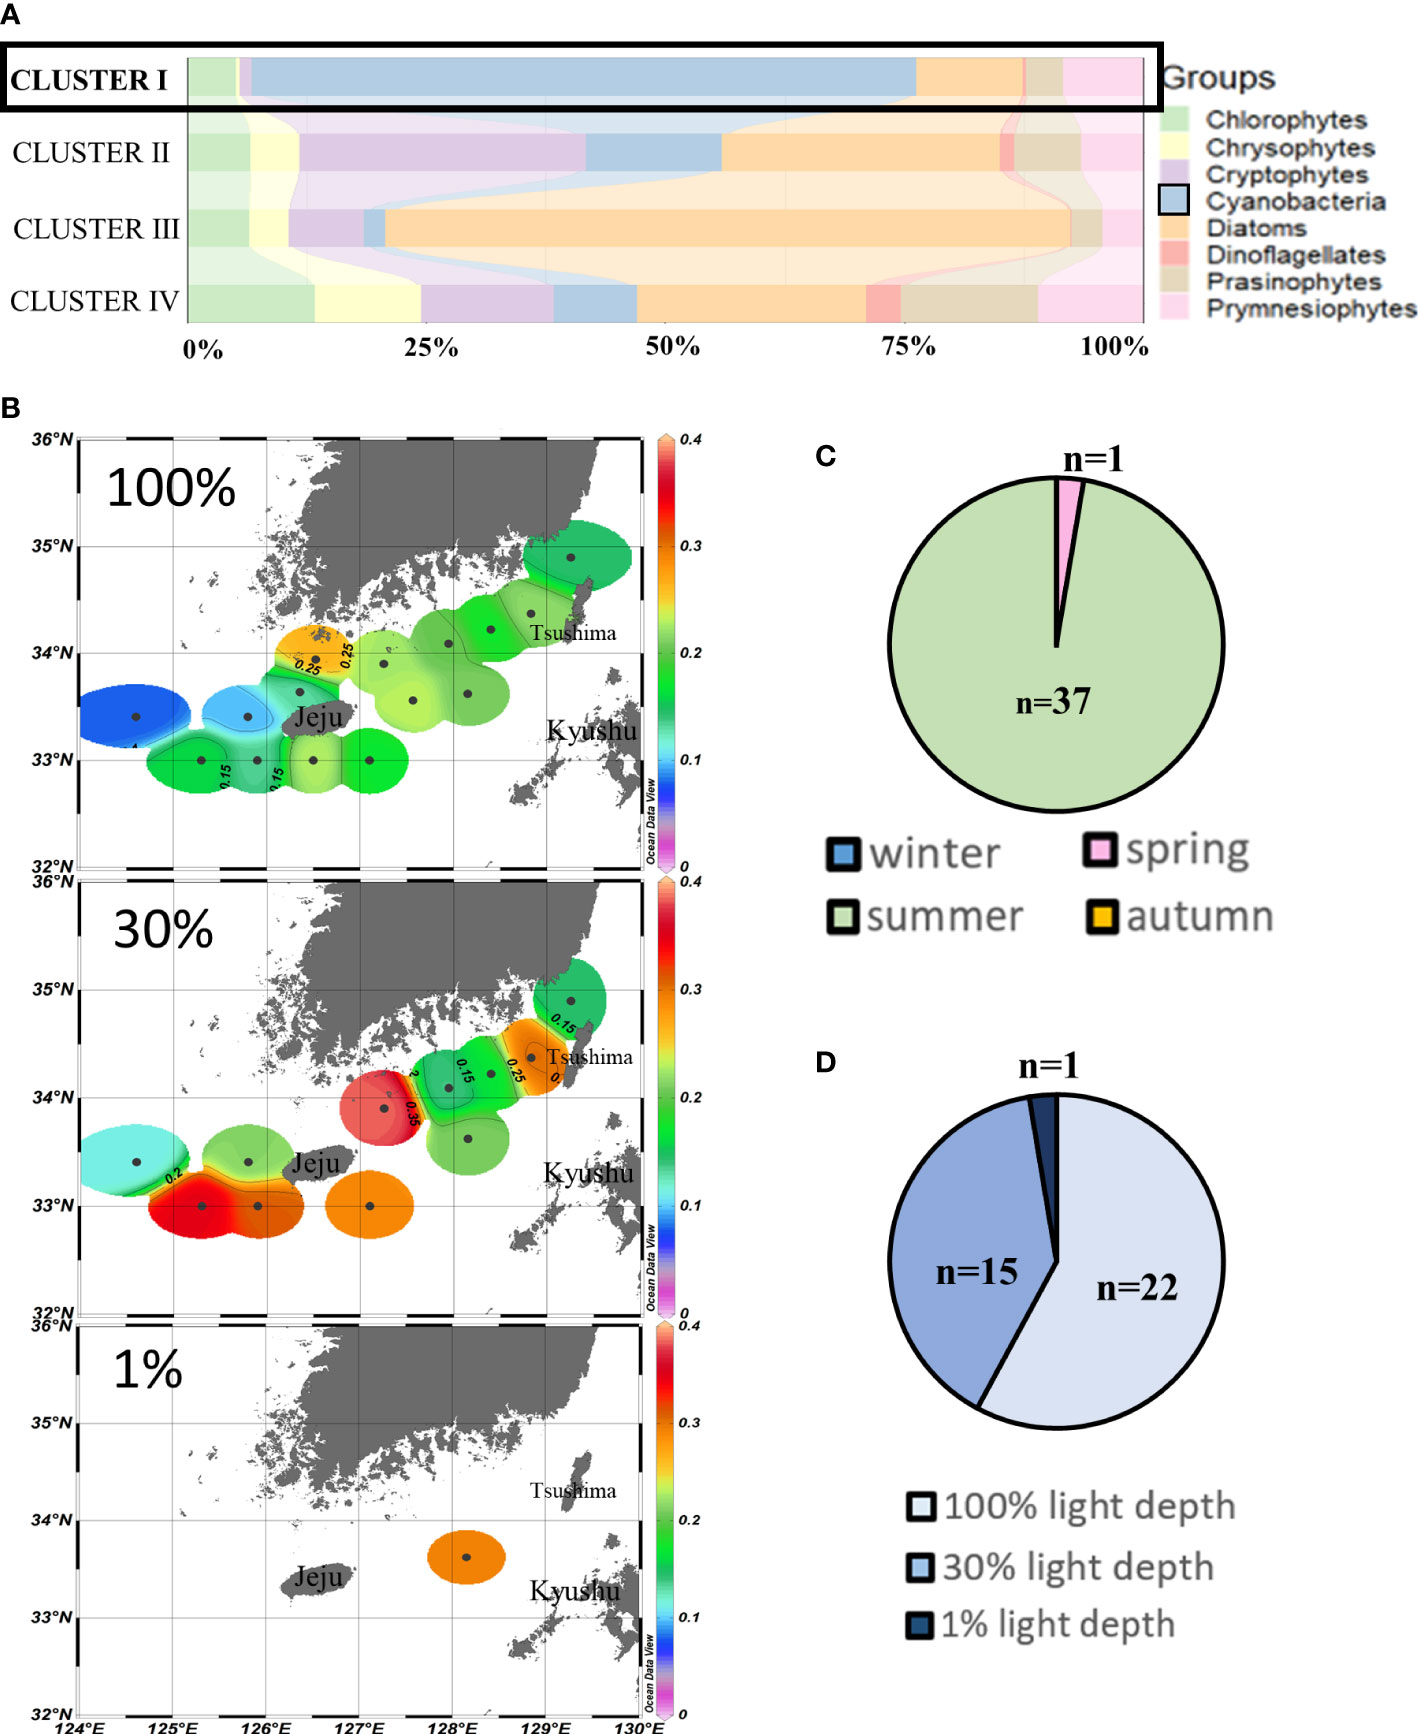
Figure 3 Cluster I points’ phytoplankton community structure (%) (A) and season distributions (C), light depth distributions (D), and horizontal distributions of chlorophyll-a concentrations (μg/L) (B) averaged from three light depths in the SCWK, 2018–2020.
Cluster II (n = 83) assembled those sampling points where cryptophytes (30.2% ± 7.9%) and diatoms (28.7% ± 13.4%) were the major contributors to chlorophyll-a. More than half of these points in cluster II were in autumn (Figures 4A, C). No distinct vertical difference was observed at the three light depths in cluster II points (Figure 4D), but chlorophyll-a concentrations in the eastern and western waters of Jeju Island were higher than those in the northern and southern waters at 100% and 30% light depths. The highest concentrations (>2.5 µg/L) of cluster II were observed in site 313-03 (Figure 4B). The second-highest chlorophyll-a concentrations (>2 µg/L) were in site 205-05 in all three light depths, close to the Kyushu Island of Japan in our study area.
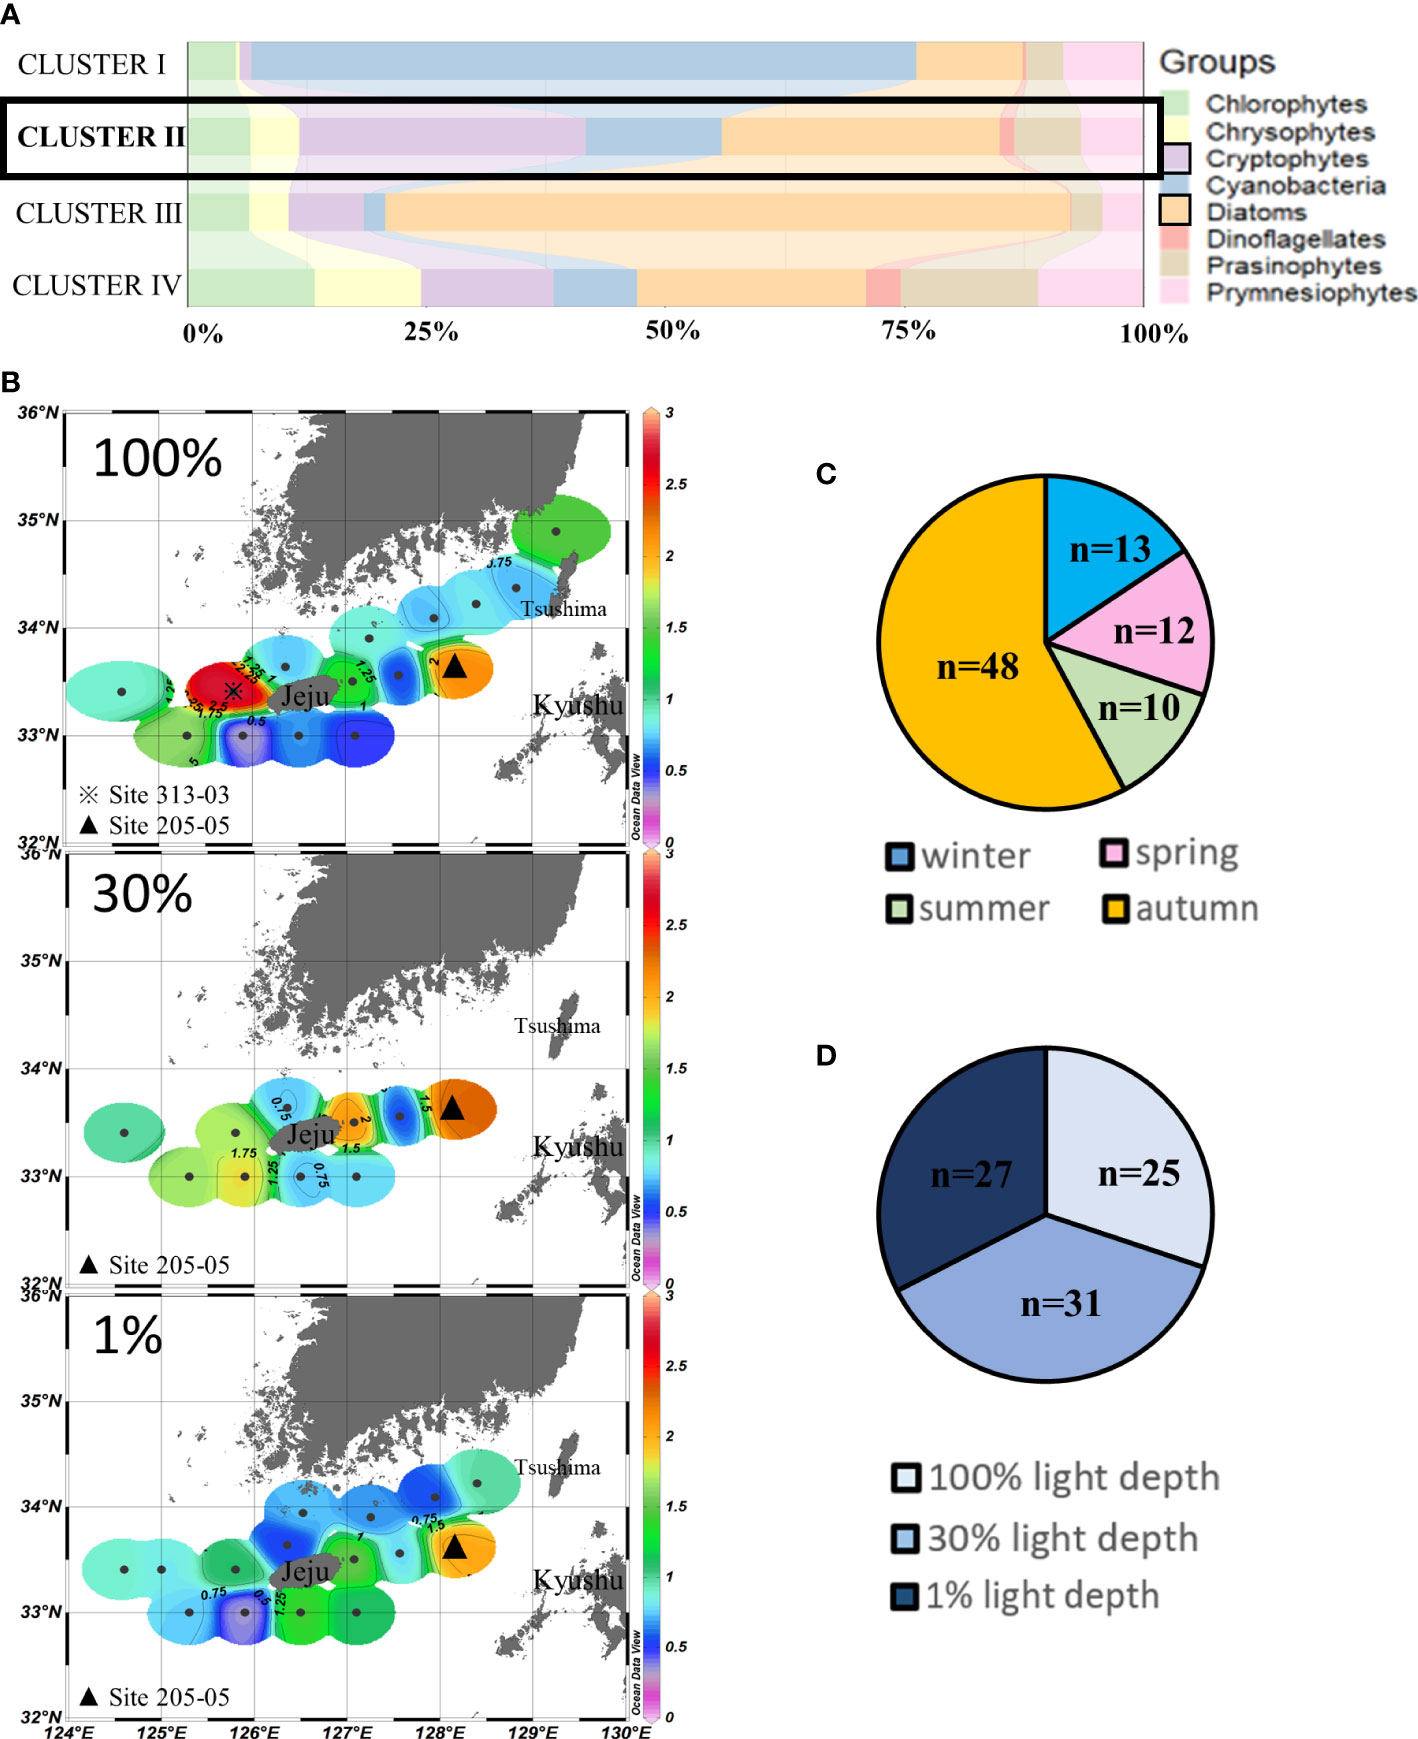
Figure 4 Cluster II points’ phytoplankton community structure (%) (A) and season distributions (C), light depth distributions (D), and horizontal distributions of chlorophyll-a concentrations (μg/L) (B) averaged from three light depths in the SCWK, 2018–2020.
Cluster III (n = 81) assembled those sampling points where diatoms (71.59% ± 14.44%) were the major contributors to chlorophyll-a, mainly during winter and autumn (Figures 5A,C). High chlorophyll-a concentrations were mainly distributed in the southern coastal water of the Korean Peninsula at 100% and 30% light depths, and the highest concentrations (>4 µg/L) in the SCWK from 2018 to 2020 were observed in site 400-14. Meanwhile, the chlorophyll-a concentrations in the southwestern waters of Jeju Island were much lower (p < 0.05, t-test) than those at other points which were all less than 0.5 µg/L. The average concentrations of 1% light depths were lower than those of 100% and 30% light depths (Figure 5B).
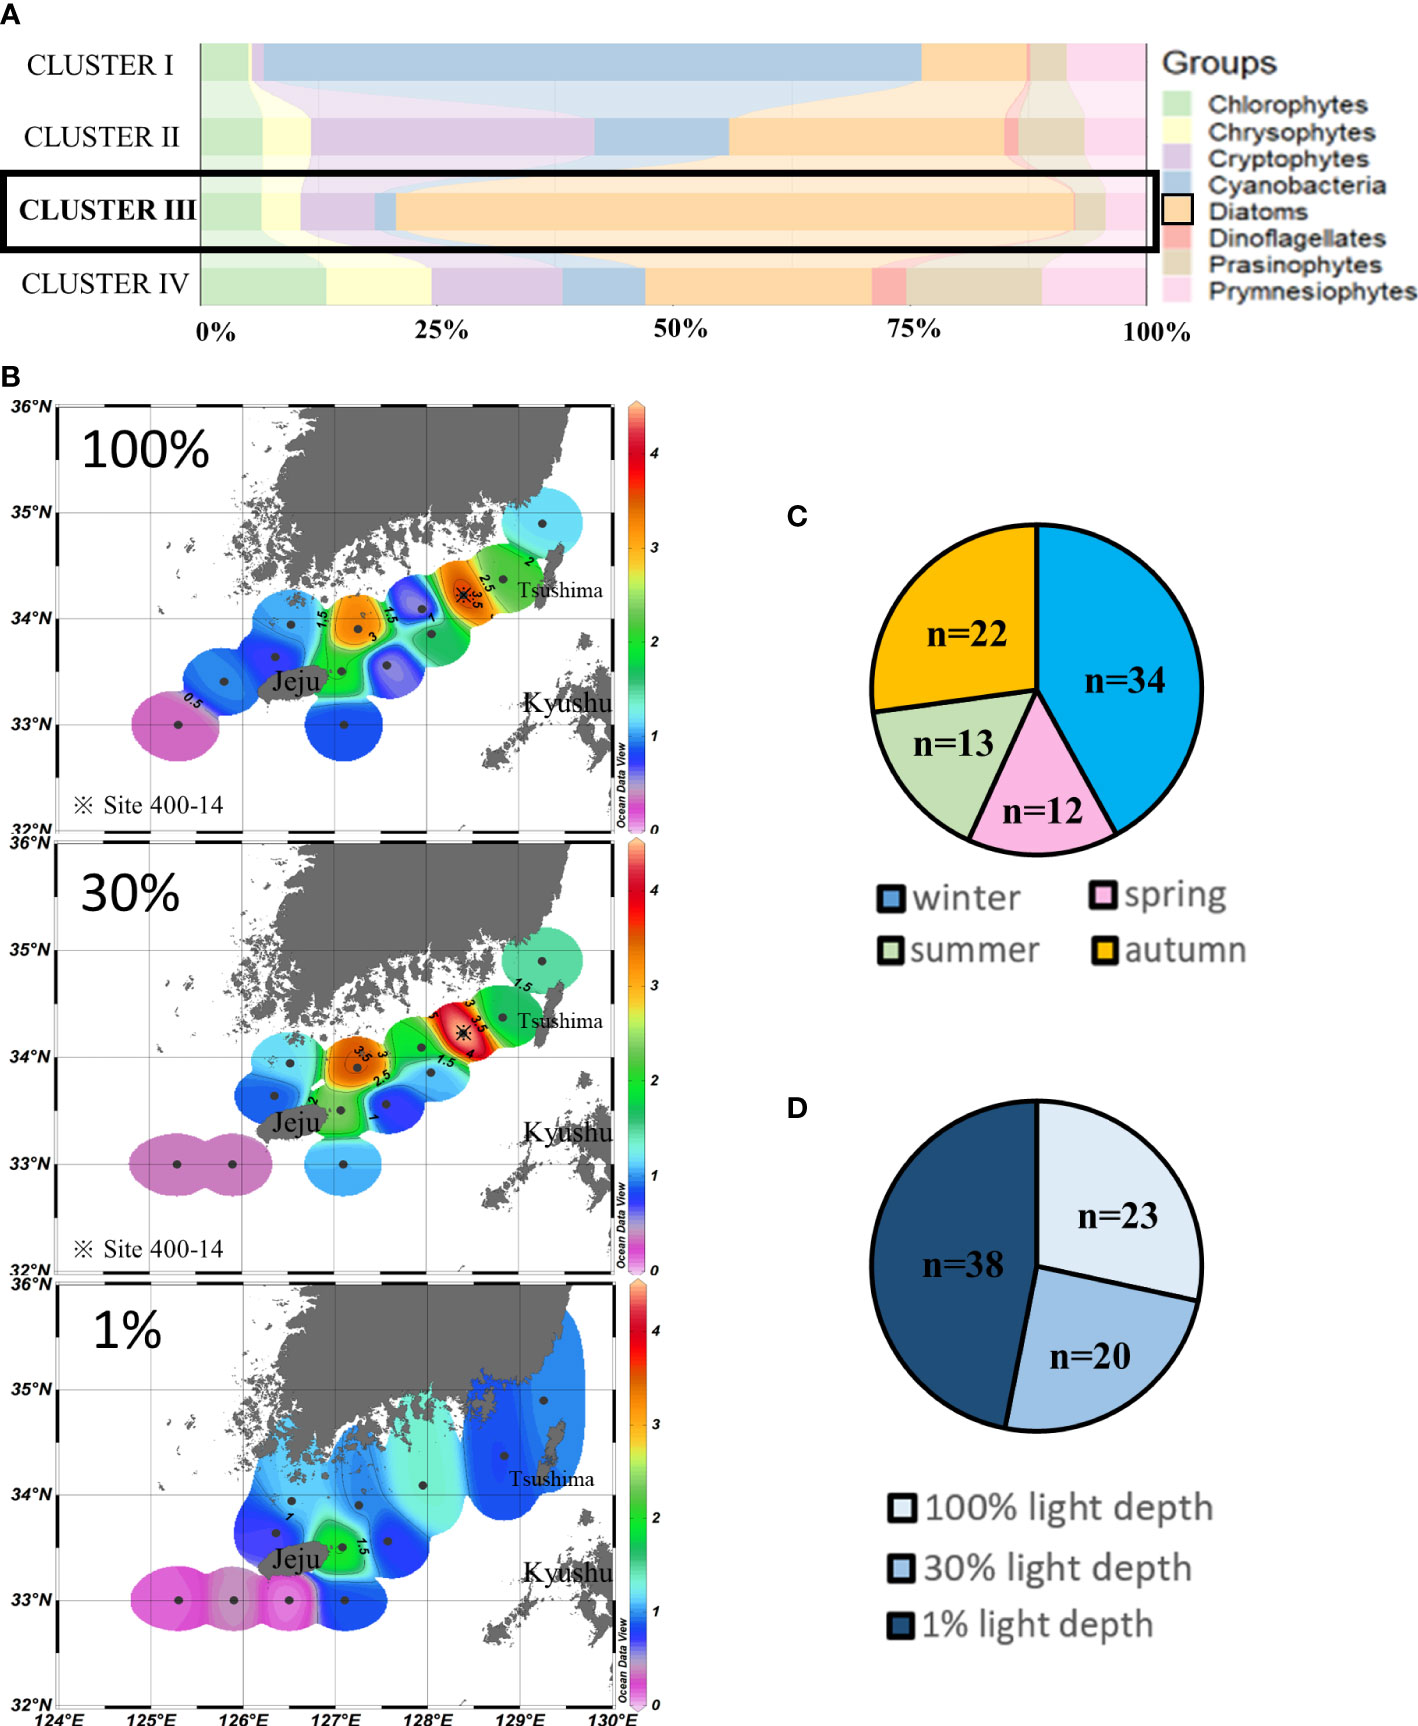
Figure 5 Cluster III points’ phytoplankton community structure (%) (A) and season distributions (C), light depth distributions (D), and horizontal distributions of chlorophyll-a concentrations (μg/L) (B) averaged from three light depths in the SCWK, 2018–2020.
Cluster IV (n = 83) was also predominated by diatoms (24.02% ± 13.35%), but compared to other clusters, relatively higher contributions of chlorophytes, chrysophytes, prasinophytes, and prymnesiophytes were observed in cluster IV, mainly during spring and wintertime (Figures 6A, C). No obvious difference was observed at the three light depths in cluster IV points (Figure 6D). Relatively higher chlorophyll-a concentrations (>1.75 µg/L) were observed at the southwestern and northeastern points of our study area. Meanwhile, the chlorophyll-a concentrations in the waters around Tsushima Island were also higher (>1.5 µg/L) than those of other areas (Figure 6B).
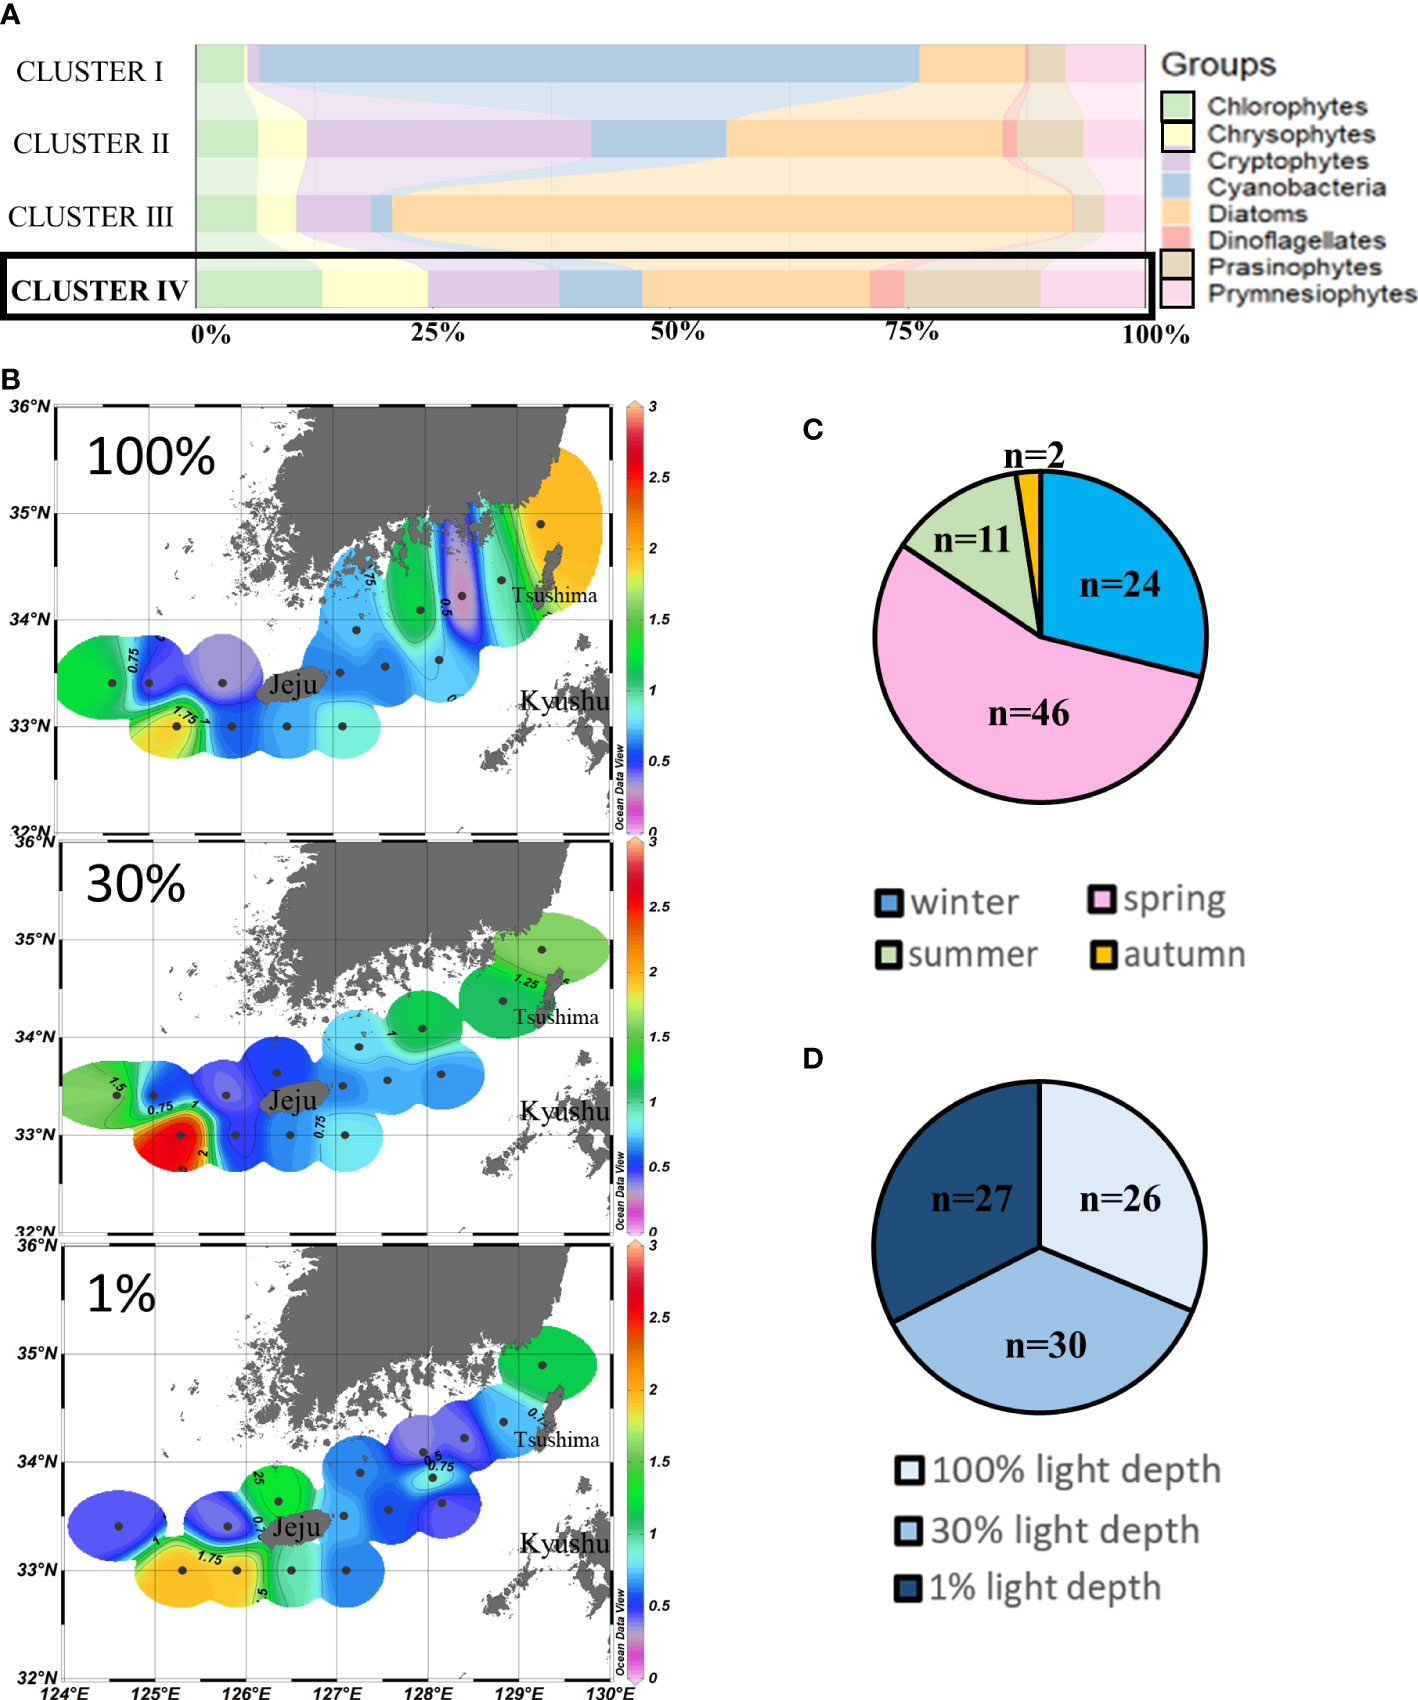
Figure 6 Cluster IV points’ phytoplankton community structure (%) (A) and season distributions (C), light depth distributions (D), and horizontal distributions of chlorophyll-a concentrations (μg/L) (B) averaged from three light depths in the SCWK, 2018–2020.
Figure 7 shows the difference in environmental factor data distributions for the four different clusters. Cluster I showed the highest average temperature (26.80°C ± 2.23°C) and the lowest average salinity (32.15 ± 0.88) among the four clusters (Figures 7A, B). Compared to the other three clusters, cluster I showed the lowest average concentrations in DIN (1.97 ± 0.74 µM), DIP (0.13 ± 0.19 µM), and ExN (−0.12 ± 3.25 µM) (Figures 7C, D, F). The average depth of cluster I points was 5.76 ± 8.21 m, and the average chlorophyll-a concentration was 0.22 ± 0.11 µg/L, which was also the lowest among the four clusters (Figures 7G, H). Cluster II showed the second-highest average temperature (19.36°C ± 3.43°C) and the second-lowest average salinity (33.51 ± 0.99) among the four clusters (Figures 7A, B). The chemical factors in cluster II showed the second-lowest average concentrations in DIN (3.31 ± 2.66 µM) and DIP (0.16 ± 0.19 µM), the lowest average concentrations in DSi (5.75 ± 3.18 µM), and the highest ExN (0.70 ± 2.32 µM) (Figures 7C-F). The average depths of cluster II points were 13.53 ± 15.36 m, and the average chlorophyll-a concentrations were 1.02 ± 0.6 µg/L, which were also the second highest among the four clusters (Figures 7G, H). Cluster III showed the second-lowest average temperature (16.87°C ± 3.00°C) and the second-highest average salinity (34.0 ± 0.63) among the four clusters (Figures 7A, B). For chemical factors, cluster III showed the highest average concentrations in all nutrients including DIN (5.44 ± 3.04 µM), DIP (0.32 ± 0.24 µM), and DSi (7.30 ± 3.76 µM) (Figures 7C-E). The average depth of cluster III points was 17.20 ± 18.94 m, and the average chlorophyll-a concentration was 1.13 ± 1.07 µg/L, showing the highest value among the four clusters (Figures 7G, H). Cluster IV showed the lowest average temperature (16.34°C ± 4.08°C) and the highest average salinity (34.09 ± 0.87) among the four clusters (Figures 7A, B). The chemical factors in cluster IV showed the second-highest concentrations in DIN (4.27 ± 2.05 µM), DIP (0.26 ± 0.18 µM), DSi (7.31 ± 2.21 µM), and ExN (0.14 ± 2.58 µM) (Figures 7C-F). The average depth of the cluster IV points was 12.47 ± 13.22 m, and the average chlorophyll-a concentration was 0.85 ± 0.67 µg/L, which was also the second lowest among the four clusters (Figures 7G, H).

Figure 7 Raincloud plots of the four clusters (clusters I, II, III, and IV) concerning temperature (A), salinity (B), dissolved inorganic nitrogen (DIN) (C), dissolved inorganic phosphorus (DIP) (D), dissolved silica (DSi) (E), excess nitrate (ExN) (F), average euphotic depth (the average value of 100%, 30%, and 1% light depths) (G), and average total chlorophyll-a concentrations (H), illustrating data probability distribution (the “cloud”), with jittered raw data (the “rain”) supplemented by a boxplot in the middle. The dots and error bar next to the “cloud” represent the mean and mean range for each cluster.
The correlation coefficients between the major phytoplankton groups and environmental drivers for each season from 2018 to 2020 are presented in Figure 8. All correlation coefficients were divided into three clusters according to hierarchical clustering. Temperature, cyanobacteria, dinoflagellates, NH4, cryptophytes, and ExN were divided into one cluster. Cyanobacteria had a strong positive correlation with temperature (r = 0.75, p < 0.001, n = 285) and a negative correlation with cryptophytes (r = −0.31, p < 0.001, n = 285). Dinoflagellates had a weak negative correlation with temperature (r = −0.17, p < 0.001, n = 285) and a weak positive correlation with NH4 (r = 0.14, p < 0.05, n = 285). Cryptophytes had a negative correlation with temperature (r = −0.24, p < 0.05, n = 285). Diatoms, depths, NOx, DIN, DIP, and DSi were divided in the second cluster. Diatoms had positive correlations with all environmental factors (0.21 < r < 0.35, p < 0.01, n = 285) except DSi. Meanwhile, depths had positive correlations with other environmental factors (0.26 < r < 0.39, p < 0.001, n = 285) and diatoms (r = 0.21, p < 0.001, n = 285). The third cluster included prasinophytes, prymnesiophytes, chrysophytes, chlorophytes, and salinity. The phytoplankton groups in this cluster all had positive correlations with salinity (0.18 < r < 0.54, p < 0.01, n = 285) except prymnesiophytes (r = −0.15, p < 0.01, n = 285). Meanwhile, these four phytoplankton groups also had positive correlations with each other (0.14 < r < 0.31, p < 0.05, n = 285) except prasinophytes showing a negative correlation with chlorophytes (r = −0.16, p < 0.05, n = 285).
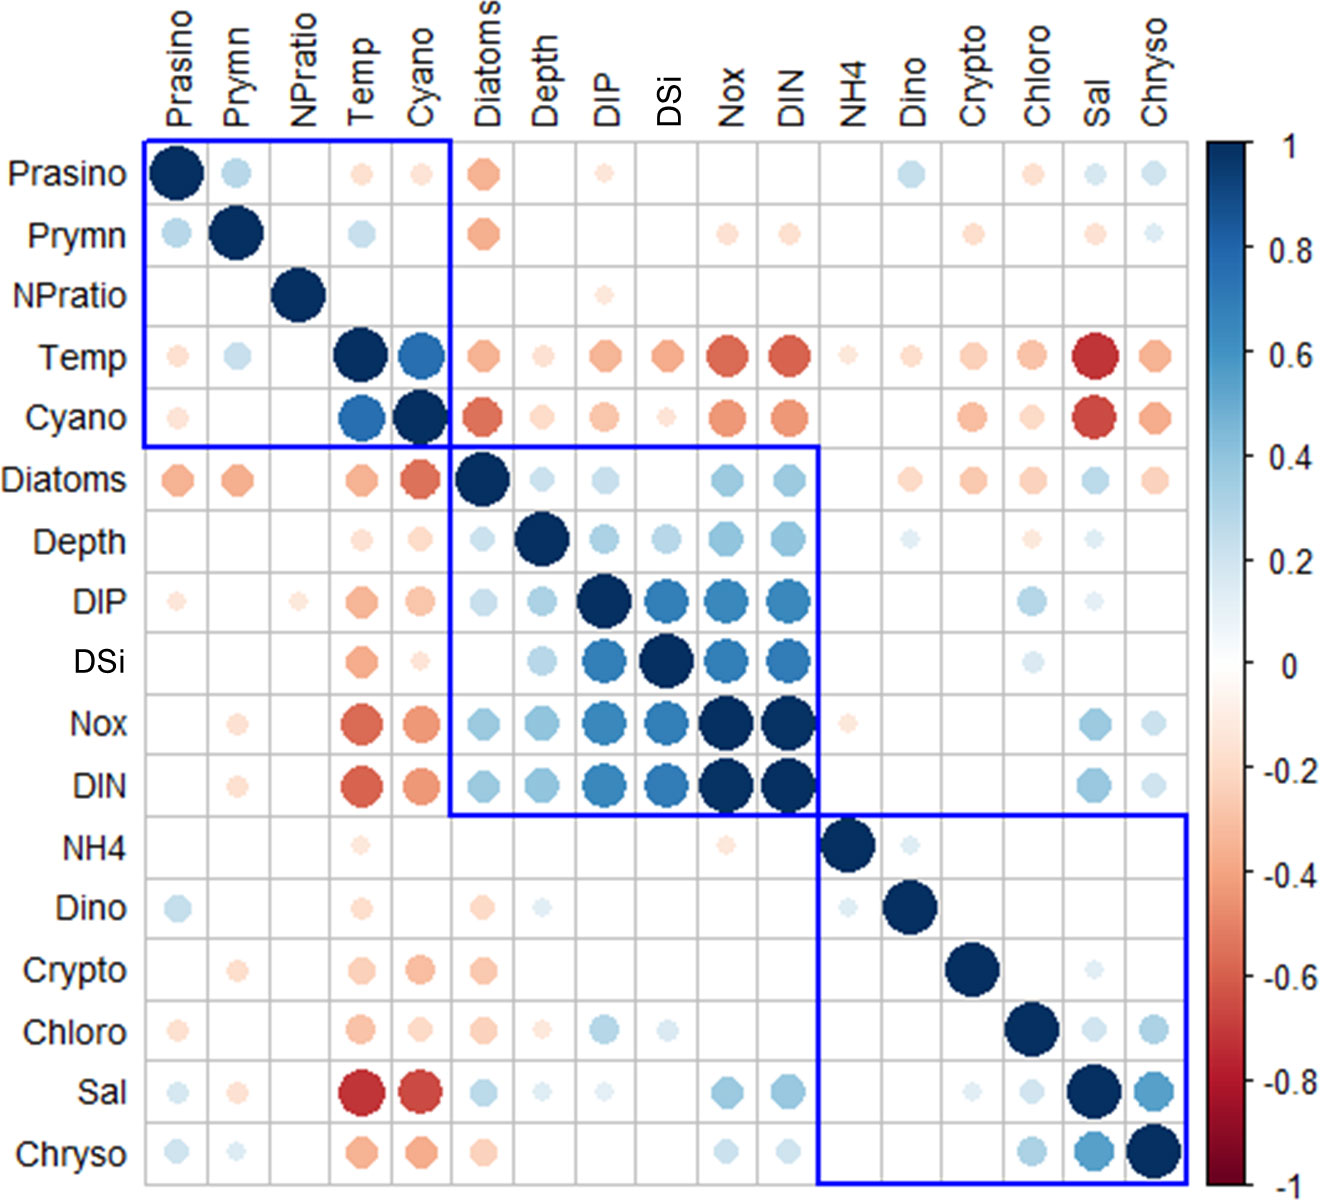
Figure 8 Heatmap of the correlation coefficients between the major phytoplankton communities and environmental drivers of each cruise period in the SCWK, 2018∼2020. Only significant coefficients and absolute correlation coefficients (if >0.10) are indicated. The size of a circle indicates the absolute correlation coefficient.
Three main phytoplankton groups responding differently to environmental factors in the SCWK from 2018 to 2020 in all four seasons were compared in GAMs. Only data with significant differences (p < 0.01, t-test) after fitting with GAMs were used to ensure high accuracy of the comparison between phytoplankton groups and environmental factors. The results indicated that the contribution of diatoms to chlorophyll-a concentrations decreased when the temperature was between 20°C and 26°C, and the contribution of cryptophytes decreased starting at 22°C. Cyanobacteria increased with temperature increasing especially when the temperature was higher than 20°C (Figure 9A). In salinity GAMs, cyanobacteria contribution showed negative correlations with salinity, and diatoms increased significantly in the salinity range between 30 and 33 (Figure 9B). Although the contribution of diatoms fluctuated greatly in DIN GAMs, it showed an increasing trend when DIN concentrations were between 0 and 13 µM. Cyanobacteria decreased significantly (p < 0.01, t-test) when DIN was lower than 6 µM, and the intersection of the diatom and cyanobacteria contribution curves was at 3 µM (Figure 9C). The contribution of diatoms generally increased with the increase of DIP, but the contribution decreased obviously when the concentrations of DIP were between 0.2 and 0.35 µM and increased when the concentration of DIP was greater than 0.35 µM. Cyanobacteria contribution decreased when DIP concentration was <0.3 µM, and the intersection of the contribution curves of diatoms and cyanobacteria was at 0.1–0.2 µM (Figure 9D).
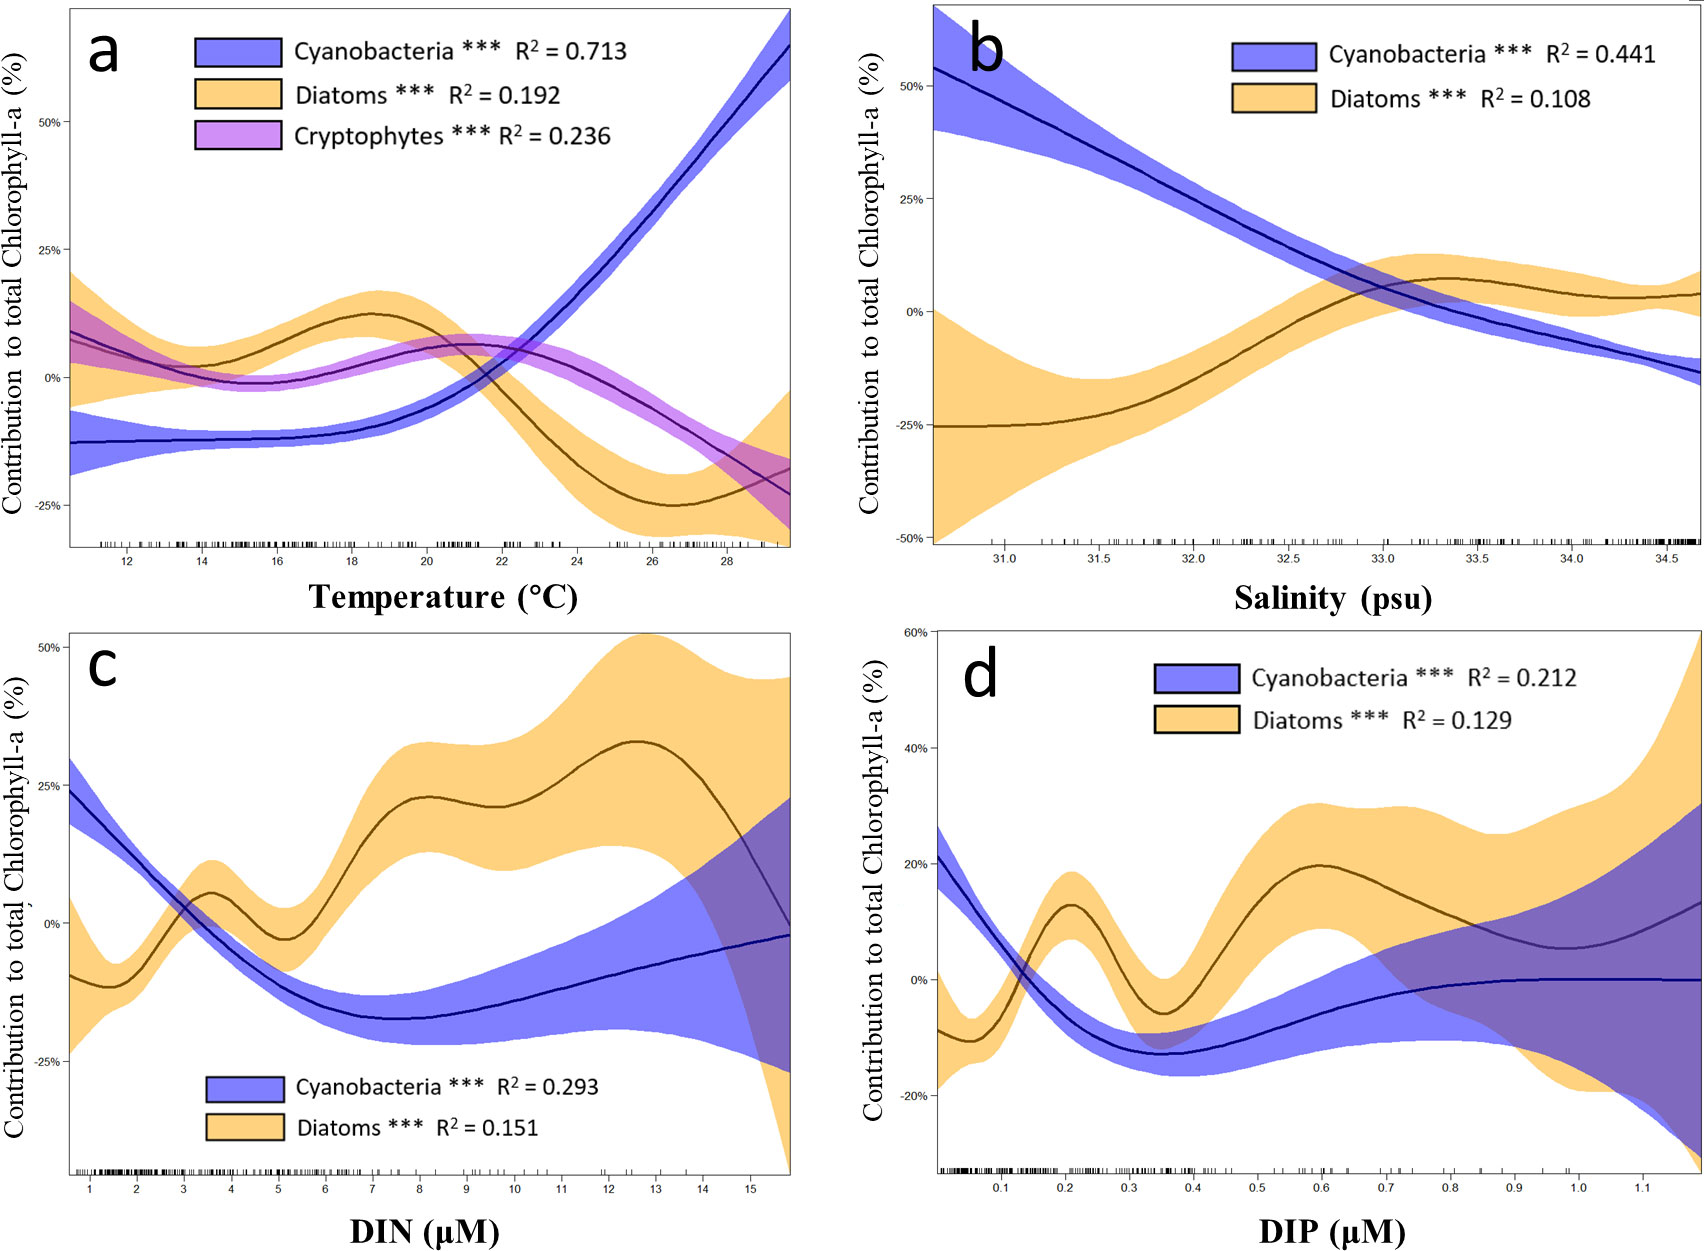
Figure 9 Results of the generalized additive models (GAMs) describing the contributions of major phytoplankton to chlorophyll-a with environmental factors in the SCWK from 2018 to 2020. (A) Changes in the contributions of cyanobacteria, diatoms, and cryptophytes with temperature. Changes in the contributions of cyanobacteria and diatoms with (B) salinity, (C) dissolved inorganic nitrogen (DIN), and (D) dissolved inorganic phosphorus (DIP). The contributions of different phytoplankton groups to chlorophyll-a are plotted as differences between concentrations and mean values (Y-axis). Solid lines with significant relationships (asterisks on the phytoplankton group legends, p < 0.001) represent smoothing lines from GAMs, and shaded areas indicate 95% confidence intervals. The inward tick marks on the X-axis show data distributions.
Discussion
One of the major phytoplankton groups in the SCWK was cyanobacteria which were predominant at 100% (0 m) and 30% (5–19 m) light depths in summer (Figures 3C, D). Generally, cyanobacteria in the SCWK were hardly observed at 1% light depths. The high cyanobacteria concentrations were in the northern and southern waters of Jeju Islands. The temperature and salinity discrepancy between surface and bottom layers in summer caused a strong water stratification resulting in blocking nutrient-rich bottom water upwelling (Lee et al., 2016; Xu et al., 2019). The nutrient-limited conditions at the surface layer cause larger phytoplankton groups to be at a disadvantage in terms of competition, whereas these conditions induce small phytoplankton to be favored because of their higher nutrient affinity associated with their small size (Tilman, 1982). Compared with nutrients, temperature was the decisive environmental factor that determines the distribution of cyanobacteria in this study, based on the results of the correlation heatmap and GAMs (Figures 8, 9). In cluster I dominated by cyanobacteria, the average temperature was considerably higher than those of other clusters by more than 6°C (Figure 7A). The GAM results indicated that the contribution of cyanobacteria to the total chlorophyll-a concentrations begins to increase sharply when the temperature is above 20°C (Figure 9A). The DIN and DIP models showed a sharp decrease in cyanobacterial contribution at low concentrations, but these changes were not obvious over the concentrations of 7.0 and 0.4 µM, respectively (Figures 9C, D). The distribution of ExN, which reflects the nutrient limitation conditions (Wong et al., 1998), showed a wide range from −3.52 to 2.98 µM in cluster I (Figure 7F). However, neither the cyanobacteria concentrations (Figure 2A) nor their contributions to the total chlorophyll-a concentrations (Figure 2B) changed greatly under DIN or DIP limitation conditions in summer from 2018 to 2020. This also proves that nutrient limitation is not the decisive factor for cyanobacteria in the SCWK. The relatively low cyanobacteria concentrations at the westernmost points in the present study area were probably related to the strong stratification caused by the bottom water mass affected by the YSCW, which is also consistent with previous studies indicating that cyanobacteria are the dominant groups in the southern Yellow Sea in summer (Le et al., 2010; Lee et al., 2012). Kang (2000) and Kim et al. (2011) indicated that the sea surface temperature (SST) in the SCWK has been continuously increasing mainly due to global warming. Therefore, we could predict that the cyanobacteria will gradually become mostly the predominant groups at the 100% and 30% light depths of the SCWK in summer. The cyanobacteria species (marker pigment: zeaxanthin) that can be discriminated by pigment analysis are mainly Prochlorococcus, Synechococcus, and Trichodesmium (Morel et al., 1993; Liu et al., 2016; Dupouy et al., 2018; Xu et al., 2019). The divinyl chlorophyll-a as a characteristic pigment for Prochlorococcus was not found in this study, so we concluded that the main cyanobacteria dominant species in the SCWK were Synechococcus or Trichodesmium. Consistently, Lee et al. (2014) and Choi et al. (2016) observed that the dominant cyanobacteria were in the northern part of the East China Sea (ECS). Lee et al. (2014) and Xu et al. (2022) indicated that Prochlorococcus is the dominant species in Kuroshio Current-influenced regions. The different dominant species of cyanobacteria between adjacent sea areas should be verified in further research.
Cryptophytes and diatoms as the other major phytoplankton groups in the SCWK were classified into cluster II and cluster III. Cluster II was predominated by cryptophytes (30.2% ± 7.9%) and diatoms (28.7% ± 13.4%), and cluster III was predominated mostly by diatoms (71.6% ± 14.4%) only. Relatively high concentrations of cryptophytes and diatoms were observed in autumn, and no obvious vertical distribution was found among the three light depths (Figures 4C, D), while diatom-dominated waters were detected mainly at 1% light depths, especially in autumn and winter (Figures 5C, D). From the spatial distributions of these two phytoplankton groups, high concentrations of diatoms were mainly observed in the southern water of the Korean Peninsula where the total chlorophyll-a concentrations were significantly (p < 0.05, t-test) lower at 1% light depths than at the surface layer. The chlorophyll-a concentrations in the southwestern water of Jeju Island were extremely low (Figure 5B). The high concentrations of cryptophytes and diatoms were observed in the east and west waters of Jeju Island (Figure 4B). The average salinity of waters dominated by cryptophytes and diatoms was relatively lower than that of waters dominated by diatoms (Figure 7B), but all nutrients including DIN, DIP, and DSi were higher (but not significant) in diatom-dominated waters than in the waters dominated by cryptophytes and diatoms (Figures 7C-E). The average ExN in the diatom-dominated waters was 0.38 ± 2.59 µM (Figure 7F), which is nearly identical to the Redfield N:P ratios of 16 in the four clusters. The average total chlorophyll-a concentrations in the diatom-dominated waters were the highest among the other phytoplankton groups (Figure 7H). Wong et al. (1998) observed that the effects of the limitations of macronutrients N, P, and Si on diatoms were particularly obvious. They also found that diatoms have significantly higher absolute nutrient requirements than other phytoplankton groups and that their N and P requirements are closest to the Redfield ratio of 16 (Wong et al., 1998), which is consistent with the results in this study (Figure 7F). The great diversity of diatoms encompasses many ecological strategies such as colonist, stress-tolerant, and ruderal species, and the latter ones tend to have high maximum carbon-specific nutrient uptake rates (Alves-De-Souza et al., 2008; Edwards et al., 2012; Xiao et al., 2018). It may make the growth of diatoms largely limited under conditions of nutrient deficiency (Smayda and Reynolds, 2001) and also makes diatoms more tolerant to other environmental constraints (such as temperature and light conditions) than other phytoplankton groups (Malviya et al., 2016). In this study, diatom-dominated points were mostly found at 1% light depths in winter with low temperature and weak light conditions but sufficient nutrients. According to Ahn et al. (1999) and Baek et al. (2020), the southern water of the Korean Peninsula has regional characteristics of nutrient-enriched and low turbidity conditions, which is consistent with the highest chlorophyll-a concentrations (>3.5 µg/L) in this study (Figure 5B). Meanwhile, diatoms also require enough DSi to build intricate and hard but porous cell walls called frustules (Wikfors, 2003), which is consistent with our results of the correlation heatmap (Figure 8). Generally, diatoms, being one of the most important contributors to the total chlorophyll-a concentration in the phytoplankton community, account for about 40% of the total oceanic primary production (Wetz and Wheeler, 2007), making them a significant component of marine food webs (Sarthou et al., 2005; Amin et al., 2012). We also found that diatoms were the highest contributor to the total chlorophyll-a concentrations in this study. Previous studies in the SCWK indicated that the dominant diatom species associated with summer blooms were Chaetoceros didymus and Skeletonema costatum, and the dominant species of diatoms were Eucampia zodiacus and Thalassiosira curviseriata in winter (Yoon, 2003). Cryptophytes were also one of the dominant groups in autumn, and their ExN average concentration was higher than that of diatoms in this study, which is consistent with the results of the different response patterns of these two phytoplankton groups to ExN in other studies (Kang et al., 2021; Sun et al., 2022). Meanwhile, although no relationship between cryptophytes and NH4+ or NOx was found via correlation analysis, hierarchical clustering grouped cryptophytes and NH4+ into one cluster (Figure 8), which is also consistent with the result from Kang et al. (2021) who found that cryptophytes have a more positive correlation with NH4+ than NOx in Yeongil Bay on the southeastern coast of Korea. According to previous studies, phytoplankton is unable to directly use NO3−. NO3− is firstly reduced to NO2− by nitrate reductase (NR) which is converted to NH4+ by nitrate reductase (NiR), and finally, NH4+ was incorporated into amino acid by glutamine synthetase (GS) and glutamate synthase (GOGAT) (Glibert et al., 2016; Jo et al., 2021). Differences in NOx and NH4+ uptake rates among different phytoplankton groups require more research in the future.
Chlorophytes, chrysophytes, prasinophytes, and prymnesiophytes were not the main phytoplankton groups in the SCWK, but they still had relative contributions to the total chlorophyll-a in winter and especially in spring during this study period (Figures 2, 6C). From the spatial distribution of these four phytoplankton groups, the high concentrations were mainly observed in the southwestern water of Jeju Island (Figure 6B), which is greatly influenced by the ECS. The average temperature was lower at these points than in other phytoplankton group-dominant points, but the average salinity at these points was higher than in other points (Figures 7A, B). The average chlorophyll-a concentrations of these four phytoplankton groups were relatively lower than those of diatoms and cryptophytes and diatom-dominated points (Figure 7H). The correlation heatmap grouped these four phytoplankton groups into one cluster, and chlorophytes, chrysophytes, and prasinophytes showed positive correlations with salinity, whereas only prymnesiophytes showed a negative correlation with salinity (Figure 8).
Based on cluster analysis, the niche spaces for these groups are mainly located between (pico)cyanobacteria and large cells of diatoms and cryptophytes (Figure 7). Therefore, this taxonomically complex assemblage of pico- and nano-sized phytoplankton confirms the general perception of a broad structuring role of cell size in phytoplankton community composition (Litchman et al., 2007; Liu et al., 2016). Chlorophytes have been largely observed in the Changjiang Estuary and in the adjacent coastal waters (Furuya et al., 2003; Zhu et al., 2009), which is consistent with the high concentrations of total chlorophyll-a being found in the southwestern water of Jeju Island (close to the ECS) in this study (Figure 6B) in which chlorophyll-b (the marker pigment of chlorophytes) accounted for a large contribution. According to different CHEMTAX ratios, chrysophytes and prymnesiophytes are sometimes grouped as haptophytes because both of them have the characteristic pigment 19′-hexanoyloxy-fucoxanthin (Latasa, 2007; Pinckney et al., 2015). Chrysophytes, prymnesiophytes, and prasinophytes, as small-sized eukaryotic phytoplankton, have been identified as mixotrophs and major predators of prokaryote cells (Zubkov and Tarran, 2008; McKie-Krisberg and Sanders, 2014), which expands their ecological roles important in pelagic food webs (Mitra et al., 2014; Liu et al., 2016).
Summary and conclusion
This study is the first to document the spatiotemporal variations in the phytoplankton biomass and community structure in relation to the nutrient stoichiometry for the three light depths in the euphotic zone and four seasons in the SCWK. The combination of cluster analysis, correlation heatmaps, and GAMs revealed strong relationships between the phytoplankton community structure and nutrient stoichiometry. Diatoms were the dominant groups mainly concentrated at 1% light depths in the SCWK, while their concentrations were still relatively high within more illuminated conditions (at 100% and 30% light depths). Diatoms were highly associated with the total chlorophyll-a, DIN, DIP, and DSi concentrations based on cluster analysis. The positive correlations between diatoms and all macronutrients were also confirmed in correlation heatmaps and GAMs. Cyanobacteria were the main dominant groups at the surface layer in summer, and they were highly associated with low chlorophyll-a and high temperature. Cryptophytes and diatom-dominated points were mainly concentrated in autumn, showing the highest average ExN among the four clusters. Additional groups which included chlorophytes, chrysophytes, prasinophytes, and prymnesiophytes contributed significantly to the total biomass of phytoplankton based on their chlorophyll-a concentrations in the southwestern water of Jeju Island, especially during spring.
Future studies in the SCWK should closely look at 1) the different dominant species of cyanobacteria between the SCWK and the Kuroshio Current-influenced region, 2) the differences in NOx and NH4 uptake rates between different phytoplankton groups, and 3) the responses of these small-sized phytoplankton groups to environmental variations. The limitation of this study focused on the different phytoplankton groups based on HPLC pigment analysis. Future research should combine species-associated primary productivity with observational studies of specific phytoplankton species through microscopic methods because different phytoplankton species have their own specific primary productivities and respond differently to environmental changes.
Data availability statement
The raw data supporting the conclusions of this article will be made available by the authors, without undue reservation.
Author contributions
YS, S-HY, HO, HJ, YK, and SL contributed to the conception and design of the study. Material preparation and data collection were performed by YK, JK, DL, KK and HJ. YS and YK performed the data analysis. LS provided codes for data visualization. YS wrote the first draft of the manuscript. SL reviewed and edited previous versions of the manuscript. All authors contributed to manuscript writing and revision and read and approved the submitted version.
Funding
This research was supported by the National Institute of Fisheries Science (NIFS; R2018067) and partly by Korea Institute of Marine Science & Technology Promotion (KIMST) funded by the Ministry of Oceans and Fisheries, Korea (20180447, Improvements of ocean prediction accuracy using numerical modeling and artificial intelligence technology).
Conflict of interest
The authors declare that the research was conducted in the absence of any commercial or financial relationships that couldbe construed as a potential conflict of interest.
The reviewer TH declared a shared affiliation with the author YS to the handling editor at the time of review.
Publisher’s note
All claims expressed in this article are solely those of the authors and do not necessarily represent those of their affiliated organizations, or those of the publisher, the editors and the reviewers. Any product that may be evaluated in this article, or claim that may be made by its manufacturer, is not guaranteed or endorsed by the publisher.
References
Affan A., Lee J.-B. (2004). Seasonal characteristics of phytoplankton dynamics and environmental factors in the coast of Mara-do and U-do, jeju island, Korea. Algae 19, 235–245. doi: 10.4490/algae.2004.19.3.235
Ahn Y.-H., Lie H.-J., Moon J.-E. (1999). Variations of water turbidity in Korean waters. in. Int. Symposium Prog. Coast. Eng. Oceanogr. Seoul National University, Seoul, Korea, pp. 45–53.
Ajani P. A., Davies C. H., Eriksen R. S., Richardson A. J. (2020). Global warming impacts micro-phytoplankton at a long-term pacific ocean coastal station. Front. Mar. Sci. 7. doi: 10.3389/fmars.2020.576011
Allen M., Poggiali D., Whitaker K., Marshall T. R., Kievit R. A. (2021). Raincloud plots: A multi-platform tool for robust data visualization (version 2). Wellcome Open Res. 4, 63. doi: 10.12688/wellcomeopenres.15191.2
Alves-De-Souza C., González M. T., Iriarte J. L. (2008). Functional groups in marine phytoplankton assemblages dominated by diatoms in fjords of southern Chile. J. Plankton Res. 30 (11), 1233–1243. doi: 10.1093/plankt/fbn079
Amin S. A., Parker M. S., Armbrust E. V. (2012). Interactions between diatoms and bacteria. Microbiol. Mol. Biol. Rev. 76, 667–684. doi: 10.1128/mmbr.00007-12
Baek S. H., Kim D., Kim Y. O., Son M., Kim Y. J., Lee M., et al. (2019). Seasonal changes in abiotic environmental conditions in the busan coastal region (South Korea) due to the nakdong river in 2013 and effect of these changes on phytoplankton communities. Cont. Shelf Res. 175, 116–126. doi: 10.1016/j.csr.2019.01.014
Baek S. H., Lee M., Park B. S., Lim Y. K. (2020). Variation in phytoplankton community due to an autumn typhoon and winter water turbulence in southern korean coastal waters. Sustain 12, 2781. doi: 10.3390/su12072781
Barton A. D., Irwin A. J., Finkel Z. V., Stock C. A. (2016). Anthropogenic climate change drives shift and shuffle in north Atlantic phytoplankton communities. Proc. Natl. Acad. Sci. 113, 2964–2969. doi: 10.1073/pnas.1519080113
Boopathi T., Lee J. B., Youn S. H., Ki J. S. (2015). Temporal and spatial dynamics of phytoplankton diversity in the East China Sea near jeju island (Korea): A pyrosequencing-based study. Biochem. Syst. Ecol. 63, 143–152. doi: 10.1016/j.bse.2015.10.002
Boyce D. G., Lewis M. R., Worm B. (2010). Global phytoplankton decline over the past century. Nature 466 (7306), 591–596. doi: 10.1038/nature09268
Choi D. H., Noh J. H., An S. M., Choi Y. R., Lee H., Ra K., et al. (2016). Spatial distribution of cold-adapted synechococcus during spring in seas adjacent to Korea. Algae 31, 231–241. doi: 10.4490/algae.2016.31.9.10
de Boyer Montégut C., Madec G., Fischer A. S., Lazar A., Iudicone D. (2004). Mixed layer depth over the global ocean: An examination of profile data and a profile-based climatology. J. Geophys. Res. C Ocean. 109, C12. doi: 10.1029/2004JC002378
Dupouy C., Frouin R., Tedetti M., Maillard M., Rodier M., Lombard F., et al. (2018). Diazotrophic trichodesmium impact on UV-vis radiance and pigment composition in the western tropical south pacific. Biogeosciences 15, 5249–5269. doi: 10.5194/bg-15-5249-2018
Edwards K. F., Thomas M. K., Klausmeier C. A., Litchman E. (2012). Allometric scaling and taxonomic variation in nutrient utilization traits and maximum growth rate of phytoplankton. Limnol. Oceanogr. 57, 554–566. doi: 10.4319/lo.2012.57.2.0554
Eppley R. W., Rogers J. N., McCarthy J. J. (1969). Half-saturation constants for uptake of nitrate and ammonium by marine phytoplankton. Limnol. Oceanogr. 14, 910–920. doi: 10.4319/lo.1969.14.6.0912
Falkowski P. G., Raven J. A. (2013). Aquatic photosynthesis (Princeton, NJ: Princeton University Press). doi: 10.3389/fmars.2022.769497
Fehling J., Davidson K., Bolch C. J. S., Brand T. D., Narayanaswamy B. E. (2012). The relationship between phytoplankton distribution and water column characteristics in north west european shelf sea waters. PloS One 7, e34098. doi: 10.1371/journal.pone.0034098
Furuya K., Hayashi M., Yabushita Y., Ishikawa A. (2003). Phytoplankton dynamics in the East China Sea in spring and summer as revealed by HPLC-derived pigment signatures. Deep. Res. Part II Top. Stud. Oceanogr 50, 367–387. doi: 10.1016/S0967-0645(02)00460-5
Glibert P. M., Wilkerson F. P., Dugdale R. C., Raven J. A., Dupont C. L., Leavitt P. R., et al. (2016). Pluses and minuses of ammonium and nitrate uptake and assimilation by phytoplankton and implications for productivity and community composition, with emphasis on nitrogen-enriched conditions. Limnol. Oceanogr. 61, 165–197. doi: 10.1002/lno.10203
Hastie T. J., Tibshirani R. J. (1986). Generalized additive models. Stat. Sci. 1, 297–318. doi: 10.1016/j.csda.2010.05.004
Jeong K. S., Joo G. J., Kim H. W., Ha K., Recknagel F. (2001). Prediction and elucidation of phytoplankton dynamics in the nakdong river (Korea) by means of a recurrent artificial neural network. Ecol. Modell. 146, 115–129. doi: 10.1016/S0304-3800(01)00300-3
Jo N., La H. S., Kim J. H., Kim K., Kim B. K., Kim M. J., et al. (2021). Different biochemical compositions of particulate organic matter driven by major phytoplankton communities in the northwestern Ross Sea. Front. Microbiol. 12. doi: 10.3389/fmicb.2021.623600
Kang Y. Q. (2000). Warming trend of coastal waters of Korea during recent 60 year-1995). Fish. Aquat. Sci. 3, 173–179. doi: 10.3389/fmars.2022.981504
Kang C.-K., Kim P.-J., Lee W.-C., Lee P.-Y. (1999). Nutrients and phytoplankton blooms in the southern coastal waters of Korea: I. the elemental composition of c, n, and p in particulate matter in the coastal bay systems. J. korean Soc Oceanogr. 34, 86–94.
Kang J. J., Lee J. H., Kim H. C., Lee W. C., Lee D., Jo N., et al. (2018). Monthly variations of phytoplankton community in geoje-hansan bay of the southern part of Korea based on HPLC pigment analysis. J. Coast. Res. 85, 356–360. doi: 10.2112/SI85-072.1
Kang Y., Moon C. H., Kim H. J., Yoon Y. H., Kang C. K. (2021). Water quality improvement shifts the dominant phytoplankton group from cryptophytes to diatoms in a coastal ecosystem. Front. Mar. Sci. 8. doi: 10.3389/fmars.2021.710891
Kilham P., Hecky R. E. (1988). Comparative ecology of marine and freshwater phytoplankton. Limnol. Oceanogr. 33, 776–795. doi: 10.4319/lo.1988.33.4part2.0776
Kim G.-B., Kang S.-M., Lee J.-B. (2019). Spatial and temporal variation of phytoplankton community in the coastal waters of jeju island. Sea J. KOREAN Soc Oceanogr. 24, 92–105. doi: 10.7850/jkso.2019.24.1.092
Kim S. J., Woo S. H., Kim B. M., Hur S. (2011). Trends in sea surface temperature (SST) change near the Korean peninsula for the past 130 years. Ocean Polar Res. 33, 281–290. doi: 10.4217/OPR.2011.33.3.281
Kim Y., Youn S. H., Oh H. J., Kang J. J., Lee J. H., Lee D., et al. (2020). Spatiotemporal variation in phytoplankton community driven by environmental factors in the northern east china sea. Water (Switzerland) 12, 2695. doi: 10.3390/w12102695
Latasa M. (2007). Improving estimations of phytoplankton class abundances using CHEMTAX. Mar. Ecol. Prog. Ser. 329, 13–21. doi: 10.3354/meps329013
Lee Y., Choi J. K., Shon J. K. (2012). Phytoplankton distribution in the eastern part of the yellow Sea by the formation of tidal front and upwelling during summer. Ocean Polar Res. 34, 111–123. doi: 10.4217/OPR.2012.34.2.111
Lee Y., Choi J. K., Youn S., Roh S. (2014). Influence of the physical forcing of different water masses on the spatial and temporal distributions of picophytoplankton in the northern East China Sea. Cont. Shelf Res. 88, 216–227. doi: 10.1016/j.csr.2014.08.001
Lee M. O., Kim J. K., Kim B. K. (2016). Factors controlling the origin of cochlodinium polykrikoides blooms along the goheung coast, south Korea. Mar. pollut. Bull. 113, 165–175. doi: 10.1016/j.marpolbul.2016.09.001
Lee M., Park B. S., Baek S. H. (2018). Tidal influences on biotic and abiotic factors in the seomjin river estuary and gwangyang bay, Korea. Estuaries Coasts 41, 1977–1993. doi: 10.1007/s12237-018-0404-9
Lee Y.-W., Park M.-O., Kim Y.-S., Kim S.-S., Kang C.-K. (2011). Application of photosynthetic pigment analysis using a HPLC and CHEMTAX program to studies of phytoplankton community composition. Sea 16, 117–124. doi: 10.7850/jkso.2011.16.3.117
Le F., Ning X., Liu C., Hao Q., Shi J. (2010). Community structure of picoplankton abundance and biomass in the southern huanghai Sea during the spring and autumn of 2006. Acta Oceanol. Sin. 29, 58–68. doi: 10.1007/s13131-010-0008-0
Litchman E., Klausmeier C. A., Schofield O. M., Falkowski P. G. (2007). The role of functional traits and trade-offs in structuring phytoplankton communities: Scaling from cellular to ecosystem level. Ecol. Lett. 10, 1170–1181. doi: 10.1111/j.1461-0248.2007.01117.x
Liu X., Xiao W., Landry M. R., Chiang K. P., Wang L., Huang B. (2016). Responses of phytoplankton communities to environmental variability in the East China Sea. Ecosystems 19, 832–849. doi: 10.1007/s10021-016-9970-5
Mackey M. D., Higgins H. W., Mackey D. J., Wright S. W. (1997). CHEMTAX User’s Manual: A Program for Estimating Class Abundances from Chemical Markers, Application to HPLC Measurements of Phytoplankton Pigments. Report No: 229, Hobart, Tas: CSIRO Marine Laboratories. doi: 10.4225/08/585eb90c906
Mackey M. D., Mackey D. J., Higgins H. W., Wright S. W. (1996). CHEMTAX - a program for estimating class abundances from chemical markers: Application to HPLC measurements of phytoplankton. Mar. Ecol. Prog. Ser. 144, 265–283. doi: 10.3354/meps144265
Malviya S., Scalco E., Audic S., Vincent F., Veluchamy A., Poulain J., et al. (2016). Insights into global diatom distribution and diversity in the world’s ocean. Proc. Natl. Acad. Sci. U. S. A. 113 (11), E1516–E1525. doi: 10.1073/pnas.1509523113
McKie-Krisberg Z. M., Sanders R. W. (2014). Phagotrophy by the picoeukaryotic green alga micromonas: Implications for Arctic oceans. ISME J. 8, 2151–2151. doi: 10.1038/ismej.2014.16
Min J.-O., Ha S.-Y., Chung M.-H., Choi B.-H., Lee Y.-J., Youn S.-H., et al. (2012). Seasonal variation of primary productivity and pigment of phytoplankton community structure in the seomjin estuary. Korean J. Ecol. Environ. 45, 139–149.
Mitra A., Flynn K. J., Burkholder J. M., Berge T., Calbet A., Raven J. A., et al. (2014). The role of mixotrophic protists in the biological carbon pump. Biogeosciences 11, 13535–13562. doi: 10.5194/bg-11-995-2014
Morel A., Ahn Y.-H., Partensky F., Vaulot D., Claustre H. (1993). Prochlorococcus and synechococcus: A comparative study of their optical properties in relation to their size and pigmentation. J. Mar. Res. 51, 617–649. doi: 10.1357/0022240933223963
Olsen Y., Reinertsen H., Vadstein O., Andersen T., Gismervik I., Duarte C., et al. (2001). Comparative analysis of food webs based on flow networks: Effects of nutrient supply on structure and function of coastal plankton communities. Cont. Shelf Res. 21, 2043–2053. doi: 10.1016/S0278-4343(01)00041-3
Pham D. T., Dimov S. S., Nguyen C. D. (2005). Selection of K in K-means clustering. Proc. Inst. Mech. Eng. Part C J. Mech. Eng. Sci. 219, 103–119. doi: 10.1243/095440605X8298
Pinckney J. L., Benitez-Nelson C. R., Thunell R. C., Muller-Karger F., Lorenzoni L., Troccoli L., et al. (2015). Phytoplankton community structure and depth distribution changes in the cariaco basin between 1996 and 2010. Deep. Res. Part I Oceanogr. Res. Pap. 101, 27–37. doi: 10.1016/j.dsr.2015.03.004
Poole H. H., Atkins W. R. G. (1929). Photo−electric measurements of submarine illumination throughout the year. J. Mar. Biol. Assoc. United Kingdom 16, 297–324. doi: 10.1017/S0025315400029829
Redfield A. C. (1934). “On the proportions of organic derivatives in sea water and their relation to the composition of plankton,” in James Johnstone Memorial Volume, ed. Daniel R. J. (Liverpool: Liverpool University Press), 1–7.
Salmaso N., Naselli-Flores L., Cerasino L., Flaim G., Tolotti M., Padisák J. (2012). Preface: phytoplankton responses to human impacts at different scales. Hydrobiologia 698, 1–3. doi: 10.1007/s10750-012-1252-4
Sarthou G., Timmermans K. R., Blain S., Tréguer P. (2005). Growth physiology and fate of diatoms in the ocean: A review. J. Sea Res. 53, 25–42. doi: 10.1016/j.seares.2004.01.007
Smayda T. J. (1997). Harmful algal blooms: Their ecophysiology and general relevance to phytoplankton blooms in the sea. Limnol. Oceanogr. 42, 1137–1153. doi: 10.4319/lo.1997.42.5_part_2.1137
Smayda T. J., Reynolds C. S. (2001). Community assembly in marine phytoplankton: Application of recent models to harmful dinoflagellate blooms. J. Plankton Res. 23, 447–461. doi: 10.1093/plankt/23.5.447
Sommer U. (1994). The impact of light intensity and daylength on silicate and nitrate competition among marine phytoplankton. Limnol. Oceanogr. 39, 1680–1688. doi: 10.4319/lo.1994.39.7.1680
Stefanescu S., Cocoș R., Turcu-Stiolica A., Shelby E. S., Matei M., Subtirelu M. S., et al. (2021). Prediction of treatment outcome with inflammatory biomarkers after 2 months of therapy in pulmonary tuberculosis patients: Preliminary results. Pathogens 10 (7), 789. doi: 10.3390/pathogens10070789
Sun Y., Youn S.-H., Kim Y., Kang J. J., Lee D., Kim K., et al. (2022). Interannual variation in phytoplankton community driven by environmental factors in the northern East China Sea. Front. Mar. Sci. 9. doi: 10.3389/fmars.2022.769497
Tilman D. (1982). Resource competition and community structure. Monogr. Popul. Biol. 17, 1–296. doi: 10.2307/4549
Wetz M. S., Wheeler P. A. (2007). Release of dissolved organic matter by coastal diatoms. Limnol. Oceanogr. 52, 798–807. doi: 10.4319/lo.2007.52.2.0798
Wikfors G. H. (2003). A taxonomic guide to some common marine phytoplankton. Harmful Algae 2, 161–162. doi: 10.1016/s1568-9883(03)00024-6
Wong G. T. F., Gong G.-C., Liu K. K., Pai S. C. (1998). ‘Excess nitrate’in the East China sea. Estuar. Coast. Shelf Sci. 46, 411–418. doi: 10.1006/ecss.1997.0287
Xiao W., Liu X., Irwin A. J., Laws E. A., Wang L., Chen B., et al. (2018). Warming and eutrophication combine to restructure diatoms and dinoflagellates. Water Res. 128, 206–216. doi: 10.1016/j.watres.2017.10.051
Xu Q., Sukigara C., Goes J. I., do Rosario Gomes H., Zhu Y., Wang S., et al. (2019). Interannual changes in summer phytoplankton community composition in relation to water mass variability in the East China Sea. J. Oceanogr. 75, 61–79. doi: 10.1007/s10872-018-0484-y
Xu Q., Wang S., Sukigara C., Goes J. I., Gomes H., do R., et al. (2022). High-resolution vertical observations of phytoplankton groups derived from an in-situ fluorometer in the East China Sea and tsushima strait. Front. Mar. Sci. 8. doi: 10.3389/fmars.2021.756180
Yoon Y. H. (2003). Spatial distribution of phytoplankton community and red tide of dinoflagellate, prorocentrum donghaience in the East China Sea during early summer. Korean J. Env. Biol. 21, 132–141.
Zhang Q. L., Weng X. C., Yang Y. L. (1996). Analysis of water masses in the south Yellow Sea in spring. Oceanol. Limnol. Sin. 27 (4), 421–428. doi: 10.3389/fmars.2022.972921
Zhu Z. Y., Ng W. M., Liu S. M., Zhang J., Chen J. C., Wu Y. (2009). Estuarine phytoplankton dynamics and shift of limiting factors: A study in the changjiang (Yangtze river) estuary and adjacent area. Estuar. Coast. Shelf Sci. 84, 393–401. doi: 10.1016/j.ecss.2009.07.005
Keywords: phytoplankton community, HPLC, generalized additive models, cyanobacteria, diatom, southern coastal waters of Korea
Citation: Sun Y, Youn S-H, Oh HJ, Joo H-T, Kim Y, Kang JJ, Lee D, Kim K, Jang HK, Jo N, Yun MS, Sun L and Lee SH (2022) Spatial and temporal distribution of phytoplankton community in relation to environmental factors in the southern coastal waters of Korea. Front. Mar. Sci. 9:950234. doi: 10.3389/fmars.2022.950234
Received: 22 May 2022; Accepted: 07 September 2022;
Published: 29 September 2022.
Edited by:
Jing Zhang, University of Toyama, JapanReviewed by:
Márcio Silva de Souza, Federal University of Rio Grande, BrazilArumugam Sundaramanickam, Annamalai University, India
Takafumi Hirata, Hokkaido University, Japan
Xiaojun Yan, Zhejiang Ocean University, China
Copyright © 2022 Sun, Youn, Oh, Joo, Kim, Kang, Lee, Kim, Jang, Jo, Yun, Sun and Lee. This is an open-access article distributed under the terms of the Creative Commons Attribution License (CC BY). The use, distribution or reproduction in other forums is permitted, provided the original author(s) and the copyright owner(s) are credited and that the original publication in this journal is cited, in accordance with accepted academic practice. No use, distribution or reproduction is permitted which does not comply with these terms.
*Correspondence: Sang Heon Lee, c2FuZ2xlZUBwdXNhbi5hYy5rcg==