Abstract
Whether the Guangdong-Hongkong-Macao Greater Bay Area (GBA) can achieve the goal of environmental protection at the same time as its rapid economic development is an important issue that deserves attention. In this paper, we obtained remote sensing data on air pollution including CO, NO2, SO2, PM10, PM2.5, and nighttime light data. We combined the remote sensing data with county-level economic statistics to study economic development and air pollution in the Guangdong-Hongkong-Macao GBA. Our research showed that the economic development in the Guangdong-Hongkong-Macao GBA significantly increased the emissions of NO2, PM10, and PM2.5 and did not have significant effects on CO and SO2. We constructed an emission intensity indicator of pollutants per unit of luminance. We found that the unit emission intensity of four categories of pollutants, PM10, PM2.5, SO2, and CO, showed a significant decreasing trend in line with economic development. The emission intensity of NO2 showed a trend of first decreasing and then increasing. The conclusion of this research illustrates that the emission intensity of pollutants per unit of luminosity in the Guangdong-Hongkong-Macao GBA is continuously reducing. The emission of pollutants will gradually change from slow growth to zero growth. However, the emission of NO2 pollution should be an area of focus in achieving the dual goals of economic development and environmental protection.
1 Introduction
Achieving economic development while protecting the ecological environment is an important challenge for countries worldwide. It is also an essential issue that China must address in achieving sustainable development. In recent years, the Chinese government has paid more attention to environmental protection while developing the economy, regarding environmental protection as an inherent requirement for the sustainable development of the Chinese nation (Wang et al., 2021a).
However, realizing the win-win goal of economic development quality and ecological environment quality faces many challenges (Grossman and Krueger, 1995; Ebenstein et al., 2015). A salient fact is that since the reform and opening up, while China has made remarkable achievements in economic development, it has also paid a high environmental price. The emissions of air pollutants, mainly SO2 and particulate matter (PM), are currently the highest worldwide. The World Bank’s “China Environmental Pollution Losses Report” released in 2007 shows that China’s air and water pollution losses were equivalent to 5.8% of its real GDP in that year. Fewer than five of the country’s 500 cities have an air quality that meets the World Health Organization’s recommended standards, and 16 of the world’s 20 most polluted cities are in China (World Bank, 2007).
Severe air pollution impacts people’s health and economic development. Brook et al. (2004) confirmed that short and long-term exposure to air pollutant-containing environments results in a sustained increase in related cardiovascular disease risk. Carey et al. (2018) and Chang et al. (2014) found an increased risk of dementia in adults with increased exposure to PM2.5, NO2, and CO. There is evidence of a significant association between PM2.5, PM10, NO2, and O3 and COVID-19 infection (Zhu et al., 2020; Liang et al., 2020). (Shi et al., 2016) confirmed that both short- and long-term exposures to PM2.5 are associated with mortality. Each year in China, 350,000 to 500,000 people die prematurely due to outdoor air pollution (Chen et al., 2013), and air pollution has become the fourth most significant threat to the health of the population in China (Yang et al., 2013). Because PM2.5 particles are smaller and can easily enter indoor spaces, their increase can significantly reduce worker productivity, affecting corporate profits (Chang et al., 2016). All things being equal, a 1% increase in PM2.5 concentration leads to a decrease of about 0.5% of GDP per capita in China, thereby harming economic development (Hao et al., 2018).
The root cause of this problem lies in the process of rapid economic development. China prioritized the development of the secondary industry represented by the manufacturing sector, and the consumption of natural resources inevitably increases in the industrialization process, leading to an increase in the level of air pollution. China prioritized economic development over environmental protection. Air pollution has seriously affected China’s sustainable development, and inevitably, this development path is unsustainable. The development concept of harmonious coexistence between human and nature requires China to comprehensively transform its economic development model, take economic growth and environmental protection into consideration, thereby achieving “green development.”
The achievement of the goals of economic development and ecological environment quality faces many difficulties. Stricter environmental protection policies will inevitably increase the cost of manufacturing. This will have a specific inhibitory effect on economic development. How to achieve a win-win situation between economic development and the ecological environment is a complex economic development problem that China must face and solve. Against this background, China’s various national strategies take environmental protection as a fundamental development goal. The Guangdong-Hongkong-Macao GBA is one of the pilot areas for exploring green development in China. The GBA includes the Hongkong Special Administrative Region, Macau Special Administrative Region, Guangzhou, Shenzhen, Zhuhai, Foshan, Huizhou, Dongguan, Zhongshan, Jiangmen, and Zhaoqing in Guangdong Province, a total area of 56,000 km2 with a population of 66.71 million people. It is one of the most open and economically dynamic regions and the most innovative in science and technology in China. For the reasons mentioned above, it has an important strategic position in the development of China. As one of the four major bay areas in the world, compared with the New York Bay Area, the San Francisco Bay Area, and the Tokyo Bay Area, the economic aggregate of the GBA was expected to reach 12.54 trillion yuan (about 1.82 trillion US dollars) with an increase of 8.1% in 2021. In line with China’s national strategy, the GBA hopes to achieve long-term sustainable development of its nature, society, and economy through green innovation and development. It is a pilot area for China’s high-quality economic development.
The coordinated development of ecological environment protection and economic development in the GBA can greatly benefit China’s future economic development path. Existing research has not analyzed this critical issue in-depth in the GBA. In the context of the pollution situation in the GBA, Li and Huang (2022) used the statistical data of prefecture-level cities to analyze the discharge of wastewater and exhaust gas from secondary industries. Lu et al. (2021) focused on the urban heat island effect in the GBA. Zhan et al. (2018) analyzed the air quality problem in the GBA based on environmental monitoring data. However, no scholars have studied the air pollution problem in the GBA using remote sensing data and analyzed air pollution and economic trends. This paper explores the economic development and environmental protection of the GBA by extracting county-level nighttime light data and remote sensing data of air pollution from 2013 to 2019 and examines the ecological environment and economic development of the GBA by constructing the indicator of pollution intensity per unit of light brightness and conducting an in-depth analysis of the factors affecting this indicator. Whether the innovation-driven GBA can effectively reduce air pollution deserves further study.
2 Materials and Methods
2.1 Nighttime Light Data
Nighttime light data have been widely used in socio-economic studies as a long-term, stable, and objective data source to monitor human activities by detecting visible and near-infrared radiation on the ground. The higher the level of economic development, the higher the brightness of nighttime light data. More and more scholars are adopting nighttime light data as a proxy variable for regional economic growth levels (Elvidge et al., 1997; Henderson et al., 2012).
There are three data sources for nighttime light data: DMPS/OLS, NPP/VIIRS, and Luojia-1. The DMSP/OLS data are for 1992 to 2013 and are no longer updated. NPP/VIIRS has been in operation since 2012, and its data are kept updated. Luojia-1 has been in operation since 2018. Considering our research purpose, we selected NPP/VIIRS as the data source to obtain the 2013-2019 nighttime light raster dataset in mainland China (Figure 1). Our selection of NPP/VIIRS was made because the data period of Luojia-1 is short, and the DMSP/OLS dataset has some shortcomings, such as the lack of in-orbit radiation calibration and the saturation phenomenon (Cao et al., 2019; Ji et al., 2019; Levin et al., 2020).
Figure 1
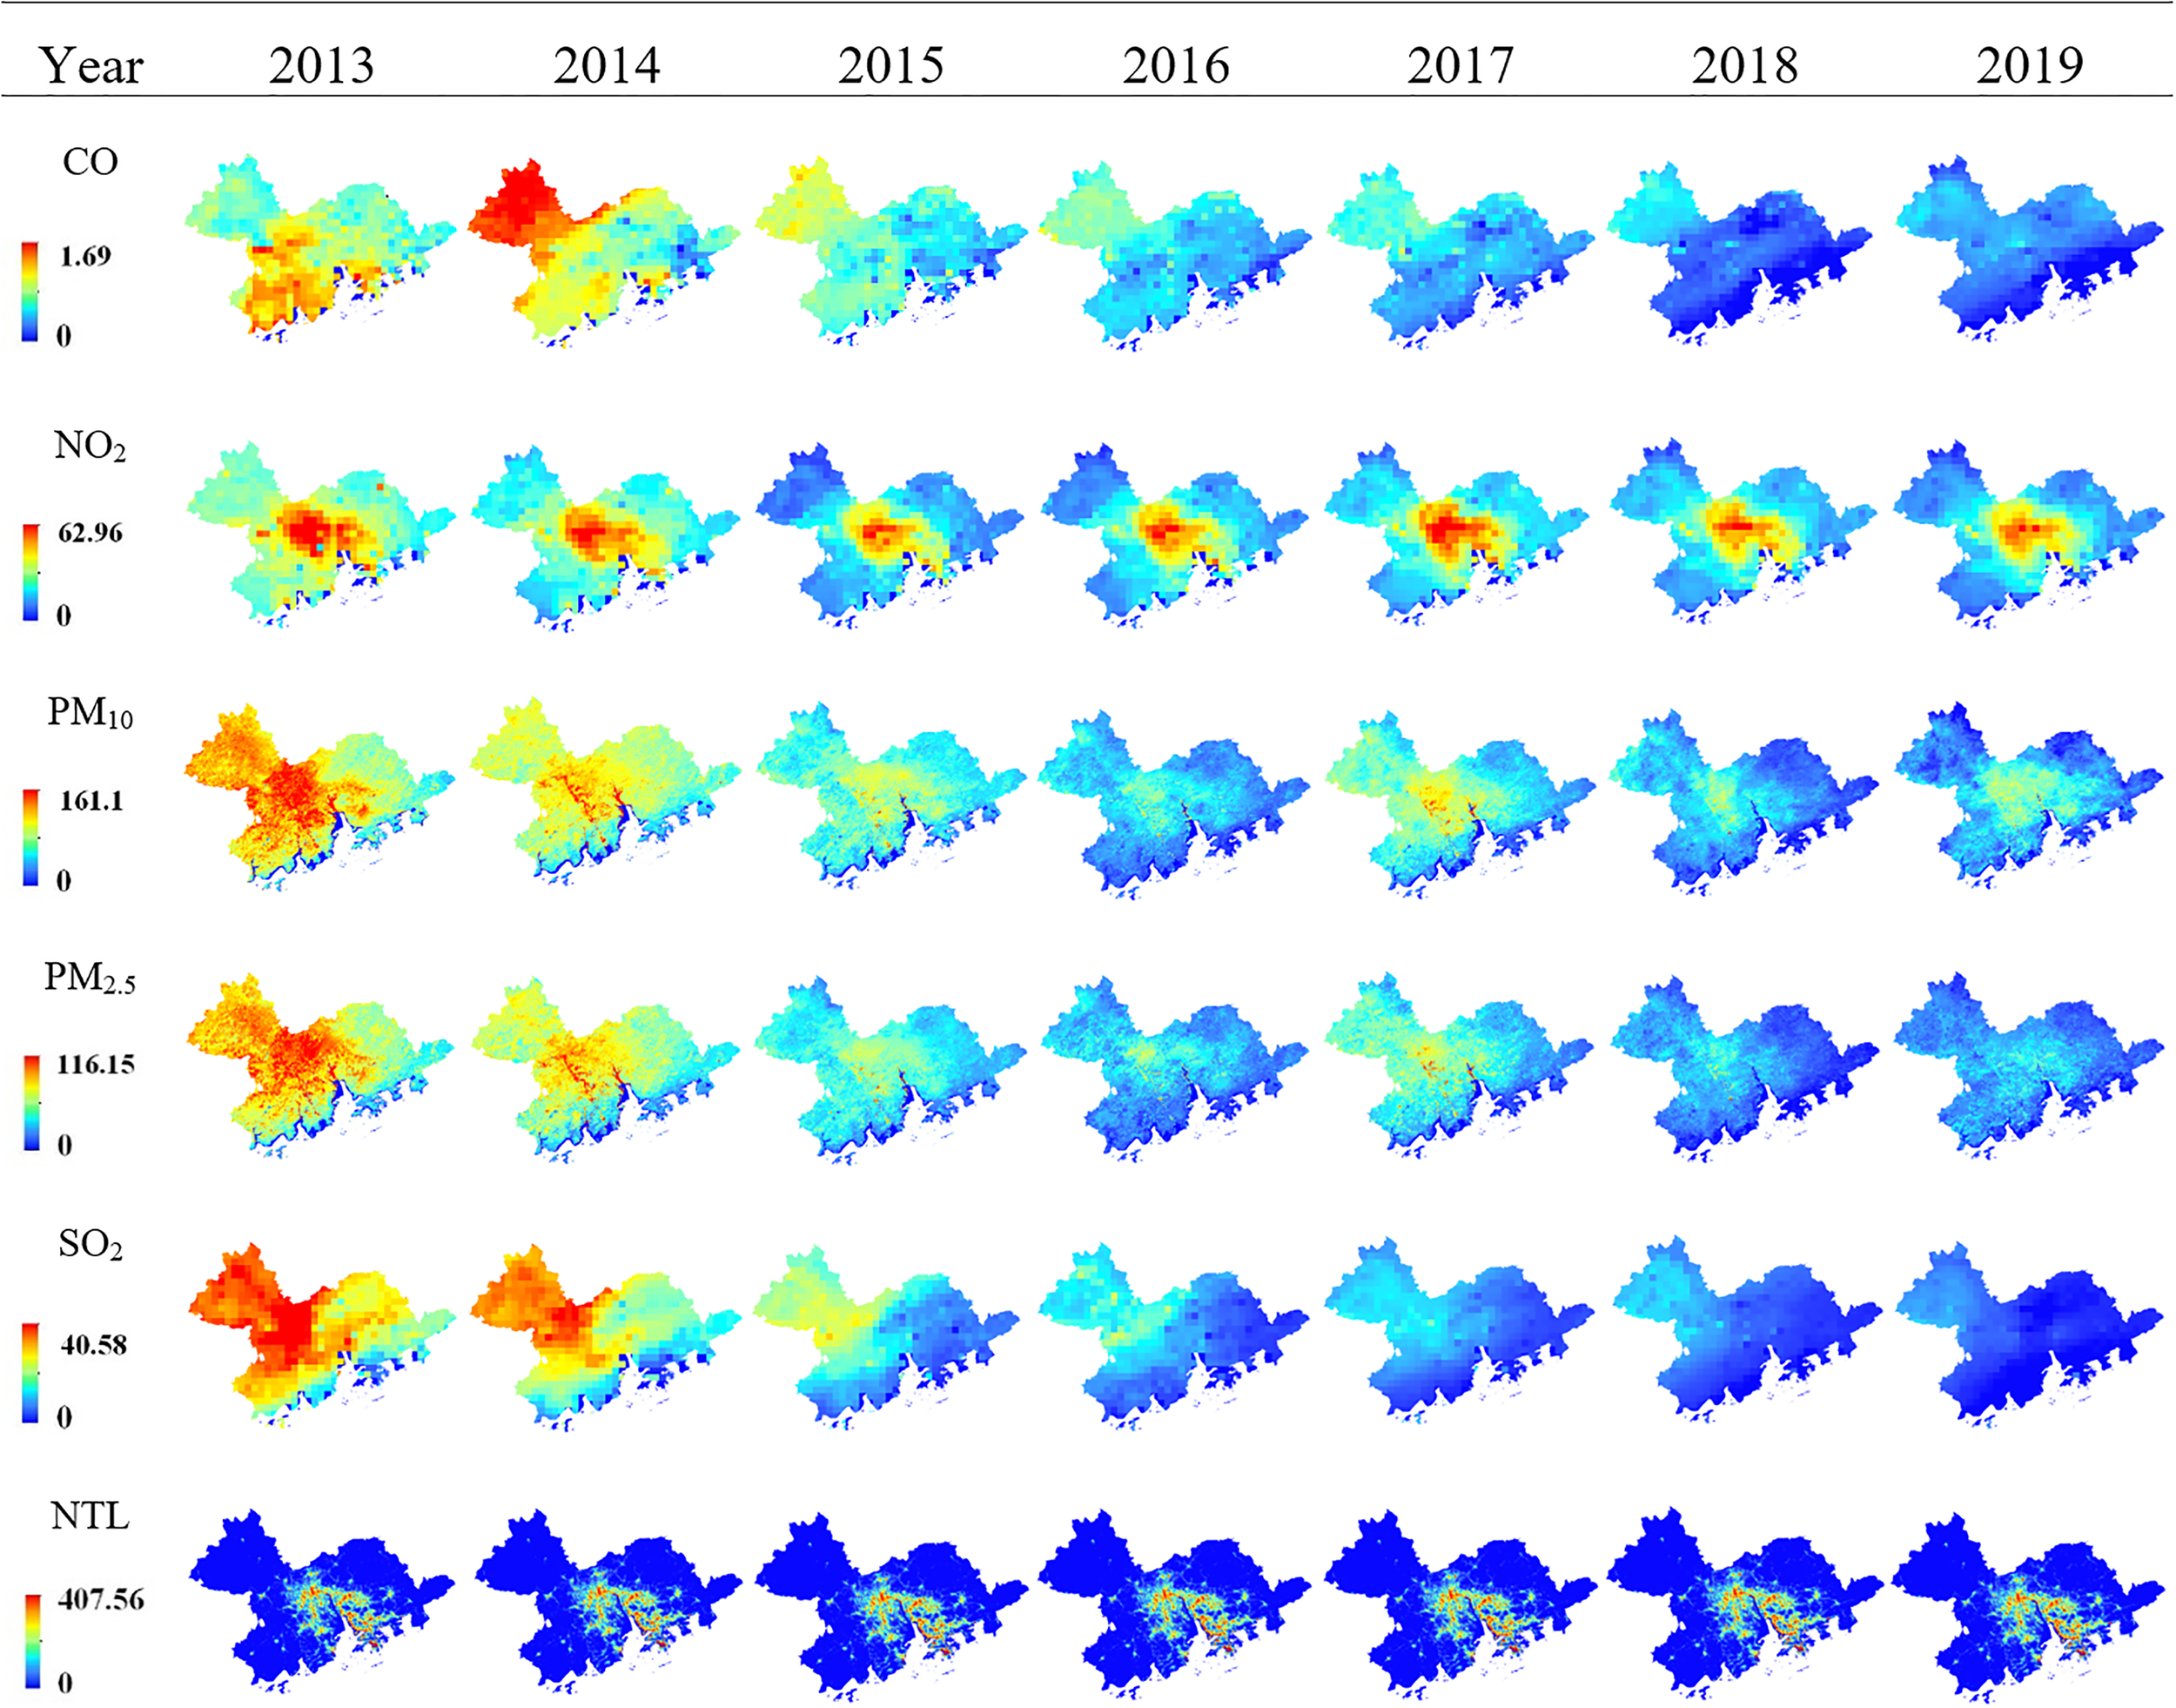
Remote sensing data from 2013 to 2019.
Compared to DMSP/OLS data, the spatial resolution of the NPP/VIIRS nighttime light data increased from 1 km to 500 m, and the DN value increased from 6 to 14 bits, significantly improving the dataset quality. The NPP/VIIRS nighttime light could identify human economic and social development better (Elvidge et al., 2013; Chen et al., 2021). NOAA provides monthly and annual data, and we use annual data for analysis.
2.2 Air Pollution Data
In addition to nighttime light data, air pollution data are another critical data source. Remote sensing data can generate information about PM10, PM2.5, CO, SO2, NO2, and many other pollutants (Wei et al., 2021b). In this paper, the China High Air Pollution Dataset (CHAP) (https://weijing-rs.github.io/product.html) is used as the data source for air pollution. The CHAP dataset contains long-term, high-resolution, high-quality datasets of several major atmospheric pollutants in China, such as CO, NO2, PM10, PM2.5, and SO2 (Wei et al., 2021b).
This dataset is generated by the space-time extra-trees (STET) model, which yields more substantial selection randomness in features, parameters, models, and splits than other tree-based machine learning approaches. The MODIS Multi-Angle Implementation of Atmospheric Correction uses aerosol products, land use, population distribution, and pollution emissions in data integration to reconstruct a high-resolution and high-quality Chinese air pollutant dataset (Wang et al., 2021b; Wei et al., 2021a) (Figure 1). The STET model has high spatial prediction capability, with more accurate estimates of current air pollutant concentrations and better assessments of historical air pollutant concentrations (Wei et al., 2021a), with cross-test coefficients higher than 0.80 for several pollutant categories (Table 1). Therefore, we use the annual data for SO2, CO, PM10, PM2.5, and NO2 in the CHAP dataset as the pollutant data source (https://weijing-rs.github.io/product.html).
Table 1
| Data set | Spatial resolution | CV-R2 | Available period | Using period |
|---|---|---|---|---|
| CO | 10km | 0.8 | 2013-2020 | 2013-2019 |
| NO2 | 10km | 0.84 | 2008-2020 | 2013-2019 |
| PM10 | 1km | 0.90 | 2000-2020 | 2013-2019 |
| PM2.5 | 1km | 0.92 | 2000-2020 | 2013-2019 |
| SO2 | 10km | 0.84 | 2013-2020 | 2013-2019 |
| NPP/VIIRS | 500m | – | 2012-2021 | 2013-2019 |
| Statistics | – | – | 2000-2019 | 2013-2019 |
Summary of data sources.
Figure 1 shows the variety of remote sensing data used in this paper. As Figure 1 shows, several pollutants and nighttime light data show high levels in urban areas and low levels in peripheral regions. The CO trend in 2013 is different from that in other years. We use the above remote sensing data to obtain the mean values of nighttime lights and pollutants in each county by using the shapefile of administrative divisions in the Guangdong-Hongkong-Macao GBA. Table 2 shows the descriptions of the mean value of the nighttime light and pollutants.
Table 2
| Variable | Obs | Mean | Std.Dev | Min | Max |
|---|---|---|---|---|---|
| light_mean | 161 | 5.3788 | 9.2443 | 0.0903 | 37.0510 |
| CO_mean | 161 | 0.9239 | 0.1510 | 0.6550 | 1.3893 |
| NO2_mean | 161 | 30.2240 | 8.3032 | 19.8142 | 56.7402 |
| SO2_mean | 161 | 15.4001 | 6.7429 | 5.8124 | 34.5899 |
| PM10_mean | 161 | 68.9438 | 13.9929 | 45.7016 | 114.1952 |
| PM2.5_mean | 161 | 44.0026 | 10.4779 | 26.8755 | 74.5520 |
| sec_ind | 161 | 367.2436 | 418.2826 | 36.9081 | 2048.7090 |
| budget | 161 | 45.4773 | 54.5640 | 1.0666 | 246.8380 |
| fir_ind | 161 | 37.3992 | 18.7095 | 0.2666 | 101.5576 |
| saving | 155 | 507.7007 | 661.7844 | 58.3200 | 2930.7490 |
| education | 161 | 65.4706 | 52.2104 | 17.6667 | 651.5091 |
| total_ind | 92 | 1348.5210 | 1558.7910 | 111.9551 | 6745.8470 |
| eduction1 | 161 | 102.5684 | 65.7817 | 44.1222 | 784.4818 |
Descriptive statistics of variables.
2.3 County-Level Economic Statistics
To ensure the reliability of our research, we also selected county and district statistics as the following control variables. The statistical database contains data from 2000 to 2019, and we select 2013-2019 for analysis. (1) Manufacturing level (sec_ind): The air pollution situation correlates with the local manufacturing level (Ebenstein et al., 2015). We select the value of the secondary industry (billion yuan) to measure industrial development. (2) Government regulation (budget): Government regulation is crucial in compensating for market failure. Negative externalities from environmental pollution are a typical market failure problem (Aruga, 2022). We choose general public budget revenue (billion yuan) to measure government regulation. (3) Agricultural development (fir_ind): In relative terms, the agricultural industry’s impact on the environment is smaller than that of industry (Nasih et al., 2019). Therefore, the more developed the agriculture, the smaller the degree of environmental pollution. We choose the primary industry (billion yuan) to measure agriculture development; (4) Residents’ living level (saving): The higher the living standard of residents, the higher the level of environmental requirements (Freymeyer and Johnson, 2010). Therefore, improving residents’ income levels promotes the local ecological environment. We select the logarithmic value of the balance of residents’ savings deposits (million yuan) to measure the residents’ living level; (5) Level of education (education): The increase in education level positively contributes to economic growth (Hanushek and Woessmann, 2016). and environmental awareness (Strieder Philippssen et al., 2017). We select the number of students in middle school per 100,000 people to measure the local education level; (6) Total industrial output (total_ind): This variable represents the gross domestic value of the most important secondary industry firms, which is used in robustness test; (7) Level of education (education1): We use the student number per 100,000 in primary schools, which is also used in robustness test.
Table 2 shows the descriptive statistics related to nighttime light data, air pollution data, and statistical yearbook data used in this paper.
2.4 Methodology
2.4.1 Economic Development and Air Pollution Mean Value
We analyzed the impact of economic development on air pollution to examine the relationship between economic development and air pollution in detail. Due to the rapid development of the Guangdong-Hongkong-Macao GBA in recent years, we propose Hypothesis 1:
Hypothesis 1: Total air pollution in the Guangdong-Hongkong-Macao GBA keeps rising along with economic development.
Based on Hypothesis 1, we use the Ordinary Least Squares method to test the impact of economic development on various air pollutants:
where i, j, and t represent the ith county, the jth air pollutant, and the tth year, respectively; Xi,j,t represents the average value of the jth air pollutant in the ith county in the tth year; lighti, t represents the nighttime light brightness of the ith county in the tth year; Controli, t is the corresponding control variable, εi,t is the error. We use the control variables of industrial development, general public budget revenue, agricultural development, residents’ savings deposits, and education level. In this model, we focus on the sign and significance of β1 . If β1 is significantly positive, it means that air pollution is rising with economic development, and if it is significantly negative, it means that the mean value of air pollutants is falling.
2.4.2 Economic Development and Air Pollution Intensity
Previous studies have confirmed that economic development increases air pollution. Therefore, environmental protection should focus on pollutant emission intensity per unit of economic growth. In particular, as the Guangdong-Hongkong-Macao GBA relies on scientific and technological innovation to develop the economy, air pollution caused by economic development will be continuously reduced by industrial restructuring, technological progress, and enhanced awareness of environmental protection. Therefore, we propose Hypothesis 2:
Hypothesis 2: The intensity of air pollution decreases with economic development.
Therefore, we construct the pollution intensity indicator, which is calculated as follows:
where Xper represents the total pollution intensity per unit of light brightness; X represents the mean value of various pollutants in the county, and light represents the mean of nighttime light brightness.
Next, the impact of economic development on pollution intensity is examined. We use the same control variables, industrial development, general public budget revenue, agricultural development, residents’ savings deposits, and education levels, to calculate the impact of economic development in the GBA on its pollution intensity. The equation is as follows:
In this model, we still focus on the sign and significance of α1 . If α1 is significantly positive, it indicates that the unit pollution intensity rises during the economic development process. If the opposite is true, it indicates that the unit pollution intensity keeps decreasing.
We also investigate the relationship between the intensity of air pollution and economic development. In line with Wang and Huang (2015) study, we investigate the relationship between the intensity of air pollution and economic development by setting the quadratic term of night light brightness. The model is as follows:
In Equation (4), we focus on the coefficients of β1 and β2 . If β1 is significantly negative and β2 is significantly positive, air pollution intensity decreases first and then increases with economic development in an inverted U-shaped relationship. If β1 is significantly negative and β2 is not significant, it indicates that air pollution continues to decline with economic development. If β1 is significantly positive and β2 is significantly negative, it indicates that air pollution intensity increases first and then decreases with economic development. If β1 is significantly positive and the β2 coefficient is not significant, it indicates that the intensity of air pollution continues to rise with economic development.
3 Results
3.1 Benchmark Analysis
Table 3 reports the results of the benchmark analysis of Equation (1) without adding control variables. The results from columns (1)–(5) show that the coefficients of the mean values of several air pollutants of NO2, PM10, and PM2.5 are positive, and the coefficients are all significant at the 1% confidence level. This shows that with economic development, these types of pollutants show a growing trend, and NO2 rises the most among the pollutants mentioned above. Each unit increase in nighttime light brightness will result in a 0.7316 unit increase in NO2, a 0.5505 unit increase in PM10, and a 0.2619 unit increase in PM2.5. The positive impact of economic development on these three types of air pollution is significant at the 1% confidence level.
Table 3
| (1) | (2) | (3) | (4) | (5) | |
|---|---|---|---|---|---|
| CO | NO2 | SO2 | PM10 | PM2.5 | |
| light_mean | -0.0010 | 0.7316*** | 0.0525 | 0.5505*** | 0.2619*** |
| (0.001) | (0.052) | (0.036) | (0.070) | (0.055) | |
| _cons | 0.9296*** | 26.2889*** | 15.1178*** | 65.9830*** | 42.5940*** |
| (0.016) | (0.654) | (0.715) | (1.394) | (1.093) | |
| N | 161 | 161 | 161 | 161 | 161 |
The impact of economic development on air pollutants without control variables.
Standard errors in parentheses* p<0.1, ** p<0.05, *** p<0.01.
Table 4 shows the results of Equation (1) after the addition of control variables. After adding the control variables, the NO2 coefficient is still significantly positive at the 1% confidence level, indicating that economic development still leads to increased atmospheric NO2 levels in the GBA. The coefficient of PM10 is still positive, but the confidence level drops to 5%, and the coefficient of PM2.5 still remains positive, but the confidence level drops to 10%. Several other pollutant categories are consistent with the results in Table 3 and remain insignificant. In addition, the coefficients of the control variables show that the development of secondary industry leads to an increase in pollution levels.
Table 4
| (1) | (2) | (3) | (4) | (5) | |
|---|---|---|---|---|---|
| CO | NO2 | SO2 | PM10 | PM2.5 | |
| light_mean | -0.0015 | 0.7812*** | 0.1927 | 0.6871** | 0.4441* |
| (0.004) | (0.094) | (0.167) | (0.307) | (0.240) | |
| sec_ind | 0.0002 | 0.0098** | 0.0096* | 0.0190* | 0.0172** |
| (0.000) | (0.004) | (0.005) | (0.011) | (0.008) | |
| budget | -0.0030* | -0.0347 | -0.1041 | -0.1026 | -0.1061 |
| (0.002) | (0.031) | (0.093) | (0.164) | (0.127) | |
| fir_ind | -0.0052*** | -0.1107*** | -0.1123*** | -0.3136*** | -0.1895*** |
| (0.001) | (0.027) | (0.042) | (0.087) | (0.063) | |
| saving | 0.0001 | -0.0046 | -0.0011 | -0.0089 | -0.0068 |
| (0.000) | (0.004) | (0.009) | (0.015) | (0.012) | |
| education | 0.0002** | -0.0051 | 0.0064 | 0.0049 | 0.0021 |
| (0.000) | (0.003) | (0.006) | (0.012) | (0.009) | |
| _cons | 1.1547*** | 30.8963*** | 20.1132*** | 79.2327*** | 50.7780*** |
| (0.051) | (1.221) | (1.800) | (3.997) | (2.745) | |
| N | 155 | 155 | 155 | 155 | 155 |
The impact of economic development on air pollutants with control variables.
Standard errors in parentheses * p<0.1, ** p<0.05, *** p<0.01.
In contrast, primary industry significantly reduces air pollution. This indicates that the development of manufacturing industry is the leading cause of air pollution in the region. During the economic development of Guangdong-Hongkong-Macao GBA, the related industries caused a significant increase in NO2, PM10, and PM2.5 pollutants. However, the industries related to CO and SO2 emissions were better controlled in terms of pollutant emissions. Hypothesis 1 is partially validated.
In Equation (3), we analyze the impact of economic development on air pollution intensity. Table 5 reports the regression results of the intensity of various air pollutants without adding control variables. Columns (1)–(5) show that the coefficients of the pollution intensity of several air pollutants, such as CO, NO2, SO2, PM10, and PM2.5, are all negative, and the coefficients are all significant at the 1% confidence level. This result means that several air pollutants mentioned above show a significant decreasing trend for every unit increase in light brightness. Among these pollutants, PM10 decreases at the fastest rate, and along with the economic development, the emission intensity of PM10 decreases by −7.1248 units for each unit increase in light brightness at night, and the emission intensity of PM2.5, NO2, SO2, and CO decreases by −4.6040, −2.6534, −1.7793 and −0.1059 units, respectively.
Table 5
| (1) | (2) | (3) | (4) | (5) | |
|---|---|---|---|---|---|
| CO_per | NO2_per | SO2_per | PM10_per | PM2.5_per | |
| light_mean | -0.1059*** | -2.6534*** | -1.7793*** | -7.1248*** | -4.6040*** |
| (0.039) | (0.940) | (0.680) | (2.612) | (1.694) | |
| _cons | 2.2128*** | 57.2546*** | 38.4101*** | 152.6818*** | 99.0297*** |
| (0.621) | (15.013) | (11.485) | (42.67) | (27.843) | |
| N | 161 | 161 | 161 | 161 | 161 |
The impact of economic development on air pollutants intensity without control variables.
Standard errors in parentheses * p<0.1, ** p<0.05, *** p<0.01.
Table 6 shows the results of Equation (3) with the addition of control variables. After adding the control variables, the intensities of several air pollutants per unit of light brightness are still negative and significant at the 1% confidence level. This indicates that even after controlling other related factors, the intensity per unit emission of several air pollutants still decreases significantly along with the economic development of the GBA. After adding the control variables, the PM10 unit pollution intensity decreases the most, reaching −10.0142, and the emission intensity of the several remaining pollutants also keeps dropping. In reducing emission intensity, the development of secondary industry does not have a significant influence. In contrast, primary industry development significantly reduces pollutant emission intensity. The effect of other control variables was not significant.
Table 6
| (1) | (2) | (3) | (4) | (5) | |
|---|---|---|---|---|---|
| CO_per | NO2_per | SO2_per | PM10_per | PM2.5_per | |
| light_mean | -0.1399*** | -3.4254*** | -2.9417*** | -10.0142*** | -6.6557*** |
| (0.042) | (1.007) | (1.022) | (3.215) | (2.185) | |
| sec_ind | -0.0009 | -0.0256 | -0.0364 | -0.0915 | -0.065 |
| (0.001) | (0.019) | (0.027) | (0.068) | (0.049) | |
| budget | 0.0055 | 0.1452 | 0.255 | 0.6336 | 0.4451 |
| (0.006) | (0.157) | (0.214) | (0.544) | (0.385) | |
| fir_ind | -0.0659*** | -1.5714*** | -1.6821*** | -5.1056** | -3.4655** |
| (0.024) | (0.575) | (0.644) | (2.000) | (1.363) | |
| saving | 0.0004 | 0.0094 | 0.007 | 0.0213 | 0.0143 |
| (0.000) | (0.011) | (0.012) | (0.033) | (0.024) | |
| education | 0.0019*** | -0.0209 | 0.0287 | 0.0293 | 0.0082 |
| (0.001) | (0.021) | (0.026) | (0.069) | (0.049) | |
| _cons | 4.6188*** | 119.5496*** | 104.0117*** | 351.1414*** | 235.5162*** |
| (1.504) | (36.242) | (36.601) | (117.447) | (79.354) | |
| N | 155 | 155 | 155 | 155 | 155 |
The impact of economic development on air pollutants intensity with control variables.
Standard errors in parentheses* p<0.1, ** p<0.05, *** p<0.01.
Table 7 shows the results of Equation (4) with the addition of control variables. As Table 7 shows, after adding the secondary term of night light, the primary term coefficients of CO, NO2, SO2, PM10, and PM2.5 are still significantly negative. CO and NO2 are significant at the 1% confidence level, while SO2, PM10, and PM2.5 are significant at the 5% confidence level. The quadratic coefficients of CO, SO2, PM10, and PM2.5 are insignificant, indicating that the pollution intensity of these pollutants will continue to decline with economic development. However, the quadratic coefficient of NO2 is significantly positive at the confidence level of 10%, indicating a U-shaped relationship between NO2 pollution intensity and economic development. The pollution intensity of NO2 decreases first and then increases with economic development. Hypothesis 2 is confirmed.
Table 7
| (1) | (2) | (3) | (4) | (5) | |
|---|---|---|---|---|---|
| CO_per | NO2_per | SO2_per | PM10_per | PM25_per | |
| light_mean | -0.3206*** | -8.2488*** | -8.5102** | -24.9753** | -17.5821** |
| (0.124) | (3.114) | (3.944) | (10.242) | (7.317) | |
| light2 | 0.0057 | 0.1504* | 0.1628 | 0.4584 | 0.3308 |
| (0.004) | (0.090) | (0.106) | (0.292) | (0.205) | |
| sec_ind | -0.0008 | -0.023 | -0.0262 | -0.0784 | -0.0529 |
| (0.001) | (0.017) | (0.023) | (0.060) | (0.043) | |
| budget | 0.0067 | 0.1798 | 0.3118 | 0.7508 | 0.5363 |
| (0.007) | (0.167) | (0.236) | (0.587) | (0.417) | |
| fir_ind | -0.0626*** | -1.4842*** | -1.5943** | -4.8333** | -3.2713** |
| (0.024) | (0.567) | (0.627) | (1.968) | (1.335) | |
| saving | 0.0003 | 0.0072 | 0.0036 | 0.0138 | 0.0086 |
| (0.000) | (0.011) | (0.014) | (0.035) | (0.025) | |
| education | 0.0020*** | -0.0194 | 0.0317 | 0.0351 | 0.0128 |
| (0.001) | (0.022) | (0.028) | (0.072) | (0.051) | |
| _cons | 4.7699*** | 123.5249*** | 107.2143*** | 362.2369*** | 243.1331*** |
| (1.496) | (36.128) | (36.694) | (116.931) | (79.115) | |
| N | 155 | 155 | 155 | 155 | 155 |
The impact of economic development on air pollutants intensity with the secondary term of night light.
Standard errors in parentheses* p<0.1, ** p<0.05, *** p<0.01.
3.2 Robustness Test
To ensure the reliability of the results of this paper, we adopt two methods for robustness testing, replacing control variables and replacing explanatory variables. All of the robustness tests adopt the results with control variables.
3.2.1 Replace Control Variables
We replaced two essential control variables. The first variable replaced is secondary industry. We use the total industrial output above the designated enterprises (total_ind) instead of secondary industry. This variable represents the gross domestic product value of the most important secondary industry firms. Furthermore, we use the student number per 100,000 in primary schools (education1) instead of the number of students in middle schools. Table 8 shows the robustness test results for the effect of economic development on air pollutants. The coefficients of the mean values of three air pollutants, NO2, PM10, and PM2.5, increase significantly along with economic development, consistent with the results in Tables 3, 4.
Table 8
| (1) | (2) | (3) | (4) | (5) | |
|---|---|---|---|---|---|
| CO | NO2 | SO2 | PM10 | PM2.5 | |
| light_mean | -0.0005 | 0.7427*** | 0.4026* | 0.9786** | 0.5905* |
| (0.004) | (0.131) | (0.234) | (0.418) | (0.314) | |
| total_ind | 0.000 | 0.0021 | 0.001 | 0.0022 | 0.0025 |
| (0.000) | (0.001) | (0.002) | (0.003) | (0.002) | |
| fir_ind | -0.0008 | -0.0622 | -0.0919 | -0.1625 | -0.0956 |
| (0.001) | (0.050) | (0.074) | (0.131) | (0.093) | |
| Budget | -0.0026 | -0.0251 | -0.0059 | 0.0111 | -0.0077 |
| (0.003) | (0.084) | (0.170) | (0.308) | (0.232) | |
| Saving | 0.0001 | -0.0029 | -0.0082 | -0.0152 | -0.0108 |
| (0.000) | (0.007) | (0.014) | (0.025) | (0.019) | |
| education1 | -0.0001 | -0.0103*** | -0.0103* | -0.0248* | -0.0206** |
| (0.000) | (0.003) | (0.006) | (0.013) | (0.010) | |
| _cons | 1.0722*** | 29.9695*** | 23.9216*** | 81.0123*** | 52.8370*** |
| (0.037) | (1.507) | (2.589) | (4.339) | (2.976) | |
| N | 87 | 87 | 87 | 87 | 87 |
The impact of economic development on air pollutants with replacing control variables.
Standard errors in parentheses* p<0.1, ** p<0.05, *** p<0.01.
Table 9 shows the results of the robustness test on the emission intensity of air pollutants when the control variables are replaced. The results show that the emission intensity of several air pollutants still decreases significantly along with economic development. The coefficients and the significance are consistent with the results in Tables 5, 6. The decreasing trend of air pollutants has strong robustness and credibility.
Table 9
| (1) | (2) | (3) | (4) | (5) | |
|---|---|---|---|---|---|
| CO_per | NO2_per | SO2_per | PM10_per | PM2.5_per | |
| light_mean | -0.1671*** | -4.3482*** | -3.8490** | -12.6215*** | -8.2953*** |
| (0.052) | (1.437) | (1.504) | (4.384) | (3.010) | |
| total_ind | -0.0001 | -0.0068 | -0.0095 | -0.0228 | -0.0182 |
| (0.000) | (0.006) | (0.007) | (0.018) | (0.013) | |
| fir_ind | -0.0692*** | -2.1620*** | -2.3085*** | -7.0387*** | -4.6583*** |
| (0.019) | (0.795) | (0.858) | (2.462) | (1.699) | |
| budget | -0.0003 | 0.1192 | 0.3011 | 0.7439 | 0.5515 |
| (0.007) | (0.185) | (0.265) | (0.612) | (0.460) | |
| Saving | 0.0007 | 0.0204 | 0.0131 | 0.0344 | 0.0251 |
| (0.001) | (0.018) | (0.024) | (0.059) | (0.044) | |
| education1 | -0.0002 | -0.0517*** | -0.0441*** | -0.1162*** | -0.0972*** |
| (0.000) | (0.007) | (0.009) | (0.021) | (0.016) | |
| _cons | 5.0615*** | 147.2407*** | 137.1652*** | 443.0357*** | 295.1140*** |
| (1.427) | (44.791) | (45.043) | (136.921) | (93.050) | |
| N | 89 | 89 | 89 | 89 | 89 |
The impact of economic development on air pollutants intensity with replacing control variables.
Standard errors in parentheses* p<0.1, ** p<0.05, *** p<0.01.
3.2.2 Replace the Explained Variable
In the second method, we replace the explained variables to test the robustness of the regression results. We use the logarithm of the mean values of CO, SO2, NO2, PM10, and PM2.5 instead of the mean value of these air pollutants. Table 10 shows the results of the robustness test of the impact of economic development on the ln value of air pollutants. The coefficients of NO2 and PM10 still increase significantly with economic development. The results are consistent with those in Tables 3, 4, and 7.
Table 10
| (1) | (2) | (3) | (4) | (5) | |
|---|---|---|---|---|---|
| LnCO | LnNO2 | LnSO2 | LnPM10 | LnPM2.5 | |
| light_mean | -0.0015 | 0.0181*** | 0.0131 | 0.0079* | 0.0092 |
| (0.004) | (0.003) | (0.013) | (0.004) | (0.006) | |
| sec_ind | 0.0002 | 0.0003** | 0.0007 | 0.0003* | 0.0004* |
| (0.000) | (0.000) | (0.000) | (0.000) | (0.000) | |
| budget | -0.0030* | -0.0009 | -0.007 | -0.0012 | -0.002 |
| (0.002) | (0.001) | (0.005) | (0.002) | (0.003) | |
| fir_ind | -0.0052*** | -0.0047*** | -0.0132*** | -0.0055*** | -0.0057*** |
| (0.001) | (0.001) | (0.003) | (0.001) | (0.002) | |
| saving | 0.0001 | -0.0001 | -0.0002 | -0.0001 | -0.0002 |
| (0.000) | (0.000) | (0.001) | (0.000) | (0.000) | |
| education | 0.0002** | -0.0002** | 0.0004 | 0.0001 | 0.0001 |
| (0.000) | (0.000) | (0.000) | (0.000) | (0.000) | |
| _cons | 1.1547*** | 3.4562*** | 3.2217*** | 4.3986*** | 3.9716*** |
| (0.051) | (0.042) | (0.140) | (0.059) | (0.067) | |
| N | 155 | 155 | 155 | 155 | 155 |
The impact of economic development on air pollutants with replacing explained variables.
Standard errors in parentheses* p<0.1, ** p<0.05, *** p<0.01.
Similarly, we adopt the way of taking ln values of several air pollutants for the replacement to conduct robustness tests on air pollution emission intensity. Table 11 shows the results of the robustness test of the effect of economic development on the ln value of air pollutant emission intensity. The results in Table 10 show that the emission intensity of ln values of five air pollutants, PM10, PM2.5, NO2, SO2, and CO, still show a significant decreasing trend with economic development and are still significant at the 1% confidence level, which is consistent with the results in Tables 5, 6, and 9.
Table 11
| (1) | (2) | (3) | (4) | (5) | |
|---|---|---|---|---|---|
| LnCO_per | LnNO2_per | LnSO2_per | LnPM10_per | LnPM2.5_per | |
| light_mean | -0.1399*** | -0.3849*** | -0.3913*** | -0.5095*** | -0.4676*** |
| (0.042) | (0.109) | (0.118) | (0.146) | (0.135) | |
| sec_ind | -0.0009 | -0.0021 | -0.0029 | -0.0029 | -0.0028 |
| (0.001) | (0.002) | (0.002) | (0.002) | (0.002) | |
| budget | 0.0055 | 0.0143 | 0.0203 | 0.0214 | 0.0204 |
| (0.006) | (0.015) | (0.019) | (0.021) | (0.019) | |
| fir_ind | -0.0659*** | -0.1575*** | -0.1927*** | -0.2146** | -0.2015** |
| (0.024) | (0.060) | (0.072) | (0.084) | (0.079) | |
| saving | 0.0004 | 0.0008 | 0.0008 | 0.0009 | 0.0008 |
| (0.000) | (0.001) | (0.001) | (0.001) | (0.001) | |
| educaiton | 0.0019*** | 0.001 | 0.0035 | 0.0034 | 0.0027 |
| (0.001) | (0.002) | (0.002) | (0.003) | (0.002) | |
| _cons | 4.6188*** | 13.0046*** | 13.4233*** | 17.1758*** | 15.8129*** |
| (1.504) | (3.974) | (4.345) | (5.413) | (5.015) | |
| N | 155 | 155 | 155 | 155 | 155 |
The impact of economic development on air pollutants intensity with replacing explained variables.
Standard errors in parentheses* p<0.1, ** p<0.05, *** p<0.01.
4 Discussion
4.1 Economic Development and Air Pollution
Previous studies indicate that economic development, especially industrial development, aggravates air pollution, mainly because industrial development leads to the direct contribution of the consumption of coal, oil, and other energy forms to the emission of CO, SO2, NO2, and to PM, thereby increasing the concentration of such pollutants in the atmosphere. However, scholars have drawn different conclusions about the relationship between economic development and air pollution. Brajer et al. (2008) and Brajer et al. (2011) found an inverted U-shaped relationship between the concentration of SO2, PM, and NO2 and economic development by using urban data in China. However, He and Wang (2012) believed that there was an inverted U-shaped relationship between PM concentration and per capita income, and there was a U-shaped relationship between SO2 and per capita income. NO2 increases with income. Wang and Huang (2015) believed that PM10, NO2, and SO2 all had a U-shaped relationship with per capita income, which means that air pollution became more severe with economic development. The above studies mainly considered China as a whole. However, there are apparent differences in the mode of economic development and the style of production and life in different regions of China. For example, in northern China, the main fuel is coal. The industry is mainly heavy industry, so the concentration of SO2, inhalable PM, and other air pollutants increases. In contrast, industry in southern China is mainly light industry. In addition, there is no need for heating in winter, making air pollution relatively weak (Li et al., 2012).
In an outward-oriented economy, bay areas in general often becomes the core node of a country’s external and internal connections, giving the area a locational advantage in terms of industrial and population concentration and an important strategic position in national development. More than 60% of the global economy is concentrated in bay-area-dominated mega-city regions (Walker and Schafran, 2015). The trend of people moving from a country’s interior to its coastal regions has been increasing. In this study, as a particular region, we found that only NO2, PM10, and PM2.5 increased significantly with economic development. Simultaneously, CO and SO2 had no relevance to economic development in the Guangdong-Hongkong-Macao GBA. This indicates that in the development of the Guangdong-Hongkong-Macao GBA, industries are constantly emitting NO2 and PM, resulting in the concentration of pollutants in the atmosphere increasing. Table 4 also shows this conclusion. Secondary industry increases air pollution while primary industry decreases air pollution.
4.2 Economic Development and Air Pollution Intensity
The bay area economy has achieved a high level of globalization through its strengths of innovation, productivity, and investment (Volberding, 2011). Hui et al. (2020) argue that the bay area is a new mega-city region with the most critical growth pole and stimulus for global economic growth and technological innovation. The Guangdong-Hongkong-Macao GBA is selected as the research object mainly because it is one of the regions with the most substantial innovation capacity in China. We study the impact of economic development on air pollution under the influence of technological innovation by analyzing the relationship between economic development and air pollution intensity. Our conclusion shows that, under the influence of technological innovation, air pollution intensity in the GBA will continue to decrease as economic development increases. Hypothesis 1 and Hypothesis 2 jointly describe the fact that there is an inverted U-shaped relationship between air pollution and economic development. That is, air pollution increases with economic development at the beginning and eventually decreases with economic development. In GBA, NO2, PM10, and PM2.5 are shown such a trend. At present, the Guangdong-Hongkong-Macao GBA is still in the former stage. CO and SO2 showed a continuous downward trend. The quadratic coefficients of CO, SO2, PM10, and PM2.5 are insignificant, indicating that the pollution intensity of these pollutants will continue to decline with economic development. Forthese types of pollutants, air pollution intensity presents a linear relationship with economic development; the higher the level of economic development, the lower the intensity of these pollutants. It is noteworthy that the intensity of NO2 shows a U-shaped relationship between its pollution level and economic development. In line with economic development, NO2 shows a trend of first decreasing and then increasing. This may be due to the GBA’s higher dependence on NO2-producing industries or the relatively slow progress of technological innovation in reducing NO2 emissions. This result indicates that technological innovation will have different impacts on different pollutants due to existing industrial structures. In future, the GBA should pay more attention to NO2 pollution.
4.3 Remote Sensing Data Use
Remote sensing data have been widely used. These data have significant advantages in areas where it is difficult to obtain data directly (Chen et al., 2022). Human activities and air pollution both show obvious spatial aggregation distribution characteristics. In previous studies, statistics were used for economic development and ground-based monitoring for air pollution. However, these types of data lose a significant proportion of spatial information and are also affected by scale. Therefore, nighttime light data have been increasingly used in socio-economic research. Widespread studies have confirmed that the higher the level of economic development, the higher the brightness of nighttime light data (Elvidge et al., 1997; Henderson et al., 2012; Ji and Wei, 2021). In recent years, nighttime light data have been used to study built-up areas (Ma et al., 2012), freight volume (Shi et al., 2015), population change (Huang et al., 2016; Yu et al., 2019), poverty levels (Zhao et al., 2019), electricity consumption (Shi et al., 2019), housing vacancy (Chen et al., 2015), and other issues directly related to socio-economics. Compared with nighttime light data, air pollutant remote sensing data are not widely used because of the short time series and difficulty of inversion (Wei et al., 2021a). It is even rarer to combine the two types of remote sensing data.
Although this combination solves the problem of data acquisition, it also creates a series of problems. First, arising from how remote sensing data are acquired, the spatial accuracy depends on sensor accuracy, inversion model, and inversion parameters. The two remote sensing datasets are combined for trend study rather than specific values. In this study, the CO remote sensing data have inconsistent trends in different years (Figure 1), and the results may have errors. Second, the time series of data is a problem. The running years of different sensors are inconsistent, making it necessary to choose remote sensing data. The final data may be limited to the shortest data type available if using multiple data sources. Due to the enormous advantages of remote sensing data, the exploration of remote sensing data applications should not stop because of these problems.
5 Conclusions
Based on nighttime light data and remote sensing data of several air pollutants such as CO, NO2, SO2, PM10, and PM2.5 from the year 2013 to 2019 in the GBA, as well as county and regional economic statistics, we examined the relationship between economic development and environmental pollution. Through data analysis, we found that economic development in the GBA caused significant increases in three air pollutants, NO2, PM10, and PM2.5. The effects on two air pollutants, CO and SO2, were insignificant, and this trend remained significant after adding control variables. Subsequently, we further examined the effect of economic development on the emission intensity of air pollutants per unit of light brightness. The results showed that with economic development, the emission intensity per unit of CO, NO2, SO2, PM10, and PM2.5 of several major air pollutants showed a significant decreasing trend, all significant at the 1% confidence level. Among them, PM10 emission intensity decreases the most in several air pollutants. The above conclusions are still robust after testing.
The findings of this paper illustrate that during the rapid economic development of the Guangdong-Hongkong-Macao GBA, the emission intensity of pollutants generated per unit of economic growth decreased significantly. However, some categories of air pollutants increased slightly. Therefore, the Guangdong-Hongkong-Macao GBA shows potential for “green development.” It is foreseeable that with the continuous optimization of the construction of the GBA, the constant improvement of environmental regulations, and the increasing awareness of environmental protection, the level of pollution per unit of economic growth will continue to decline. The continuous reduction in unit emission intensity will eventually lead to a gradual change in the overall pollution level from growth to a cessation of growth and then to a trend of decreasing total pollution. However, whether the future development of the GBA will follow this trend requires continuous monitoring and ongoing research.
Funding
This study has received funding from the Youth Program of Social Science Planning Research in Shandong Province (Nos. 21DJJJ12), the Natural Science Fund General Program of Shandong (Nos. ZR2020MD010), and the Key Research and Development Plan of Shandong Province (Nos. 2019JZZY020103).
Publisher’s Note
All claims expressed in this article are solely those of the authors and do not necessarily represent those of their affiliated organizations, or those of the publisher, the editors and the reviewers. Any product that may be evaluated in this article, or claim that may be made by its manufacturer, is not guaranteed or endorsed by the publisher.
Statements
Data availability statement
Publicly available datasets were analyzed in this study. This data can be found here: Jing Wei (weijing-rs.github.io) Earth Observation Group (noaa.gov).
Author contributions
XJ and SL: conception and design, writing, review, and revision of the manuscript. NJ: study supervision. FW, LF, and XN: analysis and interpretation of data. All authors contributed to the article and approved the submitted version.
Acknowledgments
We gratefully acknowledge the contributions of Shandong Internet of Things Research Institute to collect and verify data. We are also grateful to the reviewers and editor.
Conflict of interest
The authors declare that the research was conducted in the absence of any commercial or financial relationships that could be construed as a potential conflict of interest.
References
1
Aruga K. (2022). “Economic Instrument and Environmental Problems,” in Environmental and Natural Resource Economics (Cham: Springer), 19–58. doi: 10.1007/978-3-030-95077-4_2
2
Brajer V. Mead R. W. Xiao F. (2008). Health Benefits of Tunneling Through the Chinese Environmental Kuznets Curve (EKC). Ecol. Econ.66 (4), 674–686. doi: 10.1016/j.ecolecon.2007.11.002
3
Brajer V. Mead R. W. Xiao F. (2011). Searching for an Environmental Kuznets Curve in China’s Air Pollution. China Econ. Rev.22 (3), 383–397. doi: 10.1016/j.chieco.2011.05.001
4
Brook R. D. Franklin B. Cascio W. Hong Y. Howard G. Lipsett M. et al . (2004). Air Pollution and Cardiovascular Disease: A Statement for Healthcare Professionals From the Expert Panel on Population and Prevention Science of the American Heart Association. Circulation109 (21), 2655–2671. doi: 10.1161/01.CIR.0000128587.30041.C8
5
Cao X. Hu Y. Zhu X. Shi F. Zhuo L. Chen J. (2019). A Simple Self-Adjusting Model for Correcting the Blooming Effects in DMSP-OLS Nighttime Light Images. Remote Sens. Environ.224, 401–411. doi: 10.1016/j.rse.2019.02.019
6
Carey I. M. Anderson H. R. Atkinson R. W. Beevers S. D. Cook D. G. Strachan D. P. et al . (2018). Are Noise and Air Pollution Related to the Incidence of Dementia? A Cohort Study in London, England. BMJ Open8 (9), e022404. doi: 10.1136/bmjopen-2018-022404
7
Chang K. H. Chang M. Y. Muo C. H. Wu T. N. Chen C. Y. Kao C. H. (2014). Increased Risk of Dementia in Patients Exposed to Nitrogen Dioxide and Carbon Monoxide: A Population-Based Retrospective Cohort Study. PLoS One9 (8), e103078. doi: 10.1371/journal.pone.0103078
8
Chang T. Graff Zivin J. Gross T. Neidell M. (2016). Particulate Pollution and the Productivity of Pear Packers. Am. Econ. Journal: Econ. Policy8 (3), 141–169. doi: 10.1257/pol.20150085
9
Chen C. Liang J. Xie F. Hu Z. Sun W. Yang G. et al . (2022). Temporal and Spatial Variation of Coastline Using Remote Sensing Images for Zhoushan Archipelago, China. Int. J. Appl. Earth Observ. Geoinfo.107, 102711. doi: 10.1016/j.jag.2022.102711
10
Chen Z. Wang J. N. Ma G. X. Zhang Y. S. (2013). China Tackles the Health Effects of Air Pollution. Lancet (London Engl.382 (9909), 1959–1960. doi: 10.1016/S0140-6736(13)62064-4
11
Chen Z. Yu B. Hu Y. Huang C. Shi K. Wu J. (2015). Estimating House Vacancy Rate in Metropolitan Areas Using NPP-VIIRS Nighttime Light Composite Data. IEEE J. Selected Topics Appl. Earth Observ. Remote Sens.8 (5), 2188–2197. doi: 10.1109/JSTARS.2015.2418201
12
Chen Z. Yu B. Yang C. Zhou Y. Yao S. Qian X. et al . (2021). An Extended Time Series, (2000–2018) of Global NPP-VIIRS-Like Nighttime Light Data From a Cross-Sensor Calibration. Earth System Sci. Data13 (3), 889–906. doi: 10.5194/essd-13-889-2021
13
Ebenstein A. Fan M. Greenstone M. He G. Yin P. Zhou M. (2015). Growth, Pollution, and Life Expectancy: China From 1991-2012. Am. Econ. Rev.105 (5), 226–231. doi: 10.1257/aer.p20151094
14
Elvidge C. D. Baugh K. E. Kihn E. A. Kroehl H. W. Davis E. R. Davis C. W. (1997). Relation Between Satellite Observed Visible-Near Infrared Emissions, Population, Economic Activity and Electric Power Consumption. Int. J. Remote Sens.18 (6), 1373–1379. doi: 10.1080/014311697218485
15
Elvidge C. D. Baugh K. E. Zhizhin M. Hsu F. C. (2013). Why VIIRS Data are Superior to DMSP for Mapping Nighttime Lights. Proc. Asia-Pacific Advanced Network35 (0), 62. doi: 10.7125/APAN.35.7
16
Freymeyer R. H. Johnson B. E. (2010). A Cross-Cultural Investigation of Factors Influencing Environmental Actions. Sociolog. Spectr.30 (2), 184–195. doi: 10.1080/02732170903496075
17
Grossman G. M. Krueger A. B. (1995). Economic Growth and the Environment. Q. J. econ.110 (2), 353–377. doi: 10.2307/2118443
18
Hanushek E. A. Woessmann L. (2016). “The Role of Education Quality for Economic Growth”. World Bank policy research working paper (No. 4122), doi: 10.1596/1813-9450-4122
19
Hao Y. Peng H. Temulun T. Liu L. Q. Mao J. Lu Z. N. et al . (2018). How Harmful is Air Pollution to Economic Development? New evidence from PM2. 5 concentrations of Chinese cities. J. Clean. Product.172, 743–757. doi: 10.1016/j.jclepro.2017.10.195
20
Henderson J. V. Storeygard A. Weil D. N. (2012). Measuring Economic Growth From Outer Space. Am. econ. Rev.102 (2), 994–1028. doi: 10.1257/aer.102.2.994
21
He J. Wang H. (2012). Economic Structure, Development Policy and Environmental Quality: An Empirical Analysis of Environmental Kuznets Curves With Chinese Municipal Data. Ecol. Econ.76, 49–59. doi: 10.1016/j.ecolecon.2012.01.014
22
Huang Q. Yang Y. Li Y. Gao B. (2016). A Simulation Study on the Urban Population of China Based on Nighttime Light Data Acquired From DMSP/OLS. Sustainability8 (6), 521. doi: 10.3390/su8060521
23
Hui E. C. Li X. Chen T. Lang W. (2020). Deciphering the Spatial Structure of China’s Mega-City Region: A New Bay Area—The Guangdong-Hong Kong-Macao Greater Bay Area in the Making. Cities105, 102168. doi: 10.1016/j.cities.2018.10.011
24
Ji X. Li X. He Y. Liu X. (2019). A Simple Method to Improve Estimates of County-Level Economics in China Using Nighttime Light Data and GDP Growth Rate. ISPRS Int. J. Geo-Information8 (9), 419. doi: 10.3390/ijgi8090419
25
Ji X. Wei J. (2021). The Influence of City-Administered-County System on the Coordinated Development of Urbanization and Industrialization——Historical Investigation of Economic Development of the Municipal District After the Establishment of the New Prefecture-Level City. Res. Econ. Manage.42 (8), 81–95. doi: 10.13502/j.cnki.issn1000-7636.2021.08.006
26
Levin N Kyba C. C Zhang Q. de Miguel A. S. Román M. O Li X et al . (2020). Remote Sensing of Night Lights: A Review and an Outlook for the Future. Remote Sens. Environ.237, 111443. doi: 10.1016/j.rse.2019.111443
27
Liang D Shi L Zhao J Liu P Sarnat J. A Gao S et al . (2020). Urban Air Pollution May Enhance COVID- 19 Case-Fatality and Mortality Rates in the United States. Innovation (N Y NY)1(3), 100047. doi: 10.1101/2020.05.04.20090746
28
Li X. F. Zhang M. J Wang S. J. Zhao A. F. Ma Q. (2012). Variation Characteristics and Influencing Factors of Air Pollution Index in China. Environ. Sci.33 (6), 1936–1943. doi:10.3969/j.issn.2095-6630.2014.18.133
29
Li J. Huang H. (2022). The Ecological Environment Effect of Green Finance: Practical Test of the Greater Bay Area under the Dual Carbon Goal. J. Guangdong Univ. Fin. Econ.180 (1), 87–95.
30
Lu Y. Yang J. Ma S. (2021). Dynamic Changes of Local Climate Zones in the Guangdong–Hong Kong–Macao Greater Bay Area and Their Spatio-Temporal Impacts on the Surface Urban Heat Island Effect Between 2005 and 2015. Sustainability13 (11), 6374. doi: 10.3390/su13116374
31
Ma T. Zhou C. Pei T. Haynie S. Fan J. (2012). Quantitative Estimation of Urbanization Dynamics Using Time Series of DMSP/OLS Nighttime Light Data: A Comparative Case Study From China’s Cities. Remote Sens. Environ.124, 99–107. doi: 10.1016/j.rse.2012.04.018
32
Nasih M. Harymawan I. Paramitasari Y. I. Handayani A. (2019). Carbon Emissions, Firm Size, and Corporate Governance Structure: Evidence From the Mining and Agricultural Industries in Indonesia. Sustainability11 (9), 2483. doi: 10.3390/su11092483
33
Shi K. Yang Q. Fang G. Yu B. Chen Z. Yang C. et al . (2019). Evaluating Spatiotemporal Patterns of Urban Electricity Consumption Within Different Spatial Boundaries: A Case Study of Chongqing, China. Energy167, 641–653. doi: 10.1016/j.energy.2018.11.022
34
Shi K. Yu B. Hu Y. Huang C. Chen Y. Huang Y. et al . (2015). Modeling and Mapping Total Freight Traffic in China Using NPP-VIIRS Nighttime Light Composite Data. GIScience Remote Sens.52 (3), 274–289. doi: 10.1080/15481603.2015.1022420
35
Shi L Zanobetti A Kloog I Coull B. A Koutrakis P Melly S. J et al (2016). Low-Concentration PM2.5 and Mortality: Estimating Acute and Chronic Effects in a Population-Based Study. Environ. Health Perspective. 124 (1), 46–52. doi: 10.1289/ehp.1409111
36
Strieder Philippssen J. Soares Angeoletto F. H. Santana R. G. (2017). Education Level and Income are Important for Good Environmental Awareness: A Case Study From South Brazil. Ecología Austral27 (1), 39–44.
37
Volberding P. (2011). Engaging Regions in Globalization: The Rise of the Economic Relationship Between the San Francisco Bay Area and China. Berkeley Undergrad. J.23 (2). doi: 10.5070/B3232007681
38
Walker R. Schafran A. (2015). The Strange Case of the Bay Area. Environ. Plann. A47 (1), 10–29. doi: 10.1068/a46277
39
Wang L. Chen C. Xie F. Hu Z. Zhang Z. Chen H. et al . (2021a). Estimation of the Value of Regional Ecosystem Services of an Archipelago Using Satellite Remote Sensing Technology: A Case Study of Zhoushan Archipelago, China. Int. J. Appl. Earth Observ. Geoinfo.105, 102616. doi: 10.1016/j.jag.2021.102616
40
Wang M. Huang Y. (2015). China’s Environmental Pollution and Economic Growth. China Econ. Quarterly.14 (2), 557–578. doi: 10.13821/j.cnki.ceq.2015.02.007
41
Wang X. Xu Z. Su H. Ho H. C. Song Y. Zheng H. et al . (2021b). Ambient Particulate Matter (PM1, PM2.5, PM10) and Childhood Pneumonia: The Smaller Particle, the Greater Short-Term Impact? Sci. Total Environ.772, 145509. doi: 10.1016/j.scitotenv.2021.145509
42
Wei J. Li Z. Lyapustin A. Sun L. Peng Y. Xue W. et al . (2021a). Reconstructing 1-Km-Resolution High-Quality PM2. 5 Data Records From 2000 to 2018 in China: Spatiotemporal Variations and Policy Implications. Remote Sens. Environ.252, 112136. doi: 10.1016/j.rse.2020.112136
43
Wei J. Li Z. Xue W. Sun L. Fan T. Liu L. et al . (2021b). The ChinaHighPM10 Dataset: Generation, Validation, and Spatiotemporal Variations From 2015 to 2019 Across China. Environ. Int.146, 106290. doi: 10.1016/j.envint.2020.106290
44
World Bank (2007) Cost of Pollution in China: Economic Estimates of Physical Damages. Available at: http://citeseerx.ist.psu.edu/viewdoc/download;jsessionid=3B88EA96B11319E0ACA529B4D205707E?doi=10.1.1.174.4729&rep=rep1&type=pdf.
45
Yang G. Wang Y. Zeng Y. Gao G. F. Liang X. Zhou M. et al . (2013). Rapid Health Transition in China 1990–2010: Findings From the Global Burden of Disease Study 2010. Lancet381 (9882), 1987–2015. doi: 10.1016/S0140-6736(13)61097-1
46
Yu B. Lian T. Huang Y. Yao S. Ye X. Chen Z. et al . (2019). Integration of Nighttime Light Remote Sensing Images and Taxi GPS Tracking Data for Population Surface Enhancement. Int. J. Geogr. Inf. Sci.33 (4), 687–706. doi: 10.1080/13658816.2018.1555642
47
Zhan S. Kuang Y. Ruan Z. (2018). Factors Impacting the Regional Air Quality in the Guangdong-Hong Kong-Macao Greater Bay Area: A Study Based on Grey Relational Analysis. J. Tsinghua Univ. (Science Technology)58 (8), 761–767. doi: 10.16511/j.cnki.qhdxxb.2018.26.031
48
Zhao X. Yu B. Liu Y. Chen Z. Li Q. Wang C. et al . (2019). Estimation of Poverty Using Random Forest Regression With Multi-Source Data: A Case Study in Bangladesh. Remote Sens.11 (4), 375. doi: 10.3390/rs11040375
49
Zhu Y. Xie J. Huang F. Cao L. (2020). Association Between Short-Term Exposure to Air Pollution and COVID-19 Infection: Evidence From China. Sci. total Environ.727, 138704. doi: 10.1016/j.scitotenv.2020.138704
Summary
Keywords
Guangdong-Hongkong-Macao Greater Bay Area, nighttime light data, air pollution, economic development, environmental protection.
Citation
Ji X, Li S, Jiang N, Wang F, Fan L and Niu X (2022) The Impact of Economic Development of the Guangdong-Hongkong-Macao Greater Bay Area on Air Pollution: Investigation Based on Remote Sensing Data of Nighttime Lights and Air Pollution. Front. Mar. Sci. 9:954361. doi: 10.3389/fmars.2022.954361
Received
27 May 2022
Accepted
23 June 2022
Published
22 July 2022
Volume
9 - 2022
Edited by
Chao Chen, Zhejiang Ocean University, China
Reviewed by
Dabin Ji, Chinese Academy of Sciences (CAS), China; Xiaoqing Wu, Chinese Academy of Sciences (CAS), China; Yaqian He, University of Central Arkansas, United States
Updates
Copyright
© 2022 Ji, Li, Jiang, Wang, Fan and Niu.
This is an open-access article distributed under the terms of the Creative Commons Attribution License (CC BY). The use, distribution or reproduction in other forums is permitted, provided the original author(s) and the copyright owner(s) are credited and that the original publication in this journal is cited, in accordance with accepted academic practice. No use, distribution or reproduction is permitted which does not comply with these terms.
*Correspondence: Na Jiang, jiangna123321@163.com
†These authors have contributed equally to this work and share first authorship
This article was submitted to Marine Conservation and Sustainability, a section of the journal Frontiers in Marine Science
Disclaimer
All claims expressed in this article are solely those of the authors and do not necessarily represent those of their affiliated organizations, or those of the publisher, the editors and the reviewers. Any product that may be evaluated in this article or claim that may be made by its manufacturer is not guaranteed or endorsed by the publisher.