Abstract
Marine floating raft aquaculture forms an integral component of the monitoring of coastal marine environments. It is essential to accurately obtain the spatial distribution of marine floating raft aquaculture to gain the fullest understanding of the development of marine fishery production, optimization of the spatial layout of aquaculture, and protection of the marine environment. The Sentinel-2 Multispectral Instrument (MSI) is used to acquire optical imagery at a high spatial and temporal resolution, sampling 13 spectral bands in the visible, near-infrared, and short-wave infrared parts of the spectrum. This research reports how a decision-tree-based procedure was developed to map marine floating raft aquaculture using Sentinel-2A MSI imagery and DEM (Digital Elevation Model) data. Three indices and spectral features were used in this algorithm to differentiate marine floating rafts from other land-cover and land-use types in Fangchenggang City, China. These included the Differential Ratio Floating Raft Index (DRRI), newly proposed in the paper, the Normalized Difference Vegetation Index (NDVI), and visible reflectance. Additionally, a comparison was made between the decision tree classification method (DT) and the random forest (RF) and support vector machine (SVM) methods. The results demonstrate that these three methods can obtain raft information with high accuracy. Finally, the classification results were merged into aquaculture rafts and non-aquaculture rafts. The overall accuracy for DT was 98.20% and 1.28 and 4.99 percentage points higher than RF and SVM, respectively. The user accuracy for marine floating rafts for DT (98.25%) was also markedly higher than that of RF and SVM methods (93.97% and 86.50%, respectively). The producer accuracy for marine floating rafts through the DT method was 98.17%, 0.81 percent lower than that of RF, and 1.03 percent lower than that of SVM. The decision-tree method does not assume strict data distribution parameters, optimization of the application of multispectral imagery and elevation data becomes possible, and combing with the DRRI index, then results in higher classification accuracies of marine floating rafts. When using multi-source data of different types and distributions to map marine floating rafts, a decision-tree method, therefore, appears to be superior to RF and SVM classifiers.
1. Introduction
Floating raft aquaculture is generally found in the shallow marine regions, consisting of cultures of macroalgae, shellfish, and other marine animals (Yu, 2019). Following the rapid growth of the fishery market scale, the floating raft density in seawater continues to increase, resulting in the slowdown of seawater flow, thereby reducing the exchange capacity of the bay water, causing many marine ecological problems. It is important to ascertain the distribution of floating rafts in the marine area for the following reasons: to inform and develop macro governmental regulations; to ensure the protection of marine ecological environments; to guarantee safe ship navigation and reasonable planning of cultures, facilitating production value estimations.
Floating raft aquaculture is primarily located in offshore areas that are difficult to cover using traditional manual monitoring methods. With a wide range of distribution and a tendency to increase year by year, this represents the urgent requirement for timely monitoring. Manual aerial surveys are time-consuming and laborious, showing the potential in the use of satellite remote sensing as an efficient means to obtain information on floating raft distribution, a method that is suitable for long-term dynamic monitoring. Remote sensing extraction of floating raft aquaculture areas carried out by both domestic and foreign scholars usually uses visual interpretation (Yang et al., 2005; Cheng et al., 2012), object-oriented methods (Chu et al., 2008; Loberternos et al., 2016; Wang et al., 2018; Yu, 2019; Liu et al., 2020), image enhancement methods (Liu et al., 2013; Fan et al., 2015), and deep learning (Cui et al., 2019a; Cui et al., 2019b; Liu et al., 2019a; Liu et al., 2019b) based methods.
Visual interpretation methods involve interpreting floating raft information directly using the human eye alone by following certain interpretation markers (Yang et al., 2005; Cheng et al., 2012). The efficiency of this type of method is low (Rajitha et al., 2007; Jayanthi, 2011), and generally focuses on a small number of floating rafts as training samples. Image enhancement methods normally involve the use of information enhancement indices to extract floating raft information. The image enhancement and classification method based on neighborhood analysis being designed (Liu et al., 2013) demonstrate a good extraction effect for seine farming areas. Through the use of feature extraction with a joint sparse representation classification method and other information enhancement methods, Fan (Fan et al., 2015) efficiently extracted floating raft information from a single high-resolution SAR image.
However, there is room for improvement in classification accuracy. The mariculture floating raft extraction methods which combine optical and SAR images to create one single fused image can improve the classification accuracy (Yu, 2019), but the fused image makes full use of the rich spectral features of the original optical images difficult. Object-oriented methods establish classification systems based on the spectral, textural, and spatial features of floating raft targets (Du et al., 2013; Xu et al., 2018). Liu (Liu et al., 2020) located floating raft targets by processing Landsat8 images using object-oriented NDVI, NDWI, and edge extraction operators, however, most object-oriented classification systems require additional expert experience, making such methods more subjective (Xue et al., 2018).
Compared with traditional methods, machine learning and deep learning methods can improve the extraction efficiency of floating raft information. However, it should be noted that general machine learning and object-oriented methods are more prone to the phenomenon of “adhesion”(Liu et al., 2019a; Liu et al., 2019b; Yu, 2019; Liu et al., 2020), and the fact that a large number of aquaculture areas on land are misclassified as floating raft targets when this method is used is problematic. Chu (Chu et al., 2020) proposed a support vector machine method combining spectral and texture features based on GF-1 image data. This improved overall classification accuracy, acting to reduce the “adhesion” phenomenon when compared with general machine learning methods, however, the extraction accuracy was reduced without the presence of strong local spectral features due to the reduced number of bands in GF-1 data. Cui (Cui et al., 2019a; Cui et al., 2019b) proposed a fully convolutional neural network method as another way to overcome this “adhesion” phenomenon. However, this method requires a large number of training samples with high spatial resolution and the extraction of floating rafts on a large spatial scale, which can lead to the omission of floating rafts in coastal rivers. Sui (Sui et al., 2020) proposed a semantic segmentation-based algorithm for offshore fish box and floating raft extraction, but the learning and extraction efficiency of this method is reduced when dealing with remote sensing images over larger areas.
Commonly used remote sensing data for extracting marine floating raft aquaculture areas mainly includes optical images such as GF-1 (Wang et al., 2018; Cui et al., 2019a; Cui et al., 2019b; Chu et al., 2020); GF-2(Liu et al., 2019a; Liu et al., 2019b); SPOT-5 (Chu et al., 2008; Liu et al., 2013); Landsat TM (Yang et al., 2005); Landsat 8 OLI (Yu, 2019; Liu et al., 2020) and SAR images (such as GF-3 (Yu, 2019) X-band SAR images (Fan et al., 2015)), and Phil-Lidar2 LiDAR (Loberternos et al., 2016) point cloud data. Extraction studies of mariculture rafts based on Sentinel-2 imagery have been less reported. Sentinel-2 consists of two satellites, Sentinel-2A and Sentinel-2B, which carry a multispectral imager (MSI). This covers 13 spectral bands, from visible to short-wave infrared, and can acquire multispectral images with a revisit period of 5 d (10 d for a single satellite) with a spatial resolution of up to 10m. Therefore, its high spatial and temporal resolution alongside the wide working band has great potential for the remote sensing identification of floating rafts. Additionally, marine-farmed rafts are distributed in coastal waters with low elevation, and a combination of DEM (Digital Elevation Model) data can make full use of this feature leading to the potential improvement of the accuracy of raft extraction.
Accordingly, this paper uses Pearl Bay in Fangchenggang City, Guangxi as the study area. This study aims to construct a spectral index of floating rafts by comparing the differences in spectral characteristics of typical features based on Sentinel-2MSI satellite images and making full use of the special coastal environment in which the offshore floating rafts are located, to eventually establish a decision tree model to extract offshore floating raft areas based on Sentinel-2 and DEM data.
2. Data & methodology
2.1 Overview of the study area
The study area selected in this paper is at the southernmost point of the Chinese mainland coastline (107°28′E~108°36′E, 20°36′N~22°22′N), located in Pearl Bay, Fangchenggang City. The area borders Vietnam to the southwest and contains 580 km of coastline with a subtropical monsoon climate. The latitude and longitude range of the study area is 108°0′E~108°19′E, 21°25′N~21°39′N, as shown in Figure 1.
Figure 1
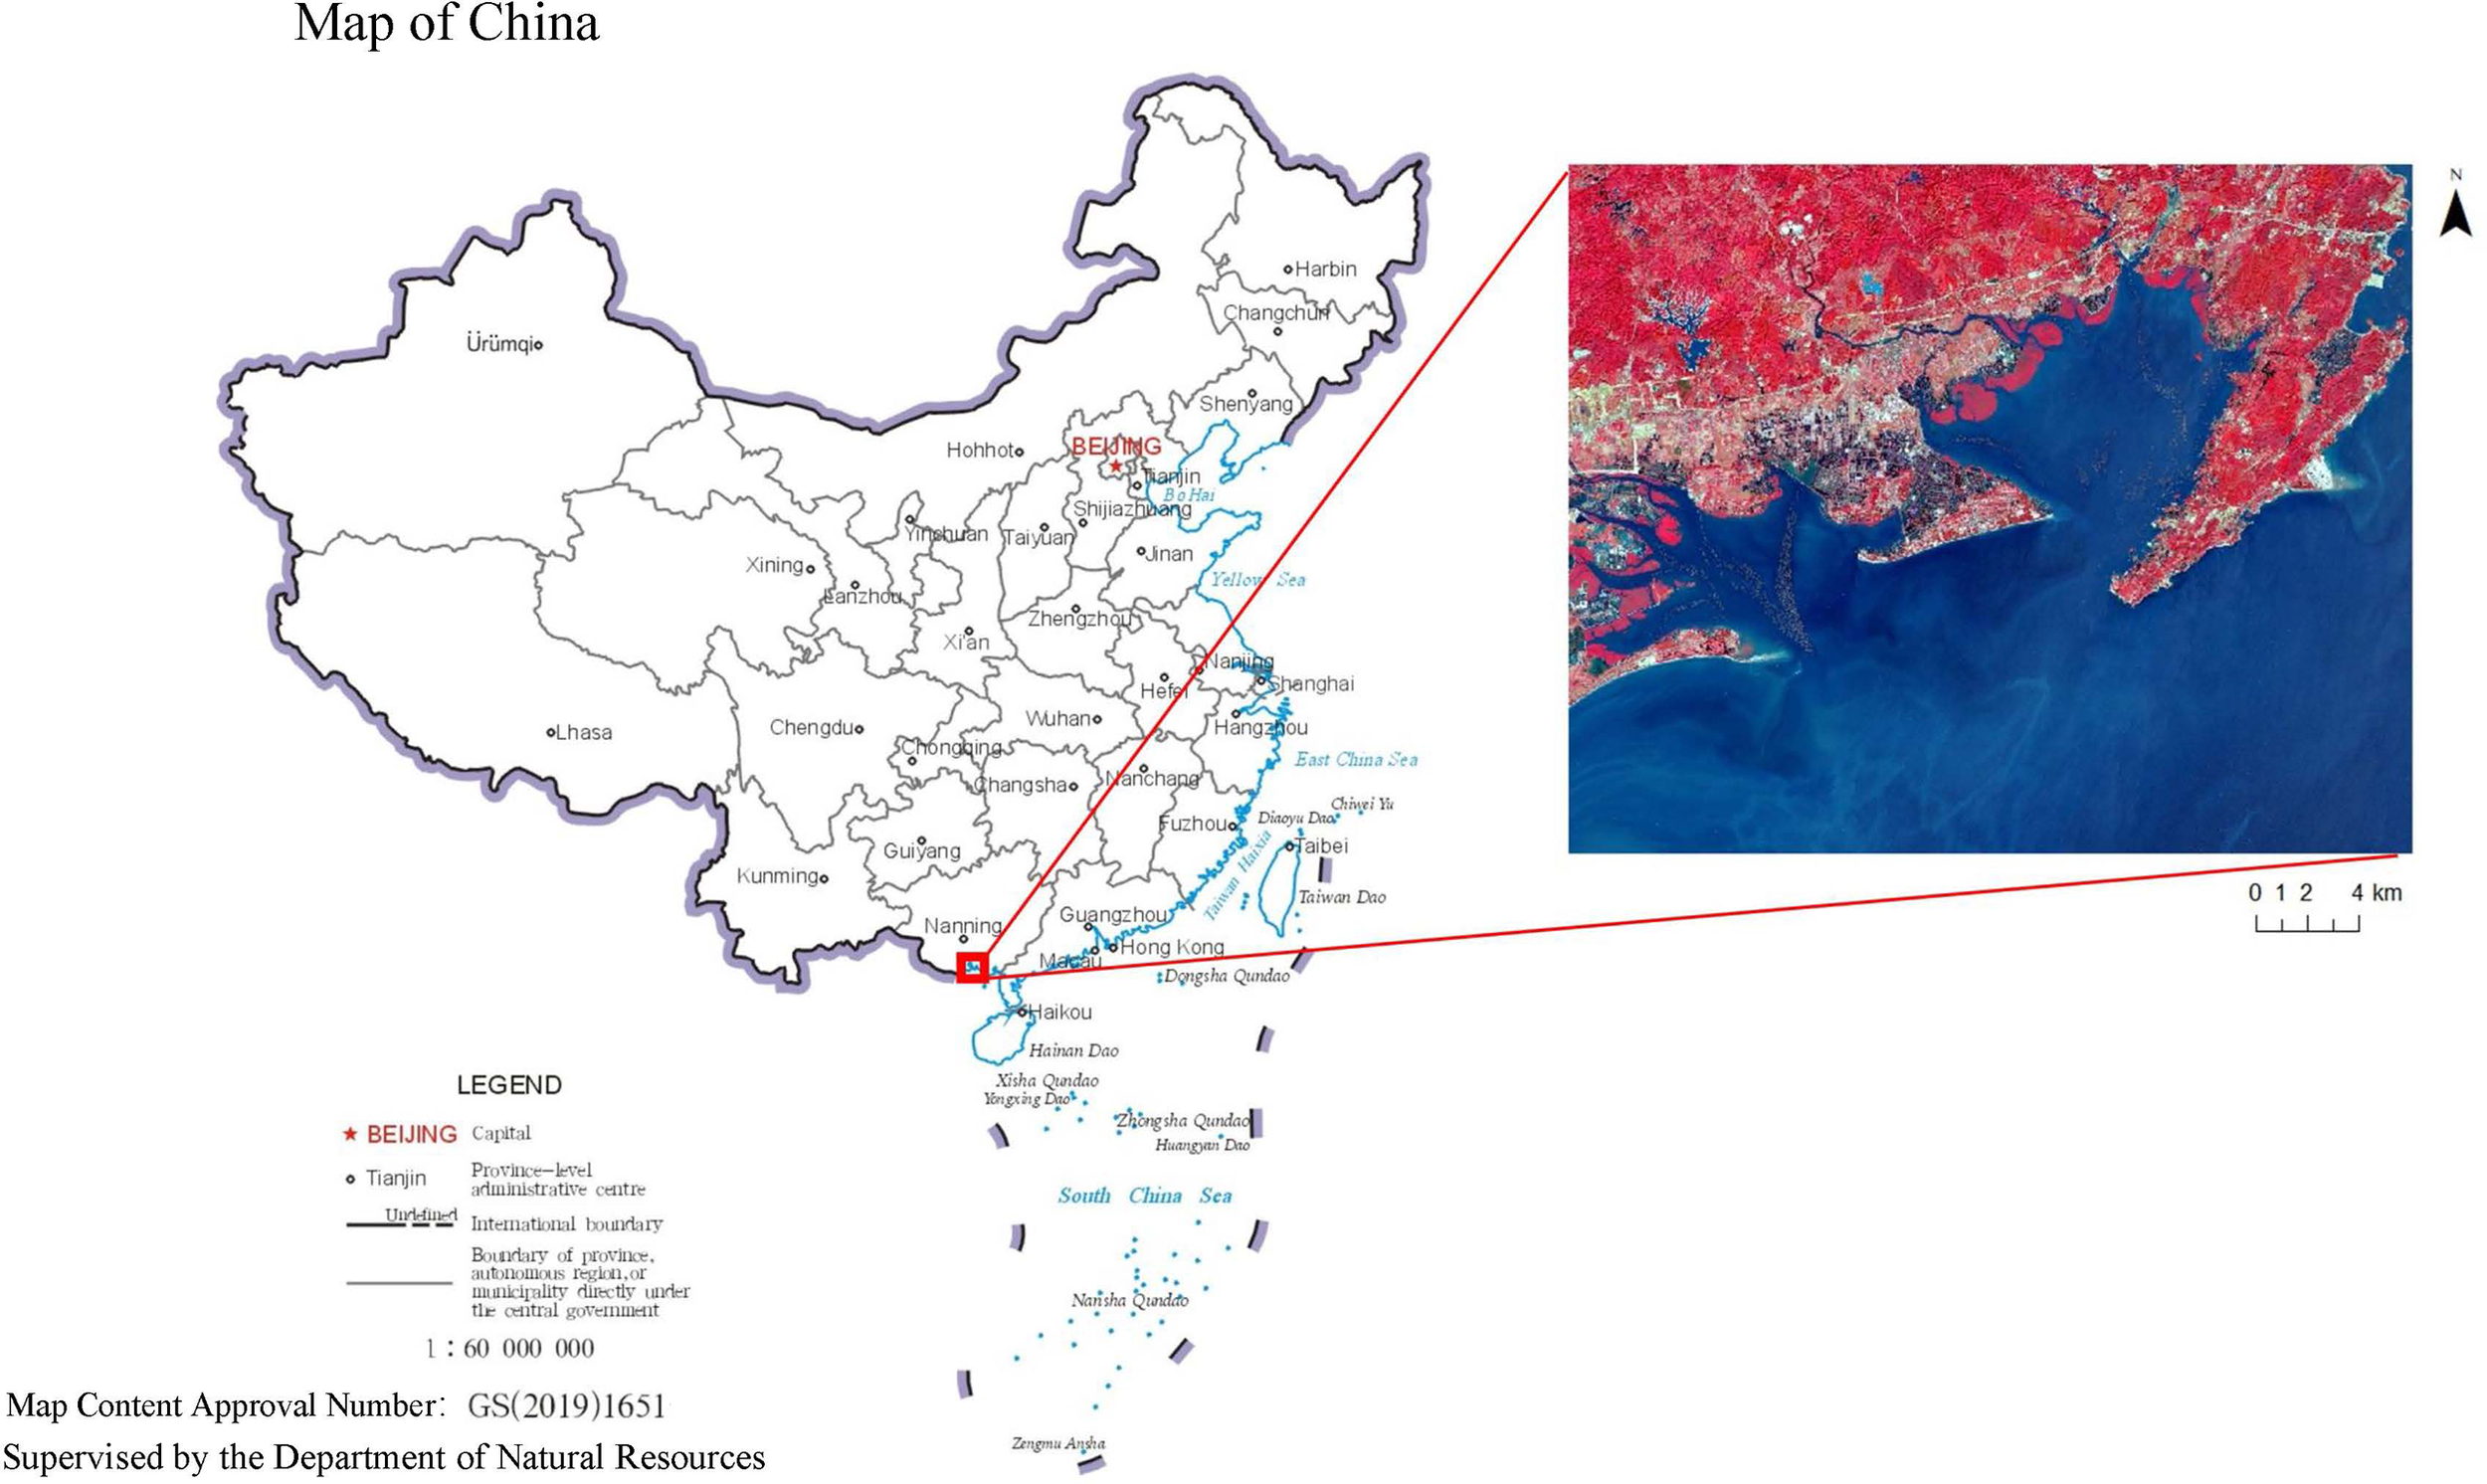
The geographical location of the study area and Sentinel-2A standard false color composite image of the study area.
The deep-water wind & wave-resistant aquaculture base for fish farming in Pearl Bay represents the first national marine ranching core demonstration area in Guangxi Province, where enterprises develop the deep-sea net box and new shellfish floating raft aquaculture in both the marine breeding area and surrounding waters. The offshore deep-water wind and wave resistant net cage and new shellfish floating raft culture cage are two new types of aquacultures forming an important element of the development of marine fisheries in Fangchenggang City, possessing a large economic value. The floating raft in this area averages about 15m-20m wide and 55m-60m long. This means that when the spatial resolution is 10m, the floating raft target generally occupies about 2-3 pixels in width and about 6-8 pixels in length.
2.2 Data acquisition
2.2.1 Satellite imagery data
In this paper, the satellite image data used for the extraction of aquaculture floating raft information is the Sentinel-2A satellite image. Sentinel-2 is composed of two satellites, “2A” and “2B”, carrying a high-resolution multispectral imaging device with 13 bands from the visible to the near-infrared and short-wave infrared, whose band settings and performance indicators are detailed in Table 1. This experiment uses the atmospherically corrected S2A satellite data product of the L2A level acquired on December 21, 2020. The atmospheric correction of data is based on Sen2Cor. To allow for the difference in resolution of Sentinel-2A data in different bands, the data are resampled using cubic convolutions. This experiment includes band data with 10m (B2, B3, B4, B8) and 20m (B6) resolution, and data with a 20m spatial resolution are resampled to 10m resolution to enable subsequent experiments. Data are selected for the newly formed index and model used in this study and were selected by index principle and accuracy assessment of models.
Table 1
| Band Number | Central Wavelength (nm) | Band Width (nm) | Spatial resolution (m) |
|---|---|---|---|
| 1 | 443.9 | 27 | 60 |
| 2 | 496.6 | 98 | 10 |
| 3 | 560.0 | 45 | 10 |
| 4 | 664.5 | 38 | 10 |
| 5 | 703.9 | 19 | 20 |
| 6 | 740.2 | 18 | 20 |
| 7 | 782.5 | 28 | 20 |
| 8 | 835.1 | 145 | 10 |
| 8A | 864.8 | 33 | 20 |
| 9 | 945.0 | 26 | 60 |
| 10 | 1373.5 | 75 | 60 |
| 11 | 1613.7 | 143 | 20 |
| 12 | 2202.4 | 242 | 20 |
Sentinel-2A band data.
2.2.2 DEM data
The DEM data used in this paper is the SRTM (Shuttle Radar Topography Mission) DEM, comprising digital elevation data obtained from the Shuttle Radar Topography Mission SRTM. NASA and the National Geospatial-Intelligence Agency (NGA) conducted this 11-day mission from February 11 to 22, 2000, on board the Space Shuttle Endeavour. The data used for this experiment are 30m resolution SRTM DEM products.
2.2.3 Sample data set
The data sample for this study was determined through the combining of quasi-synchronous high-resolution Google images with visual interpretation from Sentinel-2 images. The spatial distribution of the samples is shown in Figure 2. 7488 sample pixels were extracted by sample polygons, of which 639, 631, 505, 661, 679, 861, 915, 2597 were artificial buildings, bare soil, sandy beaches, land vegetation, mangroves, water bodies, land aquaculture ponds, and floating rafts, respectively. 1369 floating raft pixels and 1941 non-floating pixels (including artificial buildings, bare soil, sandy beaches, land vegetation, mangroves, water bodies, and land-based aquaculture ponds 494, 472, 242, 390, 460, 431, 461 respectively) were randomly selected as training samples, with the remaining ones being validation samples. Data is processed with weights in RF and SVM, detailed process models are in Section 3.2. Category definitions are shown in Table 2.
Figure 2
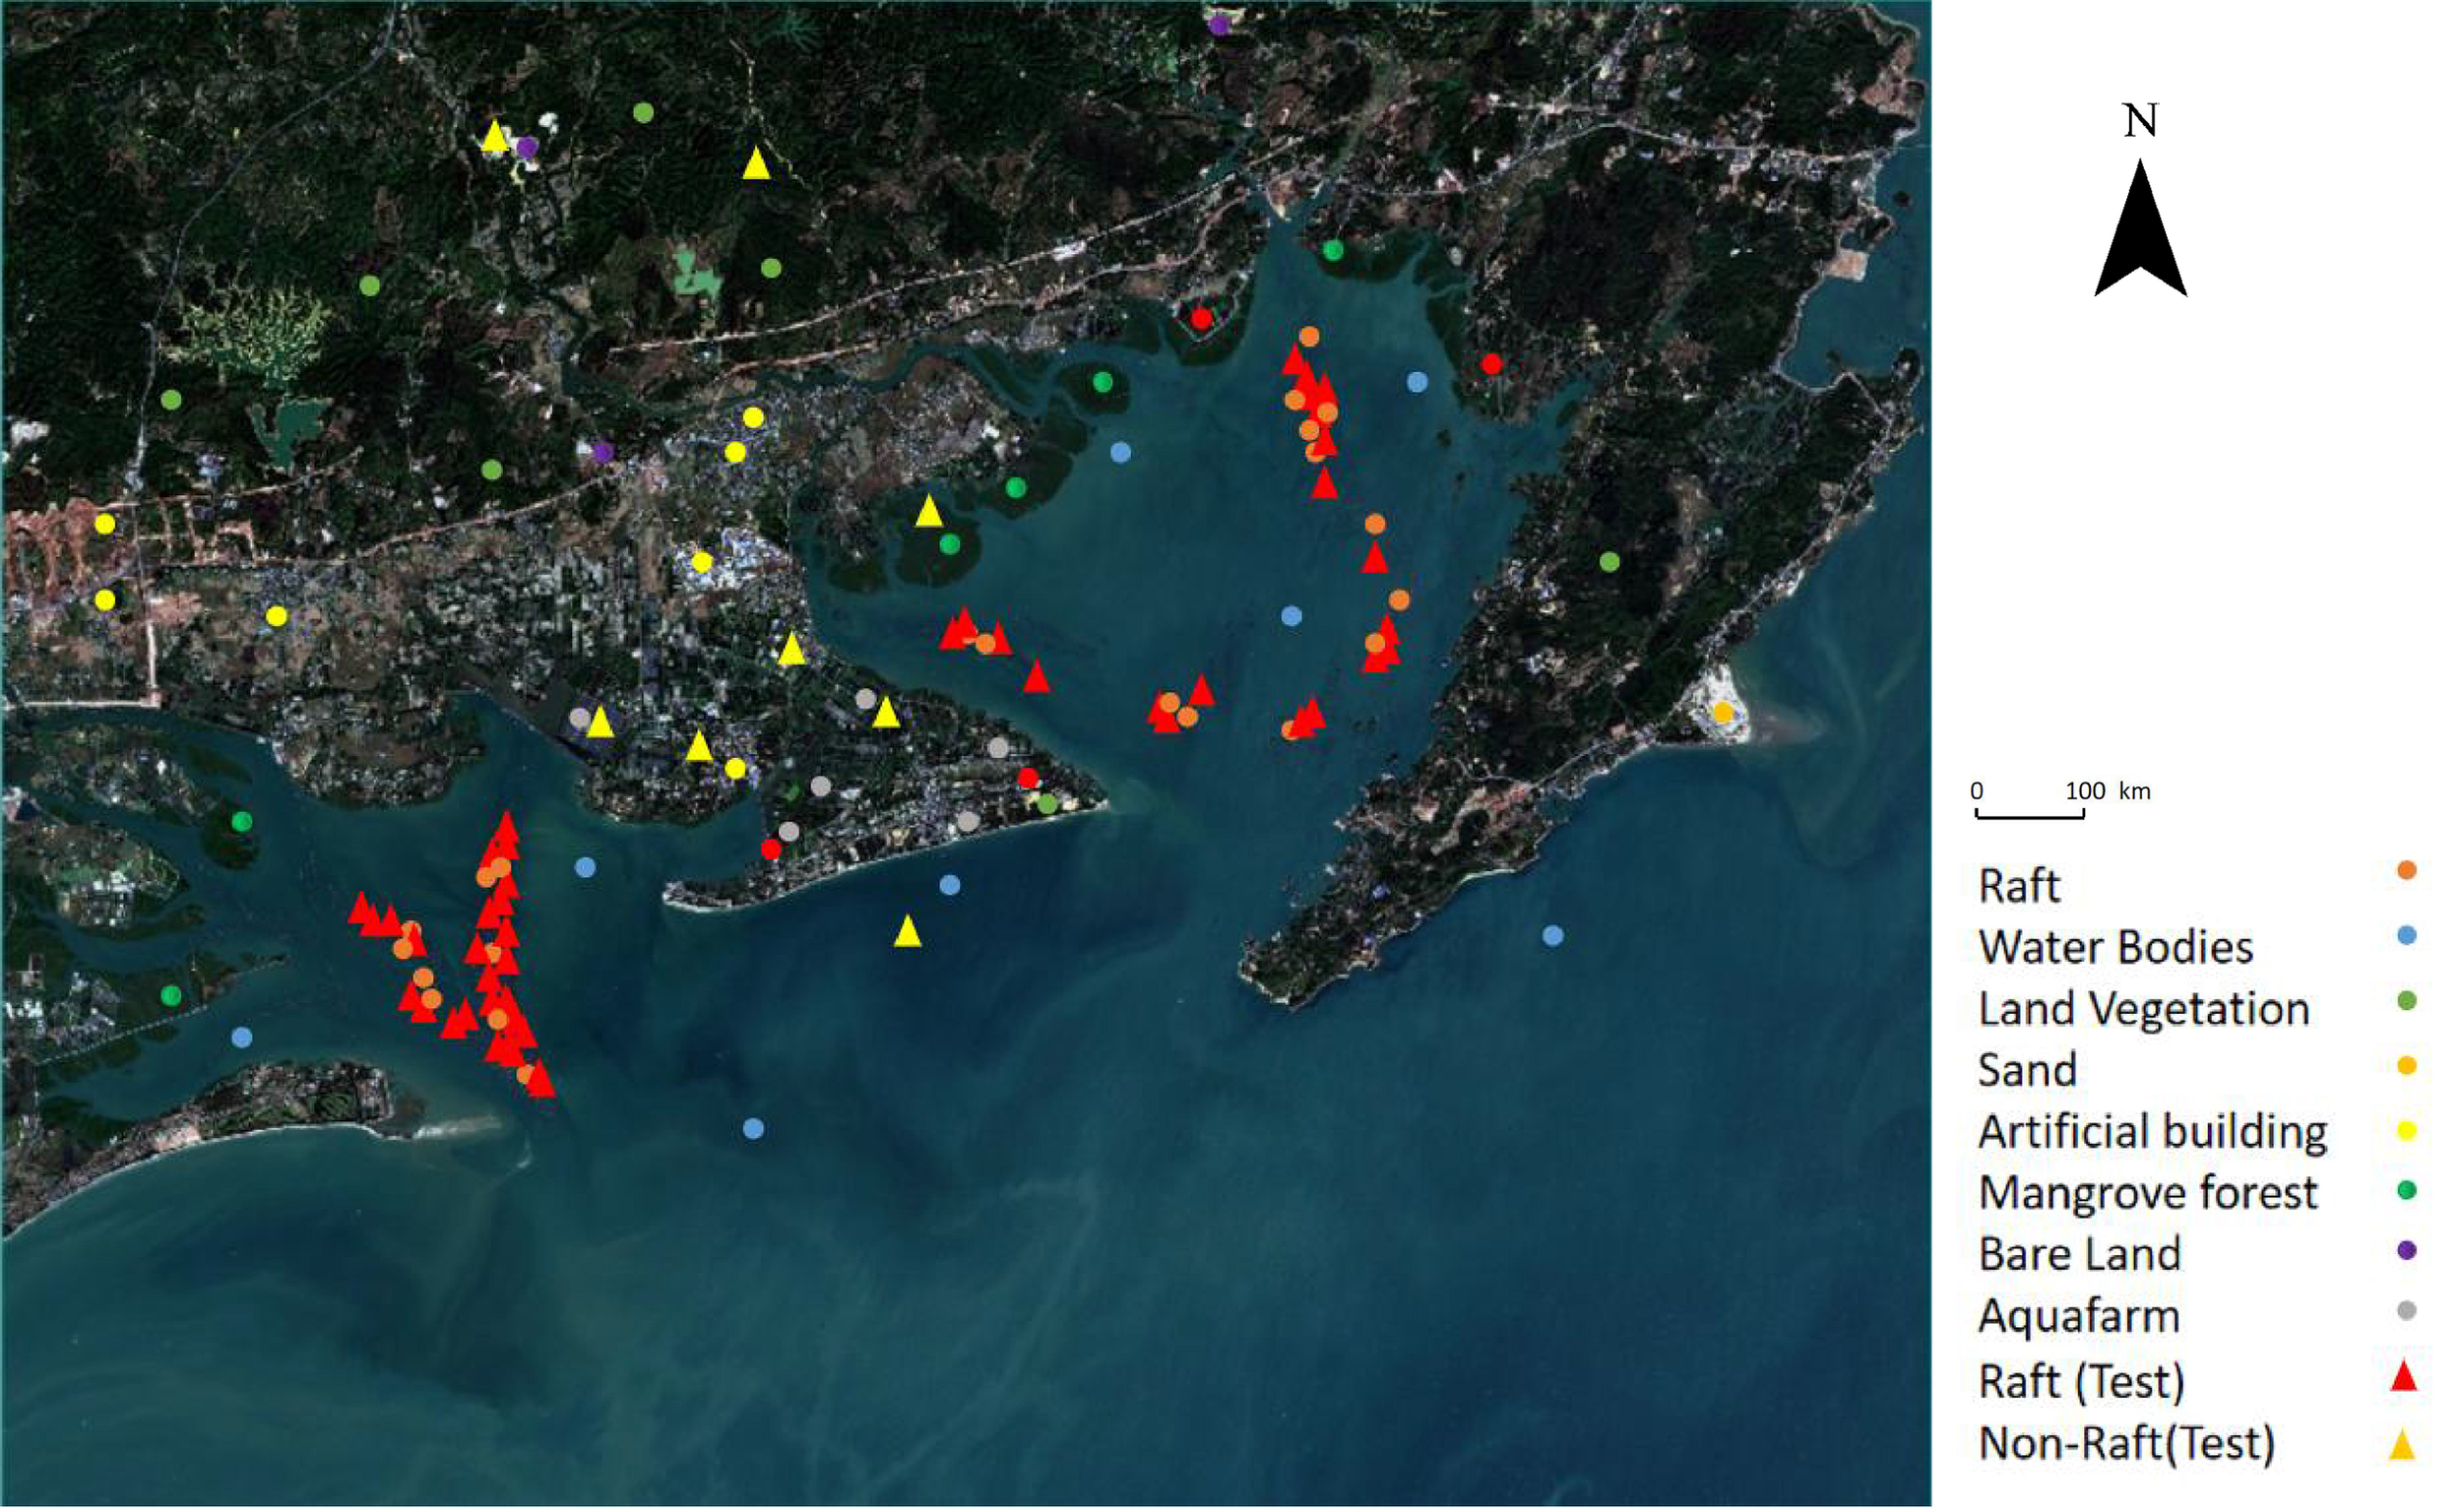
Sample Distribution.
Table 2
| Classes | Classification Class Definition | |
|---|---|---|
| Raft | Areas covered by floating Rafts used for aquaculture | |
| Non-Raft | Water Bodies | Areas covered by sea, rivers, lakes |
| Bare land | Areas covered by exposed soil | |
| Artificial building | Areas covered by artificial facilities | |
| Aquafarm | Areas covered by aquaculture ponds on the coast. | |
| Mangrove Forest | Areas covered by both closed and open mangrove forests | |
| Sand | The region of the shore of the sea | |
| Land vegetation | Areas covered by vegetation on the land | |
Category Definition.
2.3 Research methodology
2.3.1 Analysis of Spectral Characteristics
The typical features in this study area comprise floating rafts, land-based aquaculture areas (Aquafarm), water bodies, vegetation (land-based vegetation and mangroves), bare land, artificial buildings, and sandy beaches (Sand). The Sentinel-2A reflectance data were combined with the region of interest (ROI) for statistical purposes (in Figure 3) to analyze the reflectance characteristics of the typical features within the study area. The reflectance of the floating raft shows a peak with increasing wavelength, a trough value (0.040) in the near-infrared band (740.2 nm-782.5 nm), and reflectance of 0.061 at 835.1 nm. The reflectance of the floating raft decreases continuously from 835.1 nm to 945 nm, decreases to 0.021 at 945 nm, and then increases to 0.040 at 2202.4 nm. The reflectivity of the raft at the wavelength of 2202.4 nm is 0.030.
Figure 3
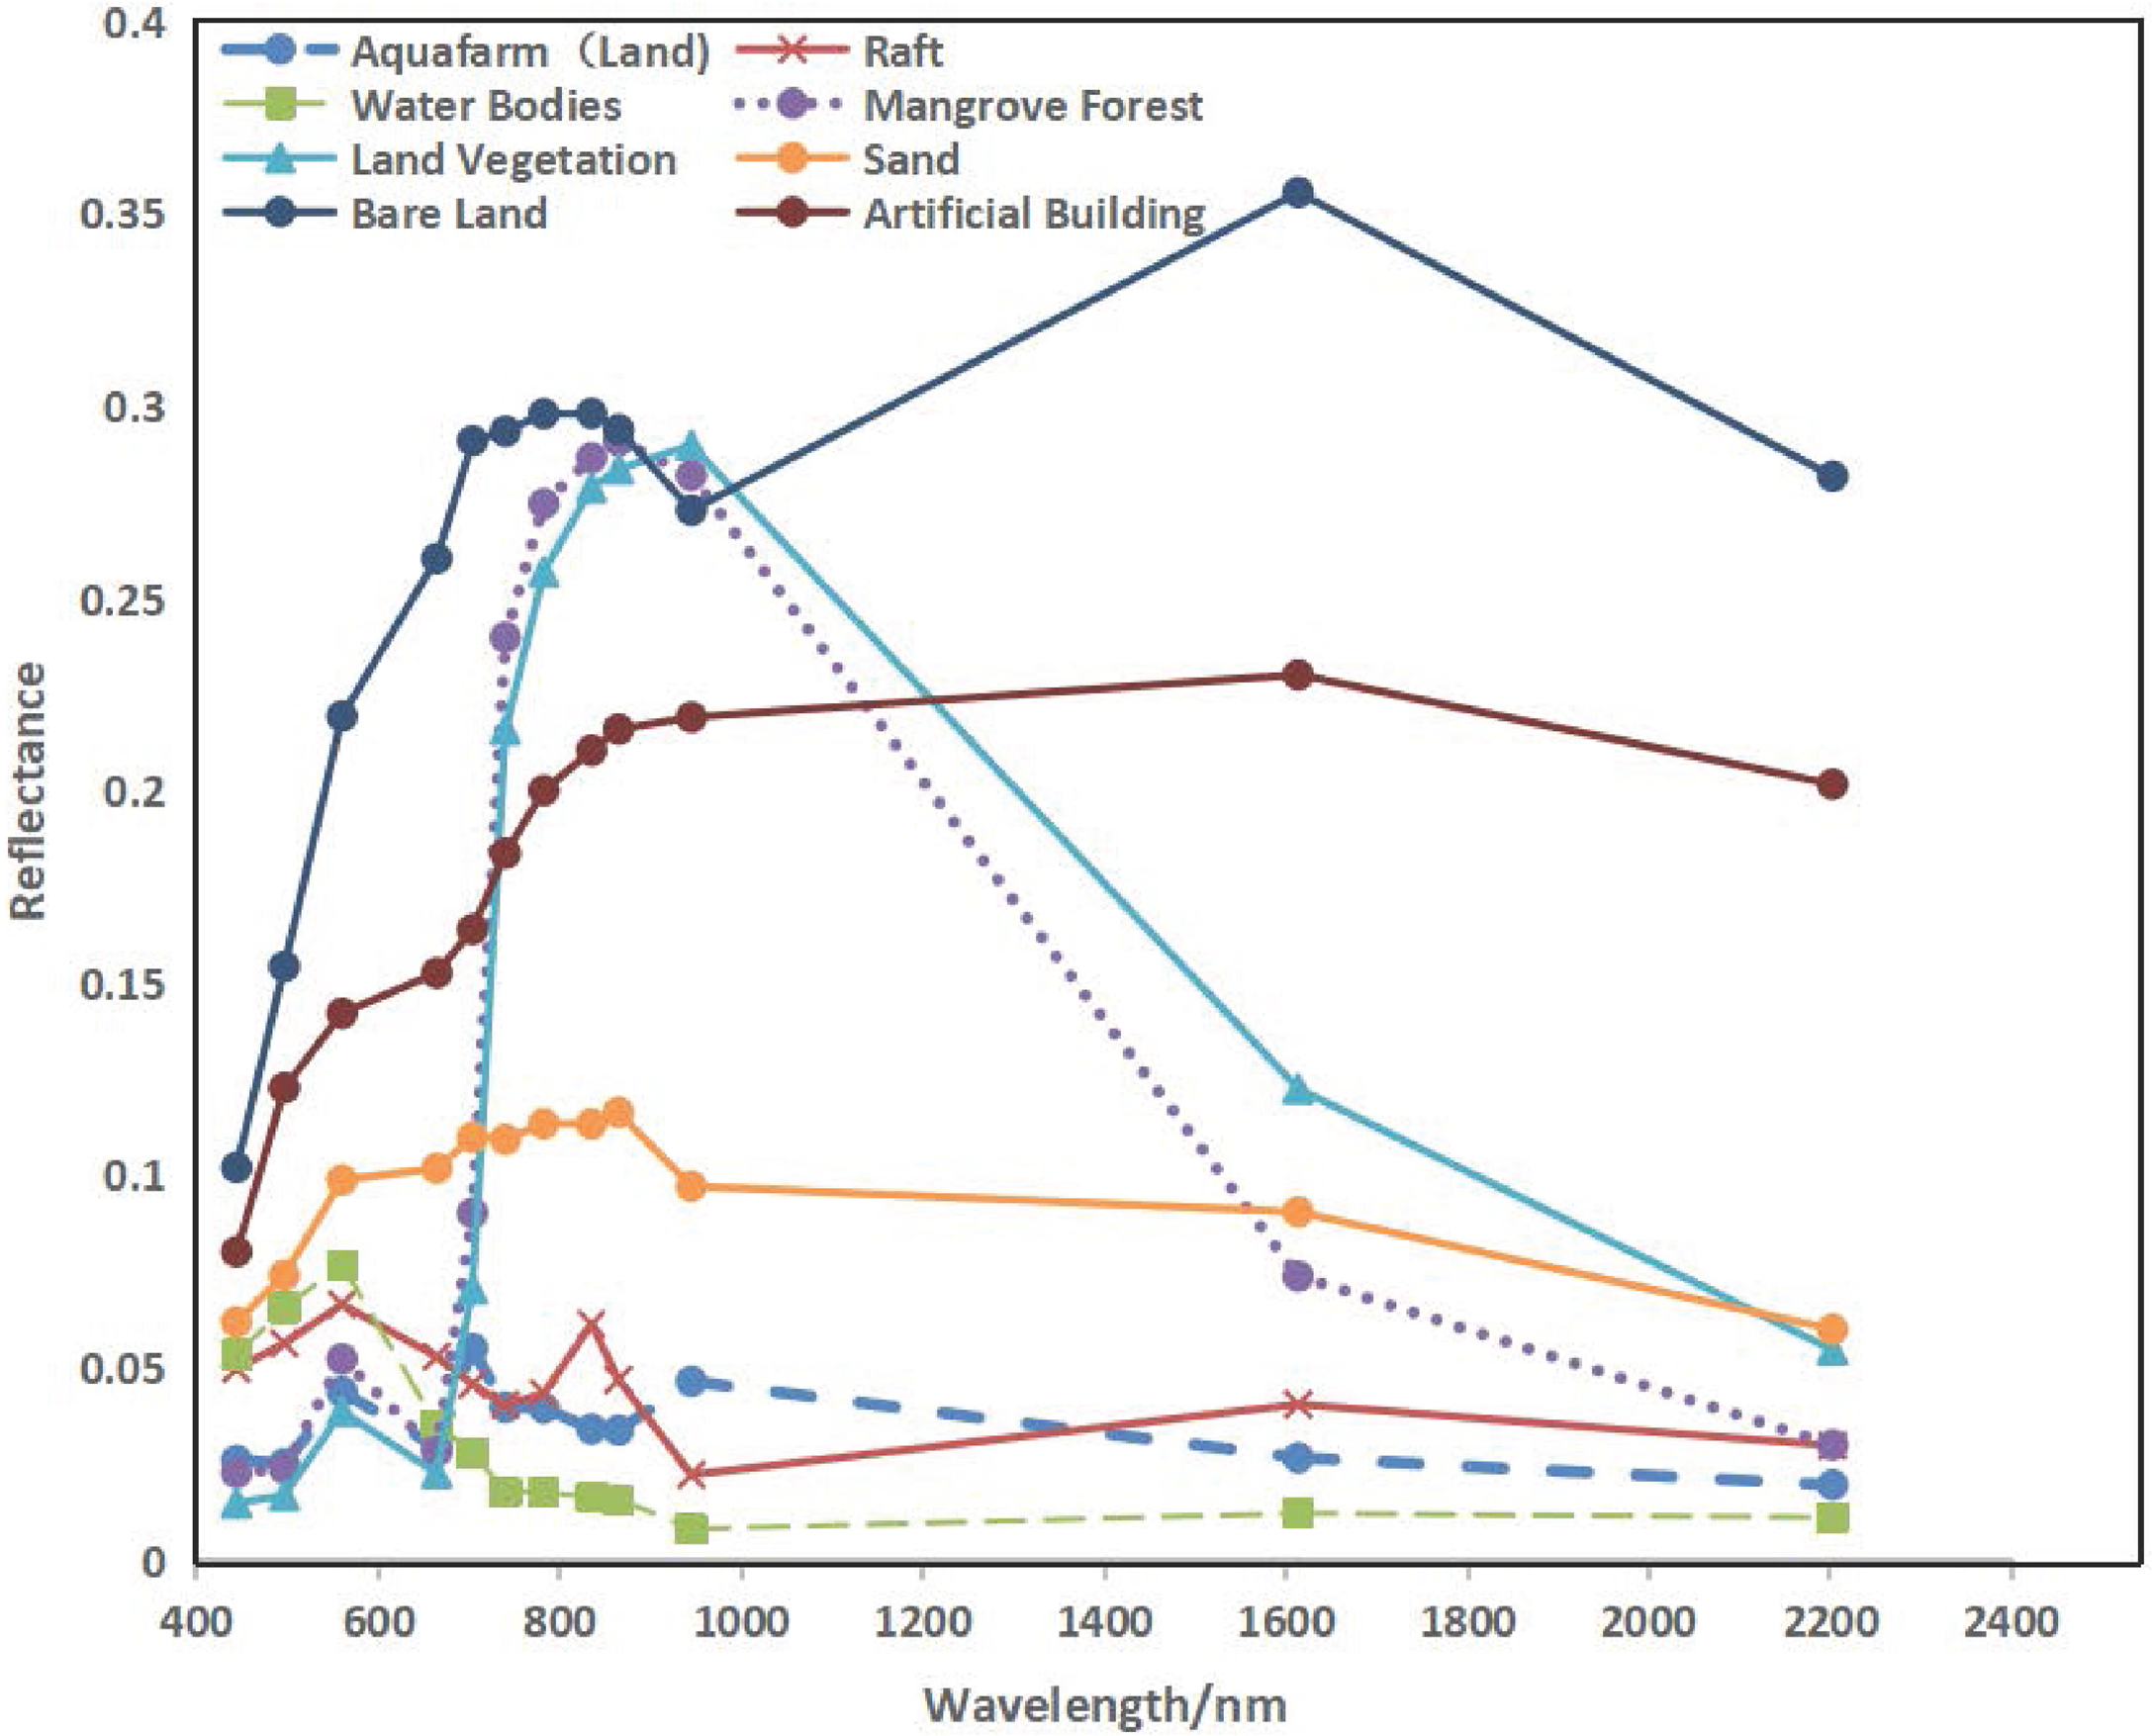
Schematic of the reflectivity curve between the floating raft and the water body.
The reflectance of the land-based aquafarm and the floating raft were close to each other, however, the difference between them was obvious in the visible wavelength, while the similarity is high in the NIR. The difference between the two is most obvious at 496.6 nm, where the reflectance of the floating raft is about twice as high as that of the land-based aquafarm. From the perspective of the change in reflectance values with wavelength, the change in reflectance between the floating raft and the land-based aquafarm is in the opposite direction from 835.1 nm to 945 nm, and the slope of the change in reflectance of the floating raft is larger in absolute value than that of the aquafarm. The reflectance of the floating raft increased while that of the aquafarm decreased.
The reflectance of the water bodies increases with wavelength then decreases and tends to level off in general, with the highest being 0.076 (560 nm) and the lowest being 0.008 (945 nm). This is closer to the reflectance of the floating raft in the visible band, while the difference in the NIR is relatively large (703.9 nm-835.1 nm). The average difference in reflectance between the water bodies and the floating raft is up to 0.029.
The reflectance of bare land and artificial buildings is high in all wavelengths, so they are different from the floating raft, making it easier to distinguish the floating raft from them. The lowest reflectance of bare land and artificial building is at 443.9 nm (0.10 and 0.08, respectively), and the highest is at 1613.7 nm (0.36 and 0.230 for bare land and artificial building, respectively). The beach reflectance does not vary much in bands and is higher than that of the floating raft, so it is generally easy to discern the two when classifying.
Reflectance changes in the mangrove forest and terrestrial vegetation are identical, making it easy to distinguish between these and the floating raft, because of their distinct vegetation characteristics and high reflectance at the NIR.
2.3.2 Spectral index
NDVI (Normalized Difference Vegetation Index) is a widely used vegetation index (Rouse et al., 1974). The near-infrared and red bands of Sentinel-2 multispectral remote sensing data fall in Band 8 (central wavelength 842 nm) and Band 4 (central wavelength 665 nm), respectively. NDVI attempts to indicate information about vegetation in the study area and is calculated as follows
In Equation (1), ρR corresponds to the Band4 (red band) and ρNIR corresponds to the Band8 (NIR band).
Due to the diversity of features in the study area, the overall NDVI values ranged from -0.9974 to 0.9994, and eight types of features were analyzed: raft, Aquafarm, water bodies, mangrove forest, land vegetation, bare land, sand, and artificial building. This was done in order to extract information on floating rafts in the ocean and exclude the influence of aquafarm. Statistical information on the NDVI values of features is shown in Table 3. Information in the table demonstrates that the NDVI values of land and water bodies are distinct, meaning the index can be used to distinguish land and water bodies effectively, however, the NDVI values of land areas such as rivers and lakes are negative, which would have an influence on the result.
Table 3
| Features | NDWI | NDVI | DRRI |
|---|---|---|---|
| μ±σ | μ±σ | μ±σ | |
| Raft | 0.0135 ± 0.0967 | -0.0927 ± 0.0699 | 0.0647 ± 0.0515 |
| Aquafarm | 0.1785 ± 0.1866 | 0.0524 ± 0.1760 | -0.1726 ± 0.1194 |
| Water Bodies | 0.6485 ± 0.0753 | -0.3674 ± 0.1191 | -0.3994 ± 0.0587 |
| Mangrove Forest | -0.6859 ± 0.0667 | 0.8157 ± 0.0580 | 0.0237 ± 0.0245 |
| Land Vegetation | -0.7486 ± 0.0550 | 0.8444 ± 0.0727 | 0.0727 ± 0.0382 |
| Bare Land | -0.1476 ± 0.1149 | 0.0698 ± 0.1128 | 0.0359 ± 0.031 |
| Sand | -0.0676 ± 0.0115 | 0.0526 ± 0.0099 | 0.0173 ± 0.0082 |
| Artificial Building | -0.2097 ± 0.1116 | 0.1804 ± 0.1168 | 0.0397 ± 0.0547 |
Statistics of typical feature indices in the study area.
NDWI (Normalized Difference Water Index) is a normalized difference water index calculated using green and near-infrared bands (McFeeters, 1996), and is commonly used to extract information about water bodies in images. The NDWI can be calculated using Band3 and Band8 in Sentinel-2 to extract water body information in the study area, and its calculation formula is as follows.
In Equation (2), ρG corresponds to the Band3 (green band), and ρNIR corresponds to the Band8 (NIR band).
From the statistical information of NDWI, it can be analyzed that in this index, the difference between floating rafts and water bodies is obvious: the mean value of NDWI for the floating rafts is 0.0135, while that for water bodies is 0.6485. In a marine context, the NDWI index can be used to distinguish floating rafts and water bodies, and the statistical information for eight types of features is shown in Table 3.
DRRI (Difference-Ratio Raft Index) is improved by using bands in NDWI, which is calculated based on green (Band3 560nm), red (Band4 664.5nm), and red edge (Band6 740.2nm), and near-infrared (Band8 835.1nm). The index is capable of separating the ocean background from floating rafts and is applicable for the extraction of floating rafts on the sea surface by using the following calculation formula.
The theory of DRRI lies mainly in using the difference between the floating raft and the water body in the following four bands: green, red, red edge, and near-infrared in order to extract the floating raft from the water bodies. In Equation(3) the following band reflectance is thusly represented:ρNIR represents the NIR, ρRE represents the red-edge, ρG represents the green, and ρR represents the red.
As is indicated by the red and purple arrows in Figure 4, the index is built based on the differences in red-green and NIR-red-edge bands between Raft and water bodies. For water bodies, there is a steep in red-green bands(pointed by the first red arrow), while in the NIR-red-edge band, the reflectance change in water bodies is small(pointed by the second red arrow). The floating raft target has large differences in reflectance in both the red-green band(pointed by the first purple arrow) and the NIR-red-edge band(pointed by the second arrow). Short lines indicat their changes. By amplifying the difference in the green-red band by a factor of 1.25 (measuring the mean standardized distance with the coefficient, and optimizing the factor by the least square method) and adding the amplified part with the NIR-red-edge band, the floating raft target becomes brighter and the water background darker. Then the extraction index is normalized to -1 and 1, and the water bodies are always smaller than 0. The difference between the floating raft and water bodies being processed by DRRI is more obvious than using a single band, or a simple combination of bands.
Figure 4
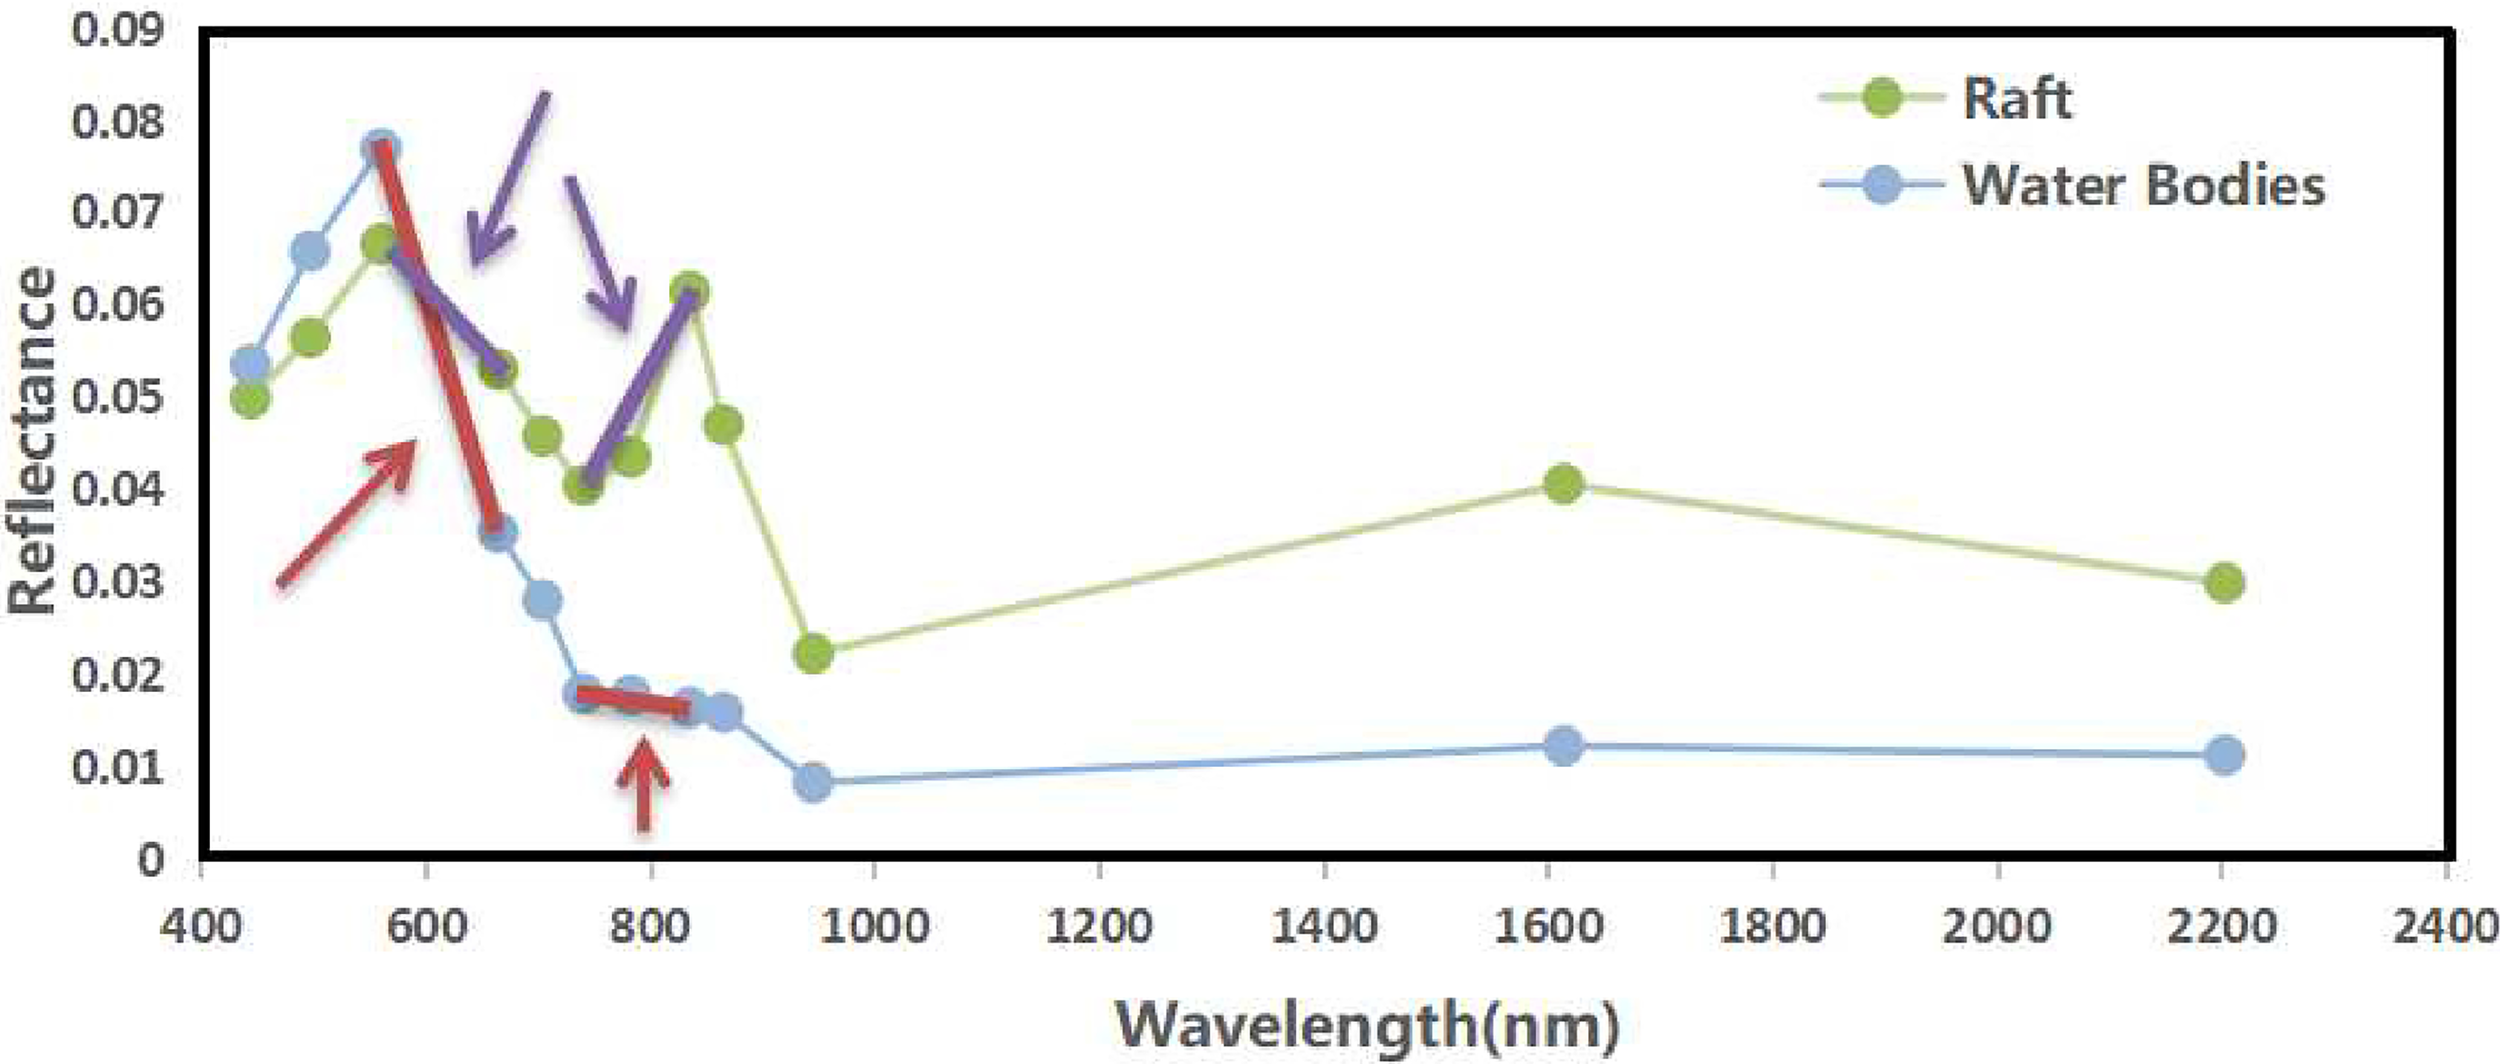
Characteristic curves of typical feature reflection.
From the analysis of the DRRI statistical information obtained, the mean value of DRRI of water bodies is -0.3994. The standard deviation is 0.0587. The DRRI values of marine water bodies are all small and distinctive, and the standard deviation is smaller than the statistical value in NDWI. Other features that are easily confused with rafts, such as aquafarm, have large differences in DRRI with rafts and can be better identified using the DRRI. The DRRI statistics of typical features are shown in Table 3 below.
This study uses mean standardized distance to evaluate the effectiveness of the three indexes mentioned above and aims to select indexes that have better separability within the group of categories. The mean standardized distance d is calculated as follows:
In the Equation, μ1μ2 is the statistical mean of the sample on the corresponding index for both feature categories, and σ1σ2 is the statistical standard deviation of the sample on the corresponding index for both feature categories.
The mean standardized distance of NDVI, NDWI, and DRRI are shown in Table 4. The NDWI index has good differentiability for raft & water bodies, raft & artificial building, raft & mangrove forest, and raft & land vegetation, with distances d of 3.703, 1.032, 4.186, and 4.873, respectively. The newly constructed DRRI index of this experiment has better differentiability between raft and water bodies than NDWI, with the best distance d between the floating raft and water body (4.211), and distance between raft and aquafarm was 1.389.
Table 4
| Types of objects | d (NDVI) | d (NDWI) | d (DRRI) | |
|---|---|---|---|---|
| Raft | Water Bodies | 2.517 | 3.703 | 4.211 |
| Bare Land | 0.164 | 0.849 | 0.349 | |
| Artificial Building | 0.417 | 1.032 | 0.235 | |
| Aquafarm | 0.180 | 0.559 | 1.389 | |
| Mangrove Forest | 5.510 | 4.186 | 0.539 | |
| Sand | 0.497 | 0.755 | 0.794 | |
| Land Vegetation | 5.115 | 4.873 | 0.0892 | |
Index Separability of NDVI, NDWI, and DRRI.
In summary, among the three indexes in this experiment, NDVI is applicable to distinguish floating rafts from terrestrial vegetation and mangrove forest, and DRRI is applicable to distinguish floating rafts from water bodies and aquafarms. The validity of the DRRI index proposed in this experiment is verified and applies to the extraction of floating raft targets from the marine surface.
2.3.3 DEM feature analysis
The study area includes land, islands, ocean, mudflats, and other topography. It can be seen from the SRTM DEM data that the elevation of the marine area is 0m, while the land and island areas are generally higher, in the mudflats area at the junction of land and ocean and elevation of some aquafarms, it is also 0m. The difference in elevation characteristics can be roughly distinguished between land rivers, lakes and other water bodies, and marine water bodies.
2.3.4 Classification and accuracy assessment method
To validate the classification result, the accuracy assessment is carried out by computing User’s Accuracy(UA), Producer’s Accuracy, Overall Accuracy, and Kappa coefficient using the test dataset.
In equations above, TP represents True Positive, FN represents False Negative, FP represents False Positive, and TN represents True Negative.
The decision tree method is one of supervised classification, this study uses ENVI to realize the decision tree model. The decision tree subdivides the study objects level by level so that the probability of the Raft at the end point is maximized through multiple discriminative classifications to obtain highly accurate classification results. Coastal aquaculture areas and sand areas influence the remote sensing extraction results of floating rafts. A decision tree model is established based on Sentinel-2A, DEM data, and spectral indexes to reduce the influence of other features, therefore, achieving a more effective identification of floating rafts in the ocean. The overall accuracy of the decision tree is 98.20%. A detailed explanation of the decision tree model is introduced in section 3.1.
The random forest method is a widely used machine learning remote sensing information extraction method. It has the advantages of low human intervention, fast computing speed, and robustness (Yu et al., 2019). Based on the random forest classification tool of van der Linden (Van der Linden et al., 2015) we used the following parameters, and input the visual interpretation of the floating raft ROI; the number of trees was set to 1000 with the number of features determined using the log function, and Gini Impurity is employed to measure whether to continue splitting. The overall accuracy of the random forest model is 96.92%. The detailed data processing method is in “3.2”.
Support vector machine is a kind of machine learning method based on statistical learning theory. Ocean surface information is complex and has a lot of interference. The principle of the support vector machine is to segment the samples into different classes by using the hyperplane. This allows the maximum interval on the feature space, making the support vector machine method capable of achieving better results for general classification problems. For nonlinear classification problems, they are generally converted to a high-dimensional feature space by nonlinear transformation for linear support vector machine learning (Li, 2012). The general process includes inputting a training data set (region of interest); selecting a radial basis function as the kernel function; setting the penalty parameter as 100, and then constructing the model. The overall accuracy of the SVM model is 93.21%. The detailed data processing method is in “3.2”.
Further discussion of accuracy assessment is shown in “3.3 Evaluation”.
3. Results and analysis
3.1 Decision tree model construction
From the analysis of NDVI, NDWI, and DRRI, it can be seen that, relative to the results of the index operation, the differentiation degree of various types of features on Sentinel-2 images (b1-b11) is not high, and only land objects (vegetation, mangrove forest, and artificial building) are distinguishable from other features. This means that the floating raft cannot be identified by directly using the original remote sensing reflectance data in the Decision Tree (Figure 5).
Figure 5
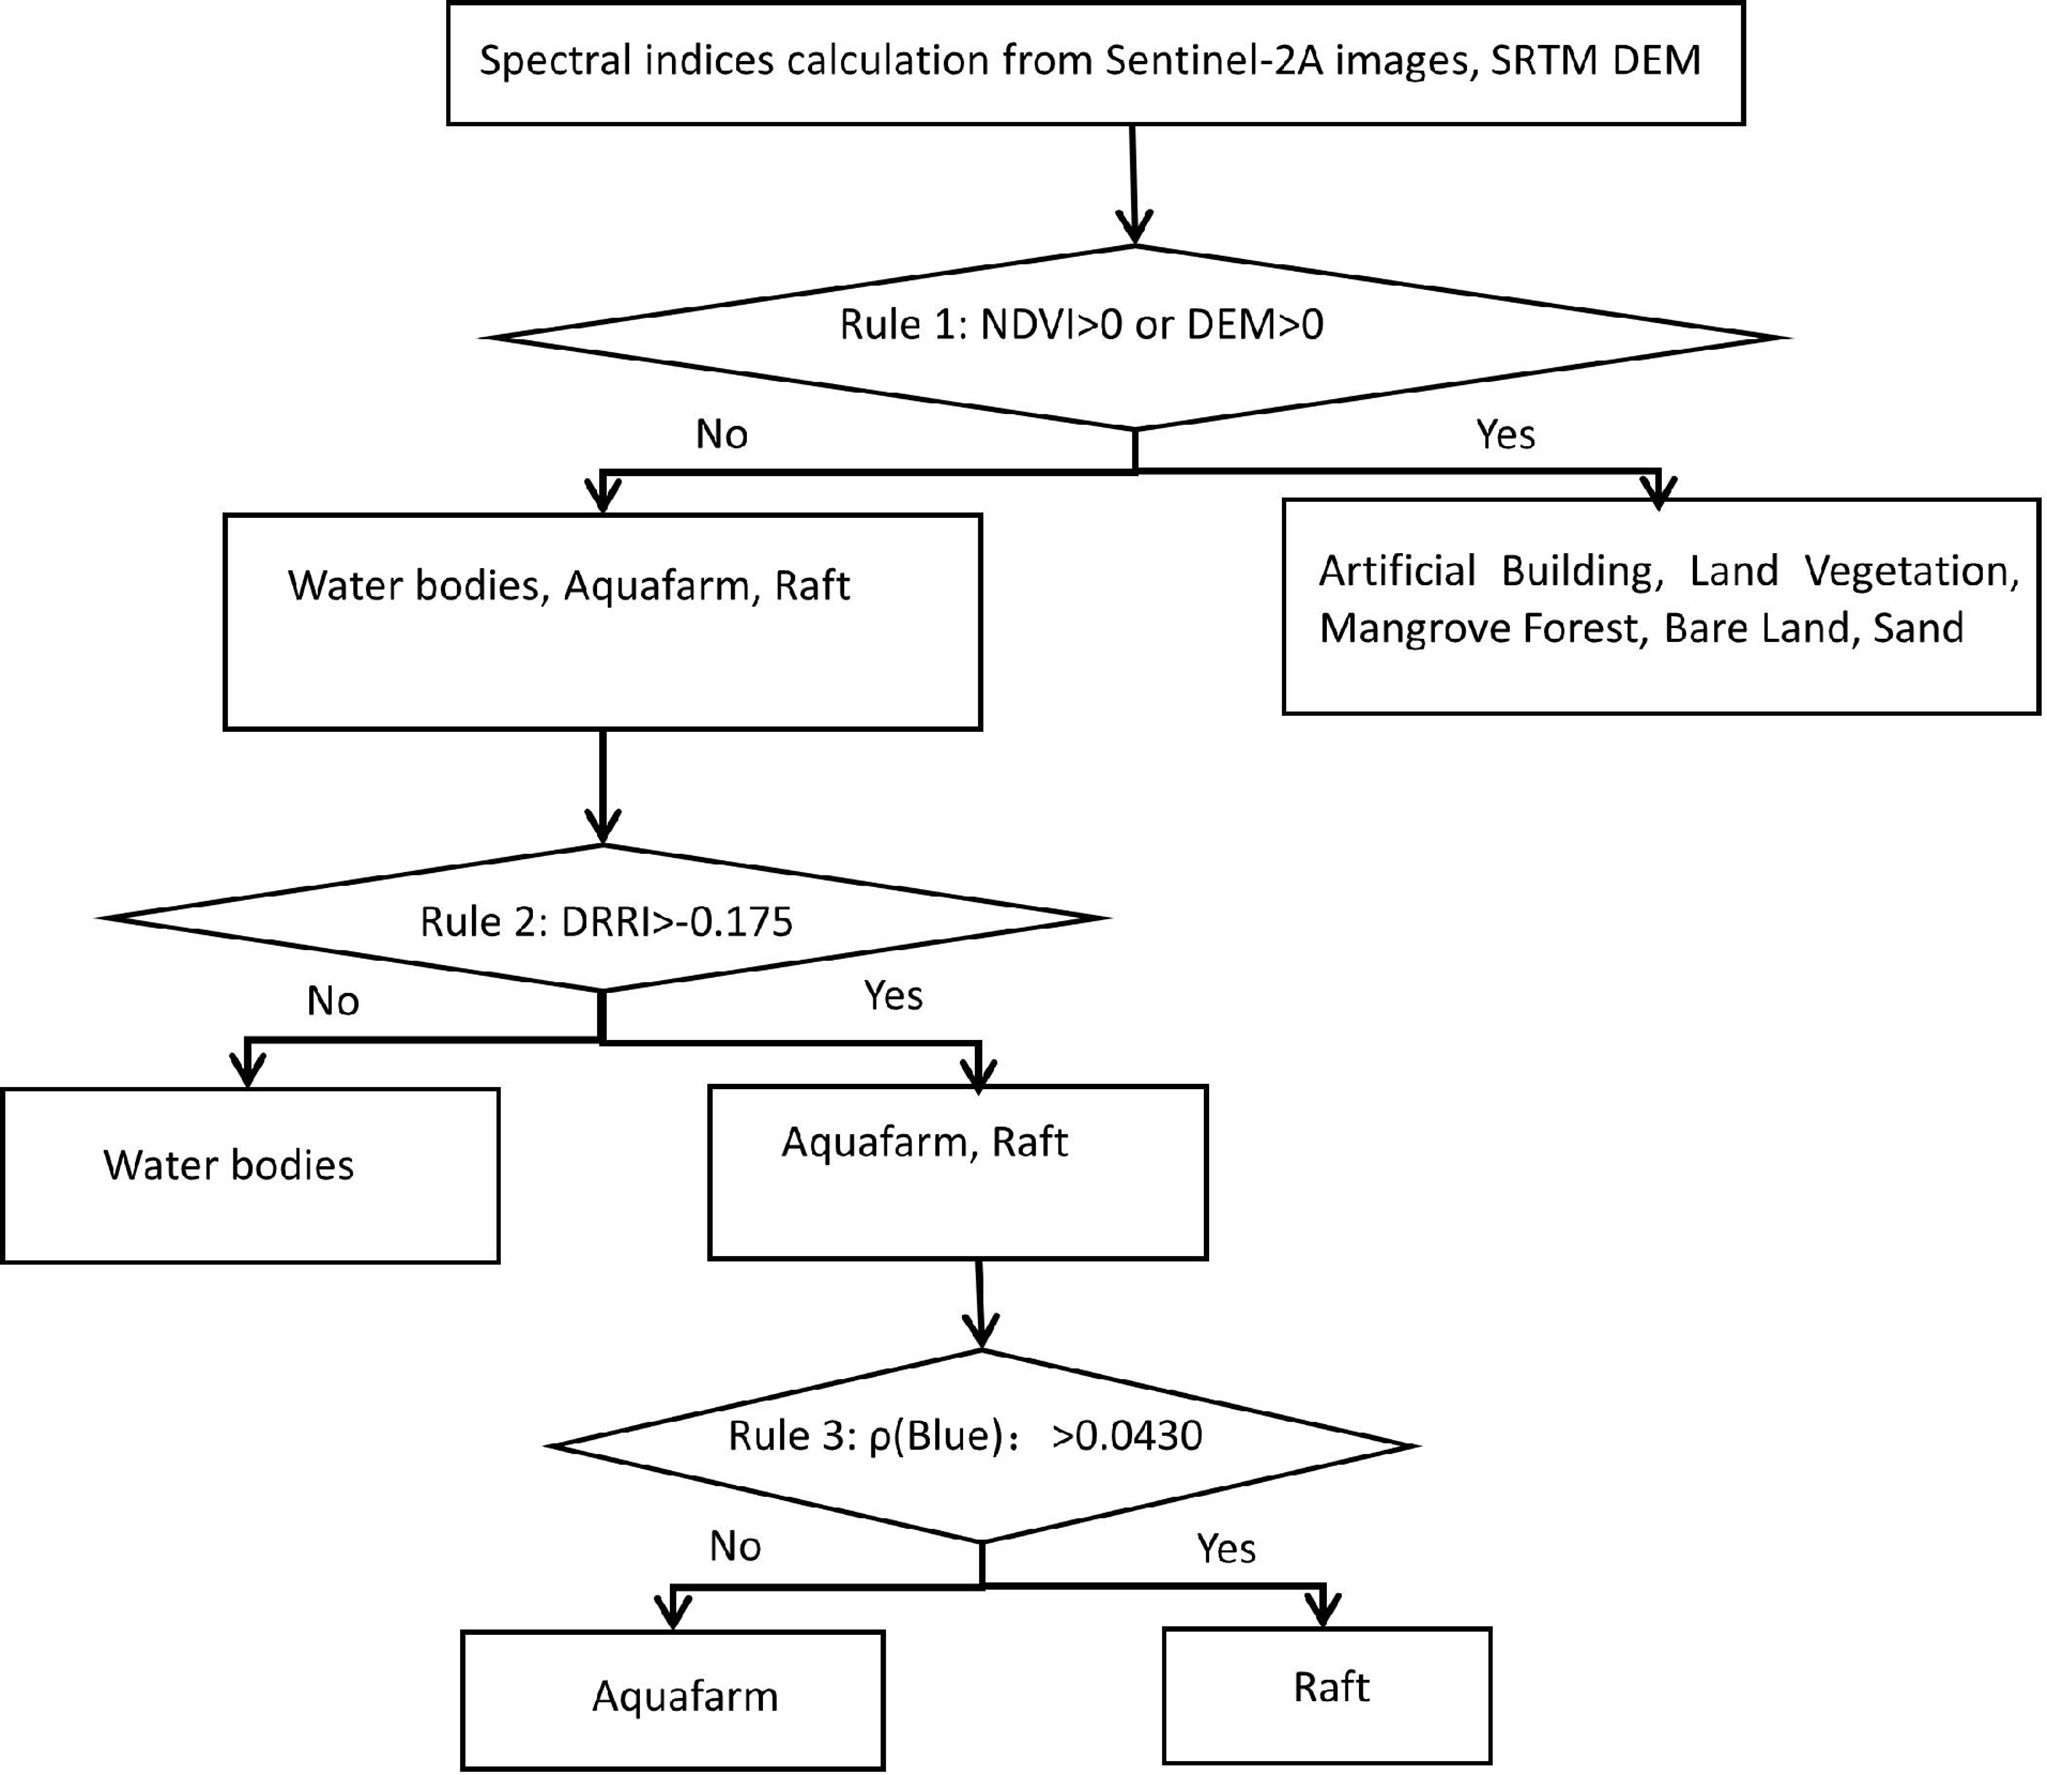
Schematic diagram of decision tree algorithm.
Since the floating raft is located on the marine surface, its identification depends on segmenting the land and the ocean for extraction to avoid the misclassification of objects on land with materials similar to the floating raft. Using DEM can distinguish most of the marine water bodies from the land. In coastal regions, there is a large area of mangrove forest, and the DEM value in this area is consistent with the marine water bodies. Therefore, it is difficult to eliminate the mangrove forest only by the DEM value, however, because the NDVI of the mangrove forests is positive, the NDVI index can be used to extract it efficiently. The sand can also be eliminated according to the positive NDVI. Therefore, the combination of NDVI and DEM is applied in order to exclude the influence of land water bodies (rivers, lakes, etc.) and mangroves. However, for land-based aquaculture areas (Aquafarms) and marine water bodies in coastal areas with DEM less than or equal to 0m, the influence of such features cannot be excluded in this step and need to be further processed and analyzed in the subsequent steps.
To locate the floating raft target, it needs to complete further processing of the obtained part containing the marine water body, aquafarm, and floating rafts. It can be seen from the DRRI index that the water bodies’ DRRI value is low, where the mean value is -0.3994 and the maximum value is -0.2849, while that of floating rafts and aquafarm is 0.0647 and -0.1726, respectively. The separability index of floating rafts and water bodies is 4.211. The histogram of the index shows that it is best extracted at -0.175 for floating rafts and extracting floating rafts and aquafarm areas from the marine surface.
The Sentinel-2 B2 band is used to help extract the floating rafts target. This eliminates the interference of aquafarm in identifying floating rafts because the distinction (measured by mean standardized distance) between the two features in the Sentinel-2A B2 band is the highest among all bands and indexes, which is 1.645. Aquafarm areas have low reflectance in the blue band, and the average reflectance of the floating rafts is two times that of aquafarm areas, so the B2 band can be used to separate them. Then set the threshold at 0.0430 to extract the floating raft target.
Finally, the decision tree is constructed by combining NDVI, DRRI, DEM, and Band 2 to improve the recognition accuracy of the floating raft, in the reason of the high mean standardized distance between them and features (in Section 2.3.1).
3.2 SVM and random forest construction
The parameter set for SVM and Random Forest is written in 2.3.4, while the input data is unclear. Considering the Accuracy of different band combinations in Tables 5, 6 then select the best combination as input data. Eventually, the combination of B2, B3, B4, and B8 is selected for SVM, and the combination of B2, B3, B4, B6, and B8 is selected for Random Forest.
Table 5
| Extraction method | RF | RF (CSL) | ||
|---|---|---|---|---|
| OA | Kappa | OA | Kappa | |
| B2+B3+B4+B8 | 94.1158 | 0.8823 | 93.9829 | 0.8831 |
| B2+B3+B4+B5+B8 | 95.2307 | 0.9046 | 95.1734 | 0.9016 |
| B2+B3+B4+B6+B8 | 96.9235 | 0.9372 | 96.7055 | 0.9342 |
| B2+B3+B4+B7+B8 | 94.9210 | 0.8984 | 94.9334 | 0.8993 |
| All Bands | 96.8102 | 0.9362 | 96.8093 | 0.9354 |
| All Bands+DEM | 96.2837 | 0.9257 | 96.2713 | 0.9241 |
| B2+B3+B4+B6+B8+DEM | 96.7202 | 0.8685 | 96.6273 | 0.8542 |
Comparison of input in RF.
Table 6
| Extraction method | SVM | SVM (CSL) | ||
|---|---|---|---|---|
| OA | Kappa | OA | Kappa | |
| B2+B3+B4+B8 | 93.2074 | 0.8632 | 93.2018 | 0.8614 |
| B2+B3+B4+B5+B8 | 93.1833 | 0.8641 | 93.1769 | 0.8638 |
| B2+B3+B4+B6+B8 | 93.1498 | 0.8635 | 93.1564 | 0.8598 |
| B2+B3+B4+B7+B8 | 93.0154 | 0.8608 | 93.0027 | 0.8594 |
| All Bands | 91.8737 | 0.8385 | 91.9542 | 0.8403 |
| All Bands+DEM | 92.0416 | 0.8418 | 91.9583 | 0.8341 |
| B2+B3+B4+B8+DEM | 92.8427 | 0.8518 | 92.8762 | 0.8543 |
Comparison of input in SVM.
If the DEM data is added, the overall accuracy will have a 0.0056(SVM) and 0.2180(RF) drop due to the lower resolution of DEM, which would cause the aggravated adhesion phenomenon, and more image pixels misclassified around the floating raft target.
Input ROI for SVM and Random Forest is unbalanced, so Cost-Sensitive learning (CSL) is used in this study for comparison, and assign a higher weight to minority groups, settings of weight are 4.05,4.10, 5.12, 3.92, 3.82, 3.01, 2.83, 1 for artificial buildings, bare soil, sandy beaches, land vegetation, mangroves, water bodies, land aquaculture ponds, and floating rafts, respectively. But there is no significant effect while using CSL in the process of learning (Tables 5, 6).
3.3 Evaluation
3.3.1 Evaluation of results and accuracy
The three methods mentioned in Section 2.3.4 were used to identify the floating rafts in the coastal area from the remote sensing image of Fangchenggang City on December 21, 2020. The classification results were finally combined into two categories: raft and non-raft, and the identification results are shown in Figure 6. Firstly, the subjective evaluation of the classification results shows that all three methods can effectively extract floating rafts. The decision tree method extracts the purest information about floating rafts, with the RF forming the second most accurate and the SVM representing the worst. The following is an objective evaluation of each of the three classification methods, the accuracy of which is evaluated using the validation sample dataset. From Table 7, it can be seen that in terms of overall accuracy, the decision tree method has the highest success rate at 98.20%; the RF method is the second highest at 96.92%, with the SVM method at 93.21%. From the perspective of producer accuracy, the SVM method is optimal at 99.20%, but the user accuracy of this method is lower at only 86.50%. The decision tree method has 98.25% user accuracy, producer accuracy of 98.17%, and overall accuracy is 98.20%. It is also the classification method with the highest Kappa coefficient among the three methods.
Figure 6
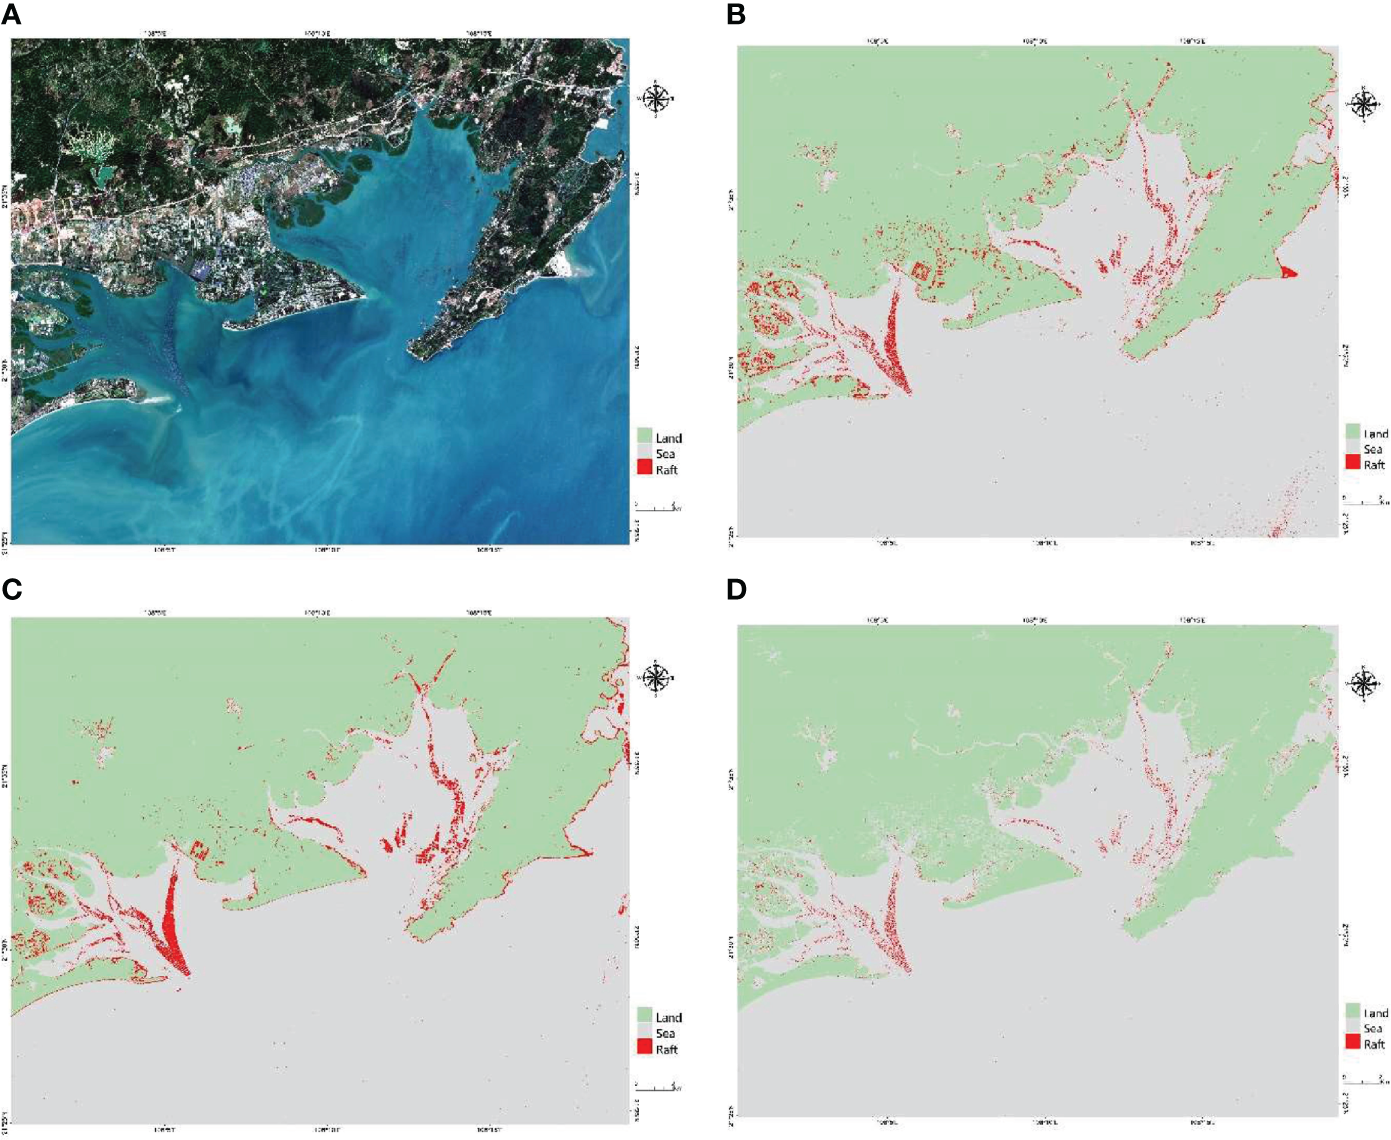
Comparison of floating raft extraction results and spatial distribution, Original Image (A), Support Vector Machine (B), Random Forest (C), Decision Tree (D).
Table 7
| Method | Confusion Matrix | Extraction accuracy of Floating raft area (%) | Kappa | ||
|---|---|---|---|---|---|
| Prod | User | Overall | |||
| Decision Tree | Raft Non-Raft Total Raft 1344 34 1368 Non-Raft 25 1880 1905 Total 1369 1914 3283 |
98.17 | 98.25 | 98.20 | 0.9632 |
| RF | Raft Non-Raft Total Raft 1355 87 1442 Non-Raft 14 1827 1841 Total 1369 1914 3283 |
98.98 | 93.97 | 96.92 | 0.9372 |
| SVM | Raft Non-Raft Total Raft 1358 212 1368 Non-Raft 11 1702 1905 Total 1369 1914 3283 |
99.20 | 86.50 | 93.21 | 0.8632 |
The extraction results of floating raft.
Overall, the SVM method has the lowest user accuracy and lowest overall accuracy due to the misclassification of non-raft pixels as rafts. The decision tree method is more suitable for floating raft identification because it has higher producer accuracy, user accuracy, and the highest overall accuracy, the identification results are also clear and reliable. Detailed statistical information on different models is shown in Table 7.
3.3.2 Comparison of extraction algorithms
The extraction of floating raft information mainly depends on the spectral information of the material within the floating raft: there are spectral characteristic differences among different features, and information about floating rafts can be effectively extracted through the selection of classification features and amplifying differences among them. In this study, the decision tree method, SVM method, and random forest method are applied to identify marine floating rafts. Among them, the RF method and the SVM method require less human intervention, while the decision tree model is obtained through the statistical analysis of remote sensing data. For raft extraction algorithms, there are some distinctions in their principles, which lead to differences in recognition accuracy. Figure 7 shows some of the intercepted areas, and the reasons for the differences in classification accuracy are as followed.
Figure 7
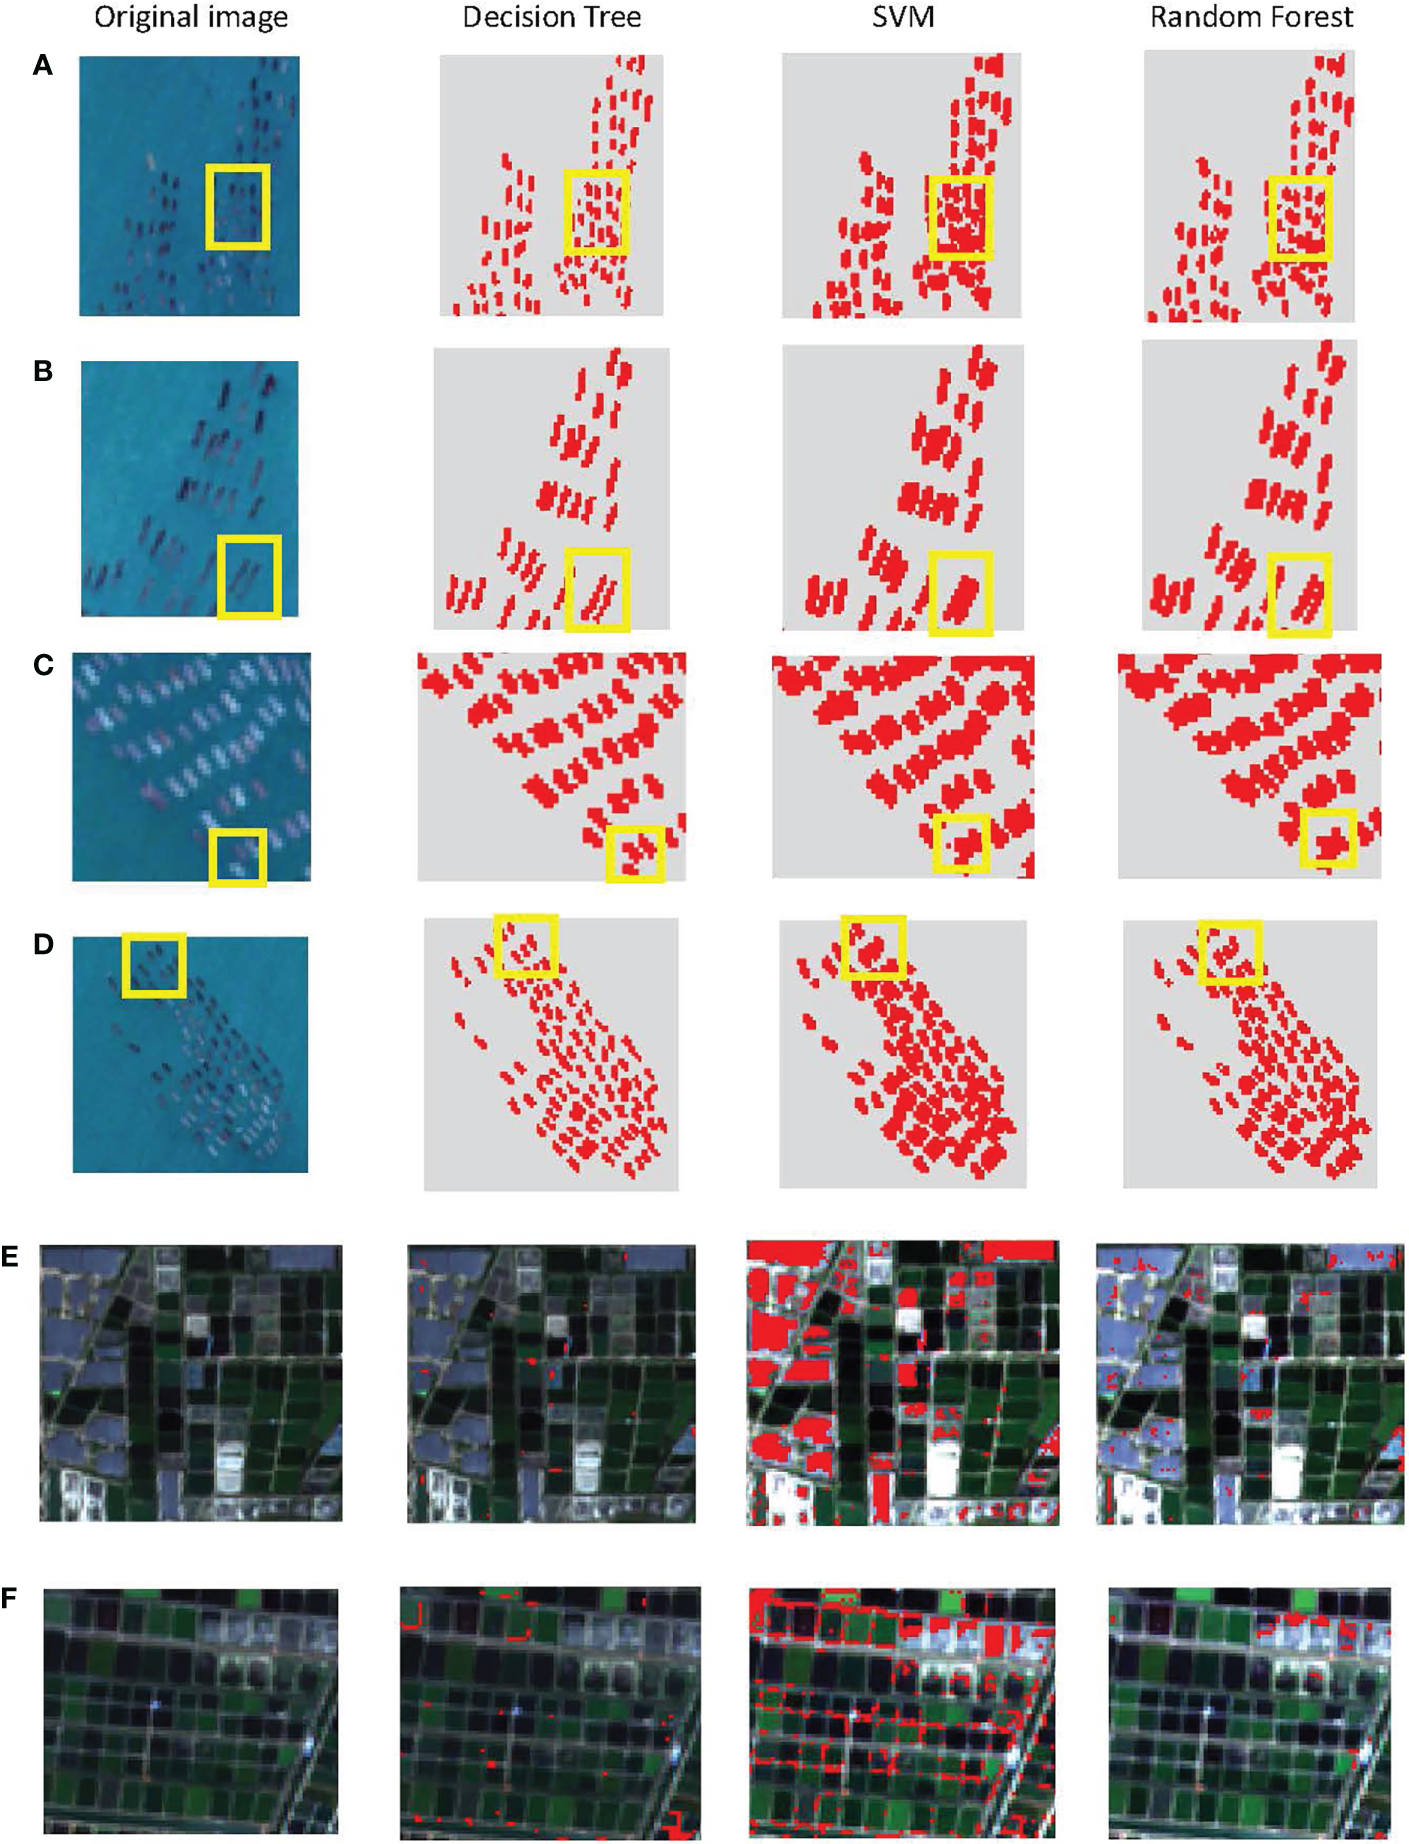
Examples of floating raft extraction comparison and misclassification, (A–C) and (D) are for raft areas, (E) and (F) are for misclassification aquafarm.
For the decision tree method, the difference in spectral features between the raft and non-raft areas can be used to better extract the target, however, a small number of misclassified elements around the floating raft still exists due to the similarity of the spectrum. Since the number of bands in multispectral images is small, which means there are fewer features that can be used for classification, leading to a higher probability of misclassification when the object material is similar to that of the floating raft. In the process of floating raft extraction, the normalized vegetation index NDVI and DEM were used for the initial screening of water bodies. Next, the DRRI index and blue band were used to screen out rafts. Choosing a variety of features such as band, index, and elevation can better avoid misclassification. The decision tree method has the highest overall accuracy, and good classification effect, with the clearer and more accurate acquisition of floating raft contours.
The SVM method is a category classification method. Multispectral remote sensing data often do not have a high enough spatial resolution for the sensing of smaller features. Supervised classification methods have a high dependence on samples, and the selected training samples may have the problem of mixed image elements. This in turn affects the computation of the support vector machine hyperplane, then reducing the accuracy of classification, while the increase in the number of samples leads to an increase in the time required for successful training. The data used for the SVM method are bands selected from Sentinel-2A (L2A). The actual size of the floating raft in this area should be 2-3 pixels in width and 6-8 pixels in length (10m resolution). Extraction results show that the target of the floating raft obtained by the support vector machine method is larger than its actual size. Furthermore, there is the phenomenon of misclassification of water body pixels into floating rafts (Figure 7).
For the random forest method, the principle is to integrate multiple decision trees to obtain the output category, however, the number of trees, inter-tree correlation, and data quality affect the accuracy of this algorithm. For the problem of floating raft extraction, the adjacent non-raft pixels are more similar to the floating raft pixels, causing a mixed pixel problem, thus affecting the inter-tree correlation, leading to problems such as larger contours and serious adhesion between floating rafts (as shown in Figure 7C). This misclassification results in lower user accuracy, while some of the floating raft pixels are also classified as other features such as water bodies. Although the Random Forest method should have higher Accuracy than the Decision Tree method theoretically, the complexity of features, the newly formed DRRI index, and the application of DEM make the Decision tree method has higher precision, which also verifies the effectiveness of the DRRI index.
The decision tree has the best classification effect of the four sets of classification results in Figure 7. The rafts extracted using the decision tree method have low adhesion to the rafts, better distinguishability, a clearer raft outline, and the area is closer to the actual size of the rafts.
For aquafarms, all three methods have the phenomenon of misclassification, mainly because the two elevations are similar, and comprise similar material, which cannot be distinguished using DEM value (decision tree method) or other algorithms. However, the overall classification accuracy of the decision tree method is the best of the three, and the misclassification phenomenon is smaller than in the other two methods (in Figure 7E, F).
3.3.3 Influence of data and objects
The identification accuracy of the floating raft is related both to the chosen classification method, and the spatial resolution of the remote sensing images used for classification, which shows a greater relationship with when the spatial resolution is higher, the corresponding extraction accuracy also increases. Chu (Chu et al., 2020) used the high-resolution remote sensing images and texture features of GF-1 for classification using the SVM method, and the classification accuracy was as high as 97.803%. However, for data with lower spatial resolution, the classification accuracy will be reduced. The floating raft target is about 15m-20m in width and 55m-60m in length, and the spatial resolution of Sentinel-2A data is 10m, so the accuracy of extracting floating raft information with Sentinel-2A meets the basic requirements, improving the efficiency of floating raft information extraction.
There are more aquafarm areas in coastal areas that are easily confused with floating raft areas (in Figure 7E, F), and coastal aquafarm areas have lower reflectance at 496.6 nm than marine waters and floating rafts. The decision tree method can use this feature to distinguish them from marine waters and floating rafts. Some of the coastal aquaculture areas have similar spectral features to the floating rafts, which may be caused by the same or similar materials within both elements, thus affecting the extraction accuracy. However, this issue can be investigated further by subsequent research.
3.4 Evaluation of another coastal area
Another coastal area in China was chosen to demonstrate the practical utility of the newly formed index DRRI and the decision tree model. It is Sandu Gulf located in Ningde city, Fujian Province. The location is shown in Figure 8.
Figure 8
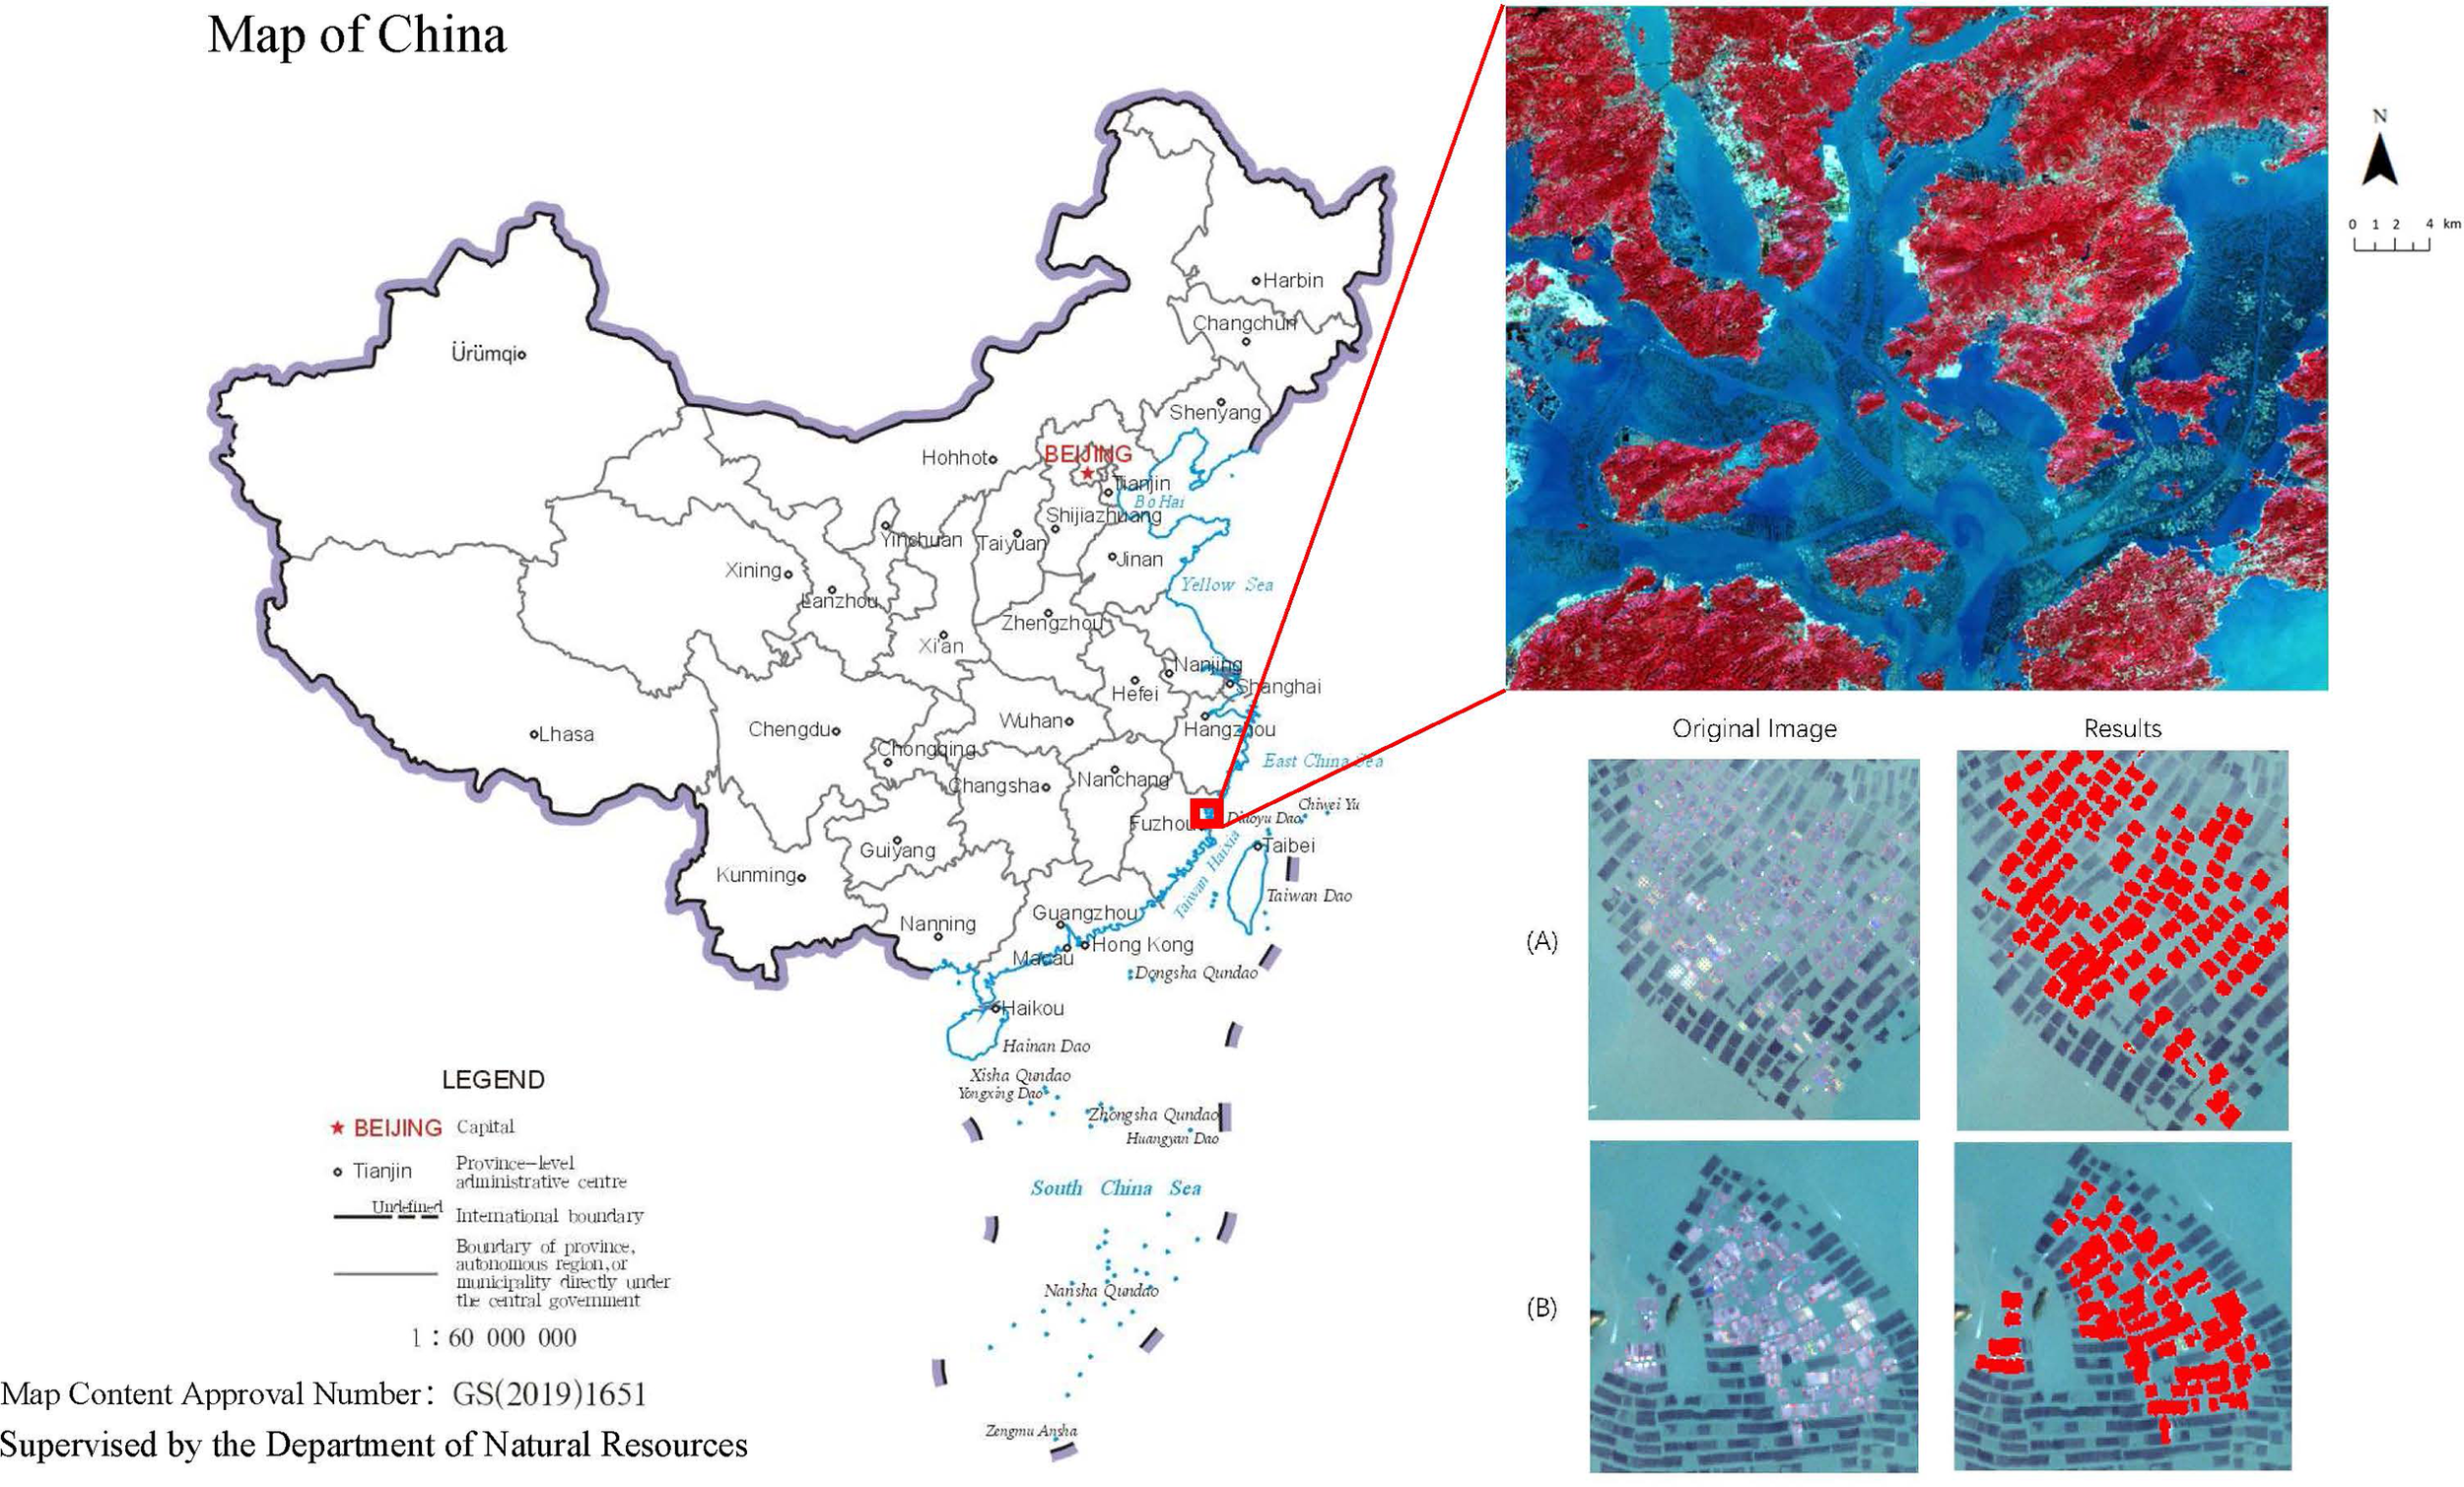
Location of verifying area and the identification results in Sandu Gulf.
The overall accuracy (OA) and the Kappa are computed to validate the performance of the DRRI index and the decision tree model, and the validation samples were randomly selected from Google Earth high-resolution images. The OA of classification results is 98.03%, and the Kappa is 0.9591, which represents high precision. Partial extraction results are in Figure 8. The water bodies’ DRRI is always smaller than 0. There are tiny differences in the setting of the parameters due to the material used for floating rafts, although they are both rafts for fish farming. The threshold of DRRI to distinguish between water bodies and rafts was set to -0.039 (raise 0.136), and the separability (measured by mean standardized distance, which is 2.1) of water bodies and rafts in DRRI is also strong.
4. Discussion
4.1 Strengths and potential
Floating rafts are located in the offshore bay area, where individual rafts are small and densely arranged, which makes “adhesion” easier between the rafts when using remote sensing images for classification. The problem of “adhesion” is more obvious in studies with low spatial resolution such as Landsat images (Yu, 2019; Liu et al., 2020), however, it is reduced with the use of higher spatial resolution images such as SPOT and GF-2. It should be noted that the phenomenon of “adhesion” still exists in areas with high floating raft density (Liu et al., 2013; Liu et al., 2019a). General machine learning and object-oriented methods show poor performance in dealing with this problem (Liu et al., 2019a; Liu et al., 2019b; Yu, 2019; Liu et al., 2020), whereas the DRRI index proposed in this study can efficiently extract the floating raft targets at images with 10m and 20m spatial resolution, thereby alleviating the “adhesion” phenomenon to a large extent. To alleviate the problem of similar spectral characteristics in the aquafarm regions and floating rafts, the use of the land elevation feature of the region where it is higher than 0 and uses DEM elevation information effectively reduces part of the misclassification phenomenon. The decision tree constructed in this study successfully distinguished aquafarms with low elevation in the coastal region from marine aquaculture floating raft areas.
Decision tree-based models are suitable for large-scale floating raft aquaculture extraction, which can provide accurate results (Hou et al., 2022). This study proposes a floating raft identification index that aims to extract the floating raft target from the background of marine water bodies, and it is demonstrated success in reducing the degree of “adhesion” between these water bodies and the floating rafts caused by mixed pixels. The index is different from the HIS-FRA index constructed by Hou (Hou et al., 2022), which uses four bands, including red band, green band, red-edge band, and near-infrared, in order to make full use of the differences in the spectral characteristics of the typical features discussed. It shows a relatively stable ability to distinguish between floating raft targets and marine water bodies. The index can not only effectively extract the floating raft target from the background of the marine water, but also fully distinguish the floating raft from artificial buildings, sand, vegetation, aquafarms, etc. The DRRI index also outperforms NDVI and NDWI in the extraction of floating rafts and has a good application value.
This study innovatively uses DEM data in the process of floating raft target extraction, thereby improving the spatial range adaptation capability of the algorithm. For large-scale remote sensing images, floating raft extraction can also be applied directly without the need for sea-land boundary data. The use of DEM data can effectively utilize elevation information, thus avoiding the influence of land features with similar spectral characteristics on floating raft extraction and does not lose the floating raft targets in the river channels in coastal areas.
4.2 Limitations
This study shows that there is a significant difference between the spectral reflectance of the marine water bodies and the floating raft target, so DRRI can effectively identify and detect the target from the marine background. The DRRI index in the decision tree algorithm is designed based on the difference in reflectance variation in the red-green band and red edge-NIR band. A small percentage of local water bodies adjacent to floating rafts will be classified as floating rafts limited by the spatial resolution. This may lead to misclassification in the region with a higher density of rafts. Constructing the DRRI index needs four bands: red band, green band, red-edge band, and NIR band, which limit the use of different sensors, such as Landsat TM/OLI, SPOT, GF-2, etc., so this algorithm needs to consider the data availability.
The study area of this paper is in the Pearl Bay area of Fangchenggang City, Guangxi Province, and the decision tree algorithm has a good extraction effect for the rafts used for fish culture in this area and was also evaluated to be effective in another coastal area. There may be lower precision for the raft of different materials or purposes in other areas.
Equally, the tide level may have some influence on the results, and the images processed in this study are remote sensing images taken at high tide, so the possible influence of the intertidal zone on the extraction of the floating raft has not been considered.
5. Conclusion
Obtaining the distribution of mariculture floating rafts has great potential significance for marine environmental pollution prevention and control as well as macroscopic control. In this study, the DRRI raft identification index was proposed using the 10m and 20m multispectral remote sensing digital image of Sentinel-2A. Decision tree, random forest, and support vector machine methods were used for classification comparison experiments, leading to the extraction of raft information in the study area. The decision tree method based on statistical analysis has the highest accuracy.
The following conclusions can be obtained from this experiment.
There is a certain difference between the spectral features of water bodies and floating rafts in the study area, and this can be used to extract floating rafts accurately from the background of marine water bodies. The construction of the DRRI floating raft extraction index is used to amplify the difference between the two and improve the category differentiability. This forms a key feature for floating raft information extraction.
This paper innovatively uses DEM data in the floating raft extraction process, thereby improving the spatial adaptability of the algorithm, and the DEM elevation information can be used to effectively screen out features on land with spectral characteristics similar to those of the floating raft.
The decision tree method, random forest method, and support vector machine method constructed in this experiment all display desirable levels of accuracy. The overall accuracy of all methods was more than 90%, among which the decision tree classification method had the highest accuracy of 98.20%. This indicates that the Sentinel-2A multispectral remote sensing images obtain desirable classification results of floating rafts. Sentinel-2A has a high temporal and spatial resolution and is easy to acquire and is useful for learning about the spatial distribution of floating rafts, marine fishery production, and the assessment of the damage to aquaculture areas after marine disasters.
Funding
This work was supported by the National Natural Science Foundation of China [grant number 41871239], the Qing Lan Project of Jiangsu Province, and S&T Program of Hebei [grant number 21567624H], the Natural Science Foundation of Jiangsu Province [grant number YJGL-YF-2020-16 and JSZRHYKJ202114].
Publisher’s note
All claims expressed in this article are solely those of the authors and do not necessarily represent those of their affiliated organizations, or those of the publisher, the editors and the reviewers. Any product that may be evaluated in this article, or claim that may be made by its manufacturer, is not guaranteed or endorsed by the publisher.
Statements
Data availability statement
The original contributions presented in the study are included in the article/supplementary material. Further inquiries can be directed to the corresponding author.
Author contributions
YC and XZ analyzed the data and wrote the manuscript. XZ conceived the study and provided the methods. NJ reviewed and edited the manuscript. TD assisted with the formal analysis, and reviewed and edited the manuscript. TX provides constructive suggestions in the revision of the thesis. All authors contributed to the article and approved the submitted version.
Conflict of interest
The authors declare that the research was conducted in the absence of any commercial or financial relationships that could be construed as a potential conflict of interest.
References
1
Cheng T. Zhou W. Wei F. (2012). Progress in the methods for extracting aquaculture areas from remote sensing data. Remote Sens. Land. Resour.03), 1–5. doi: 10.6046/gtzyyg.2012.03.01
2
Chu J. Shao G. Zhao J. Gao N. Wang F. Cui B. (2020). Information extraction of floating raft aquaculture based on GF-1. Sci. Surv. Mapp.45 (01), 92–98. doi: 10.16251/j.cnki.1009-2307.2020.01.014
3
Chu J. Zhao D. Zhang F. Wei B. Li C. Suo A. (2008). Monitor method of rafts cultivation by remote sense-a case of changhai. Mar. Environ. Sci.27 (S2), 35–40. doi: 10.3969/j.issn.1007-6336.2008.z2.007
4
Cui B. Fei D. Shao G. Lu Y. Chu J. (2019b). Extracting raft aquaculture areas from remote sensing images via an improved U-net with a PSE structure. Remote Sens.11 (17), 2053. doi: 10.3390/rs11172053
5
Cui B.-G. Zhong Y. Fei D. Zhang Y.-H. Liu R.-J. Chu J.-L. et al . (2019a). Floating raft aquaculture area automatic extraction based on fully convolutional network. J. Coast. Res.90 (SI), 86–94. doi: 10.2112/SI90-011.1
6
Du Y. Wu D. Liang F. Li C. (2013). Integration of case-based reasoning and object-based image classification to classify SPOT images: A case study of aquaculture land use mapping in coastal areas of guangdong province, China. GISci. Remote Sens.50 (5), 574–589. doi: 10.1080/15481603.2013.842292
7
Fan J. Chu J. Geng J. Zhang F. (2015). “"Floating raft aquaculture information automatic extraction based on high resolution SAR images",” in 2015 IEEE international geoscience and remote sensing symposium (IGARSS) (IEEE), 3898–3901. doi: 10.1109/IGARSS.2015.7326676
8
Hou T. Sun W. Chen C. Yang G. Meng X. Peng J. (2022). Marine floating raft aquaculture extraction of hyperspectral remote sensing images based decision tree algorithm. Int. J. Appl. Earth Obs. Geoinf.111, 102846. doi: 10.1016/j.jag.2022.102846
9
Jayanthi M. (2011). Monitoring brackishwater aquaculture development using multi-spectral satellite data and GIS- a case study near pichavaram mangroves south-east coast of India. Indian J. Fisheries.58 (1), 85–90. doi: 10.1071/MF10194
10
Li H. (2012). Statistical learning methods (Beijing: Tsinghua University Press).
11
Liu X. Huang H. Yang X. Yan L. (2013). Method to extract raft-cultivation area based on SPOT image. Sci. Surv. Mapp.38 (02), 41–43. doi: 10.16251/j.cnki.1009-2307.2013.02.033
12
Liu Y. Yang X. Wang Z. Lu C. Li Z. Yang F. (2019a). Aquaculture area extraction and vulnerability assessment in sanduao based on richer convolutional features network model. J. Oceanol. Limnol.37 (6), 1941–1954. doi: CNKI:SUN:HYFW.0.2019-06-014 doi: 10.1007/s00343-019-8265-z
13
Liu Y. Yang X. Wang Z. Lu C. (2019b). Extracting raft aquaculture areas in sanduao from high-resolution remote sensing images using RCF. Acta Oceanol. Sin.41 (04), 119–130. doi: 10.3969/j.issn.0253-4193.2019.04.011
14
Liu Y. Wang Z. Yang X. Zhang Y. Yang F. Liu B. et al . (2020). Satellite-based monitoring and statistics for raft and cage aquaculture in china’s offshore waters. Int. J. Appl. Earth Obs. Geoinf.91, 102118. doi: 10.1016/j.jag.2020.102118
15
Loberternos R. Porpetcho W. Graciosa J. Violanda R. Diola A. Dy D. et al . (2016). An object-based workflow developed to extract aquaculture ponds from airborne LIDAR data: A test case in central visayas, Philippines. Int. Arch. Photogramm. Remote Sens. Spatial. Inf. Sci.41, 1147–1152. doi: 10.5194/isprsarchives-XLI-B8-1147-2016
16
McFeeters S. K. (1996). The use of the normalized difference water index (NDWI) in the delineation of open water features. Int. J. Remote Sens.17 (7), 1425–1432. doi: 10.1080/01431169608948714
17
Rajitha K. Mukherjee C. Chandran R. V. (2007). Applications of remote sensing and GIS for sustainable management of shrimp culture in India. Aquacult. Eng.36 (1), 1–17. doi: 10.1016/j.aquaeng.2006.05.003
18
Rouse J. Haas R. Schell J. Deering D. (1974). Monitoring vegetation systems in the great plains with ERTS: Proceedings of the third earth resources technology satellite-1 symposium. NASA SP-351. (Germany: The International Society for Photogrammetry and Remote Sensing (ISPRS)) 301–317.
19
Sui B. Jiang T. Zhang Z. Pan X. Liu C. (2020). A modeling method for automatic extraction of offshore aquaculture zones based on semantic segmentation. ISPRS. Int. J. Geo-Inf.9 (3), 145. doi: 10.3390/ijgi9030145
20
Van der Linden S. Rabe A. Held M. Jakimow B. Leitão P. J. Okujeni A. et al . (2015). The EnMAP-Box–a toolbox and application programming interface for EnMAP data processing. Remote Sens.7 (9), 11249–11266. doi: 10.3390/rs70911249
21
Wang F. Xia L. Chen Z. Cui W. Liu Z. Pan C. (2018). Remote sensing identification of coastal zone mariculture modes based on association-rules object-oriented method. Trans. Chin. Soc. Agric. Eng.34 (12), 210–217. doi: 10.11975/j.issn.1002-6819.2018.12.025
22
Xue W. Lichun S. Mianqing Z. Dingmeng L. Lili D. (2018). Fully convolution neural networks for water extraction of remote sensing images. Bull. Surv. Mapp.6), 41. doi: 10.13474/j.cnki.11-2246.2018.0173
23
Xu S. Xia L. Peng H. Li X. (2018). Remote sensing extraction of mariculture models based on object-oriented. Geomat. Spatial. Inf. Technol.41 (5), 110–112. doi: 10.3969/j.issn.1672-5867.2018.05.035
24
Yang Y. Jiang N. Yin L. Hu B. (2005). RS-based dynamic monitoring of lake area and enclosure culture in east tai hu lake. J. Lake. Sci.02), 133–138. doi: 10.3321/j.issn:1003-5427.2005.02.007
25
Yu H. (2019). Extracting marine floating raft region based on fusion of optical image and radar image (Chengdu (SC: Southwest Jiaotong University).
26
Yu X. Zhao G. Chang C. Yuan X. Wang Z. (2019). Random forest classifier in remote sensing information extraction: A review of applications and future development. Remote Sens. Inf.34 (02), 8–14. doi: 10.3969/j.issn.1000-3177.2019.02.002
Summary
Keywords
Floating raft aquaculture, Sentinel-2A, decision tree, random forest, support vector machine, DRRI
Citation
Cui Y, Zhang X, Jiang N, Dong T and Xie T (2022) Remote sensing identification of marine floating raft aquaculture area based on sentinel-2A and DEM data. Front. Mar. Sci. 9:955858. doi: 10.3389/fmars.2022.955858
Received
29 May 2022
Accepted
22 July 2022
Published
17 August 2022
Volume
9 - 2022
Edited by
Chao Chen, Zhejiang Ocean University, China
Reviewed by
Xing Li, Jiangsu Normal University, China; Romano Trent Lottering, University of KwaZulu-Natal, South Africa; Qingjiu Tian, Nanjing University, China
Updates
Copyright
© 2022 Cui, Zhang, Jiang, Dong and Xie.
This is an open-access article distributed under the terms of the Creative Commons Attribution License (CC BY). The use, distribution or reproduction in other forums is permitted, provided the original author(s) and the copyright owner(s) are credited and that the original publication in this journal is cited, in accordance with accepted academic practice. No use, distribution or reproduction is permitted which does not comply with these terms.
*Correspondence: Xuehong Zhang, zxhbnu@126.com
This article was submitted to Marine Conservation and Sustainability, a section of the journal Frontiers in Marine Science
Disclaimer
All claims expressed in this article are solely those of the authors and do not necessarily represent those of their affiliated organizations, or those of the publisher, the editors and the reviewers. Any product that may be evaluated in this article or claim that may be made by its manufacturer is not guaranteed or endorsed by the publisher.