 Aurélie Portas
 Nolwenn Quillien2
 Gérald Culioli
 Jean-François Briand
- 1Laboratory Matériaux Polymères Interfaces Environnement Marin (MAPIEM), University of Toulon, EA 4323, Toulon, France
- 2France Energies Marines, Environmental Integration of Offshore Energy systems, Brest, France
- 3Institut Méditerranéen de Biodiversité et d’Ecologie marine et continentale (IMBE), UMR CNRS-IRD-Avignon Université-Aix-Marseille Université, Avignon, France
Marine biofouling communities, including biofilms, are composed of many eukaryotes with high taxonomic and functional diversities. However, molecular characterization of eukaryotic diversity of marine biofouling has been barely developed due to the only recent interest in research areas such as marine renewable energies, antifouling technologies, or plastic pollution. The aim of this study was to compare the diversity and taxonomic composition of biofouling through different metabarcoding approaches used to detect the widest range of taxa from samples collected in several contrasted marine environments (French Atlantic and Mediterranean coasts). Thus, we assessed four DNA extraction methods and six primers pairs targeting the 18S rDNA gene (including the V1-V2, V4TAR, V4UNI, V7 and V9 regions) and the COI gene, the latter with two databases (BOLD and MIDORI). In addition the influence of primers selection was analyzed at three sites to compare geographic variations in eukaryotic diversity. Although none of the extraction methods greatly altered the community diversity or composition. we have observed that eukaryotic biofouling community diversity and structure varied depending on primers pairs, reference databases and sites. 18S rDNA regions allowed the detection of more taxa at the species level, including microeukaryotes, while the COI recovered more ASVs, but with a large proportion that remained taxonomically unassigned probably because BOLD and MIDORI specifically targeted metazoans. Interestingly, the spatial pattern obtained with both COI and 18S rDNA markers were similar showing that spatial selection occurred throughout a wide diversity of eukaryotic taxa. These results encouraged the use of these two complementary markers for future metabarcoding investigations but also highlighted the relevance of completing databases to enhance the identification of biofouling eukaryotes.
Introduction
Marine biofouling results from the settlement of living marine organisms which colonize all immersed surfaces including diverse biogenic habitats (Davey and O’toole, 2000). This complex process has been generally described as a chronological sequence that depends on several factors related to both environmental conditions and physical-chemical properties of the colonized substrates (Anderson and Underwood, 1994; Zaiko et al., 2016; Briand et al., 2017). After a rapid conditioning step, due to their highest abundance in the water column, the settlement of bacteria, diatoms, and other marine microorganisms (unicellular autotrophic and heterotrophic microeukaryotes) precedes the settlement of larger organisms (macroeukaryotes, i.e. pluricellular organisms) (Chung et al., 2010; Flemming and Wingender, 2010; Hadfield, 2011). Several studies have described the formation and composition of prokaryotic biofilms (Marszalek et al., 1979; Dang and Lovell, 2016; Pollet et al., 2018; Caruso, 2020; Catao et al., 2021) while the characterization of marine eukaryotic biofouling communities, especially using molecular approaches, has attracted less attention from the scientific community. In addition, most molecular studies of eukaryotic biofouling have generally focused on the diversity of dominant groups, the detection of specific taxa such as non-indigenous marine species (NIS) (Ammon et al., 2018b; Rey et al., 2020) or the studies based on marine navigation (Schultz et al., 2011), including different substrates and ecosystems.
In addition to the characterization of microeukaryotes, the acquisition of large metabarcoding datasets to supplement with morphological inventories, which are time-consuming and rely on extensive taxonomic expertise, would be helpful. As a matter of fact, the very small size of some eukaryotes and/or their insufficient morphological discernible features appear to considerably limit their detection and identification, leading to the underestimation of their diversity (Carugati et al., 2015). Thus, molecular approaches appear as a promising alternative for standardized and accurate species identification compared to the use of traditional morphological surveys (Aylagas et al., 2016; Obst et al., 2020). However, several methodological parameters (e.g., DNA extraction, use of multiple primer sets and more or less specific databases, bioinformatics processing, and sequencing depth requirements) vary considerably among studies and may affect the conclusions made from environmental samples (Giebner et al., 2020; van der Loos and Nijland, 2021; Zaiko et al., 2022). Efforts are thus needed to improve the reliability of DNA metabarcoding monitoring in general but especially for biofouling communities.
The analysis of eukaryotes based on molecular approaches represents a specific challenge because eukaryotes possess resilient cellular structures which can give poor DNA yield during extraction (Hermans et al., 2018). In addition, the choice of marker genes for environmental DNA studies remains a critical step and closely depends on the taxa of interest as well as the taxonomic levels obtained. Currently, two genes, or markers, have been frequently targeted in marine eukaryote DNA studies, those coding nuclear ribosomal DNA (rDNA) and the mitochondrial cytochrome oxidase c subunit I (COI). The former is a more conserved marker that detects more diverse taxa whereas COI is a more variable marker that provides information at a higher taxonomic resolution (down to the species level) but databases are only adapted for metazoans (Tang et al., 2012; Ammon et al., 2018b; Marquina et al., 2019). Indeed, Wangensteen et al. (2018) have shown that COI reveals a greater diversity at the species-level when compared to the V7 region of 18S rDNA primer when applied to hard-bottom samples. Several hypervariable regions from the 18S rDNA gene have been used to detect taxonomic groups. The V1-V2 region presents a good taxonomic coverage for meiofauna and is often used for environmental surveys (Fonseca et al., 2010; Cordier et al., 2019). The V4 and V9 regions, considered as the most popular for metabarcoding, have been often used to characterize microbial planktonic diversity (Vargas et al., 2015; Tanabe et al., 2016). Recent studies have highlighted the advantage of a multigene metabarcoding approach using these two barcode regions to broadly identify marine eukaryotic communities (Ammon et al., 2018b; Atienza et al., 2020; Azevedo et al., 2020; Rey et al., 2020). However, the use of molecular approaches for the study of eukaryotes is biased by the proportion of reads which is not correlated with the initial proportions of taxa in the sample. These differences can be influenced by both PCR- bias and gene copy number that varies considerably across taxa and sometimes within taxa (Elbrecht and Leese, 2015; Jeunen et al., 2019; Lamb et al., 2019). Furthermore, another aspect that may bias the results of metabarcode-based biodiversity assessments of biofouling is the taxonomic assignment of ASVs. Regardless of the primers used, sequence identification is highly dependent on the completeness of the chosen reference database and often tailored to certain taxonomic groups. Consequently, identification is mainly limited to specimens belonging to well-known taxa (Pompanon and Samadi, 2015). There is, therefore, an important need to evaluate the most suitable method to identify the broadest range of eukaryotic taxa involved in biofouling.
In the present study, we investigated eukaryotic communities colonizing polymeric artificial surfaces which have been immersed at several locations along the French Mediterranean and Atlantic coasts. The objectives were to compare different molecular methods used for the global depiction of the diversity of marine eukaryotic biofouling assemblages. Obtaining the broadest possible characterization of biofouling in the marine environment, especially offshore, becomes crucial as questions arise in the context of the deployment of marine renewable energy (MRE) structures. Four DNA extraction methods using samples scraped from three different polymeric materials deployed at the Toulon Bay (NW Mediterranean Sea) were first assessed. Secondly, based on the most reproducible DNA extraction method to recover the most diversity, we compared the coverage and identification resolution of five variable regions of the 18S rRNA gene and one region of the COI gene. Finally, we explored the influence of the choice of primer sets on dissimilar eukaryotic communities from different sites in the Mediterranean Sea (Toulon and Banyuls bays) and in the Atlantic Ocean at an offshore site (Saint-Nazaire).
Materials and methods
The experimental design followed by the molecular processing is summarized in Figure S1.
Immersion and sampling
Sampling design included two immersions of the panels. Firstly, we immersed five panels (297 × 210 × 8 mm), made of three different polymers including polyvinyl chloride (PVC), which is the regular material used as a reference, but also high-density polyethylene (HDPE) and polyamide (PA) which are commonly used in the construction of offshore renewable energy components. Panels were sandblasted before immersion to promote primary biological adhesion. For three months (from March to May 2020), these panels were set at low depth (-1m) in the Bay of Toulon, Mediterranean Sea (43°06’25’’N; 5°55’41’’E) close to the port area. Secondly, we immersed PVC panels in Banyuls and Saint-Nazaire for seven months (from July 2017 to February 2018) off the coasts. At the offshore site of Banyuls, PVC panels were fixed on a metallic frame, which was hung under the Oceanographic buoy SOLA (47°27’13’’N; 03°32’360’’ E), allowing the immersion of panels at 2m depth. This site was located at 1 km off the coast with a maximal depth of 27m. In the Atlantic, PVC panels were set up offshore Saint-Nazaire (47°13’9” N; 2°34’47” W), under the UN-SEA-SMS buoy (Nantes University) at 10.7 km off the coast and at 1m depth. Plates were sub-sampled (Figure S1C) and the biofouling that developed on each panel at each site was scraped off one side with sterile gloves and a sterile scalpel and stored in a 50 ml tube at -20°C until DNA extraction. A total of 36 samples (3 types of surface × 12 subsamples) was collected in Toulon and only one scraped sample was obtained at Saint-Nazaire and Banyuls sites.
Molecular biology methods
DNA extraction: Toulon samples were extracted following four DNA extraction methods (3 materials × 3 subsamples × 4 extraction methods, n = 36 samples), we selected these four specific kits for the following reasons: (1) the DNeasy PowerBiofilm Kit (PB) (Qiagen, Germany) was especially optimized to extract DNA from biofilms. We standardized the amount of material using a maximum of 20 mg for all samples. (2) The PowerMaxSoil DNA isolation kit (PMS) (Qiagen, Germany) is particularly useful for complex and heterogenous samples as marine biofilms which allowed extraction of up to 10 g material in order to use the whole of samples. This method was useful in our case to utilize the entire sample amount (≈ 2 g per sample). Overall, commercials kits integrated several purification steps, results quicker, and have the advantage of employs different combinations of mechanical, chemical, and enzymatic disruption to lyse cells but, usually, have high costs associated. (3) Grinding step followed by the DNeasy PowerBiofilm kit (GPB) (Qiagen, Germany). (4) Grinding step followed by the GenElute Bacterial Genomic DNA (GGE) kit, which was significantly less expensive than other kits but did not include a column purification step. For all methods, DNA extraction was performed according to the manufacturer’s instructions. When applied, grinding step corresponded to the addition of beads (metal beads, 2.38 mm, Qiagen) in volume/volume to enhance cell disruption and DNA extraction. Bead beating was performed in a Vortex Adapter (Qiagen) for 5 min at maximum speed. For Banyuls and St. Nazaire samples, the DNA were extracted with the DNeasy PowerBiofilm kit using a maximum quantity of 20 mg (as was done with the Toulon samples previously with this kit). DNA concentrations were quantified, and quality assessed with a NanoDrop 1000 Spectrophotometer (ThermoScientific, United States). Extracted DNA was stored at −80 °C.
PCR: Overall, for the characterization of eukaryotic communities, one primer pair targeting the COI (Leray et al., 2013) and five primers pairs targeting five variable regions of the 18S rDNA gene were selected. The latter corresponded to V1-V2 (Pochon et al., 2013), V4TAR (Stoeck et al., 2010), V4UNI (Zhan et al., 2013), V7 (Van de Peer et al., 2000) and V9 (Amaral-Zettler et al., 2009). The name and sequences of primer summarized in Table S1. They were all modified to include Illumina™ overhang adaptors. Firstly, only the amplification of the V7 region of the 18S rDNA gene was performed to compare the four DNA extraction methods. Secondly, the PowerMax soil DNA extracts were used to compare all the 18S rDNA (V1-V2, V4TAR, V4UNI, V7 and V9) and COI primers. Finally, five 18S rDNA hypervariable regions and COI primers were amplified to compare the taxonomic composition of the three sites. A total of 91 samples were amplified in PCR reactions (25 μL) containing 12,5 μL of 2× GoTaq® Long PCR Master Mix, 10 μM of each primers pair, and approximately 2 ng of DNA. The thermal cycling schemes of each primers pair were based on the literature and summarized in Table S1. All PCR reactions included negative controls. Unfortunately, samples from St. Nazaire failed to be amplified by V4UNI. PCR products were checked on a 2% agarose gel. Subsequently, the sequencing was carried out with 300 bp paired end reads using the Illumina MiSeq platform to obtain MiSeq Illumina libraries (Eurofins Genomics, Ebersberg, Germany).
Bioinformatic processing
The initial quality control check of reads in ‘fastq’ files was performed using FastQC (Andrews, 2010), forward and reverse primers were trimmed from the paired-end-reads using ‘Cutadapt’ (v. 3.1) (Martin, 2011). Sequences were quality-filtered, denoised and merged into ASVs (Amplicon sequence variants) using the pipeline DADA2 (Callahan et al., 2016) within R (v. 4.1.0). Briefly, sequences were filtered based on visual impaction of the error rates according to the quality score ≥ 30 and after chimeras were detected and removed with the ‘removeBimeraDenovo’ script in DADA2. Each representative of 18S rDNA ASV sequences were affiliated using Blast+ (v. 2.10) and the naïve Bayesian classifier method (Wang et al., 2007) against the PR2 (Protist Ribosomal) database (v 4.13.0) (Guillou et al., 2013). The BOLD (Barcode Of Life Data system) (v. 2019) (Ratnasingham and Hebert, 2007) and MIDORI MARINE (GenBank) (v. 2018) databases, implanted on the Galaxy platform (Escudié et al., 2018) were used for the COI sequences. Based on the initial assignment, we organized our taxonomic profile to keep the taxonomy of ASVs with more than 95% identity and 75% sequence coverage. Below these thresholds, if an ASV showed a bootstrap confidence score <75% at each level, it was binned into unknown. After processing, ASVs with abundance lower than 0.005% were removed (Bokulich et al., 2013). Moreover, sequences assigned to organisms unlikely to live in marine environments (i.e., contamination from human DNA and terrestrial species) or unclassified at kingdom level were removed from the dataset. Analyses were then only focused on the sequences that were annotated as marine eukaryotes referring in the World Register for Marine Species database (WoRMS Editorial Board, 2021). The raw sequence data generated in this study have been deposited in the NCBI Sequence Read Archive under the accession number BioProject PRJNA777059. It is indeed well known that 18S is not suitable for species assignment but instead allows for broad taxonomic coverage, while COI is appropriate for distinguishing species (due to its high evolutionary rate) but prone to strong amplification biases and known to overlook some taxonomic groups (Leray and Knowlton, 2016; Duarte et al., 2021). For these reasons, we worked at the genus level for the 18S rDNA data and at the species level for the COI data.
Additional details on bioinformatic procedure were given in supplementary materials.
Statistical analyses
Statistical analyses and plots were performed within RStudio (R version 4.0.4, packages ‘vegan’, ‘ggplot’, ‘stats’, ‘phyloseq’). Samples were rarefied to the minimum sample read depth for each primer. All further analyses were assessed on a richness index because the correlation between true abundance/biomass of a species and DNA signal strength obtained by metabarcoding is undetermined (Jeunen et al., 2019). Alpha-diversity was assessed using ASV richness and Chao1 index. For the analysis comparing alpha diversity between the six primers and the two databases, the samples were also standardized to the same number of reads per sample besides per primer. Data were tested for normality using the Shapiro-Wilks test and were statistically tested with an analysis of variance (ANOVA) followed by Tukey Honest Significant Difference (HSD) test and the homogeneity of dispersion was assessed using the ‘betadisper’ function. To determine the influence of the different tested conditions on specific taxonomic groups, a similarity percentage analysis (SIMPER) was used with a threshold of 50% of discrimination. Multivariate analyses were used to investigate whether eukaryotic community structure changed across extraction methods, primers, or sites. Nonmetric multidimensional scaling (NMDS) ordinations were computed based on Jaccard and unweighted Unifrac distance matrices. First, the effects of extraction methods and surface types, and then, primers, surface types, and localities on community composition were tested for significance using a permutational multivariate analysis of variance (PERMANOVA) with 9999 permutations. Mantel tests based on Spearman’s rank correlation were performed to evaluate the correlation between primers pairs at the ASV level. Primer and Site variables were correlated with community composition using the ‘envfit’ function. Post hoc Tukey’s tests were carried out to differentiate the dispersion.
Results
DNA extraction methods effects on eukaryotic diversity and taxonomic composition
Amplicons obtained with the four extraction methods and the three surface types (n = 36 samples) were sequenced returning 3,489,945 raw sequence reads. After refining, a total number of 1,267,175 reads was distributed across all the samples. Sufficient sequencing coverage was obtained, except for one replicate (PVC extracted with PMS), which was removed from the dataset as it did not meet the rarefaction threshold of 36,205 reads (Figure S2). Sequences represented 323 non singleton and assigned ASVs.
Regarding alpha-diversity, there was no difference in richness among the surface types (PVC, HDPE, and PA) (ANOVA, p = 0.12547) while there was a statistical difference across the extraction method used (p < 0.0001) (Figure 1A). Pairwise tests on Chao1 values showed that richness associated with the PMS and PB kits (PMS: 126 ± 10 ASVs, PB: 115 ± 17 ASVs) was higher than with other methods including GPB (105 ± 15 ASVs). The alpha-diversity based on the extraction with the GGE method was the lowest but also showed a high variability between replicates (96 ± 18 ASVs).
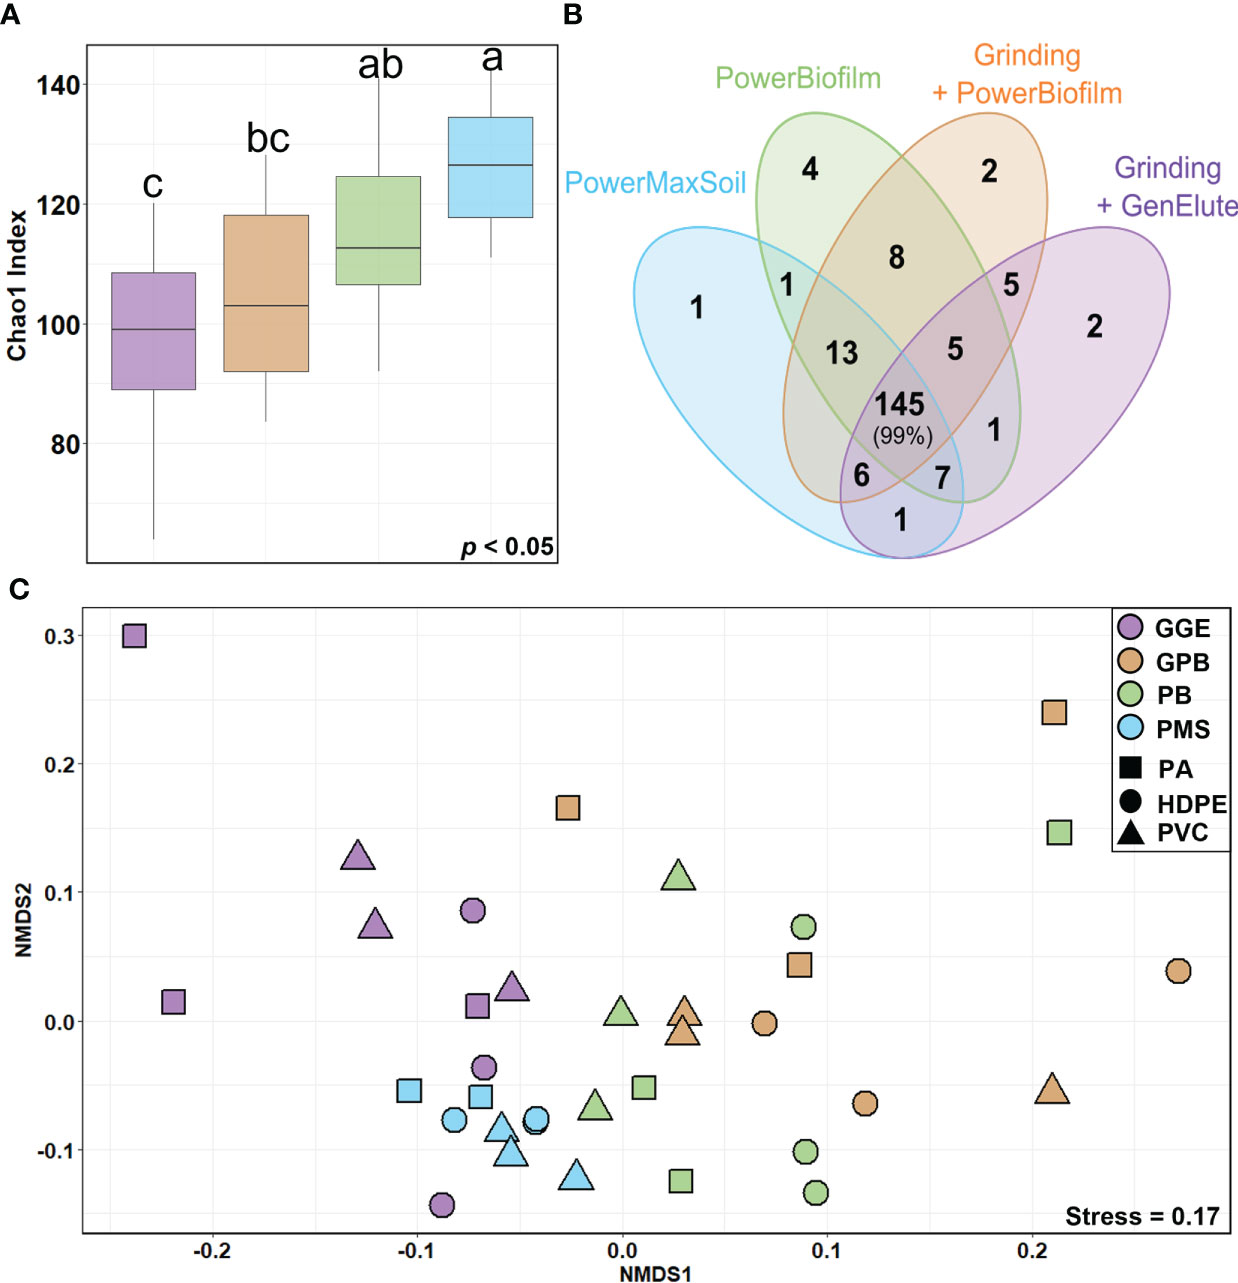
Figure 1 Diversity of eukaryotic communities according to different DNA extraction methods (A) Boxplots of the Chao1 index at the genus level for each extraction method. The line in each box plot indicates the median, the box delimits the 25th and 75th percentile, and the whisker is the range. Letters above boxplots represent pairwise comparisons between each method. (B) Venn diagram of genera identified for each extraction method. Numbers within overlapping ellipses show numbers of genera shared between methods; numbers in non-overlapping ellipses show unique genera for the method; percentage indicates the associated proportion of reads. (C) NMDS of the eukaryote community composition across different surfaces (shapes) and determined with different extraction methods (colors). Unweighted unifrac distance was used for matrix distance. Each point represents one sample. PowerBiofilm (BF), PowerMaxSoil (PMS), Grinding step followed by PowerBiofilm (GBF) Grinding step followed by the GenElute bacterial genomic (GGE), Polyamide (PA), High Density Polyethylene (HDPE), polyvinyl chloride (PVC).
NMDS (Figure 1C) showed significant segregation of eukaryotic communities according to the extraction methods used (PERMANOVA, p = 0.0001, betadispers, p < 0.0045). A lower influence of the surface types on eukaryotic communities was also observed, as PERMANOVA indicated a significant but lower value with unweighted Unifrac distances (PERMANOVA, p = 0.0410). PB, GPB and GGE methods showed similar variability (betadisper, p > 0.05). However, the testing of homogeneity of multivariate dispersions showed a heterogeneous dispersion (betadisper, p < 0.05) for PMS and the other methods (Figures S3A, B).
The number of taxa identified at the genus level reached 201. Among them, 145 genera were common to all DNA extraction methods and represented 99% of the reads (Figure 1B). Thus, all methods detected the same dominant genera, but with different proportions (Figure S4), suggesting that the extraction methods impacted relative abundances. SIMPER results showed that 8 genera contributed to more than 50% of the differentiation between eukaryote communities across methods (Figure S5). PB and PMS kits tended to better recover Metazoans, especially Arthropoda (Harpacticus), Bryozoa (Bugula and Watersipora) as well as Nematoda of the Chromadorina genus. Conversely, members of Phaeophyceae, such as Leathesia, were better identified when using a preliminary grinding step (GPB: 34 ± 14%, GGE: 51 ± 10% compared to PMS: 6 ± 3% and PB: 8 ± 4%). The Ceramium genus was more identified using GPB (5 ± 6% compared without grinding PB: 1 ± 1%) and Neosiphonia with PB (3 ± 4% compared with grinding GPB: 1 ± 1%) but both genera showed a high variability.
Diversity and community composition depending on genetic markers and databases
To determine the composition and diversity depending on primer pairs, we focused on the sequences corresponding to the 54 samples immersed at Toulon, representing three types of surfaces in three replicates, and which were all amplified by six primers pairs. Rarefaction curves indicated that the coverage of sequencing was sufficient for all primers (Figure S6). Only one PVC sample with V7 primer amplification had not reached the normalization threshold (36,389 sequences). High percentages of taxonomy assignment were reached for ASVs obtained with the 18S rDNA primers until the genus level (74 to 85% corresponding to 55 to 94% of reads), whereas the taxonomy assignment at the species level fall between 52 to 65% (corresponding to 38% to 71% of reads) (Table 1). However, regarding the COI ASVs, only 7 and 6% were affiliated at the genus and species levels with BOLD, respectively, compared to 16% with MIDORI.
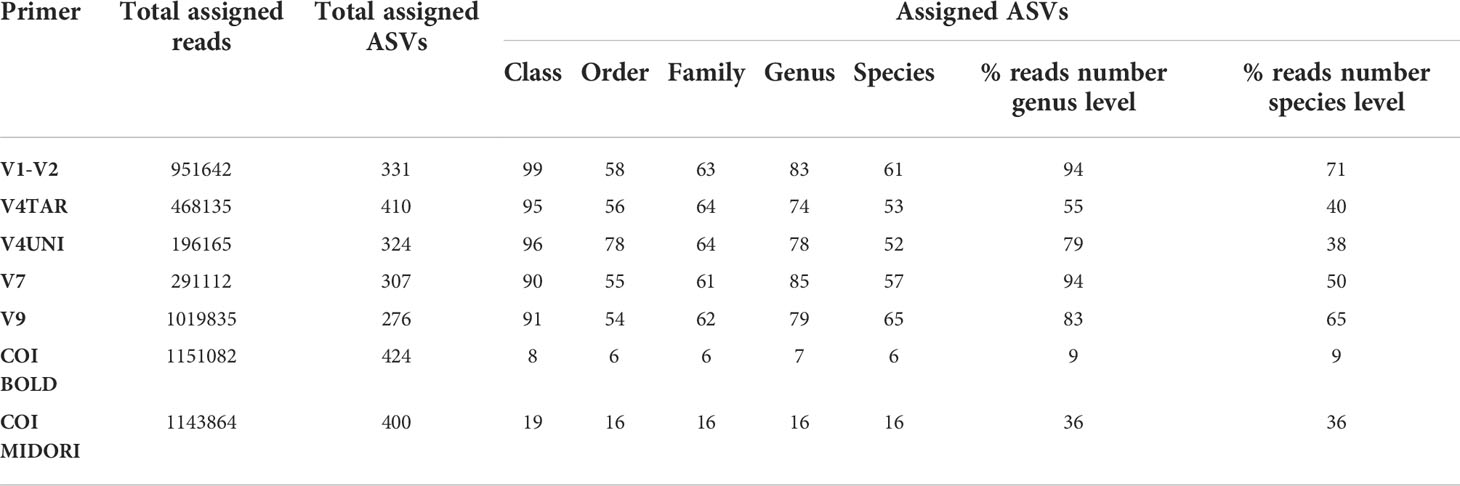
Table 1 Summarize of affiliation percentages from the class to the species level and associated percent of reads at the genus and species level with the different primers/database used for each panel (PVC, PA, and HDPE) from Toulon extracted with the PMS method and amplified with five hypervariable regions of 18S rDNA and COI affiliated with the two databases (n = 54 samples).
Richness measured by the Chao1 was not significantly different across surface types (ANOVA, p = 0.055) but differed significantly between primers (ANOVA, p < 0.0001) (Figure 2A). Moreover, Mantel tests were used to correlate the eukaryotic community structure between each primers pair. Results showed that high and significant relationships between eukaryotic communities regardless of the primer choice were obtained (Mantel’s > 0.3, p < 0.05). The 18S rDNA primers exhibited a higher correlation with each hypervariable region of 18S rDNA compared to COI (BOLD and MIDORI), including close relationships between V4TAR and V7, and V1-V2 and V9, with R values around 0.94 (p < 0.001). However, COI allowed a similar community structure with respect to the database choice (Figure 2B). NMDS analysis, based on Jaccard’s index, revealed a separation between 18S rDNA regions and COI (Figures S7A, S8) with a significant beta dispersion among COI affiliated with both databases (betadisp, p = 0.01). We did not detect any significant interaction between surface types, contrary to primers and databases (PERMANOVA, p< 0.001). Although NMDS plots showed distinct clustering across regions of 18S rDNA, high and significant correlations were found between distance matrices suggesting a similar structure between each primer (Mantel’s > 0.7, p < 0.01) (Figure S7B).
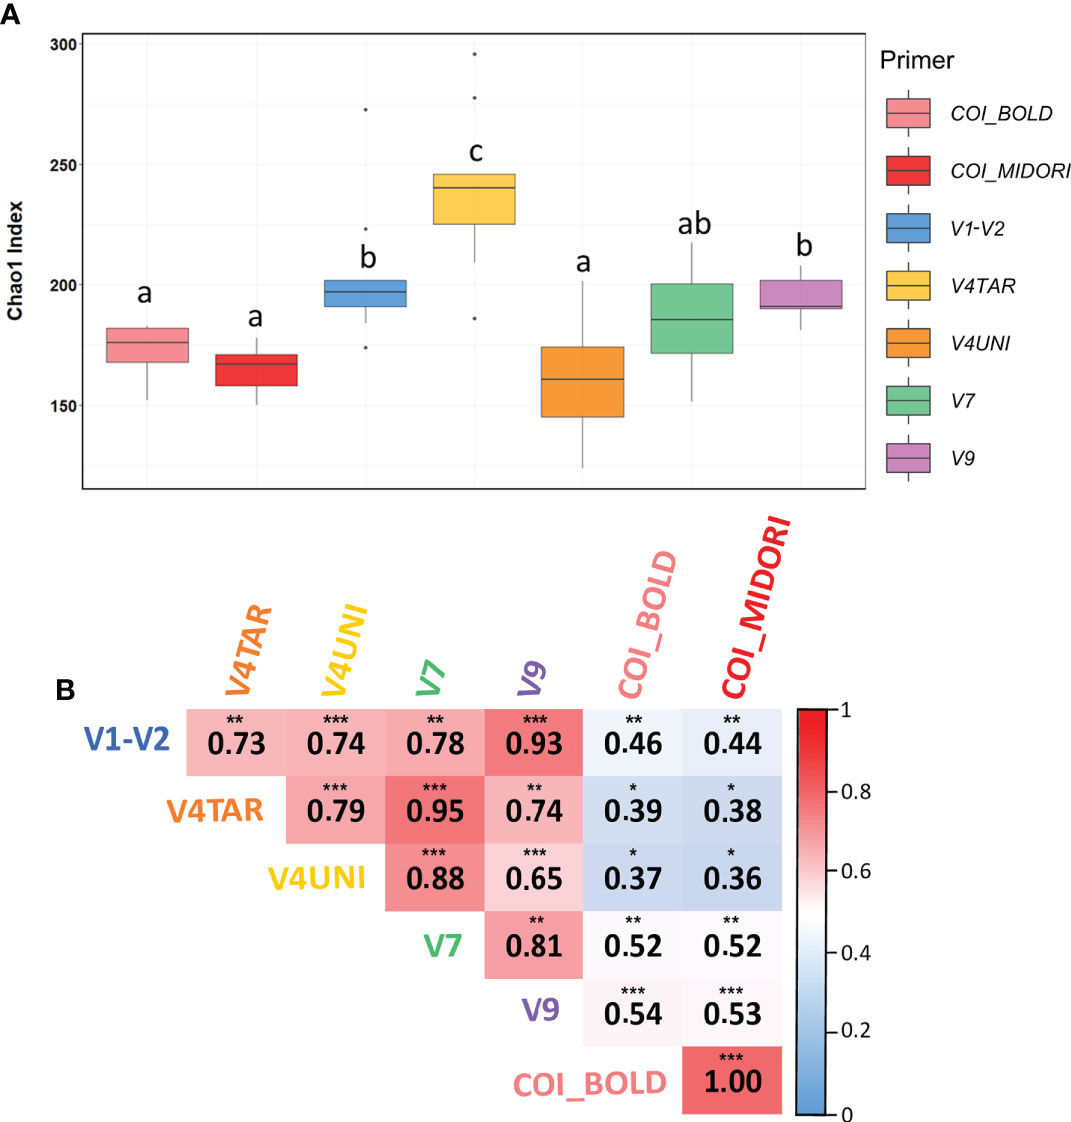
Figure 2 Diversity of eukaryotic communities according to different genetic markers. (A) Boxplots of chao1 index at the genus level for each primers pair calculated for Toulon samples. The line in each box plot indicates the median, the box delimits the 25th and 75th percentile, and the whisker is the range. Letters above boxplots represent pairwise comparisons between each primers pair. (B) Mantel test between eukaryotic community structures for each primer based on Spearman correlation for Toulon samples (n= 9). Color indicated the R values. Analyses are performed on Jaccard distances based on ASVs. Significant values are indicated by the following code: 0 ‘***’ 0.001 ‘**’ 0.01 ‘*’ 0.05 ‘.’ 0.1 ‘‘ 1. Samples used are the three panels (PVC, PA, and HDPE) from Toulon extracted with the PMS method and amplified with five hypervariable regions of 18S rDNA and COI affiliated with the two databases (n = 54) samples.
Comparing the taxonomic composition and structure between markers, only 8 and 14 classes were detected for COI using BOLD and MIDORI databases, respectively, compared to 47 ± 4 for 18S rDNA. Clear differences were observed in the 33 most abundant genera (relative abundance threshold ≥ 0.5%) recovered by each primer. Harpacticus and Schlerochilus (Arthropoda), Watersipora (Bryozoa), Cephalothrix (Nermertea) and Obelia (Cnidaria) were dominant genera with all 18S rDNA primers (Figure 3A). On the contrary, both Jassa species (J. slatteryi and J. marmorata, Arthropoda) were the only species dominant with the two COI databases (Figure 3B). Overall, very few species were dominant following the COI, regardless databases. Indeed, only 10 species showed abundances greater than 0.1% and many species remained unknown/unidentified, such as many species of Nematodes, Mollusks, Cnidaria, and Arthropods. A greater number of genera were abundant in the COI samples assigned with MIDORI and which showed dominant genera such as Obelia (Hydrozoa) and some genera in Bryozoa. Conversely, Phaeophyceae, Arthropoda, Bryozoa and Nematoda were the top four abundant classes across 18S rDNA samples. Phaeophyceae genera were the most abundant ones with V1-V2 (39 ± 8%), V4TAR (38 ± 8%), V7(35 ± 7%), and V9 (30 ± 15%) while only 1% was recovered with the V4UNI primer. Communities obtained with V4UNI were dominated by the genus Neochromadora in the Nematoda class (13 ± 2%). For the 18S rDNA data, a total of 432 genera were identified. Among those, 37 genera were shared by all the 18S rDNA regions, accounting for an average of 34% of sequences (Figures S9, S10). The proportion of shared groups varied slightly between primers, except for some taxa such as the Florideophyceae of the genus Ceramium (Rhodophyta) and Diathrodes (Arthropoda) which were less abundant with V1-V2 and V9 respectively. However, specificity between 18S rDNA primers appeared mainly at the genus level (Figure S10, Table S2). Indeed, as shown in Figure 4, the detection of some Phaeophyceae genera varied depending on the 18S rDNA primer. For instance, Ectocarpus was detected by V1-V2, Adenocystis was detected by V9, and Pylaiella was detected by V7 while no Phaeophyceae genera were detected using V4UNI. The same result was observed for groups of Bacillariophyta (diatoms), which were identified with all primers excluding V4UNI. By contrast, some of the Florideophyceae and Umbonula (genera of Rhodophyta and Bryozoa classes, respectively) were specific for both V4 primers. Finally, the percentage of specific genera varied from 4% to 14% with V7 reaching the highest value closely followed by V9 (Table S2).
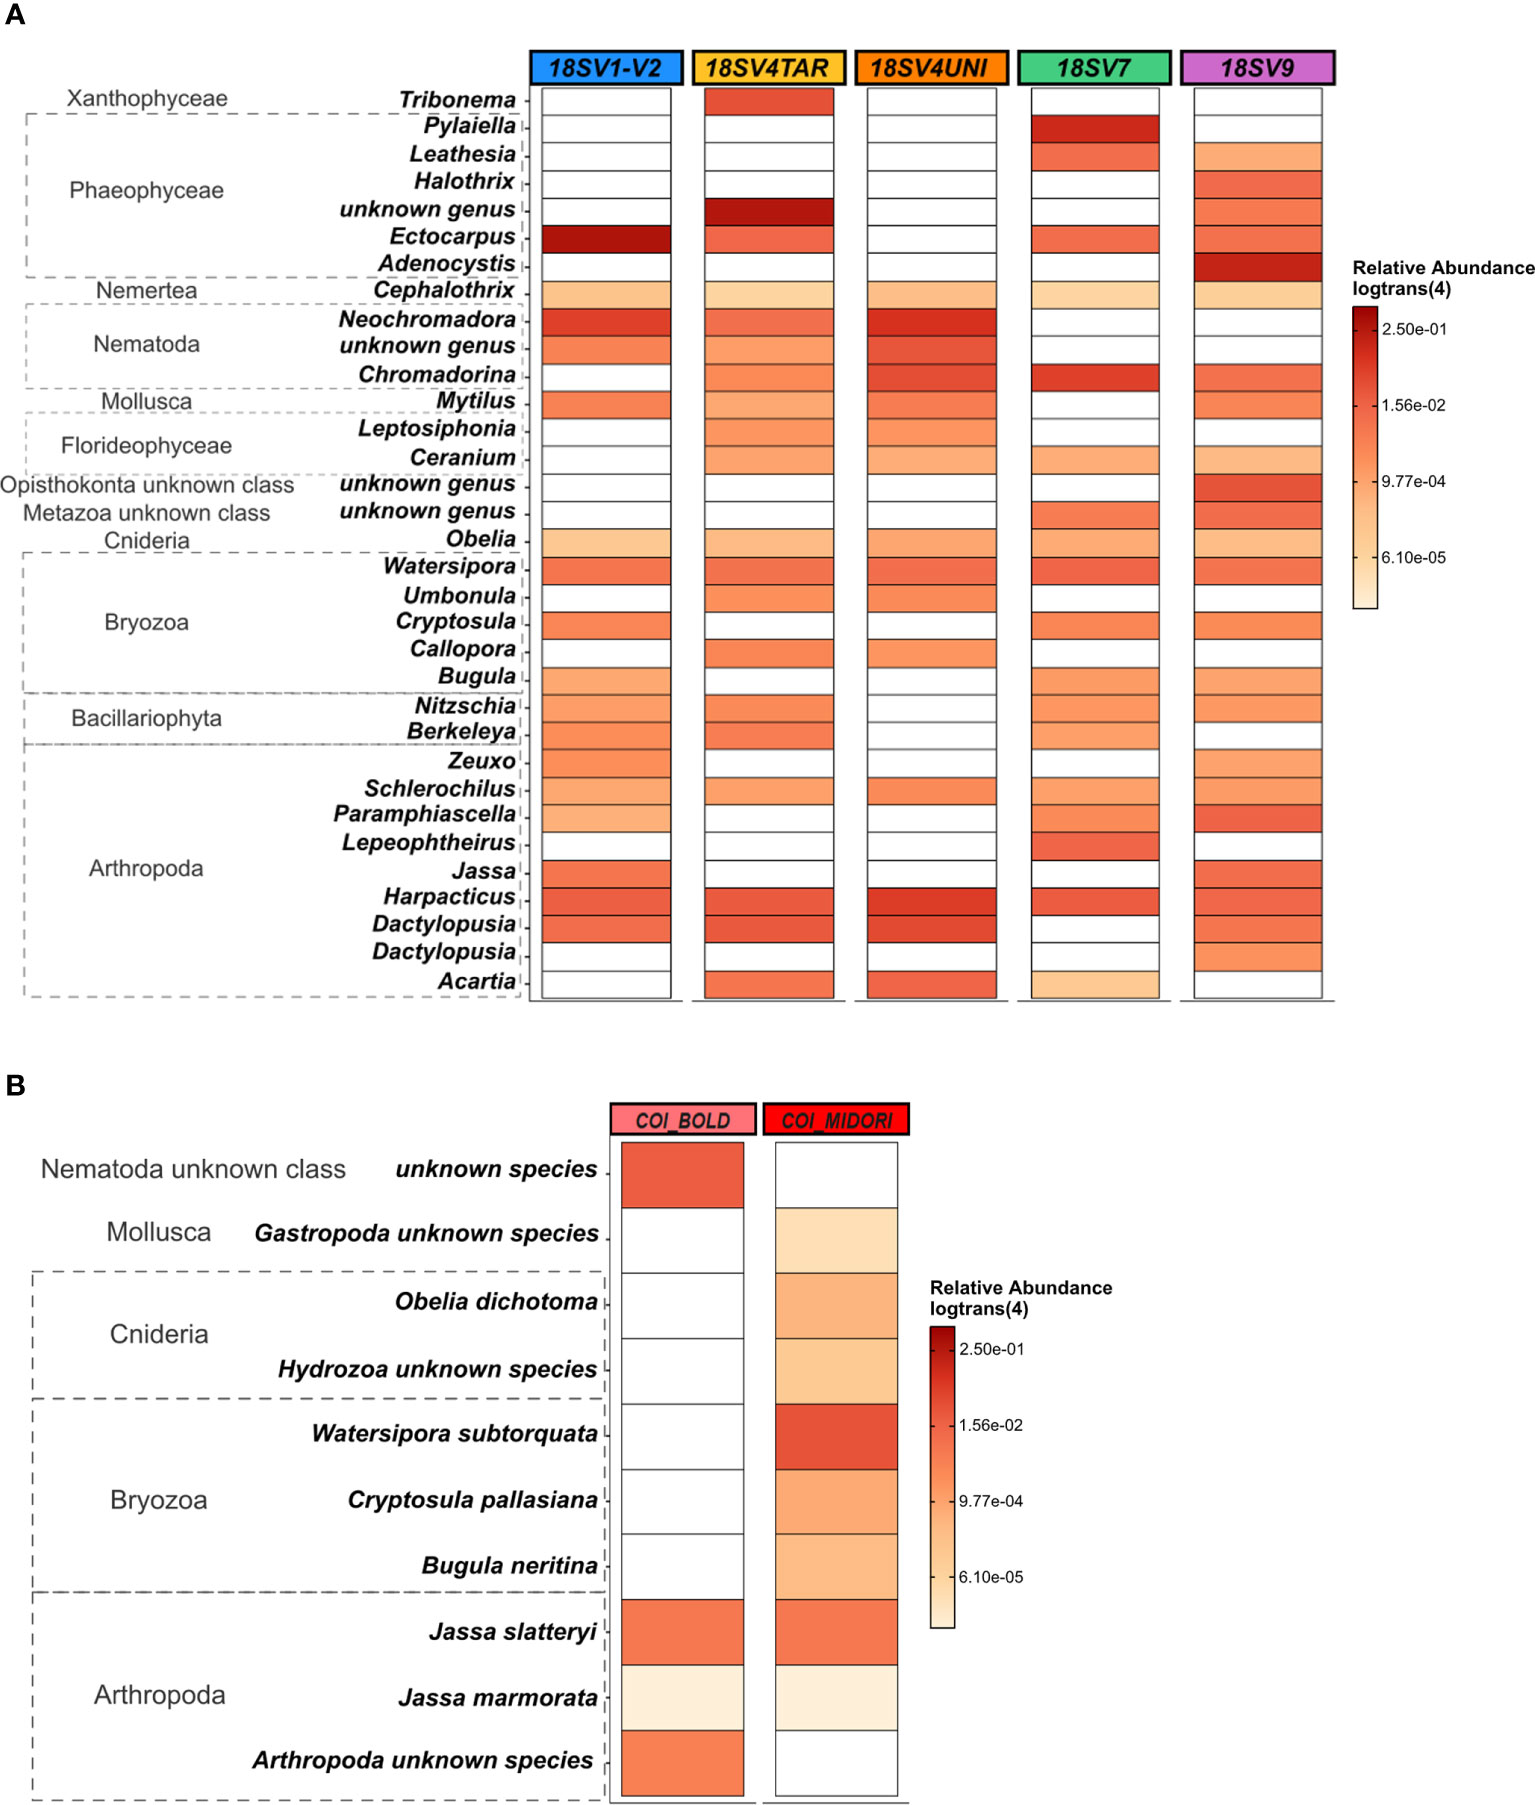
Figure 3 Heat map based on the relative abundance [in log_trans (4)] of: (A) the 33 most abundant eukaryote genera across five hypervariable regions of 18S rDNA selected if > 0,5%. (B) The 10 most abundant eukaryote species across COI using two databases selected if > 0,1%. Samples used are the three panels (PVC, PA, and HDPE) from Toulon extracted with the PMS method and amplified with five hypervariable regions of 18S rDNA (n = 45 samples).
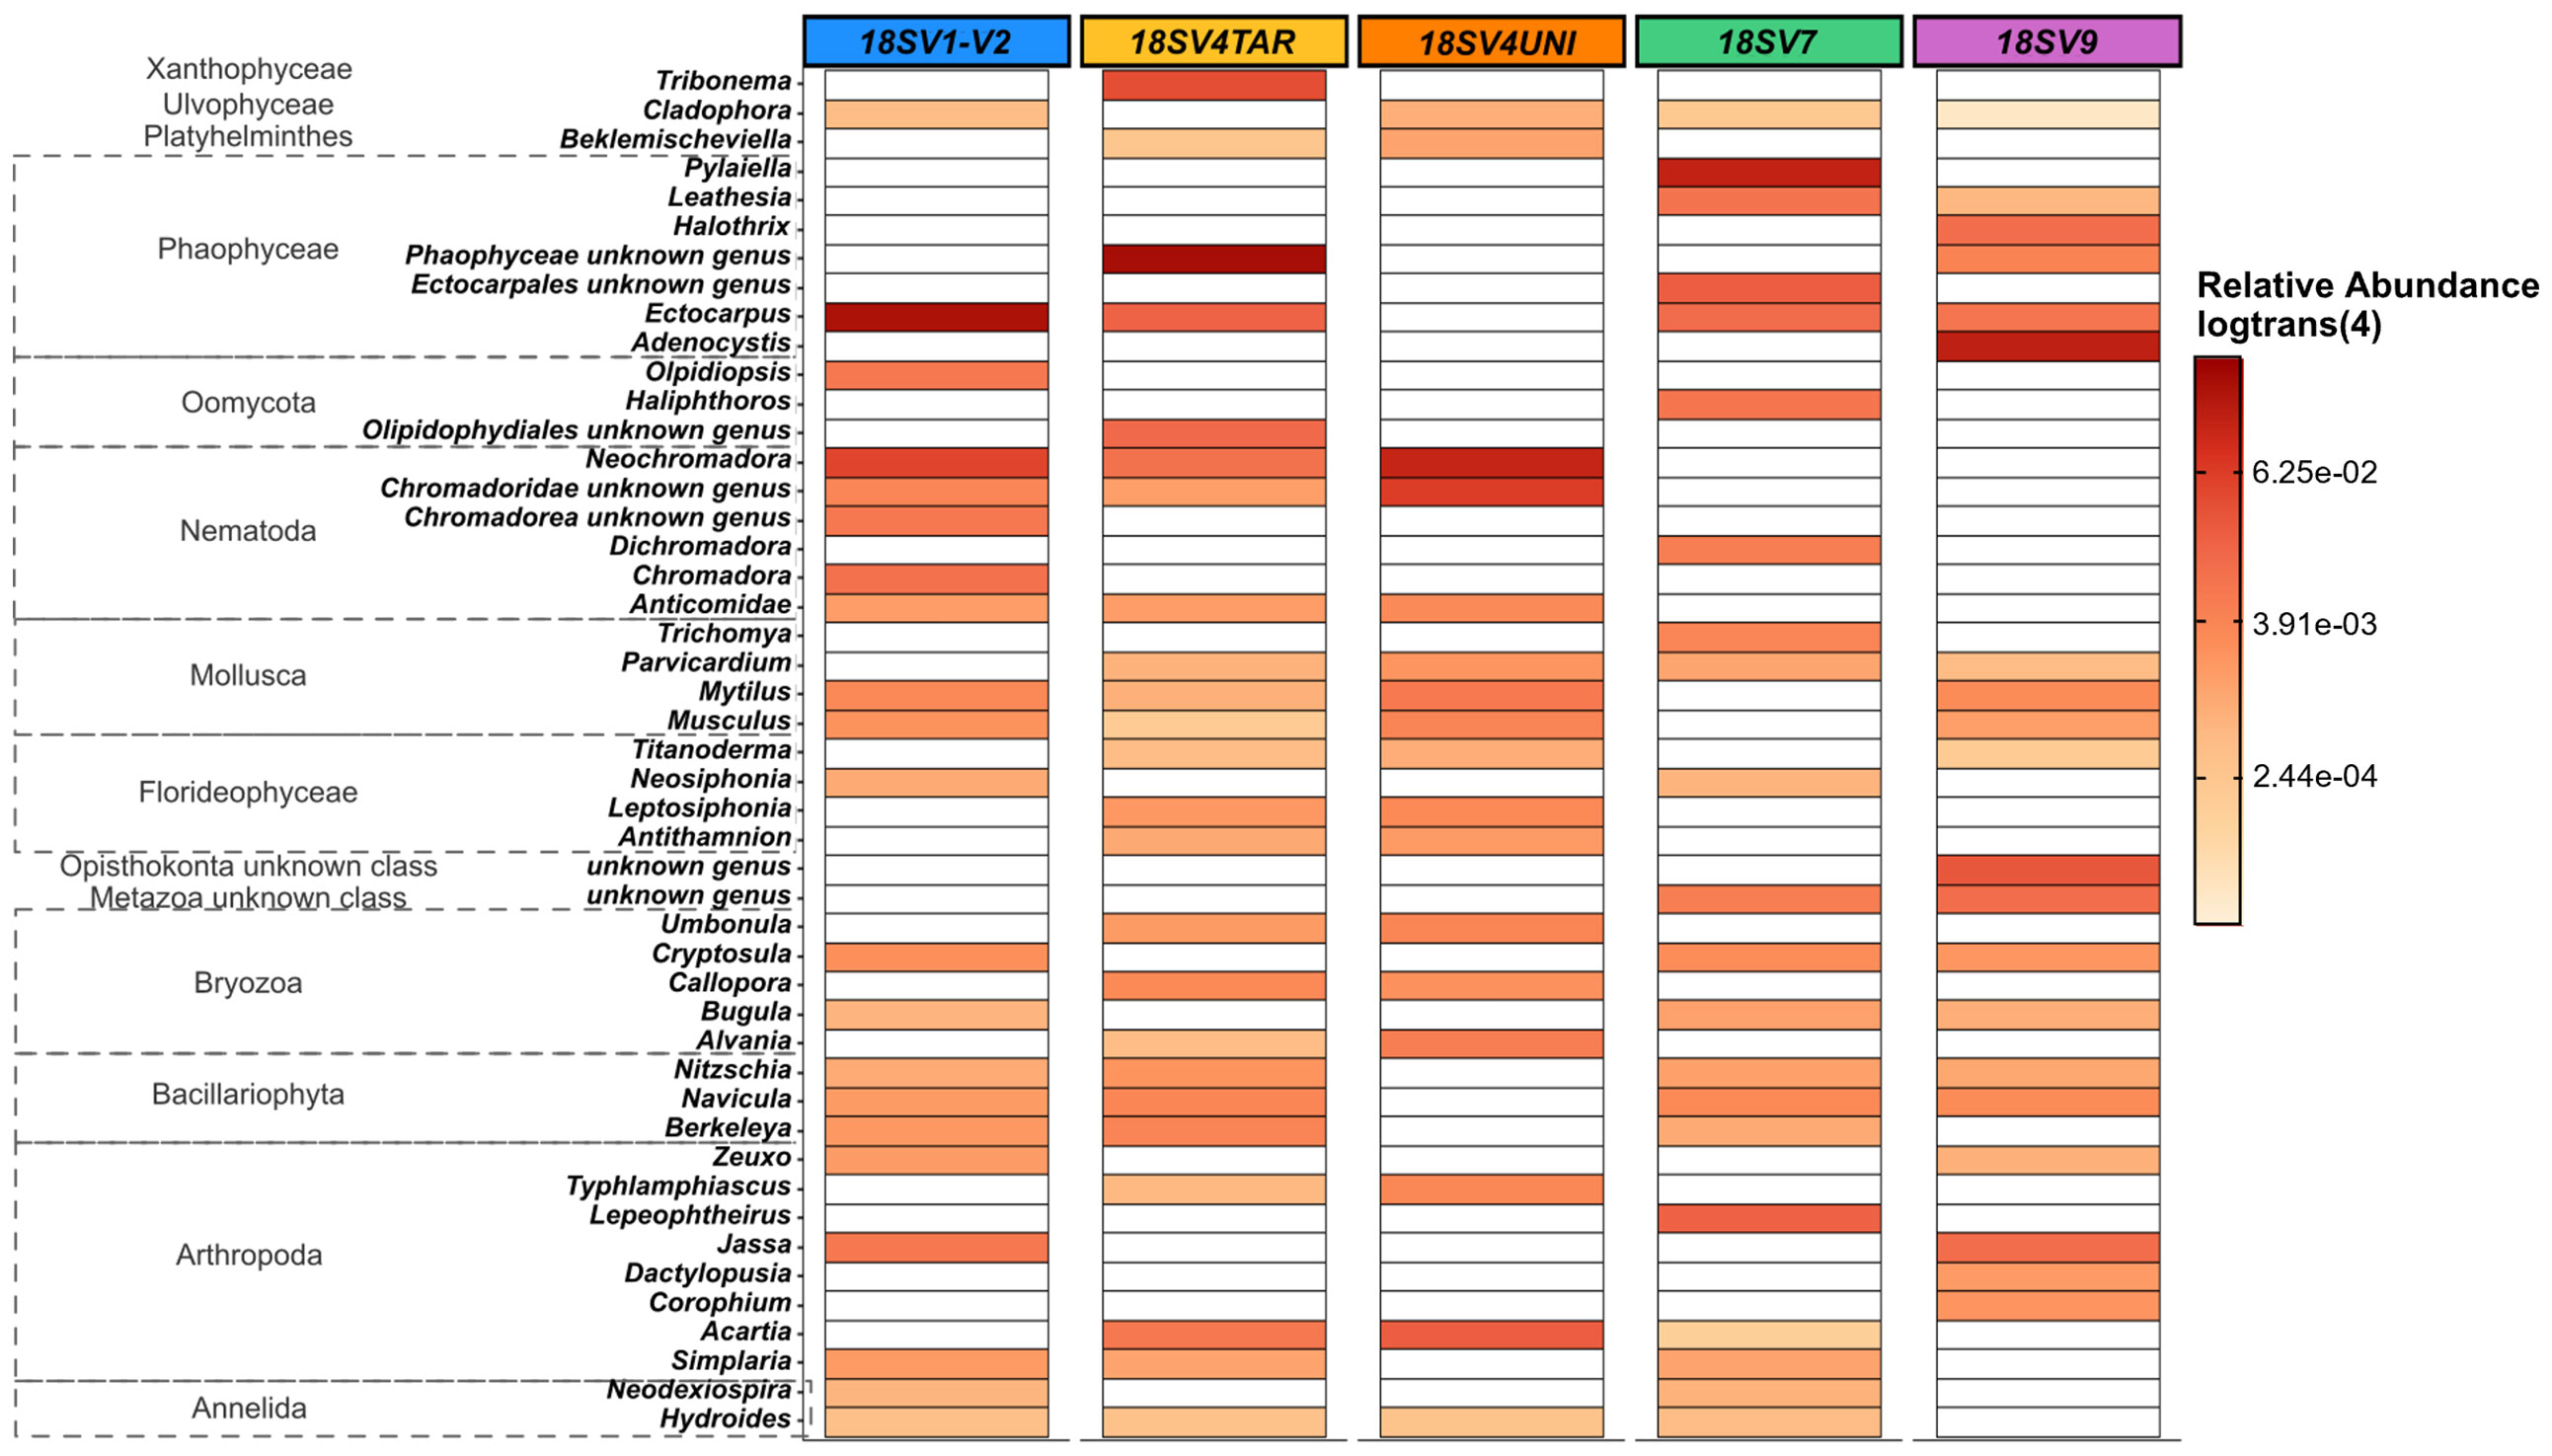
Figure 4 Heat map based on Toulon samples representing the relative abundance [in log_trans (4)] of: eukaryote genera specific to each 18S rDNA primers (>0,3%). 37 common genera were removed to visualize only the specific genera. Samples used are the three panels (PVC, PA, and HDPE) from Toulon extracted with the PMS method and amplified with five hypervariable regions of 18S rDNA (n = 45 samples).
Spatial variations of marine eukaryotic community structure
The effect of primer choice on the characterization of marine biofouling community was then assessed based on samples from contrasted marine systems. DNA extracts, obtained with PB method, from samples scraped on PVC panels deployed at Toulon, Banyuls and Saint-Nazaire were also amplified with the six primer pairs (i.e., COI and the five hypervariable regions of 18S rDNA) (n = 35 samples). Then, we compared results at a larger scale across the three sites.
First, the richness and relative abundances of the major eukaryotic groups from the three localities are presented for the five regions of 18S rDNA and COI affiliated with the two databases in the Figures 5, 6. Chao1 index was generally higher with 18S rDNA primers than with COI. However, whatever the marker, a same pattern can be observed with higher richness for the Toulon samples.
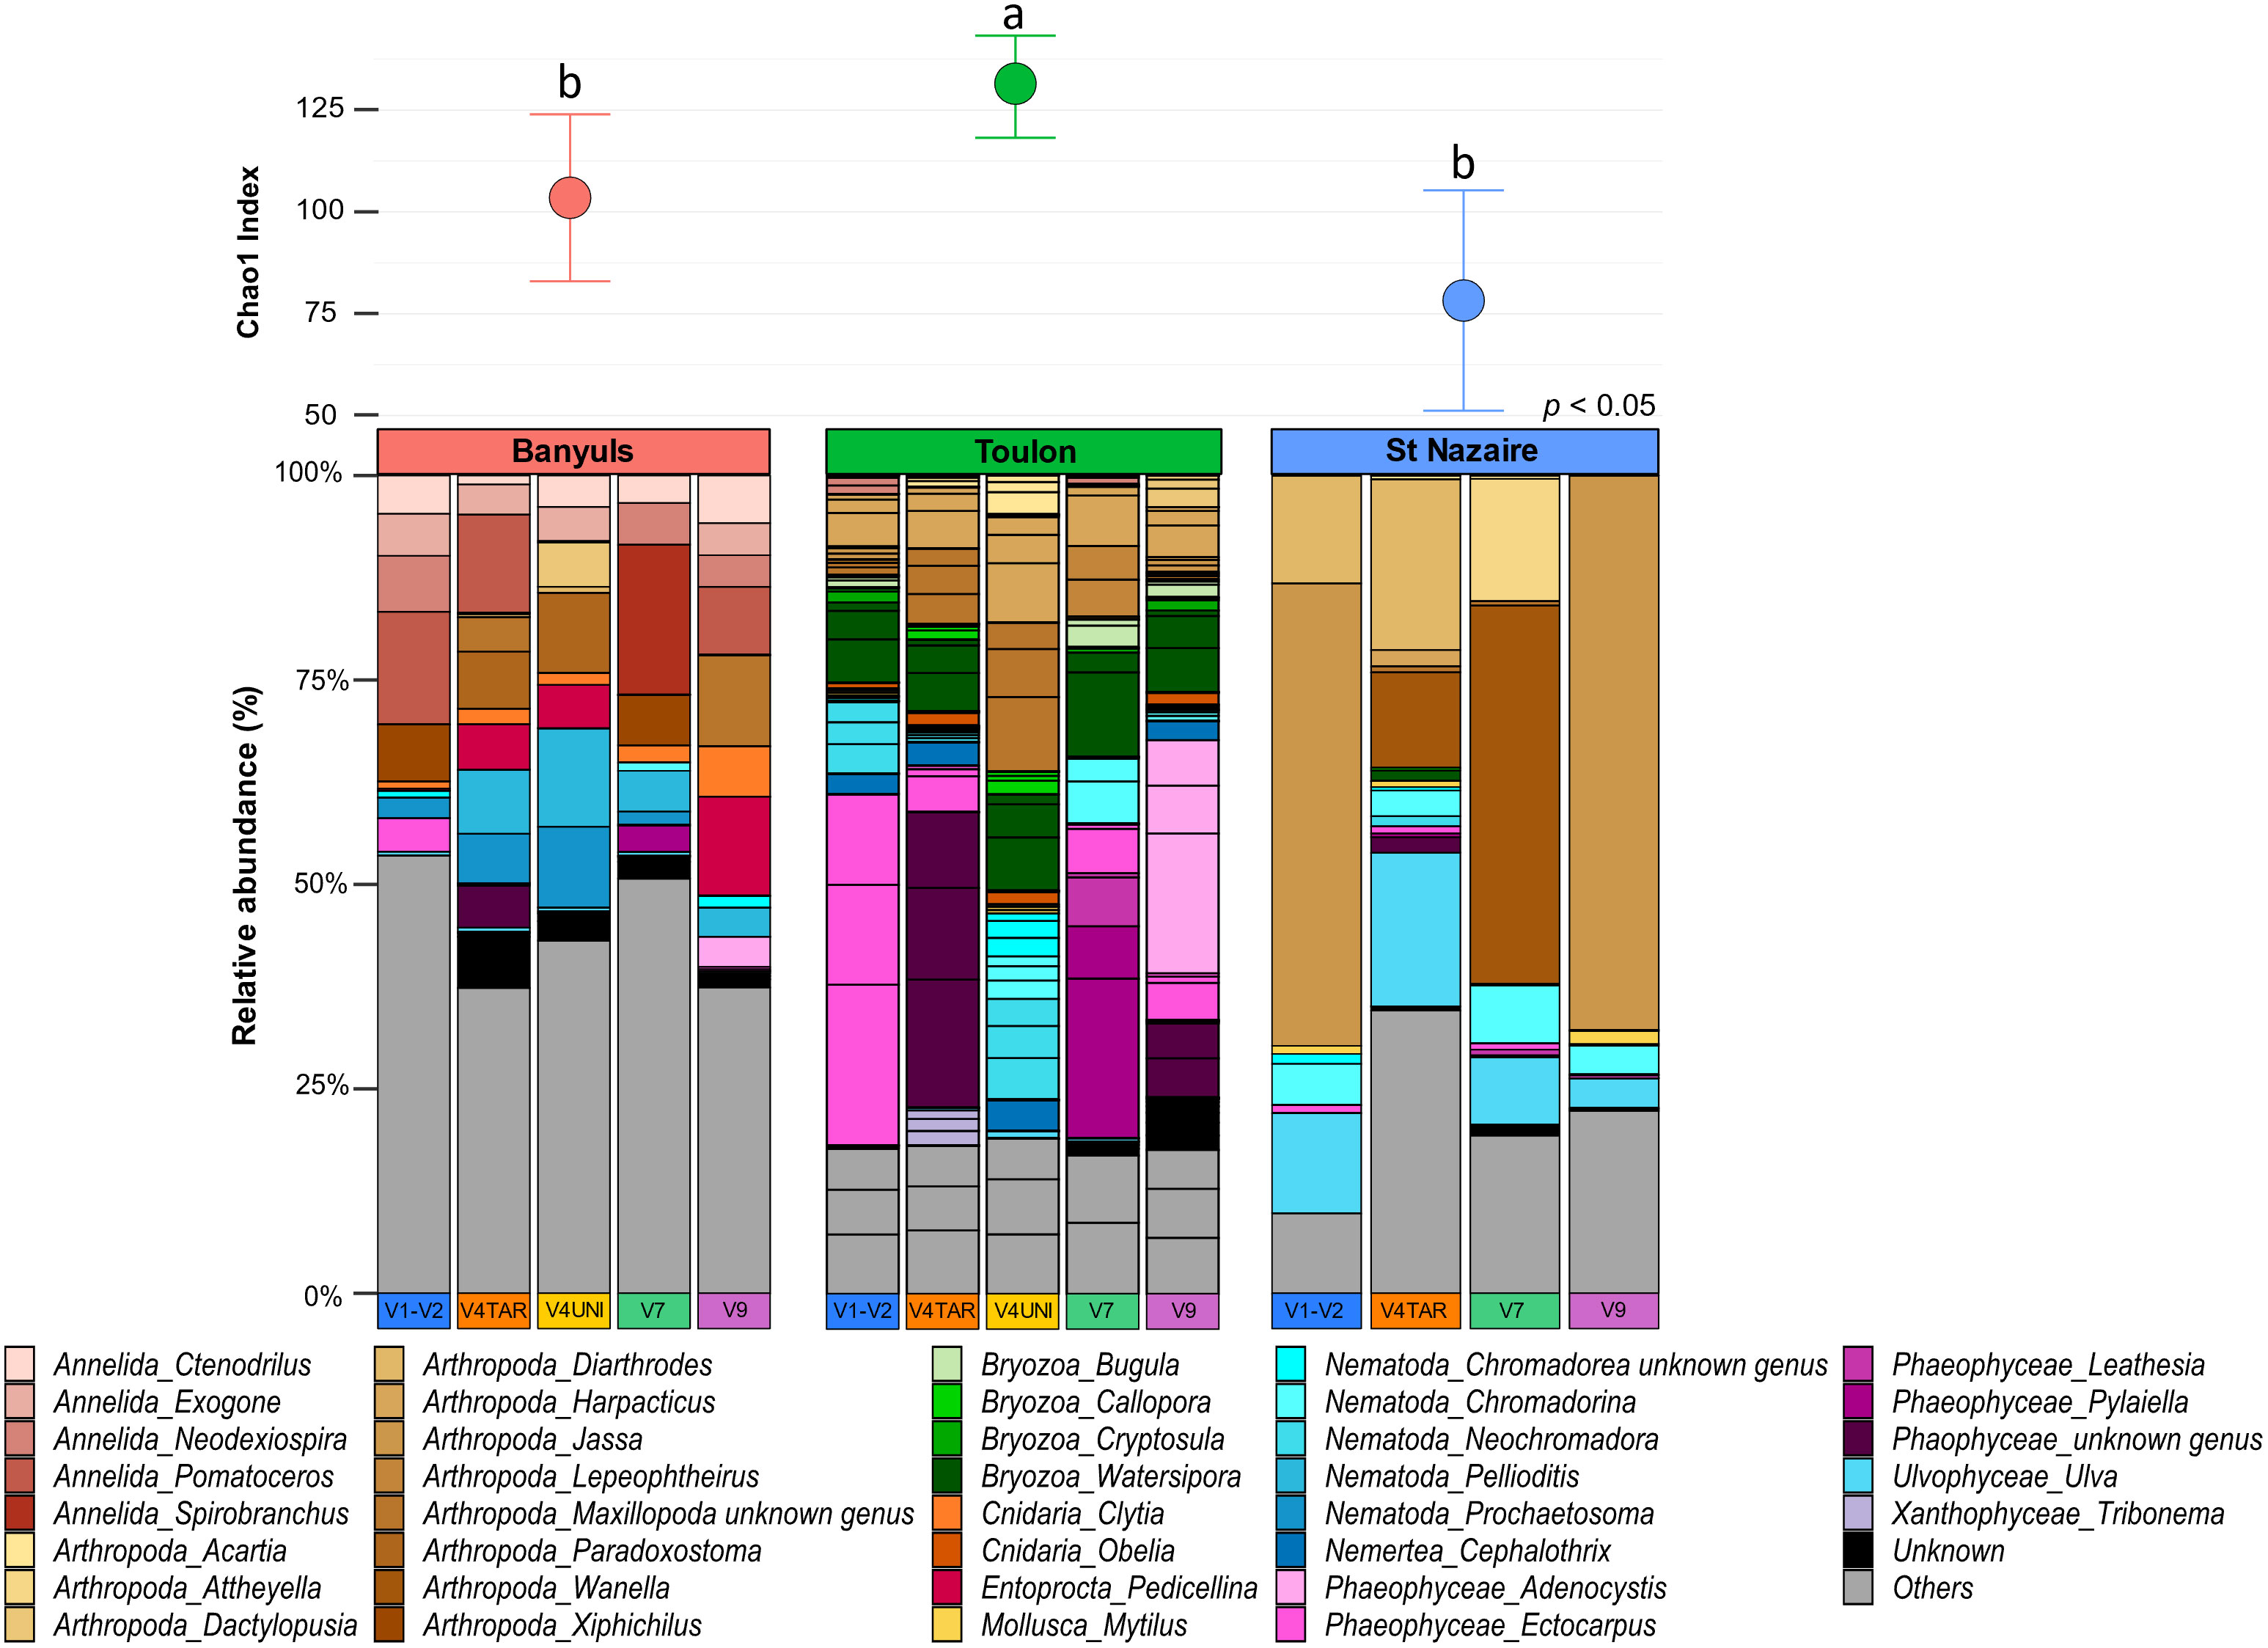
Figure 5 Diversity and composition of top eukaryote genera within each site for 18S rDNA gene. Barplots were represented in relative abundance (> 0.1%) of each taxonomic group of eukaryotes. Above the barplot, graph shows chao1 index at each site (Banyuls, Toulon, Saint-Nazaire). Letters above boxplots represent pairwise comparisons between sites.
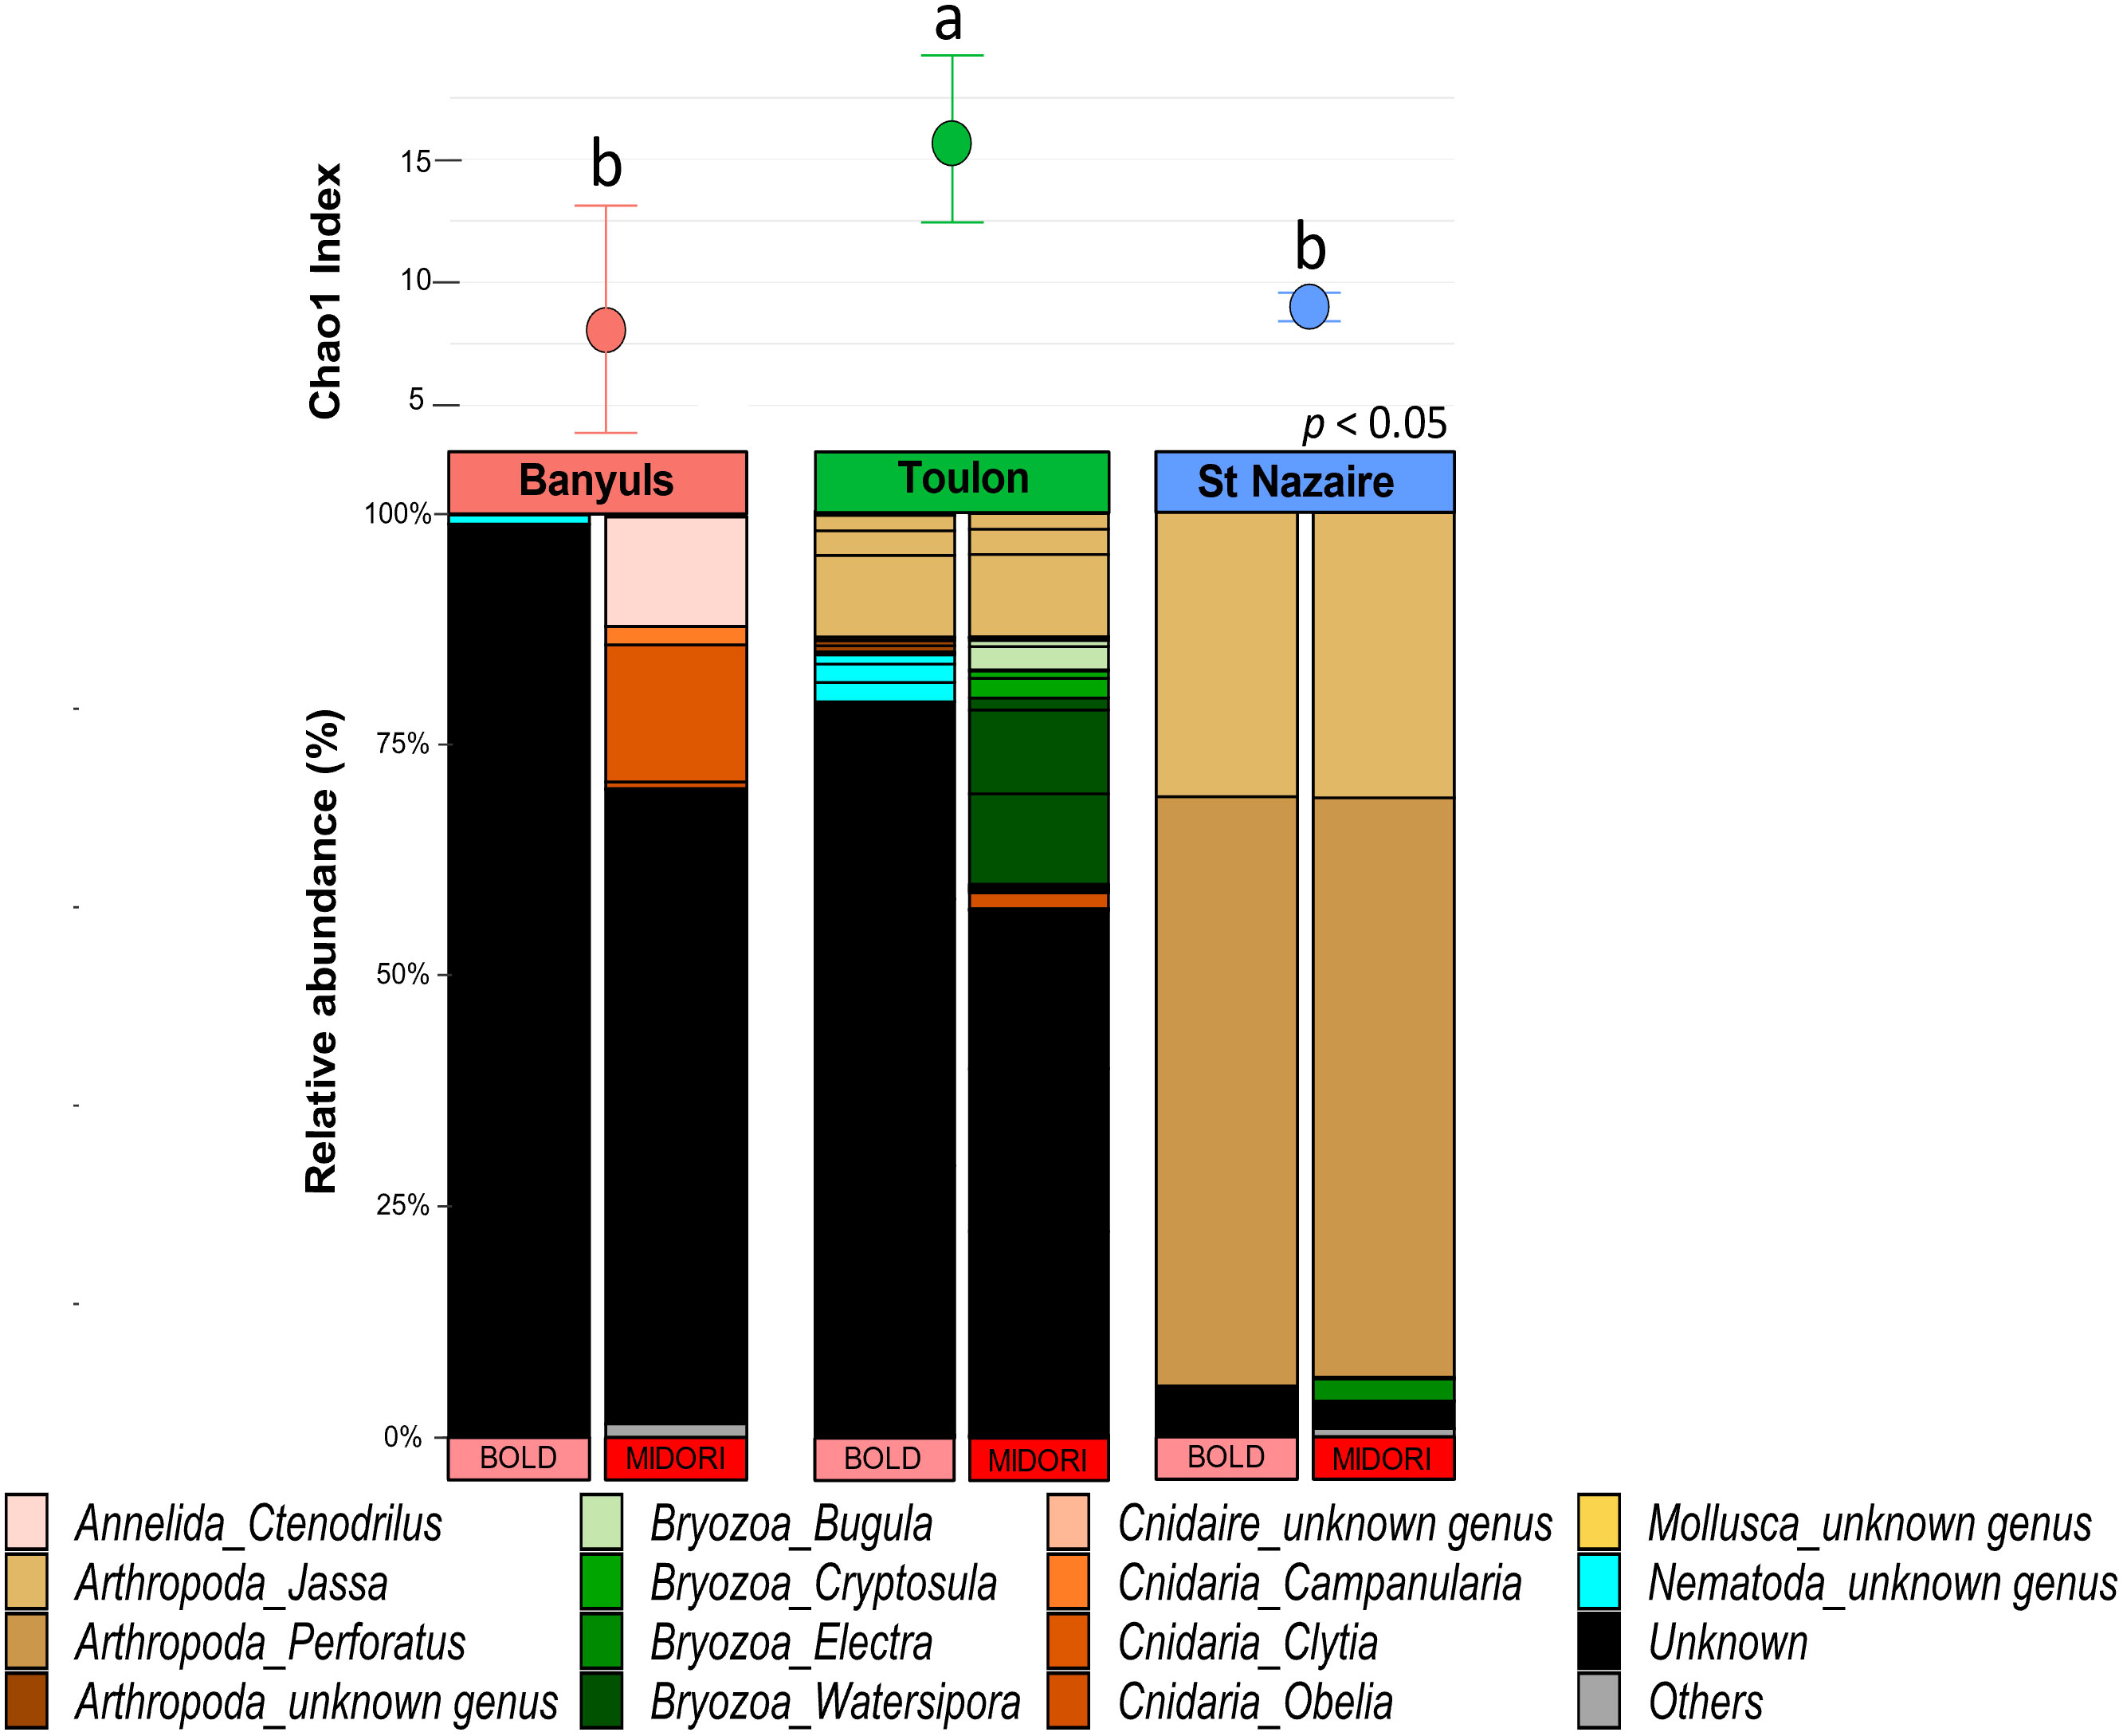
Figure 6 Diversity and composition of top eukaryote genera within each site for COI gene. Barplots were represented in relative abundance (> 0.1%) of each taxonomic group of eukaryotes. Above the barplot, graph shows chao1 index at each site (Banyuls, Toulon, Saint-Nazaire). Letters above boxplots represent pairwise comparisons between sites.
Then, the COI and 18S rDNA datasets showed distinct clusters based on different localities (Figure 7). The NMDS ordination plot showed three clusters based on location (PERMANOVA, p < 0.0001) for the 18S rDNA data and two clusters based on databases for the COI, with Mediterranean samples clustering together (Figures 7A, B). In addition, long vectors for Banyuls, Saint-Nazaire and Toulon in ordination plots revealed that location was strongly associated with the variability of eukaryote assemblages (envfit for 1st and 2nd axes, p < 000.1 for 18S rDNA and p < 0.05 for COI), while primers and databases were statistically not related to variation in biofouling community structure (envfit for 1st and 2nd axes, p = 0.999 for 18S rDNA and p = 0.5930 for COI).
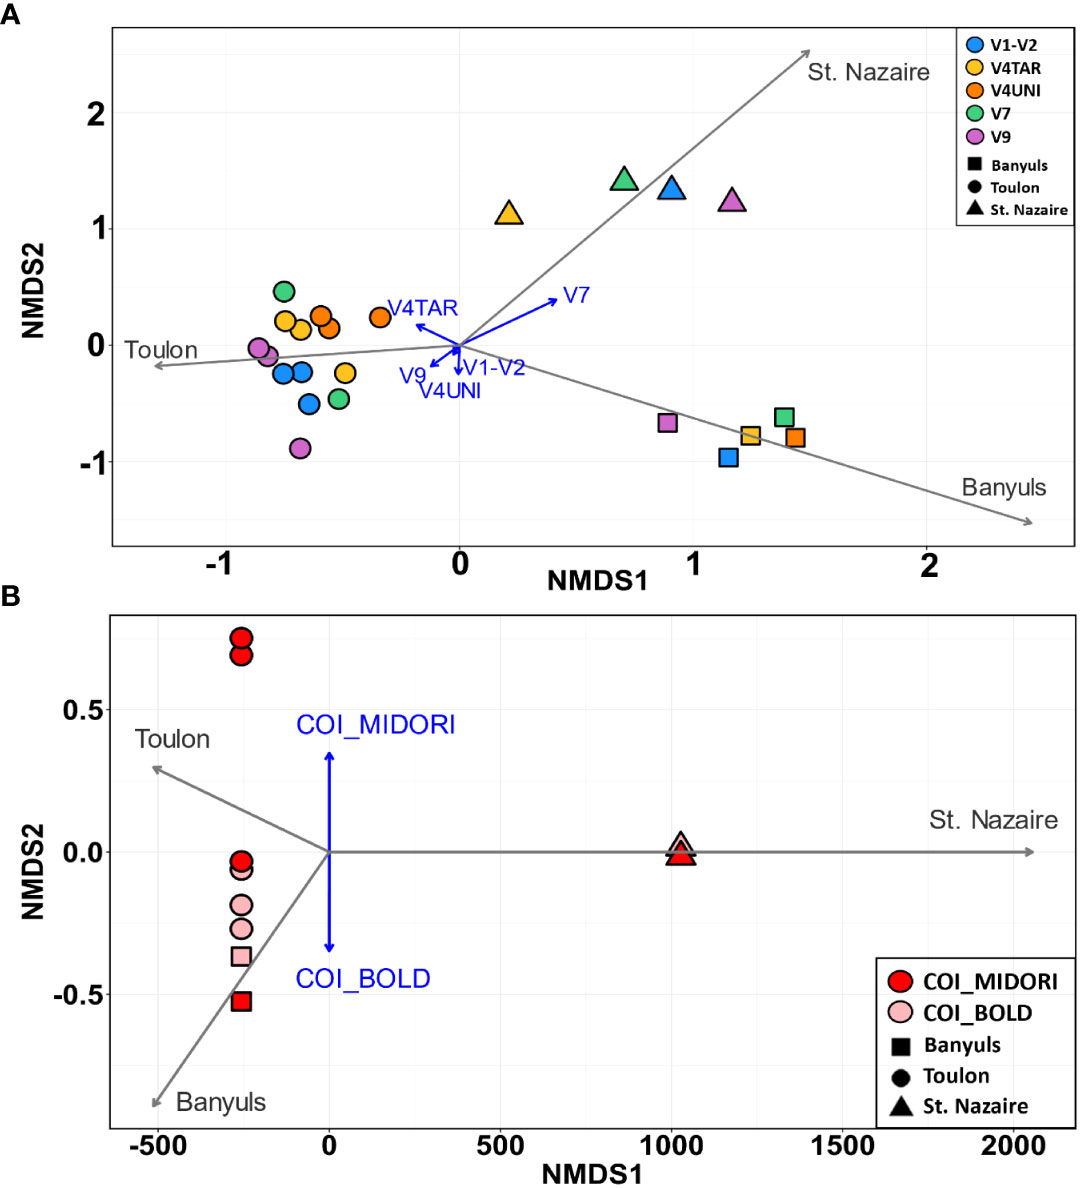
Figure 7 NMDS showing eukaryotic communities that attached to PVC panels at the three sites (Banyuls, Toulon, Saint-Nazaire showed by different shapes) with primers targeting (A) the five regions of 18S rDNA (colors) and (B)the COI with two databases (MIDORI and BOLD). Jaccard’s distance was used for the raster distance. The gray vectors represent the sites, and the blue vectors represent the primers, or, in the case of COI, the databases used (envit function). Each point represents one sample.
A total of 597 genera were detected with the five regions of 18S rDNA against 52 with the COI dataset (Figure S11). For each marker, the number of exclusive genera was highest at Toulon, and lowest at Banyuls and Saint-Nazaire. Most genera found at Toulon and Banyuls were shared. With the regions of 18S rDNA, some nematodes such as the genera Pellioditis, Prochaetosoma and Dracograllus, constituted a major exclusive group in Banyuls while the Florideophyceae group was exclusive in Saint-Nazaire, e.g., the genera Heterothamnion, Bonnemaisonia, and Asparagopsis. Moreover, only two genera were unique in the COI dataset from Saint-Nazaire, Electra (Bryozoa) and Platynereis (Annelida). In Toulon, more diverse groups were found such as Bacillariophyta, Phaeophyceae, Arthropoda and Bryozoa, with the last two being the most abundant groups. Only a small part of genera remained unassigned within the 18S rDNA dataset. For COI, however, a large proportion of sequences remained unassigned, especially for the Mediterranean sites, Banyuls and Toulon. The proportions of ASVs assigned to small metazoans were notably higher with 18S rDNA than with COI (annelids: 23 ± 9%, nematodes: 18 ± 7%). Arthropods were abundant in all localities, especially in Saint-Nazaire which included nearly 62% of the sequences for 18S rDNA and 94% for COI data, exclusively represented by the genus Jassa. In the Banyuls samples, annelids and cnidarian classes were more identified in the biofouling communities whereas Phaeophyceae and Bryozoa were more detected at Toulon. Finally, green algae of the Ulvophyceae class, including the genus Ulva, were exclusively found in Saint-Nazaire.
Discussion
DNA metabarcoding of environmental samples is used to reveal the biodiversity associated with a wide variety of habitats and sample types in the marine environment. However, the widespread and routine implementation of this method is still highly dependent on reliable and cost-effective standardization, especially for biomonitoring, bioindication and ecological survey in general. The present study adds to the increasing number of research using metabarcoding to improve the characterization and identification of the diversity of marine eukaryotic communities. Indeed, there is currently a lack of standard methodology for an overall characterization of the diversified eukaryotic communities, particularly for marine biofilms and biofouling. In this study, we determined the DNA extraction method that recovers the most diversity and how the use of six markers (five regions of the 18S rRNA gene and one of the COI gene) influenced the representation of eukaryotic biofouling community structure and composition, taking into consideration the spatial variability across samples from Atlantic and Mediterranean sites.
DNA extraction methods showed similar richness but different community structures
The recovery of DNA from marine eukaryote communities represents a critical first step in molecular approaches for the assessment of biodiversity (Walden et al., 2017; Liu et al., 2019). Several DNA extraction kits, as well as non-commercial techniques, are available on the market. Commercial DNA-extraction kits have been chosen based on: (i) our experience on marine biofilms, (ii) their possibility to extract larger biomass, and (iii) one kit without column purification step. Nevertheless, our results revealed that the four DNA extraction methods we selected in this study could reliably detect almost all eukaryotic genera from biofouling at Toulon (99% of sequence reads), but PB and PMS kits showed higher performances compared with the extraction methods without purification step (GGE) and the kit with an additional grinding step (GPB). In addition, GGE and GPB lead to a significantly lower similarity between replicates compared to non-grinding methods, resulting in lower and less reliable reproducibility of results. Commonly, the commercial kits were used for marine sediments or biofilms (Briand et al., 2018; Ramírez et al., 2018). It has been demonstrated that kit-based extractions are preferable as they suffer less from technical variation, are quicker and gave a higher DNA quality, mainly due to the fact that the use of pre-made buffers and column purifications likely increase extraction quality (Carugati et al., 2015). These observations are consistent with our results showing higher DNA yield and faster preparation time with the kit-based extractions (Table S3). Commercial kits generally use small sample amounts, ranging from 0.05 g to 1 g, which could decrease communities representativeness (Ranjard et al., 2003). However, in our study, the PowerMaxSoil kit, which is widely used in eDNA studies, and is designed to allow extraction from up to 10 g of sample (Zinger et al., 2016; Pansu et al., 2021), did not show higher richness, nor diversity.
Our results also demonstrated that DNA extraction methods with additional grinding, i.e., the implementation of a supplementary beat step, gave the lowest alpha diversity. This result was counterintuitive and did not verify our hypothesis that the supplementary grinding step would improve the eukaryote DNA extraction. Cell lysis based on bead beating methods is considered to be more suited for the identification of micro-eukaryotes, such as diatoms and thecate dinoflagellates, as they possess fortified and resilient cell walls (Yuan et al., 2015). In our case, only brown algae taxa were better extracted following grinding. Our observations confirmed those of Hermans et al. (2018), who showed that an excessive amount of mechanical treatment is very likely to fragment DNA by the strong shear force produced by high-speed movement of the beads and thus decreases genetic material quality for further analyses. Finally, although the GE method resulted in the highest amounts of DNA and was the least expensive across the four extraction methods used in our study, it was also the least reproducible between replicates (Table S3). Vasselon et al. (2017), who extracted DNA from freshwater biofilms using five different extraction methods, including GenElute, has demonstrated that this protocol led to the highest DNA concentration, but with significant higher PCR inhibition. In conclusion, the use of the two kit methods without additional grinding steps appeared to be the most suitable extraction methods for studies dealing with biofouling eukaryotic community.
18S and COI are complementary but differences in taxonomic identification reflect current gaps in assignment databases
Several studies have highlighted the difficulties encountered to elucidate the biodiversity of marine eukaryotes as a major issue is the markers choice. (Drummond et al., 2015; Valentini et al., 2016; Clarke et al., 2017; Alberdi et al., 2018; Wangensteen et al., 2018). Consistent with the latter, our results showed that each primer recovered a distinct biofouling community with some taxa being associated with a given primer. Moreover, the COI analysis yielded a high number of ASVs assigned (≈ 400 ASVs) compared to some regions of 18S rDNA. A similar result has been reported by Wangensteen et al. (2018) who investigated the suitability of the 18S and COI markers to detect marine hard-bottom communities. Primer specific detection is probably due to the much lower variability of the 18S gene, which underestimates the actual number of taxa (Hadziavdic et al., 2014). A second major difference was found in the taxonomic assignment performance. Among affiliations with COI, a larger discrepancy between the amounts of unassigned ASVs from BOLD and from MIDORI databases, even at high-level taxa, and with more unassigned ASVs from BOLD dataset, was observed. While leaving out ASVs that could not be assigned to a eukaryotic kingdom or lower, a higher proportion of genera was found unassigned with COI. Conversely, 18S rDNA marker, irrespective of the region targeted, recovered 47 eukaryotic classes (among which 12 were metazoans) while COI recovered only 8 and 14 classes with BOLD and MIDORI databases, respectively. Therefore, both markers resulted in different taxonomic profiles. Although the BOLD database is based on COI barcodes and currently contains over 5 million sequences from over 5 million different species (Zhao et al., 2021), only 9% were assigned of read sequences at species and genus level while 36% read sequences were recovered with the MIDORI database, which is specific to marine taxa. For the MIDORI database, there were 335,177 sequences classified into 29 phyla representing 47,113 species whereas the BOLD database was built with 2,425,004 sequences into 6 phyla representing 190,318 species. Despite the high number of sequences, the high proportion of unassigned sequences highlights significant gaps in the reference databases for marine biofoulers. Our results were in line with a previous study on marine biofouling showing that almost all ASVs remained unassigned when using the BOLD database (Ammon et al., 2018a). This can also be explained by the high intraspecific variability and the high substitution rates within the COI gene (Djurhuus et al., 2018). In addition, taxa identified by MIDORI were exclusively assigned to marine organisms, so excluding terrestrial groups such as Diplopoda or Amphibia. Although we did find that the COI region allowed to identify the metazoans diversity with BOLD database, we observed a high proportion of organisms unlikely to be present in a marine sample, including terrestrial metazoans like organisms belonging to the Insecta and Arachnida classes. Due to the more conservative nature of 18S rDNA, it is possible to identify a sequence at a lower taxonomic rank as soon as a related sequence is present in the reference database, even if it is from a distant relative. Conversely, with its greater variability, identification with the COI marker requires a closely related sequence to match the sequences present in the reference database. Moreover, the degeneration of the COI primer sets may partly explain the production of non-targeted sequences which correspond to taxa in the database. This problem has been raised by Horton et al. (2017), who demonstrated the lack of COI region primers specificity to identify metazoans from soil samples. Berry et al. (2015) have identified a similar issue with COI primers, which failed to detect most mollusk taxa in the stomachs of several Australian fish species. Nevertheless, such an issue could also be due to a lower number of marine sequences in the database. Finally, COI primers have considerable potential because the rate of evolution of the COI gene is much faster than for the 18S rRNA gene, usually facilitating the identification at the species level (Hebert et al., 2003). In this sense, we showed that the COI gene can recover more ASVs with a large number of them unidentified but with reliable assignment at low taxonomic levels while the 18S rDNA gene allowed to assign more ASVs but poorly identified at the species level because several taxa can share the same sequence. Similar conclusions were observed to detect the NIS in biofouling communities, and increasing evidence showed that the use of two genes provides a more complete view of diversity and identification of broad marine eukaryote taxa (Borrell et al., 2017; Atienza et al., 2020; Rey et al., 2020).
Community structure and composition varied at low taxonomic ranks depending on 18S rDNA primers pairs used
All 18S rDNA hypervariable regions used recovered a wide range of eukaryotic taxa (about 40%), including microeukaryotes among Stramenopila, Alveolata, and Rhizaria. The different regions of this gene have commonly been used for the description of diversity due to their representation in all eukaryotes and their strong conservation (Ki, 2012; Choi and Park, 2020). Particularly, the V4, V9 and V1-V2 regions are the most targeted regions in marine diversity surveys (Dunthorn et al., 2012; Leray and Knowlton, 2016; Salonen et al., 2019). Some genera like Watersipora (Bryozoa), Harpacticus (Arthropoda) and Neochromadora (Nematoda) were identified as being dominant. These groups have been the most encountered in marine fouling, suggesting that most of 18S rDNA gene regions were able to provide a relatively similar overview of the main eukaryotic groups (Zaiko et al., 2016; Briand et al., 2018; Kettner et al., 2019). However, the choice of the targeted region has a potential influence on the taxonomic composition particularly at genera or species levels. For instance, the two V4 regions were less effective for the identification of Phaeophyceae and Bacillariophyta classes (notably the V4UNI primers). These results were consistent with those of Stoeck et al. (2010) who showed, using pyrosequencing 454, that part of the V4 region recovered less diversity at higher taxonomic rank than the V9 region, notably for ciliates and dinoflagellates. Furthermore, these authors have shown that V4UNI primers have not been successful at detecting all Ochrophyta groups (including Phaeophyceae and Bacillariophyta). More recently, Briand et al. (2018) used the Illumina sequencing technologies on biofouling samples and confirmed this observation, which suggested that the V4UNI primers are not suitable for targeting these major groups in marine biofouling communities. Otherwise, the V4 region was particularly useful for identifying genera among the Nematoda and Florideophyceae. The sequence variability and longer read length of V4, relative to other 18S rDNA regions, may have contributed to the detection of more ASVs in these two groups. Indeed, the main advantage of targeting V4 rather than shorter regions may allow for increased phylogenetic and taxonomic resolutions (Dunthorn et al., 2014; Hu et al., 2015). By contrast, a previous work comparing results between V4 and the short V9 region on coastal phytoplankton communities has demonstrated opposite conclusions (Tragin et al., 2018). For example, more genera of red algae (Florideophyceae and Bangiophyceae) were found with V9 (Tragin et al., 2018).
Considering macroalgae, V1-V2, V7, and V9 primers allowed to amplify different genera of Phaeophyceae. V1-V2 identified the Ectocarpus genus whereas V7 and V9 recovered the genera Pylaiella and Adenocystis, respectively. These results suggested that the different primers have the ability to better detect different brown algae subgroups. Furthermore, V1-V2 was better suited to amplify some groups of Nematoda. In the literature, this region has also already been used in metabarcoding studies of zooplankton and meiofauna (Lindeque et al., 2013; Mohrbeck et al., 2015). Nonetheless, Pochon et al. (2015) have shown that this region provided an insufficient taxonomic resolution at the species level to identify eukaryotes in biofilm communities.
Small amplicon sizes, as V7 and V9 primers, offer less length heterogeneity allowing for a much larger sequence depth at lower costs and maximize richness estimates (Pitsch et al., 2019). Furthermore, the short DNA fragments (≈ ≤ 400pb) have an increased probability of recovering small DNA or degraded DNA. Hadziavdic et al. (2014) demonstrated that shorter regions are more easily amplified than longer ones and may be sufficiently specific for large eukaryote groups. Nevertheless, short length potentially providing low taxonomic resolutions (until genus or species) and may limit phylogenetic information (Geisen et al., 2019). V9 showed good coverage for diatoms, dinoflagellates, and ciliates. This is consistent with results of the largest environmental sequencing study available to date (Tara expedition) on microbial eukaryote communities (Vargas et al., 2015). Despite the low number of studies using V7 region in metabarcoding approach, it has been shown that V7 was a good marker in terms of coverage and taxonomic resolution for microbial eukaryote communities (Capo et al., 2016; Debroas et al., 2017). In this study, V7 showed better performance recovering a higher proportion of genera including sequences from multicellular organisms and seemed to have the ability to detect different taxonomic groups more widely.
Remarkably, distance matrices based on the presence/absence of ASVs, and genera obtained using the five primers targeting the 18S rDNA gene were highly correlated (Mantel tests), indicating similar structural patterns regardless of the 18S rDNA gene regions used. While the NMDS results showed a clear separation between each primers pair, revealing strong differences in taxonomic composition. Furthermore, the core community between primers accounted for 95% and 82% for class and family levels, respectively, only 9% of genera (corresponding to 30% of reads) were shared between communities. This effect may be explained by a high number of unassigned ASVs that could be common to communities obtained with different primers.
Site specific biofouling communities identified irrespective of the 18S rDNA and COI markers
Currently, the assessment of marine eukaryote biodiversity using a multigenic approach is mainly based on a single sampling site and may underestimate methodological performance in terms of taxonomic coverage and resolution (Zhan et al., 2013; Wangensteen et al., 2018). To gain a comprehensive understanding of the influence of the primer’s choice on biofouling diversity, it is necessary to increase the diversity range using several locations exhibiting dissimilar environmental conditions. Thus, in this study, three immersion sites representing coastal and offshore seawaters in both the Mediterranean Sea and the Atlantic Ocean were selected and the six primers were used to assess biofouling diversity and community composition at each site. Due to logistical problems encountered during sample collection at the Saint Nazaire and Banyuls offshore sites (very dynamic environment, with strong currents and high meteorological variability), it was difficult to obtain identical immersion times for the Saint Nazaire and Banyuls samples. In addition, caution must be taken due to the lack of replicate. Nevertheless, it is remarkable to note that the effect of primers is lower than environmental conditions leading to spatial variability. This spatial variation in community structure that we observed can probably be explained by variation in environmental parameters from one site to another. Indeed, it remains unclear whether variations in community structure and composition were more influenced by anthropic impact (offshore vs harbor environments) more than larger geographic differences between Atlantic and Mediterranean seawater conditions. Environmental variables (e.g. temperature, wave exposure, depth…) have been identified as significant drivers of temporal and spatial changes in biofouling assemblages (Berntsson and Jonsson, 2003; Briand et al., 2017, Quillien et al., 2019). Toulon and Banyuls showed similar biofouling community structure with a dominance of Nematoda, Arthropoda, and Bryozoa, but with a greater number of Ochrophyta genera in Toulon. Conversely, Chlorophyta as well as arthropods, especially the Maxillopoda group, dominated the biofouling communities formed at Saint-Nazaire. Similar results were also reported in eukaryotic assemblages from biofouling by Briand et al. (2018). They compared the bay of Toulon with Lorient, not far from Saint-Nazaire on the Atlantic coast, the main difference being that Saint-Nazaire is an offshore site. A dominance of hydrozoans, Chlorophyceae, and Ciliophorans has been shown in Lorient while Ochrophyta and Nematoda dominated less diverse assemblages in Toulon. Interestingly, the differences in composition were less important between Lorient and Saint-Nazaire, Florideophyceae being the dominant group in this last site. In addition, a recent study by Kettner et al. (2019) has shown that locations, i.e., local environmental factors, influenced the formation of eukaryotic assemblages on microplastics in brackish ecosystems. In this case, the salinity gradient along the coast of the Baltic Sea explained their assemblages. It was also noticeable that biofouling at the two offshore sites showed a lower richness than in the Toulon Bay, a nutrient rich and metal-polluted environment (Briand et al., 2017; Catão et al., 2019). A similar trend has been reported in a recent study by Lema et al. (2019) with bacterial biofilms, which showed lower diversity at offshore sites compared to coastal ones. It is clear that further studies are needed to confirm the importance of distance to shore on biofouling community diversity.
Conclusion
Based on the comparative analysis of diversity and taxa composition using different metabarcoding approaches across contrasted marine sites, this study provided methodological evidence for the study of the diversity and community structure of highly complex marine biofouling communities. Overall, the extraction methods managed to recover the majority of the eukaryotic community but did not offer the same reliability. Then, these results showed as for other ecosystem compartments, that the COI and 18S rDNA markers each detected a distinct set of taxa present in marine biofouling assemblages, with different taxonomic resolution. We also showed that primer choice among 18S rDNA regions has limited impact on beta-diversity, especially at large scale, although influences on the depiction of biofouling community composition could be noticed. However, it is important to note that regardless of the marker or the assignment database, spatial variation of biofouling community structure can be assessed using a metabarcoding approach which shows specific communities for each locality. Future investigations should include a multigene approach to obtain the more complete coverage of fouling diversity.
Data availability statement
The datasets presented in this study can be found in online repositories. The names of the repository/repositories and accession number(s) can be found below: https://www.ncbi.nlm.nih.gov/, PRJNA777059.
Author contributions
AP and J-FB designed and performed the research, analyzed data, and wrote the paper. J-FB designed and supervised the research, reviewed, and edited the paper. NQ reviewed and edited the paper, and GC edited the publication. All authors contributed to the article and approved the submitted version.
Funding
This work benefited from France Energies Marines and State financing managed by the National Research Agency under the Investments for the Future program bearing the reference ANR-10-IED-0006-32 (ABIOP+ project, 2019-2022) and the reference ANR-10-IEED-0006-21 (ABIOP project, 2017-2019).
Acknowledgments
The authors would like to thank Marine Reynaud (Ecole Centrale de Nantes, SEMREV), Franck Schoefs (University of Nantes) and the divers from the Banyuls research station for their help with sampling collection.
Conflict of interest
The authors declare that the research was conducted in the absence of any commercial or financial relationships that could be construed as a potential conflict of interest.
Publisher’s note
All claims expressed in this article are solely those of the authors and do not necessarily represent those of their affiliated organizations, or those of the publisher, the editors and the reviewers. Any product that may be evaluated in this article, or claim that may be made by its manufacturer, is not guaranteed or endorsed by the publisher.
Supplementary material
The Supplementary Material for this article can be found online at: https://www.frontiersin.org/articles/10.3389/fmars.2022.971939/full#supplementary-material
References
Alberdi A., Aizpurua O., Gilbert M. T. P., Bohmann K. (2018). Scrutinizing key steps for reliable metabarcoding of environmental samples. Methods Ecol. Evol. 9 (1), 134−147. doi: 10.1111/2041-210X.12849
Amaral-Zettler L. A., McCliment E. A., Ducklow H. W., Huse S. M. (2009). A method for studying protistan diversity using massively parallel sequencing of V9 hypervariable regions of small-subunit ribosomal RNA genes. PloS One 4 (7), e6372. doi: 10.1371/journal.pone.0006372
Ammon U., Wood S. A., Laroche O., Zaiko A., Tait L., Lavery S., et al. (2018a). The impact of artificial surfaces on marine bacterial and eukaryotic biofouling assemblages: A high-throughput sequencing analysis. Mar. Environ. Res. 133, 57−66. doi: 10.1016/j.marenvres.2017.12.003
Ammon U., Wood S. A., Laroche O., Zaiko A., Tait L., Lavery S., et al. (2018b). Combining morpho-taxonomy and metabarcoding enhances the detection of non-indigenous marine pests in biofouling communities. Sci. Rep. 8 (1), 16290. doi: 10.1038/s41598-018-34541-1
Anderson M. J., Underwood A. J. (1994). Effects of substratum on the recruitment and development of an intertidal estuarine fouling assemblage. J. Exp. Mar. Biol. Ecol. 184 (2), 217−236. doi: 10.1016/0022-0981(94)90006-X
Andrews S. (2010) Babraham bioinformatics–FastQC a quality control tool for high throughput sequence data. Available at: https://www.bioinformatics.babraham.ac.uk/projects/fastqc/.
Atienza S., Guardiola M., Præbel K., Antich A., Turon X., Wangensteen O. S. (2020). DNA Metabarcoding of deep-sea sediment communities using COI: community assessment, spatio-temporal patterns and comparison with 18S rDNA. Diversity 12 (4), 123. doi: 10.3390/d12040123
Aylagas E., Mendibil I., Borja Á., Rodríguez-Ezpeleta N. (2016). Marine sediment sample pre-processing for macroinvertebrates metabarcoding: mechanical enrichment and homogenization. Front. Mar. Sci. 3. doi: 10.3389/fmars.2016.00203
Azevedo J., Antunes J. T., Machado A. M., Vasconcelos V., Leão P. N., Froufe E. (2020). Monitoring of biofouling communities in a Portuguese port using a combined morphological and metabarcoding approach. Sci. Rep. 10 (1), 13461. doi: 10.1038/s41598-020-70307-4
Berntsson K. M., Jonsson P. R. (2003). Temporal and spatial patterns in recruitment and succession of a temperate marine fouling assemblage: A comparison of static panels and boat hulls during the boating season. Biofouling 19 (3), 187−195. doi: 10.1080/08927014.2003.10382981
Berry O., Bulman C., Bunce M., Coghlan M., Murray D. C., Ward R. D. (2015). Comparison of morphological and DNA metabarcoding analyses of diets in exploited marine fishes. Mar. Ecol. Prog. Ser. 540, 167−181. doi: 10.3354/meps11524
Bokulich N. A., Subramanian S., Faith J. J., Gevers D., Gordon J. I., Knight R., et al. (2013). Quality-filtering vastly improves diversity estimates from illumina amplicon sequencing. Nat. Methods 10 (1), 57−59. doi: 10.1038/nmeth.2276
Borrell Y. J., Miralles L., Huu H. D., Mohammed-Geba K., Garcia-Vazquez E. (2017). DNA In a bottle–rapid metabarcoding survey for early alerts of invasive species in ports. PloS One 12 (9), e0183347. doi: 10.1371/journal.pone.0183347
Briand J.-F., Barani A., Garnier C., Réhel K., Urvois F., LePoupon C., et al. (2017). Spatio-temporal variations of marine biofilm communities colonizing artificial substrata including antifouling coatings in contrasted french coastal environments. Microbial. Ecol. 74 (3), 585−598. doi: 10.1007/s00248-017-0966-2
Briand J.-F., Pochon X., Wood S. A., Bressy C., Garnier C., Réhel K., et al. (2018). Metabarcoding and metabolomics offer complementarity in deciphering marine eukaryotic biofouling community shifts. Biofouling 34 (6), 657−672. doi: 10.1080/08927014.2018.1480757
Callahan B. J., McMurdie P. J., Rosen M. J., Han A. W., Johnson A. J. A., Holmes S. P. (2016). DADA2: High-resolution sample inference from illumina amplicon data. Nat. Methods 13 (7), 581−583. doi: 10.1038/nmeth.3869
Capo E., Debroas D., Arnaud F., Guillemot T., Bichet V., Millet L., et al. (2016). Long-term dynamics in microbial eukaryotes communities: A palaeolimnological view based on sedimentary DNA. Mol. Ecol. 25 (23), 5925−5943. doi: 10.1111/mec.13893
Carugati L., Corinaldesi C., Dell’Anno A., Danovaro R. (2015). Metagenetic tools for the census of marine meiofaunal biodiversity: An overview. Mar. Genomics 24, 11−20. doi: 10.1016/j.margen.2015.04.010
Caruso G. (2020). Microbial colonization in marine environments: Overview of current knowledge and emerging research topics. J. Mar. Sci. Eng. 8 (2), 78. doi: 10.3390/jmse8020078
Catao E. C. P., Gallois N., Fay F., Misson B., Briand J.-F. (2021). Metal resistance genes enrichment in marine biofilm communities selected by biocide-containing surfaces in temperate and tropical coastal environments. Environmental pollution 268, 115835. doi: 10.1016/j.envpol.2020.115835
Catão E. C. P., Pollet T., Misson B., Garnier C., Ghiglione J.-F., Barry-Martinet R., et al. (2019). Shear stress as a major driver of marine biofilm communities in the NW Mediterranean Sea. Front. Microbiol 10. doi: 10.3389/fmicb.2019.01768
Choi J., Park J. S. (2020). Comparative analyses of the V4 and V9 regions of 18S rDNA for the extant eukaryotic community using the illumina platform. Sci. Rep. 10 (1), 6519. doi: 10.1038/s41598-020-63561-z
Chung H. C., Lee O. O., Huang Y.-L., Mok S. Y., Kolter R., Qian P.-Y. (2010). Bacterial community succession and chemical profiles of subtidal biofilms in relation to larval settlement of the polychaete hydroides elegans. ISME J. 4 (6), 817−828. doi: 10.1038/ismej.2009.157
Clarke L. J., Beard J. M., Swadling K. M., Deagle B. E. (2017). Effect of marker choice and thermal cycling protocol on zooplankton DNA metabarcoding studies. Ecol. Evol. 7 (3), 873−883. doi: 10.1002/ece3.2667
Cordier T., Frontalini F., Cermakova K., Apothéloz-Perret-Gentil L., Treglia M., Scantamburlo E., et al. (2019). Multi-marker eDNA metabarcoding survey to assess the environmental impact of three offshore gas platforms in the north Adriatic Sea (Italy). Mar. Environ. Res. 146, 24−34. doi: 10.1016/j.marenvres.2018.12.009
Dang H., Lovell C. R. (2016). Microbial surface colonization and biofilm development in marine environments. Microbiol. Mol. Biol. Rev. 80 (1), 91−138. doi: 10.1128/MMBR.00037-15
Davey M. E., O’toole G. A. (2000). Microbial biofilms: From ecology to molecular genetics. Microbiol. Mol. Biol. Rev. 64 (4), 847−867. doi: 10.1128/MMBR.64.4.847-867.2000
Debroas D., Mone A., Ter Halle A. (2017). Plastics in the north Atlantic garbage patch: A boat-microbe for hitchhikers and plastic degraders. Sci. Total Environ. 599−600, 1222−1232. doi: 10.1016/j.scitotenv.2017.05.059
Djurhuus A., Pitz K., Sawaya N. A., Rojas-Márquez J., Michaud B., Montes E., et al. (2018). Evaluation of marine zooplankton community structure through environmental DNA metabarcoding. Limnol. Oceanogr.: Methods 16 (4), 209−221. doi: 10.1002/lom3.10237
Drummond A. J., Newcomb R. D., Buckley T. R., Xie D., Dopheide A., Potter B. C., et al. (2015). Evaluating a multigene environmental DNA approach for biodiversity assessment. GigaScience 4, 46. doi: 10.1186/s13742-015-0086-1
Duarte S., Vieira P. E., Lavrador A. S., Costa F. O. (2021). Status and prospects of marine NIS detection and monitoring through (e)DNA metabarcoding. Sci. Total Environ. 751, 141729. doi: 10.1016/j.scitotenv.2020.141729
Dunthorn M., Klier J., Bunge J., Stoeck T. (2012). Comparing the hyper-variable V4 and V9 regions of the small subunit rDNA for assessment of ciliate environmental diversity. J. Eukaryotic Microbiol. 59 (2), 185−187. doi: 10.1111/j.1550-7408.2011.00602.x
Dunthorn M., Otto J., Berger S. A., Stamatakis A., Mahé F., Romac S., et al. (2014). Placing environmental next-generation sequencing amplicons from microbial eukaryotes into a phylogenetic context. Mol. Biol. Evol. 31 (4), 993−1009. doi: 10.1093/molbev/msu055
Elbrecht V., Leese F. (2015). Can DNA-based ecosystem assessments quantify species abundance? testing primer bias and biomass–sequence relationships with an innovative metabarcoding protocol. PloS One 10 (7), e0130324. doi: 10.1371/journal.pone.0130324
Escudié F., Auer L., Bernard M., Mariadassou M., Cauquil L., Vidal K., et al. (2018). FROGS: Find, rapidly, OTUs with galaxy solution. Bioinformatics 34 (8), 1287−1294. doi: 10.1093/bioinformatics/btx791
Flemming H.-C., Wingender J. (2010). The biofilm matrix. Nat. Rev. Microbiol. 8 (9), 623−633. doi: 10.1038/nrmicro2415
Fonseca V. G., Carvalho G. R., Sung W., Johnson H. F., Power D. M., Neill S. P., et al. (2010). Second-generation environmental sequencing unmasks marine metazoan biodiversity. Nat. Commun. 1 (7), 98. doi: 10.1038/ncomms1095
Geisen S., Vaulot D., Mahé F., Lara E., de Vargas C., Bass D. (2019). A user guide to environmental protistology: Primers, metabarcoding, sequencing, and analyses. BioRxiv. 850610. doi: 10.1101/850610
Giebner H., Langen K., Bourlat S. J., Kukowka S., Mayer C., Astrin J. J., et al. (2020). Comparing diversity levels in environmental samples: DNA sequence capture and metabarcoding approaches using 18S and COI genes. Mol. Ecol. Resour. 20 (5), 1333−1345. doi: 10.1111/1755-0998.13201
Guillou L., Bachar D., Audic S., Bass D., Berney C., Bittner L., et al. (2013). The protist ribosomal reference database (PR2): A catalog of unicellular eukaryote small sub-unit rRNA sequences with curated taxonomy. Nucleic Acids Res. 41 (Database issue), D597–D604. doi: 10.1093/nar/gks1160
Hadfield M. G. (2011). Biofilms and marine invertebrate larvae: What bacteria produce that larvae use to choose settlement sites. Annu. Rev. Mar. Sci. 3 (1), 453−470. doi: 10.1146/annurev-marine-120709-142753
Hadziavdic K., Lekang K., Lanzen A., Jonassen I., Thompson E. M., Troedsson C. (2014). Characterization of the 18S rRNA gene for designing universal eukaryote specific primers. PloS One 9 (2), e87624. doi: 10.1371/journal.pone.0087624
Hebert P. D. N., Cywinska A., Ball S. L., deWaard J. R. (2003). Biological identifications through DNA barcodes. Proc. R. Soc. London. Ser. B: Biol. Sci 270(1512), 313–321. doi: 10.1098/rspb.2002.2218
Hermans S. M., Buckley H. L., Lear G. (2018). Optimal extraction methods for the simultaneous analysis of DNA from diverse organisms and sample types. Mol. Ecol. Resour. 18 (3), 557−569. doi: 10.1111/1755-0998.12762
Horton D. J., Kershner M. W., Blackwood C. B. (2017). Suitability of PCR primers for characterizing invertebrate communities from soil and leaf litter targeting metazoan 18S ribosomal or cytochrome oxidase I (COI) genes. Eur. J. Soil Biol. 80, 43−48. doi: 10.1016/j.ejsobi.2017.04.003
Hu S. K., Liu Z., Lie A. A. Y., Countway P. D., Kim D. Y., Jones A. C., et al. (2015). Estimating protistan diversity using high-throughput sequencing. J. Eukaryotic Microbiol. 62 (5), 688−693. doi: 10.1111/jeu.12217
Jeunen G.-J., Knapp M., Spencer H. G., Taylor H. R., Lamare M. D., Stat M., et al. (2019). Species-level biodiversity assessment using marine environmental DNA metabarcoding requires protocol optimization and standardization. Ecol. Evol. 9 (3), 1323−1335. doi: 10.1002/ece3.4843
Kettner M. T., Oberbeckmann S., Labrenz M., Grossart H.-P. (2019). The eukaryotic life on microplastics in brackish ecosystems. Front. Microbiol. 10. doi: 10.3389/fmicb.2019.00538
Ki J.-S. (2012). Hypervariable regions (V1–V9) of the dinoflagellate 18S rRNA using a large dataset for marker considerations. J. Appl. Phycol. 24 (5), 1035−1043. doi: 10.1007/s10811-011-9730-z
Lamb P. D., Hunter E., Pinnegar J. K., Creer S., Davies R. G., Taylor M. I. (2019). How quantitative is metabarcoding: A meta-analytical approach. Mol. Ecol. 28 (2), 420−430. doi: 10.1111/mec.14920
Lema K. A., Constancias F., Rice S. A., Hadfield M. G. (2019). High bacterial diversity in nearshore and oceanic biofilms and their influence on larval settlement by hydroides elegans (Polychaeta). Environ. Microbiol. 21 (9), 3472−3488. doi: 10.1111/1462-2920.14697
Leray M., Knowlton N. (2016). Censusing marine eukaryotic diversity in the twenty-first century. Philos. Trans. R. Soc. B: Biol. Sci. 371 (1702), 20150331. doi: 10.1098/rstb.2015.0331
Leray M., Yang J. Y., Meyer C. P., Mills S. C., Agudelo N., Ranwez V., et al. (2013). A new versatile primer set targeting a short fragment of the mitochondrial COI region for metabarcoding metazoan diversity: Application for characterizing coral reef fish gut contents. Front. Zool. 10 (1), 34. doi: 10.1186/1742-9994-10-34
Lindeque P. K., Parry H. E., Harmer R. A., Somerfield P. J., Atkinson A. (2013). Next generation sequencing reveals the hidden diversity of zooplankton assemblages. PloS One 8 (11), e81327. doi: 10.1371/journal.pone.0081327
Liu M., Xue Y., Yang J. (2019). Rare plankton subcommunities are far more affected by DNA extraction kits than abundant plankton. Front. Microbiol. 10. doi: 10.3389/fmicb.2019.00454
Marquina D., Esparza-Salas R., Roslin T., Ronquist F. (2019). Establishing arthropod community composition using metabarcoding: surprising inconsistencies between soil samples and preservative ethanol and homogenate from malaise trap catches. Mol. Ecol. Resour. 19 (6), 1516−1530. doi: 10.1111/1755-0998.13071
Marszalek D. S., Gerchakov S. M., Udey L. R. (1979). Influence of substrate composition on marine microfouling. Appl. Environ. Microbiol. 38 (5), 987−995. doi: 10.1128/aem.38.5.987-995.1979
Martin M. (2011). Cutadapt removes adapter sequences from high-throughput sequencing reads. EMBnet.Journal 17 (1), 10−12. doi: 10.14806/ej.17.1.200
Mohrbeck I., Raupach M. J., Arbizu P. M., Knebelsberger T., Laakmann S. (2015). High-throughput sequencing–the key to rapid biodiversity assessment of marine metazoa? PloS One 10 (10), e0140342. doi: 10.1371/journal.pone.0140342
Obst M., Exter K., Allcock A. L., Arvanitidis C., Axberg A., Bustamante M., et al. (2020). A marine biodiversity observation network for genetic monitoring of hard-bottom communities (ARMS-MBON). Front. Mar. Sci. 7. doi: 10.3389/fmars.2020.572680
Pansu J., Chapman M. B., Hose G. C., Chariton A. A. (2021). Comparison of an extracellular v. total DNA extraction approach for environmental DNA-based monitoring of sediment biota. Mar. Freshw. Res 1–14. doi: 10.1071/MF20269
Pitsch G., Bruni E. P., Forster D., Qu Z., Sonntag B., Stoeck T., et al. (2019). Seasonality of planktonic freshwater ciliates: are analyses based on V9 regions of the 18S rRNA gene correlated with morphospecies counts? Front. Microbiol. 10. doi: 10.3389/fmicb.2019.00248
Pochon X., Bott N. J., Smith K. F., Wood S. A. (2013). Evaluating detection limits of next-generation sequencing for the surveillance and monitoring of international marine pests. PloS One 8 (9), e73935. doi: 10.1371/journal.pone.0073935
Pochon X., Zaiko A., Hopkins G. A., Banks J. C., Wood S. A. (2015). Early detection of eukaryotic communities from marine biofilm using high-throughput sequencing: An assessment of different sampling devices. Biofouling 31 (3), 241−251. doi: 10.1080/08927014.2015.1028923
Pollet T., Berdjeb L., Garnier C., Durrieu G., Le Poupon C., Misson B., et al. (2018). Prokaryotic community successions and interactions in marine biofilms: The key role of flavobacteriia. FEMS Microbiol. Ecol. 94 (6), 1–13. doi: 10.1093/femsec/fiy083
Pompanon F., Samadi S. (2015). Next generation sequencing for characterizing biodiversity: Promises and challenges. Genetica 143 (2), 133−138. doi: 10.1007/s10709-015-9816-7
Quillien N., Lejart M., Damblanc G. (2019). Bibliographical atlas of biofouling along the 746 French coasts in the context of offshore renewable energyFrance Energies Marines 747, 70.
Ramírez G. A., Graham D., D’Hondt S. (2018). Influence of commercial DNA extraction kit choice on prokaryotic community metrics in marine sediment. Limnol. Oceanogr.: Methods 16 (9), 525−536. doi: 10.1002/lom3.10264
Ranjard L., Lejon D. P. H., Mougel C., Schehrer L., Merdinoglu D., Chaussod R. (2003). Sampling strategy in molecular microbial ecology: Influence of soil sample size on DNA fingerprinting analysis of fungal and bacterial communities. Environ. Microbiol. 5 (11), 1111−1120. doi: 10.1046/j.1462-2920.2003.00521.x
Ratnasingham S., Hebert P. D. N. (2007). Bold: The barcode of life data system (http://www.barcodinglife.org). Mol. Ecol. Notes 7 (3), 355−364. doi: 10.1111/j.1471-8286.2007.01678.x
Rey A., Basurko O. C., Rodriguez-Ezpeleta N. (2020). Considerations for metabarcoding-based port biological baseline surveys aimed at marine nonindigenous species monitoring and risk assessments. Ecol. Evol. 10 (5), 2452−2465. doi: 10.1002/ece3.6071
Salonen I. S., Chronopoulou P.-M., Leskinen E., Koho K. A. (2019). Metabarcoding successfully tracks temporal changes in eukaryotic communities in coastal sediments. FEMS Microbiol. Ecol. 95 (1), 1–11. doi: 10.1093/femsec/fiy226
Schultz M. P., Bendick J. A., Holm E. R., Hertel W. M. (2011). Economic impact of biofouling on a naval surface ship. Biofouling 27 (1), 87−98. doi: 10.1080/08927014.2010.542809
Stoeck T., Bass D., Nebel M., Christen R., Jones M. D. M., Breiner H.-W., et al. (2010). Multiple marker parallel tag environmental DNA sequencing reveals a highly complex eukaryotic community in marine anoxic water. Mol. Ecol. 19 Suppl 1, 21−31. doi: 10.1111/j.1365-294X.2009.04480.x
Tanabe A. S., Nagai S., Hida K., Yasuike M., Fujiwara A., Nakamura Y., et al. (2016). Comparative study of the validity of three regions of the 18S-rRNA gene for massively parallel sequencing-based monitoring of the planktonic eukaryote community. Mol. Ecol. Resour. 16 (2), 402−414. doi: 10.1111/1755-0998.12459
Tang C. Q., Leasi F., Obertegger U., Kieneke A., Barraclough T. G., Fontaneto D. (2012). The widely used small subunit 18S rDNA molecule greatly underestimates true diversity in biodiversity surveys of the meiofauna. Proc. Natl. Acad. Sci. U.S.A. 109 (40), 16208−16212. doi: 10.1073/pnas.1209160109
Tragin M., Zingone A., Vaulot D. (2018). Comparison of coastal phytoplankton composition estimated from the V4 and V9 regions of the 18S rRNA gene with a focus on photosynthetic groups and especially chlorophyta. Environ. Microbiol. 20 (2), 506−520. doi: 10.1111/1462-2920.13952
Valentini A., Taberlet P., Miaud C., Civade R., Herder J., Thomsen P. F., et al. (2016). Next-generation monitoring of aquatic biodiversity using environmental DNA metabarcoding. Mol. Ecol. 25 (4), 929−942. doi: 10.1111/mec.13428
Van de Peer Y., De Rijk P., Wuyts J., Winkelmans T., De Wachter R. (2000). The European small subunit ribosomal RNA database. Nucleic Acids Res. 28 (1), 175−176. doi: 10.1093/nar/28.1.175
van der Loos L. M., Nijland R. (2021). Biases in bulk: DNA metabarcoding of marine communities and the methodology involved. Mol. Ecol. 30 (13), 3270−3288. doi: 10.1111/mec.15592
Vargas C., Audic S., Henry N., Decelle J., Mahé F., Logares R., et al. (2015). Eukaryotic plankton diversity in the sunlit ocean. Science 348 (6237), 1261605. doi: 10.1126/science.1261605
Vasselon V., Domaizon I., Rimet F., Kahlert M., Bouchez A. (2017). Application of high-throughput sequencing (HTS) metabarcoding to diatom biomonitoring: Do DNA extraction methods matter? Freshw. Sci. 36 (1), 162−177. doi: 10.1086/690649
Walden C., Carbonero F., Zhang W. (2017). Assessing impacts of DNA extraction methods on next generation sequencing of water and wastewater samples. J. Microbiol. Methods 141, 10−16. doi: 10.1016/j.mimet.2017.07.007
Wangensteen O. S., Palacín C., Guardiola M., Turon X. (2018). DNA Metabarcoding of littoral hard-bottom communities: High diversity and database gaps revealed by two molecular markers. PeerJ 6, e4705. doi: 10.7717/peerj.4705
Wang Q., Garrity G. M., Tiedje J. M., Cole J. R. (2007). Naïve bayesian classifier for rapid assignment of rRNA sequences into the new bacterial taxonomy. Appl. Environ. Microbiol. 73 (16), 5261−5267. doi: 10.1128/AEM.00062-07
WoRMS Editorial Board (2021). World Register of Marine Species. Available at: https://www.marinespecies.org at VLIZ. doi: 10.14284/170
Yuan J., Li M., Lin S. (2015). An improved DNA extraction method for efficient and quantitative recovery of phytoplankton diversity in natural assemblages. PloS One 10 (7), e0133060. doi: 10.1371/journal.pone.0133060
Zaiko A., Greenfield P., Abbott C., von Ammon U., Bilewitch J., Bunce M., et al. (2022). Towards reproducible metabarcoding data: Lessons from an international cross-laboratory experiment. Mol. Ecol. Resour. 22 (2), 519−538. doi: 10.1111/1755-0998.13485
Zaiko A., Schimanski K., Pochon X., Hopkins G. A., Goldstien S., Floerl O., et al. (2016). Metabarcoding improves detection of eukaryotes from early biofouling communities: Implications for pest monitoring and pathway management. Biofouling 32 (6), 671−684. doi: 10.1080/08927014.2016.1186165
Zhan A., Hulák M., Sylvester F., Huang X., Adebayo A. A., Abbott C. L., et al. (2013). High sensitivity of 454 pyrosequencing for detection of rare species in aquatic communities. Methods Ecol. Evol. 4 (6), 558−565. doi: 10.1111/2041-210X.12037
Zhao L., Zhang X., Xu M., Mao Y., Huang Y. (2021). DNA Metabarcoding of zooplankton communities: Species diversity and seasonal variation revealed by 18S rRNA and COI. PeerJ 9, e11057. doi: 10.7717/peerj.11057
Keywords: biofouling, marine eukaryote diversity, metabarcoding, database, spatial dissimilarity
Citation: Portas A, Quillien N, Culioli G and Briand J-F (2022) Eukaryotic diversity of marine biofouling from coastal to offshore areas. Front. Mar. Sci. 9:971939. doi: 10.3389/fmars.2022.971939
Received: 17 June 2022; Accepted: 15 September 2022;
Published: 06 October 2022.
Edited by:
Daniel Rittschof, Duke University, United StatesReviewed by:
Sandi Orlic, Rudjer Boskovic Institute, CroatiaSunny Jiang, University of California, Irvine, United States
Sergey Dobretsov, Sultan Qaboos University, Oman
Copyright © 2022 Portas, Quillien, Culioli and Briand. This is an open-access article distributed under the terms of the Creative Commons Attribution License (CC BY). The use, distribution or reproduction in other forums is permitted, provided the original author(s) and the copyright owner(s) are credited and that the original publication in this journal is cited, in accordance with accepted academic practice. No use, distribution or reproduction is permitted which does not comply with these terms.
*Correspondence: Jean-François Briand, YnJpYW5kQHVuaXYtdGxuLmZy