 Eneko Bachiller
 Maria Korta
 Maria Mateo
 Estanis Mugerza
 Lucia Zarauz†
- AZTI, Sustainable Fisheries Management, Basque Research and Technology Alliance (BRTA), Sukarrieta, Spain
Within the first attempt to assess marine recreational fisheries (MRF) along the coastal villages of the Basque Country (Eastern Cantabrian Sea), off-site surveys were carried out from 2015 to 2019 to estimate captures of the main targeted species by shore fishing, boat fishing and spearfishing. Phone calls got better response rates (>50%) than email questionnaires (<25%). Spearfishing population was smaller (1000 licenses, <2% of total MRF effort) and younger, whereas boat fishers (5000 licenses, 9% MRF effort) were generally older and more experienced. Shore fishing was the most extended MRF activity (50000 licenses, 90% of MRF effort), showing wider age and experience ranges. Boat fishing targeting albacore in summer was the main MRF activity interacting with regional commercial small-scale fishery. Squids were also important for both shore and boat fishing, followed by seabass, the main target species for shore anglers. Despite surveys were primarily designed to gather information about these three species, they also evidenced, moreover with clear underestimation bias, frequent captures of generally unassessed species, such as sargo-bream (Diplodus spp.), gilthead seabream (Sparus aurata), common dentex (Dentex dentex), red mullet (Mullus surmuletus) or scorpionfish (Scorpaena spp.). Fishers with more experience, as well as spearfishers in general, captured a wider diversity of species, but individual fishers were more specialized (i.e., showing less variation between trips). Our off-site survey assessment highlights the importance of incorporating multispecies sampling schemes to develop future MRF assessment criteria, within a context of an ecosystem approach that should also consider potential interactions with commercial small-scale fishery.
1 Introduction
Marine recreational fisheries (MRF) are defined as “fishing of aquatic animals (mainly fish) that do not constitute the individual´s primary resource to meet basic nutritional needs and are not generally sold or otherwise traded on export, domestic or black markets” (FAO, 2012). This activity is one of the most frequent leisure activities in coastal zones worldwide, and it involves large number of people and consequently high levels of fishing effort (Cowx and Arlinghaus, 2008; Hyder et al., 2017b; Hyder et al., 2020; Radford et al., 2018). In the case of Europe, participation has shown to be high, with significant social and economic benefits, but also has impacts on some fish stocks (Hyder et al., 2017b; Hyder et al., 2017a). Recent research has shown that in Europe there are around 8.7 million people engaged in MRF, fishing for almost 78 million days, and spending about €5.9 billion each year (Hyder et al., 2017b). This creates a total economic impact of €10.5 billion per year and supports almost 100,000 jobs across Europe (Hyder et al., 2017b). Recreational removals (kept fish plus post release mortality) can be significant for some species representing between 2-43% of the total catch (Radford et al., 2018) and recreational fishing also has environmental impacts (Lewin et al., 2019). The importance of proper management is covered under the Common Fisheries Policy (CFP) (EU, 2013) where it states that “recreational fisheries can have a significant impact on fish resources and Member States should, therefore, ensure that they are conducted in a manner that is compatible with the objectives of the CFP”.
However, knowledge of the MRF activity is scarce and this leads to the fact that governance of MRF is lacking, and it is not embedded in the marine management and policy process of many countries (Pita et al., 2017; Hyder et al., 2020). For EU countries, there has been a legal requirement from the European Commission to collect annual recreational catches for salmon and bluefin tuna under the Data Collection Framework (DCF) since 2001 (EU, 2001). For the Atlantic region, the list of required species increased in subsequent regulations (EU, 2008a; EU, 2010; EU, 2016; EU, 2021), including estimates of catches and releases for Atlantic cod (Gadus morhua), European seabass (Dicentrarchus labrax), European eel (Anguilla anguilla), Atlantic salmon (Salmo salar), pollack (Pollachius pollachius), elasmobranchs and for all highly migratory species, e.g., tuna species assessed by the International Commission for the Conservation of Atlantic Tunas (ICCAT). For the first time Member States are urged to implement multispecies sampling schemes that enable catch quantities to be estimated for certain stocks that were selected at regional level, in accordance with the relevant end user needs (EU, 2021).
A second mechanism for data collection of recreational fishery in Europe is the Control Regulation that specifies recreational fisheries are conducted in a manner compatible with the CFP and that recreational catches of stocks subject to recovery plans must be monitored on vessels registered in each country (EU, 2011). There has been limited data collected on MRF despite these requirements, mainly due to the challenges of delivering robust surveys and the varied and dispersed nature of MRF. In addition, there are relevant EU directives such as the Marine Strategy Framework Directive (MSFD) (EU, 2008b), The Maritime Spatial Planning Directive (EU, 2014; EU, 2022) where the objectives are to protect more effectively the marine environment across Europe in the case of the former, and to manage the use of the European seas and oceans coherently to ensure that human activities take place in an efficient, safe and sustainable way in the case of the latter. Therefore, despite these legal requirements, in many European countries the data collection programs on MRF are still a pending issue (Hyder et al., 2020). In Spain, Gordoa et al. (2019) and Dedeu et al. (2019) carried out recently the first assessment of marine recreational fishing at a national scale. Before that, MRF studies had been performed at a smaller scale by some Autonomous Communities (AC), which are the administrative bodies responsible for MRF management in the inshore waters (Morales-Nin et al., 2005; Lloret et al., 2008a; Lloret et al., 2008b; García-Flórez et al., 2012; Ruiz et al., 2014; Zarauz et al., 2015). These studies allowed a first characterisation of the biological and socio-economic importance of MRF in these regions. However, there is not a national data collection programme set up to answer the requirements of the new EU Multiannual Program (EUMAP) for data collection, which establishes the data requirements to be collected, the list of mandatory surveys in each sea basin and the thresholds to collect data. The data requirements for MRF are included under one of these legal acts: Commission Delegated Decision (EU) 2021/1167 of 27 April 2021, establishing the multiannual Union Program for the collection and management of biological environmental, technical, and socioeconomic data in the fisheries and aquaculture sectors. On the other hand, sampling schemes have considered selected species individually, which implicitly assumed independent distributions among species. In fact, species distributions are correlated with each other, driven by either biotic interactions or environmental variables (Zhang et al., 2020 and references therein). Therefore, in order to successfully manage these fisheries, it is essential to perform a detailed assessment of the critical gaps in the scientific knowledge (Pita et al., 2020), e.g., pointing towards multispecies sampling schemes for MRF.
The situation in the coastal region of the Basque Country (Figure 1), as in the rest of the Spanish coastal regions, is quite similar to other EU countries in relation to the knowledge of the activity of the MRF (Pita et al., 2020). The first study on the establishment of a systematic data collection system on MRF in this region was carried out in 2012-2013 (Ruiz et al., 2014) to provide the first estimates of seabass catches in response to EUMAP requirements, using different off-site methods such as telephone and email surveys (Zarauz et al., 2015). This study allowed comparing estimates obtained through the different sampling methods as well as evaluating the suitability of the different methodologies, but also potentially related biases. The results from Zarauz et al. (2015) made it possible to establish, for the first time in the Basque Country, a routine collection system using off-site methods, which has been in place since 2015.
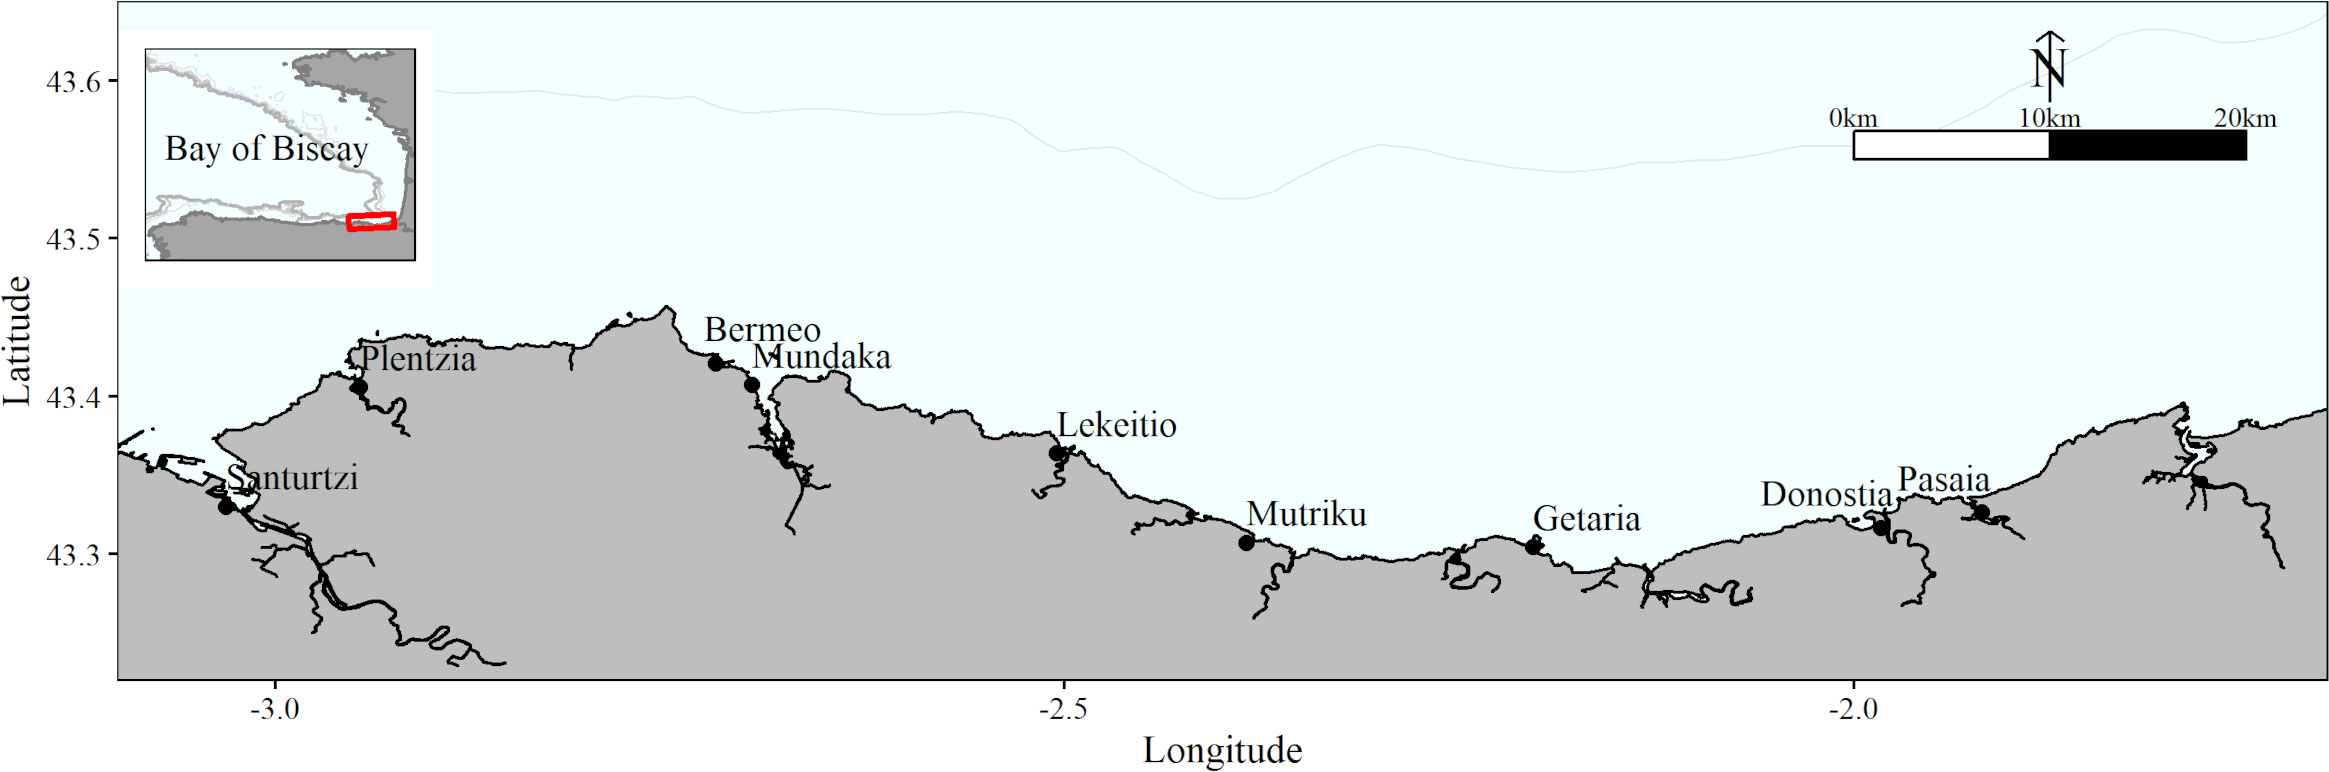
Figure 1 Area of study where recreational fishing activity data was collected. Red box in the upper left small map indicates the zoomed region of the Bay of Biscay presented in the main panel. The most important harbors are indicated within the map. Grey lines represent the 200m (the closest to the shore, visible in both maps), 500m and 1000m isobaths.
In this study we analyse data collected between 2015-2019 under the established routinary sampling programme. We characterize the profile of marine recreational fishers and we provide 5–year catch estimates for seabass (D. labrax), albacore (Thunus alalunga) and squids (Loligo spp.) for the first time. Although the surveys were initially designed to gather information about these three species, they could also be used to estimate the minimum abundance of other target species of MRF in the Basque Country, evidencing the relevance of additional species groups not reported previously for this activity, which highlights the need of multispecies sampling schemes able to capture the variability of the catch profile of MRF.
2 Materials and methods
2.1 Data collection: Off-site surveys
The study area was the Basque coastline, which extends 176 km in the Southeast corner of the Bay of Biscay (Figure 1). The management of recreational fishing depends on the Basque Government, who issues recreational fishing licenses that are mandatory for anglers and spearfishers older than 16 years and are valid to be used all over the Spanish coast. There are two types of licenses: one for surface fishing (shore and boat fishing) and one for spearfishing. The first one is renewed every 5 years, and the second one, annually. Additionally, for boat fishing, boat owners should register their boats in a specific census. For the purposes of this study, only the licenses of fishers living in the Basque Country were considered.
To collect data from different recreational fishing activities, off-site surveys were carried out from 2015 to 2019, both by email and through phone calls. In the first four years, surveys were conducted in July and January, collecting information from the corresponding previous semesters. In 2019 three surveys were conducted, one every three months, i.e., in May, September and December. A company was subcontracted to carry out the telephone surveys. The e-mail surveys were directly done using SurveyMonkey (www.surveymonkey.com). In 2017, only email surveys were performed, due to logistical problems. Sampling was stopped at the end of 2019 because of restrictions due to de personal data protection regulation (BOE, 2018), which requires the license application system to be changed to gather the explicit consent of the fishers.
Our sampling frame considered only licenses from fishers living in the Basque Country. The study population for shore and spear fishing was defined by the list of licensed anglers and spearfishers respectively, which, according to Basque regulations, is mandatory for recreational fishers older than 16 years (Eusko Jaurlaritza, 2000).The population of boat fishing was based on the list of fishers owning a license and having a vessel registered in the boat census. The contact information available in the license census was not complete. Namely, for surface licenses, an average of 35% fishers provided their telephone, and 27% their email; an average of 56% and 55% of spearfishers’ phone and emails were available, respectively. The sampling frames for shore and spearfishing were constructed using the contact information available in the corresponding license census. The sampling frame for boat fishing was built with the contact information of fishers owning a license and having a vessel registered in the boat census. Therefore, only boat owners were targeted, i.e., not licensed boat fishers without their own boat.
For phone sampling, the fishers were randomly selected from each sampling frame. The target number of surveys completed was set in 400. When no phone answer was obtained in a household, at least four attempts were done at different times of the day before considering that sample as a non-response. For email surveys, all available e-mails were used to send the questionnaire. A second email was sent to the fishers that did not reply to the questionnaire at the first round. According to that, the whole sampling frame is defined as the available phone numbers and emails. The gross sample accounts for the number of fishers contacted out of the sampling frame. The net sample is the number of available samples after accounting for sample loss (e.g., invalid contact information). This way, the response rate was calculated as the number of fully responding questionnaires divided by the gross sample, so only fishers that received the survey request were considered.
All surveys fall in the category of recall surveys, in which interviewers are asked about an event performed in the past. To minimize the non-response during the survey, 300€ were raffled among all participants. Both email and phone surveys were based on the same questionnaires aiming to collect information about fisher’s profile (i.e., age and years of experience) and fishing activities. Regarding the latter, fishers were asked about their fishing mode, fishing location, fishing effort (i.e., number of days of each reported fishing activity during the surveyed period) and catch information. Fishers were first asked to report captures (i.e., total number and, if possible, total weight) of seabass, squids and albacore. Captures of sea bass and albacore were needed to answer the requirements of the DCF (EU, 2010; EU, 2016; EU, 2021). Squids were included in the surveys because their relevance in the Basque MRF (Ruiz et al., 2014; Palas et al., 2017). Captures of other species were reported as additional information, but often qualitatively, as part of an open field regarding ‘other captured species’ within the questionnaires. Although both retained and released capture information was requested, the reported information of released fish was almost null and therefore only data of retained fish will be considered in this study. Boat owners were asked to report the total catch and effort performed from their vessel, which may correspond to several fishers; however, and since such information was not available, it was assumed that all the fishing activity of each vessel corresponded to its owner.
2.2 Data analysis
2.2.1 Response rates and fishers’ profiles
To characterize the coverage of the Basque recreational fishing community, response rates were assessed in terms of percentages (Table S01), by survey type (i.e., email vs phone calls), year (2015-2019), period (month ranges), and fishing mode (shore fishing, boat fishing, spearfishing).
The recreational fisher’s profile was assessed by age, fishing experience (in years) and fishing effort (fishing days) of those who responded to different surveys, for each fishing mode.
A t-test was applied to test for differences on response rates between survey sources (phone vs email).
2.2.2 Fishing effort
Fishing effort was assessed with the total fishing days declared by each fisher. To check whether estimated total fishing effort varied depending on fishing mode and years, two-way ANOVA (F test) was applied.
2.2.3 Catch estimates based on abundance and weight of captured species
Questionnaires collected species’ catch information from fishers practicing each recreational fishing mode. Each fisher reported detailed information about captured numbers of seabass, albacore or (especially) squids; for such species, weight was also occasionally reported. For all other captured species, the total number was often unspecified, and the information was sometimes limited to singular (i.e., 1 individual) vs plural (i.e., at least 2 individuals) capture reports. To ease later interpretation of results, the following 16 species groups were defined: tunids (i.e., Thunnus alalunga, Sarda sarda, Katsuwonus pelamis, Auxis spp.), squids (Loligo spp.), seabass (D. labrax), sargo-breams Diplodus spp. (D. sargus, D. vulgaris, D. puntazzo and D. cervinus), Scomber spp. (Atlantic mackerel, S. scombrus, and Atlantic Chub mackerel, S. colias), Trachurus spp. (T. trachurus and T. mediterraneus), gilthead seabream (Sparus aurata), Lithognathus mormyrus, Pagellus spp. (P. bogaraveo, P. erythrinus and P. acarne), common dentex (Dentex dentex), scorpionfish Scorpaena spp. (S. porcus, S. notata and S. scrofa), Mullus surmuletus, Conger conger, other fish species (Solea solea, Platichthys flesus, Scophthalmus spp., Lepidorhombus spp., Dicologlossa cuneata, Coris julis, Serranus cabrilla, Balistes capriscus, Triglidae fam., Labrus spp. (L. bergylta, L. mixtus), Trachinus draco, Beryx decadactylus, Trisopterus luscus, Helicolenus dactylopterus, Zeus faber, Boops boops, Umbrina spp. (U. cirrosa, U. canariensis), Argyrosomus regius, Oblada melanura, Spondyliosoma cantharus, Mugil spp., Belone belone, Pagrus pagrus, Brama brama, Sarpa salpa, Merluccius merluccius, Pollachius pollachius and Micromesistius poutassou), swordfish, sharks and rays (Xiphias gladius, Scyliorhinus canicula, Galeus melastomus and Raja spp.), and other species (Anguilla anguilla, Maja squinado and Palaemon spp.).
The total catch of seabass, tunids and squid was estimated using the Horvitz & Thompson estimator and assuming simple random sampling (Lumley, 2011; ICES, 2012) for each fishing mode:
where N is size of the study population, C is the estimated total catch, ci is the catch reported by the surveyed fishers, and πi is the probability of including unit i in a sample of size n. In the case of simple random sampling, π equals .
For other species, the minimum catch abundance was assessed. For weight estimates, data was considered from reports when available, and re-calculated from abundances and mean weights for surveys not providing weight information. Catch estimates were extrapolated for each fishing mode, according to the covered sampling frame and assuming simple random sampling (see details in Lumley, 2020). Given that both phone and email surveys extrapolated captures to the total fishers’ numbers from census, the mean catches between the two methods were considered for further analyses.
In addition, we used two-way ANOVAs (F tests) to evaluate variables affecting the estimated total catches. Fishing mode, years, number of fishers, response rates and estimated fishing effort (total fishing days) were used as explanatory variables, whereas the estimated total catch (kg) was used as the response. Akaike’s information criterion (AIC) was applied to get the most parsimonious model.
2.2.4 Variation in captured species composition
First, we used multinomial logistic regression models (iterated 2500 times) with reported data (i.e., absolute catch abundances) to evaluate variables affecting the captured species composition. Year, fisher’s age and fishing experience, fishing mode and fishing effort were used as explanatory variables and multivariate species compositional data (i.e., species abundance composition matrix) was used as the response. Since preliminary data exploration recommended in Zuur et al. (2010) determined a high collinearity between age and experience, we kept experience and dropped age for the multivariate analyses.
Several authors concern about the use of count data in recreational fishery reports, given that high amount of zero values are common (Taylor et al., 2011) and may ignore overdispersed data (Zuur et al., 2009; Carlos-Júnior et al., 2020; Stoklosa et al., 2022 and references therein). Accordingly, we also determined significant variables affecting the species composition, fitting a zero inflated negative binomial model (iterated 999 times) with the species occurrence as response variable, as proposed by Solow and Smith (2010); i.e., 0 representing absence of species, 1 representing singletons (true single individuals), and 2 representing two or more (Solow and Smith, 2010; Stoklosa et al., 2022).
The variation in captured species composition was then assessed in detail, in terms of beta-diversity, comparing the fishing modes first, and different experience ranges (defined as <5 years, 5-30 and >30 years) in a second analysis. Following the approach proposed by Baselga (2010); Baselga (2012), we used captured species’ presence-absence data to compute the monotonic transformation (Chao et al., 2012) of beta-diversity – Sørensen dissimilarity index (βSOR) and its partition into two additive components, accounting for pure spatial turnover and nestedness. The turnover component is species replacement, consists of the substitution of species in an individual fisher’s captures by different species in captures of the other fishers, and is measured as the Simpson-based dissimilarity component (βSIM). The nestedness-resultant dissimilarity component (βNES) is species loss (or gain), which implies the elimination (or addition) of species in only one individual fisher, as leads to the poorest assemblage being a strict subset of the richest one Baselga (2010); Baselga (2012).
2.3 Software and statistical packages
We used R software v.2.4.0 (R Core Team, 2021) for all analyses and graphical representations, using especially package ggplot2 v.3.2.1 (Wickham, 2009) for figures. Catch estimates were calculated using ‘svyby’ and ‘svytotal’ functions from survey package v.4.0 (Lumley, 2020). We fitted multinomial regressions using ‘multinom’ function in nnet package (Venables and Ripley, 2002), and zero inflated negative binomial models using ‘zeroinfl’ function in package pscl (Zeileis et al., 2008). For the beta-diversity analysis, we used the betapart package v1.5.6 (Baselga and Orme, 2012) and in particular, the ‘betapart.core’ function to compute and plot captured species dissimilarity, turnover, and nestedness components.
3 Results
3.1 Response rates and fishers’ profiles
The study population (number of fishers), sampling frame (contact information available), the gross sample (phone calls and emails sent), lost and refused calls, number of answers obtained and response rates per fishing mode and year, are presented as Supplementary Material (Supplementary Table S01).
According to the census, the number of active fishing licenses during the sampling period was around 50000, 5000 and 1000 for shore fishing, boat fishing and spearfishing, respectively (Supplementary Table S01). With both phone and email survey methods around 50% of spearfishers and <20% of shore and boat fishers were contacted.
Although the contacted numbers varied during the study period, both for email and phone calls, the aimed 400 responses were achieved in most of the sampling years and fishing modes (Figure 2). Such response numbers were higher in surveys made by phone in all modes, spearfishers showing relatively higher response numbers than shore fishers and boat fishers (Figure 2). When accounting for the email survey, the response numbers were lower in all modes, with especially few answers from boat fishers in all years (Figure 2; Supplementary Table S01).
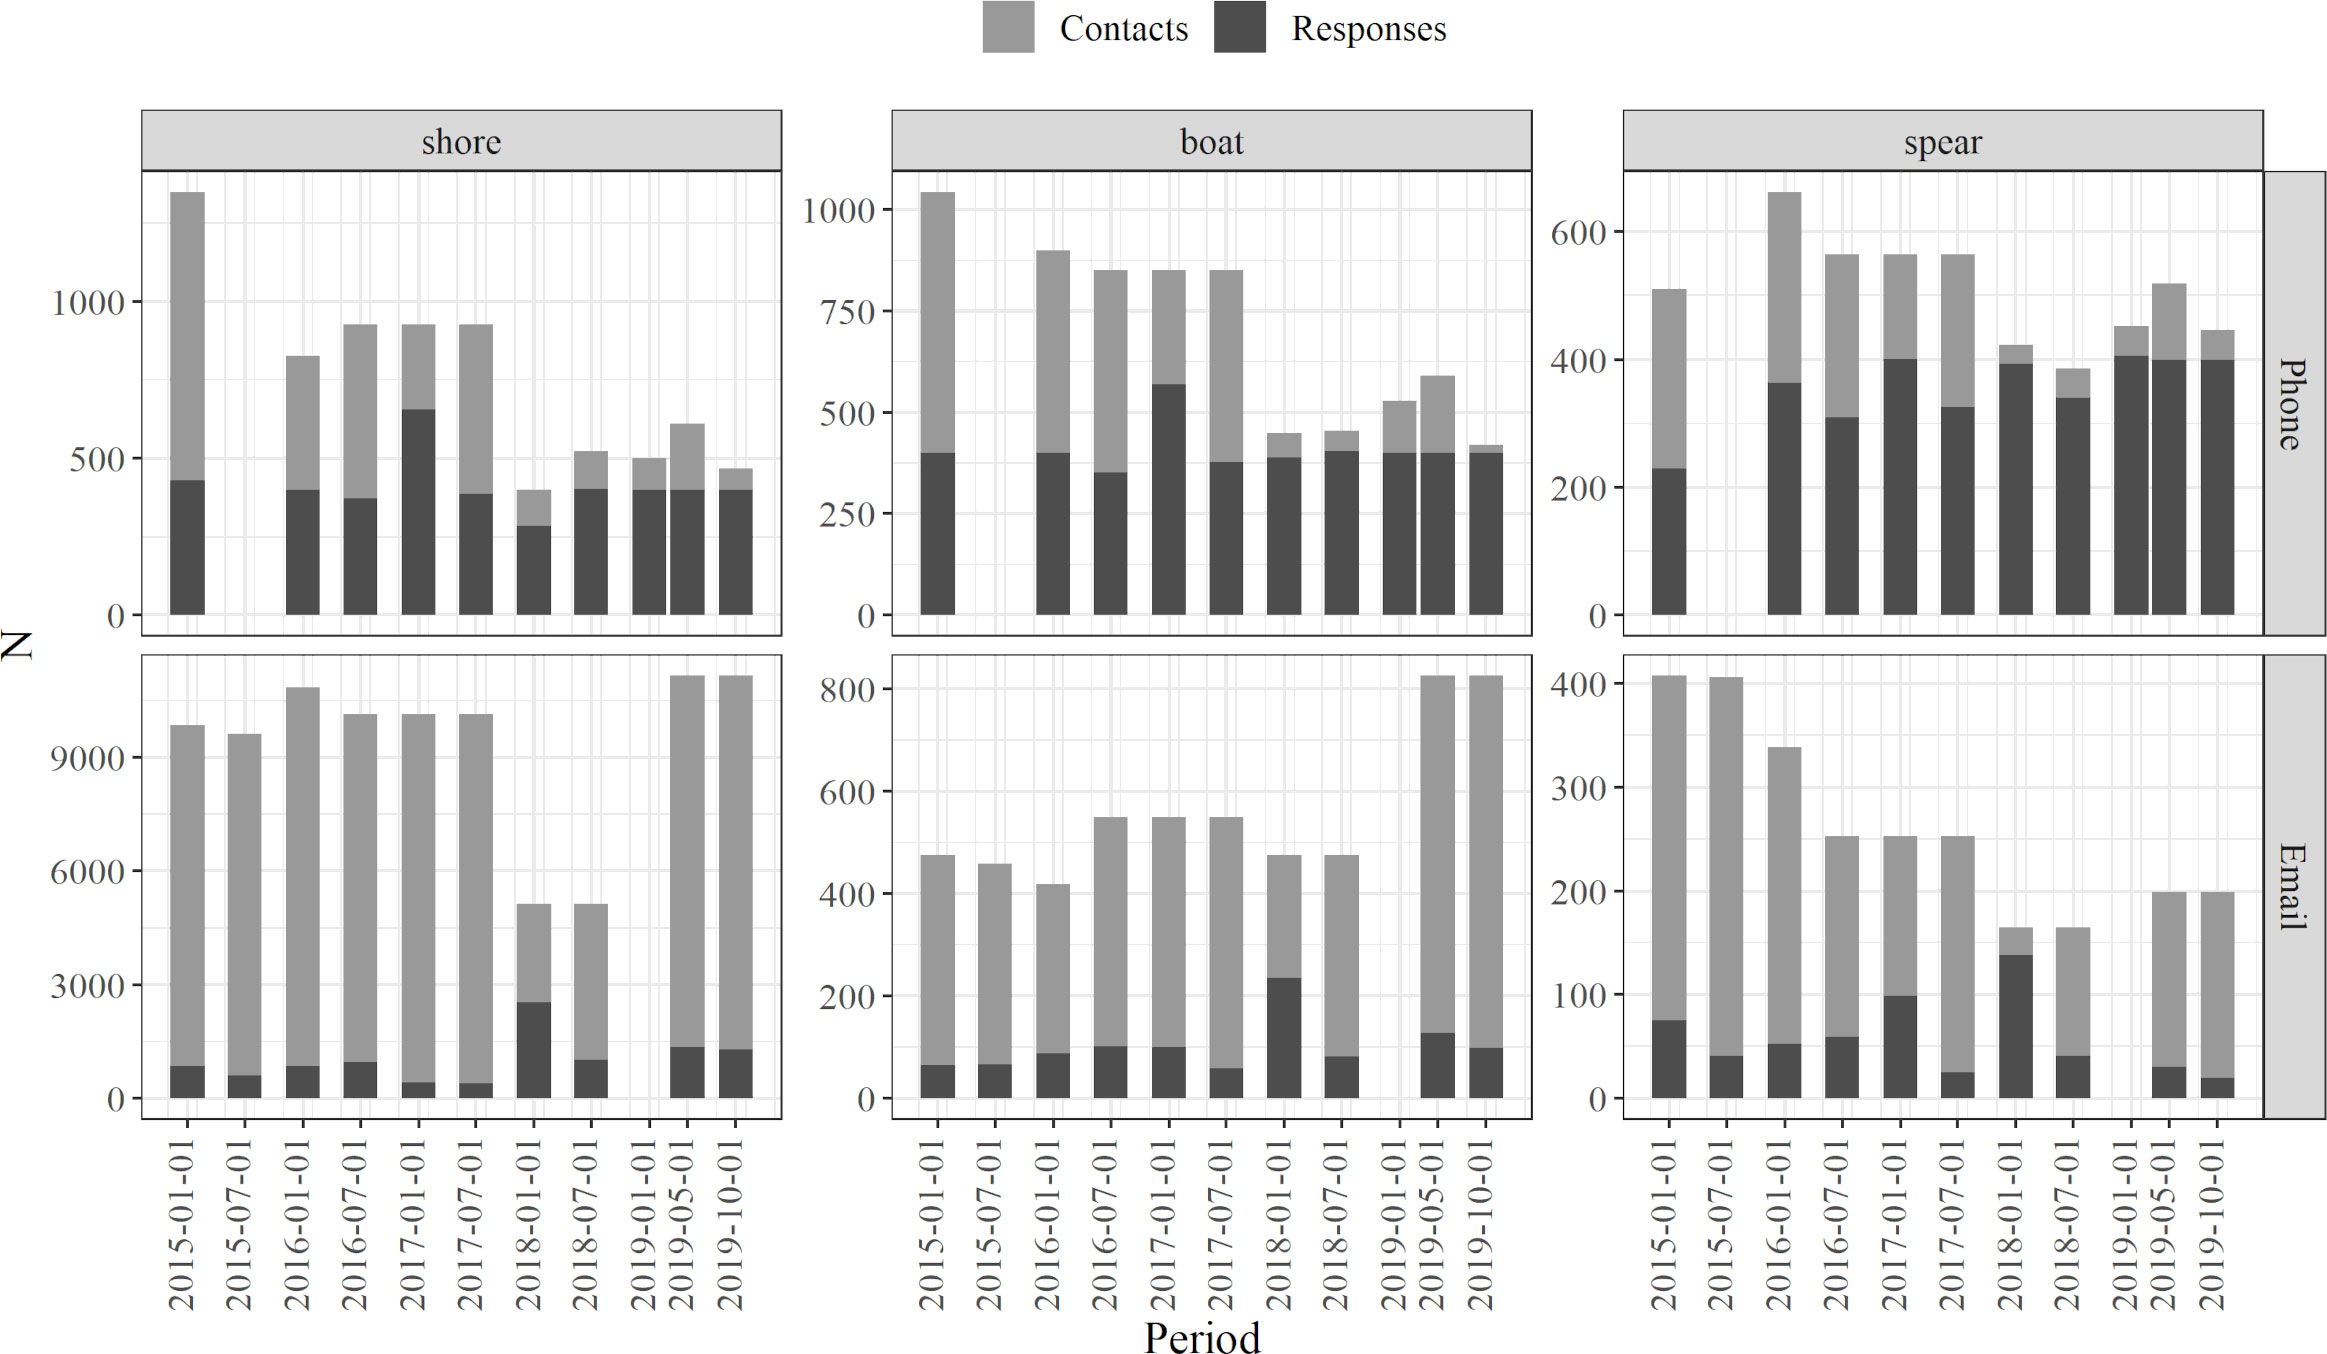
Figure 2 Number of contacted fishers and obtained positive responses though different months of the sampling period (2015 – 2019), separated by survey type (i.e., phone calls and emails) and fishing mode (i.e., shore fishing, boat fishing and spearfishing). Note the different scales in Y axes.
Accordingly, the response rate was significantly higher (t-test, p < 0.05) for phone calls (57–68%, Table 1) than for emails (13–24%, Table 1). While the response rate of phone surveys was similar for the three fishing modes, in relation to the total license numbers, spearfishers showed relatively higher response rates than the boat and shore fishers (Table 1; Supplementary Table S01). The response rates obtained especially from phone surveys increased during the last two years, i.e., 2018 – 2019 (Figure 2; Supplementary Table S01).
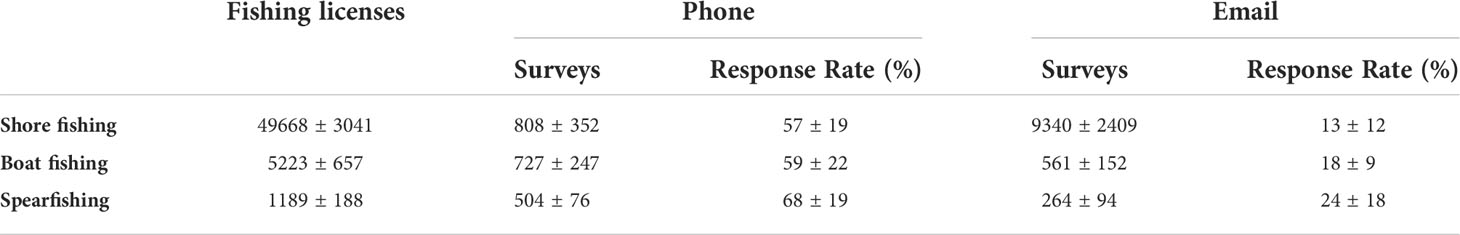
Table 1 Means ( ± SD, Standard Deviation) of the number of fishers (i.e., licenses), conducted surveys (i.e., gross sample) by phone and email during the sampling period (2015 – 2019), and of the total response rates obtained (absolute numbers and percentages), for each fishing mode.
Regarding the age of fishers based on both phone and email survey responses, most of responses were obtained from 30–50 year old fishers until 2017, and even from older fishers (40–60 years old) in the last two years (Figure 3). In any case, age-range differences were more due to fishing modes than to any inter-annual trends. Boat fishers showed an older age-range in comparison with shore fishers and spearfishers, with even clearer differences on email surveys. Spearfishers presented a slightly younger and narrower age-range, whereas higher abundances were observed in all age ranges of shore fishers, going from 1 year up to 80 (Figure 3).
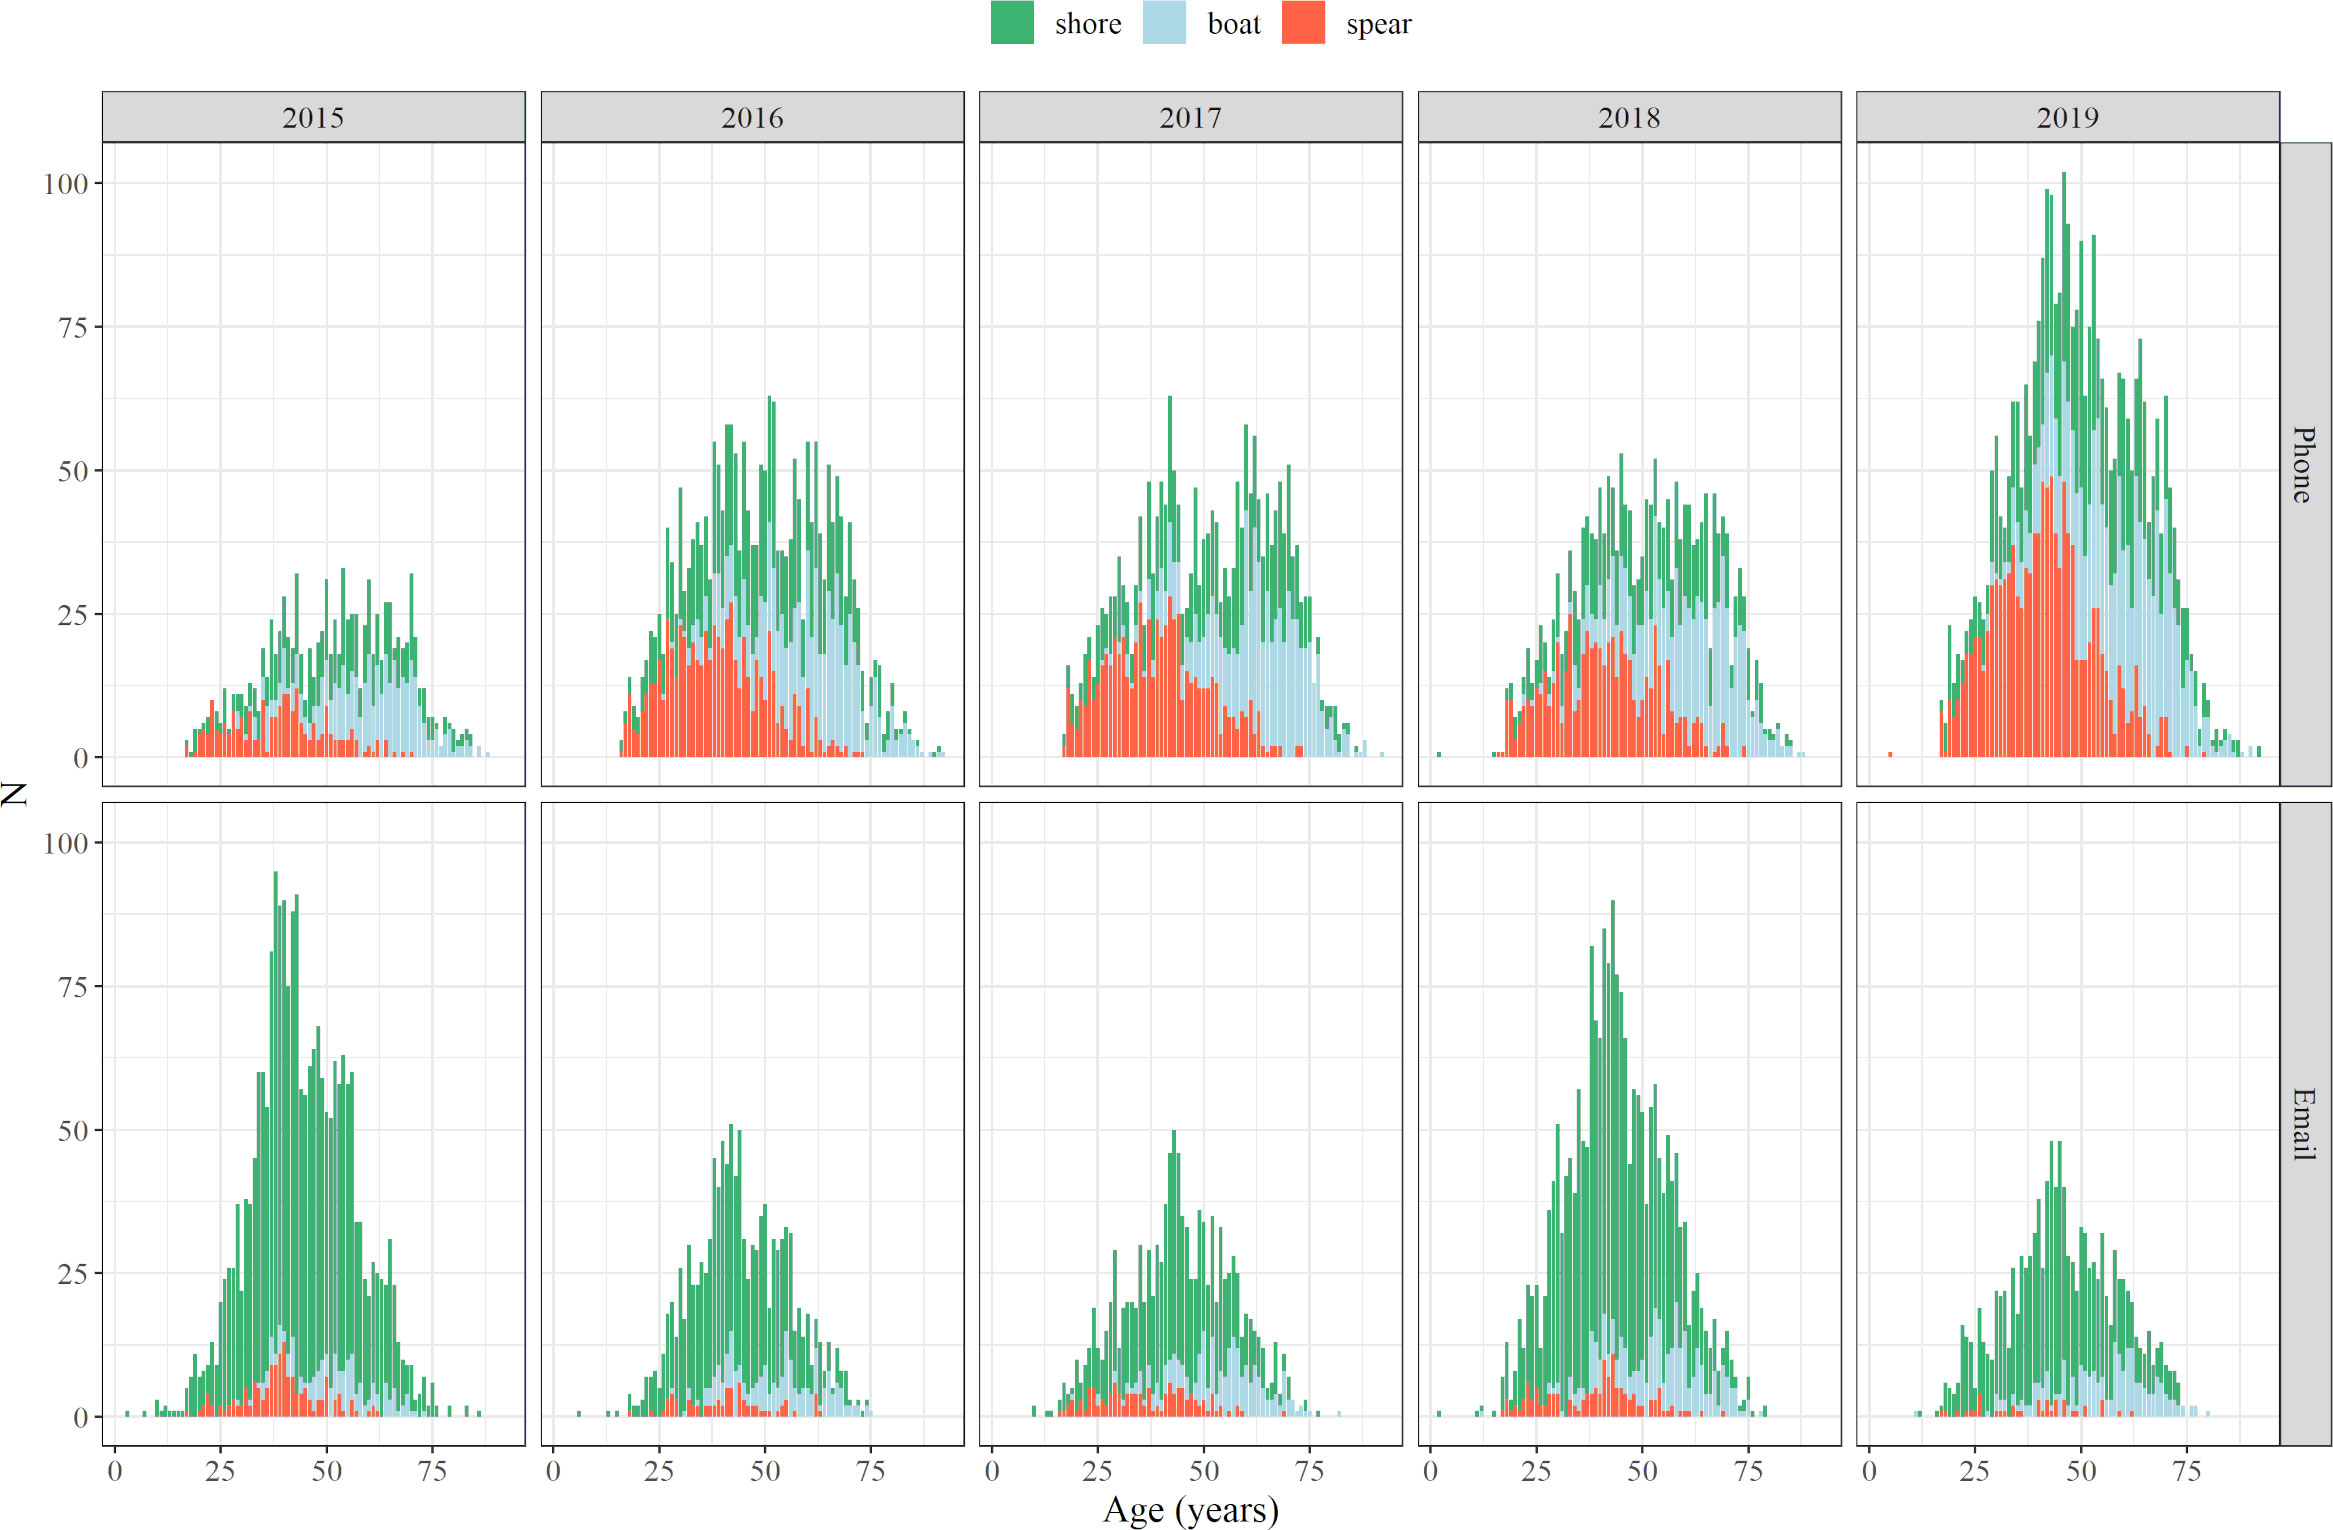
Figure 3 Age distribution of fishers that provided information on phone and email surveys from 2015 to 2019, for each of the fishing modes (shore fishing, boat fishing, spearfishing).
In all fishing modes, fishers with experience ranging from 1 to 10 years were the most abundant, dropping as the number of years of experience increased. The main drop was for fishers with >40 years of experience in shore fishing, whereas the number of spear fishers declined when considering >10 years of experience, suggesting an overall shorter experience degree than for fishers in the other two modes. Number of boat fishers also declined as the degree of experience increased but such a decline was smoother than in other modes (Figure 4).
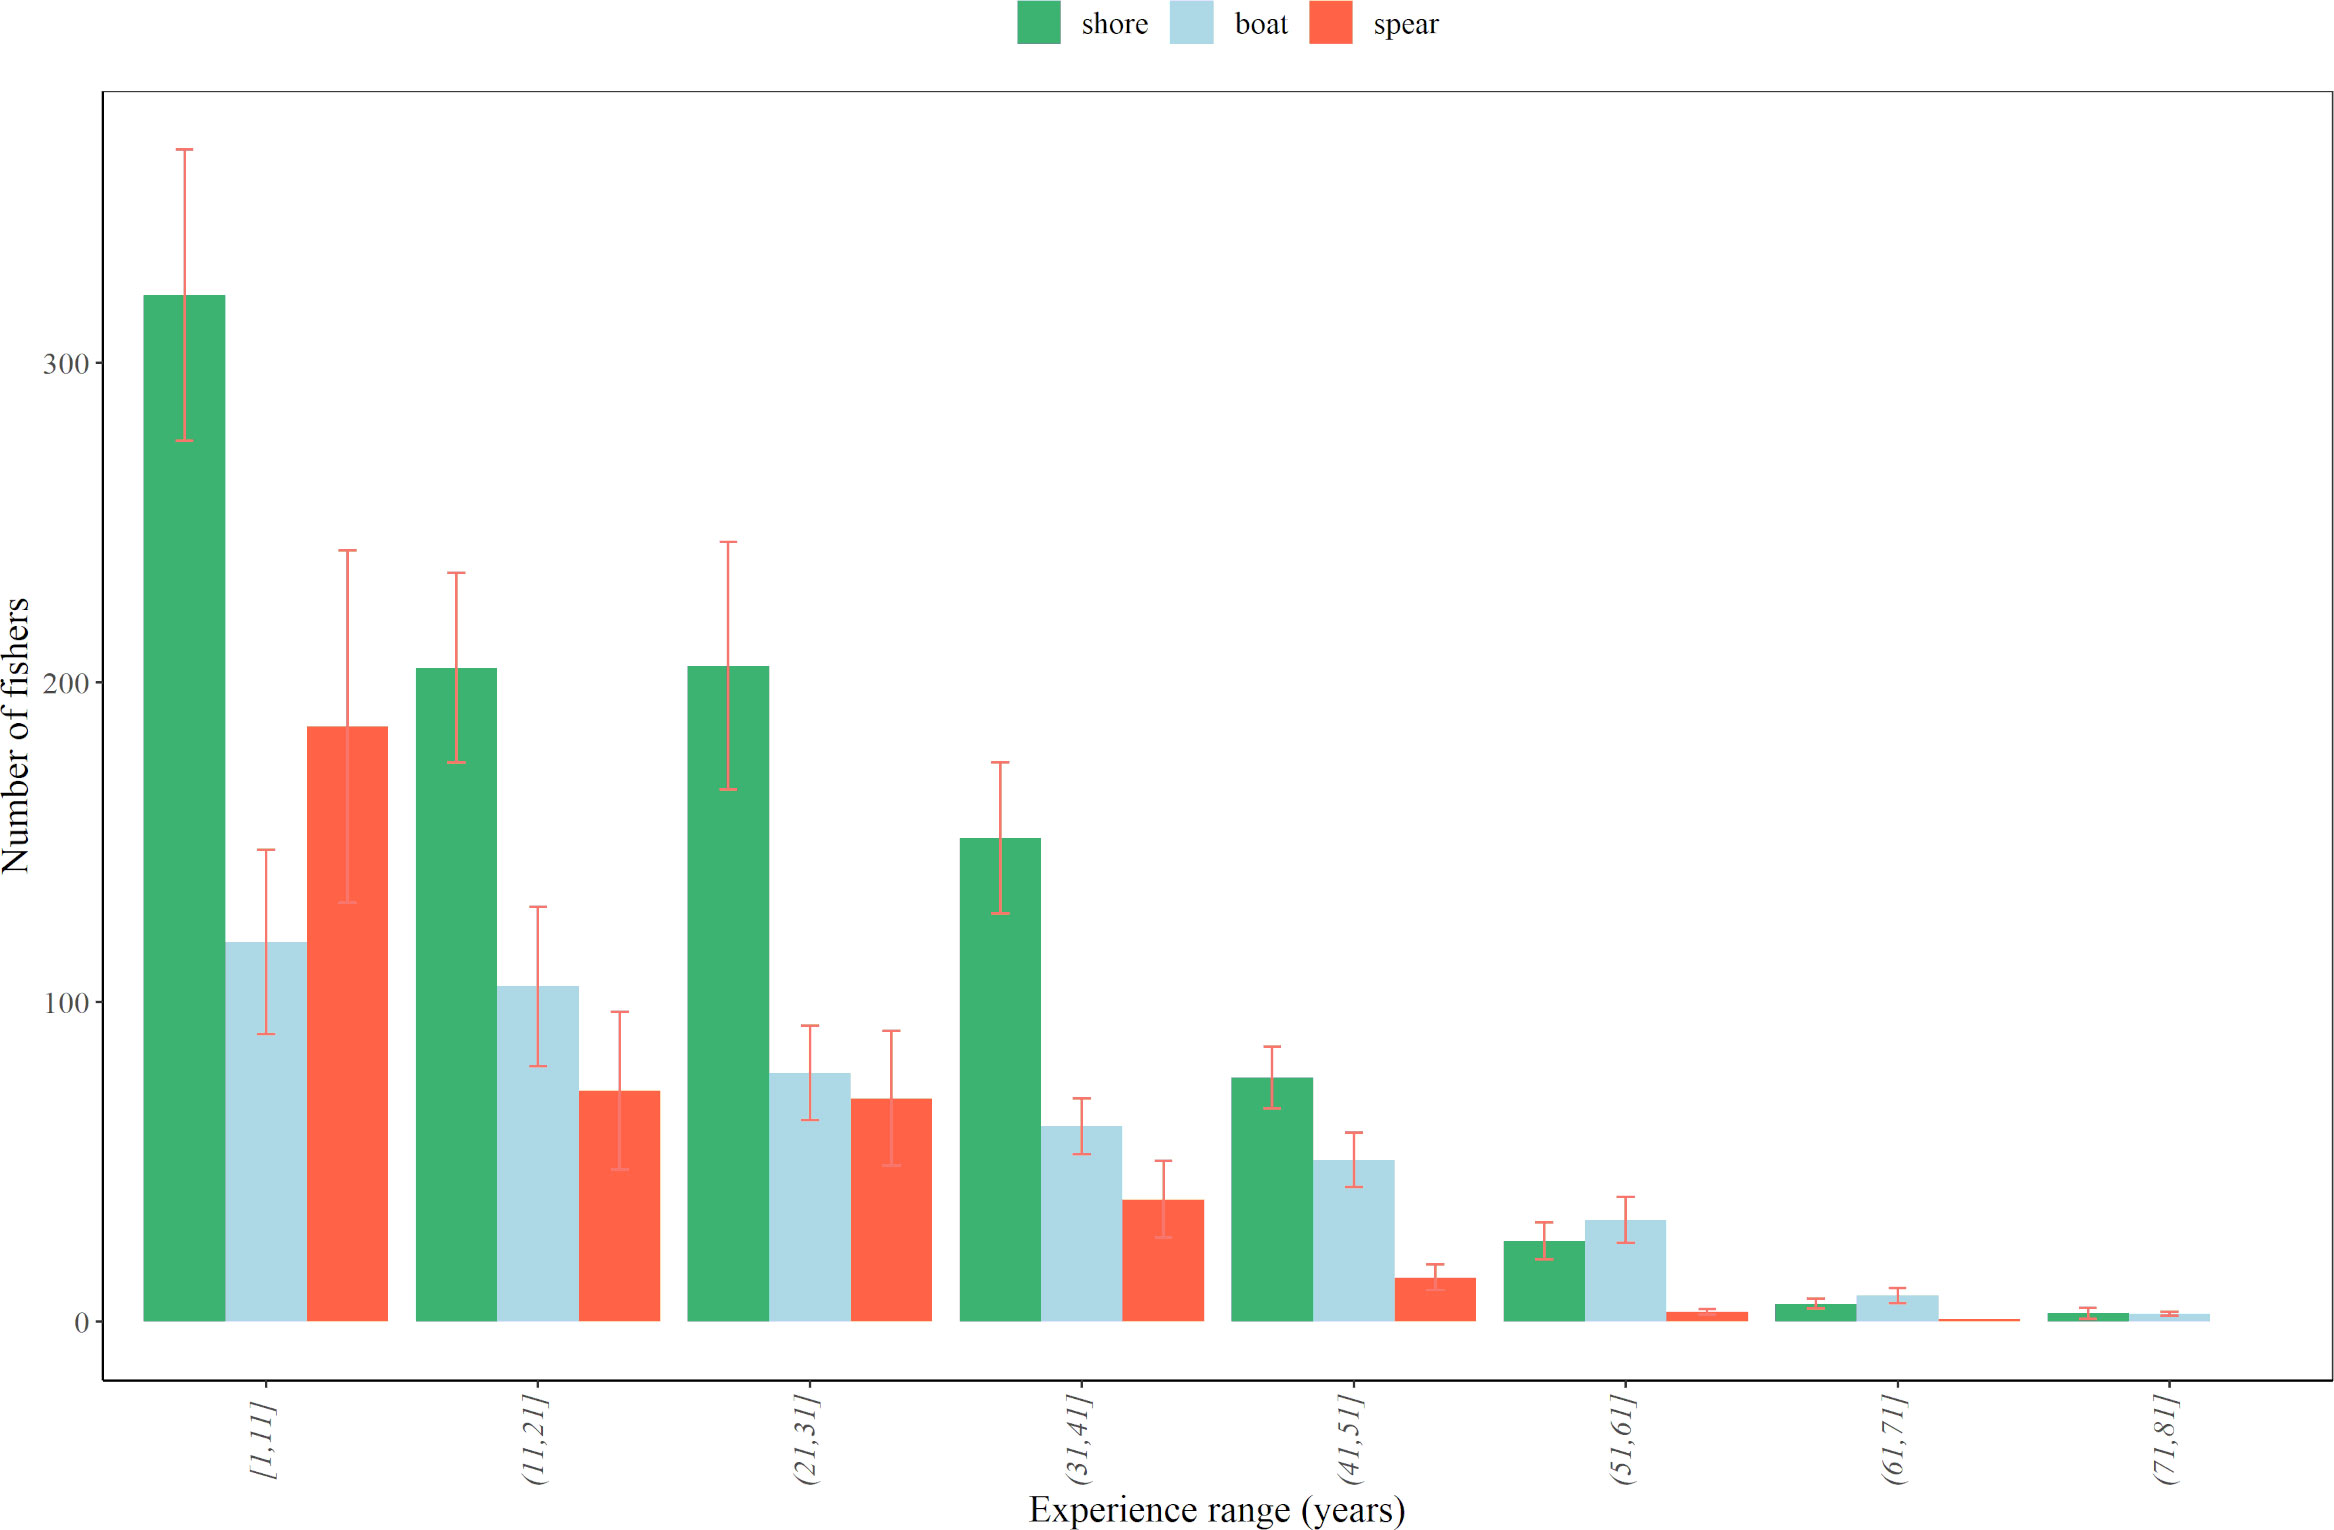
Figure 4 Number of fishers per range of degree of experience (in years) for each fishing mode, considering all sampling years and survey sources together (phone and email surveys, 2015-2019). Error bars denote the standard error.
3.2 Fishing effort
Estimated total fishing effort varied significantly depending on fishing mode but not between years (two-way ANOVA; year: F = 1.923, d.f. = 4, p = 0.2; fishing mode: F = 492.87, d.f. = 2, p <0.001; year*mode interaction: F = 0.62, d.f. = 8, p = 0.57). Shore fishers exerted by far much higher fishing effort, followed by boat fishers and spearfishers (Supplementary Figure S01), the latter accounting for <2% of the total estimated recreational fishing effort.
In accordance with age distribution, fishers reporting the highest fishing effort (i.e., those who declared a higher number of fishing days per corresponding surveyed period) were the shore fishers from 40 to 50 years old, boat fishers from 50 to 70 years old, and spearfishers from 30 to 40 years old (Supplementary Figure S02). Number of fishing days reported were significantly different between phone and email surveys during different years (two-way ANOVA; year: F = 98.79, d.f. = 4, p < 0.001; source: F = 402.39, d.f. = 1, p < 0.001; year*source interaction: F = 245.78, d.f. = 1, p < 0.001).
3.3 Catch estimates
The estimated total catch differed significantly depending on the fishing mode and on its interaction with response rates (two-way ANOVA; fishing mode: F = 14.78, d.f. = 2, p <0.001; response rate: F =0.98, d.f. = 1, p = 0.33; mode*response rate interaction: F =2.46, d.f. = 2, p < 0.1), whereas ‘sampling year’, ‘number of fishers’ and ‘fishing effort’ were not significant explanatory variables based on the AIC. However, we decided to assess the following catch estimates analysis keeping the sampling years separately to check for suggested temporal trends.
Squids caught from shore and boats were by far the most abundant captures in numbers in almost all sampling years, whereas most of the total catch weight was due to captures of tunids from boats. In terms of total weight, tunid landings were estimated between 68 t and 358 t, depending on the year (showing the minimum and maximum landings in 2015 and 2019, respectively; Figure 5). Squid landings ranged from 89 t to 156 t, and were within similar ranges as seabass estimates, the main target species for shore fishers, ranging from 71 t to 147 t (Figure 5).
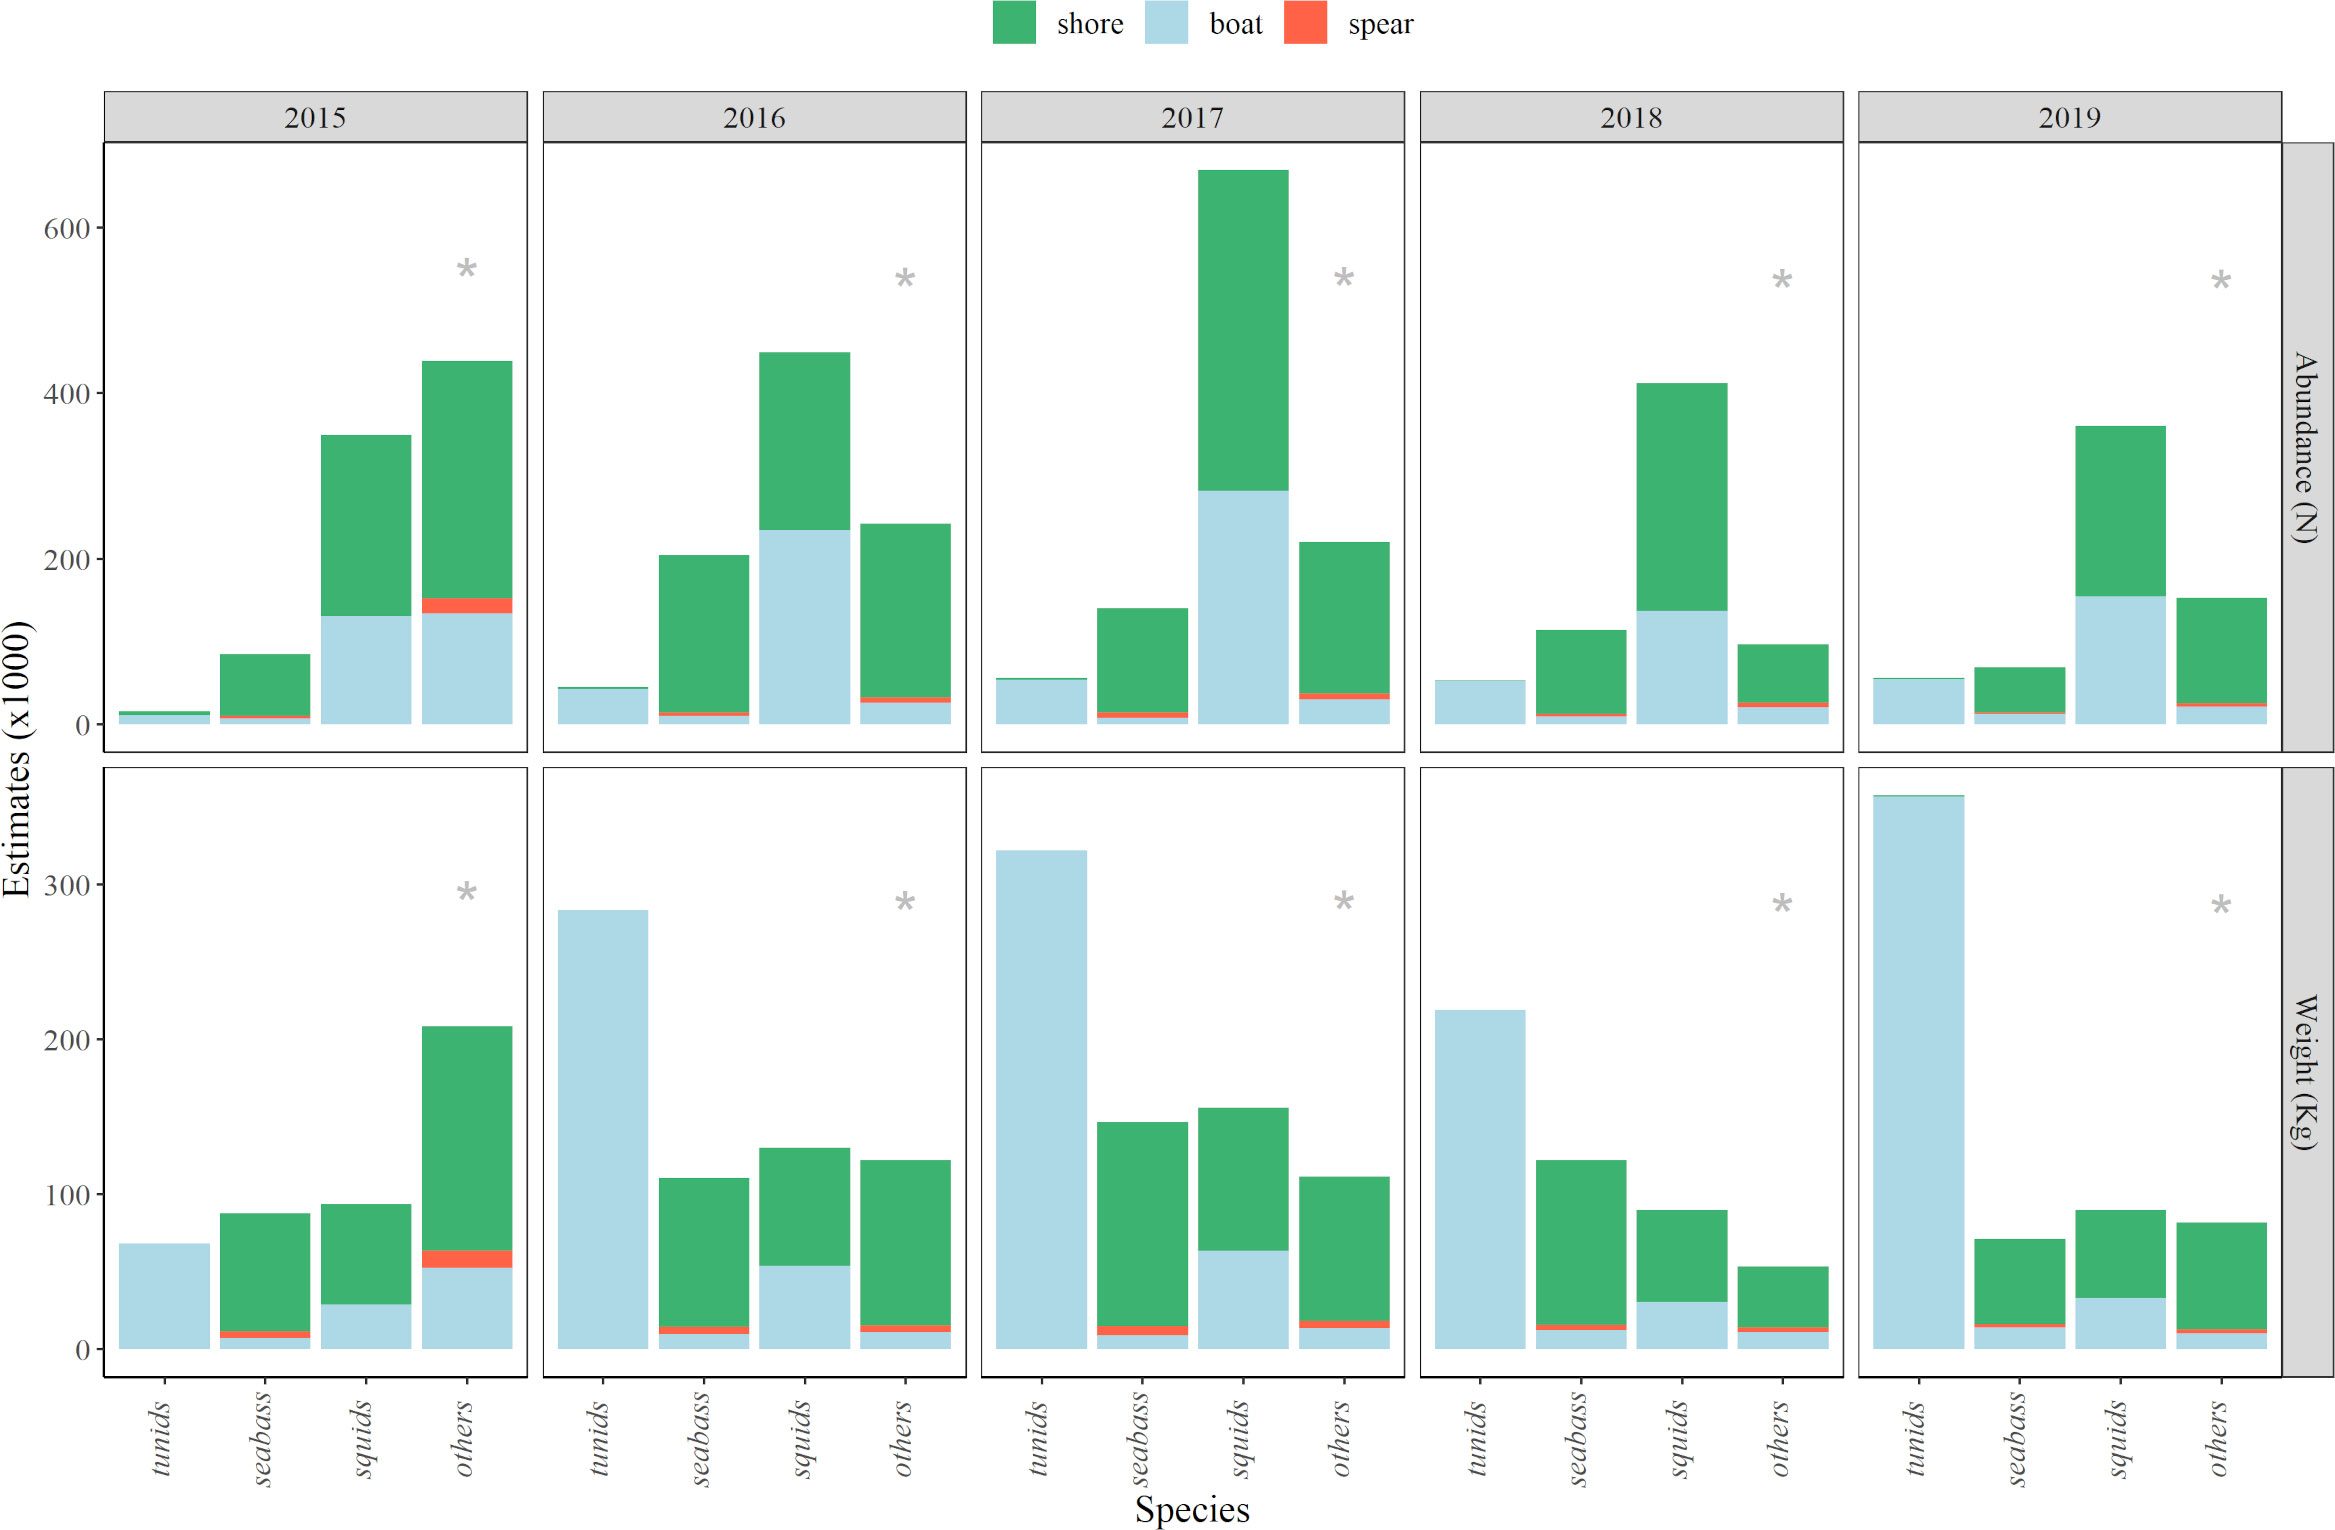
Figure 5 Mean values of estimated catches (i.e., between phone and email surveys, see Methods section), in terms of abundance (numbers) and weight (kg), for the main species groups caught by each fishing mode (i.e., shore fishing, boat fishing, spearfishing) during the sampling years (2015-2019). Grey “*” denotes minimum abundance, based on additional notes from fishers (see Methods section).
In terms of percentages by fishing modes (Figure 6), squids were around one third of captures in numbers in shore fishing and more than the half in boat fishing; together with seabass and sargo-breams (Diplodus spp.) in shore fishing, and with tunids in boat fishing, they comprised >75% of the total catches in numbers. In contrast, in terms of weight, seabass and seabreams were the half of the total shore fishing catches in weight, whereas tunids were by far the most important in boat fishing (>70% of the total catch), followed by squids in the two fishing modes. For spearfishing, seabass and seabreams were the most important captured species both in numbers and weight (>50%), with a wide variety of additional species (e.g., congers, scorpionfish, gilthead seabreams) completing the targeted species (Figure 6).
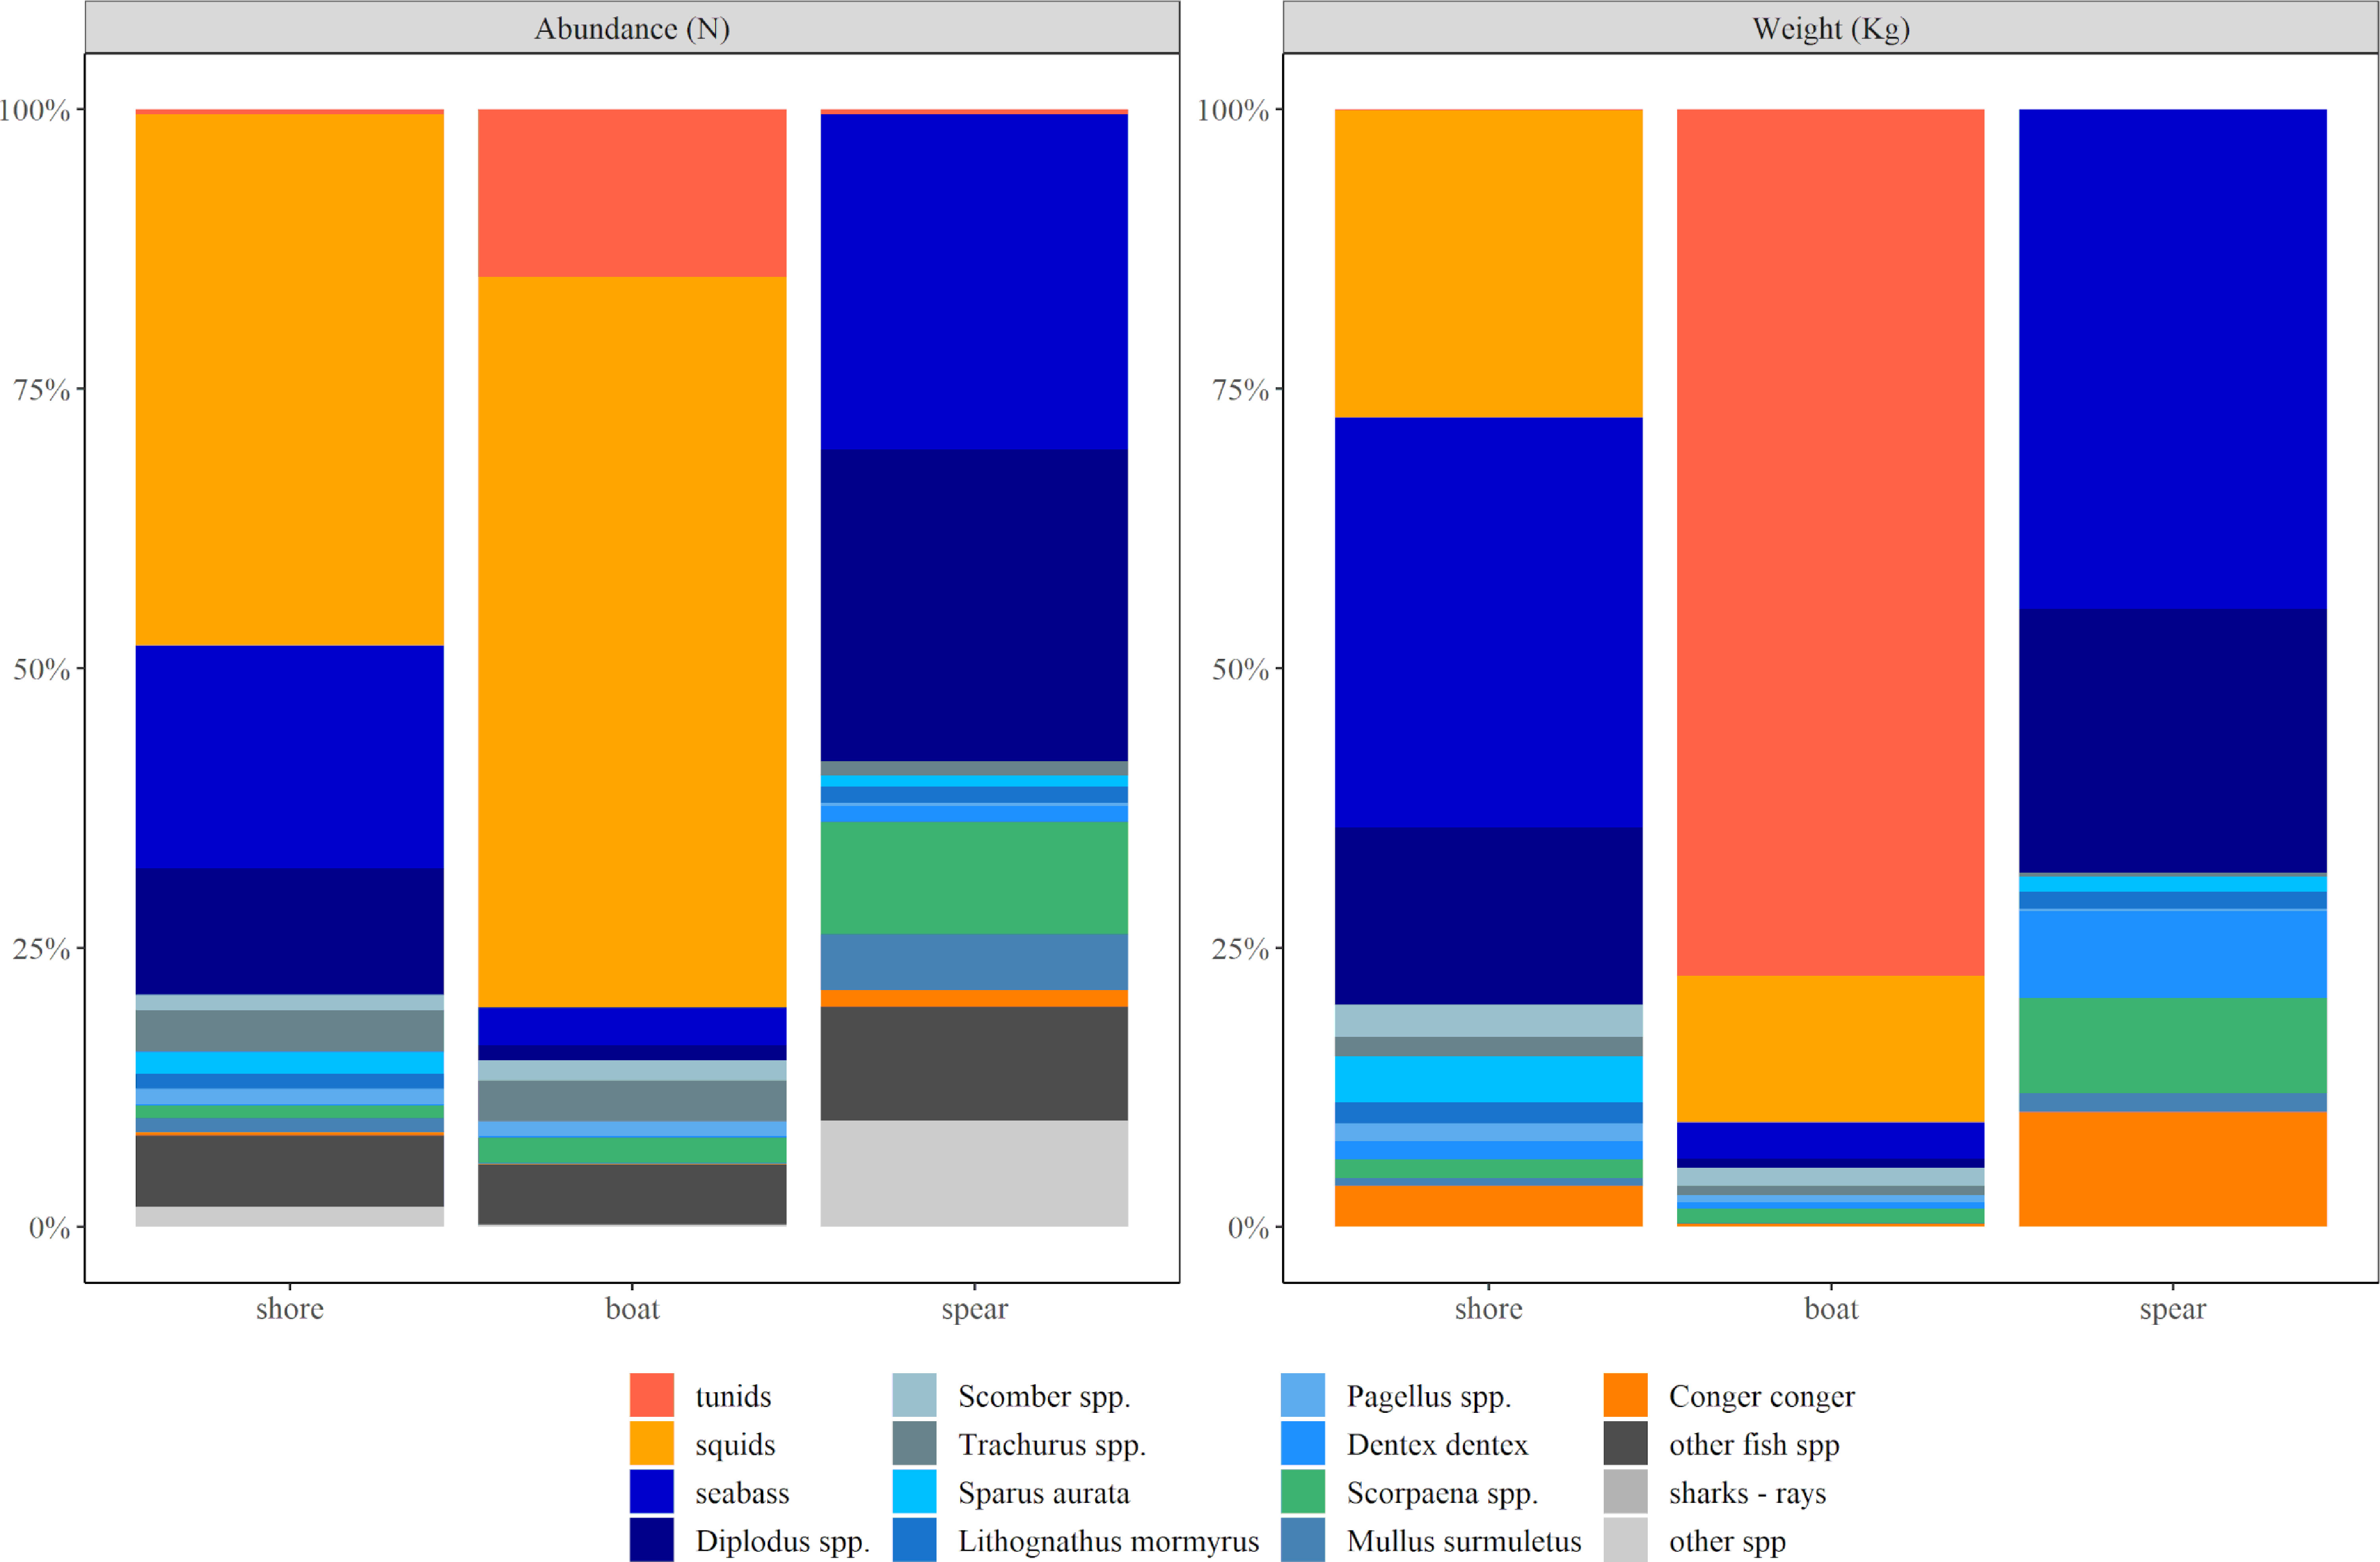
Figure 6 Estimated captures in percentages of abundance (number) and weight (kg), for all species groups caught with different fishing modes (i.e., shore fishing, boat fishing, spearfishing), considering all years (2015-2019) and survey methods (phone and email) together.
3.4 Variation in captured species composition
Species composition data (i.e., absolute reported catch values) were first analyzed using logistic multinomial regressions. AIC tests showed that in addition to the fishing mode (standardized null model, AICµ 357437), the consecutive incorporation of the variables ‘sampling year’ (AICµ+year 352452), ‘years of experience’ (AICµ+year+experience 351418) and ‘fishing effort’ (AICµ+year+experience+effort 343810) resulted in the last option as the most parsimonious model.
The negative binomial model (Zuur et al., 2009; Stoklosa et al., 2022) also showed that occurrence density of species varied significantly by fishing mode, fishing effort, sampling year and experience; the zero inflated negative binomial model showed that both fishing mode and sampling effort were significant variables predicting excessive non-occurrences (i.e., zero values) (Table 2).
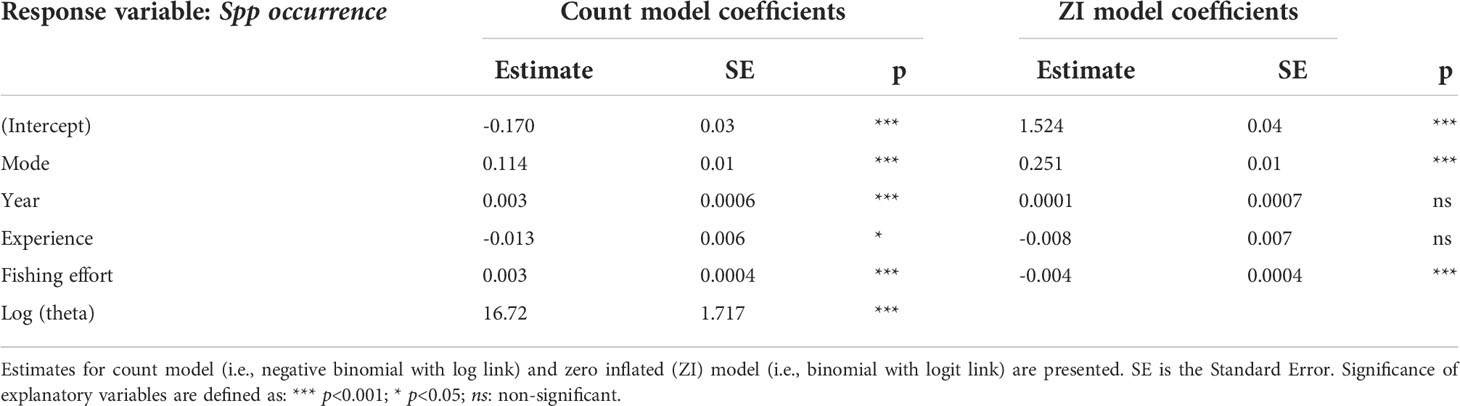
Table 2 Summary statistics of the zero inflated negative binomial model fitted to species occurrence compositional data as response variable.
Regarding the variations in captured species composition (beta-diversity), shore-fishing and spearfishing showed the highest and the lowest individual variations in species composition, respectively (i.e., Sørensen dissimilarity index βSOR, Figure 7A). The lower beta diversity in spearfishing was primarily explained by the turnover component, which defined spearfishing as the most different fishing mode in terms of captured species composition due to a lower species alternating in comparison with boat and shore fishing (i.e., Simpson dissimilarity βSIM, Figure 7B). Shore and boat fishing modes had a similar species loss (i.e., prey richness), in contrast with higher richness variation observed in spearfishing (i.e., nestedness component βNES, Figure 7C).
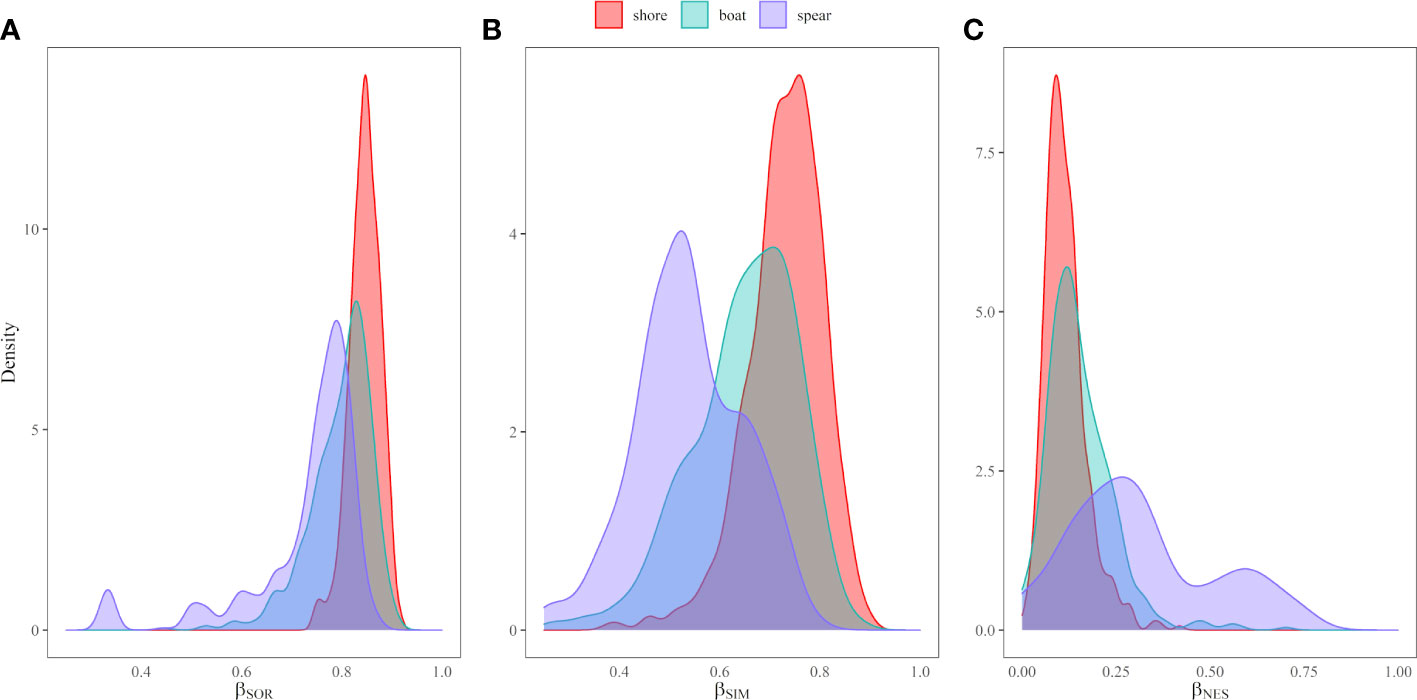
Figure 7 The partition of beta-diversity transformed as (A) Sørensen dissimilarity index (βSOR), and the partition in the (B) turnover (βSIM) and (C) nestedness (βNES) components, for shore fishing (red), boat fishing (light green) and spear fishing (blue).
When comparing variations in captured species composition (βSOR) caught by fishers with different experience ranges, it was mostly the same for all groups, the most experienced fishers (i.e., >30 years’ experience) showing a bit lower individual variations in species composition (Supplementary Figure S03A). The captured species composition was most variable for amateur fishers (i.e., <5 years’ experience), due to a higher species replacement (βSIM) in comparison with fishers with longer experience (Supplementary Figure S03B). The nestedness component (βNES) showed a similar species loss among different levels of experience, suggesting lower species richness in the catch of fishers with shorter experience (Supplementary Figure S03C).
4 Discussion
4.1 Survey assessment
From the total number of contacted fishers, within reasonable ranges compared with previous surveys in other areas (Herfault et al., 2013; Rocklin et al., 2014; Hyder et al., 2017b), response rates obtained were higher in phone surveys, despite the emails contacting a larger sample of the fishing population. Such better responses obtained by phone could be interpreted in terms of bias risk due to non-responses, as avid fishers are more likely to answer than fishers reporting zero catches (Tarrant and Manfredo, 1993; Tarrant et al., 1993; National Research Council, 2006). In our study, non-responses in phone surveys were more due to erroneous phone numbers rather than to people refusing to answer, which were less than 10%, in accordance with first surveys in the region in the last decade (Zarauz et al., 2015). This way, and although the increase of phone survey refusals observed with time might probably be related with survey fatigue (National Research Council, 2006), the response rates increased with time in all fishing modes, due to a better depuration when preparing the phone numbers lists. In contrast, it might be easier for less avid fishers not to respond to email surveys, lead either by little interest to provide information about their own catches, moreover filling forms manually. As a conclusion, we can say that phone surveys were less likely to be influenced by non-response bias than email surveys.
Besides, only retained species were reported, and therefore information about released species was almost null, suggesting that in future questionnaires a dedicated section and/or a special sampling effort should be incorporated to characterize the catch-and-release activity.
Concerning the sampling frame, the proportion of fishers providing contact information when getting the license increased over time (Table S01, Supplementary Material), probably due to improvements in the webpage of the corresponding administration that aimed to encourage fishers to fill in such information and to quality check that provided information. Accordingly, and given that we do not expect any significant bias related with fishers who did not provide their contact information, the increase in number of contacts also represented an increase in the quality of the sampling frame, as a larger proportion of the fishing population would be covered. However, there is potential bias due to the lack of information about the fishing activity carried out by the non-licensed fraction of the population. In fact, Gordoa et al. (2019) estimated that the 5% of fishers in Spain did not have a license, and that percentage would be even higher when considering fishers younger than 16 years old, who are not required to have such licenses (Eusko Jaurlaritza, 2000).
Still, it is not clear whether the amount and quality of the provided information is more related with survey method (e.g., time spent with each survey) or avidity (and therefore interest) of fishers’ community. In fact, considering fishing effort as an approximation of avidity, estimates would be affected by year or source (i.e., phone vs email). Most of the responses were obtained from 30–50 year old fishers, which is in accordance with that observed throughout different regions of Spain by Dedeu et al. (2019). However, fulfilling email surveys might have been harder for older fishing population, which might skew the use of age distribution for different fishing modes based on survey responses. In any case, differences between responses from different fishing modes might be more related with fisher’s age (e.g., spearfishing population is generally younger than boat fishers’ population), experience, and interest, rather than with the survey methodology (National Research Council, 2006; Rocklin et al., 2014). According to that, both survey methods seem to be useful, although questionnaires should be re-defined to get more detailed information about (1) all captured species and (2) fishing effort, which might consider some additional variables such as the number of hooks per fisher or the number of fishers per boat, ignored in actual surveys.
Regarding catch estimates, data was more detailed in directed questionnaires by phone (i.e., surveys oriented to get estimates for seabass, tunids, squids), whereas the information regarding other captured species was much more extended on email surveys. This might be because fishers spent longer time thinking and filling the forms this way and were therefore more eager to include written information rather than providing extended information by phone. However, estimates of ‘other species’, written in open fields as ‘additional information’ and often qualitatively, resulted in underestimation biases. This was assessed here considering minimum catch estimates, which, in any case, showed conservative information about captured species not previously reported for MRF in the region. Nonetheless, adding more species in questionnaires also resulted in high amounts reported zero catches, which might indicate either real zeros or absence of information (e.g., Solow and Smith, 2010; Stoklosa et al., 2022). In fact, fishing mode and effort significantly affected the zero inflation in species composition, according to our results. Such zero-inflation bias might therefore be potentially related also with the fishers’ profile, considering the degree of detail of the information provided by fishers from different modes and with different degree of experience, especially for those captures defined as ‘other species’.
The main sources of bias in our probabilistic approach based on random selection of licenses to survey, might be associated with (1) undercoverage of the sampling frame, (2) previously mentioned non-responses (<10% for phone surveys), (3) the potential recall bias, (4) the non-licensed fraction of fishers from which no information could be obtained. Table 3 summarizes the generalized sources of bias, their potential consequences and suggested improvements that might be considered for future surveys. In this sense, while non-responses and potential recall bias could potentially be related to the fishers’ profile (e.g., avidity, age, experience, or interest when providing data), other sources would be more due to logistic and/or budget limitations. In fact, in our study only retained species were reported so that data regarding released captures was not available for further analyses. On the other hand, the different sampling effort when conducting different surveys throughout our sampling period (e.g., no phone surveys could be made in 2017; in 2019 three sampling periods were defined contrasting with two periods considered during previous years) might also have affected final estimates. Besides, the lower response rates obtained by email which, at the same time, were filled by more avid fishers, might also suggest that further research is needed to determine the uncertainty and errors derived from different surveying methodologies, especially concerning catch estimates.
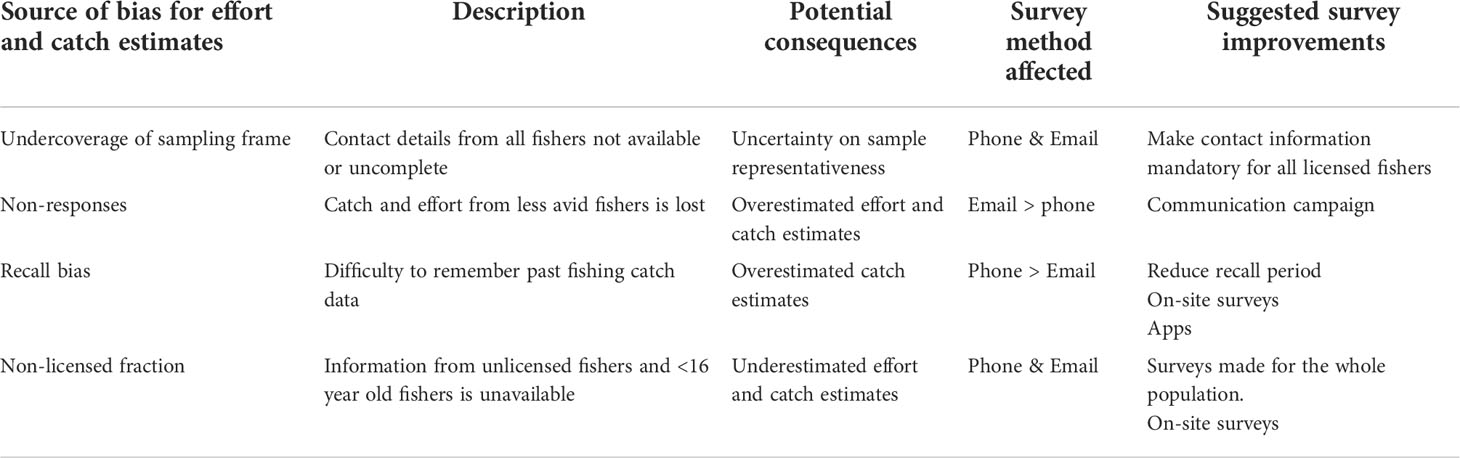
Table 3 Summary of the main sources of bias in MRF surveys, potential consequences and suggested improvements that might be considered for future research.
4.2 Basque MRF characterization
4.2.1 Fishers’ profiles and fishing effort
The age range of the population in shore fishing was the highest, ranging from the youngest to the oldest fishers, since angling is always the most accessible recreational fishing mode. This was also well reflected in terms of fishing experience, which, in accordance with Papadopoulos et al. (2022), was relatively shorter for spearfishers. Those were generally younger than boat fishers, which in contrast, were older and had a higher degree of fishing experience (Vitale et al., 2021; Papadopoulos et al., 2022). However, most of fishers showed experiences ranging from 1 to 10 years in all fishing modes, which seems reasonable considering that most of the people that gets the fishing license goes fishing sporadically of in certain seasons of the year (e.g., during summer vacations). Given that age distribution of fishers was stable for the three fishing modes through years, we might not expect any relevant behavioral change in recreational fishing population in a near future.
The avidity of fishers was well reflected in the fishing effort, which varied depending on fishing mode. In accordance with general trends shore fishers, more in numbers and with more variable profiles, summed much higher fishing effort than boat fishers and spearfishers (Pita et al., 2018), the latter exerting <2% of the total recreational fishing effort during the sampling period. However, and similar to that observed, for instance, in northern Europe (van der Hammen et al., 2016), most fishers were active few days a year, whereas the most avid fishers were much less in numbers.
4.2.2 Catch estimates and captured species composition
This is the first study providing results of a 5–year sampling program of MRF in the Basque Country, answering to the DCF requirements in terms of annual catch estimates of seabass and albacore in the region (EU, 2016). Additionally, and despite they are not included as mandatory species in catch-reporting regulations, the same time series is provided for squids, given their importance especially for fishers in charge of small recreational boats that are designed for such purpose.
However, our estimates are skewed due to different bias identified, such as non-response, recall, quality of species’ information and the sampling coverage. For instance, given that reported catches were extrapolated to the whole recreational population (i.e., total number of licenses), and despite both reported (real) zeros and non-response-derived zero inflation (Carlos-Júnior et al., 2020; Stoklosa et al., 2022), it might be reasonable to think that, for instance, not all recreational vessels exert fishing effort on tunids. This way and considering that recreational tuna fishery seems to be specialized, more dedicated surveys would be required to get better estimates that might be then compared with landings from commercial small-scale fishery, which could be the fishing sector that might present relevant potential interactions with MRF (Pascual-Fernández et al., 2015). In the same way, most of squid landings are known to be under-reported by commercial fishery, which might also make it difficult to determine this kind of interaction. Therefore, catch estimates are treated for relative comparisons between fishing modes, but could not be used to compare with landings from the commercial fishery. In the same way, the bias caused by dedicated questionnaires asking about albacore, squids and seabass suggests that relative comparisons should only be applied between these species.
Focusing on the three species targeted in our surveys, in terms of total landings, tunids were the most important species in MRF, all captured from boats and therefore by more experienced (and relatively older) fishers. Except the results from year 2015, which showed very low weights, the mean catch estimates for tunids ranged from 200 to 360 t (Figure 5), which, considering that are mostly due to albacore catches, are in line with catches estimated for this species by Ruiz et al. (2014) and Dedeu et al. (2019). Squids were the most abundant in numbers for both shore and especially boat fishing, and the second most important species for MRF in terms of landed weights. Estimated catches for the period of study ranged from 89 to 160 t, which is comparable with the weight calculated by Ruiz et al. (2014) but lower than those estimated by Dedeu et al. (2019) for the same region. Sea bass catches in the period of study ranged between 71 and 147 t, in accordance with previous results obtained in the area by Ruiz et al. (2014) and Zarauz et al. (2015) but being smaller than estimates from Dedeu et al. (2019).
On the other hand, additional capture information evidenced that many other species were often targeted by recreational fishers, as shown by minimum catch estimates. Shore fishers varied targeted species between trips more than boat and spearfishers but showed less species richness in each trip. This might be related with less experienced fishers, who might spend less time fishing by trip and have less success when capturing large amounts of different species. This way, in addition to the already assessed seabass, captures of sargo-breams (Diplodus spp.), gilthead seabream (Sparus aurata), common dentex (Dentex dentex) might also be relevant. In fact, considering their economic importance (Lloret et al., 2018), some dedicated shore fishing activity might be expected, which could derive in potential interactions with commercial small-scale fishery, the only fishing sector that brings such species into the local market (Lloret et al., 2018). Also, Atlantic mackerel (Scomber scombrus) might get some interest from shore fishers, especially in spring when this species gets closer to the coast (Uriarte and Lucio, 2001) allowing relatively important captures in short time. Despite the potential competition with commercial fishery is still open to discussion (i.e., due to the relatively low total landings in comparison with commercial catches), this might attract both avid and other fishers with a wide range of experience or age, that would be interested in shore fishing only during the corresponding season. The dedicated seasonal fishing activity (e.g., for sargo-breams and mackerel) might also explain the significant relationship found between captures and presence-absence capture probability with the fishing effort (i.e., fishing days). Captures of scorpionfish (Scorpaena spp.) might be related with anglers that search rocky areas not so accessible to everyone, which might suggest profiles with some degree of experience.
Regarding boat fishers, the variation in species composition was close to that observed for shore fishers, probably because the most important captured species (i.e., aside from albacore, seabass, and squids) were mackerel –which might also be concentrated in certain periods in spring (González-Álvarez et al., 2016)– and scorpionfish –appreciated species captured in rocky areas.
Spearfishers, much less in numbers in comparison with other fishing modes (Sbragaglia et al., 2021), showed the highest differences, with lower species alternation between trips, but different spearfishers targeting different specific fish groups. In addition to seabass, minimum catch estimates for sargo-breams were close to the 25% of the total catch in weight, which suggests that the real catch of this species by the whole spearfishing community might be important (Pita and Freire, 2016). Other important species targeted by spearfishers would be scorpionfish and conger, not so frequent but important in terms of weight. In this sense, spearfishers might be the most selective recreational fishers (Sbragaglia et al., 2021).
4.3 Conclusive remarks and future steps
This study shows evidence that not only tunids, squids and seabass are important but also other assessed (e.g., mackerel caught by shore and boat fishers) or unassessed species (e.g., sargo-breams, gilthead seabreams or common dentex caught by shore fishers and spearfishers) are commonly caught and might be relevant in terms of total landings. However, an improved re-definition of the sampling frame by each fishing mode and perhaps even by each fishery –based on target species (e.g., boat fishing targeting tunids, MRF targeting mackerel in spring, etc.)–, as well as dedicated sampling to collect information about all captured species, are required to get useful estimates. Results suggest that captures of certain species might be important, but further research is needed to determine the potential consequences of such an interaction with local commercial small-scale fisheries, which also exert certain fishing effort to those unassessed but still commercially important species.
This goes in line with the recent inclusion of statistically robust multispecies sampling schemes for MRF in the DCF (EU, 2021) which had been recommended repeatedly (Hyder et al., 2017a). This modification of the DCF is relevant, as recreational fishers are not required to register their activity, and the DCF is presently the main tool to collect information for this fishery. Historically, scientific assessments of marine fish stocks in Europe have been focused on the impacts caused by commercial fisheries and these have become the main target for data collection. Consequently, the impact of MRF has been underestimated and reduced to a limited list of species (ICES, 2020). With the inclusion of multispecies sampling schemes for MRF, it will be possible to obtain data on the overall impact of this activity in marine fish stocks.
In this sense, in addition to off-site surveys, questionnaires filled on-site allow getting better estimates of fishing effort (resolution in hours), captures (including fish length distribution and qualified identification) and detailed information about the fishing location and/or conditions (weather, tides, interactions with other fishing activities, etc.). Furthermore, the use and implementation of novel technologies such as smartphones application (apps) for data collection will also improve the collection of MRF data and their knowledge (Skov et al., 2021) for retained and released species, both required to feed models to get reliable recreational fishing effort estimates. Angler apps are potentially valuable source of conventional and novel data that are both frequent and extensive, and an opportunity to engage anglers through data sharing and citizen science (Venturelli et al., 2017). However, repeated surveys might cause less interest from fishers (vs. feeling of being controlled), so especially considering future on-site surveys in small villages, a balance between off-site and onsite surveys might be achieved.
Future MRF survey designs should therefore have to deal with getting the balance right between survey cost, precision, and accuracy, to get better catch estimates of both assessed and unassessed species that might be comparable with catches from commercial small-scale fishery in potential future scenarios with increased MRF activities (Freire et al., 2020).
Data availability statement
The original contributions presented in the study are included in the article/Supplementary Material. Further inquiries can be directed to the corresponding author.
Author contributions
All authors listed have made a substantial, direct, and intellectual contribution to the work and approved it for publication.
Funding
This work was cofounded by the Department of Economic Development, Sustainability and the Environment of the Basque Government, and the European Commission Data Collection Framework.
Acknowledgments
We thank all the people who agreed to participate in telephone and e-mail surveys for providing information about their fishing activity. We are also thankful to all interviewers from Lanalden Contact Center for carrying out the telephone surveys. Finally, thanks are due to the reviewers for their useful comments, which contributed to improve the manuscript. This is contribution no. 1104 from AZTI (Marine Research Division).
Conflict of interest
The authors declare that the research was conducted in the absence of any commercial or financial relationships that could be construed as a potential conflict of interest.
Publisher’s note
All claims expressed in this article are solely those of the authors and do not necessarily represent those of their affiliated organizations, or those of the publisher, the editors and the reviewers. Any product that may be evaluated in this article, or claim that may be made by its manufacturer, is not guaranteed or endorsed by the publisher.
Supplementary material
The Supplementary Material for this article can be found online at: https://www.frontiersin.org/articles/10.3389/fmars.2022.975089/full#supplementary-material
References
Baselga A. (2010). Partitioning the turnover and nestedness components of beta diversity. Glob. Ecol. Biogeogr. 19, 134–143. doi: 10.1111/j.1466-8238.2009.00490.x
Baselga A. (2012). The relationship between species replacement, dissimilarity derived from nestedness, and nestedness. Glob. Ecol. Biogeogr. 21, 1223–1232. doi: 10.1111/j.1466-8238.2011.00756.x
Baselga A., Orme C. D. L. (2012). betapart : an r package for the study of beta diversity. Methods Ecol. Evol. 3, 808–812. doi: 10.1111/j.2041-210X.2012.00224.x
BOE (2018). Ley orgánica 3/2018, de 5 de diciembre, de protección de datos personales y garantía de los derechos digitales. Sección I: Disposiciones Generales p.119788–119857.
Carlos-Júnior L. A., Creed J. C., Marrs R., Lewis R. J., Moulton T. P., Feijó-Lima R., et al. (2020). Generalized linear models outperform commonly used canonical analysis in estimating spatial structure of presence/absence data. PeerJ 8, e9777. doi: 10.7717/peerj.9777
Chao A., Chiu C.-H., Hsieh T. C. (2012). Proposing a resolution to debates on diversity partitioning. Ecology 93, 2037–2051. doi: 10.1890/11-1817.1
Cowx I. G., Arlinghaus R. (2008). ““Recreational fisheries in the twenty-first century: Towards a code of conduct,”,” in Global challenges in recreational fisheries (Oxford, UK: Blackwell Publishing Ltd), 338–352. doi: 10.1002/9780470697597.ch17
Dedeu A. L., Boada J., Gordoa A. (2019). The first estimates of species compositions of Spanish marine recreational fishing reveal the activity’s inner and geographical variability. Fish. Res. 216, 65–73. doi: 10.1016/j.fishres.2019.03.025
EU (2001). Council regulation (EC) no. 1639/2001 of 25 July 2001 establishing the minimum and extended community programmes for the collection of data in the fisheries sector and laying down detailed rules for the application of council regulation (EC) no. 1543/20. Off. J. Eur. Union. L 222 p.53–115
EU (2008a). Commission decision of 6 November 2008 adopting a multiannual community programme pursuant to council regulation (EC) no 199/2008 establishing a community framework for the collection, management and use of data in the fisheries sector and support for scientific advice regarding the Common Fisheries Policy. Off. J. Eur. Union L 60 5.3.2008, p. 1–12
EU (2008b). Directive 2008/56/EC of the European parliament and of the council of 17 June 2008 establishing a framework for community action in the field of marine environmental policy (Marine strategy framework directive). Off. J. Eur. Union. L 164 p.19–40
EU (2010). Commission decision of 18 December 2009 adopting a multiannual community programme for the collection, management and use of data in the fisheries sector for the period 2011–2013. Off. J. Eur. Union. L 41, p.8–71
EU (2011). Commission implementing regulation (EU) no 404/2011 of 8 April 2011 laying down detailed rules for the implementation of council regulation (EC) no 1224/2009 establishing a community control system for ensuring compliance with the rules of the common fish. Off. J. Eur. Union. L 112, p.1–153.
EU (2013). Regulation (EU) no 1380/2013 of the European parliament and of the council, on the common fisheries policy, amending council regulations (EC) no 1954/2003 and (EC) no 1224/2009 and repealing council regulations (EC) no 2371/2002 and (EC) no 639/2004 and Council Decision 2004/585/EC. Off. J. Eur. Union. L 354, p.22–61
EU (2014). Directive 2014/89/EU of the European parliament and of the council of 23 July 2014 establishing a framework for maritime spatial planning. Off. J. Eur. Union, L 257, p.135–145.
EU (2016). Commission implementing decision (EU) 2016/1251 of 12. July 2016 adopting a multiannual union programme for the collection, management and use of data in the fisheries and aquaculture sectors for the period 2017-2019 (European Union). Off. J. Eur. Union L 207, p.113–177.
EU (2021). Commission delegated decision (EU) 2021/1167 of 27 April 2021 establishing the multiannual union programme for the collection and management of biological, environmental, technical and socioeconomic data in the fisheries and aquaculture sectors from 2022 (European Union). Off. J. Eur. Union, L 253, p.51–90.
FAO (2022). Rreport from the commission to the European parliament and the council outlining the progress made in implementing directive 2014/89/EU establishing a framework for maritime spatial planning (Brussels:Aquatic Science and Fisheries Abstracts (ASFA)), 19pp.
Eusko Jaurlaritza (2000). 198/2000 DEKRETUA, urriaren 3koa, itsasoko kirol arrantzaren arautegia onartzeko dena (Basque Country: Eusko Jaurlaritza (EJ-GV).
FAO (2012). “Recreational fisheries,” in FAO technical guidelines for responsible fisheries. no. 13 (Rome: Food and Agriculture Organization of the United Nations (FAO)).
Freire K. M. F., Belhabib D., Espedido J. C., Hood L., Kleisner K. M., Lam V. W. L., et al. (2020). Estimating global catches of marine recreational fisheries. Front. Mar. Sci. 7. doi: 10.3389/fmars.2020.00012
García-Flórez L., Alcázar-Álvarez J. L., Fernández-Rueda M. P., Mortera-Piorno H., Apilánez-Piniella I. (2012). Caracterización de la pesca marítima de recreo en el principado de asturias. gobierno del principado de asturias. Chapter 1. Asturias, Spain: Report from Centro de Experimentación Pesquera, 71pp
González-Álvarez J., García-de-la-Fuente L., García-Flórez L., Fernández-Rueda M., del P., Luis Alcázar-Álvarez J. (2016). Identification and characterization of m&eacute;tiers in multi-species artisanal fisheries. a case study in Northwest Spain. Nat. Resour. 07, 295–314. doi: 10.4236/nr.2016.76026
Gordoa A., Dedeu A. L., Boada J. (2019). Recreational fishing in Spain: First national estimates of fisher population size, fishing activity and fisher social profile. Fish. Res. 211, 1–12. doi: 10.1016/j.fishres.2018.10.026
Herfault J., Levrel H., Thebaud O., Veron G. (2013). The nationwide assessment of marine recreational fishing: A French example. Ocean. Coast. Manage. 78, 121–131. doi: 10.1016/j.ocecoaman.2013.02.026
Hyder K., Maravelias C. D., Kraan M., Radford Z., Prellezo R. (2020). Marine recreational fisheries — current state and future opportunities. ICES. J. Mar. Sci. 77, 2171–2180. doi: 10.1093/icesjms/fsaa147
Hyder K., Radford Z., Prellezo R., Weltersbach M. S., Lewin W.-C., Zarauz L., et al. (2017a). Research for PECH committee - marine recreational and semi-subsistence fishing - its value and its impact on fish stocks. Eur. Parliam. Policy Departm. Struct. Cohes. Polic. Brussels. 140pp. doi: 10.2861/277908
Hyder K., Weltersbach M. S., Armstrong M., Ferter K., Townhill B., Ahvonen A., et al. (2017b). Recreational sea fishing in Europe in a global context-participation rates, fishing effort, expenditure, and implications for monitoring and assessment. Fish. Fish. 19, 225–243. doi: 10.1111/faf.12251
ICES (2012). Report of the second workshop on practical implementation of statistical sound catch sampling programmes, 6 - 9 November (Copenhagen, Denmark:ACOM 52), 72pp
ICES (2020). Working Group on Recreational Fisheries Surveys (WGRFS; outputs from 2019 meeting). ICES Scientific Reports vol. 2 ICES:Copenhagen, Denmark, 86pp
Lewin W.-C., Weltersbach M. S., Ferter K., Hyder K., Mugerza E., Prellezo R., et al. (2019). Potential environmental impacts of recreational fishing on marine fish stocks and ecosystems. Rev. Fish. Sci. Aquac. 27, 287–330. doi: 10.1080/23308249.2019.1586829
Lloret J., Cowx I. G., Cabral H., Castro M., Font T., Gonçalves J. M. S., et al. (2018). Small-scale coastal fisheries in European seas are not what they were: Ecological, social and economic changes. Mar. Policy 98, 176–186. doi: 10.1016/j.marpol.2016.11.007
Lloret J., Zaragoza N., Caballero D., Font T., Casadevall M., Riera V. (2008a). Spearfishing pressure on fish communities in rocky coastal habitats in a Mediterranean marine protected area. Fish. Res. 94, 84–91. doi: 10.1016/j.fishres.2008.07.002
Lloret J., Zaragoza N., Caballero D., Riera V. (2008b). Biological and socioeconomic implications of recreational boat fishing for the management of fishery resources in the marine reserve of cap de creus (NW Mediterranean). Fish. Res. 91, 252–259. doi: 10.1016/j.fishres.2007.12.002
Lumley T. (2011). Complex surveys: A guide to analysis using r 16th Edition (Harvard, Boston, USA:Wiley), 296pp.
Morales-Nin B., Moranta J., García C., Tugores M. P., Grau A. M., Riera F., et al. (2005). The recreational fishery off Majorca island (western mediterranean): some implications for coastal resource management. ICES. J. Mar. Sci. 62, 727–739. doi: 10.1016/j.icesjms.2005.01.022
National Research Council (2006). Review of recreational fisheries survey methods (Washington, D.C: National Academies Press). doi: 10.17226/11616
Palas S., Villasante S., Pita P. (2017). Combining fishers’ knowledge and cost-effective monitoring tools in the management of marine recreational fisheries: A case study of the squid and cuttlefish fishery of the ría of vigo (NW Spain). Fish. Manage. Ecol. 24, 469–477. doi: 10.1111/fme.12255
Papadopoulos A., Touloumis K., Tziolas E., Boulamatsis D., Koutrakis E. (2022). Evaluation of marine recreational fisheries and their relation to sustainability of fisheries resources in Greece. Sustainability 14, 3824. doi: 10.3390/su14073824
Pascual-Fernández J. J., Chinea-Mederos I., de la Cruz-Modino R. (2015). “Marine protected areas, small-scale commercial versus recreational fishers: Governability challenges in the canary islands, spain,”. 397–412. doi: 10.1007/978-3-319-17034-3_21
Pita P., Alós J., Antelo M., Artetxe I., Biton-Porsmoguer S., Carreño A., et al. (2020). Assessing knowledge gaps and management needs to cope with barriers for environmental, economic, and social sustainability of marine recreational fisheries: The case of Spain. Front. Mar. Sci. 7. doi: 10.3389/fmars.2020.00023
Pita P., Artetxe I., Diogo H., Gomes P., Gordoa A., Hyder K., et al. (2017). Research and management priorities for Atlantic marine recreational fisheries in southern Europe. Mar. Policy 86, 1–8. doi: 10.1016/j.marpol.2017.08.030
Pita P., Freire J. (2016). Assessing the impact of spear fishing by using competitions records and underwater visual censuses. Sci. Mar. 80, 27–38. doi: 10.3989/scimar.04352.15A
Pita P., Hyder K., Gomes P., Pita C., Rangel M., Veiga P., et al. (2018). Economic, social and ecological attributes of marine recreational fisheries in Galicia, Spain. Fish. Res. 208, 58–69. doi: 10.1016/j.fishres.2018.07.014
Radford Z., Hyder K., Zarauz L., Mugerza E., Ferter K., Prellezo R., et al. (2018). The impact of marine recreational fishing on key fish stocks in European waters. PloS One 13, e0201666. doi: 10.1371/journal.pone.0201666
R Core Team (2021) R: A language and environment for statistical computing. Available at: http://www.mendeley.com/research/r-language-environment-statistical-computing-96/%5Cnpapers2://publication/uuid/A1207DAB-22D3-4A04-82FB-D4DD5AD57C28.
Rocklin D., Levrel H., Drogou M., Herfaut J., Veron G. (2014). Combining telephone surveys and fishing catches self-report: The French Sea bass recreational fishery assessment. PloS One 9, e87271. doi: 10.1371/journal.pone.0087271
Ruiz J., Zarauz L., Urtizberea A., Andonegi E., Mugerza E., Artetxe I. (2014). Establecimiento de un sistema de recogida sistemática de datos sobre pesca recreativa.
Sbragaglia V., Arlinghaus R., Blumstein D., Coll M., Dedeu A., Diogo H., et al. (2021). Spearing into the future: a global review of marine recreational spearfishing. EcoEvoRxiv. Prepr., 44pp doi: 10.32942/osf.io/f5whn
Skov C., Hyder K., Gundelund C., Ahvonen A., Baudrier J., Borch T., et al. (2021). Expert opinion on using angler smartphone apps to inform marine fisheries management: status, prospects, and needs. ICES. J. Mar. Sci. 78, 967–978. doi: 10.1093/icesjms/fsaa243
Solow A. R., Smith W. K. (2010). On predicting abundance from occupancy. Am. Nat. 176, 96–98. doi: 10.1086/653077
Stoklosa J., Blakey R. V., Hui F. K. C. (2022). An overview of modern applications of negative binomial modelling in ecology and biodiversity. Diversity 14, 320. doi: 10.3390/d14050320
Tarrant M. A., Manfredo M. (1993). Digit preference, recall bias, and nonresponse bias in self reports of angling participation. Leis. Sci. 15, 231–238. doi: 10.1080/01490409309513202
Tarrant M. A., Manfredo M., Bayley P. B., Hess R. (1993). Effects of recall bias and nonresponse bias on self-report estimates of angling participation. North Am. J. Fish. Manage. 13, 217–222. doi: 10.1577/1548-8675(1993)013<0217:EORBAN>2.3.CO;2
Taylor S. M., Webley J. A. C., Mayer D. G. (2011). Improving the precision of recreational fishing harvest estimates using two-part conditional general linear models. Fish. Res. 110, 408–414. doi: 10.1016/j.fishres.2011.05.001
Uriarte A., Lucio P. (2001). Migration of adult mackerel along the Atlantic European shelf edge from a tagging experiment in the south of the bay of Biscay in 1994. Fish. Res. 50, 129–139. doi: 10.1016/S0165-7836(00)00246-0
van der Hammen T., de Graaf M., Lyle J. M. (2016). Estimating catches of marine and freshwater recreational fisheries in the Netherlands using an online panel survey. ICES. J. Mar. Sci. J. Du. Cons. 73, 441–450. doi: 10.1093/icesjms/fsv190
Venables W. N., Ripley B. D. (2002). Modern applied statistics with s. fourth edi (New York: Springer, New York). Available at: http://scholar.google.com/scholar?q=related:29252RNVomwJ:scholar.google.com/&hl=en&num=100&as_sdt=0,5%5Cnpapers2://publication/uuid/E2522B53-755A-48D4-925F-A02094784F2C.
Venturelli P. A., Hyder K., Skov C. (2017). Angler apps as a source of recreational fisheries data: opportunities, challenges and proposed standards. Fish. Fish. 18, 578–595. doi: 10.1111/faf.12189
Vitale G., Dedeu A. L., Pujol M., Sbragaglia V. (2021). Characterizing the profile of recreational fishers who share their catches on social media. Front. Mar. Sci. 8. doi: 10.3389/fmars.2021.768047
Wickham H. (2009). ggplot2: elegant graphics for data analysis (New York, USA.:Springer), 213pp. Available at: http://books.google.com/books?id=rhRqtQAACAAJ&dq=intitle:ggplot2+inauthor:wickham&ie=ISO-8859-1&source=gbs_gdata.
Zarauz L., Ruiz J., Urtizberea A., Andonegi E., Mugerza E., Artetxe I. (2015). Comparing different survey methods to estimate European sea bass recreational catches in the Basque country. ICES. J. Mar. Sci. 72, 1181–1191. doi: 10.1093/icesjms/fsv054
Zeileis A., Kleiber C., Jackman S. (2008). Regression models for count data in r. J. Stat. Software 27 (8), 1–25. doi: 10.18637/jss.v027.i08
Zhang C., Xu B., Xue Y., Ren Y. (2020). Evaluating multispecies survey designs using a joint species distribution model. Aquac. Fish. 5, 156–162. doi: 10.1016/j.aaf.2019.11.002
Zuur A. F., Ieno E. N., Elphick C. S. (2010). A protocol for data exploration to avoid common statistical problems. Methods Ecol. Evol. 1, 3–14. doi: 10.1111/j.2041-210X.2009.00001.x
Keywords: MRF, off-site surveys, fisher’s profile, target species, catch estimates, unreported catches, fishing interactions
Citation: Bachiller E, Korta M, Mateo M, Mugerza E and Zarauz L (2022) Assessing the unassessed marine recreational fishery in the Eastern Cantabrian coast. Front. Mar. Sci. 9:975089. doi: 10.3389/fmars.2022.975089
Received: 21 June 2022; Accepted: 27 July 2022;
Published: 24 August 2022.
Edited by:
Pablo Pita, University of Santiago de Compostela, SpainReviewed by:
Sophia Kochalski, University of Santiago de Compostela, SpainTommaso Russo, University of Rome Tor Vergata, Italy
Copyright © 2022 Bachiller, Korta, Mateo, Mugerza and Zarauz. This is an open-access article distributed under the terms of the Creative Commons Attribution License (CC BY). The use, distribution or reproduction in other forums is permitted, provided the original author(s) and the copyright owner(s) are credited and that the original publication in this journal is cited, in accordance with accepted academic practice. No use, distribution or reproduction is permitted which does not comply with these terms.
*Correspondence: Eneko Bachiller, ZWJhY2hpbGxlckBhenRpLmVz
†These authors have contributed equally to this work and share senior authorship