 Nicole K. Hayes
 Charles J. Walton
 David S. Gilliam
- Halmos College of Arts and Sciences, Nova Southeastern University, Dania Beach, FL, United States
A stony coral tissue loss disease (SCTLD) outbreak, first widely reported in 2014 in the Southeast Florida Ecosystem Conservation Area (Coral ECA), has continued to impact stony coral communities for more than seven years. Here, we utilize long-term (2012-2020) annual monitoring data from the Southeast Florida Reef Evaluation and Monitoring Project (SECREMP) to assess the impact of the SCTLD outbreak on the stony coral assemblage as well as spatiotemporal and ecological associated variation. SECREMP examines 22 permanent sites distributed along Florida’s Coral Reef from Miami-Dade County north to Martin County, Florida. We expand upon previously documented disease event-related regional impacts. Coral ECA SCTLD prevalence was greatest in 2016 coinciding with significant declines in coral live tissue area (LTA). Even though by 2018 SCTLD prevalence had dropped to < 1% and significant annual LTA declines were no longer recorded, upwards of 59% of stony coral total LTA in the Coral ECA was lost between 2015-2018. In this study, SCTLD was observed across all habitats and affected 11 stony coral species. Colony size did not preclude infection or mortality, with 25% of all infections occurring on colonies 5-14 cm in diameter. The indiscriminate nature of the disease and lack of size refugia has altered the stony coral population structure and assemblage composition. Since 2016, the coral assemblage has shifted towards smaller colonies, with a significant decrease in mean colony size. Juvenile corals, < 4 cm diameter, of many reef building, structurally-complex species were rarely documented, while eurytopic, generalist species dominated juvenile abundance. Although significant losses, altering ecosystem function, were documented, all species recorded prior to the disease event were present, albeit some only as juveniles. Our study adds to the growing body of evidence of the severity of the disease outbreak and precarious state of the stony coral assemblage in the Coral ECA. We show long-term monitoring projects provide invaluable opportunities to capture such spatiotemporal changes in coral assemblages and may identify potential indicators of recovery. While no stony coral species were completely lost from the monitored assemblage, the likelihood of recovery, to even a pre-outbreak state, is limited without immediate action addressing development related local stressors and climate change related global stressors.
Introduction
Coral disease outbreaks continue to threaten stony coral communities and ecosystem function (Harvell et al., 2002; van Woesik, 2002; Maynard et al., 2015; van Woesik and Randall, 2017). The intensity and frequency of coral disease events has increased during the past few decades, with the Caribbean considered a disease “hot spot” having faced significant impacts from diseases including white band disease on Acroporids and white plague type diseases (Richardson et al., 1998; Aronson and Precht, 2001; Croquer et al., 2003; Richardson and Voss, 2005; Miller et al., 2009; Sokolow, 2009; Hoegh-Guldberg, 2010; Manzello, 2015; van Woesik and Randall, 2017). Coral disease events reduce fecundity, result in both local and regional population declines, and can cause shifts in coral assemblages (Richardson and Voss, 2005; Croquer and Weil, 2009). Within Florida, a rapidly progressing white disease was first widely observed in Miami-Dade and Broward counties in 2014 and spread to other portions of the Southeast Florida Coral Reef Ecosystem Conservation Area (Coral ECA) by fall 2015 (Precht et al., 2016; Walton et al., 2018; Jones et al., 2021). Increased ocean temperatures (Manzello, 2015) followed by coral bleaching were reported in late summer and fall 2014 in the Coral ECA and continued through 2015 (Eakin et al., 2016; van Woesik and McCaffrey, 2017; Walton et al., 2018). By summer 2016, active disease had been reported throughout the Coral ECA, with multiple species having significant declines in density (Walton et al., 2018). This disease has been termed stony coral tissue loss disease (SCTLD) due to gross morphological differences with other documented coral diseases (NOAA Stony Coral Tissue Loss Disease Case Definition, 2018).
SCTLD differs from previously documented white diseases in that lesions may appear in the middle of the colony as opposed to lesions starting at tissue margins or the base of colony; where lesions can be surrounded by bleached tissue and often presents with varying levels of recent tissue necrosis (NOAA Stony Coral Tissue Loss Disease Case Definition, 2018; Landsberg et al., 2020; Aeby et al., 2021). Over 20 species may be susceptible to SCTLD to varying degrees leading to species being categorized as highly susceptible, intermediately susceptible, low susceptible, and presumed susceptible (NOAA Stony Coral Tissue Loss Disease Case Definition, 2018; Dobbelaere et al., 2020). The biotic and abiotic factors contributing to differences in severity of disease and mortality have been examined in multiple studies with reef type, temperature, depth, species composition, colony size, diversity, and density all found to have significant effects (Alvarez-Filip et al., 2019; Gintert et al., 2019; Rippe et al., 2019; Meiling et al., 2020; Muller et al., 2020; Costa et al., 2021; Williams et al., 2021). Studies have also examined the microbial community of SCTLD lesions and have identified multiple bacterial taxa enriched in the lesion as well as potential contributors to co-infections and opportunistic pathogens; however a single pathogen or group of pathogens has yet to be conclusively identified (Aeby et al., 2019; Meyer et al., 2019; Rosales et al., 2020; Ushijima et al., 2020; Becker et al., 2021). Additionally, SCTLD has now been documented in multiple locations in the Caribbean. (Alvarez-Filip et al., 2019; Weil et al., 2019; Meiling et al., 2020; Roth et al., 2020; Brandt et al., 2021).
Recovery after disturbance depends on growth of existing corals, coral reproduction, recruitment, and survival. Previous studies have found that coral reproductive output at the colony level is highest when cover is highest at the species level (Hartmann et al., 2017), and low cover after a disturbance event can limit recovery. Bartlett et al. (2017) showed that post-disturbance recruitment was dominated by a few hardy stony coral species and occurred in higher abundance at low-disturbance sites. Additionally, decreased colony size leads to reduced reproductive output, in turn limiting the likelihood of recovery (Connell, 1973; Szmant-Froelich, 1985; Tsounis et al., 2006). However, although large colonies contribute more to reproductive output, they may face disadvantages for survival. Large coral size has been found to increase the likelihood of extinction during mass extinction events such as the Anthropocene and disease risk was shown to increase with increasing coral size (Ceballos et al., 2017; Caldwell et al., 2018; Dishon et al., 2020; Greene et al., 2020; Guy et al., 2021). Coral colony size metrics also provide insight into past disturbance events and offer predictive power to population development which are a vital tool that can be used to estimate response of coral populations to the environment (Bak and Meesters, 1998). The functional integrity of coral reefs depends on the ability to maintain three-dimensional reef structures, where loss of structure and change in composition limits future capacity to provide habitat and environmental services (Grimsditch et al., 2017; Estrada-Saldivar et al., 2019).
Acute disturbances, chronic stressors, and the high economic value of the Coral ECA’s reefs require long-term monitoring and comprehensive research to define and quantify change, identify threats to the ecosystem, and develop an effective management plan. This study used data from the Southeast Florida Coral Reef Evaluation and Monitoring Project (SECREMP), a long-term monitoring project established in 2003 to monitor status and trends in the Coral ECA. The Coral ECA reefs span Miami-Dade, Broward, Palm Beach, and Martin Counties, which exist within 3 km of a highly urbanized and developed mainland. Florida reef related tourism generates $5.5 billion in sales each year, while increased risk of flood caused by the degradation of Florida’s coral reef is estimated at $823 million (Gibson et al., 2008; Storlazzi et al., 2019; Storlazzi et al., 2021). The population of the four counties adjacent to the Coral ECA is greater than 6 million people and is expected to increase to 7.5 million people by 2040 (Acevedo, 2017). Large, adjacent populations lead to increased pollution, sedimentation, and coastal development further increasing stressors on the reef tract. Additionally, commercial and recreational fishing activities, marine construction (e.g., dredging and port expansion), sewage outfalls, and ship groundings directly impact the Coral ECA. The impacts of these stressors on the Coral ECA reef system are expected to continue increasing in the face of human population growth and global climate change (Hughes et al., 2018).
In this study, SECREMP stony coral assemblage data collected between 2012 and 2020 were analyzed to determine the impact and extent of the SCTLD outbreak and assess the potential of recovery from this event. The specific objectives of this study were 1) to further evaluate the spatial and temporal extent of the SCTLD outbreak, 2) quantify regional loss of stony coral live tissue area and potential biotic and abiotic drivers of tissue loss, 3) assess changes in colony size distribution, and 4) quantify the abundance and composition of juveniles (< 4 cm diameter).
Methods
Coral demographic surveys
To evaluate the impact of the SCTLD outbreak event in the Coral ECA, stony coral density and demographic data from 22 SECREMP sites were analyzed. These 22 sites are located along the northernmost portion of Florida’s Coral Reef (FCR) ranging from Miami-Dade County in the south to Martin County in the north, encompassing multiple reef habitats. Within the Coral ECA, reefs consist of linear reef terraces running parallel to shore within 3 km, cresting in depth from 3 m (nearshore ridge complex) to 21 m (outer reef) (Banks et al., 2007; Walker et al., 2008). For an extensive description of locations, habitats and map of sites, please see Gilliam et al. (2021). Each site consists of four, 1 m x 22 m transects demarcated by permanently installed stainless steel pins. Annual stony coral demographic surveys were conducted during the summer months (May – September) from 2012 to 2020 with all stony corals ≥ 4 cm diameter identified to species. Maximum colony diameter and height (defined as the measurement perpendicular to the plane of growth) were recorded along with any visual signs of bleaching, disease, or other conditions (i.e., predation, overgrowth interactions, boring sponges, etc.).
Site disease prevalence was determined separately for SCTLD and all other diseases were combined to determine ‘other’ disease prevalence. Other diseases included black band disease, yellow band disease, white band disease (for Acroporids), and dark spot disease. Percent total (recent + old) colony mortality was also assessed. Recent mortality was defined as tissue loss with clearly distinguishable corallite structure and minimal overgrowth by algae or other fouling organisms. Any areas of colony mortality that did not meet these criteria were defined as old mortality. SCTLD was visually assessed as tissue loss lesions that either start on the edge of the colony and progress upwards or lesions that begin as patches or blotches within intact tissue (NOAA Stony Coral Tissue Loss Disease Case Definition, 2018). As there is no definitive way to differentiate between white tissue loss diseases in situ, all diseases with this visual presentation were classified as SCTLD. Colonies with disease margins not consistent with white plague (Richardson et al., 1998) were recorded as ‘white syndrome’ previous to the release of the NOAA Stony Coral Tissue Loss Disease Case Definition (2018) and were re-classified as SCTLD based on the described disease morphology. Additionally, to better understand potential recovery after a disease event, a survey of smaller coral colony sizes was added to the protocol. Beginning in 2018, juvenile colonies, those visible to the naked eye and < 4 cm diameter, were identified to the lowest taxonomic level and tallied across all sites.
Statistical analyses
Differences in disease prevalence, maximum colony diameter, and coral live tissue area (LTA) were analyzed at the regional level, where regional values were calculated using data from all transects. The metric, LTA, was utilized to capture the loss of coral tissue that occurred without whole colony mortality and is presented as mean per station, where individual coral LTA was calculated, summed across each transect and averaged across the four transects. This metric is especially useful because disease often causes partial colony mortality and is therefore a more sensitive method for detecting change in the stony coral assemblage. Colony surface areas were calculated from colony height and diameter using a modified version of Knud Thomsen approximation for the surface area of an ellipsoid, and then total colony mortality (old + recent) was used with colony surface area to calculate LTA as described in Walton et al. (2018). All data are presented as mean ± standard error (SE) per station unless otherwise noted; all statistical analyses were performed in R and RStudio (version 1.3.1093) (R Core Team, 2020; RStudio Team, 2020). Site BCA is a targeted Acropora cervicornis patch. No A. cervicornis colony data is collected in situ, instead A. cervicornis data is collected from benthic images; however, all other species have colony data collected. For consistency with Walton et al. (2018), in this study only non- A. cervicornis colonies at BCA were included in the regional disease prevalence and LTA analyses.
To evaluate regional differences, disease prevalence (total, SCTLD and other), maximum colony diameter, and colony LTA were analyzed using linear mixed-effects models (LMM) in the nlme package (Pinheiro et al., 2017). Year was set as a categorical fixed effect in these models with disease prevalence, maximum diameter, or LTA as the response variables. Change in colony maximum diameter was additionally examined based on disease susceptibility by grouping the species into SCTLD high-intermediate susceptibility, low susceptibility, and presumed susceptibility. Linear mixed-effects models were then used on each grouping, where year was set as a categorical fixed effect in these models with maximum diameter as the response variable. The high-intermediate susceptibility group included all species classified as ‘highly susceptible’ or ‘intermediately susceptible’ in the SCTLD case definition (NOAA Stony Coral Tissue Loss Disease Case Definition, 2018). Low susceptibility comprised those species defined as ‘low susceptible species’, and presumed susceptibility included those defined as ‘presumed susceptible but insufficient data to categorize onset’ (NOAA Stony Coral Tissue Loss Disease Case Definition, 2018). Species level LTA were examined using Linear Mixed-effect Models with year as a fixed effect. Due to difficulties in field identification or historical grouping, all Agaricia spp., Orbicella spp., Scolymia spp., and Siderastrea spp. were grouped by genera; therefore, reported differences were for these complexes not individual species. For all regional models, station was nested within site as a random effect. For all models, if significant effects were found, a Tukey’s post hoc analysis was performed using the glht (general linear hypothesis) function in the multcomp package (Hothorn et al., 2008).
Potential spatiotemporal, environmental, and ecological drivers of coral LTA were analyzed using Generalized Linear Mixed-effects Models (GLMM). The model was fitted to assess whether coral LTA varied significantly over space and time and if coral diversity and in situ benthic temperature metrics were associated with the variation. One site, Palm Beach County 1 (PB1), presented many outliers in LTA distribution and was excluded from the GLMM models. PB1 experienced periods of sand burial, which was atypical of the remaining SECREMP sites. The glmmTMB function in the glmmTMB package (Brooks et al., 2017) was used to fit the model using a tweedie family function. The hierarchical data structure was accounted for by nesting the station within the random effect, site. The model included sample year, sub-region (county), and reef habitat as fixed categorical predictors, the 11 continuous predictors in Table 1, and the random intercept of station nested within site (Equation 1). All temperature variables were calculated using in situ benthic temperature data that has been collected at all SECREMP sites since 2007. Heat stress duration was defined as the number of days where the average daily in situ temperature at an individual site exceeded the maximum summer mean by ≥ 1°C. SCTLD susceptible species density was calculated using the species defined as highly or intermediately susceptible by NOAA Stony Coral Tissue Loss Disease Case Definition, (2018).
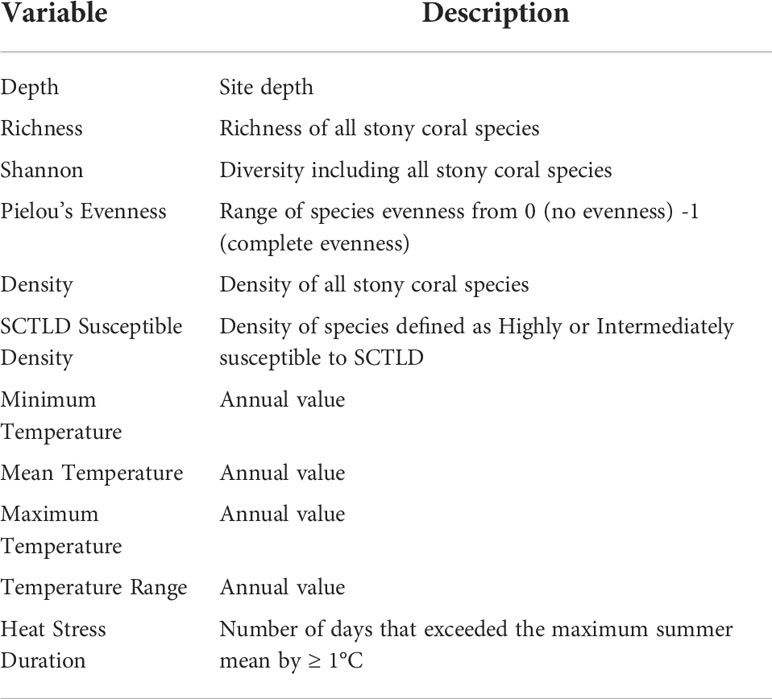
Table 1 Continuous variables used as predictors in the models and their descriptions.
Models were tested for multicollinearity by calculating the variance inflation factor (VIF) using the check_collinearity function in the performance package (Lüdecke et al., 2020). Minimum temperature, maximum temperature, temperature range, and depth exhibited high collinearity and were therefore removed from all models. Remaining candidate models were evaluated using a backward stepwise approach to select the minimum adequate model using Akaike Information Criterion (AIC). The minimum adequate model was determined as the model with the lowest AIC. If any models had an AIC within two, the simplest model was selected.
Following model selection, diagnostics and validation of the minimum adequate model were performed using the DHARMa package (Hartig, 2020). The model was tested for uniformity, heterogeneity of dispersion, and outliers. Model validation was performed by plotting fitted residuals against predicted residuals. Temporal autocorrelation was also tested via the testTemporalAutocorrelation function in the DHARMa package (Hartig, 2020). The function emmeans in the emmeans package (Lenth, 2021) was used to perform a post hoc analysis for the fixed categorical predictors in the minimum adequate model. To account for multiple comparisons, p-value corrections were applied via False Discovery Rate (FDR).
To assess species change within sites across time and habitats, an nMDS ordination of the Bray-Curtis dissimilarity matrix was used to provide graphical representation of different species composition using the metaMDS function in the vegan package (Oksanen et al., 2020). A PERMANOVA test using the adonis2 function within the vegan package was performed to investigate the effect of habitat and year as well as the interaction on species composition, where the strata were station nested within site (Oksanen et al., 2020). The pairwise.adonis2 function was used to evaluate significant differences between levels of habitat and time in post hoc test (Martinez Arbizu, 2020). Species associations to different time blocks (2012-2014, 2015-2017, 2018-2020) were evaluated with multi-level pattern analysis using the multipatt function within the indicspecies package (De Caceres and Legendre, 2009). These time blocks represent pre-peak disease (2012-2014), peak disease (2015-2017), and post-peak disease (2018-2020) to better elucidate changes over multiple years instead of between individual years.
To evaluate the change in colony size distribution, continuous yearly size distributions (all sites combined) were analyzed at the regional level, and within susceptibility groups, using k-sample Anderson-Darling tests via the kSamples package (Scholz and Zhu, 2019). Further, two-sample Kolmogorov-Smirnov tests (KS test) were performed post hoc using the ks.test function to determine significant differences between years, regionally and between susceptibility groups (R Core Team, 2020). Due to multiple comparisons, to reduce Type 1 errors, all ks.test p-values were corrected using FDR.
Juvenile density was compared over time (2018-2020) and between habitats using LMM in the nlme package (Pinheiro et al., 2017). Year, habitat, and year-habitat interaction were categorical fixed effects in the model with density as the response. Post hoc pairwise analysis was performed using lsmeans in the lsmeans package (Lenth, 2016). Changes in density within species were then modeled with time as the fixed effect. A Tukey’s post hoc analysis was performed using the glht (general linear hypothesis) function in the multcomp package (Hothorn et al., 2008). For the species analysis, juveniles were identified to the lowest taxonomic level possible in situ, and thus Isophyllia, Mycetophyllia, Oculina, and Pseudodiloria species were grouped by genera. In all models, station was nested within site as a random effect. All figures were generated using packages ggplot2 (Wickham, 2016), afex (Singmann et al., 2021) and dotwhisker (Solt and Hu, 2021).
Results
Increased coral disease and regional coral declines
As reported in Walton et al. (2018), regional stony coral disease prevalence (all diseases) increased 12-fold from 2012 (0.26 ± 0.11%) to 2016, peaking at 3.23 ± 0.60% colonies affected. Regional disease prevalence then declined to less than 1% (0.89 ± 0.31%) in 2017 (Figure 1). The increase in disease prevalence was driven by an increase in SCTLD. SCTLD was not observed in 2012 and occurrence of colonies with disease margins consistent with SCTLD increased every year from 2013 to 2016 (Figure 1). In 2013, three colonies (two Dichocoenia stokesii and one Porites astreoides) located in two counties (Broward and Miami-Dade) and on two different reef habitats (nearshore ridge complex (NRC) and the inner reef) visually presented tissue necrosis consistent with SCTLD (Table 2). By 2014, SCTLD prevalence had increased 8-fold (2013: 0.08 ± 0.05%; 2014: 0.82 ± 0.32%) and was recorded on six species in three different counties and habitats (Table 2). Regional SCTLD prevalence continued to increase in 2015 and by 2016 was 2.48 ± 0.57%, which was significantly higher than all other years (p < 0.01, LMM). By 2016, SCTLD was recorded on 11 of the 27 species recorded during the study, in all counties within the Coral ECA, and on all habitat types, demonstrating the wide geographic extent of the disease as well as its indiscriminate effect (Table 2). In 2019, SCTLD prevalence dropped to 0.34 ± 0.22% and was only recorded on Montastraea cavernosa, Orbicella spp. and Solenastrea bournoni; in 2020 SCTLD prevalence dropped to 0.06 ± 0.03% (Table 2). During the study, SCTLD was recorded on colonies ranging from 5 -165 cm in diameter with a mean diameter of 40.51 ± 2.78 cm. Small colonies, 5 -14 cm diameter, represented 25% of all colonies with disease lesions. Other diseases were recorded over the course of this study; however regionally other disease prevalence remained less than 1% for all years, but was significantly elevated in 2016 compared to 2019 and 2020 (p < 0.05, LMM) (Figure 2). Other diseases recorded in this study included black band disease, yellow band disease, dark spot disease, and white band disease.
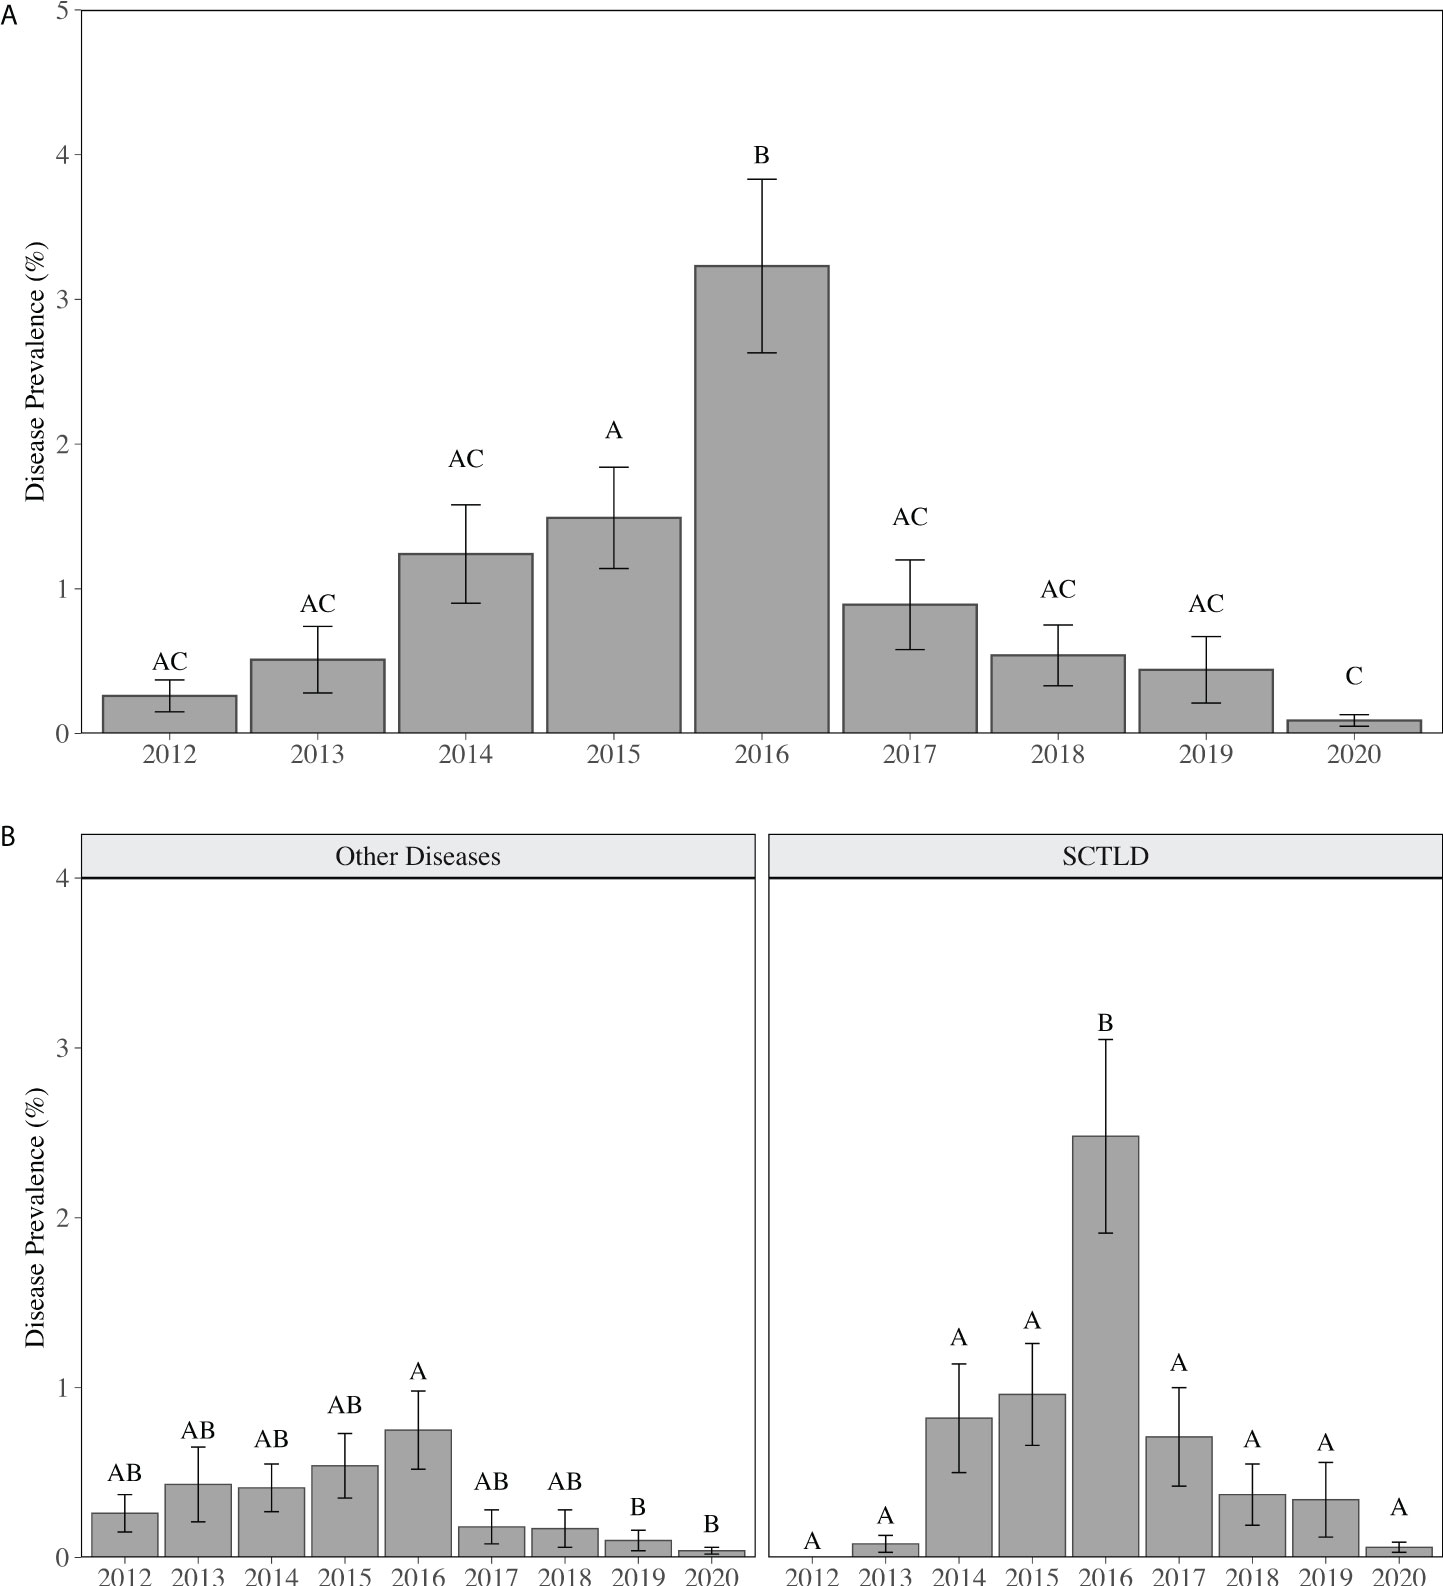
Figure 1 Mean (± SE) annual coral disease prevalence for (A) all diseases combined, (B) other diseases (including black band disease, yellow band disease, white band disease (Acroporids only), and dark spot disease) and disease visually consistent with SCTLD. Different letters above the bars indicate significant differences in disease prevalence between years (p < 0.05, LMM).
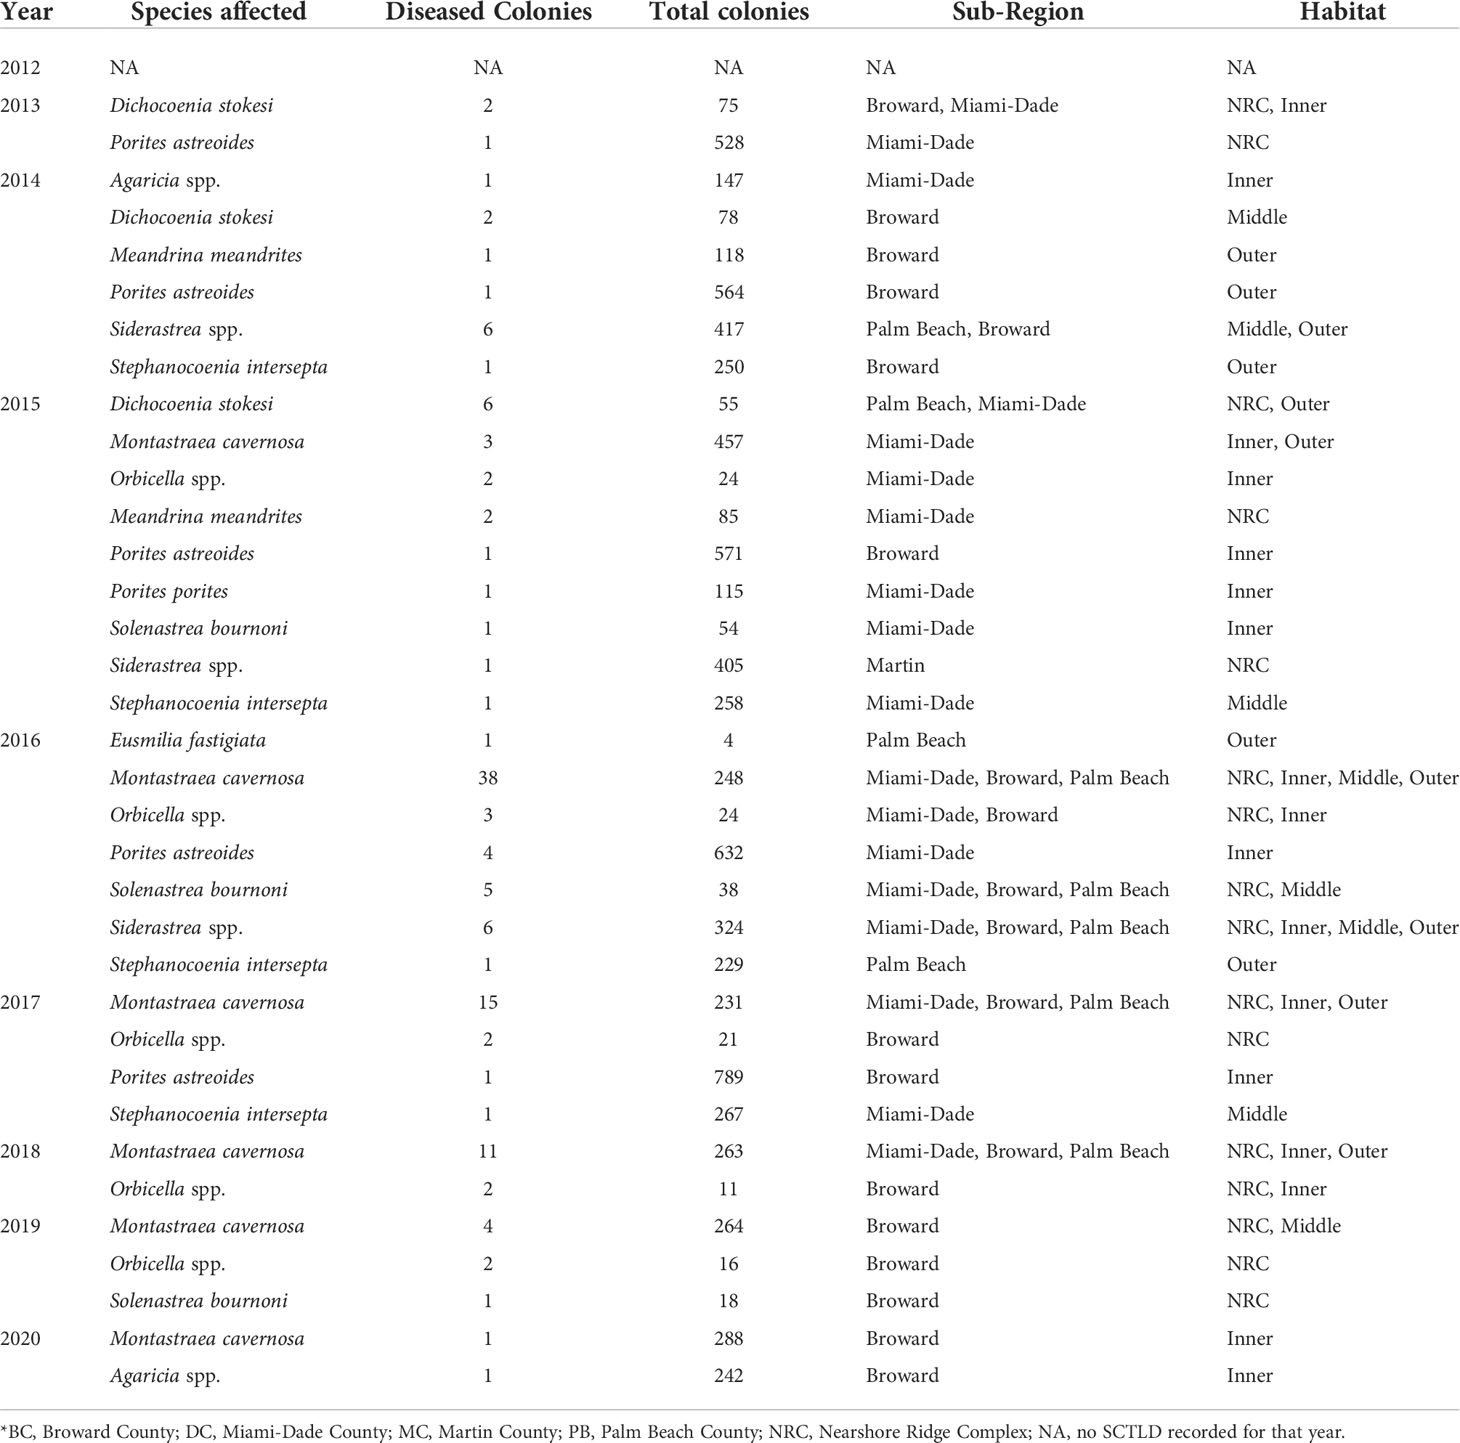
Table 2 Annual abundance of stony coral species (colonies ≥ 4 cm maximum diameter) observed with disease lesions consistent with SCTLD*.
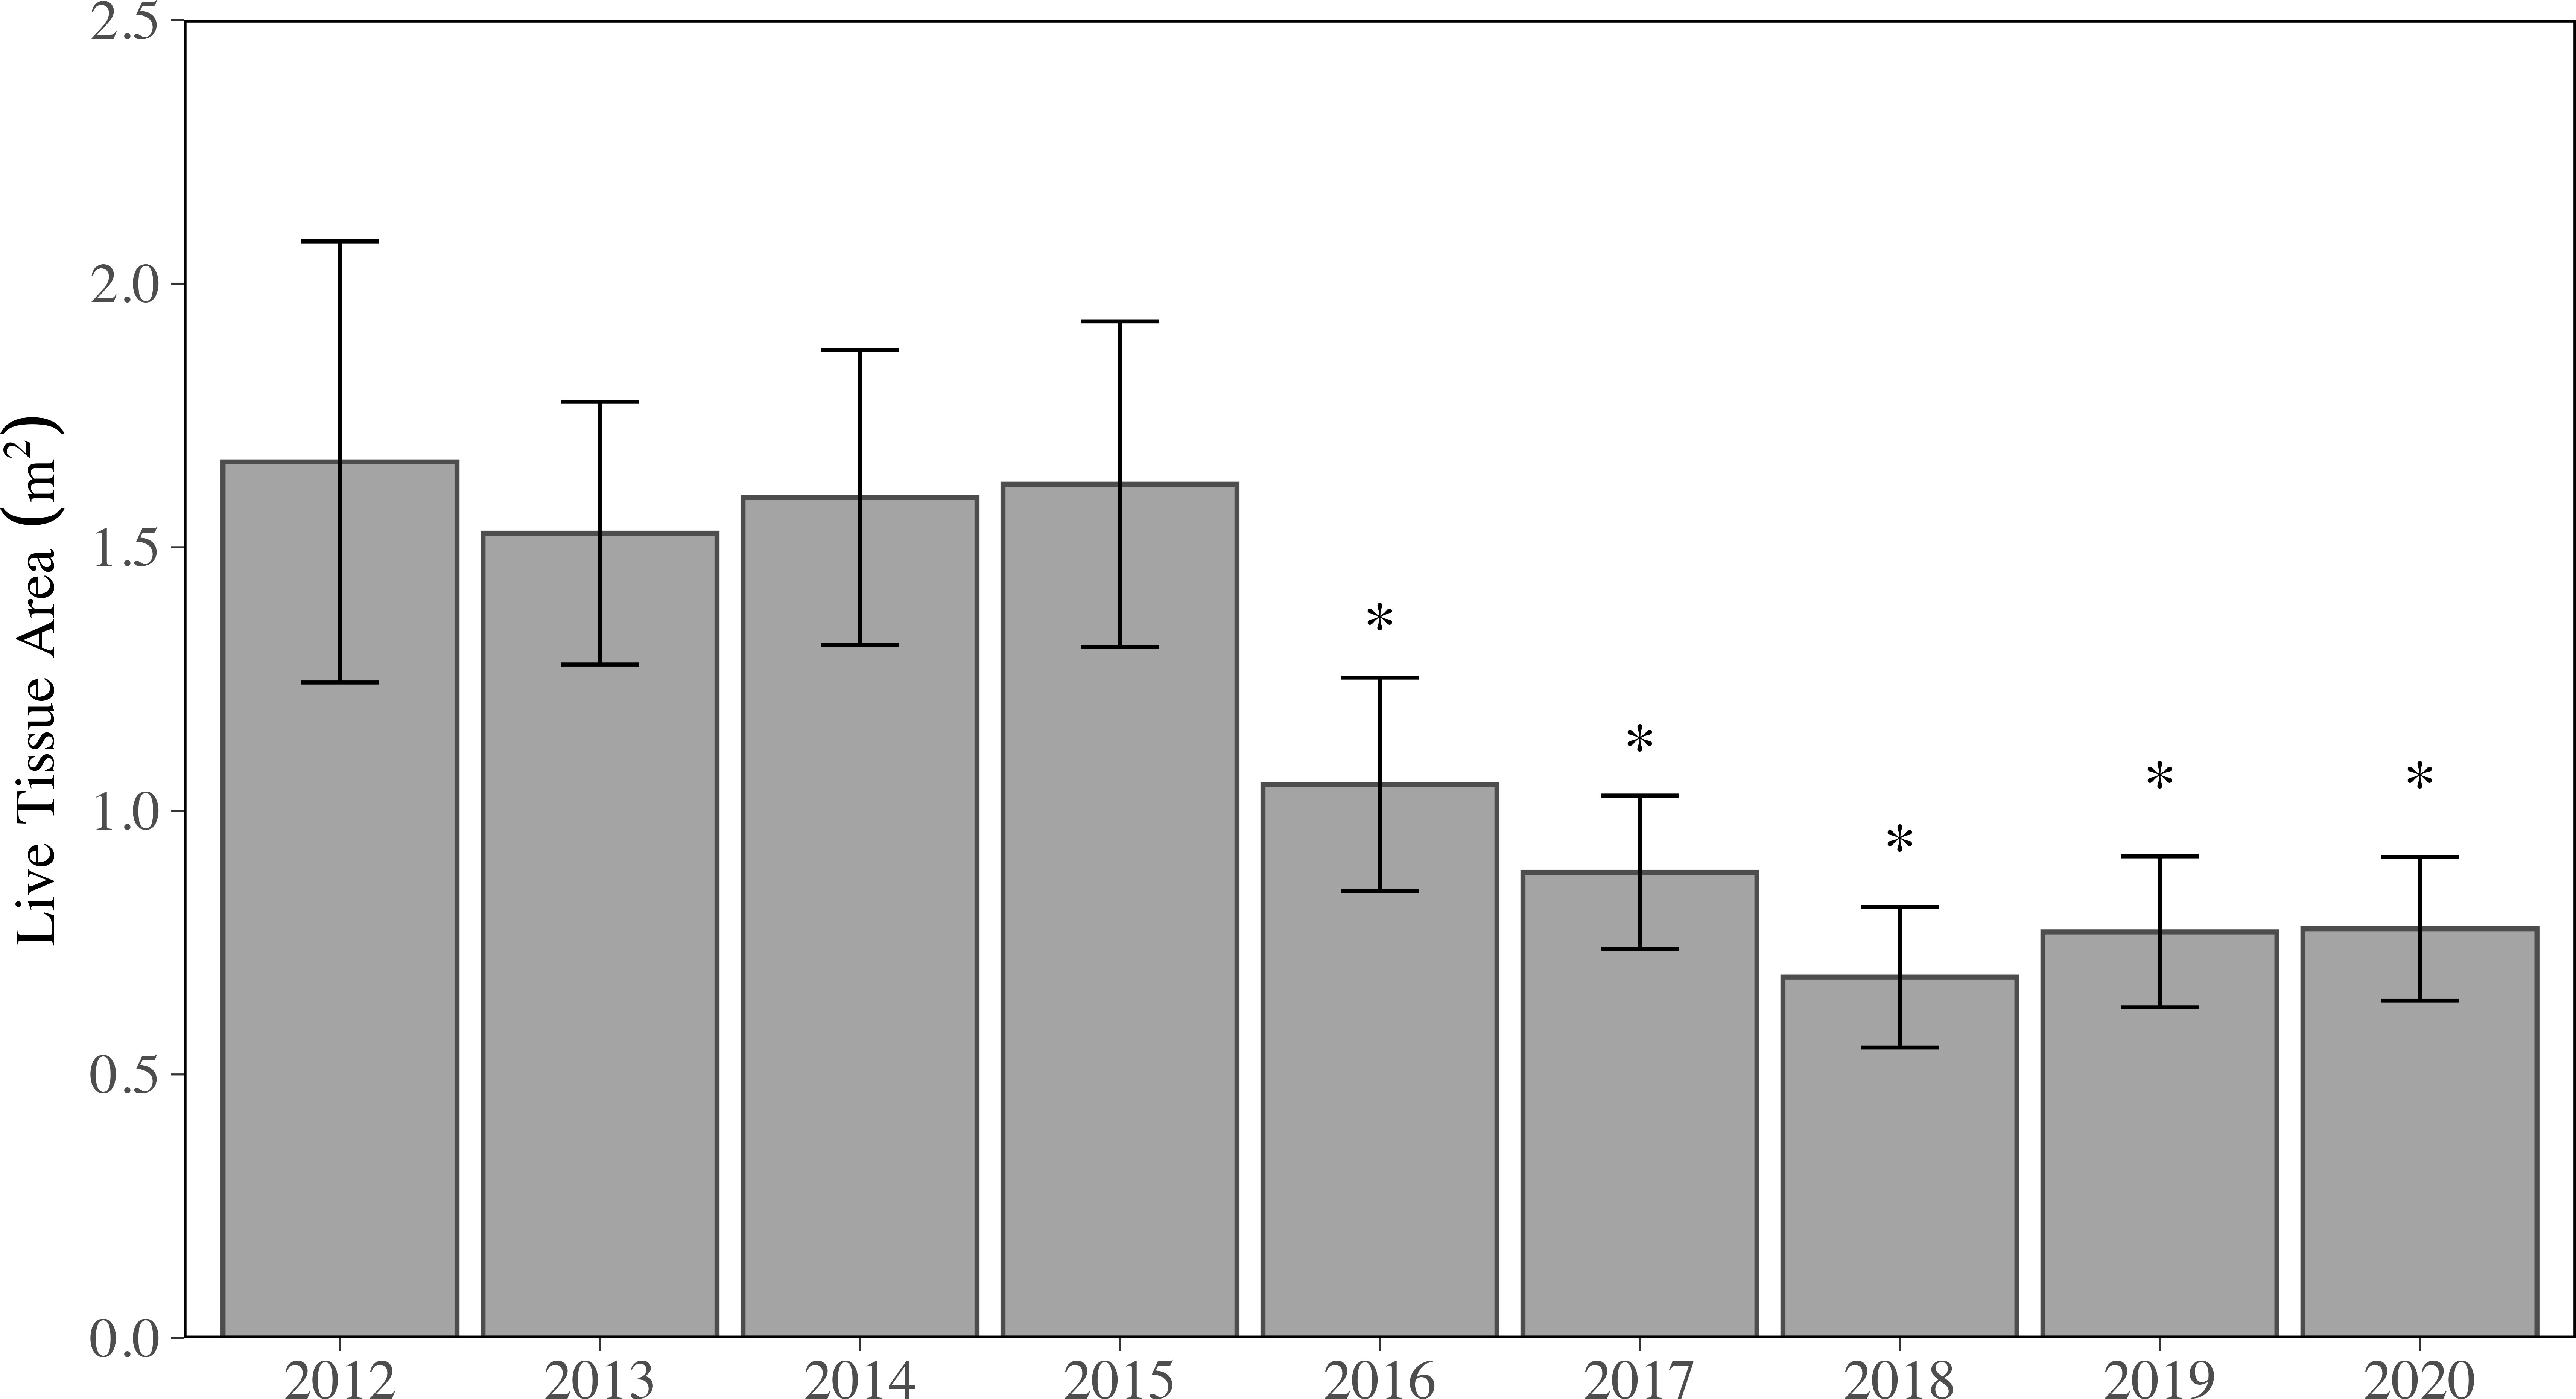
Figure 2 Mean (± SE) annual live tissue area (LTA) for all stony coral species and sites combined. Years with asterisks (*) are significantly different from those without asterisks (*) but are not significantly different from each other (p < 0.05, LMM).
From 2012 to 2015, regional LTA did not significantly change (p > 0.05, LMM), where regional mean LTA ranged from 1.53 ± 0.25 m2 to 1.66 ± 0.42 m2 per station (Figure 2). It should be noted, new sites were added in 2013, which resulted in a slight decline in the regional mean LTA (p > 0.05, LMM). In 2016, regional mean LTA dropped by 35% to 1.05 ± 0.20 m2 per station, which was significantly lower than all previous years (p < 0.05; 2012-2015, LMM). Further declines of LTA were observed in 2017 (0.88 ± 0.15 m2 per station) and reached the minimum over the study period in 2018 (0.68 ± 0.13 m2 per station). When LTA was summed across all sites per year, between 2015 (141.65 m2) and 2018 (58.12 m2), upwards of 59% of all tissue was lost. In 2019, regional mean LTA increased to 0.77 ± 0.14 m2, although not significantly (p > 0.05, LMM); regional mean LTA in 2020 was 0.78 ± 0.14 m2. There was no significant difference in LTA between the years 2016-2020, but all five years were significantly lower (p < 0.05, LMM) than 2012-2015.
Species specific SCTLD effects
While no species affected by SCTLD experienced complete population loss, many species experienced significant LTA changes over the study period. Pseudodiploria clivosa, P. strigosa, D. stokesii, and Meandrina meandrites each lost ≥ 98% of regional LTA during the study period (Supplementary Figure 1A–F). Pseudodiploria clivosa had maximum regional LTA in 2014 with 0.47 ± 0.20 m2 of tissue per station; by 2018, only 0.01 ± 0.01 m2 was observed. For P. clivosa, regional LTA in 2018, 2019, and 2020 was significantly lower than in 2012-2016 (p < 0.01, LMM). Pseudodiploria strigosa had a regional maximum LTA of 0.14 ± 0.07 m2 in 2013 and similar to P. clivosa, by 2018 dropped to < 3% of original tissue area (0.002 ± 0.002 m2) with no significant recovery through 2020 (p < 0.05, LMM). Dichocoenia stokesii regional LTA was greatest in 2013 (0.04 ± 0.01 m2), which was subsequently reduced to half by 2014 (0.02 ± 0.00 m2). By 2016, D. stokesii regional LTA had declined to 0.003 ± 0.00 m2 and remained at or below 0.002 m2 from 2017-2020 (Supplementary Figure 1A–F). Comparably, for M. meandrites the maximum recorded regional LTA was in 2013 (0.17 ± 0.05 m2), which was reduced to < 3.5 cm2 by 2016 (0.0003 ± 0.0002 m2). In 2012, 2013 and 2014, M. meandrites mean LTA was significantly greater than in 2016-2020 (p < 0.05, LMM). Two of the major contributors to overall site LTA and reef structure, M. cavernosa and Orbicella spp., had mean LTA declines of 60% and 87%, respectively (Supplementary Figure 1A–F). Both M. cavernosa (0.96 ± 0.30 m2) and Orbicella spp. (0.67 ± 0.20 m2) reached maximum regional LTA in 2015. Montastraea cavernosa mean LTA declined each subsequent year, with a minimum of 0.38 ± 0.14 m2 in 2019. Orbicella spp. LTA dropped in 2016 to less than half of the previous year (2015: 0.67 ± 0.20 m2, 2016: 0.33 ± 0.09 m2) and then further decreased to a minimum mean LTA in 2018 (0.09 ± 0.04 m2). The only species to have significant increases in LTA were Porites astreoides and Porites porites (Supplementary Figure 1A–F, p < 0.001). Porites astreoides LTA was significantly higher in 2013-2020 than in 2012 (p < 0.05, LMM). Although not significant P. astreoides LTA increased by 43% from 2013 (0.15 ± 0.03 m2) to 2019 (0.22 ± 0.04 m2).
Spatiotemporal LTA associations
As a result of the observed changes to the Coral ECA coral assemblage, GLMMs were used to develop an understanding of the potential drivers of LTA variation during the study period with respect to time, space, temperature, and ecological metrics. These metrics provide insight into the driving factors of changes in coral LTA as the biological variables help explain differences in disease susceptibility between sites and the environmental metrics inform what is driving the change. Coral LTA was positively associated with increasing Shannon diversity, total coral density, and SCTLD susceptible species density, but was negatively associated with increasing Pielou’s evenness (GLMM, , ; Figure 3A; Supplementary Table 1). Following VIF testing, depth was removed from the models as it was highly correlated with habitat. Additionally, mean temperature and heat stress duration were not included in the minimum adequate model, as they were not significantly related to coral LTA and led to higher AIC and a more complex model. In addition to the relationships between coral LTA and the ecological metrics, coral LTA varied with space and time, indicative of environmental variability given conditions change between reef habitats, sub-regions, and over time. Coral LTA varied between habitats, which represents a depth gradient, with the nearshore ridge complex and inner reef having significantly greater LTA than the middle and outer reef (GLMM, , ; Figure 3B). Coral LTA also changed significantly with sample year, independent of habitat (p < 0.05; Figure 3B; Supplementary Table 2). Within each habitat, 2012 – 2015 did not differ significantly from each other but were each significantly different from 2016 – 2020 (GLMM, , ; Supplementary Table 3).
Figure 3 (A) Coefficient estimates (± SE) for the continuous predictors in the minimum adequate generalized linear mixed effects model (GLMM) testing the association of ecological parameters and stony coral live tissue area (LTA). Error bars that do not intersect zero are significant. Points > 0 indicate a positive relationship between the variable and LTA, whereas points < 0 indicate a negative association between the variable and LTA. (B) Results of fixed categorical predictors (year, habitat) in the tweedie GLMM testing the spatiotemporal associations with LTA. The solid shapes indicate the means with the solid lines indicating the 95% within habitat confidence interval. The boxplots represent the raw data, with the solid line indicating the median and the upper and lower ends of the box representing the upper and lower quartiles, respectively. The whiskers extend from the upper or lower quartile to the maximum and minimum values and the dots represent possible outliers. Note the pseudo-log scale on the y-axis to allow visualization of the middle and outer reef data.
To better visualize species changes across years and habitats, an nMDS ordination of the Bray-Curtis dissimilarity matrix was used to provide a graphical representation and identify variables driving dissimilarities in taxonomic composition of the reefs. Significant differences were found between habitats and years, but the interaction between habitat and year was not significant (habitat: p = 0.001, year: p = 0.001, habitat:year: p = 0.998, PERMANOVA). The effect of habitat is greater than that of time, suggesting that the habitats are very different with respect to stony coral composition (habitat R2 = 0.194, year R2 = 0.031). Although habitat was shown to have a significant effect on species composition overall, no habitats were significantly different from each other (p < 0.05, pairwise PERMANOVA). The outer reef and middle reef had relatively high similarity in community composition, while the nearshore ridge complex was the most scattered grouping, intermixing with all other habitat types (Figure 4). There were no significant changes in species composition from 2013 to 2015, but 2016 was significantly different compared to all previous years (p < 0.05, pairwise PERMANOVA). There were no significant changes in composition between 2016 and 2017, but 2018 was significantly different from all other years due to a decrease in species diversity (p > 0.05, pairwise PERMANOVA). Species composition in 2019 and 2020 was significantly different than all previous years, but not between the two years (p < 0.05, pairwise PERMANOVA). Six different indicator species were identified, indicating significant relationships between species abundance and years. Species significantly associated with the year grouping of 2012-2015 were M. meandrites (p = 0.001), D. stokesi (p = 0.001), and M. cavernosa (p = 0.002, multi-level pattern analysis). Pseudodiploria clivosa was significantly associated with years 2012-2017 (p = 0.004), while S. siderea (p = 0.007) was associated with the combination of all years except 2015 – 2017 (multi-level pattern analysis).
Figure 4 Non-metric multidimensional ordination plot (nMDS) based on Bray-Curtis dissimilarity of survey sites representing the overall abundance of stony coral species by habitat and year groupings.
Colony size and distribution changes
The distributions of colony size for all species were significantly impacted, and changes across all sizes were observed (Figure 5). The overall distribution of colony size in 2012 was significantly different than all other years (p < 0.05, KS test); however, 2012 only contains data from 16 sites compared to 21 (2013-2019), which appears to be contributing to the change in size distribution. Colony size distributions did not significantly change from 2013 to 2015 (p > 0.05, KS test); mean colony diameter was unchanged through 2013 (15.93 ± 0.34 cm), 2014 (16.07 ± 0.34 cm) and 2015 (16.12 ± 0.35 cm) (Supplementary Table 4). Beginning in 2016, significant changes in size distributions were observed, and mean diameter significantly decreased to 14.67 ± 0.36 cm (p < 0.05, LMM). The distribution of colony size was significantly different from all other years in 2016 and 2017, and these two years were significantly different from each other (p < 0.05, KS test). From 2015-2017, changes in distribution were driven by the loss of colonies in the middle of the size distribution and a concurrent increase in colonies< 10 cm (Figure 5). Mean colony diameter declined to 12.89 ± 0.28 cm in 2017 and was significantly less than 2012-2016 (p < 0.01, LMM). Mean diameter was further reduced to 10.96 ± 0.24 cm in 2018, which was 32% smaller than in 2015, and remained consistent through 2019 (10.88 ± 0.22 cm), dropping slightly in 2020 (10.25 ± 0.20 cm). For 2018-2020, coral mean diameter was significantly smaller than all previous years (p < 0.05, LMM, Supplementary Table 4). Size distributions in 2018 and 2019 were significantly different than all other years (all p < 0.001, KS test). However, size distributions in 2018 and 2019 were not significantly different from each other, which was the first-time size distribution did not significantly change since 2016. Yet the size distribution in 2020 was significantly different than all other years (p < 0.05, KS test). This change in 2020 was driven by an increase in small colonies into the dataset, rather than a loss of colonies. Although most of the loss appeared to have occurred in the middle of the size range, many of the largest colonies from the dataset were also lost, especially during 2018 and 2019 (Figure 5). The largest 5% of corals (95th percentile) in 2012 were between 52 cm to 185 cm, which remained consistent through 2015, where the top 5% were between 50 cm and 195 cm. By 2018, the 95% percentile range declined to 30 cm to 125 cm. The 95th percentile minimum value, observed in 2020 (26 cm), dropped by 50% compared to 2012 (52 cm).
Figure 5 Colony maximum diameter by year for all species combined. with the y-axis on a Log10 scale. Numbers above the year are the total number of stony coral colonies. The grey areas indicate the kernel density distribution of maximum colony diameter, where the wider the plot is the higher the probability that members of the population will take on that given value and skinnier sections have lower probabilities. The inset boxplots represent the median (solid middle bars), interquartile range (box length), and maximum and minimum values (whiskers) of colony maximum diameter. Data points that fall outside the boxplot are considered outliers. Different letters above the violins indicate significant differences in maximum colony diameter between years (p < 0.05, KS test).
The distribution of colony size for low susceptible species did not significantly change from 2012 to 2015 (p > 0.05, KS test, Figure 6B). During this time, mean diameter did not significantly change (p > 0.05, LMM) and ranged from 12.43 ± 0.46 cm (2012) to 12.03 ± 0.29 cm (2015) (Supplementary Table 4). The regional size distribution in 2016 was significantly different than in 2012 as more small, but ≥ 4 cm, low susceptibility species were observed, contributing to a more even distribution (Figure 6B). The size distribution in 2018-2020 was significantly different than the distributions in 2012-2017 (p < 0.05, KS test) driven by an increase in small colonies. The total number of colonies increased by > 96% from 2013 (634 colonies) to 2020 (1243 colonies; Figure 6B). Mean diameter in 2018 (10.09 ± 0.20 cm) through 2020 (10.16 ± 0.18 cm) was significantly smaller than in 2012-2015 due to this increase (p < 0.05, LMM, Supplementary Table 4). For high-intermediately susceptible species, the size distribution in 2017 was significantly different than 2012-2015, where a decrease across all sizes was observed and proportionally more colonies were lost from the median to maximum of the distribution (p < 0.05, KS test). From 2015 (1406 colonies) to 2016 (917 colonies), already 35% of colonies had been lost. Mean diameter did not significantly change from 2012 to 2016, ranging from 17.87 ± 0.71 cm (2013, min) to 19.23 ± 0.79 cm (2015, max). Mean diameter in 2018 (11.82 ± 0.60 cm), 2019 (11.57 ± 0.65 cm) and 2020 (10.96 ± 0.55 cm) was significantly lower than in 2012-2016 (p < 0.05, LMM, Supplementary Table 4). The distributions in 2018-2020 were significantly different than the distributions in 2012-2017 (p < 0.05, KS test). These significant changes were a result of the loss of colonies in the middle to upper end of the distribution, including many of the largest colonies and an increase in smaller colonies (Figure 6A). Colonies categorized as presumed susceptible exhibited similar patterns of change. The size distributions in 2017, 2019, and 2020 were significantly different than 2012-2015 (p < 0.05, KS test), appearing to be the result of the distribution becoming more even between small and large colonies (Figure 6C). Mean diameter in 2017 (9.23 ± 0.31 cm), 2019 (8.65 ± 0.31 cm), and 2020 (8.76 ± 0.32 cm) was significantly smaller than in 2014 (11.06 ± 0.43 cm) and 2015 (10.81 ± 0.39 cm) (p < 0.05, LMM, Supplementary Table 4).
Figure 6 Colony max diameter from 2012-2020 for stony coral species based on SCTLD susceptibility categorization for (A) high-intermediate susceptible species (B) low susceptible species and (C) presumed susceptible species. Numbers above each year are the total number of stony coral colonies observed belonging the respective susceptibility category. The grey areas indicate the kernel density distribution of maximum colony diameter, where the wider the plot is the higher the probability that members of the population will take on that given value and skinnier sections have lower probabilities. The inset boxplots represent the median (solid middle bars), interquartile range (box length), and maximum and minimum values (whiskers) of colony maximum diameter. Data points that fall outside the boxplot are considered outliers. Different letters above the violins indicate significant differences in maximum colony diameter between years (p < 0.05, KS test).
Juvenile abundance and density
The primary contributing species to juvenile abundance each year were Siderastrea spp. contributing between 881 colonies in 2019 and 1921 colonies in 2020 across 21 sites. Porites astreoides was the next most abundant species, with 393 juveniles in 2020 (302 in 2018, 226 in 2019) followed by M. cavernosa (155 in 2018, 167 in 2019) with 191 in 2020 (Table 3). These three were the most abundant species each year and accounted for 87% of the total juveniles in 2020. Only three species significantly changed in abundance Siderastrea spp., P. astreoides, and P. porites, where abundance was significantly greater in 2020 than at least one of the previous years (p < 0.05, LMM). Some species with colonies documented in the 4 - 10 cm have not had any colonies recorded < 4 cm, including Orbicella spp., Isophyllia spp., and Acropora cervicornis (Table 3). Some species susceptible to SCTLD increased in both juveniles and colonies 4 - 10 cm, including M. meandrites, D. stokesii, M. cavernosa and S. bournoni (Table 3). Pseudodiploria spp. however, had around the same number of 4–10 cm colonies every year (5 - 8 colonies), with the exception of 2015 (3 colonies), and there have not been any large increases in juveniles. Although the abundance of colonies 4 - 10 cm are increasing for many species, overall, between 2013 and 2018, 36% of all colonies > 10 cm were lost (Table 3). Juvenile density significantly varied over time and between habitats where the interaction between habitat and year was also significant (p < 0.001, LMM). The nearshore ridge complex (NRC) in 2018 had significantly higher density than the outer reef (p < 0.05), and the NRC significantly increased in density each year from 2018 - 2020 (p < 0.05). The inner reef and NRC had significantly higher density in 2020 than both the middle and outer reef (p < 0.05).
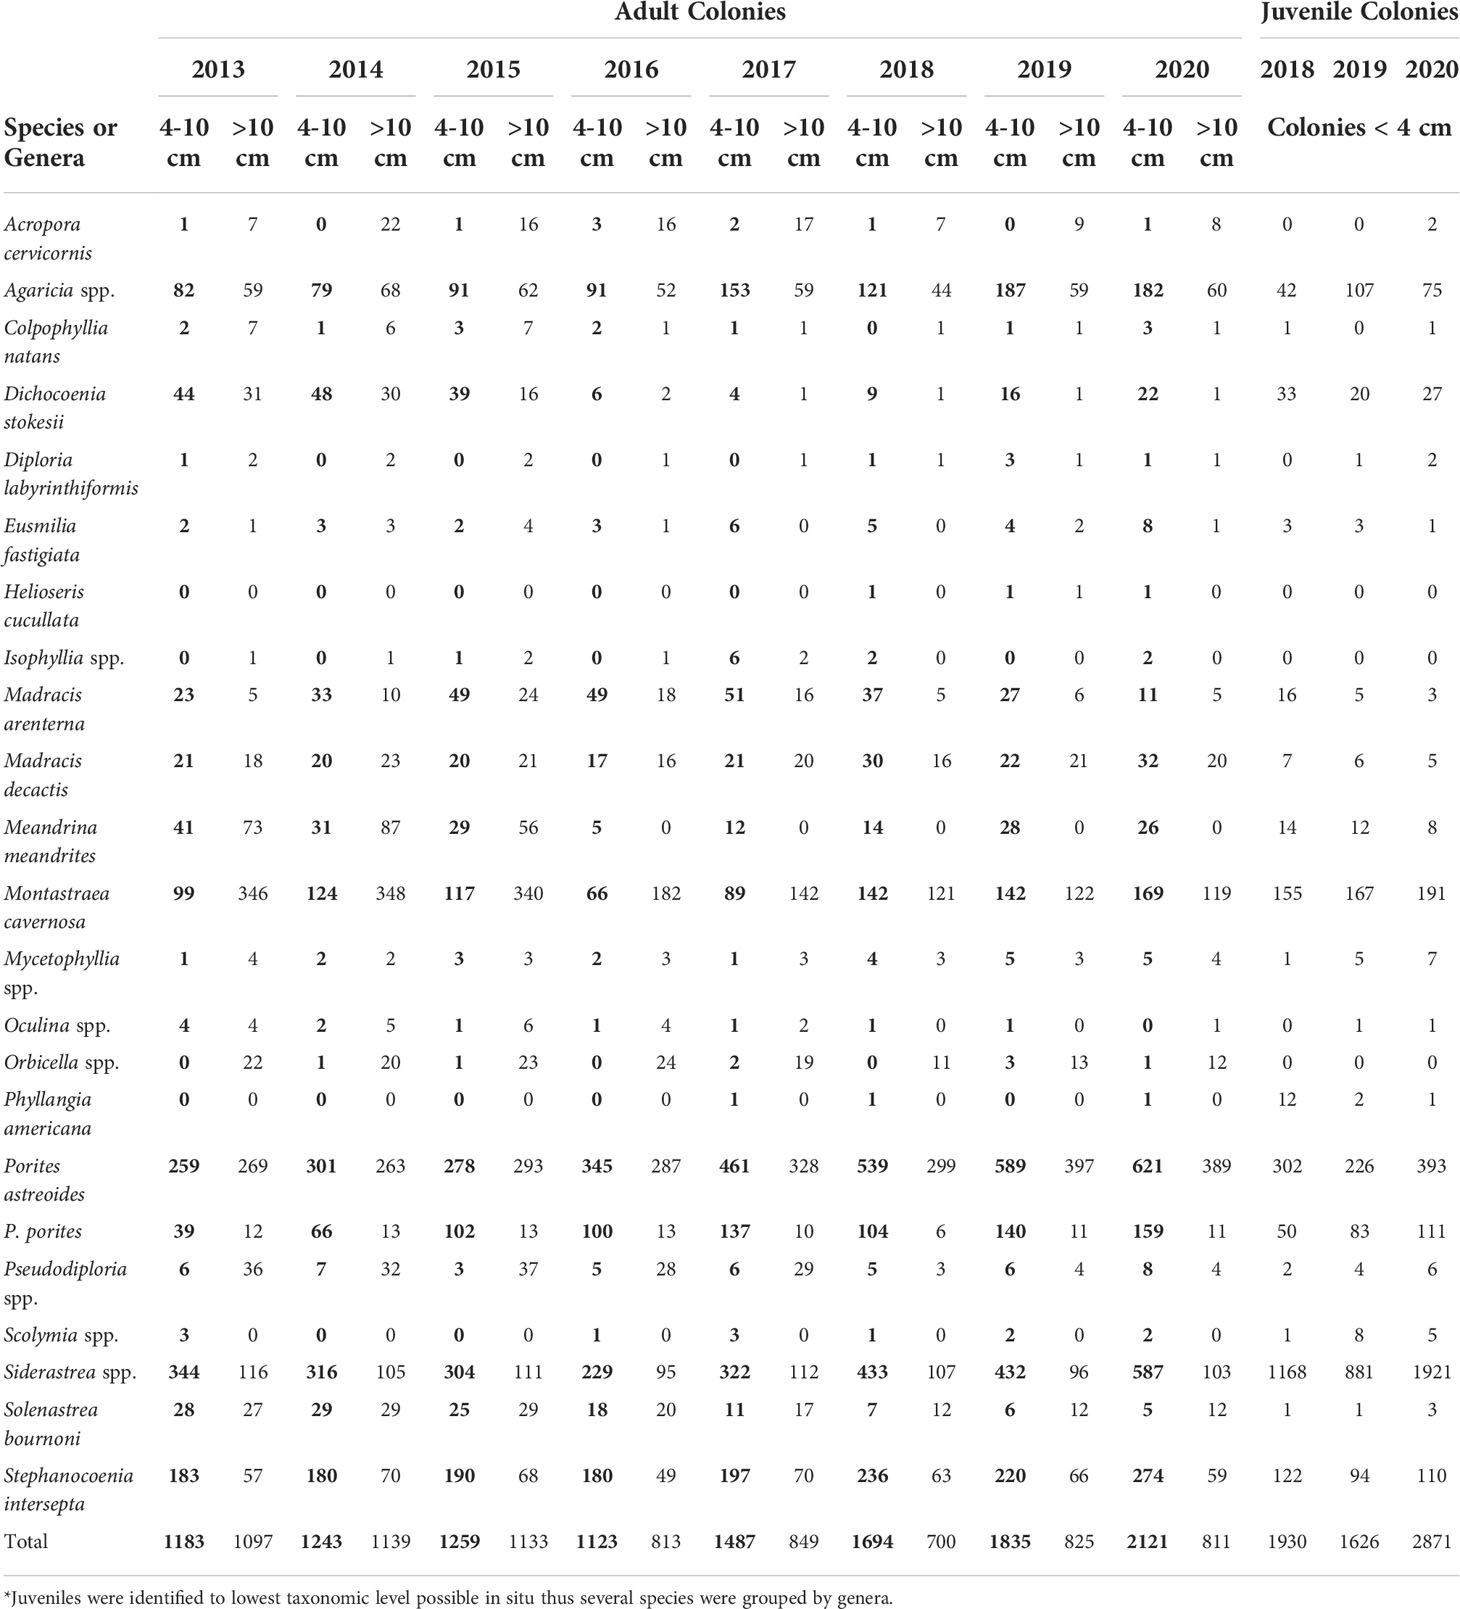
Table 3 Abundance of small adult (bold, 4-10 cm), adult (> 10 cm) and juvenile (< 4 cm) stony corals (classified by maximum colony diameter)*.
Discussion
The Southeast Florida Coral Reef Ecosystem Conservation Area underwent a temporally and geographically unprecedented disease event that resulted in significant changes in the stony coral assemblage, including severe declines in overall stony coral LTA and changes in species composition and population size distributions. Colonies with disease visually consistent with SCTLD were observed in late 2013 and early 2014, and although the exact onset of SCTLD cannot be positively identified, there was evidence of disease prior to the recognized wide-spread outbreak, as seen with Dendrogyra cylindrus in Jones et al. (2021). SCLTD continued and peaked in 2016, with the loss of whole coral colonies and live tissue continuing in 2017 and 2018. Significant disease-related losses were recorded across all counties and on all reef habitats within the Coral ECA. No significant changes in LTA were recorded in 2019 or 2020, and disease prevalence was the lowest recorded for all years, indicating that losses from the disease event may have attenuated. Although some species lost > 98% of living tissue, no species were completely lost from the SECREMP sites. However, these reefs are being increasingly dominated by small, low relief weedy species that contribute minimally to structural complexity. Many of the large, structurally complex species lacked juveniles, while eurytopic generalist species composed more than 87% of all colonies found as juveniles.
In 2013, two D. stokesii colonies had disease lesions visually consistent with SCTLD. By summer of 2014 (June and July), 12 colonies were recorded with SCTLD like lesions and all but one colony was classified as either highly, intermediately or presumed susceptible to SCTLD. The small number of colonies and the similarity of SCTLD to white-plague infections likely allowed the outbreak to go undetected until substantial mortality occurred. Muller et al. (2020) did find significant clustering of SCTLD offshore Broward and Palm Beach Counties in 2014, which is supported by these data. In summer 2014, SCTLD was reported as far north as Palm Beach County on early indicator species, D. stokesii and M. meandrites (NOAA Stony Coral Tissue Loss Disease Case Definition, 2018). Disease prevalence and the number of species affected both increased in 2015 and 2016. In 2015, nine different species and species complexes had SCTLD including the early indicator species (D. stokesii, M. meandrites) and intermediately susceptible species (M. cavernosa, Orbicella spp., S. bournoni, S. intersepta, and Siderastrea spp.) (NOAA Stony Coral Tissue Loss Disease Case Definition, 2018). By 2016, SCTLD prevalence was dominated by infections on intermediately susceptible species, with only one colony (Eusmilia fastigiata) of a highly susceptible species recorded with disease; in 2020, only 2 colonies were recorded with SCTLD lesions. The disease event was indiscriminate, affecting 11 of 27 species and occurred across all habitat types. Although this study only found 11 species with active SCTLD infections, which was consistent with Williams et al. (2021) in the lower Florida Keys, this disease has been shown to impact at least 24 species in the Caribbean (Alvarez-Filip et al., 2019). During the study, small colonies (5-14 cm diameter) represented > 25% of all colonies with disease lesions. Combs et al. (2021) found that rates of tissue loss did not correlate with total colony area, thus due to small size alone, smaller colonies were found to succumb more quickly to SCTLD. Although it has been found that SCTLD disproportionately affects larger colonies (Williams et al., 2021) these data demonstrate small colonies were likely equally prone to infection and were impacted by disease.
By 2015, SCTLD was recorded on all four-habitat types and across all four sub-regions in the Coral ECA. Coral LTA was found to significantly vary between habitat types, with the NRC and inner reef having significantly greater LTA than the middle and outer reef. More disease colonies were identified on the NRC and inner reef (Table 2) compared to the middle and outer reef, however this may be driven by an increase in available tissue to be infected. Spatial analyses have shown that colonies within 1.5 -3 m of a diseased coral were at a higher risk for showing disease signs than those farther away (Williams et al., 2021). Coral LTA was positively associated with SCTLD susceptible species density in addition to overall density, indicating a decline in LTA was due to a decline in susceptible species density, as there is a high density of species that can be affected. This study indicates a different result than Sharp et al. (2020), that found disease transmission was independent of coral density. Additionally, these results suggest, as found by Muller et al. (2020) and Williams et al. (2021), that more diverse reefs were more affected by SCTLD, when LTA loss is used as a proxy for disease effect. Costa et al. (2021) found that in the US Virgin Islands, higher site diversity predicted greater disease prevalence and disease impact. This study found a negative association between LTA and Pielou’s evenness, indicating more evenly distributed sites had lower LTA. Studies have additionally found that deep sites were at a greater risk of disease (Muller et al., 2020) and more severely impacted by disease (Rippe et al., 2019), while both this study and Williams et al. (2021) found a greater impact of disease on shallow nearshore sites. However, it is important to note that both Williams et al. (2021) and Muller et al. (2020) in addition to Costa et al. (2021) qualified the most impacted sites as the most diverse sites, so it is unclear if depth or diversity has a greater impact on disease severity. This difference in disease dynamics may be due to geographical differences between the studies (South Florida vs. the Florida Keys) as suggested by Williams et al. (2021).
Coral disease prevalence has previously been shown to have strong seasonal variations and positive associations with water temperatures; however, SCTLD progression has been shown to negatively correlate with thermal stress, with fewer new cases occurring during the summer months (Meiling et al., 2020; Williams et al., 2021). It was noted in Walton et al. (2018) that anomalously high temperatures coincided with the outbreak. Our current analysis supports Muller et al. (2020), that the high temperatures co-occurred but were not a primary driver of disease. While Meiling et al. (2020) found that accumulated thermal stress may impact lesion progression rates rather than the virulence of possible pathogens, the majority of studies have found that corals with physiological signs of stress (bleaching and paling) were not more susceptible to SCTLD than those without (Alvarez-Filip et al., 2019; Meiling et al., 2020; Estrada-Saldívar et al., 2021; Williams et al., 2021).
Regional SCTLD prevalence declined to < 1% in 2018 - 2020 resulting in the stabilization of regional LTA, and the impact of the disease event to be assessed. Live tissue area and diversity are indicators of reef resilience, which is the ability of the system to recover (Maynard et al., 2017; van Woesik, 2017). Regional mean LTA declined by 59%, which is higher than the loss of cover reported by Jones et al. (2020) in Southeast Florida (43%), Estrada-Saldívar et al. (2021) in Cozumel (46%) and by Williams et al. (2021) in the lower Florida Keys (50%). This may be due to LTA being a more sensitive metric than benthic cover and Southeast Florida has been an endemic zone for SCTLD for a longer period of time. All species exhibiting significant changes in mean LTA are categorized as being either highly susceptible (D. stokesii, M. meandrites, P. clivosa, and P. strigosa) or intermediately susceptible (M. cavernosa and Orbicella spp.) to SCTLD (NOAA Stony Coral Tissue Loss Disease Case Definition, 2018). The species experiencing the greatest loss of LTA were C. natans, D. stokesii, D. labyrinthiformis, M. meandrites, P. strigosa, P. clivosa which each lost ≥ 90% of their regional LTA during the study period (Supplementary Figure 1A–F). Other field studies have identified C. natans, D. stokesii, D. labyrinthiformis, M. meandrites, and P. strigosa as among the most susceptible to SCTLD (Alvarez-Filip et al., 2019; Williams et al., 2021). Two of the major contributors to overall site LTA and reef structure, M. cavernosa and Orbicella spp., had mean LTA declines of 60% and 87%, respectively. Both of these species still had active SCTLD lesions in 2018 and 2019, further supporting that these two species are likely to sustain local SCTLD outbreaks (Williams et al., 2021). However, only one colony of M. cavernosa was recorded with SCTLD in 2020, and no disease lesions have been recorded on any highly susceptible species since 2016, even as small colonies of those species have started to increase in abundance (Table 2). It is unlikely that these colonies demonstrate size refugia, as small colonies were observed with active disease. Current studies show that SCTLD is most likely a waterborne, bacterial infection, also shown to transmit through direct contact (Aeby et al., 2019; Meyer et al., 2019; Sharp et al., 2020; Ushijima et al., 2020; Shilling et al., 2021). However, there is evidence that SCTLD disease dynamics change through time (Aeby et al., 2021). It is unclear if these small, susceptible species colonies have reduced susceptibility or if the environmental conditions have changed, changing the likelihood of a SCTLD infection and allowing for continued growth.
With significant declines, both in LTA and trends toward homogeneity, the reef system in the Coral ECA could face associated shifts in ecosystem function and stability, increased susceptibility to selective pressures, and reduced resilience and adaptability (van Woesik, 2002; van Woesik, 2017). The only species with significant increases in LTA were small, non-reef building, weedy coral species such as P. astreoides and P. porites with a concurrent loss of major reef-building species such as M. cavernosa and Orbicella spp. This shift in species composition towards the fast growing, weedy species can affect structure provided by the reef system as these species typically grow as small flat colonies and result in reduced reef complexity (Knowlton, 2001; Precht and Miller, 2007; Green et al., 2008). This same shift in species is being observed across the Mexican Caribbean (Alvarez-Filip et al., 2019) and Turks and Caicos (Heres et al., 2021). Loss of species and homogenization within sites, poses to foster a significant shift in the Coral ECA towards eurytopic generalist species, furthering the previously recorded shift in species dominance along Florida’s Coral Reef reported by (Burman et al., 2012). This ecological shift may cause a decrease in structural complexity, which could result in increased algal growth (Jones et al., 2020), a decrease in fish habitat and decreased storm protection (Storlazzi et al., 2021) along Florida’s already impacted shoreline.
Not only has a shift in species composition been observed, but also smaller colonies are more prevalent following the SCTLD outbreak. Although Williams et al. (2021) and Sharp et al. (2020) found that the largest corals were the most susceptible to SCTLD, our study indicated the largest loss of colonies occurred around the median of the size range (Figure 5). This could be due to lower abundances of large colonies within the sample sites, where a maximum of 16 colonies ≥ 100 cm was recorded across all sites in a single year. In that same year (2015) 297 colonies were recorded between 30-100 cm. While the majority of the large colonies were lost during the disease event, there was a much greater loss of these ‘medium’ sized colonies. As 36% of all colonies >10 cm were lost from 2013-2018, the decline in both large and medium sized corals critically reduces the already low structural complexity of the Coral ECA reefs. Structural complexity has been shown to be a predictor of reef recovery or regime shifts. Reefs containing only smaller colonies, relative to a species typical size distribution, decreases the amount of habitat and structural complexity provided by these species (Graham et al., 2015). The drastic loss of coral colonies, live tissue, and colonies of larger size, has the potential to detrimentally decrease reproductive potential of the remaining corals and further reduce the systems potential for recovery. Additionally, this shift to smaller colonies is important as colony size is directly related to fecundity and as a result changes in colony size can have detrimental effects on reproductive capabilities (Connell, 1973; Szmant-Froelich, 1985; Tsounis et al., 2006). There were no significant changes in size distributions among the disease susceptibility groups between 2018 and 2019, suggesting the loss of colonies has subsided.
In previous recruitment and juvenile stony coral studies in the Coral ECA, survivorship in the juvenile stage was found to be a critical factor in structuring the spatial organization of adult coral communities (Harper, 2017). Although for this study a dedicated recruitment survey was not performed, the method still provided a snapshot of the current juveniles within the sample sites. The majority of species had juveniles recorded (20 of 23 species/genera). Orbicella spp. had the most LTA recorded of species without any juveniles documented. This suggests during and previous to the peak of the disease event, Orbicella spp. did not have successful settlement or recruit survival within these sites. As these species now exist at even lower densities in 2019, successful reproduction seems unlikely. Other susceptible species (D. stokesii, M. meandrites and S. siderea) had more juveniles than adult colonies, suggesting successful larval settlement, during or before the disease event. Siderastrea siderea has been documented to be reproductively mature as small as 1.1 cm in the Coral ECA (St. Gelais et al., 2016), and accounted for > 50% of all juveniles recorded in 2018-2020 and was the most abundant species < 4 cm. However, large colonies were rare and there appears to be a disconnect preventing adult growth and survival. Although S. siderea is considered a reef-building species throughout the Florida Keys and greater Caribbean, in the Coral ECA these colonies rarely contribute to structural complexity. This study only recorded a maximum of five colonies per year greater than 50 cm in diameter and in 2019 more than 90% of S. siderea colonies were less than 20 cm in diameter. Low relief species like P. astreoides and S. siderea comprised more than 68% of all juveniles; these species are persisting after the disturbance event and may dominate these reefs in the future. These results highlight the need for a comprehensive juvenile study on SCTLD impacted reefs.
The reefs throughout the Coral ECA have been significantly altered with the significant loss of median and large size colonies and over half of all stony coral live tissue. The adult and juvenile coral assemblages are increasingly dominated by low relief weedy species. The small size corals dominating these reefs must have the opportunity to grow into the larger size classes, where survival and growth appears to be limited under current conditions and competition, leading to reduced reproductive potential. Although some species lost > 98% of living tissue, no species were completely lost from the sites. With disease prevalence < 1% for the past three years, there needs to be a focus on recovery of this resource. Long-term monitoring projects provide invaluable opportunities to capture spatiotemporal changes in coral assemblages and may identify potential indicators of recovery. Our study demonstrates the severity of the disease outbreak and precarious state of the stony coral assemblage in the Coral ECA. Recovery is dependent upon the survival, growth and reproductive output of the remaining coral assemblage and successful recruitment into the assemblage and into larger size classes. The likelihood of this recovery, to even a pre-outbreak state, is limited without immediate action addressing development related local stressors and climate change related global stressors.
Data availability statement
The datasets presented in this study can be found in online repositories. The names of the repository/repositories and accession number(s) can be found below: geodata.myfwc.com, Keyword: SECREMP.
Author contributions
NH, CW, and DG conducted the fieldwork, wrote, and edited the manuscript. NH and CW performed the statistical analyses. All authors contributed to the article and approved the submitted version.
Funding
This work was partially funded pursuant to Florida Department of Environmental Protection (FDEP) grant to the Florida Fish and Wildlife Conservation Commission (FWC) and then contracted to Nova Southeastern University (NSU) and through awards from FDEP directly to NSU. Though funded in part by a grant agreement from FDEP through the National Oceanic and Atmospheric Administration (NOAA), the views, statement, findings, conclusions, and recommendations expressed herein are those of the author(s) and do not necessarily reflect the views of the State of Florida, NOAA or any of their subagencies.
Acknowledgments
We thank the numerous members of the NSU Coral Reef Restoration, Assessment and Monitoring Lab for their tireless efforts in the field and lab throughout the many years of SECREMP. We also thank our Florida’s Coral Reef monitoring partners in the FWC Coral Program, especially Rob Ruzicka, Mike Colella, and Jeff Beal and the FDEP Coral Reef Conservation Program, especially Joanna Walczak, Jamie Monty, Nicole D’Antonio, and Kristi Kerrigan.
Conflict of interest
The authors declare that the research was conducted in the absence of any commercial or financial relationships that could be construed as a potential conflict of interest.
Publisher’s note
All claims expressed in this article are solely those of the authors and do not necessarily represent those of their affiliated organizations, or those of the publisher, the editors and the reviewers. Any product that may be evaluated in this article, or claim that may be made by its manufacturer, is not guaranteed or endorsed by the publisher.
Supplementary material
The Supplementary Material for this article can be found online at: https://www.frontiersin.org/articles/10.3389/fmars.2022.975894/full#supplementary-material
References
Acevedo J. (2017). Broward county and municipal population forecast and allocation model (PFAM), Broward County Florida, P.a.D.M. Division, Fort Lauderdale FL.
Aeby G., Ushijima B., Bartels E., Walter C., Kuehl J., Jones S., et al. (2021). Changing stony coral tissue loss disease dynamics through time in montastraea cavernosa. Front. Mar. Sci. 8. doi: 10.3389/fmars.2021.699075
Aeby G. S., Ushijima B., Campbell J. E., Jones S., Williams G. J., Meyer J. L., et al. (2019). Pathogenesis of a tissue loss disease affecting multiple species of corals along the Florida reef tract. Front. Mar. Sci. 6. doi: 10.3389/fmars.2019.00678
Alvarez-Filip L., Estrada-Saldivar N., Perez-Cervantes E., Molina-Hernandez A., Gonzalez-Barrios F. J. (2019). A rapid spread of the stony coral tissue loss disease outbreak in the Mexican Caribbean. PeerJ 7, e8069. doi: 10.7717/peerj.8069
Aronson R. B., Precht W. F. (2001). White-band disease and the changing face of Caribbean coral reefs. Hydrobiologia 460 (1/3), 25–38. doi: 10.1023/a:1013103928980
Bak R. P., Meesters E. H. (1998). Coral population structure- the hidden information of colony size-frequency distributions. Mar. Ecol. Prog. Ser. 162, 301–306. doi: 10.3354/meps162301
Banks K. W., Riegl B. M., Shinn E. A., Piller W. E., Dodge R. E. (2007). Geomorphology of the southeast Florida continental reef tract (Miami-Dade, broward, and palm beach counties, USA. Coral. Reefs. 26 (3), 617–633. doi: 10.1007/s00338-007-0231-0
Bartlett L. A., Brinkhuis V. I. P., Ruzicka R. R., Colella M. A., Lunz K. S., Leone E. H., et al. (2017). “Dynamics of stony coral and octocoral juvenile assemblages following disturbance on patch reefs of the Florida reef tract,” in Corals in a changing world. Eds. Beltran C. D., Camacho E. T. (London, England: IntechOpen).
Becker C. C., Brandt M., Miller C. A., Apprill A. (2021). Microbial bioindicators of stony coral tissue loss disease identified in corals and overlying waters using a rapid field-based sequencing approach. Environ. Microbiol 24 (3), 1166–82. doi: 10.1111/1462-2920.15718
Brandt M. E., Ennis R. S., Meiling S. S., Townsend J., Cobleigh K., Glahn A., et al. (2021). The emergence and initial impact of stony coral tissue loss disease (SCTLD) in the united states virgin islands. Front. Mar. Sci. 8. doi: 10.3389/fmars.2021.715329
Brooks M. E., Kristensen K., Benthem K., Magnusson A., Berg C. W., Nielson A., et al. (2017). glmmTMB balances speed and flexibility among packages for zero-inflated generalized linear mixed modeling. R. J. 9 (2), 378–400. doi: 10.32614/RJ-2017-066
Burman S. G., Aronson R.B., van Woesik R. (2012). Biotic homogenization of coral assemblages along the Florida reef tract. Marine Ecology Progress Series 467, 89–96. doi: 10.3354/meps09950
Caldwell J. M., Donahue M. J., Harvell C. D. (2018). Host size and proximity to diseased neighbours drive the spread of a coral disease outbreak in hawai'i. Proc. Biol. Sci. 285 (1870), 1–6. doi: 10.1098/rspb.2017.2265
Ceballos G., Ehrlich P. R., Dirzo R. (2017). Biological annihilation via the ongoing sixth mass extinction signaled by vertebrate population losses and declines. Proc. Natl. Acad. Sci. U.S.A. 114 (30), E6089–E6096. doi: 10.1073/pnas.1704949114
Combs I. R., Studivan M. S., Eckert R. J., Voss J. D. (2021). Quantifying impacts of stony coral tissue loss disease on corals in southeast Florida through surveys and 3D photogrammetry. PloS One 16 (6), e0252593. doi: 10.1371/journal.pone.0252593
Costa S. V., Hibberts S. J., Olive D. A., Budd K. A., Long A. E., Meiling S. S., et al. (2021). Diversity and disease: The effects of coral diversity on prevalence and impacts of stony coral tissue loss disease in saint Thomas, U.S. virgin islands. Front. Mar. Sci. 8. doi: 10.3389/fmars.2021.682688
Croquer A., Pauls S. M., Zubillaga A. L. (2003). White plague disease outbreak in a coral reef at Los roques national park, Venezuela. Rev. Biologiía. Trop. 51 (4), 39–45.
Croquer A., Weil E. (2009). Changes in Caribbean coral disease prevalence after the 2005 bleaching event. Dis. Aquat. Organisms. 87 (1-2), 33–43. doi: 10.3354/dao02164
De Caceres M., Legendre P. (2009). Associations between species and groups of sites: indices and statistical inference. Ecology 90, 3566–74. doi: 10.1890/08-1823.1
Dishon G., Grossowicz M., Krom M., Guy G., Gruber D. F., Tchernov D. (2020). Evolutionary traits that enable scleractinian corals to survive mass extinction events. Sci. Rep. 10 (1), 3903. doi: 10.1038/s41598-020-60605-2
Dobbelaere T., Muller E. M., Gramer L. J., Holstein D. M., Hanert E. (2020). Coupled epidemio-hydrodynamic modeling to understand the spread of a deadly coral disease in Florida. Front. Mar. Sci. 7. doi: 10.3389/fmars.2020.591881
Eakin C., Liu G., Gomez A., de la Cour J., Heron S., Skirving W., et al. (2016). Global coral bleaching 2014–2017: Status and an appeal for observations. Reef. Encounter. 31 (1), 20–26.
Estrada-Saldivar N., Jordan-Dalhgren E., Rodriguez-Martinez R. E., Perry C., Alvarez-Filip L. (2019). Functional consequences of the long-term decline of reef-building corals in the Caribbean: evidence of across-reef functional convergence. R. Soc. Open Sci. 6 (10), 190298. doi: 10.1098/rsos.190298
Estrada-Saldívar N., Quiroga-García B. A., Pérez-Cervantes E., Rivera-Garibay O. O., Alvarez-Filip L. (2021). Effects of the stony coral tissue loss disease outbreak on coral communities and the benthic composition of cozumel reefs. Front. Mar. Sci. 8. doi: 10.3389/fmars.2021.632777
Gibson T., Wanless H., Klaus J., Foster-Turley P., Florini K., Olson T. (2008). Corals and climate change (Environmental Defense Fund).
Gilliam D. S., Hayes N. K., Ruzicka R. R., Colella M. A. (2021). Southeast Florida coral reef evaluation and monitoring project 2020 year 18 final report (Florida DEP: FWC), 82.
Gintert B. E., Precht W. F., Fura R., Rogers K., Rice M., Precht L. L., et al. (2019). Regional coral disease outbreak overwhelms impacts from a local dredge project. Environ. Monit. Assess. 191 (10), 630. doi: 10.1007/s10661-019-7767-7
Graham N. A., Jennings S., MacNeil M. A., Mouillot D., Wilson S. K. (2015). IPredicting climate-driven regime shifts versus rebound potential in coral reefs. Nature 518 (7537), 94–97. doi: 10.1038/nature14140
Green D. H., Edmunds P. J., Carpenter R. C. (2008). Increasing relative abundance of Porites astreoides on Caribbean reefs mediated by an overall decline in coral cover. Marine Ecology Progress Series 359, 1–10. doi: 10.3354/meps07454
Greene A., Donahue M. J., Caldwell J. M., Heron S. F., Geiger E., Raymundo L. J. (2020). Coral disease time series highlight size-dependent risk and other drivers of white syndrome in a multi-species model. Front. Mar. Sci. 7. doi: 10.3389/fmars.2020.601469
Grimsditch G., Pisapia C., Huck M., Karisa J., Obura D., Sweet M. (2017). Variation in size frequency distribution of coral populations under different fishing pressures in two contrasting locations in the Indian ocean. Mar. Environ. Res. 131, 146–155. doi: 10.1016/j.marenvres.2017.09.017
Guy C. S., Cox T. L., Williams J. R., Brown C. D., Eckelbecker R. W., Glassic H. C., et al. (2021). A paradoxical knowledge gap in science for critically endangered fishes and game fishes during the sixth mass extinction. Sci. Rep. 11 (1), 8447. doi: 10.1038/s41598-021-87871-y
Harper L. M. (2017). Variation in Coral Recruitment and Juvenile Distribution Along the Southeast Florida Reef Tract. Master's thesis. Nova Southeastern University. Retrieved from NSUWorks (458). Available at: https://nsuworks.nova.edu/occ_stuetd/458
Hartmann A. C., Marhaver K. L., Vermeij M. J. A. (2017). Corals in healthy populations produce more larvae per unit cover. Conserv. Lett. 11 (3), 1–12. doi: 10.1111/conl.12410
Harvell C. D., Mitchell C. E., Ward J. R., Altizer S., Dobson A. P., Ostfeld R. S., et al. (2002). Climate warming and disease risks for terrestrial and marine biota. Science 296 (5576), 2158–2162. doi: 10.1126/science.1063699
Heres M. M., Farmer B. H., Elmer F., Hertler H. (2021). Ecological consequences of stony coral tissue loss disease in the Turks and Caicos islands. Coral. Reefs. 40 (2), 609–624. doi: 10.1007/s00338-021-02071-4
Hoegh-Guldberg O. (2010). Coral reef ecosystems and anthropogenic climate change. Regional. Environ. Change 11 (S1), 215–227. doi: 10.1007/s10113-010-0189-2
Hothorn T., Bretz F., Westfall P. (2008). Simultaneous inference in general parametric models. Inst. Für. Statistik 50 (3), 346–63.
Hughes T. P., Anderson K. D., Connolly S. R., Heron S. F., Kerry J. T., Lough J. M., et al. (2018). Spatial and temporal patterns of mass bleaching of corals in the anthropocene. Science 359, 80–83. doi: 10.1126/science.aan8048
Jones N. P., Figueiredo J., Gilliam D. S. (2020). Thermal stress-related spatiotemporal variations in high-latitude coral reef benthic communities. Coral. Reefs. 39 (6), 1661–1673. doi: 10.1007/s00338-020-01994-8
Jones N. P., Kabay L., Semon Lunz K., Gilliam D. S. (2021). Temperature stress and disease drives the extirpation of the threatened pillar coral, dendrogyra cylindrus, in southeast Florida. Sci. Rep. 11 (1), 14113. doi: 10.1038/s41598-021-93111-0
Knowlton N. (2001). The future of coral reefs. Proc. Natl. Acad. Sci. U S A 98 (10), 5419–29. doi: 10.1073/pnas.091092998
Landsberg J. H., Kiryu Y., Peters E. C., Wilson P. W., Perry N., Waters Y., et al. (2020). Stony coral tissue loss disease in Florida is associated with disruption of host–zooxanthellae physiology. Front. Mar. Sci. 7. doi: 10.3389/fmars.2020.576013
Lenth R. V. (2016). Least-squares means: The r package lsmeans. J. Stat. Software. 69 (1), 1–33. doi: 10.18637/jss.v069.i01
Lüdecke D., Makowski D., Waggoner P., Patil I. (2020). Performance: Assessment of regression models performance. CRAN doi: 10.5281/zenodo.3952174
Manzello D. P. (2015). Rapid recent warming of coral reefs in the Florida keys. Sci. Rep. 5, 16762. doi: 10.1038/srep16762
Martinez Arbizu P. (2020). “pairwiseAdonis: Pairwise multilevel comparison using adonis,” in R package version 0.4 ed.
Maynard J., van Hooidonk R., Eakin C. M., Puotinen M., Garren M., Williams G., et al. (2015). Projections of climate conditions that increase coral disease susceptibility and pathogen abundance and virulence. Nat. Climate Change 5 (7), 688–694. doi: 10.1038/nclimate2625
Maynard J. A., Byrne J., Kerrigan K., Tracey D., Bohnsack K., Pagan F., et al. (2017). Coral reef resilience to climate change in the Florida Reef Tract. Florida DEP Miami Beach, 1–30.
Meiling S., Muller E. M., Smith T. B., Brandt M. E. (2020). 3D photogrammetry reveals dynamics of stony coral tissue loss disease (SCTLD) lesion progression across a thermal stress event. Front. Mar. Sci. 7. doi: 10.3389/fmars.2020.597643
Meyer J. L., Castellanos-Gell J., Aeby G. S., Hase C. C., Ushijima B., Paul V. J. (2019). Microbial community shifts associated with the ongoing stony coral tissue loss disease outbreak on the Florida reef tract. Front. Microbiol. 10. doi: 10.3389/fmicb.2019.02244
Miller J., Muller E., Rogers C., Waara R., Atkinson A., Whelan K. R. T., et al. (2009). Coral disease following massive bleaching in 2005 causes 60% decline in coral cover on reefs in the US virgin islands. Coral. Reefs. 28 (4), 925–937. doi: 10.1007/s00338-009-0531-7
Muller E. M., Sartor C., Alcaraz N. I., van Woesik R. (2020). Spatial epidemiology of the stony-Coral-Tissue-Loss disease in Florida. Front. Mar. Sci. 7. doi: 10.3389/fmars.2020.00163
NOAA Stony Coral Tissue Loss Disease Case Definition (2018) NOAA Stonycoral tissue loss disease case definition. Available at: https://floridadep.gov/sites/default/files/Copy%20of%20StonyCoralTissueLossDisease_CaseDefinition%20final%2010022018.pdf.
Oksanen J., Guillaume Blanchet F., Friendly M., Kindt R., Legendre P., McGlinn D., et al. (2020). “vegan: Community ecology package,” in R package version 2, 5–7.
Pinheiro J., Bates D., DebRoy S., Sarkar D., R Core Team (2017). “nlme: Linear and nonlinear mixed effects models,” in R package version 3.1-131 ed(Vienna, Austria).
Precht W. F., Gintert B. E., Robbart M. L., Fura R., van Woesik R. (2016). Unprecedented disease-related coral mortality in southeastern Florida. Sci. Rep. 6, 31374. doi: 10.1038/srep31374
Precht W. F., Miller S. L. (2007). “Ecological Shifts along the Florida Reef Tract: The Past as a Key to the Future,” in Geological Approaches to Coral Reef Ecology ed. Aronson R. B. (Springer, NY), 237–312.
R Core Team (2020). R: A language and environment for statistical computing (Vienna, Austria: R Foundation for Statistical Computing).
Richardson L. L., Goldberg W. M., Carlton R. G., Halas J. C. (1998). Coral disease outbreak in the Florida keys: Plague type II. Rev. Biologiía. Trop. 46 (Supl 5), 187–98. doi: 10.15517/RBT.V46I5.29622
Richardson L. L., Voss J. D. (2005). Changes in a coral population on reefs of the northern Florida keys following a coral disease epizootic. Mar. Ecol. Prog. Ser. 297, 147–156. doi: 10.3354/meps297147
Rippe J. P., Kriefall N. G., Davies S. W., Castillo K. D. (2019). Differential disease incidence and mortality of inner and outer reef corals of the upper Florida keys in association with a white syndrome outbreak. Bull. Mar. Sci. 95 (2), 305–316. doi: 10.5343/bms.2018.0034
Rosales S. M., Clark A. S., Huebner L. K., Ruzicka R. R., Muller E. M. (2020). Rhodobacterales and rhizobiales are associated with stony coral tissue loss disease and its suspected sources of transmission. Front. Microbiol. 11. doi: 10.3389/fmicb.2020.00681
Scholz F., Zhu A. (2019). “kSamples: K-sample rank tests and their combinations,” in R package version 1.2-9 ed.
Sharp W. C., Shea C. P., Maxwell K. E., Muller E. M., Hunt J. H. (2020). Evaluating the small-scale epidemiology of the stony-coral -tissue-loss-disease in the middle Florida keys. PloS One 15 (11), e0241871. doi: 10.1371/journal.pone.0241871
Shilling E. N., Combs I. R., Voss J. D. (2021). Assessing the effectiveness of two intervention methods for stony coral tissue loss disease on montastraea cavernosa. Sci. Rep. 11 (1), 8566. doi: 10.1038/s41598-021-86926-4
Singmann H., Bolker B., Westfall J., Aust F., Ben-Shachar M. S. (2021). Afex: Analysis of factorial experiments.
Sokolow S. (2009). Effects of a changing climate on the dynamics of coral infectious disease: a review of the evidence. Dis. Aquat. Organ 87 (1-2), 5–18. doi: 10.3354/dao02099
St. Gelais A. T., Chaves-Fonnegra A., Brownlee A. S., Kosmynin V. N., Moulding A. L., Gilliam D. S. (2016). Fecundity and sexual maturity of the coral siderastrea siderea at high latitude along the Florida reef tract, USA. Invertebrate. Biol. 135 (1), 46–57. doi: 10.1111/ivb.12115
Storlazzi C. D., Reguero B. G., Cole A. D., Lowe E., Shope J. B., Gibbs A. E., et al. (2019). Rigorously valuing the role of U.S. coral reefs in coastal hazard risk reduction: U.S. geological survey open-file report 2019–1027. (U.S. Geological Survey, Reston, Virginia) 42. doi: 10.3133/ofr20191027
Storlazzi C. D., Reguero B. G., Yates K. K., Cumming K. A., Cole A. D., Shope J. B., et al. (2021). “Rigorously valuing the impact of projected coral reef degradation on coastal hazard risk in Florida,” in U.S. geological survey open-file report (U.S. Geological Survey, Reston, Virginia), 27.
Szmant-Froelich A. (1985). “The effect of colony size on the reproductive ability of the Caribbean coral montastrea annularis (Ellis and solander),” in 5th international coral reef symposoium (Antenne Museum-Ephe, Moorea, French Polynesia), 295–300.
Tsounis G., Rossi S., Aranguren M., Gili J.-M., Arntz W. (2006). Effects of spatial variability and colony size on the reproductive output and gonadal development cycle of the Mediterranean red coral (Corallium rubrum l. Mar. Biol. 148 (3), 513–527. doi: 10.1007/s00227-005-0100-8
Ushijima B., Meyer J. L., Thompson S., Pitts K., Marusich M. F., Tittl J., et al. (2020). Disease diagnostics and potential coinfections by vibrio coralliilyticus during an ongoing coral disease outbreak in Florida. Front. Microbiol. 11. doi: 10.3389/fmicb.2020.569354
van Woesik R. (2002). Processes regulating coral communities. Comments. Theor. Biol. 7, 201–214. doi: 10.1080/08948550214054
van Woesik R., McCaffrey K. R. (2017). Repeated thermal stress, shading, and directional selection in the Florida reef tract. Front. Mar. Sci. 4 (182), 1–10. doi: 10.3389/fmars.2017.00182
van Woesik R., Randall C. (2017). Coral disease hotspots in the Caribbean. Ecosphere 8 (5). doi: 10.1002/ecs2.1814
van Woesik R. (2017). Contemporary coral bleaching: why diversity matters. Biodiversity 18 (1), 16–18. doi: 10.1080/14888386.2017.1307142
Walker B. K., Riegl B., Dodge R. E. (2008). Mapping coral reef habitats in southeast Florida using a combined technique approach. J. Coast. Res. 245, 1138–1150. doi: 10.2112/06-0809.1
Walton C. J., Hayes N. K., Gilliam D. S. (2018). Impacts of a regional, multi-year, multi-species coral disease outbreak in southeast Florida. Front. Mar. Sci. 5. doi: 10.3389/fmars.2018.00323
Weil E., Hernandez-Delgado E. A., Gonzalez M., Williams S., Suleimán-Ramos S., Figuerola M., et al. (2019). “Spread of the new coral disease “SCTLD” into the Caribbean: implications for Puerto rico,” in Reef encounter (International Coral Reef Society).
Keywords: stony coral tissue loss disease, Southeast Florida Coral Reef Ecosystem Conservation Area, long-term monitoring, community composition, coral disease, coral reefs, SCTLD
Citation: Hayes NK, Walton CJ and Gilliam DS (2022) Tissue loss disease outbreak significantly alters the Southeast Florida stony coral assemblage. Front. Mar. Sci. 9:975894. doi: 10.3389/fmars.2022.975894
Received: 22 June 2022; Accepted: 08 August 2022;
Published: 26 August 2022.
Edited by:
William F. Precht, Dial Cordy and Associates, Inc., United StatesCopyright © 2022 Hayes, Walton and Gilliam. This is an open-access article distributed under the terms of the Creative Commons Attribution License (CC BY). The use, distribution or reproduction in other forums is permitted, provided the original author(s) and the copyright owner(s) are credited and that the original publication in this journal is cited, in accordance with accepted academic practice. No use, distribution or reproduction is permitted which does not comply with these terms.
*Correspondence: David S. Gilliam, Z2lsbGlhbUBub3ZhLmVkdQ==