 Karen L. Neely
 Kevin A. Macaulay1,2
- 1Halmos College of Natural Sciences and Oceanography, Nova Southeastern University, Dania Beach, FL, United States
- 2Florida Fish and Wildlife Research Institute, St. Petersburg and Marathon, FL, United States
- 3National Operations Center, Bureau of Land Management, Denver, CO, United States
The decline of elkhorn coral, Acropora palmata, has been ongoing for decades, but the causes of decline and the resulting population status continue to be topics of study. Past efforts to categorize stressors have ranged from spatially and/or temporally focused efforts that detect local stressors but may miss broader patterns to meta-analyses that identify large-scale trends but may not account for finer-scale variability. We here conduct an analysis of sites surveyed across five years (2010-2015) and much of the Florida Reef Tract in order to look at large-scale patterns while also accounting for site, habitat, seasonal, and annual variability. Through fate-tracking across nine sites, we assess trends in total tissue amount, fragmentation and fragment survival, and prevalence and severity of stressors. Acute stressors included severe bleaching events and spikes in disease prevalence, while chronic stressors were dominated by corallivorous snail predation. Four of nine survey sites experienced near total declines in population over the survey period, but the timing and cause of each differed, even among sites within a few kilometers of each other. There were notable differences in the prevalence and severity of stressors between forereef and backreef sites. We conclude that generalizing the population trajectories and stressors of A. palmata can misrepresent the conditions at individual sites. We also conclude that the forereef and backreef environments examined here differ in their stressors, and that habitat should be identified as a variable of interest in assessing A. palmata trajectories. We use this information to speculate that the remaining population of A. palmata within Dry Tortugas National Park may have survived as a result of its unique backreef geography.
Introduction
The elkhorn coral, Acropora palmata, was a major component of shallow Caribbean coral reefs from the Pleistocene through recent times (Jackson, 1992; Aronson and Precht, 2001). Normally found from 0.5 – 5 m in depth (Goreau and Wells, 1967), the species historically dominated the shallow forereef where it was the main reef-building species, even lending its name to the characterization of that area as the “Palmata Zone” (Shinn, 1980). Paleoecological and historical data suggest that widespread declines began in the 1950s-1960s (Cramer et al., 2020). These losses were exacerbated by catastrophic outbreaks of white band disease beginning in the late 1970s (Gladfelter et al., 1977; Gladfelter, 1982; Aronson and Precht, 2001). As a result of these declines, Acropora palmata is currently listed as Critically Endangered on the IUCN Red List (Aronson et al., 2008) and Threatened since 2006 under the United States Endangered Species Act (Hogarth, 2006).
Acropora palmata is known to be affected by a variety of stressors. In addition to the historically devastating white band disease, two additional diseases – white pox and rapid tissue loss diseases (Patterson et al., 2002; Williams and Miller, 2005) – can cause partial or total colony mortality. The predatory snail Coralliophila abbreviata can substantially deplete A. palmata tissue, particularly when the amount of available tissue is already low (Miller, 2001; Williams and Miller, 2006; Williams et al., 2014). Bleaching as a result of hyperthermal summers continues to increase in frequency (McWilliams et al., 2005) and can result in associated mortality. Hurricanes can cause tissue loss through abrasion or burial, or through fragmentation which can result in mortality rather than reattachment (Lirman, 2000; Williams et al., 2008). In the U.S. Virgin Islands, physical damage also correlated with increased disease prevalence and snail predation (Bright et al., 2016). Minor sources of mortality include damselfish gardens and picking (Grober-Dunsmore et al., 2006), occasional parrotfish bites (Williams et al., 2006), and tissue retreat caused by the boring sponge Cliona laticavicola (Williams et al., 2006). Other factors which may not cause direct mortality but instead reduce general health, growth rates, reproductive capacity, or juvenile settlement may include chronic nutrient enrichment (Lapointe et al., 2019) or elevated temperatures (Randall and Szmant, 2009).
Numerous studies have assessed local A. palmata populations to identify stressors and trends. These include Kramer et al. (2008) in Curacao and the British Virgin Islands, Grober-Dunsmore et al. (2006), Rogers and Muller (2012), and Muller et al. (2008) in St. John (U.S. Virgin Islands), and Williams and Miller (2012) in the upper Florida Keys. These studies all highlight the role various stressors play in local A. palmata populations within their spatiotemporal survey period; these variations over time and space make extrapolation challenging. An analysis of Florida-wide A. palmata populations (Lunz et al., 2016) sought to create a larger temporal and spatial scope of stressors. However, such meta-analyses can oversimplify the factors at play within local space and time. In an attempt to balance these approaches, we here present the status and trends of A. palmata populations spanning the Florida Keys measured over five years. We account for space, time, and habitat type as important factors that may drive stressors and trends.
Methods
Sites
We strategically chose reefs where some of the last remaining A. palmata colonies were abundant. In particular, the most dense (and in most cases the only remaining) areas of A. palmata on these reefs were selected. These included (from west to east), the only known A. palmata stand within Dry Tortugas National Park, three forereefs near Key West (Sand Key, Rock Key, and Western Sambo), one forereef off of Big Pine Key (Looe Key), one forereef off of Marathon (Sombrero), a forereef patch within Biscayne National Park (Ball Buoy), and a mid-channel patch reef within Biscayne National Park (Marker 3) (Figure 1). All colonies were between 1.5 – 7 meters in depth (Table 1).
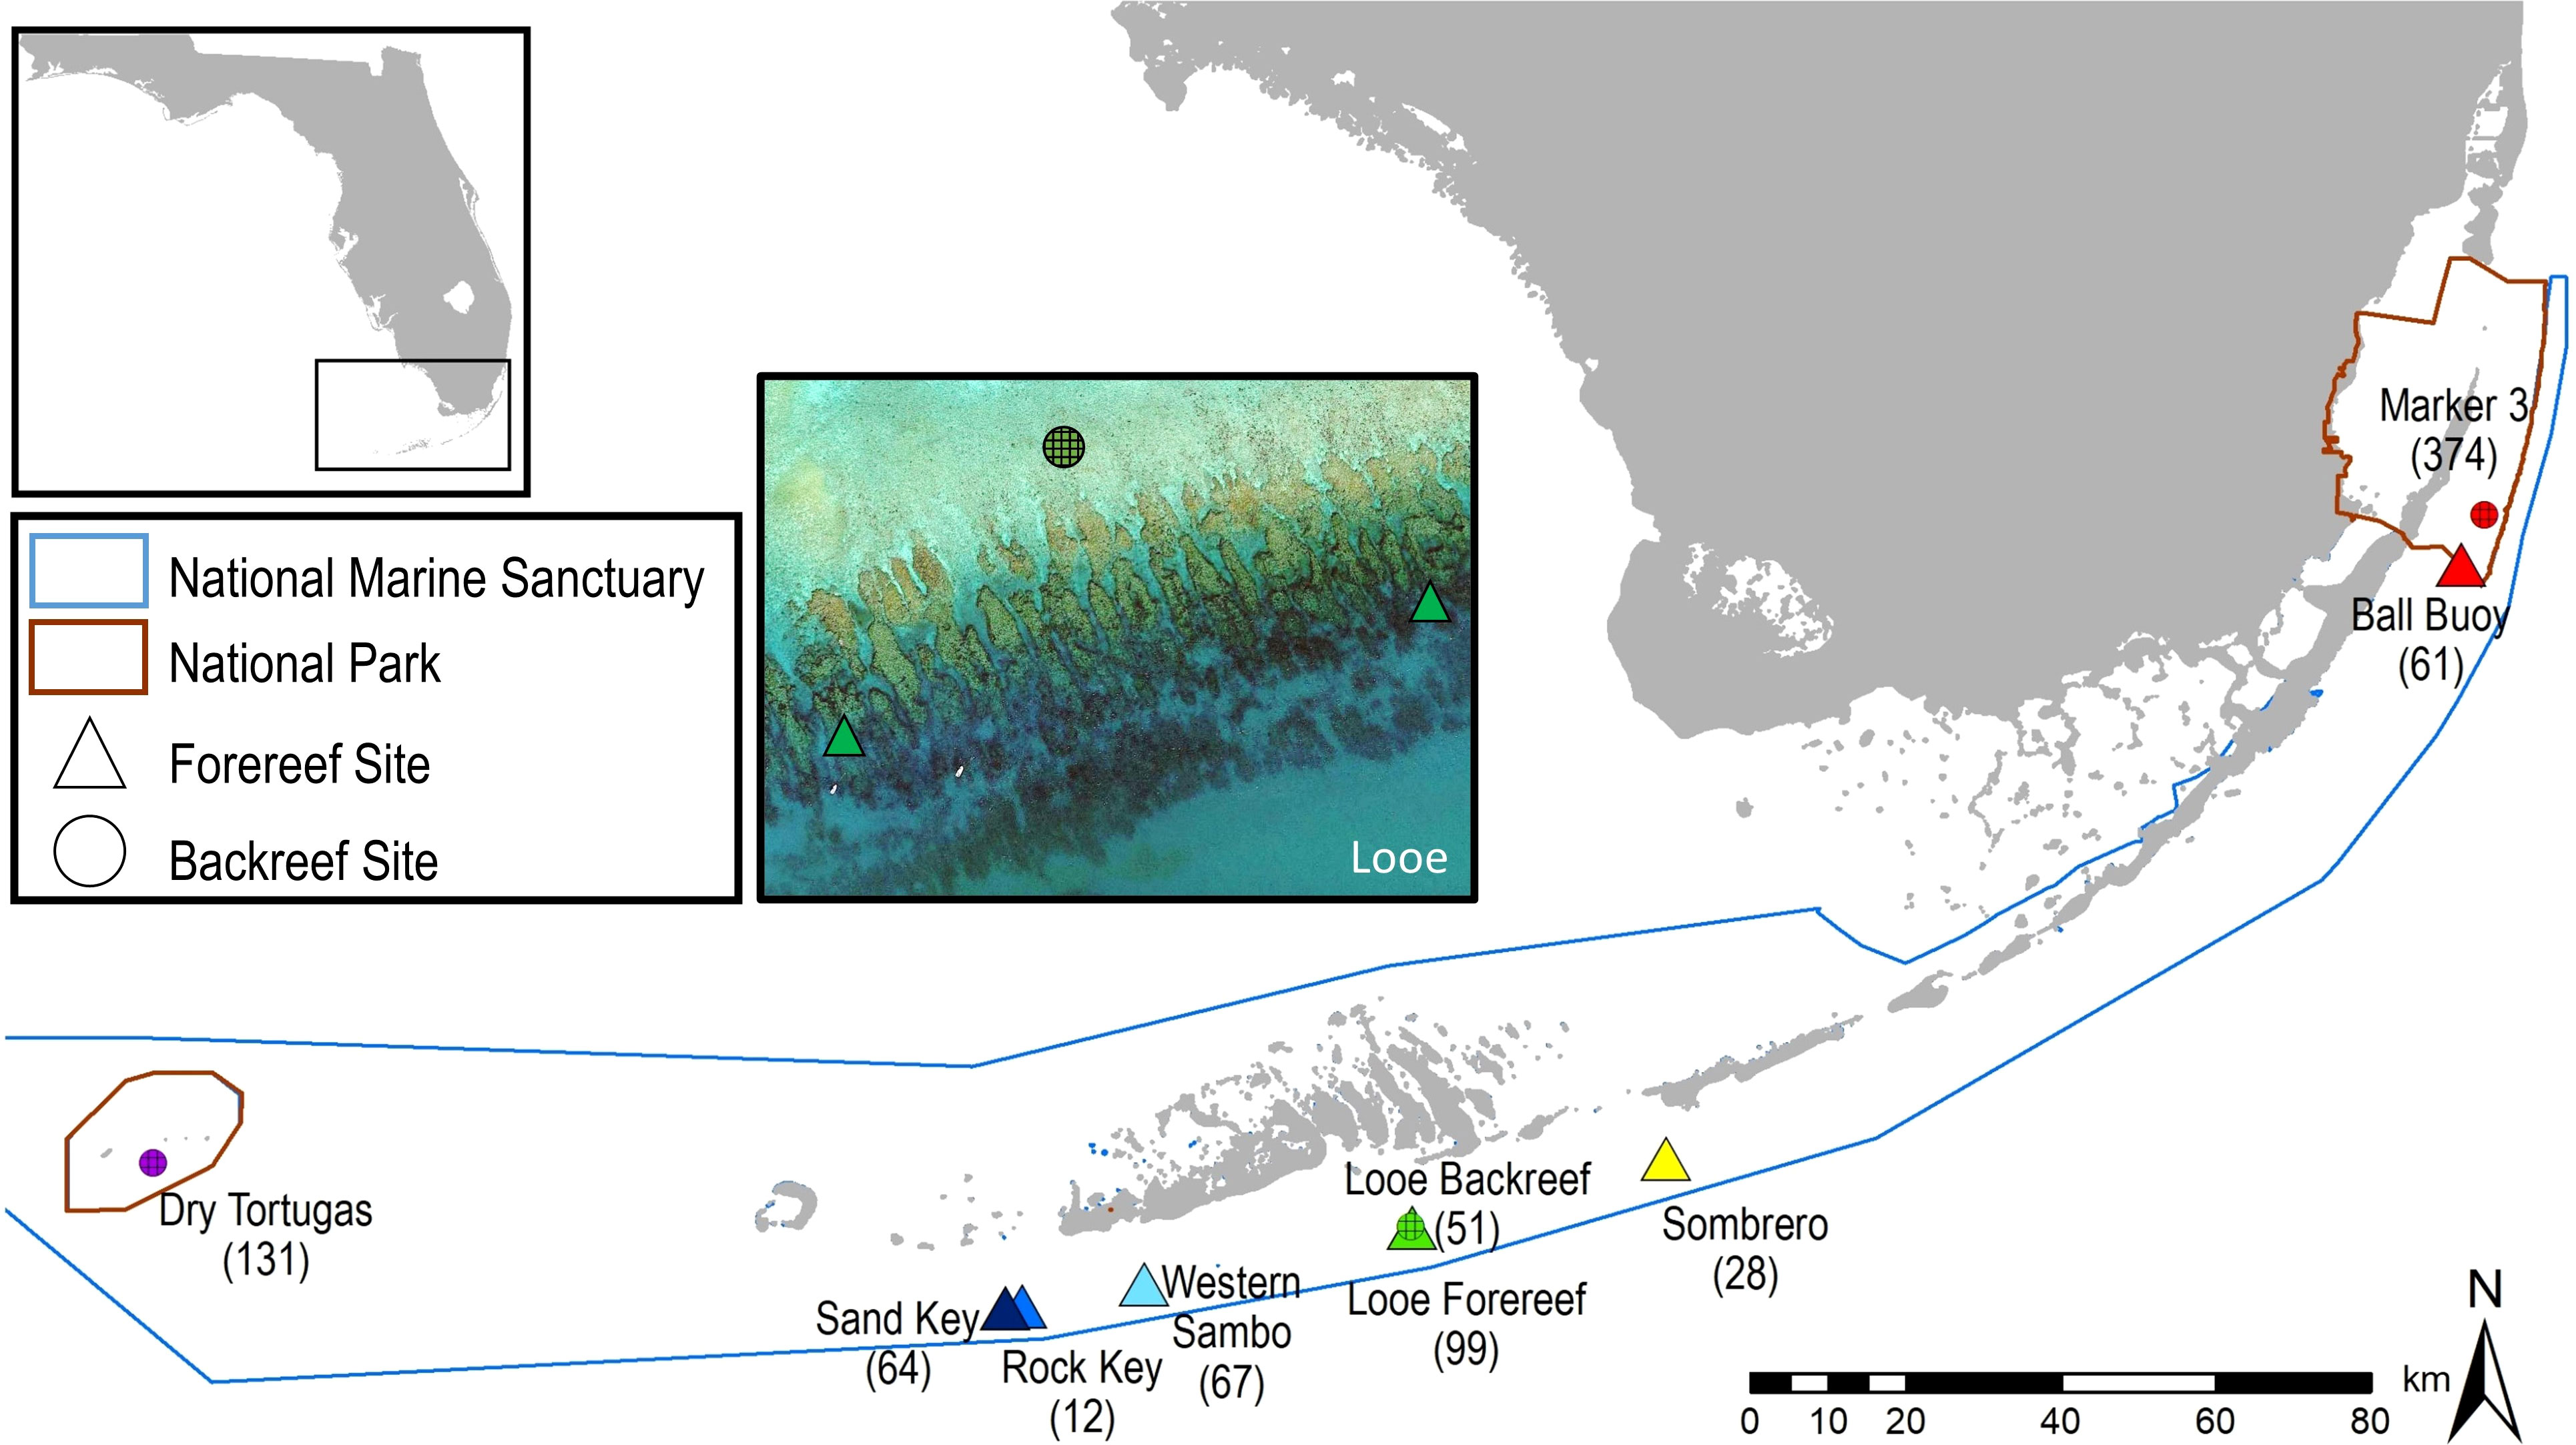
Figure 1 Map of Acropora palmata survey sites. Site symbols represent forereef (triangle) and backreef (circle) habitats. Site names are followed in parentheses by the total number of colonies documented within the plots at each site throughout the survey period. Looe Key imagery courtesy of Google Earth.
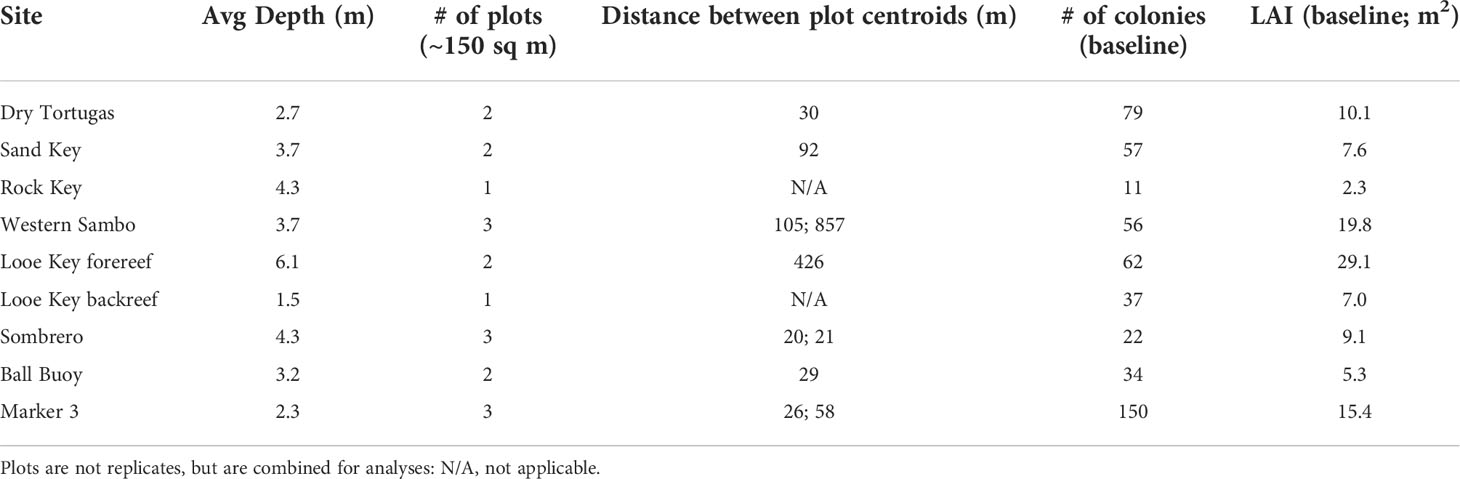
Table 1 Metrics for each Acropora palmata survey site, including depth, number of plots, distance between plots, the number of colonies present during baseline surveys, and the total site LAI during baseline surveys.
At each selected reef, we established circular plots around dense areas of A. palmata. At each plot, we hammered a central permanent stake into the reef. Depending on the distribution of the colonies, the centers of these plots were located 20 to 857 meters from each other (Table 1). At reefs with multiple areas of dense A. palmata colonies, we established three circular plots. At areas with fewer patches, we established only one or two plots, as colony distribution allowed. These plots provided defined survey areas in order to target the locations of highest A. palmata density, but they are summed by reef for all analyses rather than treated as replicates so as to provide the largest possible sample size. At Looe Key, we established two plots on the spur-and-groove forereef which are summed, and one plot in the shallow rubble backreef which is independent.
Three sites were distinguished as backreef sites: Dry Tortugas, Looe Key backreef, and Marker 3. These sites were all shallow low-relief areas that were protected behind the forereef. At Dry Tortugas and Looe Key, the plots were located approximately 0.2 km behind the spur and groove forereef formations. At Marker 3, the site was 2.2 km inland from the forereef. Coral species composition at all three backreef sites was dominated by A. palmata intermixed with Porites astreoides colonies. All other sites were located on the forereef spur-and-groove formations, which were high-relief, had greater coral species richness, and were slightly deeper than the backreef sites. The degree of clonality within the sites is largely unknown, although genotyping was done at the Dry Tortugas site, and the Marker 3 site was within 100 meters of previously genotyped colonies (Baums et al., 2006).
Temperature loggers were attached on or near an A. palmata colony at all sites, with the exceptions of Looe backreef and Rock Key which did not have loggers. Loggers were Hobo pendants, and were set for hourly data collection with a sensitivity of 0.14°C. Data collection at all sites had some gaps over the five-year time period due to logger losses, flooding, or battery malfunctions. In addition to temperature data from the loggers, we also used NOAA Coral Reef Watch data (NOAA, 2013-2019) to assess hyperthermal events via degree heating weeks. Degree heating weeks represent the accumulation of heat stress and can be a more effective predictor and correlate of coral bleaching than instantaneous temperature data (Kayanne, 2017).
Colony assessments
During the initial baseline surveys, we used a transect tape to identify all A. palmata colonies within 7 m of the central stake (total survey area per plot = 153.9 m2). For each colony, a numbered tag was placed adjacent to the coral, the distance and bearing from the stake was recorded, and photos were taken to confirm future identification. We conducted these full surveys of all A. palmata colonies within the plots on a roughly annual basis (winter 2010-2011, spring 2012, fall 2012, fall 2013, fall 2014, fall 2015). Any stable or attached fragments were identified as new colonies, and the number of these that appeared throughout the monitoring events was compared to the baseline number of colonies to create a metric of asexual fragmentation. By following each fragment through time, we quantified the percentage of new fragments that survived more or less than two years.
We measured and assessed colonies using primarily the methods described in Williams et al. (2006) and Williams and Miller (2012). For each colony, we recorded straight-line measurements of maximum length (L), width (W), and height (H) encompassing the area that included live tissue. Individual colonies were defined as those that did not share a common skeleton. We estimated the surface area (SA) of the measured skeleton as that of an ovoid with the formula SA = ((L * W * H)/3) ^ 2). We also visually estimated the percent of the measured area covered with live A. palmata tissue. We used this to calculate an estimate of the live tissue, termed the live area index (LAI), using the formula SA * % live tissue. By summing the LAI of all coral colonies within each plot during each annual assessment, we tracked the change in amount of A. palmata tissue (LAI) within the plots over five years.
We additionally assessed the presence of stressors on each coral. We looked for any signs of recent mortality (as defined by white skeleton with polyp structure still intact), recorded the cause of the mortality, and ranked the percentage of measured skeletal area that had experienced recent mortality on a scale of 1 to 5. Ranks corresponded with percentages outlined in Williams and Miller (2012) as follows: 1 = 0-5%; 2 = 10-20%; 3 = 25-45%; 4 = 50-75%; 5 = 80-100%. We used the midpoints of the ranks for analyses of the amount of recent mortality. If multiple stressors were recorded, they were ranked based on their relative contributions to the observed recent mortality and divided as such. If two stressors causing recent mortality were observed, we assigned 66% of the recent mortality to the primary cause and 33% to the secondary cause. If three causes of recent mortality were present, allocations were divided as 62.5%, 25%, and 12.5%. The mortality from stressors was lumped during analyses into four categories: disease (which included blotchy tissue loss identified in the field as either white pox or rapid tissue loss but clumped for analyses, as well as the less common white band disease), predation by the corallivorous snail Coralliophila abbreviata, bleaching-related mortality, and “other” which included ciliates, competition with other encrusting or boring organisms, or any unknown causes which were lumped together for analyses. During each monitoring event, bleaching was assessed in the field. Each colony was assessed for the percentage of tissue bleached on a scale of 1 to 5, using the same percentages outlined for recent mortality above. This bleaching metric is different from bleaching-related mortality; bare skeleton as a result of bleaching was not included in the bleaching metric, which only considered bleached but still live tissue.
In addition to the annual assessment of all A. palmata within each plot, seasonal monitoring was conducted tri-annually. For plots with 12 colonies or fewer, all colonies were fully assessed during each tri-annual monitoring event. For plots with more than 12 corals, a subset was randomly selected at the initiation of the project using random number tables and followed through time. If corals died between monitoring events, other individuals were selected to maintain the number of regularly monitored corals at 12 when possible. This subset of corals was monitored for size, coral cover, and presence of stressors as outlined above. Monitoring occurred during winter (November – February, characterized by cooler and rapidly fluctuating temperatures associated with cold snaps), spring (March – June, characterized with steadily warming temperatures), and fall (July – October, associated with high water temperatures and thermal stress).
Analyses
Stressors were all assessed using two metrics: prevalence and severity. Prevalence was calculated as the number of colonies at a site that were exhibiting recent mortality caused by the stressor during each monitoring period divided by the total number of colonies at the site alive during that monitoring period. Severity was calculated as the average percent of each affected colony at a site that was exhibiting recent mortality as a result of the stressor. For example, if there were ten colonies alive at a site and three of them had mortality from disease with scores of 1, 2, and 3, then the prevalence for disease at that site and time period would be 30%, and the severity would be 17.5% (averaging the rank midpoints of 2.5%, 15%, and 35% for the affected corals). Prevalence and severity from disease, C. abbreviata predation, and “other” were calculated and compared between:
1. Site (southwest to northeast): Dry Tortugas, Sand Key, Rock Key,Western Sambo, Looe Key fore reef, Looe Key back reef, Sombrero Reef, Ball Buoy, and Marker 3.
2. Habitat type: forereef and backreef
3. Season: fall, winter, spring
4. Year: 2010-2015.
All comparisons were Kruskal-Wallis ANOVA on Ranks using Dunn’s Method post-hoc comparisons (SigmaPlot 14.0). All significance values are reported with an α = 0.05.
Results
Amount of live tissue
The total amount of live tissue within the established plots (sum of LAI of all colonies) was tracked annually and compared to the initial 2010-2011 baselines (Figure 2). At six of the nine sites, the amount of tissue increased through summer of 2014. This included all three of the backreef sites, and three of the six forereef sites (Sombrero Reef, Looe Key, and Rock Key). By summer of 2014, the amount of tissue at these sites was 140% to 200% of the baseline levels.
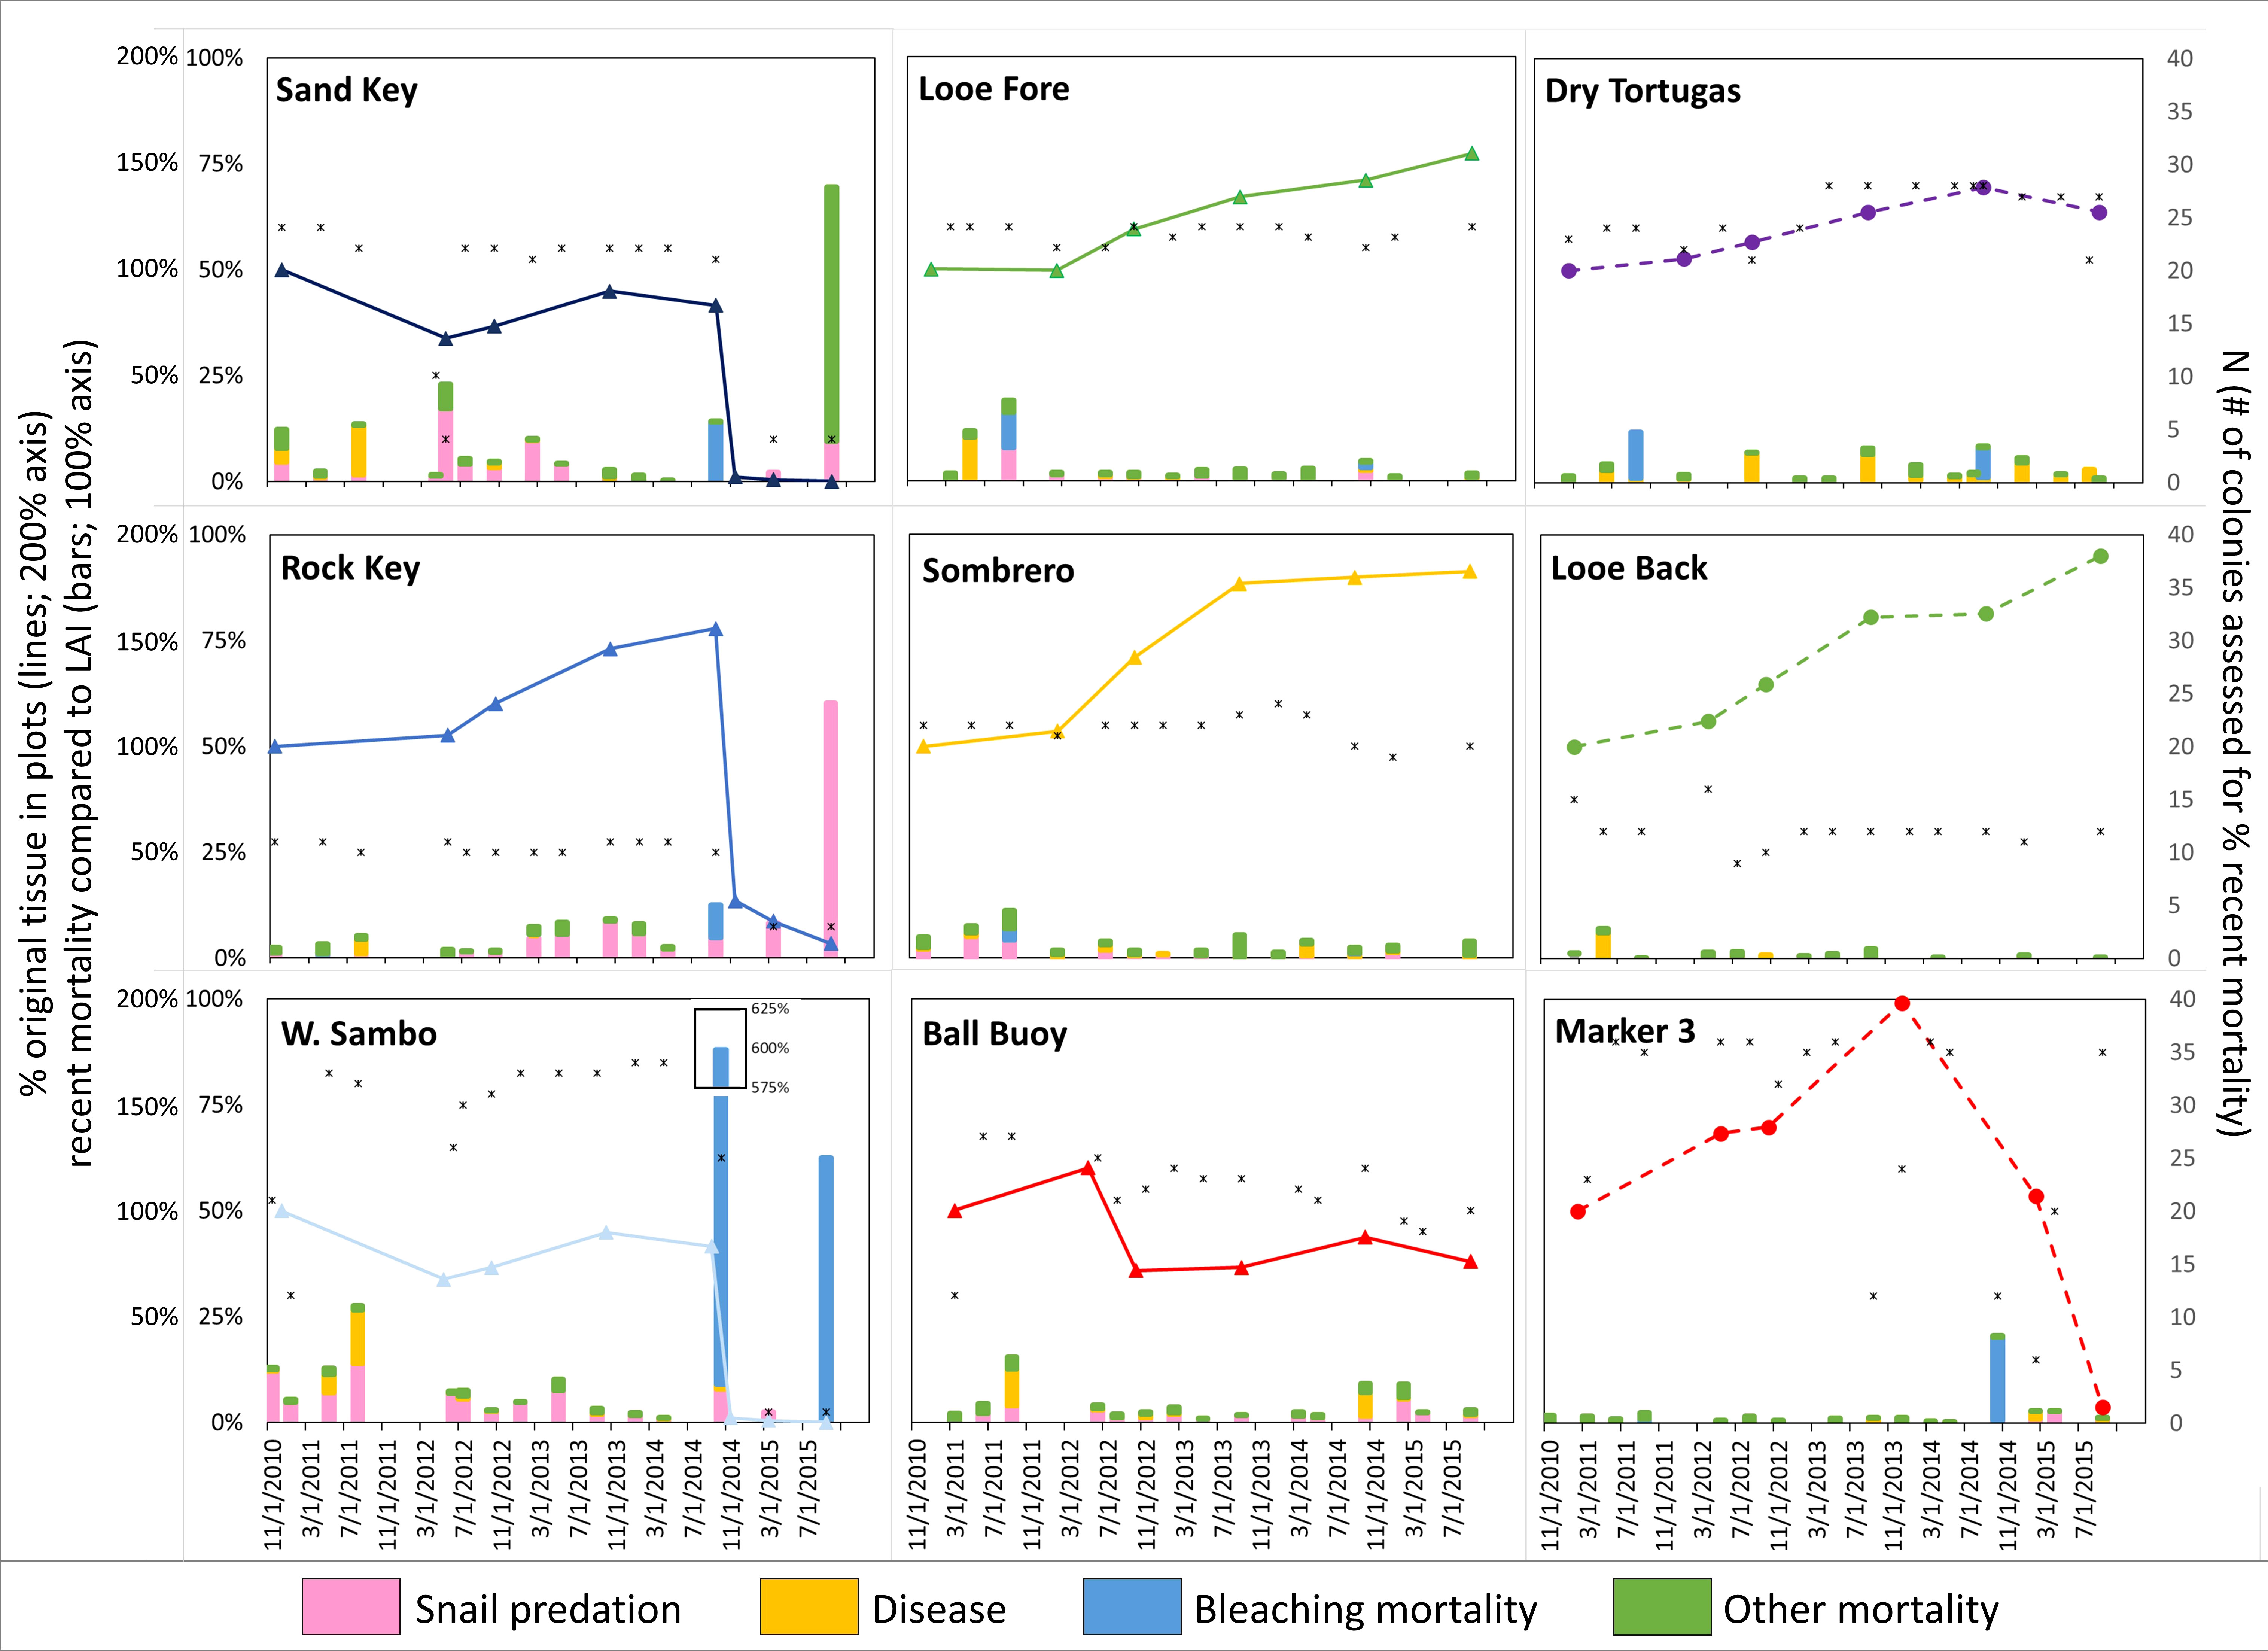
Figure 2 Percent of Acropora palmata live tissue (LAI) compared to baseline values during each annual monitoring at each site (colors and shapes of line markers correspond with the indicators of location on Figure 1: forereef = solid lines and triangles; backreef = dashed lines and circles), and percent of recent mortality surface area compared to remaining live tissue surface area during each seasonal survey (stacked bars; value can exceed 100% if there is more recent mortality than remaining tissue). The number of colonies assessed to determine the percent recent mortality is shown by asterisks. The percent of colony surface area exhibiting mortality is shown according to each stressor: predation by the corallivorous snail Coralliophila abbreviata (pink), disease (orange), bleaching-related mortality (blue), and other (green).
The three other sites exhibited declines in live tissue from baseline to summer of 2014: Western Sambo, Sand Key, and Ball Buoy (Figure 2). All three sites had a decreased amount of tissue by the end of 2012. At Ball Buoy and Sand Key, these declines were to ~70% of the initial tissue, with subsequent slight increases to around 85% of baseline tissue by the summer of 2014. In contrast, Western Sambo losses were more substantial, declining to less than 20% of baseline tissue by mid-2012, with little subsequent recovery.
Following the summer of 2014, only four of the nine sites exhibited net growth. Surveys from December 2014 onward documented almost complete collapse of the populations at Sand Key (< 1% of baseline), Rock Key (17% of baseline in March 2015, 7% of baseline in September 2015), and Western Sambo (< 1% of baseline). The population at Ball Buoy remained at 80% of the original LAI with no indication of growth or decline. Two of the three backreef sites exhibited post-summer 2014 declines; Dry Tortugas exhibited tissue loss, although levels remained at 125% of original baseline LAI, and the Marker 3 site underwent rapid collapse leading to the near complete loss (8% of baseline) of A. palmata at the site.
Fragments
The ratio of fragments to the baseline number of colonies varied from 4% (2 fragments from 57 colonies at Sand Key) to 130% (194 fragments from 150 colonies at Marker 3) (Figure 3). Though Marker 3 had a much higher fragment to colony ratio than all other sites, the ratios between forereef and backreef sites were not statistically different (t-test; p = 0.3). The percentage of fragments that survived longer than 2 years averaged 62% on the backreef sites and only 28% on the forereef sites (Figure 3), but this difference was not significant (Mann-Whitney Rank Sum test; p = 0.07). Though the differences in survival rates were not significant between backreef and forereef sites, the final 2015 surveys showed that fragments that had broken off and attached since the baseline surveys comprised less than 1% of the remaining LAI at all forereef sites except Ball Buoy (1.4%), while comprising 2.5%, 14.6%, and 17.5% of the LAI at Looe backreef, Marker 3, and Dry Tortugas respectively.
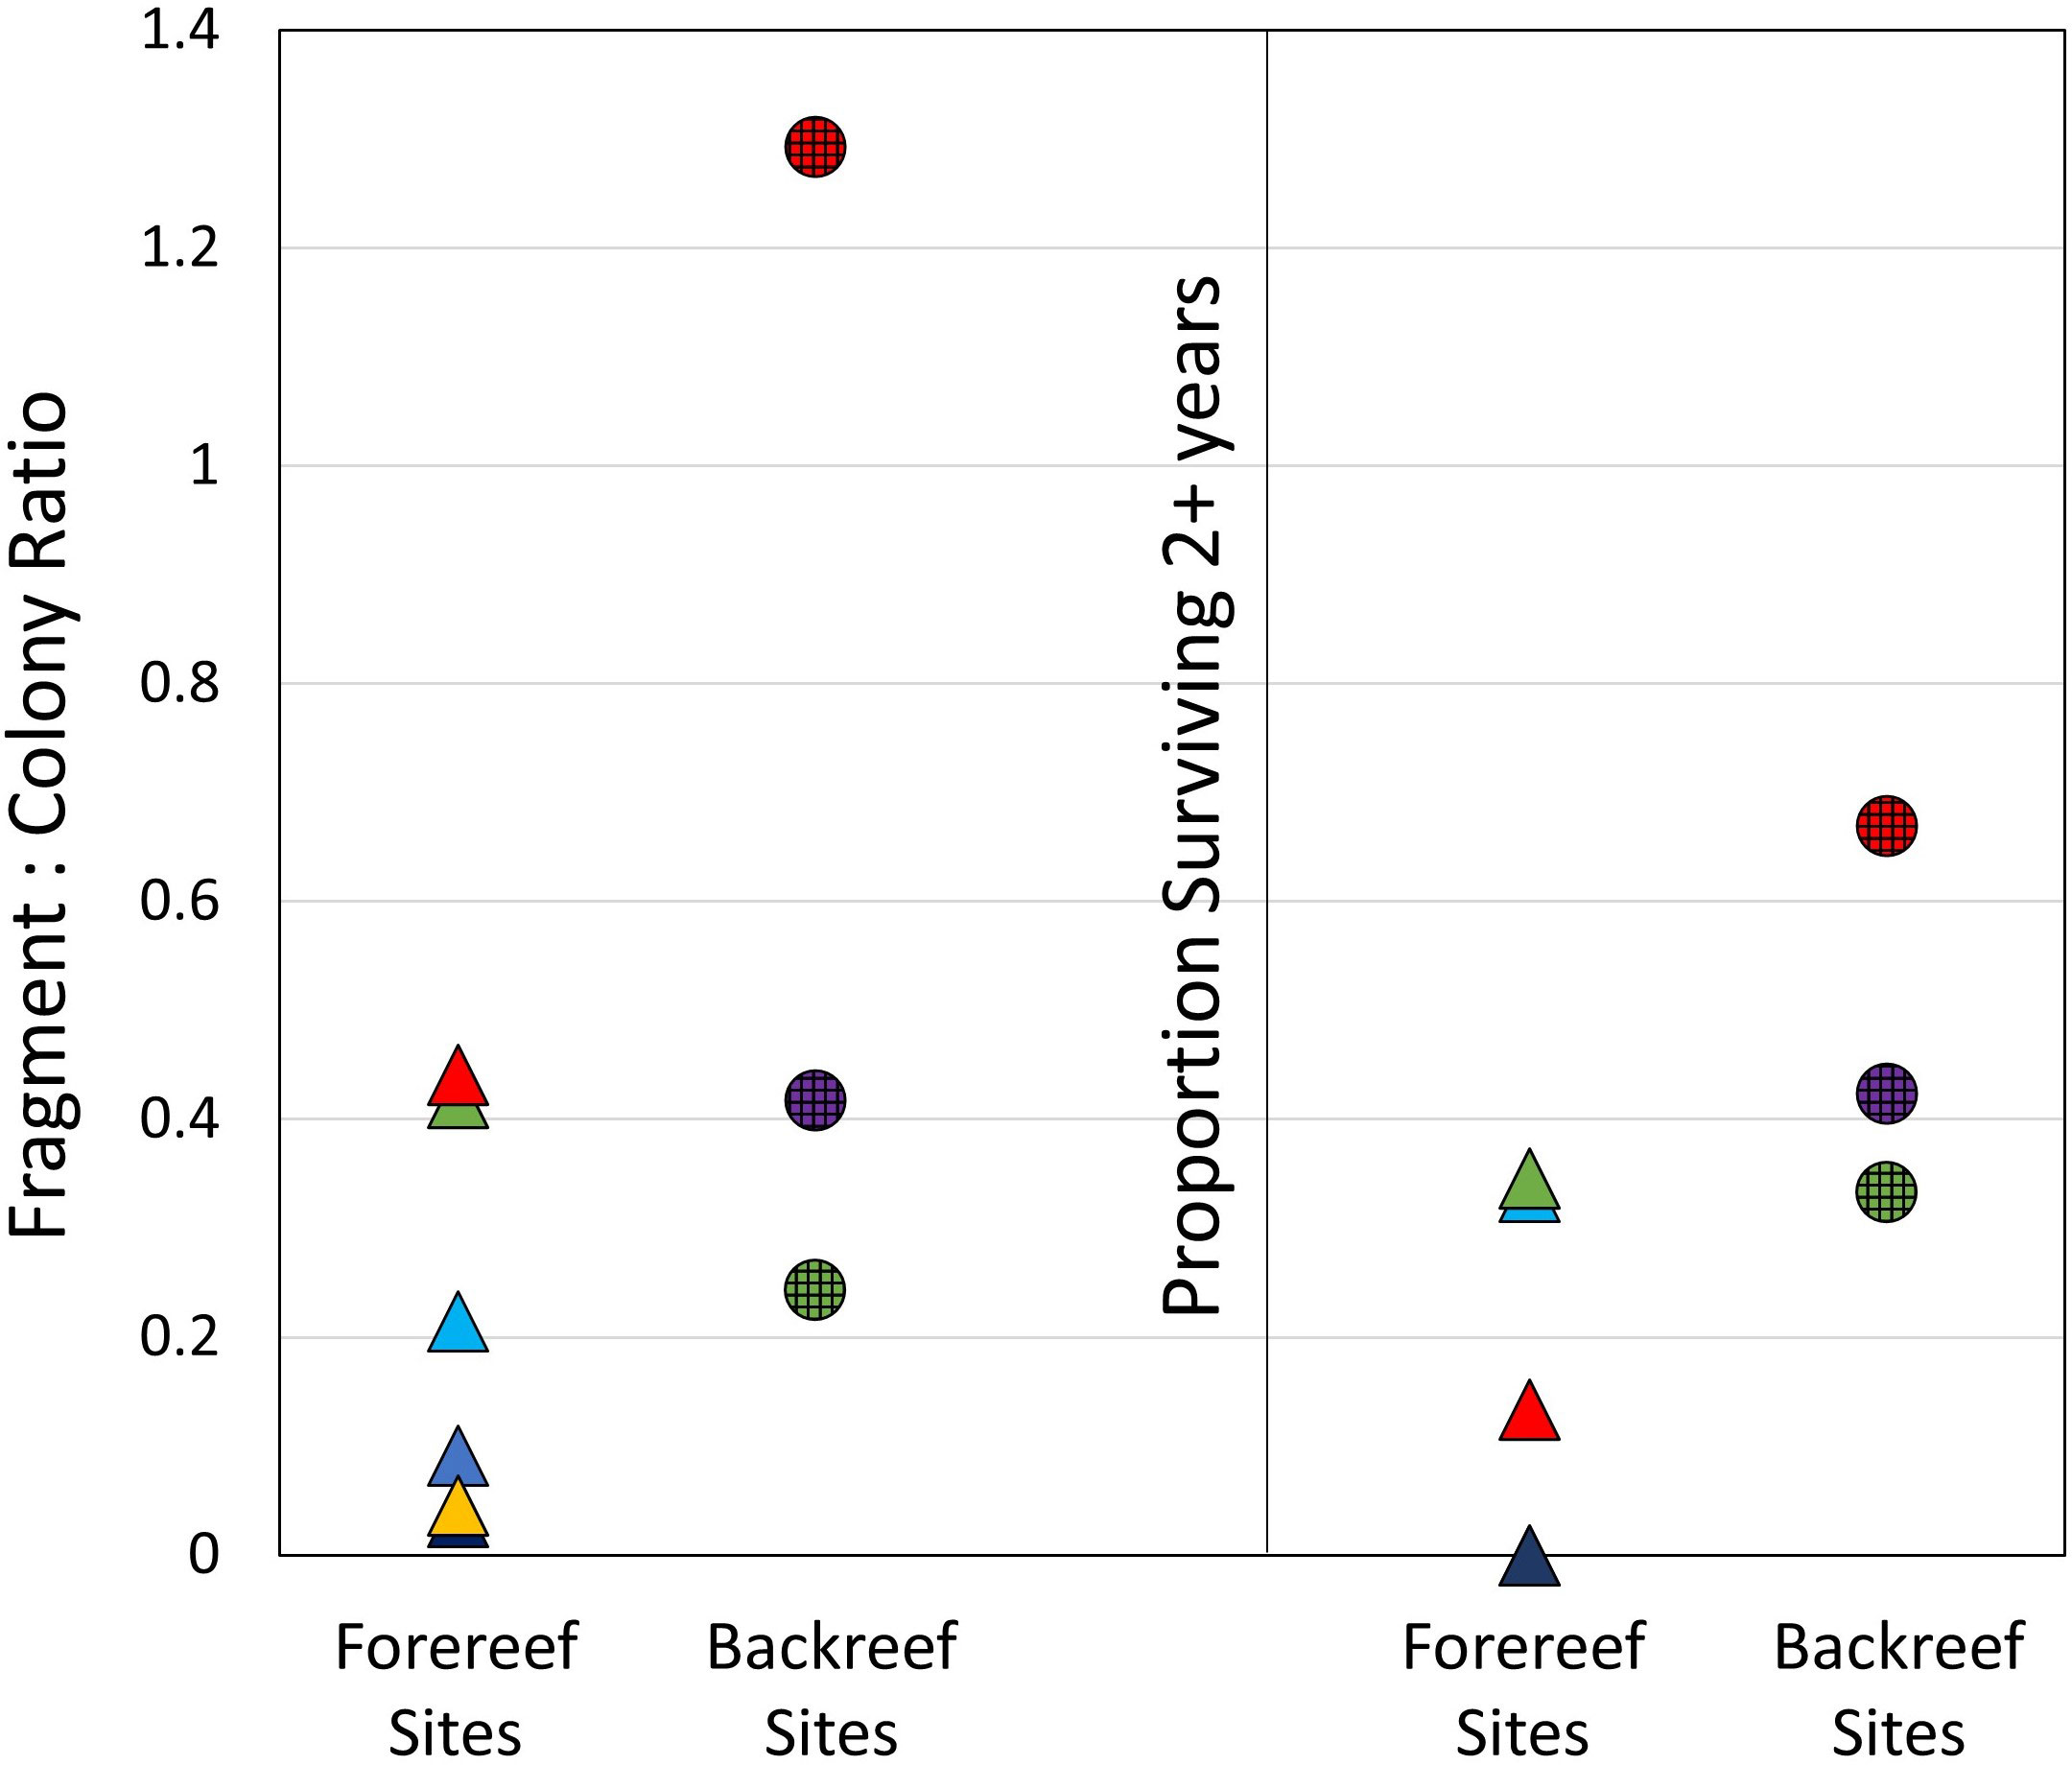
Figure 3 Ratio of new fragments formed over the five-year survey period to the number of colonies present at the baseline (left), and the proportion of new fragments that survived for two or more years (right). Values are separated into forereef sites (triangles, with colors matching those in Figure 1) and backreef sites (circles).
Stressors
In addition to sites exhibiting different trajectories of tissue gains and losses, each site varied in its exposure and response to mortality-causing stressors during the monitoring period (Figure 2).
The primary causes of mortality were white disease (white pox/rapid tissue loss, and white band), predation by the corallivorous snail Coralliophila abbreviata, bleaching-related mortality, and “other,” which also included a small number of low-severity observations that could not be attributed to a specific cause. Of a total 3084 colony monitoring observations, 246 (8%) documented disease, 410 (13%) documented snail predation, 83 (3%) documented bleaching-related mortality, and 591 (19%) documented “other” causes of recent mortality (Table 2). Of the 246 records of disease, 8 were white band disease; the rest were white pox/rapid tissue loss.

Table 2 The prevalence, severity, and timing of stressors recorded on Acropora palmata.
When assessing the impact of stressors on coral colonies, the severity of the stressor is as important as the frequency of stressor. On colonies that exhibited mortality from a particular stressor, the average proportion of tissue lost to that stressor was 10% (± 1% SE) to disease, 9% (± 1% SE) to snail predation, 41% (± 4% SE) to bleaching, and 6% (± 1% SE) to other. Bleaching severity was significantly higher than the severity of all other stressors (Kruskal-Wallis ANOVA on Ranks: p < 0.001. Pairwise comparisons: p < 0.001 for all). Severity of both disease and snail predation was also significantly higher than for “other” (pairwise comparisons: p < 0.005).
Average bleaching severity (the percentage of live tissue bleached, which differs from bleaching-related mortality) during a monitoring event ranged from 0% to 100%, with site and temporal variation (Figure 4). Backreef sites exhibited minor bleaching in the summer of 2011, and all sites except Ball Buoy exhibited moderate to severe bleaching in the summers of 2014 and 2015. Similar bleaching patterns of A. palmata colonies at upper Florida Keys sites during these years were documented by Williams et al. (2017). In situ temperature data across sites showed that temperatures exceeded Florida’s historic bleaching threshold of 30.5° C (Manzello, 2015) every summer from 2011-2015, with no notable difference between forereef and backreef sites. However, cumulative heat stress, as indicated by Degree Heating Weeks, identified 2011, 2014, and 2015 as notably more hyperthermal than 2012 and 2013 (Figure 4) in both the Florida Keys and Southeast Florida regions.
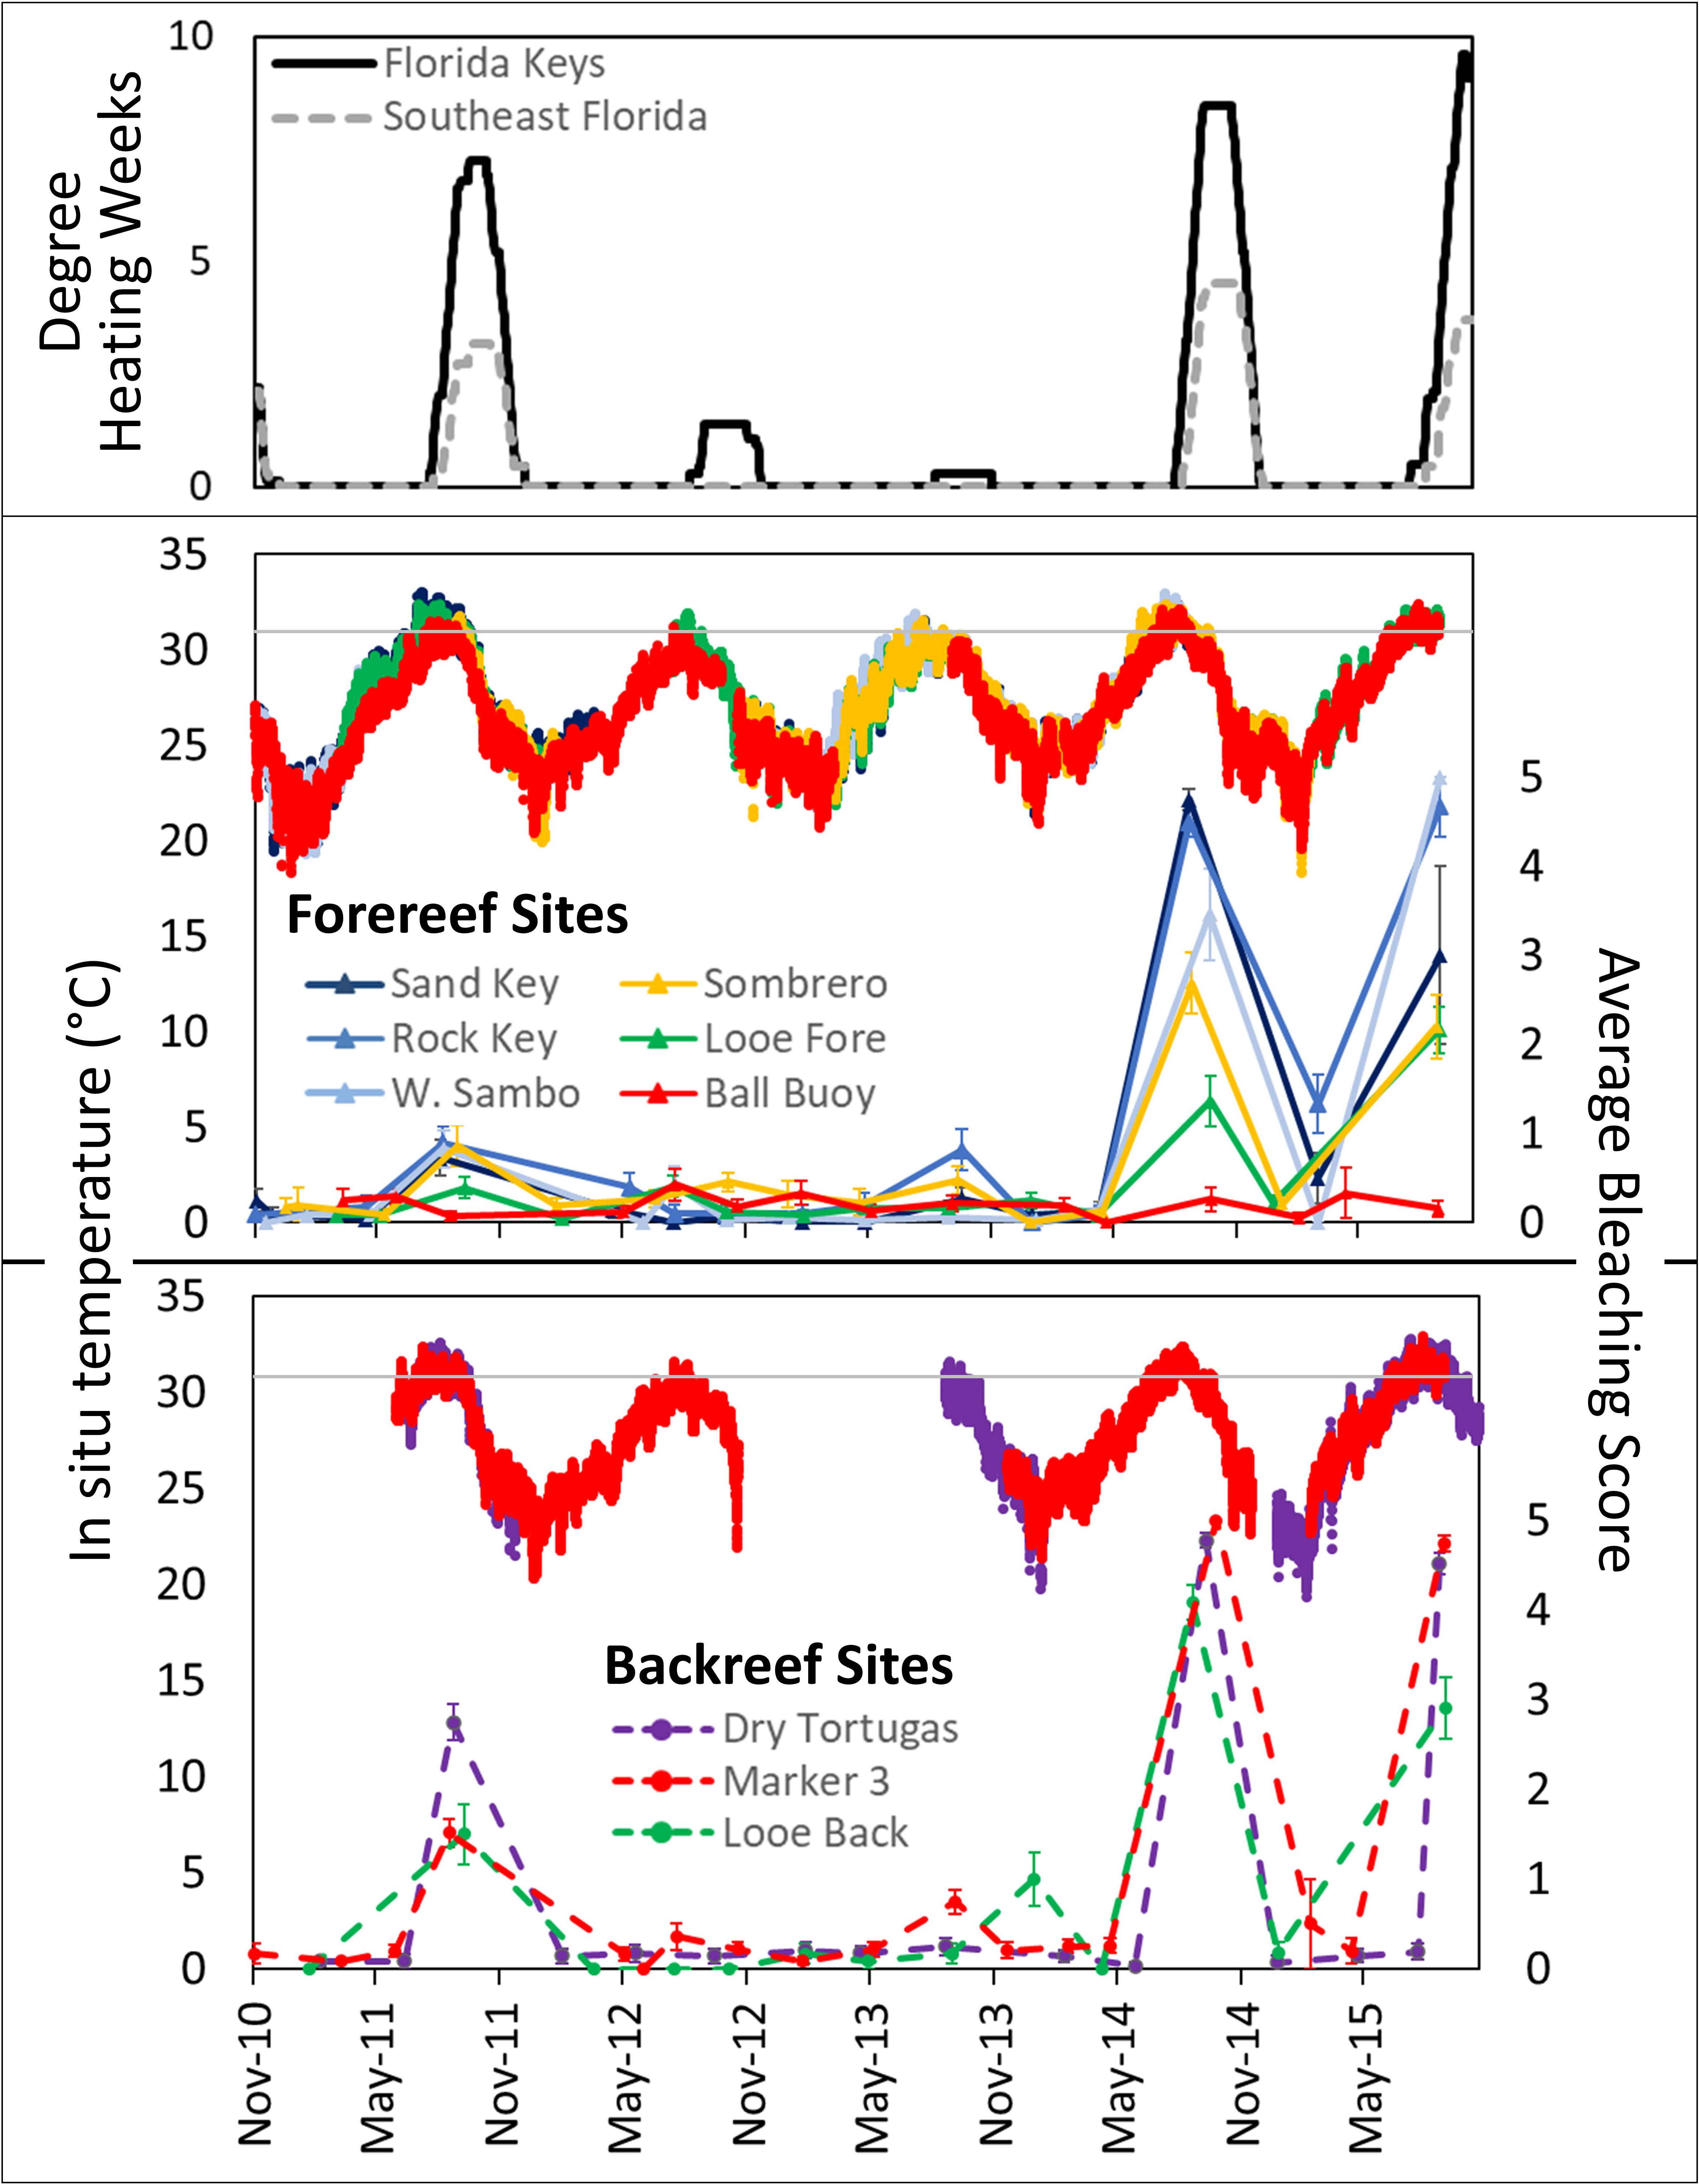
Figure 4 Degree heating weeks (top: data from NOAA Coral Reef Watch), in situ temperature data from study sites, and average bleaching scores for tri-annually monitored Acropora palmata colonies at each site (forereef = solid lines and triangles; backreef = dashed lines and circles; error bars = standard error) from November 2010 to September 2015. Note minor bleaching in 2011, particularly in the backreef sites, and severe bleaching in 2014 and 2015, particularly in the backreef (dashed) and lower Keys (solid blue) sites, but notably not at the Ball Buoy site. A line at 30.5° C indicates the historic Florida Keys bleaching temperature threshold.
Spatial and temporal distribution of stressors
Mortality-inducing stressors were compared across time (year and season) and across geography (site and habitat). For each comparison, the prevalence of the stressor (proportion of colonies affected) and the severity of the stressor (amount of recent mortality as compared to the total amount of remaining tissue) were assessed.
Across years (2010-2015), neither prevalence nor severity of disease or snail predation varied (Figure 5A). The proportion of colonies affected by “other” declined with time (2010, 2011 > 2014, 2015), but severity did not. When compared by season (fall, winter, and spring), neither snail predation nor “other” varied in prevalence or severity (Figure 5B). However, prevalence of disease was higher in the fall than in the winter or spring (Kruskal-Wallis ANOVA on Ranks; p = 0.005); severity did not vary by season.
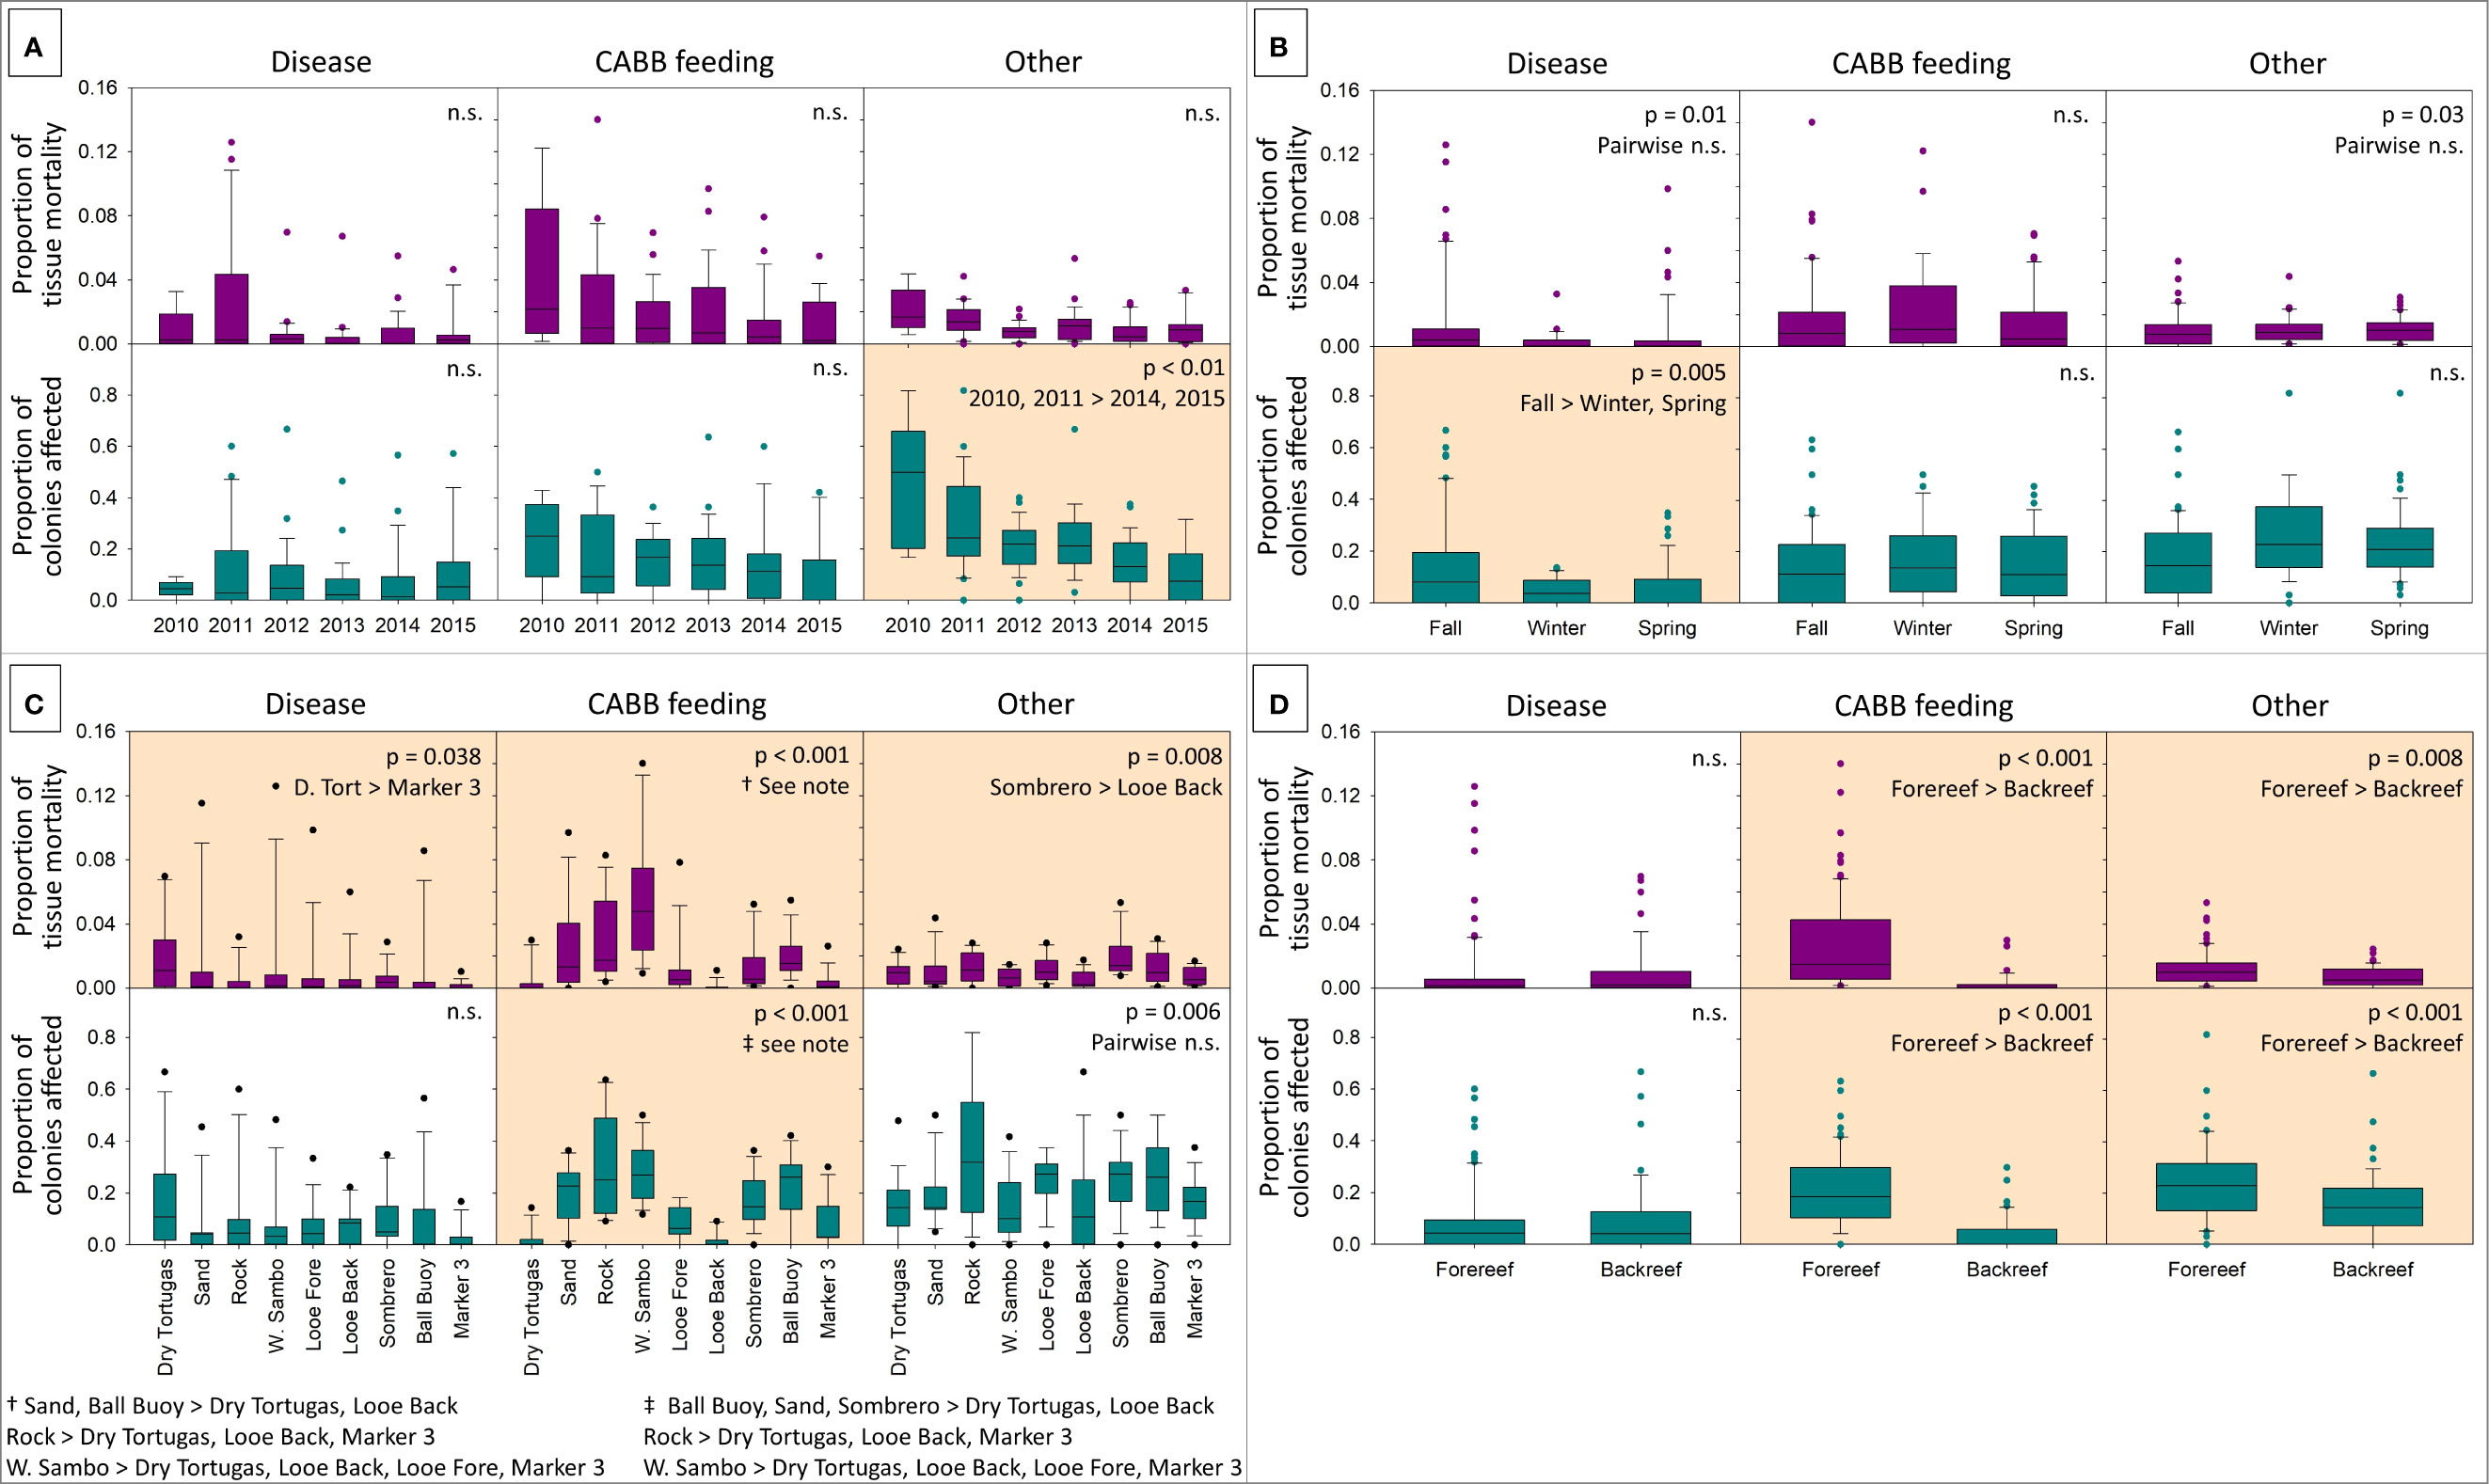
Figure 5 Box plots showing the severity (average proportion of tissue mortality on live colonies within a site: purple) and the prevalence (proportion of colonies affected within a site: teal) on Acropora palmata colonies caused by three stressors: disease, predation by corallivorous snails (Coralliophila abbreviata), and “other.” Stressors are shown by year (A), season (B), site (C), and habitat (D). Boxes show the median with the 25-75th percentiles, whiskers encompass 10-90th percentile of points, and dots are outliers. Analyses with significant differences are shaded and labeled with p-values (Kruskal-Wallis ANOVA on ranks with Dunn’s Method post-hoc comparisons); n.s, not significant.
Geographically, many sites varied from each other in terms of prevalence and severity of stressors (Figure 5C). Prevalence of disease did not vary by site, but severity was higher at the Dry Tortugas site than the Marker 3 site (Kruskal-Wallis ANOVA on Ranks; p = 0.025). Prevalence of “other” did not vary by site, but severity was higher at Sombrero than on the Looe backreef (p = 0.01). Both prevalence and severity of snail predation varied by site. In general, the backreef sites (Dry Tortugas, Looe backreef, and Marker 3) had lower C. abbreviata feeding scar prevalence and severity than many forereef sites, particularly Sand, Rock, and Western Sambo. Specific comparisons and p-values are shown in Figure 5.
When tested by habitat (forereef vs. backreef), there were no differences in severity or prevalence of disease (Figure 5D). There were, however, differences in prevalence and severity of snail predation and “other” mortality sources. The prevalence and severity of snail predation was higher on forereef sites than backreef sites (Kruskal-Wallis ANOVA on Ranks; p < 0.001 for both). And the prevalence and severity of “other” mortality sources was greater for forereef sites than for backreef sites (Kruskal-Wallis ANOVA on Ranks; p < 0.001 for prevalence; p = 0.008 for severity).
Resilience to stressors
Despite stressors occurring at all sites, lower severity at some sites corresponded with local population growth, while periods of higher severity at others corresponded with population decline. Net tissue loss was documented during annual monitoring events at least once at all sites except Looe backreef. In total, 12 instances of decreased LAI were recorded; during 9 of these, the average percent recent mortality had exceeded 10% during the monitoring interval. Average recent mortality values lower than 10% during the previous monitoring intervals were associated with increases in LAI. At some sites (Sand Key and Western Sambo), severity of the stressors as measured by the percent recent mortality was high throughout all monitoring periods; these populations never exhibited notable growth. At others, severity spiked during certain time periods (e.g., Rock Key and Marker 3 in fall 2014), which resulted in a rapid crash within a population that had been steadily growing. These rapid declines in population were not all attributable to the same stressors. For example, at Marker 3, the decline was caused almost entirely by bleaching-related mortality occurring after several months of unrecovered zooxanthellae loss initiated by the 2014 hyperthermal event. In contrast, the colonies at Western Sambo and Rock Key experienced heavy prevalence and severity of white disease, which was coupled with and followed by heavy C. abbreviata predation as the corallivorous snails converged on the remaining tissue.
Discussion
Local populations of monitored A. palmata changed over time as a result of growth and mortality. The variables governing these population dynamics provide insight into the threats and trajectories of the species in Florida, as well as the challenges of predicting the future status of these populations.
The temporal scales compared here (season and year) showed little effect on either prevalence or severity of many stressors. Year had no impact on these metrics for disease, snail predation, or “other” with the exception that “other” prevalence was lower in later years than earlier years. We attribute this primarily to the improved ability of the observers to more properly categorize sources of mortality with additional experience, and we suggest that these stressors are chronic across time for this species. Across seasons, snail predation and other sources of mortality were consistent in prevalence and severity. However, the prevalence of disease was significantly higher in fall than in winter and spring. This corresponds with other observations of increased disease prevalence on A. palmata corresponding with warmer water temperatures (Patterson et al., 2002; Muller et al., 2008; Rogers and Muller, 2012; Williams and Miller, 2012). Plausible explanations for correlation between coral disease and warmer temperatures include host susceptibility, pathogen abundance, and pathogen virulence (Maynard et al., 2015). While disease prevalence was higher on surveyed A. palmata during warm-water (fall) months, the severity of the stressor on impacted colonies was not; colonies affected by disease exhibited similar rates of mortality throughout the year. This suggests that water temperature and seasonality may enhance or inhibit disease transmission, but not reduce the impact to a coral once infected. Previous studies have used metrics including prevalence to identify seasonality; we recommend further experimentation on the impacts of temperature on severity to identify rates of tissue loss of infected corals under different temperature regimes.
The chronic nature of predation, disease, and other minor stressors, which in general resulted in observed recent mortality of 6%, was accompanied by a general upward trajectory of LAI at most sites. Like all populations, A. palmata can be interpreted as living in a balance between growth and loss. That sites could exhibit recent mortality rates of up to ~10% but still exhibit annual increases in tissue is a testament to the rapid growth and healing rates of the species. Corals are generally thought of as poor at recovery, with chronic stressors ultimately causing their demise. This species shows that such stressors can be met and overcome given low enough prevalence and severity. This corresponds with previous and similar work conducted on A. palmata populations in the upper Florida Keys by Williams and Miller (2012), which documented increases in LAI in spite of chronic stressors, but rapid losses following a hurricane and associated disease event.
Nevertheless, we identify that some sites and habitats are more susceptible to stressors than others. Such differences could easily be interpreted to identify that region is an important variable contributing to survival, as was done by Lunz et al. (2016). However, by including the habitat type as a variable of interest, we identify that such regional distinctions mask important underlying scaling within those regions. For example, the two sites within Biscayne National Park, which are 7 km apart, exhibited markedly different stressors and population trajectories between 2010 and 2015. The backreef Marker 3 site had almost no recent mortality and more than doubled its LAI before the 2014 bleaching event resulted in its near extinction. In contrast, the forereef Ball Buoy site had much higher levels of disease and snail predation, resulting in a relatively stable population throughout the monitoring period and hyperthermal event, concluding with no bleaching-associated mortality. Similarly, the Looe forereef and backreef populations were subject to different stressors, with no snail predation or bleaching-related mortality on the backreef. Despite being only 200 meters from each other, the backreef population nearly doubled its population from 2010 to 2015 while the forereef population increased by only 50%. As a third example, the Western Sambo population collapsed to near extinction due to disease and snails in 2011. Only 15 km away, the Rock Key population experienced less impact from stressors and continued to grow until late 2014. Such examples highlight the localized nature of stressors, and they serve as a cautionary tale about generalizing the threats to regions. We suggest that the recommendation by Lunz et al. (2016) to focus A. palmata outplants to the upper and middle Keys based on the amalgamation of data from sites across regions does not account for the high variability that habitat and other factors can play in localized population trends.
One factor that has received little consideration in survival of wild A. palmata is the distinction between forereef and backreef habitats. Acropora palmata is found frequently on the reef crests of spur-and-groove formations, but can also be found in backreef areas. Our data show that in Florida, colonies within these two habitats are affected by different stressors. At the forereef sites, disease and snail predation severely impacted the populations, both at a chronic level and in seasonal acute bursts. These stressors ultimately led to the collapse of the population at three sites. In contrast, at all three backreef sites, snail predation was extremely rare. The largest threat that was observed on backreef colonies was bleaching, which led to the near total loss of the Marker 3 population and was observed more severely at all backreef sites compared to forereef sites. These sites were also more susceptible to breakage and toppling, although this did little to impact the total amount of tissue. Rather, the number of fragments and their attachment and survival at the backreef sites contributed substantially to the increase in LAI at those sites. When considering the stressors to a population, whether wild or in the context of outplanting, we recommend that such habitat variables be heavily considered in anticipating what stressors the population may encounter in the future.
The characteristics of these two habitats that may be impacting the prevalence of stressors are unknown but worth consideration. Backreef colonies were more susceptible to bleaching during hyperthermal summers, and the population crash of the backreef Marker 3 population was the result of colonies remaining without zooxanthellae for months following the 2014 bleaching event. Backreef communities are expected to experience more pronounced summer bleaching conditions because of reduced water flow and higher radiation levels (Gleason and Wellington, 1993) at shallower depth. Coral colonies surviving in these environments would be expected to be more bleaching-resistant than their forereef counterparts, or else to exhibit mortality during past, present, or future hyperthermal events. These backreef colonies though, may be less exposed to other A. palmata stressors. We suggest that the backreef environments surveyed here may have been poor habitat for C. abbreviata snails, perhaps because of the higher wave energy associated with the shallow depths, or because reduced species richness of prey corals provides less desirable C. abbreviata habitat.
We acknowledge there are limitations to these forereef and backreef comparisons in this study. The forereef and backreef environments examined here are not well paired, with only a backreef environment being examined in Dry Tortugas, and only forereef environments being examined at four other sites. While corals within the backreef environments we assessed showed population increases (with the exception of the bleaching-related crash at Marker 3), there are many other reefs, including other sites at which we assessed forereef populations, that do not have A. palmata populations in the backreef area. It is possible that populations have just never established there, or that backreef environments of some reefs are more conducive to A. palmata survivorship than others, or that backreefs are ultimately unsuitable for A. palmata over longer timeframes which were not captured in this study. Understanding how these habitats impact both the corals’ resistance as well as the prevalence and severity of stressors could have broad impacts on our understanding of coral populations as well as management actions such as restoration.
Genotype is a confounding factor in all analyses of Florida A. palmata, including the ones presented here. Genotypes of A. palmata are known to have varying levels of resistance to disease and to bleaching (Muller and van Woesik, 2014; Pausch et al., 2018; Miller et al., 2019). The genetic sampling of the Dry Tortugas colonies identified only a single genotype, as did sampling of the Marker 3 area as reported in Miller et al. (2007). Consideration of stressors and trends of colonies at a site may frequently be a consideration of stressors and trends of an individual genotype. Thus, while we here speculate that survival of backreef colonies is a result of diminished stressors, we cannot rule out that it may be that the genotypes themselves are more resistant to those stressors. Further, we note that substantial loss to a single stressor, such as the case of the Marker 3 colonies during the 2014 bleaching event, may also be a result of genotypic rather than geographic or habitat-related susceptibility. All such interpretations of A. palmata trends in areas of high clonality should be interpreted through such a lens, and we recommend transplantation experiments to better separate the role of genotypic and geographic variables. One such experiment, in which nursery corals of identical genotypes were outplanted to forereefs and mid-channel patch reefs, was conducted by Pausch et al. (2018) through the 2015 hyperthermal event. A. palmata outplants transplanted onto mid-channel patch reefs bleached more severely than clonal replicates placed on the forereefs, and survivorship varied substantially more on the mid-channel colonies, with some genotypes experiencing almost total mortality while others showed higher survivorship than their forereef counterparts. This again highlights the different stressors experienced between habitats, and highlights the correlative role of location and genotype in survival. Genotype and site have variously been examined using Acropora cervicornis outplants, with variation in mortality in one instance being attributed entirely to site-specific bleaching (Drury et al., 2017), and in another attributed to both site and genotype as well as interactions between the two (Million et al., 2022). As in this study, both Drury et al. and Million et al. found that site proximity did not necessarily confer similarities in survival rates. Additional transplant experiments during non-bleaching events are likely to shed further light on genotypic and habitat responses to other stressors.
One additional concern about these results is the non-random sampling of A. palmata sites. The study sites were specifically chosen as some of the last remaining individuals within their regions, and at sites where more colonies were available, the densest areas were selected. As we caution against extrapolating from sites to regions, this strategic selection of the highest-density and/or only remaining sites may not be indicative of the forereef and backreef habitats as a whole. In particular, the large swaths of reef without A. palmata (including those where it was historically present) indicate that not all areas are suitable for either recruitment or survival of the species. Additionally, survival of and stressors impacting individuals outside these higher density selected sites may not be represented by this study. Further, the populations examined here represent the remnants of a once-thriving A. palmata population and may not be representative of trends in the species elsewhere.
With these caveats, we nevertheless make the following conclusions from this work. 1) Within Florida, sites in close proximity to each other can exhibit vastly different population trajectories, suggesting that broader geographic generalizations such as region are unlikely to be good predictors of A. palmata success. 2) Habitat (forereef and backreef) correlates with the stressors that A. palmata colonies within them are experiencing; backreef habitats had overall lower prevalence and severity of common stressors. 3) No single stressor can be attributed to the decline of colonies; different sites were subject to different stressors, and spikes in any of them could lead to unsustainable tissue loss. 4) Sites continued to experience increases in live tissue as long as recent mortality did not exceed approximately 10% of remaining live tissue amount during interim observations; the rapid growth rates of A. palmata seem capable of balancing out this level of mortality, but mortality above this results in population declines.
Such observations may suggest an explanation for the unusual pattern of A. palmata distribution within Dry Tortugas National Park. There is only one known area of A. palmata in the region, located in the Coral Special Protection Zone within the main harbor (Figure 6). However, historic maps from 1881 indicated that A. palmata was not always present at that site, but instead dominated the outer reef crest that protects the east side of the harbor, as well as a few other locations (Agassiz, 1882). By 1976, these forereef populations were gone, and the only remaining A. palmata documented in the Park was the small population that remains today (Davis, 1982). In 2017, we conducted extensive search operations using snorkel tows over the reef crest area and confirmed that while extremely large and long dead A. palmata skeletons were present, this forereef population was indeed extinct.
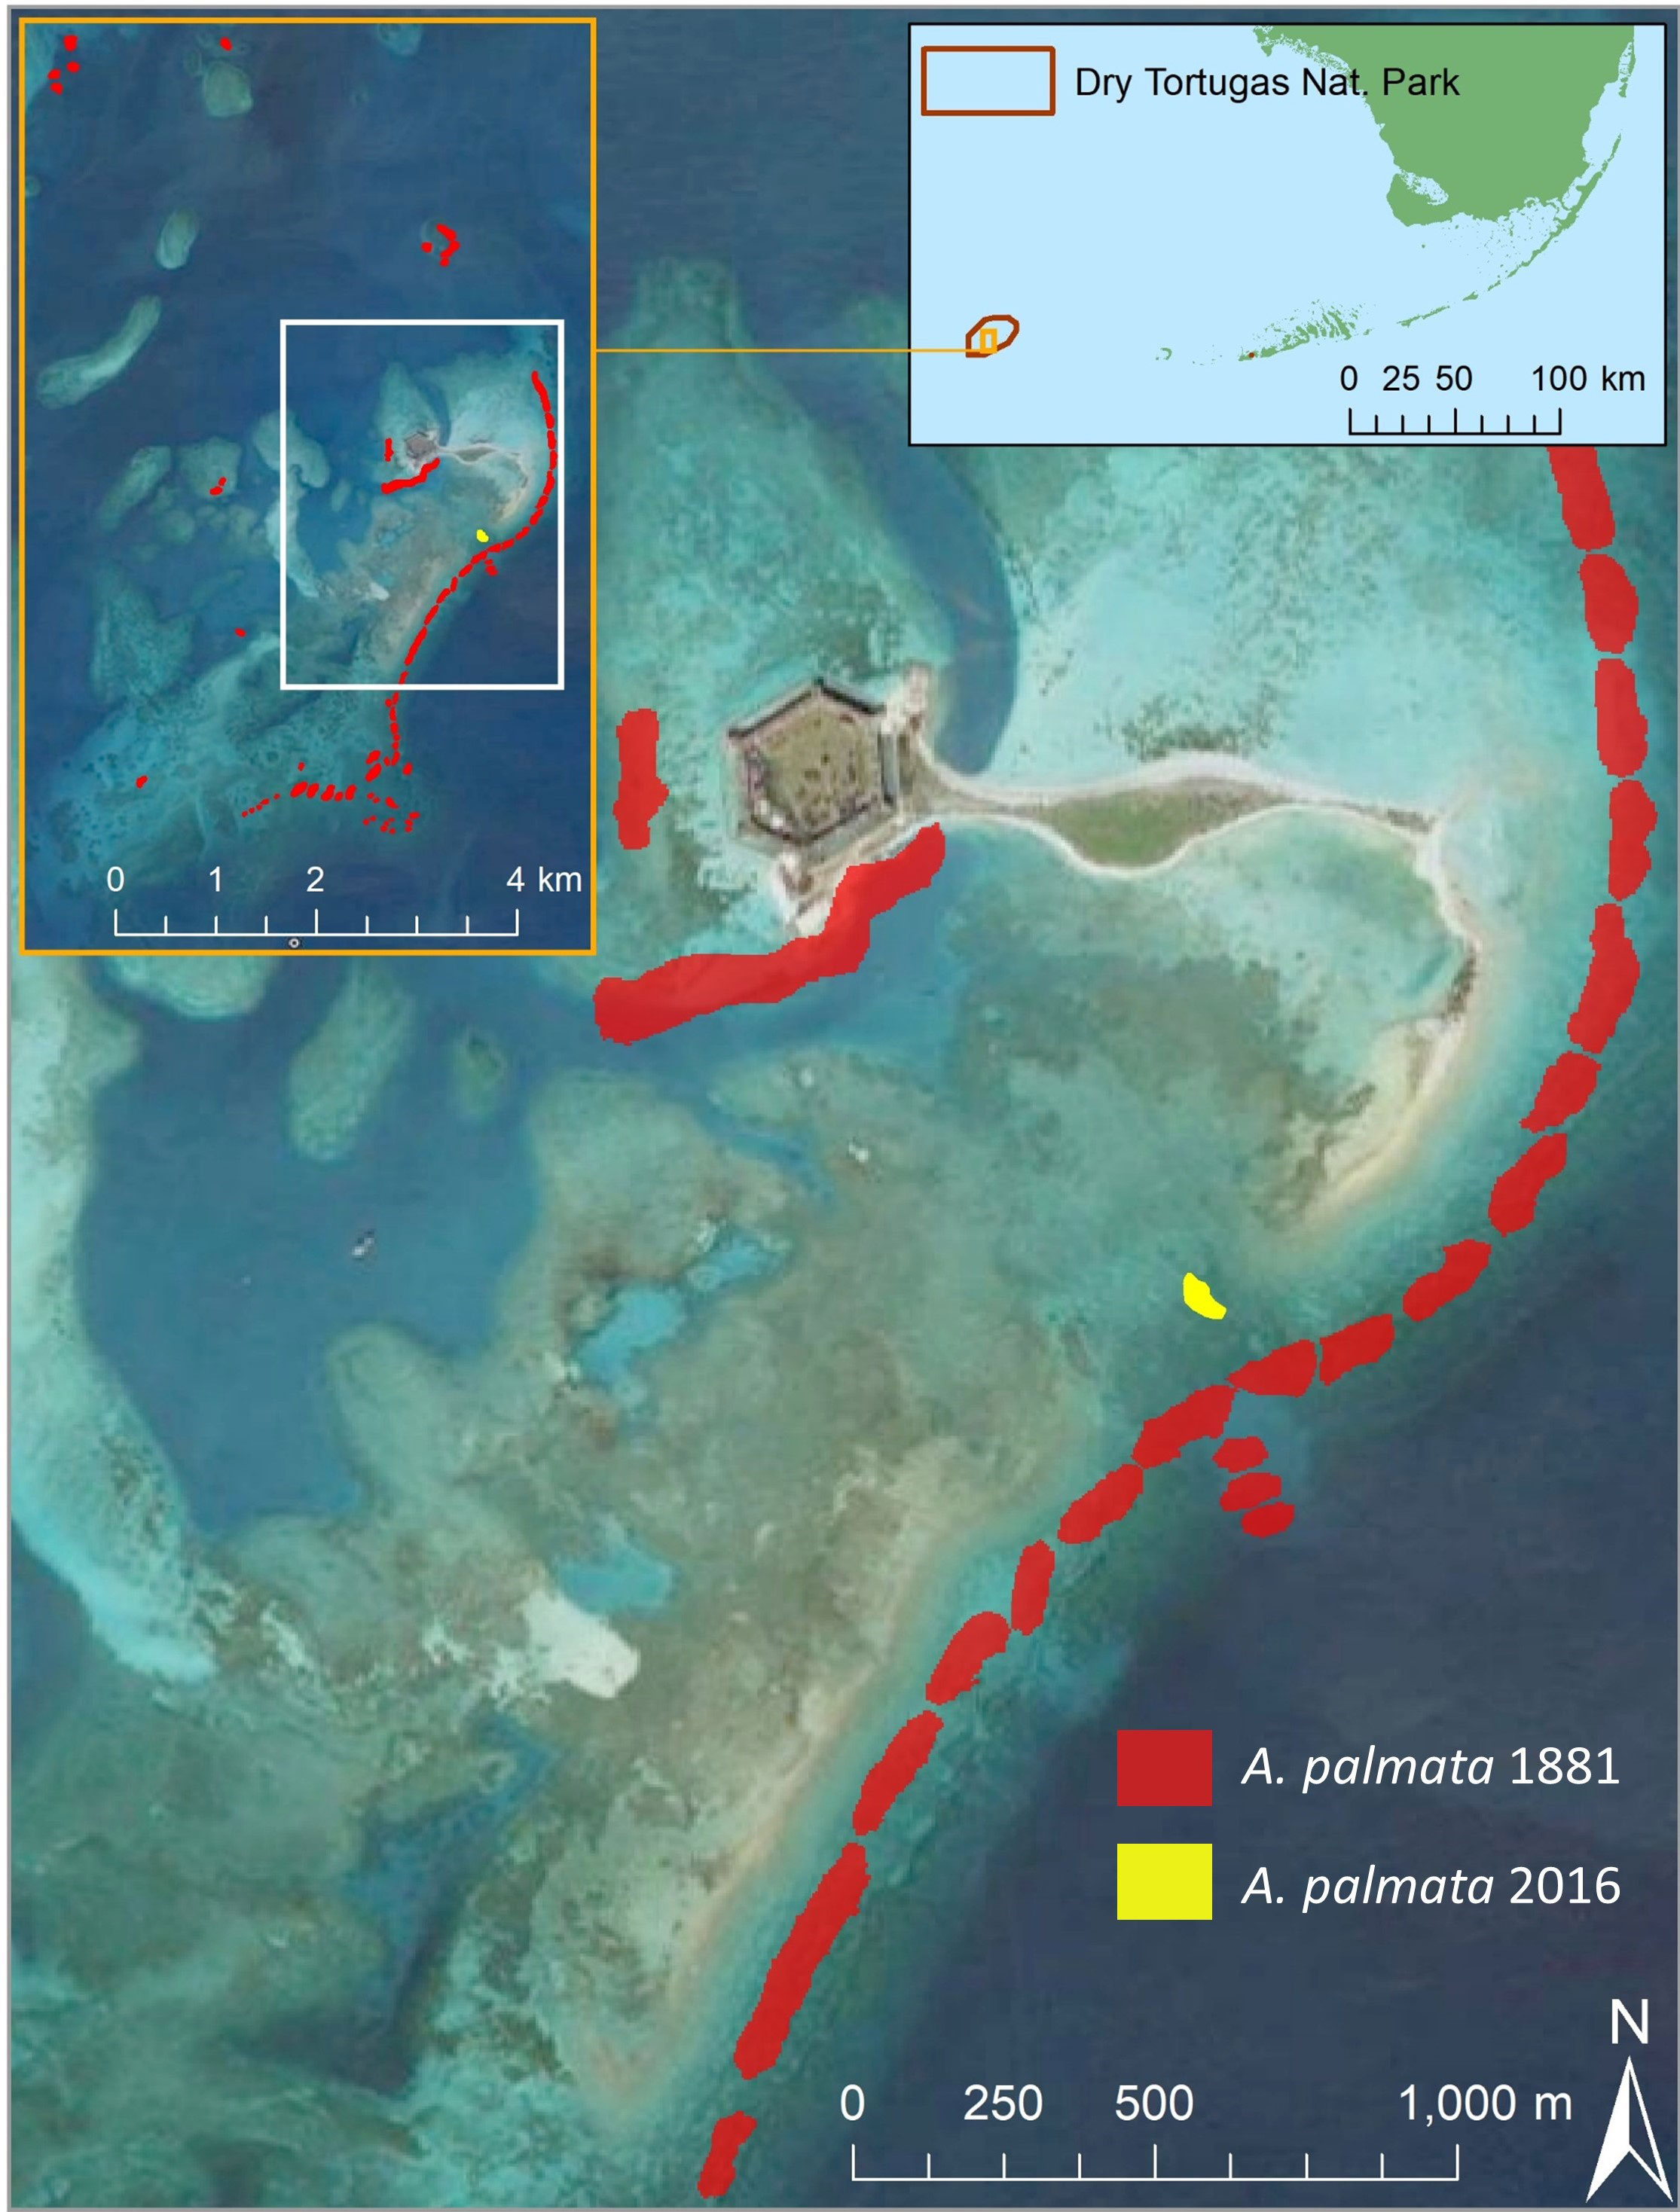
Figure 6 Overlays of current and historical distributions of Acropora palmata within Dry Tortugas National Park. The 1881 distribution (red) as recorded by Agassiz (1882) was in numerous locations throughout the region (left inset), including a high concentration on the forereef east of the main harbor. The current distribution of the species (yellow) is restricted to a small backreef area (~1800 m2) directly landward of a shallow break in the forereef. Imagery courtesy of Google Earth.
Jaap and Sargent (1994) reviewed the changes between the 1881 and 1976 population distributions, which included unpublished notes from 1932. They concluded that some of the forereef sites died before 1932, while others perished between 1932 and 1960. They suggested that the most probable causes of the mortality were hurricanes and cold-water events. Reasoning for their conclusions included A. palmata losses in Jamaica caused by a hurricane and a dieback of Dry Tortugas A. palmata due to a cold-water event in 1977. However, we suggest here that colonies within the shallow backreef where A. palmata remains would be more likely, not less likely, to have experienced mortality from hurricanes and cold-water events than their forereef counterparts. From 2010 to 2015, we observed a high degree of breakage and tumbling of A. palmata colonies in the backreef between monitoring events as a result of normal storm weather, which would be magnified during hurricanes. Underwater hourly temperature data from three winters (2014, 2016, 2017) were compared from loggers the authors placed at the existing A. palmata patch and at a site 1 km south on the forereef. Such comparisons show that minimum winter water temperatures were 1.4 – 2.2° C colder at the backreef than on the forereef. We suggest that the historic losses of A. palmata were not attributable to cold-weather events or hurricanes, as those events would have been highly unlikely to leave the resulting survivors.
The location of the remaining live A. palmata in the Park lies inshore of a shallow break in the reef crest. Microsatellite genetic sampling was conducted by the Baums lab (Pennsylvania State University) using methods outlined in Baums et al. (2006) on 50 of the 79 colonies within the patch; results showed that the site was clonal (Neely, 2015). The samples were also measured for somatic mutations to estimate genet age as per the methodologies of Devlin-Durante et al. (2016). These mutations were detected in 12 of the 50 samples, and indicated the genotype originated between 218 – 1692 years before sampling (Neely, 2015), placing its origin before the 1881 surveys. We propose that between the 1881 and 1976 surveys, storms or wave action drove fragments of an A. palmata colony through the shallow break in the reef into the back reef. Also in that time frame, differential stressors between the forereef and backreef resulted in different population trajectories. Though A. palmata diseases were not documented until the late 1970s (after the die-off in the Dry Tortugas) (Gladfelter et al., 1977; Holden, 1996), it is almost certain that coral colonies experienced some level of disease prior to that; similarly, we consider it likely that the presence of corallivorous snails has been continuous in the region. We suggest that the forereef population was not decimated by a single event, but rather was subject to chronic stressors, which between 1881 and 1976 exceeded the capacity for coral growth to balance. The observations highlighted in the unpublished notes considered by Jaap and Sargent (1994) of the two adjacent forereefs having different dates of mortality support this hypothesis. While these forereefs were experiencing the stressors that would ultimately lead to their demise, the environment within the backreef was devoid of or at least much less affected by these stressors. The result is a single, clonal, thriving backreef population while all other A. palmata within the Park was driven to extinction.
The remaining Dry Tortugas clonal population, which by itself is incapable of genetic recombination and reproduction, remains a subject of discussion for Park management. Experimental efforts by Kuffner et al. (2020) to transplant genotypes from elsewhere in the Florida Keys along with fragments from the remaining Tortugas genotype into an alternate area of the Park represent the first Park management efforts to translocate coral species; the successful growth and establishment of those genotypes suggests a future for this species within the region.
Data availability statement
The raw data supporting the conclusions of this article will be made available by the authors, without undue reservation.
Author contributions
KL led the funding and project design. KN and KM led data collection. KN conducted analyses and led manuscript preparation. All authors provided feedback on the manuscript. All authors contributed to the article and approved the submitted version.
Funding
Funding for this project was received from NOAA/NMFS Species Conservation Grants to States (NA10NMF4720029) and the Office of Protected Resources (NA15NMF4720280). A portion of the work in Dry Tortugas was funded through the National Park Service under agreements #P13AC01267 and #P15AC01272.
Acknowledgments
We are grateful to Iliana Baums and her lab for conducting the A. palmata genetic sampling at Dry Tortugas and to the staff at Dry Tortugas National Park for their assistance with cooperative agreements and field logistics within the Park. We are grateful also to Greg Ward who conducted the initial baseline surveys, and to Emily Hower who assisted with field work at Dry Tortugas. We extend our thanks to Dave Zawada who assisted with the georeferenced Dry Tortugas maps and to Dana Williams for training on survey protocols. Research was conducted under permits from the Florida Keys National Marine Sanctuary (FKNMS2010-126 and FKNMS-2013-104), Biscayne National Park (BISC-2010-SCI-0044, BISC-2011-SCI0026, BISC-2012-SCI-0026, BISC-2014-SCI-0032, and BISC-2015-SCI-0019), Dry Tortugas National Park (DRTO-2010-SCI-0025, DRTO-2011-SCI-0016, DRTO-2012-SCI-0018, DRTO-2013-SCI-0016, DRTO-2014-SCI-0010, and DRTO-2015-SCI-0018).
Conflict of interest
The authors declare that the research was conducted in the absence of any commercial or financial relationships that could be construed as a potential conflict of interest.
Publisher’s note
All claims expressed in this article are solely those of the authors and do not necessarily represent those of their affiliated organizations, or those of the publisher, the editors and the reviewers. Any product that may be evaluated in this article, or claim that may be made by its manufacturer, is not guaranteed or endorsed by the publisher.
References
Agassiz A. (1882). Explorations of the surface fauna of the Gulf Stream, under the auspices of the United States Coast Survey. II. Tortugas. Florida Reefs. Mem. Acad. Arts. Sci. Centennial. 2, 107–134.
Aronson R., Bruckner A., Moore J. A., Precht B., Weil E. (2008). Acropora palmata. The IUCN Red List of Threatened Species
Aronson R. B., Precht W. F. (2001). White-band disease and the changing face of Caribbean coral reefs. Hydrobiologia 460, 25–38. doi: 10.1023/A:1013103928980
Baums I., Miller M E., Hellberg M. (2006). Geographic variation in clonal structure in a reef-building Caribbean coral, Acropora palmata Ecological Monographs. 76, 503–19 .doi: 10.1890/0012-9615(2006)076[0503:GVICSI]2.0.CO;2
Bright A. J., Rogers C. S., Brandt M. E., Muller E., Smith T. B. (2016). Disease prevalence and snail predation associated with swell-generated damage on the threatened coral, Acropora palmata (Lamarck). Front. Mar. Sci. 3, 77. doi: 10.3389/fmars.2016.00077
Cramer K. L., Jackson J. B., Donovan M. K., Greenstein B. J., Korpanty C. A., Cook G. M., et al. (2020). Widespread loss of Caribbean acroporid corals was underway before coral bleaching and disease outbreaks. Sci. Adv. 6, eaax9395. doi: 10.1126/sciadv.aax9395
Davis G. E. (1982). A century of natural change in coral distribution at the Dry Tortugas - a comparison of reef maps from 1881 and 1976. B. Mar. Sci. 32, 608–623.
Devlin-Durante M. K., Miller M. W., Group C. A. R., Precht W. F., Baums I. B. (2016). How old are you? Genet age estimates in a clonal animal. Mol. Ecol. 25, 5628–5646. doi: 10.1111/mec.13865
Drury C., Manzello D., Lirman D. (2017). Genotype and local environment dynamically influence growth, disturbance response and survivorship in the threatened coral, Acropora cervicornis. PloS One 12, e0174000. doi: 10.1371/journal.pone.0174000
Gladfelter W. B. (1982). White-band disease in Acropora palmata: implications for the structure and growth of shallow reefs. B. Mar. Sci. 32, 639–643.
Gladfelter W. B., Gladfelter E. H., Monahan R. K., Ogden J. C., Dill R. F. (1977). “Environmental studies of Buck Island Reef National Monument,” in US National park service report, 144.
Gleason D. F., Wellington G. M. (1993). Ultraviolet radiation and coral bleaching. Nature 365, 836–838. doi: 10.1038/365836a0
Goreau T. F., Wells J. (1967). The shallow-water scleractinia of Jamaica: revised list of species and their vertical distribution range. B. Mar. Sci. 17, 442–453.
Grober-Dunsmore R., Bonito V., Frazer T. K. (2006). Potential inhibitors to recovery of Acropora palmata populations in St. John, US Virgin Islands. Mar. Ecol. Prog. Ser. 321, 123–132. doi: 10.3354/meps321123
Hogarth W. T. (2006). Endangered and threatened species: final listing determinations for elkhorn coral and staghorn coral. Federal Register. 71 (89), 26852–26861.
Holden C. (1996). Coral disease hot spot in Florida Keys. Science 274, 2017–2017. doi: 10.1126/science.274.5295.2017
Jaap W., Sargent F. J. (1994). “The status of the remnant population of Acropora palmata (Lamarck 1816) at Dry Tortugas National Park, Florida, with a discussion of possible causes of changes since 1881,” Oceanographic Literature Review 9 (42), 777.
Jackson J. B. C. (1992). Pleistocene perspectives on coral-reef community structure. Am. Zool. 32, 719–731. doi: 10.1093/icb/32.6.719
Kayanne H. (2017). Validation of degree heating weeks as a coral bleaching index in the northwestern Pacific. Coral Reefs. 36, 63–70. doi: 10.1007/s00338-016-1524-y
Kramer K. L., Williams D., Miller M., Bégin C., Fry J., Valdivia A. (2008). “Demographic comparison of threatened elkhorn coral, Acropora palmata, in the Caribbean: A case study in successful volunteer partnerships in a regional-scale monitoring program,” in Proc. 11th. Int. Coral Reef. Sym. The Proceedings of the ICRS 765–769.
Kuffner I. B., Stathakopoulos A., Toth L. T., Bartlett L. A. (2020). Reestablishing a stepping-stone population of the threatened elkhorn coral Acropora palmata to aid regional recovery. Endangered Species. Res. 43, 461–473. doi: 10.3354/esr01083
Lapointe B. E., Brewton R. A., Herren L. W., Porter J. W., Hu C. (2019). Nitrogen enrichment, altered stoichiometry, and coral reef decline at Looe Key, Florida Keys, USA: a 3-decade study. Mar. Biol. 166, 108. doi: 10.1007/s00227-019-3538-9
Lirman D. (2000). Fragmentation in the branching coral Acropora palmata (Lamarck): growth, survivorship, and reproduction of colonies and fragments. J. Exp. Mar. Biol. Ecol. 251, 41–57. doi: 10.1016/S0022-0981(00)00205-7
Lunz K. S., Shea C. P., Ames K. W., Neely K. L., Goergen E., Williams D., et al. (2016). Acropora palmata’s last stand in Florida?, in Proc. 13th. Int. Coral Reef. Symp. Proceedings of ICRS. 2–22.
Manzello D. P. (2015). Rapid recent warming of coral reefs in the Florida Keys. Sci. Rep. 5, 1–10. doi: 10.1038/srep16762
Maynard J., van Hooidonk R., Eakin C. M., Puotinen M., Garren M., Williams G., et al. (2015). Projections of climate conditions that increase coral disease susceptibility and pathogen abundance and virulence. Nat. Climate Change 5, 688–694. doi: 10.1038/nclimate2625
McWilliams J. P., Côté I. M., Gill J. A., Sutherland W. J., Watkinson A. R. (2005). Accelerating impacts of temperature-induced coral bleaching in the Caribbean. Ecology 86, 2055–2060. doi: 10.1890/04-1657
Miller M. W. (2001). Corallivorous snail removal: evaluation of impact on Acropora palmata. Coral Reefs. 19, 293–295. doi: 10.1007/PL00006963
Miller M. W., Baums I. B., Williams D. E. (2007). Visual discernment of sexual recruits is not feasible for Acropora palmata. Mar. Ecol. Prog. Ser. 335, 227–231. doi: 10.3354/meps335227
Miller M. W., Colburn P. J., Pontes E., Williams D. E., Bright A. J., Serrano X. M., et al. (2019). Genotypic variation in disease susceptibility among cultured stocks of elkhorn and staghorn corals. PeerJ 7, e6751. doi: 10.7717/peerj.6751
Million W. C., Ruggeri M., O’Donnell S., Bartels E., Krediet C. J., Kenkel C. D. (2022). Evidence for adaptive morphological plasticity in the Caribbean coral, Acropora cervicornis. bioRxiv. doi: 10.1101/2022.03.04.483038
Muller E., Rogers C. S., Spitzack A. S., Van Woesik R. (2008). Bleaching increases likelihood of disease on Acropora palmata (Lamarck) in Hawksnest Bay, St. John, US Virgin Islands. Coral Reefs. 27, 191–195. doi: 10.1007/s00338-007-0310-2
Muller E. M., van Woesik R. (2014). Genetic susceptibility, colony size, and water temperature drive white-pox disease on the coral Acropora palmata. PloS One 9, e110759. doi: 10.1371/journal.pone.0110759
Neely K. L. (2015). “Seasonal and long-term change, genetic diversity, and reproductive potential of ESA-listed coral species in Dry Tortugas National Park,” Annual permit report to Dry Tortugas National Park, 12.
NOAA (2013-2019). NOAA Coral Reef Watch Version 3.1 Daily Global 5-km Satellite Coral Bleaching Degree Heating Week Product (College Park, MD, USA).
Patterson K. L., Porter J. W., Ritchie K. E., Polson S. W., Mueller E., Peters E. C., et al. (2002). The etiology of white pox, a lethal disease of the Caribbean elkhorn coral, Acropora palmata. P Natl. Acad. Sci. U.S.A. 99, 8725–8730. doi: 10.1073/pnas.092260099
Pausch R. E., Williams D. E., Miller M. W. (2018). Impacts of fragment genotype, habitat, and size on outplanted elkhorn coral success under thermal stress. Mar. Ecol. Prog. Ser. 592, 109–117. doi: 10.3354/meps12488
Randall C. J., Szmant A. M. (2009). Elevated temperature affects development, survivorship, and settlement of the elkhorn coral, Acropora palmata (Lamarck 1816). Biol. Bull. 217, 269–282. doi: 10.1086/BBLv217n3p269
Rogers C. S., Muller E. M. (2012). Bleaching, disease and recovery in the threatened scleractinian coral Acropora palmata in St. John, US Virgin Islands: 2003-2010. Coral Reefs. 31, 807–819. doi: 10.1007/s00338-012-0898-8
Shinn E. (1980). Geologic History of Grecian Rocks, Key Largo Coral Reef Marine Sanctuary. B. Mar. Sci. 30, 646–656.
Williams D. E., Miller M. W. (2005). Coral disease outbreak: pattern, prevalence and transmission in Acropora cervicornis. Mar. Ecol. Prog. Ser. 301, 119–128. doi: 10.3354/meps301119
Williams D. E., Miller M. W. (2006). Importance of disease and predation to the growth and survivorship of juvenile Acropora palmata and Acropora cervicornis: a demographic approach. Proc. 10th. Int. Coral Reef. Symp. 1, 1096–1104.
Williams D. E., Miller M. W. (2012). Attributing mortality among drivers of population decline in Acropora palmata in the Florida Keys (USA). Coral Reefs. 31, 369–382. doi: 10.1007/s00338-011-0847-y
Williams D. E., Miller M. W., Bright A. J., Cameron C. M. (2014). Removal of corallivorous snails as a proactive conservation tool for the conservation of acroporid corals. PeerJ 2, e680. doi: 10.7717/peerj.680
Williams D., Miller M., Bright A., Pausch R., Valdivia A. (2017). Thermal stress exposure, bleaching response, and mortality in the threatened coral Acropora palmata. Mar. Pollut. Bull. 124, 189–197. doi: 10.1016/j.marpolbul.2017.07.001
Williams D. E., Miller M. W., Kramer K. L. (2006). “Demographic monitoring protocols for threatened Caribbean acropora spp. corals,” in NOAA Technical memorandum NMFS-SEFSC-543, 91.
Keywords: Acropora palmata, Florida Keys, Dry Tortugas, coral bleaching, disease
Citation: Neely KL, Macaulay KA and Lunz KS (2022) Population trajectory and stressors of Acropora palmata sites in the Florida Keys. Front. Mar. Sci. 9:978785. doi: 10.3389/fmars.2022.978785
Received: 26 June 2022; Accepted: 22 September 2022;
Published: 14 October 2022.
Edited by:
Jesús Ernesto Arias González, Instituto Politécnico Nacional de México (CINVESTAV), MexicoReviewed by:
Erinn M Muller, Mote Marine Laboratory and Aquarium, United StatesJennifer Lentz, Coalition for Clean Air, United States
Copyright © 2022 Neely, Macaulay and Lunz. This is an open-access article distributed under the terms of the Creative Commons Attribution License (CC BY). The use, distribution or reproduction in other forums is permitted, provided the original author(s) and the copyright owner(s) are credited and that the original publication in this journal is cited, in accordance with accepted academic practice. No use, distribution or reproduction is permitted which does not comply with these terms.
*Correspondence: Karen L. Neely, a25lZWx5MEBub3ZhLmVkdQ==