 Zhen Zhang
 Zongcai Cai
 Junhua Yang
 Xiaohui Guo
- 1School of Geomatics, Anhui University of Science and Technology, Huainan, China
- 2Key Laboratory of Aviation-Aerospace-Ground Cooperative Monitoring and Early Warning of Coal Mining-induced Disasters of Anhui Higher Education Institutes, Anhui University of Science and Technology, Huainan, China
- 3Coal Industry Engineering Research Center of Mining Area Environmental and Disaster Cooperative Monitoring, Anhui University of Science and Technology, Huainan, China
- 4State Key Laboratory of Cryospheric Science, Northwest Institute of Eco-Environment and Resources, Chinese Academy Sciences, Lanzhou, China
Coastal estuarine wetlands are important transition zones between rivers and oceans and are extremely rich in biodiversity. In recent years in China, large-scale reclamation and development of coastal cities have imposed serious pressures on coastal ecosystems. Thus, assessing the ecological quality of estuarine wetlands is extremely important for sustainable development. Our study focuses on four typical estuarine wetlands at the mouths of the Yangtze, Yellow, Liaohe and PearRivers. Their ecological quality between 2000 and 2020 was assessed using a remote sensing ecological index (RSEI), which was derived from several remote sensing indexes processed via the online Google Earth Engine platform. From 2000 to 2020, the RSEIs of coastal wetland increased from 0.42 to 0.63 in the Liao River estuary, 0.27 to 0.45 in the Pearl River estuary and from 0.47 to 0.54 in the Yangtze River estuary, and decreased from 0.56 to 0.49 in the Yellow River estuary. The spatial distribution in ecological environmental quality was significantly clustered. High-high clusters occurred mainly in areas of lush vegetation, while low-low clusters were mostly found in built-up areas or coastal zones. Aquacultural and built-up areas had negative impacts on the ecological environment, while vegetation cover had a positive influence. The quality of the ecological environment within these wetlands has gradually improved due to the environmental management policies of national and local governments. This approach to evaluating the ecological quality of estuarine wetlands using the RSEI and Google Earth Engine provides critical information to inform sustainable development policy.
Introduction
Wetlands are one of the world’s three main types of natural ecosystems (Zedler and Kercher, 2005). As well as being crucial to human health and well-being, they are essential in maintaining the ecological balance of the planet and regional ecological security (Jogo and Hassan, 2010). Estuarine wetlands are characterized by their dual roles as both aquatic and terrestrial ecosystems (Ma et al., 2014). As a result, they affect many aspects of climate regulation, carbon storage, water storage and shoal protection, wave prevention and shore fixation, water purification and biodiversity preservation. (Cui et al., 2016). Due to a changing climate and human activities, China’s rapidly changing estuarine wetland ecosystems are at risk of serious degradation (Chi et al., 2018). Understanding their long-term evolution and the characteristics of estuarine wetland ecological environmental quality are important parts of research on wetland ecological restoration and the implementation of wetland protection and restoration projects.
A large number of estuarine wetland systems occur in coastal areas of China due to its numerous outflowing water systems and long southeastern coastline (Jiang et al., 2015). Representative areas include the estuarine wetlands of the Yangtze, Yellow, Liao and Pearl Rivers (Wang et al., 2021). Estuarine wetlands have an extremely rich biodiversity. They are not only important habitats for waterbirds migrating between East Asia and Australia but are also breeding rich fishery resources and provide a natural ecological security barrier for the economically developed coastal areas of China (Sun et al., 2015). As a result of intensifying climate change and human activities in recent decades, coastal wetland ecosystems have undergone substantial changes, with more than 50% of China’s wetland area being lost (Wang et al., 2021). The large-scale development and exploitation of wetland resources have caused sharp declines in wetland ecosystems and their functioning and biodiversity. This has impacted ecological security and sustainable socio-economic development in China’s coastal areas (Mao et al., 2022). However, previous field surveys have had difficulty in assessing ecological environmental quality at large regional scales (Hu et al., 2018). Geospatial data on the eco-environmental quality of coastal estuarine wetlands in China have not been fully studied over the past 20 years.
Remote sensing technology provides a wide range of data for ecosystem monitoring and has provided reliable ecological indicators in recent years. Several remote sensing indices have been developed to quantify ecological conditions (Pettorelli et al., 2005; Jiang et al., 2021; Prăvălie et al., 2022). Among them, the normalized difference vegetation index (NDVI) and other vegetation indices are the single indexes most commonly used in ecological studies (Stefanov and Netzband, 2005; Wang et al., 2022). There are also several other single indicators that perform well in eco-environmental assessment, such as the permanent vegetation fraction (PVF; (Ivits et al., 2009), which has been used to assess the ecological status and dynamics of the Andalusian riparian zone. However, it is insufficient to use a single ecological index to assess the status of an ecosystem because of the complexity and diversity of potential influences. The integration of multiple ecological indices has advantages in providing more fine-scaled monitoring of ecological conditions. Many studies have integrated multiple indexes to generate new indexes (Tiner, 2004; Wang et al., 2019). For example, Wang et al. (2019) integrated the vegetation coverage index, biological abundance index, land degradation index and water density index to establish the eco-environmental quality index. However, although these multi-factor indexes can reflect the eco-environmental quality of a region, their weights need to be determined by repeated experimentation, which may be greatly affected by artificial interference or subjective influences, resulting in different weights being used in different fields. In addition, floristic quality indices (FQI; (Bourdaghs et al., 2006), the index of biotic integrity (IBI; (Yang et al., 2018), indicator species (Siddig et al., 2016), hydrological and geomorphological indexes (Beuel et al., 2016), landscape patterns (Gu et al., 2006) and other indicators have been applied to wetland ecological environmental assessment. However, it can be difficult to obtain these indicators, many of which cannot reflect spatial variation. The remote sensing ecological index (RSEI) integrates a variety of indicators and does not need weights to be determined manually. It can provide objective, rapid, and efficient information on the ecological environment of a region (Xu et al., 2019). The RSEI method is widely used for rapid monitoring and evaluation in regional ecological environments (Jing et al., 2020; Xiong et al., 2021). While it has been applied to wetland areas (Wang et al., 2021), these applications are relatively scarce and have not been used in China’s coastal estuarine wetlands. Accordingly, the present paper applies the RSEI to the study of four typical estuarine wetlands to explore its applicability to coastal wetland research.
While the RSEI can be applied to a wide range of topics, the large volumes of data involved and the complexity of their processing present challenges. The Google Earth Engine (GEE) platform not only contains a large archive of remote sensing data but is also a cloud-based service that offers data processing by high-performance parallel computing. Using the Application Programming Interface and the web-based interactive development environment of the GEE, researchers can access, operate and visualize massive amounts of data on the cloud (Gorelick et al., 2017).
Coastal wetland refers to waters with a depth of less than 6 m at low tide and associated saturated coastal areas, including intertidal zones and coastal lowlands. In this study, RSEI data were used with the GEE to investigate the relationships between four typical estuarine wetlands without permanent water and to monitor and evaluate their ecological and environmental quality from 2000 to 2020. The aim was to study the ecological environmental quality in this region and accurately estimate its status and spatio-temporal dynamics. The results provide scientific support and technical assistance for the formulation of environmental protection policies and for the evaluation of ecological engineering projects in this region, which will promote sustainable development of the local economy, society and environment.
Data and methods
Study area
The study area (Figure 1) covered four major estuarine deltas in China (Liao River, Yellow River, Yangtze River and Pearl River).
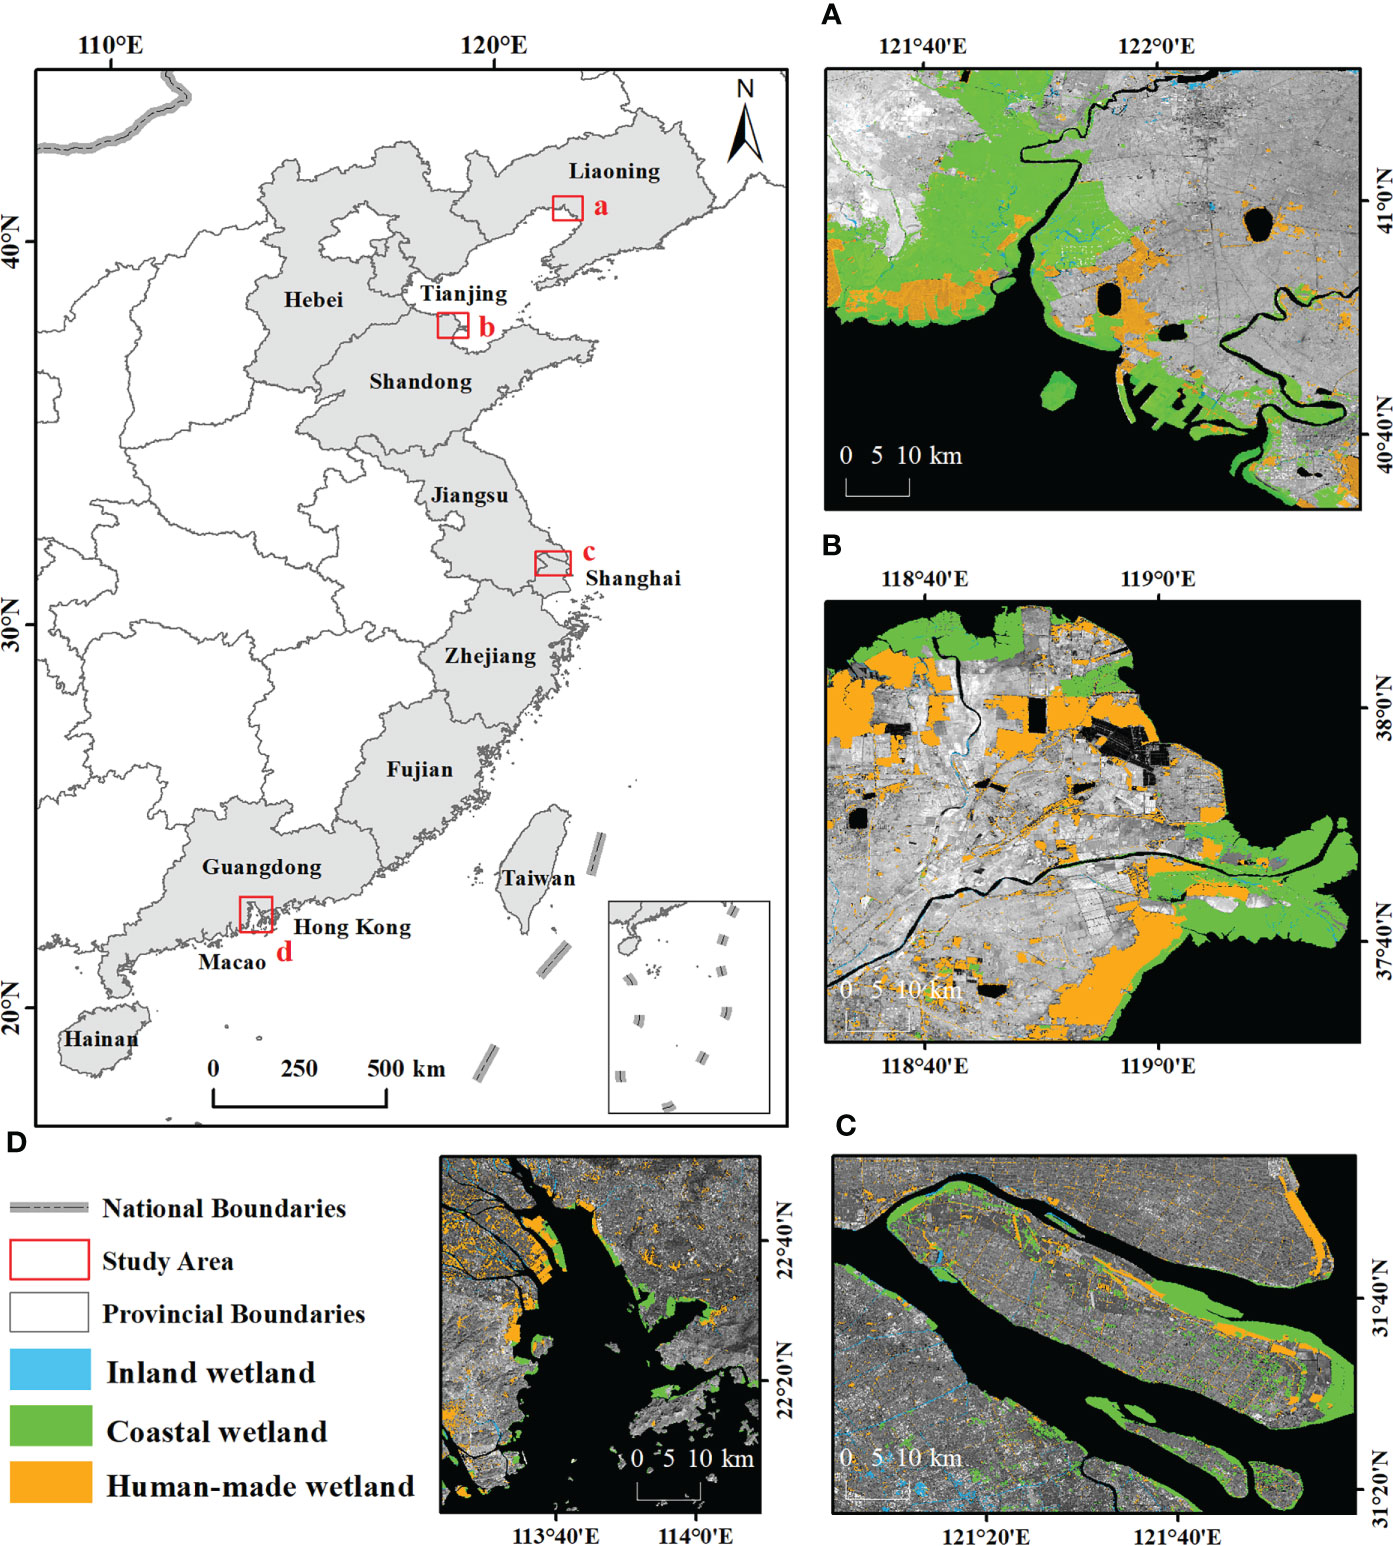
Figure 1 Map of the study areas (top left) with satellite images of the (A) LRE, (B) YRE, (C) YTRE and (D) PRE with wetland areas highlighted.
The Liao River Estuary (LRE; 40° 40’–41° 25’ N, 121° 25’–123° 55’ E) is located in the southern Liaohe Plain and to the north of Liaodong Bay in the Bohai Sea. It is the largest warm-temperate coastal wetland in Asia and has an average annual temperature of 8.4°C and average annual precipitation of 623 mm (Li et al., 2021).
The Yellow River Estuary (YRE; 37° 59’–37° 91’ N, 119° 09’–119° 39’ E) is located at the junction of the Bohai Sea and Laizhou Bay. The wetland here is the best preserved, most typical and youngest wetland ecosystem in this warm temperate region. It has an average annual temperature of 12.1°C and average annual precipitation of 552 mm (Cui et al., 2009).
The Yangtze River Estuary (YTRE; 30° 42’–31° 56’ N, 121° 36’–122° 12’ E) is mainly located in Shanghai and Nantong, Jiangsu Province. It has an average annual temperature of 15.3°C and average annual precipitation of 1022 mm (Zhao et al., 2009).
The Pearl River Estuary (PRE; 21° 52’–22° 46’ N, 112° 58’–114° 3’ E) contains waters near Lingdingyang Bay, Huangmao Sea, Hengqin Island and Nanshui Island. The surrounding land, from east to west, features the cities of Hong Kong, Shenzhen, Dongguan, Zhongshan, Zhuhai and Macao. Since the 1980s, China began to implement a policy of reform and opening-up, giving priority to the development of coastal areas. Gradually, a coastal economic belt centred on the PRE was formed. It has an average annual temperature of 21.9°C and average precipitation of 1647 mm (Lu et al., 2020).
Data source and data processing
Landsat 5 surface reflectance datasets for 2000, 2005, 2010 and Landsat 8 surface reflectance datasets for 2013, 2015, 2018 and 2020 were obtained via the GEE platform. These datasets contained Landsat data with radiometric and atmospheric corrections. Pixel values in the visible, near-infrared and short-wave infrared bands are corrected surface reflectance, and pixel values in the thermal infrared band are corrected temperature values at the sensor. To avoid cloud cover degrading the data quality, we selected images with< 20% cloud cover in a year; except in the PRE (a subtropical monsoon climate zone with more cloud cover), for which the threshold was< 50%. Then, based on pixel quality assessment (QA) band data provided by GEE, the clouds and shadows in the original data were removed. Finally, the mean values of these data were used to synthesize good-quality surface reflectance data, which was prepared for the calculation of ecological parameters. The technical process is shown in Figure 2 and the specific methods are introduced in Section 2.3.
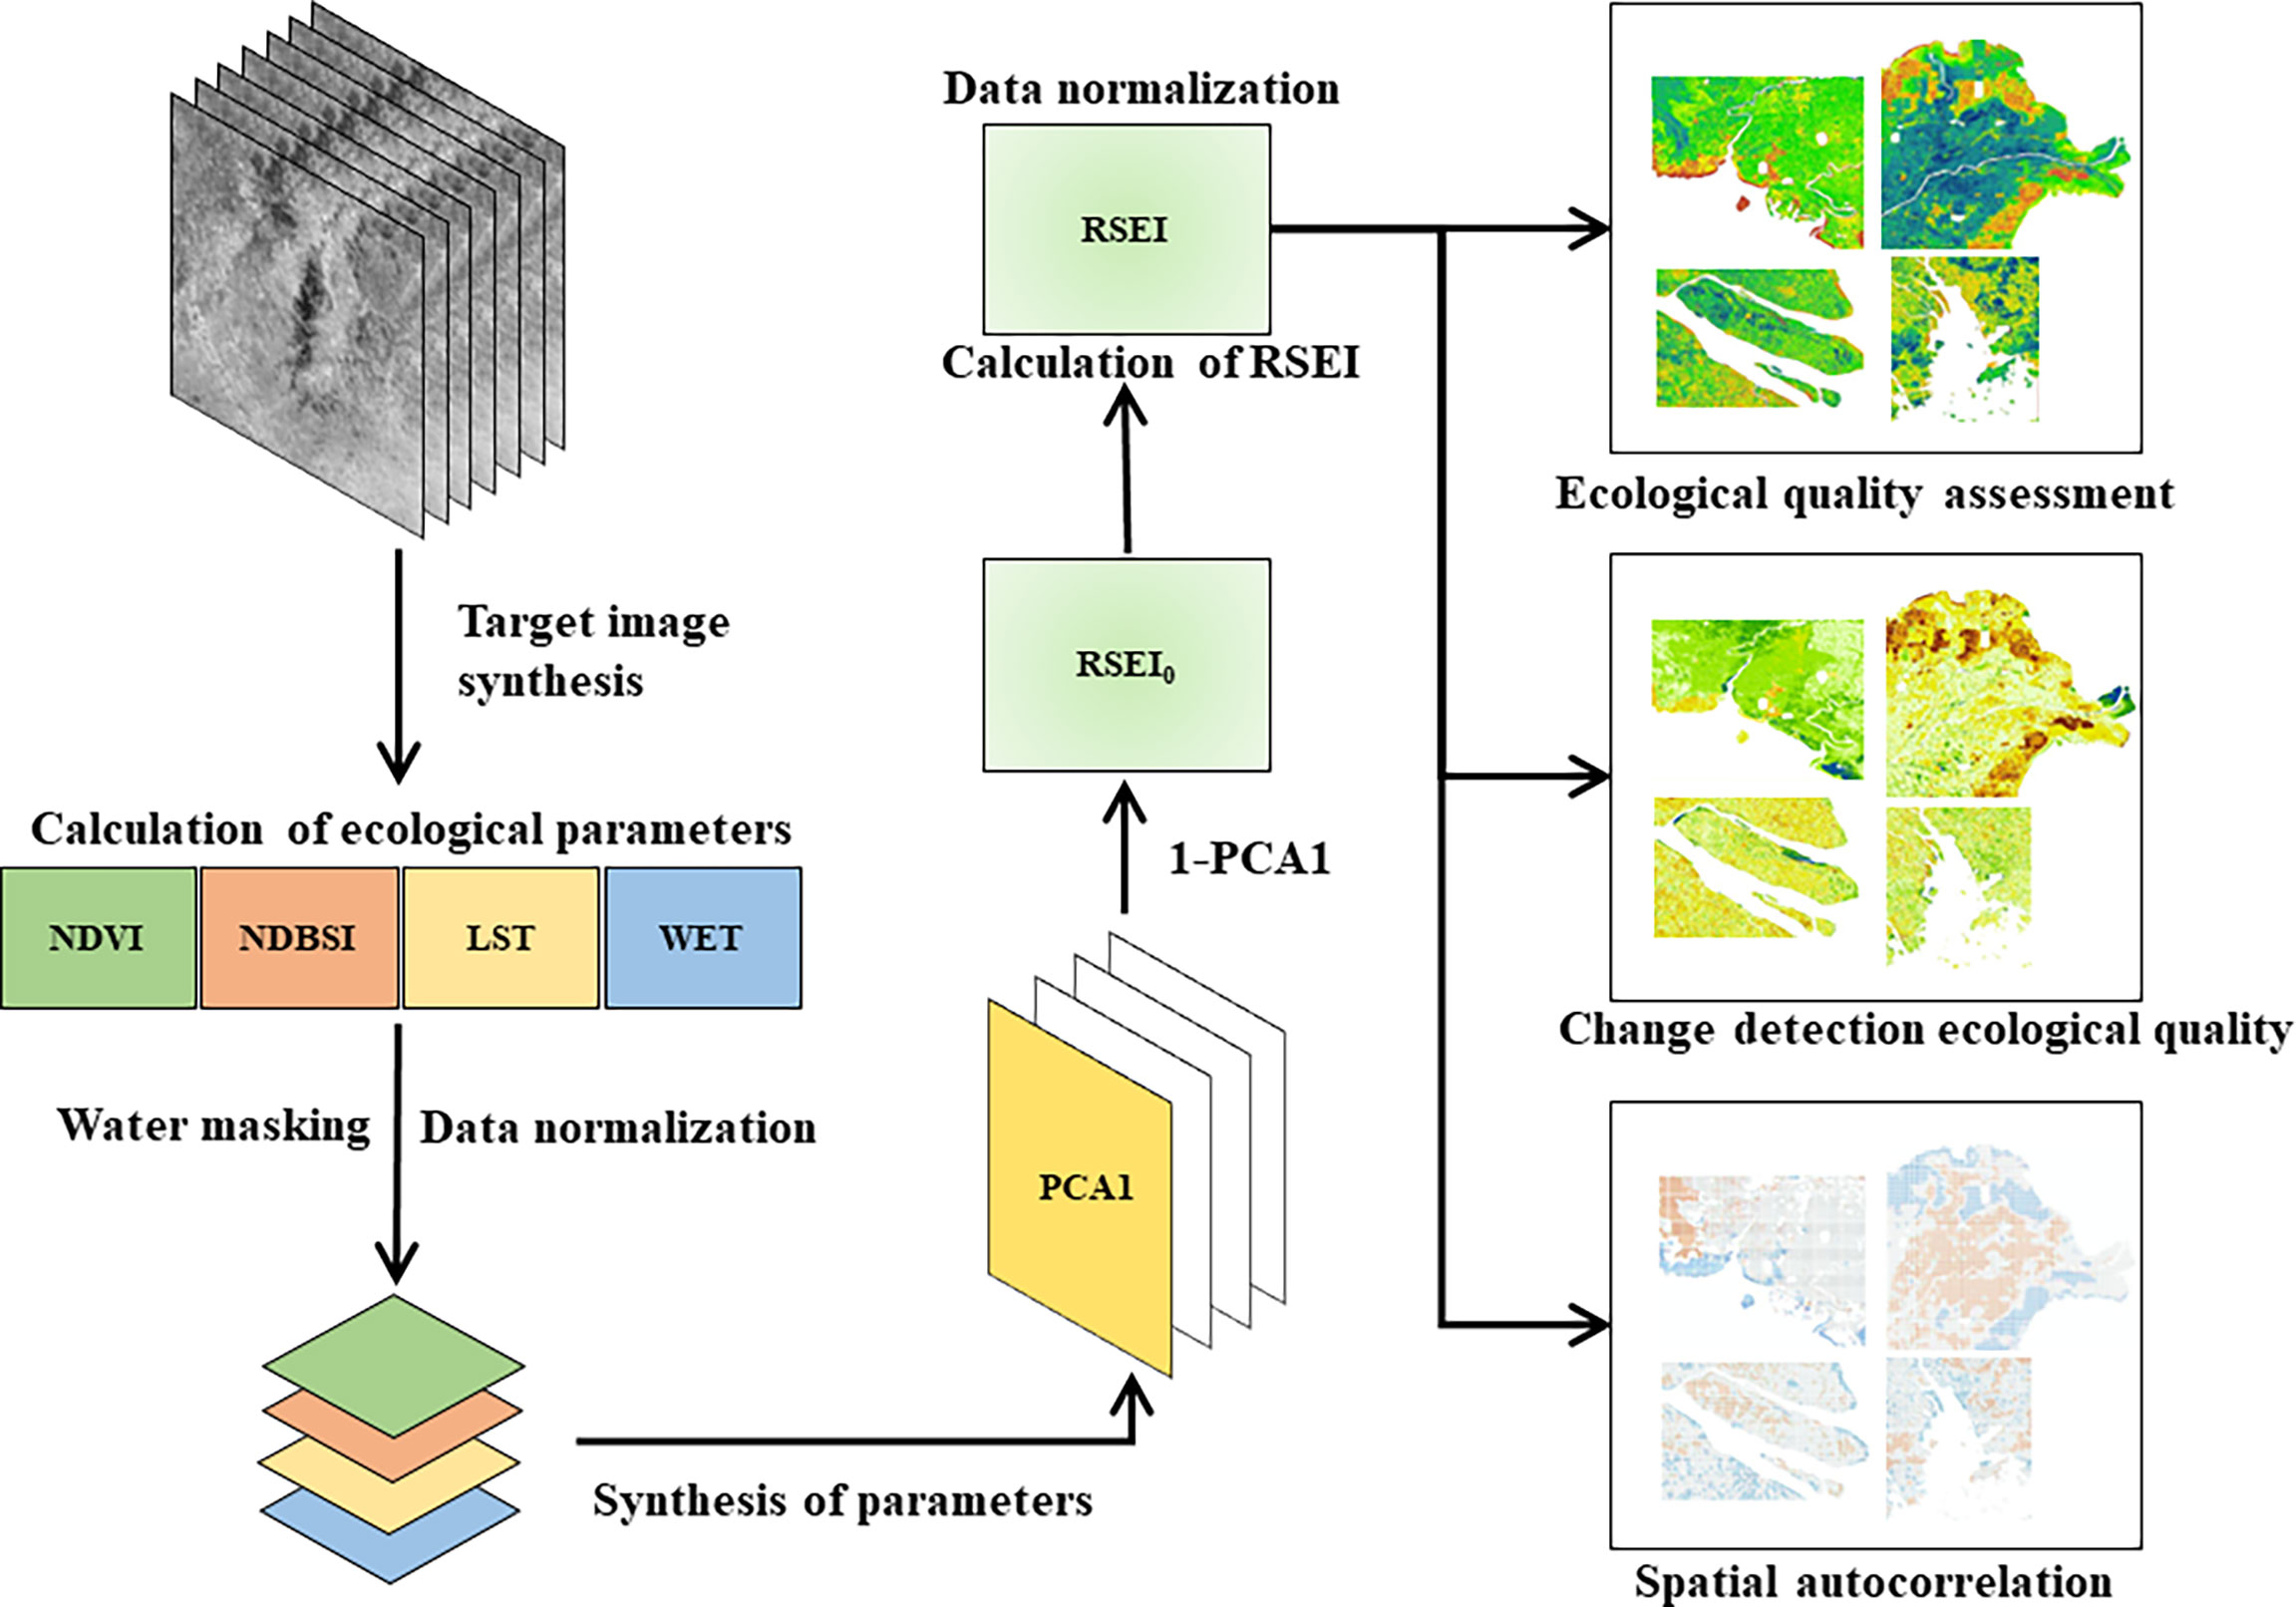
Figure 2 Flowchart of the data processing method.
Land-use/cover data for 2000–2020 (Yang and Huang, 2021) were used to analyse the relationship between land cover and the RSEI. Land cover was divided into nine categories: cropland, forest, shrub land, grassland, water, snow and ice, barren land, impervious land, and wetland. The overall accuracy of the original data in China reached 79.31%. Based on the characteristics of the research area and Landsat and Google Earth images, we reclassified the data into forest, barren land, built-up land, grassland, cropland, natural waterbodies, reservoirs and ponds. There were some errors in the original data, which were manually revised using visual interpretation. In addition, estuarine wetland data (Mao et al., 2020) were downloaded from National Earth System Science Data Center (http://www.geodata.cn/data/datadetails.html?dataguid=267682210636266&docId=10). The overall accuracy of the original data for China reached 95.1%. In order to ensure the accuracy of these data, we also modified the wetland data by combining Landsat and Google Earth images with visual interpretation.
Methods
Generation of RESI based on the GEE
In terms of remote sensing data, NDVI, wetness (WET), land surface temperature (LST) and the normalized difference bare soil index (NDBSI) were used to represent greenness, wetness, heat and dryness, respectively. These four metrics were built in the GEE. The RSEI data were obtained by principal component transformation of greenness, humidity, heat and dryness (Xu, 2013). Four remote sensing indicators were calculated as follows:
(1) NDVI
In Formula (1), ρnir and ρred are the surface reflectances in the near-infrared and red bands of remote sensing images, respectively.
(2) WET
Here, ρblue, ρgreen, ρswir1 and ρswir2 are the surface reflectances in the blue, green, shortwave infrared 1 and shortwave infrared 2 bands of the remote sensing images, respectively. For Landsat 5 images, the values of C1, C2, C3, C4, C5 and C6 are 0.0315, 0.2021, 0.3102, 0.1594, −0.6806 and −0.6109, respectively (Crist, 1985). For Landsat 8 images, they are 0.1511, 0.1973, 0.3283, 0.3407, −0.7117 and −0.4559, respectively (Baig et al., 2014).
(3) LST
In this study, the formula for calculating LST is:
Where λ is the central wavelength of the thermal infrared band (ρ = 1.438 × 10⁻² m·K), ε is the surface emissivity estimated from the NDVI (Sobrino et al., 2004) and T is the brightness temperature obtained from the Landsat surface reflectance dataset in GEE. Landsat 8 has two thermal infrared bands; we selected the 10th band for calculation.
(4) NDBSI
The NDBSI is a composite of the soil index (SI) and index-based built-up index (IBI). The formulas are (4-6):
Dimensional disunity among these four indexes will lead to a weight imbalance between them. Therefore, after they were estimated, we carried out dimensionless processing of the original indexes and unified their values to [0,1]. In order to avoid the influence of large areas of water on the results, we masked water information by obtaining water boundaries through visual interpretation using Landsat and Google Earth images. Then, we carried out principal component analysis of the four regularized indexes to obtain the first principal component (PC1). As the larger PC1 is, the worse the ecological environment it represents is. In order to make the RSEI values reflect the ecological environment quality, the initial remote sensing ecological index (RSEI0) was calculated as:
To facilitate index measurement and comparison, for the RSEI0 dimensionless processing of remote sensing, the computation formula is as follows:
In Formula (8), the RSEI value range from [0,1], with higher values indicating better eco-environmental quality.
Spatial autocorrelation analysis
Spatial autocorrelation analysis can determine whether the spatial distribution of things is autocorrelated. High autocorrelation represents the existence of spatial aggregation (Sokal and Oden, 1978). In our study, Moran’s I (global spatial autocorrelation) and the local spatial correlation index (LISA) were used to analyse the spatial correlation in eco-environmental quality.
Moran’s I is a widely used global indicator of spatial autocorrelation and is calculated as:
where xi and xj are the grid attribute data values at positions i and j, respectively, is the average of all grid attribute data values and n is the number of grid values in the study area. Wij is the weight of each grid cell; if grid j is directly adjacent grid i, then Wij = 1; otherwise, Wij = 0. A Moran’s I value close to 1 indicates a stronger spatial autocorrelation among grid cells. Moran’s I values above 0 indicate a positive correlation, whereas values below 0 indicate a negative correlation (Moran, 1948).
LISA reflects local autocorrelation and spatial aggregation. Even if Moran’s I = 0, there may be local autocorrelation and spatial aggregation. Therefore, LISA analysis was also carried out using Formula (10) (Anselin, 1995):
Where the variables are the same as in Formula (9).
Degree of land-use dynamics
An indicator of regional land-use change is the degree of land-use dynamics, which indicates how much land changed over the study period (Huang et al., 2018). This study used single and comprehensive land-use dynamic degrees to reveal land-use changes. The single land-use dynamic degree (SLUDD) expresses the area of a land-use type that changed in the study period. Its formula is:
where U2 and U1 represent the initial and final areas of a specific land-use type; and T represents the study period (Hu et al., 2019).
The comprehensive land-use dynamic degree (CLUDD) indicates the rate of change of various land-use types over time, and is calculated as:
where ΔLUij is the area of class i land transferred to class j land during the study period, and LUi is the initial area of type i land. In this study, i is built-up land, j is other land-use types, and n is the number of land use types (Huang et al., 2018).
Results
Spatial and temporal characteristics of eco-environmental quality
Figure 3 shows the RSEI values in the four estuaries from 2000 to 2020. To further explore the temporal and spatial variations in RSEI, it was divided into five grades: 0.0–0.2, 0.2–0.4, 0.4–0.6, 0.6–0.8 and 0.8–1 (for the classification criteria, refer to Yao et al., 2022). If the RSEI grade of a certain pixel did not change, it was marked as 0; if it increased by 1, 2, 3 or 4 grades, it was marked as 1, 2, 3 or 4, respectively, and if it decreased by 1, 2, 3 or 4 grades, it was marked as −1, −2, −3 or −4. In our results (Figure 4), there are no pixels that changed by 4 grades, so the results range from −3 to 3. Through Figures 3, 4, we can obtain the following results:
1. The average RSEI of the LRE increased from 0.43 in 2000 to 0.64 in 2020. The eco-environmental quality of most areas in the LRE improved, especially the banks of the Liaohe River to the west side of Panjin. However, the eco-environmental quality of the LRE coastal zone is poor. The RSEI of the west coast zone decreased from 0.52 in 2000 to 0.31 in 2020, while that of the east coast zone decreased from 0.49 to 0.38, and that of islet island decreased from 0.39 to 0.26. In addition, the eco-environmental quality of the Houyaotan aquaculture area decreased significantly (RSEI decrease from 0.52 in 2000 to 0.41 in 2020).
2. The average RSEI of the YRE decreased from 0.69 in 2000 to 0.57 in 2020. Although the eco-environmental quality of most areas in the middle of the YRE remained unchanged (most of these areas are cropland), the eco-environmental quality of the coastal zone decreased greatly (47%) during 2000-2020. In particular, the deterioration in eco-environmental quality was most significant in aquaculture areas. The eco-environmental quality of the sand spit of the new river mouth formed after the latest diversion of the Yellow River (1996 to present) increased most significantly (105%) during 2000–2020. The eco-environmental quality of the sand spit of the old mouth formed before the diversion (1976–1996) generally decreased (26%) by one grade.
3. The average RSEI of the YTRE decreased from 0.64 in 2000 to 0.56 in 2020. These low RSEI values were mainly distributed in the coastal zone of Changxing Island and the built-up areas of Shanghai, Qidong, Haimen and Taicang. The RSEI of the built-up areas of Shanghai, Qidong, Haimen and Taicang decreased from 2000 to 2020. Among them, large areas of Shanghai and Taicang had declines in eco-environmental quality. The eco-environmental quality in some coastal zones also declined. However, the RSEI of the coastal zone of Changxing Island increased from 0.65 in 2000 to 0.53 in 2020.
4. The average RSEI of the PRE decreased from 0.61 in 2000 to 0.57 in 2020. Low RSEI values were mainly distributed in built-up areas (0.31–0.43) and coastal zones (0.46–0.55), while high RSEI values were mainly distributed in areas with lush vegetation (e.g. forest; 0.63–0.85). From 2000 to 2020, the eco-environment quality of the coastal zone showed a trend of improvement. The eco-environmental quality of Shenzhen improved, while those of Hong Kong and Macao were relatively stable. However, the eco-environment quality of Guangzhou, Zhongshan, Zhuhai and Dongguan deteriorated, mainly due to urban expansion.
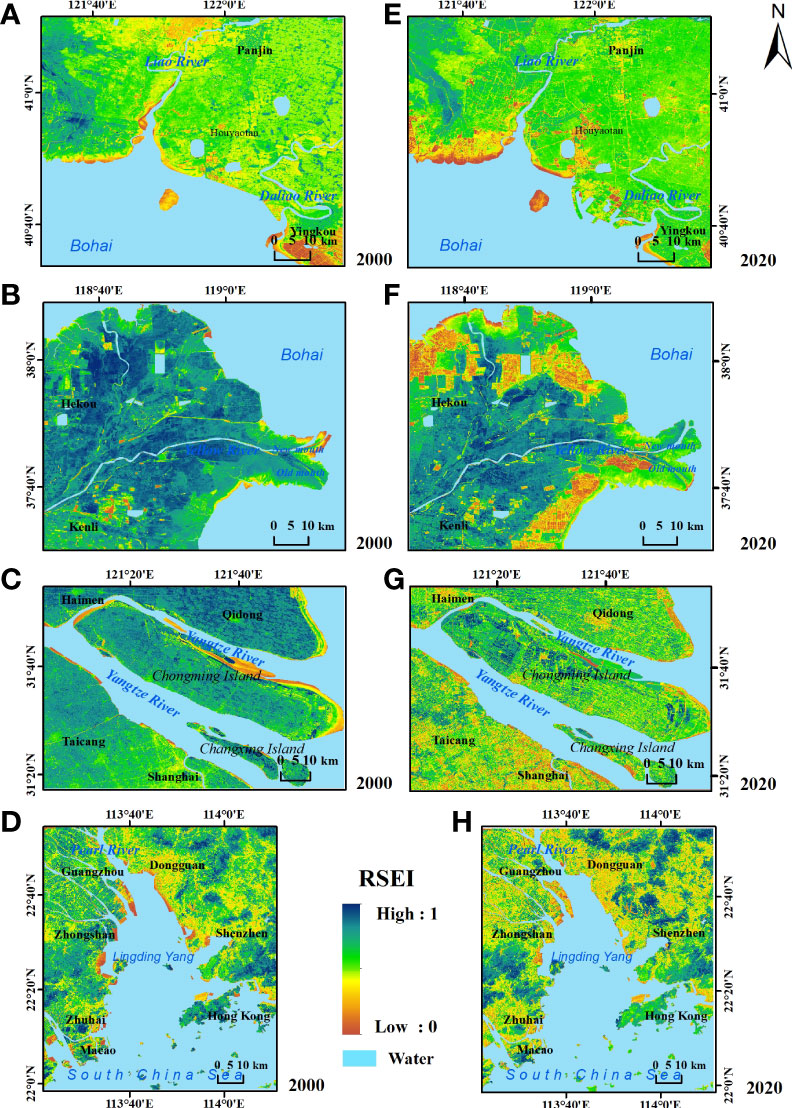
Figure 3 RSEI values of four typical estuaries in 2000 and 2020. (A) LRE in 2000; (B) YRE in 2000; (C) YTRE in 2000; (D) PRE in 2000; (E) LRE in 2020; (F) YRE in 2020; (G) YTRE in 2020; (H) PRE in 2020.
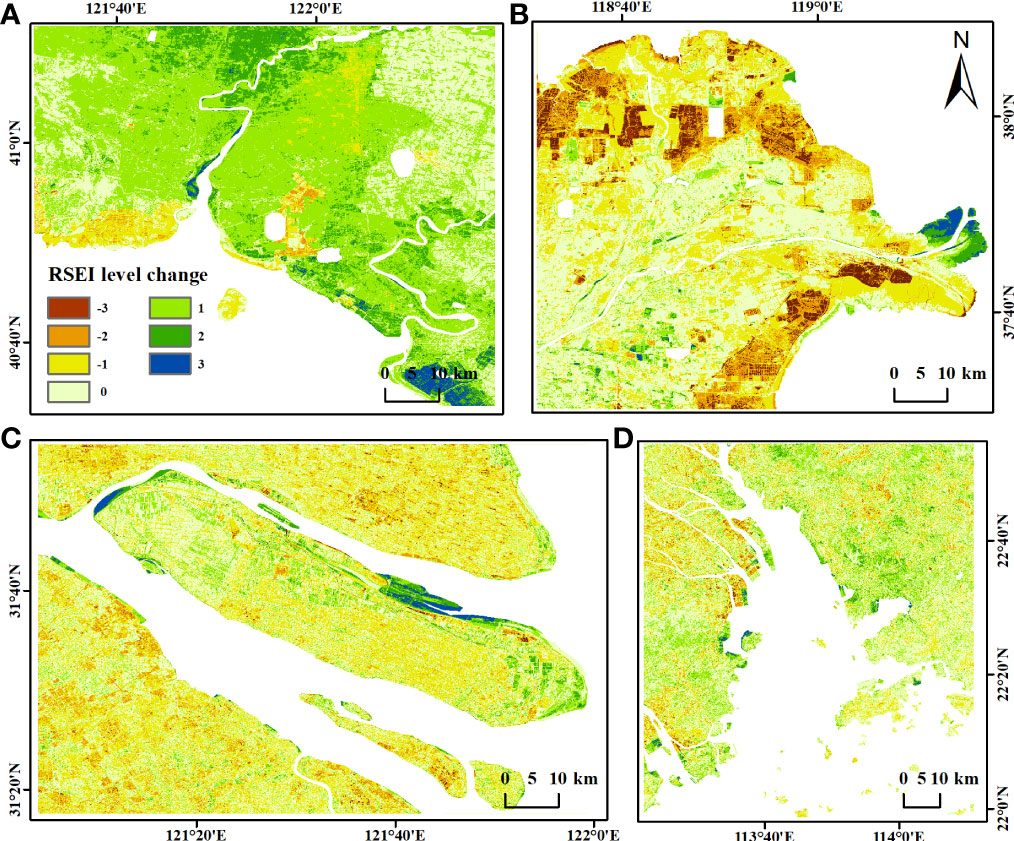
Figure 4 Change in RSEI, 2000–2020, in the (A) LRE, (B) YRE, (C) YTRE and (D) PRE.
In summary, the regions with deterioration in eco-environmental quality in the LRE and YRE were mainly distributed in the coastal zone, while deterioration in the YTRE and PRE mainly occurred in urban expansion areas.
Figure 5 shows the RSEIs of the four estuarine wetland regions from 2000 to 2020. The results show that:
1. The eco-environmental quality of the LRE’s coastal wetland improved greatly (50%) from 2000 (0.42) to 2020 (0.63), especially in the first decade. The eco-environmental quality of coastal wetlands was better than those of inland and human-made wetlands. The trends in the ecological environmental quality of the three wetlands were basically consistent.
2. The eco-environmental quality of the coastal wetland in the YRE first decreased (−20%) from 2000 (0.55) to 2010 (0.44) and then increased (10%) from 2010 to 2020 (0.49). The ecological environmental quality of inland wetlands decreased by 24% and that of human-made wetland decreased the most (−46%) during 2000–2020. Inland and human-made wetlands were relatively stable over the past five years.
3. The eco-environmental quality of the YTRE’s coastal wetland increased by 15% from 2000 (0.47) to 2010 (0.54) but was relatively stable in the past decade. The eco-environmental quality of inland and human-made wetlands decreased by 16% and 15%, respectively.
4. The eco-environmental quality of the wetland in the PRE was poor. Generally, the eco-environmental quality of coastal wetland has improved (68%) over the past 20 years (from 0.27 in 2000 to 0.45 in 2020), while those of inland and human-made wetland were slightly decreased (−8% and −14%).
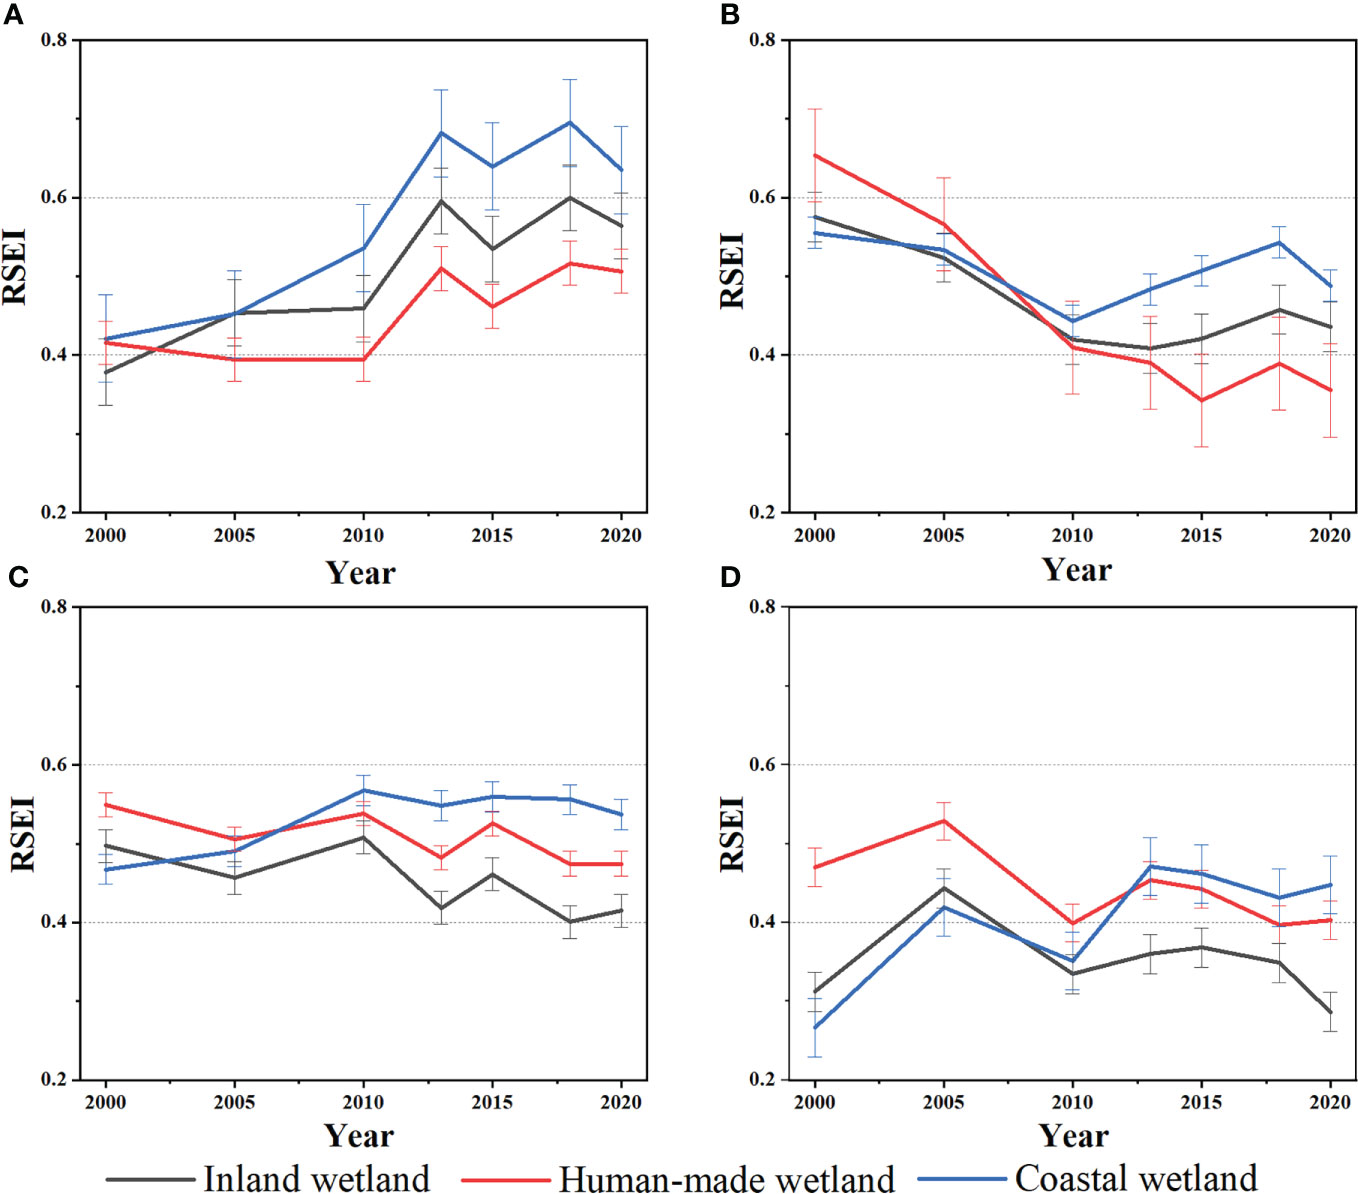
Figure 5 Temporal variations in RSEI in coastal, inland and man-made wetlands from 2000 to 2020 in the four estuaries: (A) LRE, (B) YRE, (C) YTRE and (D) PRE. Error bars represent standard deviations.
Spatial autocorrelation
To analyse spatial autocorrelation, we used 1 km × 1 km grid resampled data and analysed four typical estuaries using Moran’s I and LISA. An RSEI vs Moran’s I scatter diagram is shown in Figure 6. The points are mainly distributed in quadrants 1 and 3, indicating that ecological environmental quality in the study area was positively correlated with its spatial distribution. The Moran’s I values of the four regions in 7 years are shown in Table 1, which all show positive correlated and aggregation distribution characteristics. From 2000 to 2020, the Moran’s I values of the YRE and PRE remained stable, while those of the LRE and the YTRE showed downward trends. The areas with deteriorating eco-environmental quality in the YRE were distributed in patches (mainly in aquaculture areas), while the eco-environmental quality in the PRE was relatively stable, so the Moran’s I values in these two estuaries were relatively stable. The eco-environmental quality of the LRE increased significantly but decreased in some regions, so the spatial aggregation decreased. The eco-environmental quality of the YTRE decreased and the patches of change were scattered (Figure 4C), and the spatial aggregation decreased significantly.
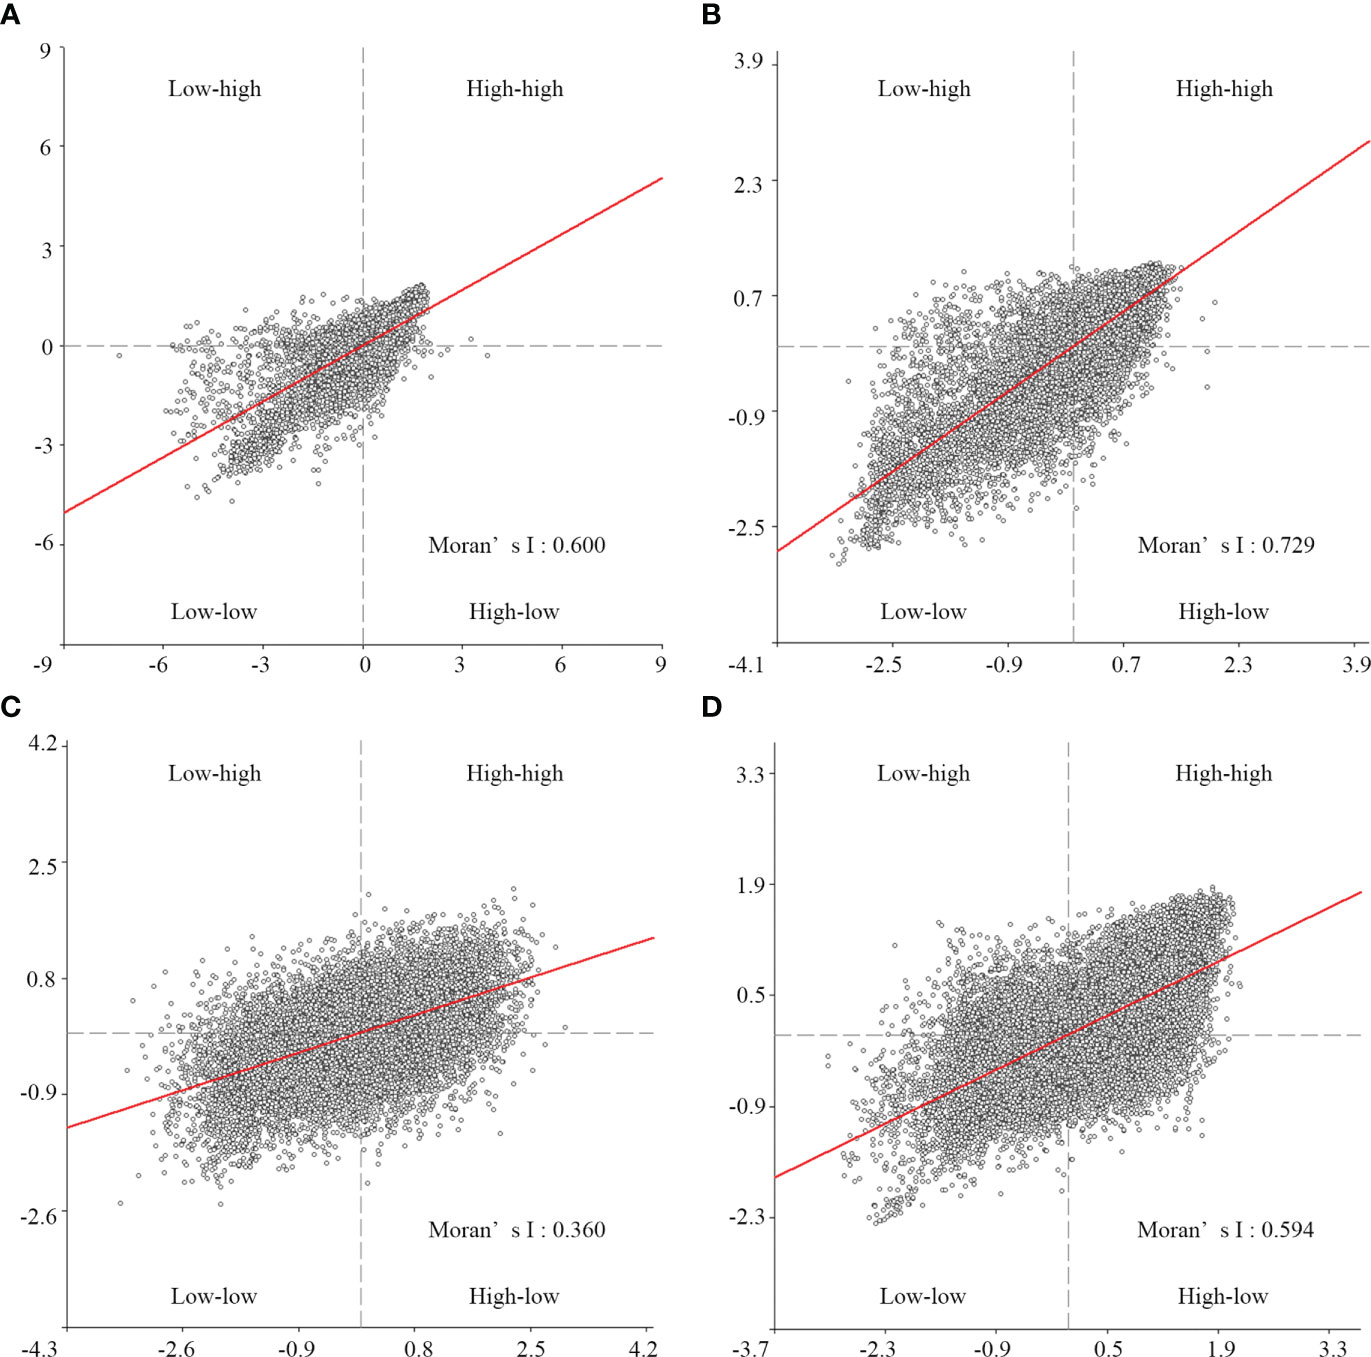
Figure 6 Global Moran’s I scatterplot of RSEIs in 2020 in the (A) Liao River Estuary, (B) Yellow River Estuary, (C) Yangtze River Estuary and (D) Pearl River Estuary.

Table 1 Annual Moran’s I values for each region in six years from 2000 to 2020.
To explore the spatial characteristics of the RSEI, we generated LISA clustering maps (Figure 7). The RSEI showed a low-low aggregation in coastal zones and urban construction zones, and high-high aggregation in forests, grassland and other areas with relatively lush vegetation. High-low and low-high clustering were rare and sporadic in the four study areas, indicating that none had extreme environmental quality. We further analysed the LISA clustering changes and obtained the following results:
1. In the coastal zone west of the LRE, the range of low-low clustering was expanding, while the range of high-high clustering was decreasing. Figure 4 also shows that the ecological environmental quality of the coastal zone west of the LRE was declining. The range of high-high and low-low clustering in the east of the LRE was decreasing. Although the eco-environmental quality in the east of the LRE showed a significant upward trend overall, the ecological environments in some regions still need to be improved.
2. Low-low clustering was concentrated in the coastal zone, while high-high clustering was concentrated in the inland cropland in the middle of the study area. The ranges of high-high and low-low clustering in the YRE were expanding. This shows that the ecological environmental quality of the coastal zone of the YRE was declining and urgently needs improved protection.
3. The low-low clustering range of the YTRE was also concentrated in coastal and built-up areas, while the low-low clustering range of the coastal area was shrinking. The expansion of urban and built-up areas leads to a reduction in the high-high clustering range and expansion of the low-low clustering range. In addition, low clustering in the Shanghai urban area was fragmented and the value of the Moran index, which reflects the global autocorrelation, also decreased significantly.
4. The cluster of eco-environmental quality in the PRE was also stable. The high-high values in the west bank of the PRE were more concentrated, and the high-high clustering in the Islands District in Hong Kong became very fragmented.
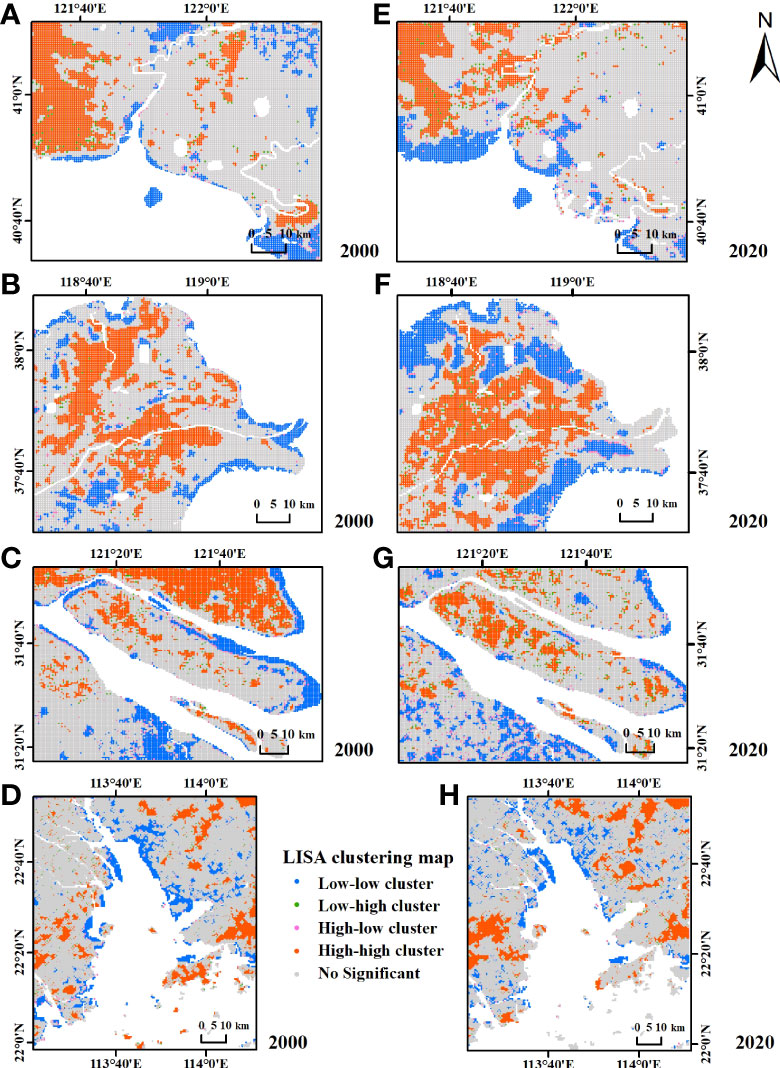
Figure 7 LISA clustering map of RSEIs in the (A) LRE in 2000; (B) YRE in 2000; (C) YTRE in 2000; (D) PRE in 2000; (E) LRE in 2020; (F) YRE in 2020; (G) YTRE in 2020; (H) PRE in 2020.
Relationship between land cover and RSEI
Comparing the distribution maps of RSEI and land cover (Figure 8), it can be found that the RSEI was lower in barren, urban and built-up regions and higher in cropland, grasslands and forest.
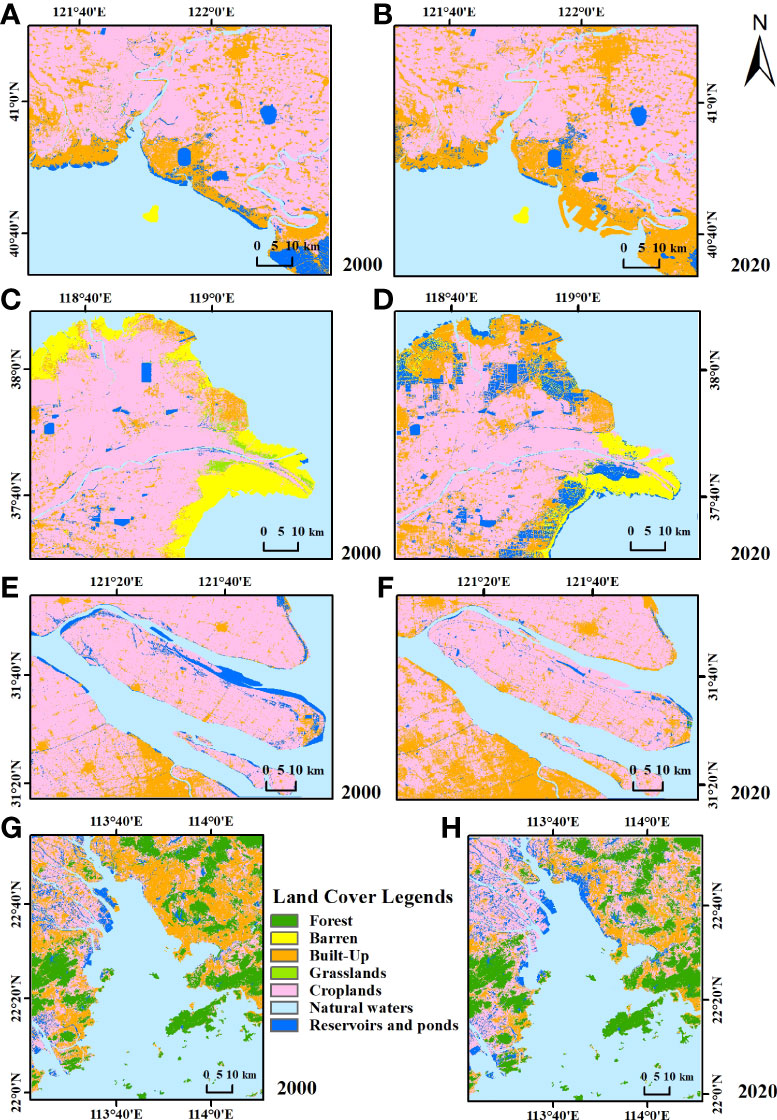
Figure 8 Land cover distribution maps of the (A) LRE in 2000; (B) YRE in 2000; (C) YTRE in 2000; (D) PRE in 2000; (E) LRE in 2020; (F) YRE in 2020; (G) YTRE in 2020; (H) PRE in 2020.
1. From 2000 to 2020, the expansion of urban and built-up regions in the LRE coastal area was not significant so, with the support of environmental protection policies, the overall RSEI presented an upward trend. However, the aquaculture area in the coastal zone of the western LRE increased (for example, a1-a5 in Figure 9 show an increase in the aquaculture area while the RSEI decreases significantly), which led to a deterioration in eco-environmental quality.
2. Urban and built-up regions in the YRE are significantly expanding, so the RSEI showed an overall downward trend. In addition, the aquaculture areas in the YRE were also greatly increasing, resulting in a significant decline in RSEI (for example, b1-b5 in Figure 9 show an increase in the aquaculture area while the RSEI decreases significantly).
3. Urban and built-up regions in the YTRE significantly expanded, while their RSEIs decreased (for example, c1-c5 in Figure 9 show an increase in urban and built-up regions while the RSEI decreases significantly).
4. Urban and built-up regions in the PRE also expanded significantly. However, there were more forests in this region, and the RSEI of the PRE was relatively stable in general (for example, d1-d5 in Figure 9 show an increase in forest area while the RSEI decreases significantly).
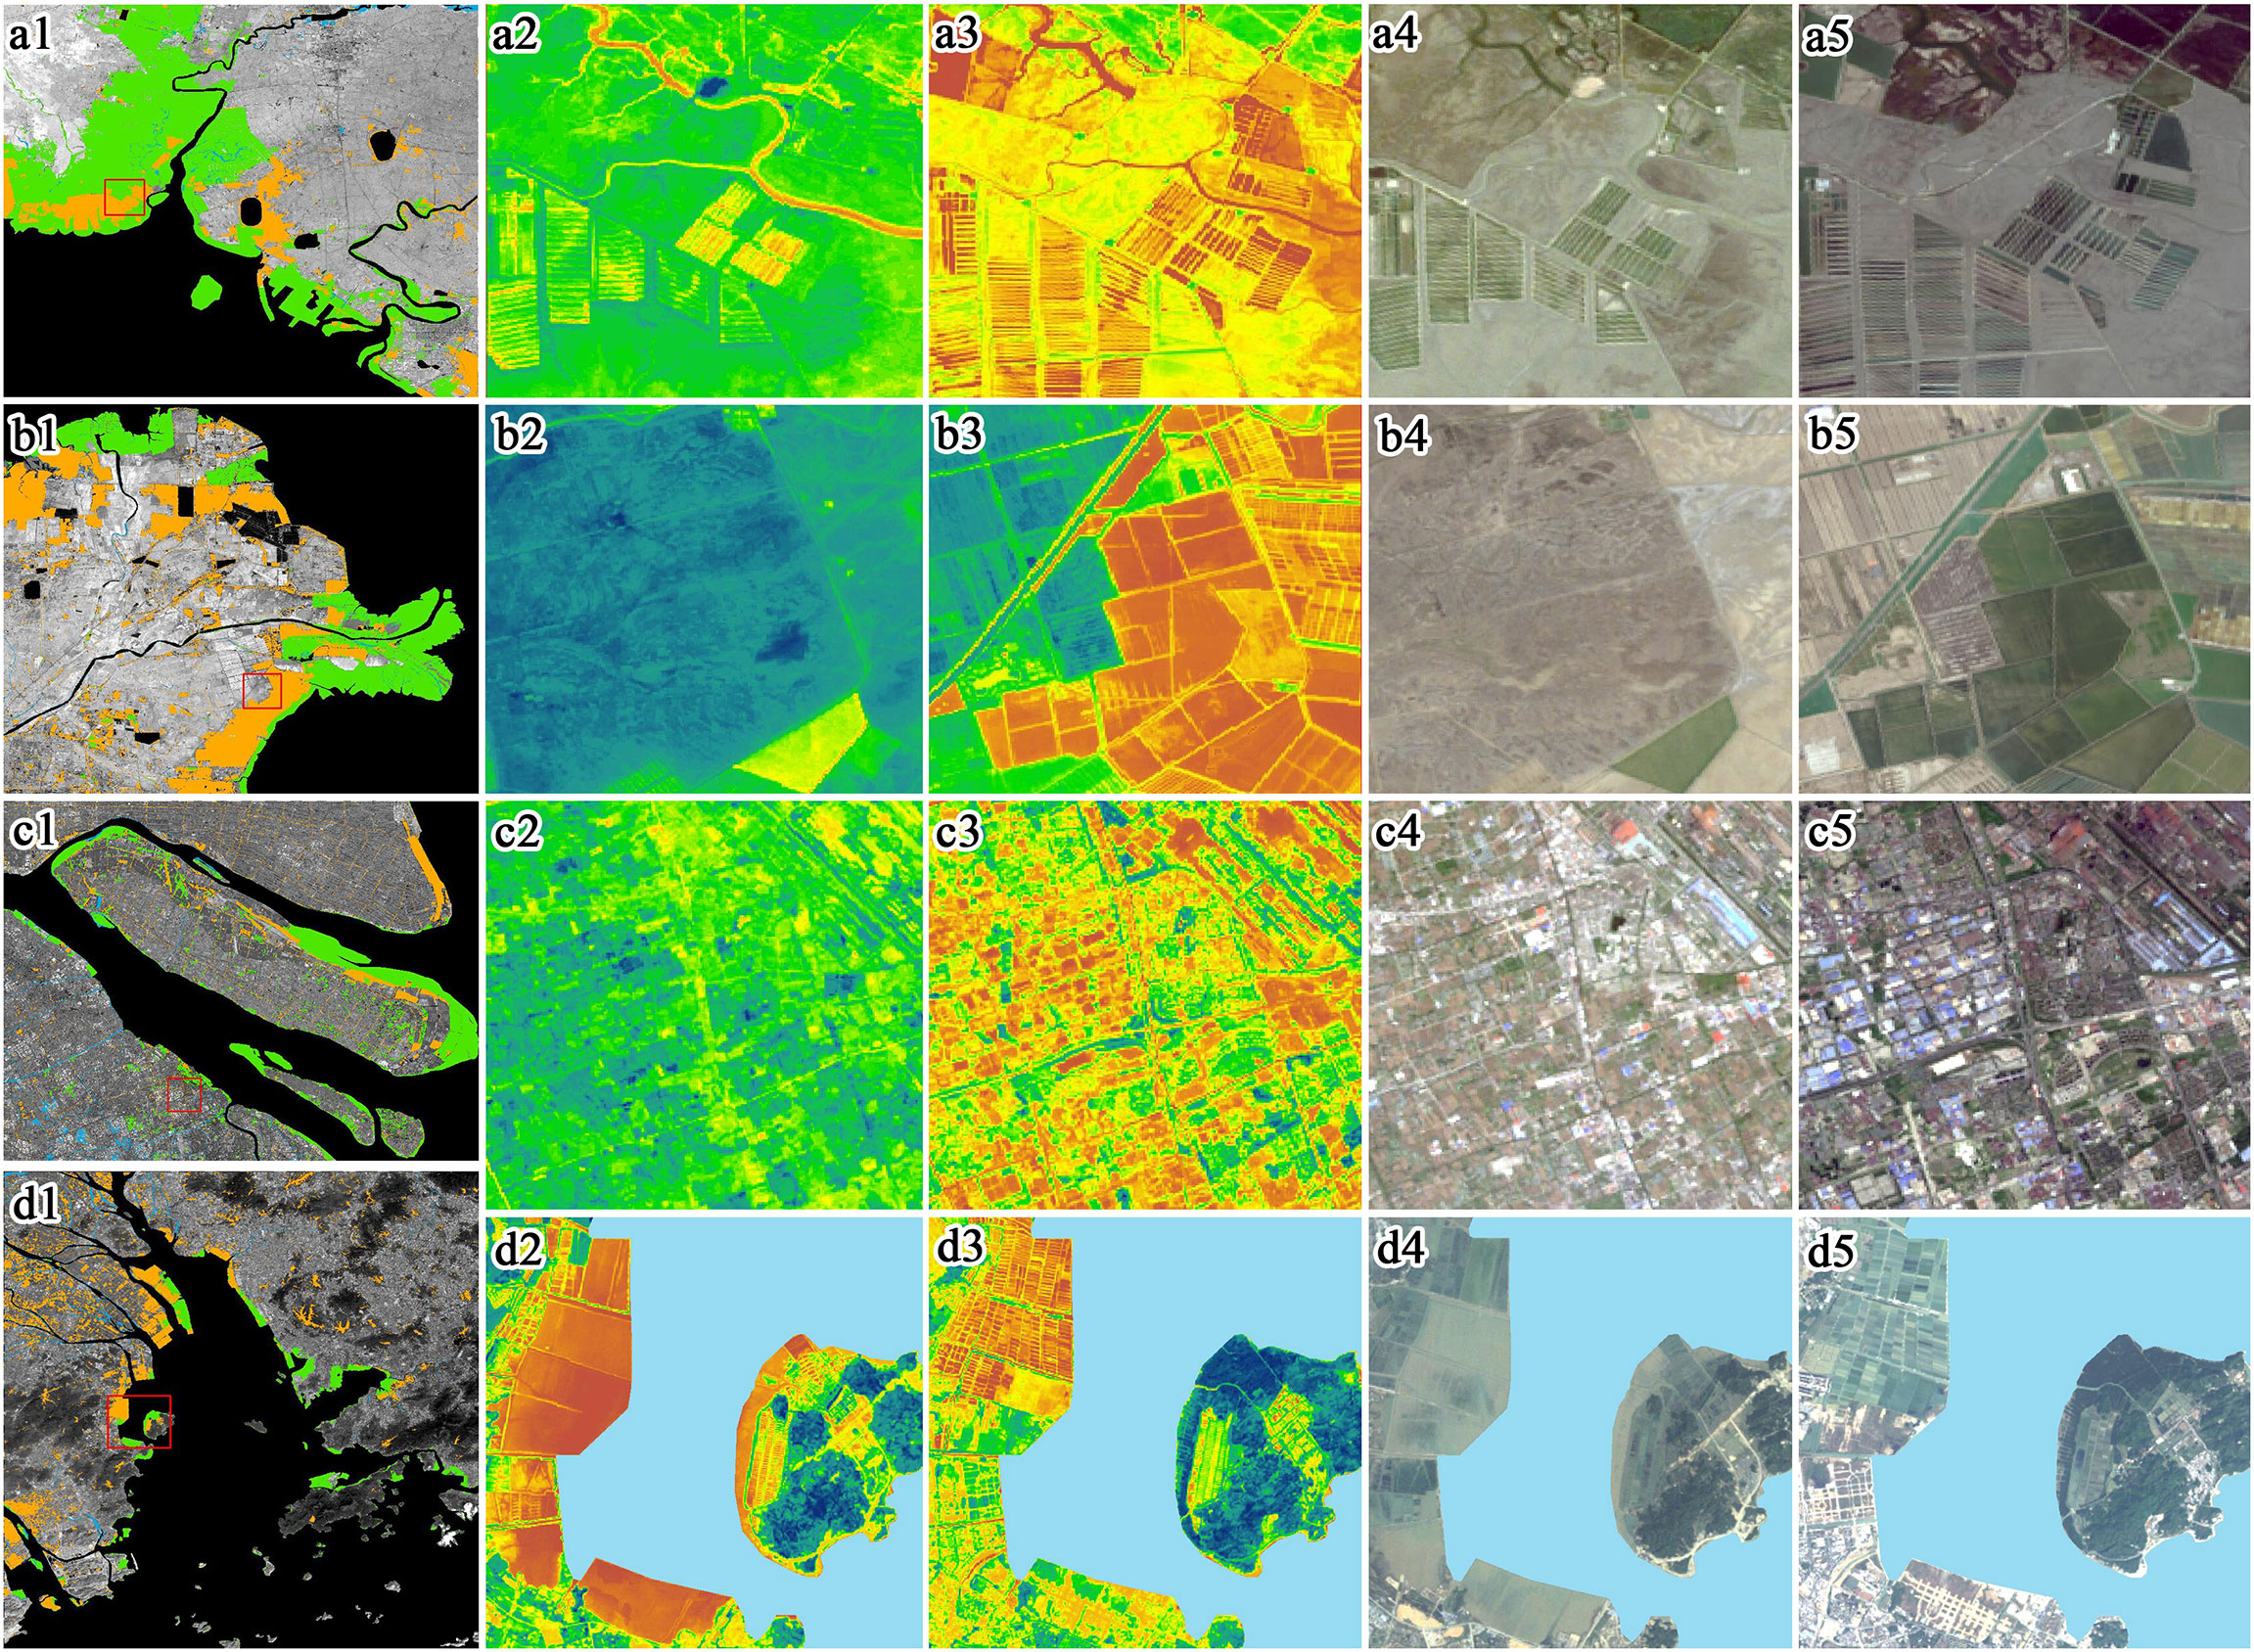
Figure 9 RSEI and land cover in different sample areas. Rows a, b, c and d represent different sample areas. Columns indicate 1) sample area locations (red boxes), 2) RSEIs of the sample areas in 2000 and 3) 2020, 4) true-colour composite Landsat 5 image in 2000 and 5) true-colour composite Landsat 8 image in 2020.
Discussion
Validation of the applicability of the RSEI
All raster data were resampled to 1 km × 1 km, then the NDVI, WET and RSEI were projected into a three-dimensional space together (Figure 10A), as were LST, NDBSI and RSEI (Figure 10B). Figure 10 shows that the RSEI increased with NDVI and WET, so RSEI is positively related to greenness and humidity, which is consistent with our own observations and other studies (Xiong et al., 2021). The RSEI decreased as LST and NDBSI increased, indicating that RSEI is negatively correlated with heat and dryness, which is also consistent with the actual situation and the results of Yao et al. (2022).
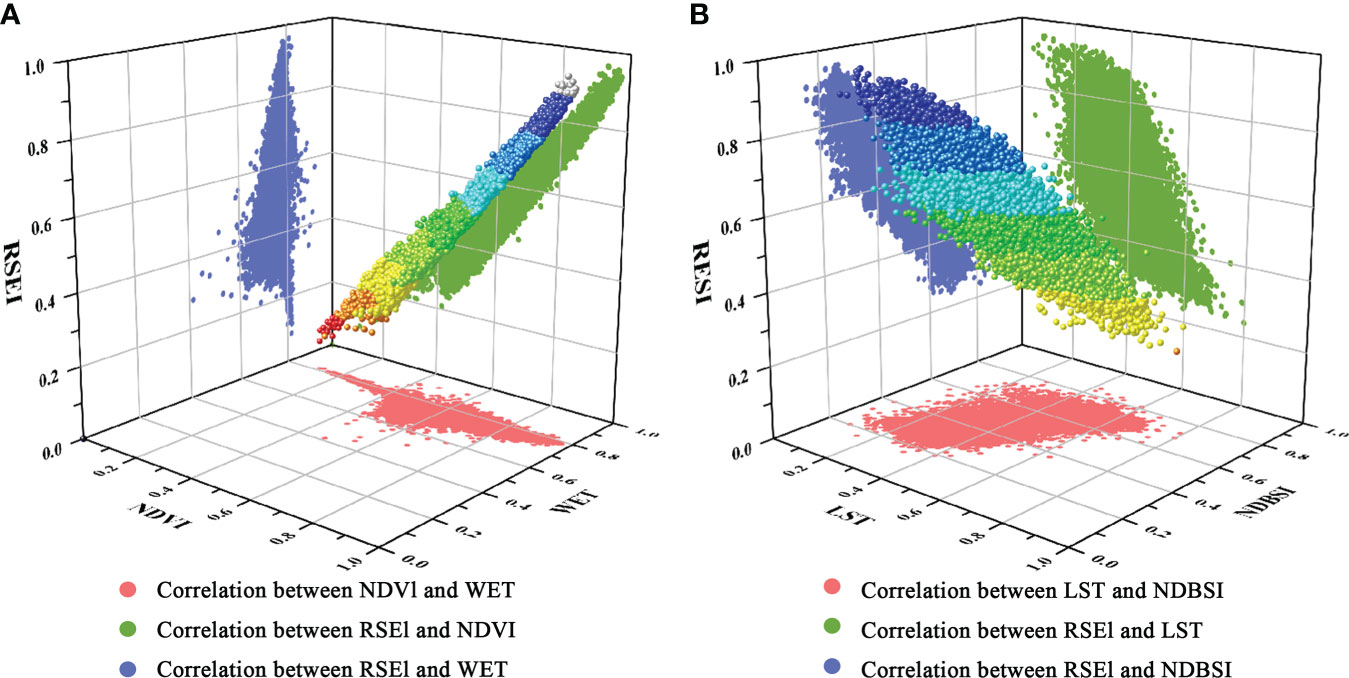
Figure 10 (A) Three-dimensional plot of NDVI, WET and RSEI, and (B) its of LST, NDBSI and RSEI.
RESI is developed under the conceptual framework of pressure-state-response (PSR), which is one of the most commonly used environmental conceptual frameworks. (Niemeijer and de Groot, 2008). Within the framework of PSR, eco-environmental problems can be expressed as three different but interrelated index types: anthropogenic pressure (P), eco-environmental state (S) and climate response (R). Among the four indicators comprising the RSEI, NDBSI is used to represent the pressure caused by human activities on an ecosystem, NDVI measures the ecological state of land before and after human-induced land surface changes, and LST and WET reflect the response of the ecosystem to the climate (Xu et al., 2019). Therefore, the RSEI has a clear physical meaning.
The RSEI is a combination of four indicators and may be difficult to use to quantify actual values on the ground. Hence, it is difficult to conduct a quantitative verification of the RSEI and only qualitative evaluations can be made. According to Figure 9, the changes in RSEI values are relatively consistent with changes in land cover. Pixels converted from other types of land cover to built-up areas, for instance, may have a clearly defined boundary showing the extent of the change. However, the border of the resulting eco-environmental change may not perfectly follow the border of land cover changes. Land cover changes may also influence the ecological conditions of adjacent pixels, which could result in changes to hot and wet surface conditions (Xu et al., 2019).
Causes of change in wetland eco-environmental quality
Many previous studies (Murray et al., 2014; Yim et al., 2018; Chen et al., 2019; Ma et al., 2019) have investigated how natural and human factors affect the temporal and spatial dynamics of coastal wetlands. Studies have shown that the ecological quality of coastal wetlands is affected by complex natural and human dynamic factors. Natural factors include runoff, temperature, precipitation, waves, and tidal currents, which affect the area and type of coastal wetlands and indirectly affect the biological composition of coastal wetlands (Shi et al., 2020; Zang et al., 2020). Human factors include beach reclamation, port development and water conservancy projects (Wang et al., 2014; Jiang et al., 2015). The purpose of reclamation is to transform cropland and develop salt farms and aquaculture. The large amount of tidal flat reclamation causes a decrease in the tidal flats area and changes the coastline length, intensifying the effect of tidal water on the coastal environment. It also reduces the habitat of intertidal organisms, directly leading to ecological deterioration (Sun et al., 2017). Port construction will straighten the coastline so that its resistance to marine dynamic action is weakened (Liu et al., 2018). Port construction leads to the expansion of coastal towns and the destruction of coastal wetlands (Wu et al., 2022). Water conservancy projects are used to intercept sediment, which directly reduces the total amount of sediment entering the river section downstream of the reservoir. It also directly reduces incoming water and sand in the coastal basin, which have great impacts on the coast, especially plain coast (Liu et al., 2013). Dam construction damages the plant habitat of coastal wetlands (Newton et al., 2020).
This study analysed the impacts of runoff, sediment discharge, and the CLUDD and SLUDD of built-up land on the ecological quality of four estuarine wetlands. Runoff and sediment discharge in the LRE increased significantly from 2000 to 2010 and remained stable from 2015 to 2020 (Figure 11), which is consistent with the RSEI trend. This indicates that both runoff and sediment discharge improved the eco-environmental quality of the LRE. Although YRE runoff was relatively stable from 2003 to 2010, sediment discharge had a downward trend, which is one of the reasons for the deteriorating eco-environmental quality during the study period. Due to a lack of adequate sediment supply, the development of the continental body in the delta was inhibited; eventually, fewer new wetlands were formed, the flora became further away from the sea and the ecological quality decreased (Yang, 2005). The runoff and sediment discharge of the YTRE and PRE were much higher than those of the LRE and YRE. The runoff of the two rivers remained stable and the sediment discharge decreased and then became stable, and the impact on eco-environmental quality was not as significant as that of the LRE and YRE.
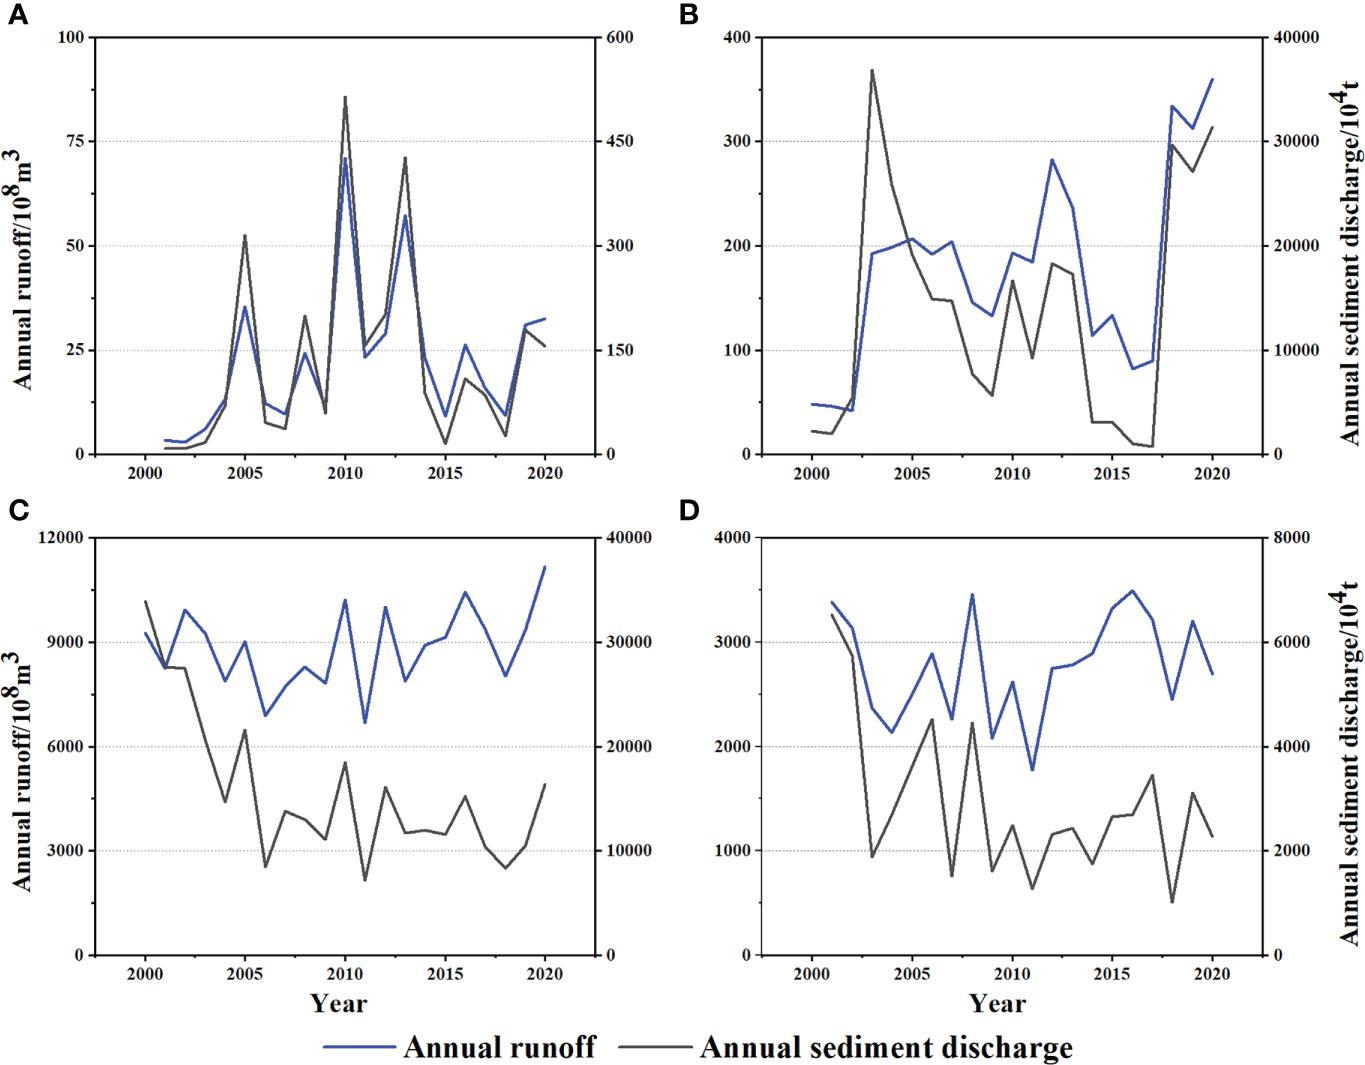
Figure 11 The annual runoff and sediment discharge from 2000 to 2020 in the four estuaries: (A) LRE, (B) YRE, (C) YTRE and (D) PRE.
CLUDD represents the rate of land-use change, while the SLUDD of built-up land reflects the rate of built-up land change. These two indicators reflect the degree of human activities such as land reclamation and port construction. Both CLUDD and SLUDD were low in the LRE and were relatively stable from 2000 to 2020 (Figure 12), indicating that activities such as reclamation and port construction had little impact on eco-environmental quality. Under natural conditions, such as the increases in runoff and sediment discharge, the eco-environmental quality improved during this period. CLUDD and SLUDD increased first and then decreased in the YRE from 2000 to 2020, which is consistent with the RSEI trend, indicating that human activities had a great impact on the eco-environmental quality of the YRE, which was most severe during 2000-2010. According to Figures 8B, F, 9B, reclamation activities in the YRE related to aquaculture increased significantly. Wang et al. (2021) also reported that land reclamation and coastal zone development (conversion to aquaculture ponds) were the main causes of wetland loss in the YRE. Both CLUDD and SLUDD in the YTRE and the PRE had significant downward trends from 2000 to 2020, which demonstrates relatively stable eco-environmental quality in these regions. It must be noted that urbanization is still the main driver of the retreat of YTRE and PRE wetlands (Wang et al., 2021), but its influence is gradually decreasing. Due to the restriction of human disturbance and the expansion of Spartina alterniflora saltmarshes, the eco-environmental quality of coastal wetlands in Changxing Island and Jiuduansha Island gradually improved (Yang et al., 2018). Governmental conservation and restoration projects increased the area of mangroves, which also contributed to improvements in the eco-environmental quality of the PRE (Ma et al., 2019).
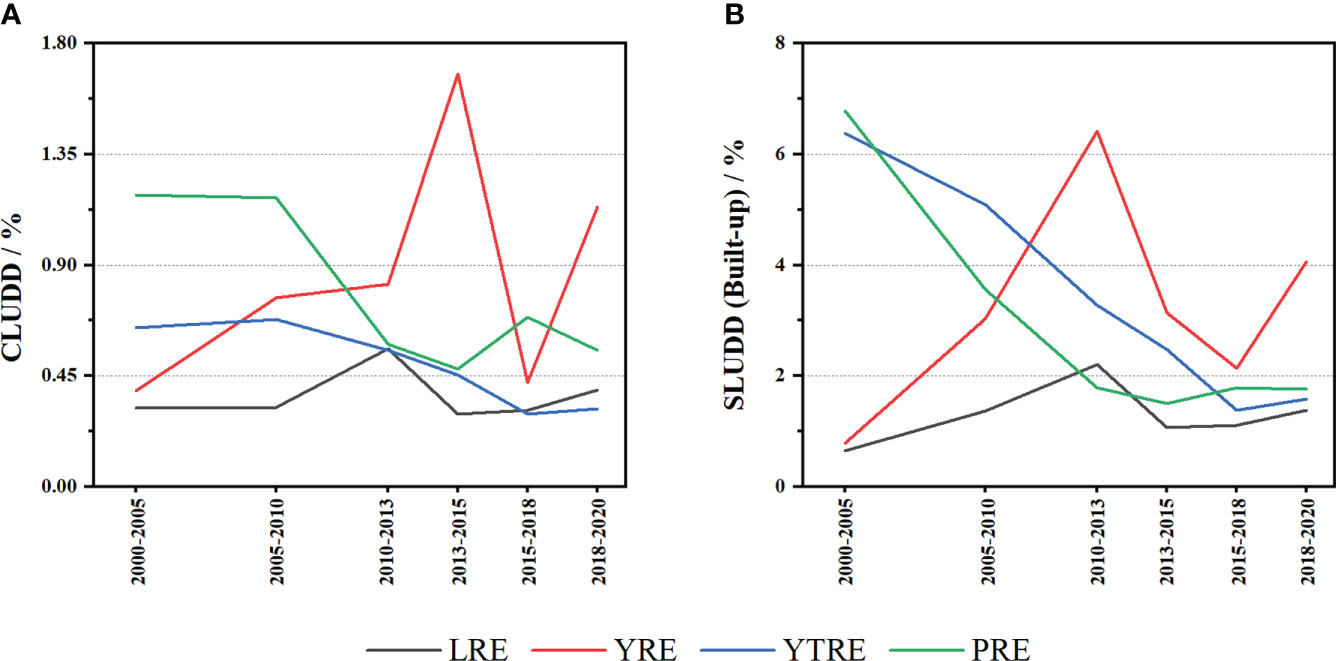
Figure 12 The CLUDD (A) and SLUDD (B) of built-up land from 2000 to 2020 in the four estuaries.
Overall, the ecological and environmental quality of coastal wetlands in China has increased in the past decade. Wang et al. (2021) also showed that a significant reduction in human activities since 2012 led to an increase in coastal wetland area. It is worth noting that in 2012, “ecological civilization construction” was incorporated into the national strategy, and the State Council of China approved the National Marine Function Zone (2011–2020) to improve the management of reclamation projects and rationally control their scale (Liu et al., 2018). Reduced human disturbance and greater government protection have contributed to the restoration of coastal wetlands in China since 2012 (Wang et al., 2021).
Strengths and limitations
In our study, the RSEI was obtained by batch processing of data on the GEE platform to achieve rapid assessment of wetland eco-environmental quality based on Landsat images acquired during 2000–2020. The results are objective and easy to analyse, which facilitates large-scale ecological quality assessment of wetlands.
However, there are some deficiencies in our research. Firstly, the ecological environment is complex, so using only four RSEI indicators can only approximate its true status. We suggest that future studies use more diverse spatial data, such as net primary productivity (NPP) and aerosols. Secondly, the RSEI is primarily used in land areas and is not suitable for large bodies of water (e.g., oceans). Through the tasseled cap transformation, the water components are primarily related to vegetation and soil water. If there were more water in the study area, and the calculated moisture component will not accurately reflect the moisture contents of vegetation and soil. The water in this case has to be masked off. Therefore, this study cannot consider the large-scale ecological status of aquatic environments. In future studies, we suggest that water quality inversion results based on remote sensing, marine NPP and RSEI data should be integrated to evaluate the eco-environmental quality of coastal wetlands.
Conclusions
In this study, the GEE platform was used to rapidly generate seasonal cloud-free images. The RSEI was calculated to analyse the spatial and temporal changes in ecological environmental quality in four typical estuarine wetlands in China’s Liao, Yellow, Yangtze and Pearl Rivers during 2000–2020. The results show that the eco-environmental quality of coastal wetlands in the LRE and PRE improved significantly, that of the YRE decreased first and then slowly improved, while that of the YTRE improved slowly. A positive correlation was found between the spatial distributions of ecological environmental quality in the four study areas. The spatial distributions tended to be clustered rather than random. In lush vegetation areas, high-high clusters were mostly found, while in built-up and coastal areas, low-low clusters were most common. The aquaculture industry negatively affected the quality of the ecological environment, particularly in the LRE and YRE. Urbanization had a negative impact on eco-environmental quality, especially in the YRE. The increase in vegetation cover had a positive impact on eco-environmental quality, especially in the PRE. Under the environmental protection policies of Chinese national and local governments, the eco-environmental quality of the coastal wetlands in these four estuaries has been gradually improving in recent years.
Data availability statement
The raw data supporting the conclusions of this article will be made available by the authors, without undue reservation.
Author contributions
ZZ: conceptualization, funding acquisition, supervision, and writing—original draft, review and editing. ZC: data curation, writing—review, formal analysis, and visualization. JY and XG: writing—review. All authors contributed to the article and approved the submitted version.
Funding
This research was jointly supported by the National Natural Science Foundation of China (42071085 and 41701087) and the Open Project of the State Key Laboratory of Cryospheric Science (SKLCS 2020-10).
Acknowledgments
We thank Goolge Earth Engine for providing data and processing services. We also thank the National Earth System Science Data Center for providing wetland boundary data.
Conflict of interest
The authors declare that the research was conducted in the absence of any commercial or financial relationships that could be construed as a potential conflict of interest.
Publisher’s note
All claims expressed in this article are solely those of the authors and do not necessarily represent those of their affiliated organizations, or those of the publisher, the editors and the reviewers. Any product that may be evaluated in this article, or claim that may be made by its manufacturer, is not guaranteed or endorsed by the publisher.
References
Anselin L. (1995). Local indicators of spatial association–LISA. Geogr. Anal. 27 (2), 93–115. doi: 10.1111/j.1538-4632.1995.tb00338.x
Baig M. H. A., Zhang L., Shuai T., Tong Q. (2014). Derivation of a tasselled cap transformation based on landsat 8 at-satellite reflectance. Remote. Sens. Lett. 5 (5), 423–431. doi: 10.1080/2150704x.2014.915434
Beuel S., Alvarez M., Amler E., Behn K., Kotze D., Kreye C., et al. (2016). A rapid assessment of anthropogenic disturbances in East African wetlands. Ecol. Indic. 67, 684–692. doi: 10.1016/j.ecolind.2016.03.034
Bourdaghs M., Johnston C. A., Regal R. R. (2006). Properties and performance of the floristic quality index in great lakes coastal wetlands. Wetlands 26, 718–735. doi: 10.1672/0277-5212(2006)26[718:PAPOTF]2.0.CO;2
Chen Y., Dong J., Xiao X., Ma Z., Tan K., Melville D., et al. (2019). Effects of reclamation and natural changes on coastal wetlands bordering china's yellow Sea from 1984 to 2015. Land. Degrad. Dev. 30 (13), 1533–1544. doi: 10.1002/ldr.3322
Chi Y., Zheng W., Shi H., Sun J., Fu Z. (2018). Spatial heterogeneity of estuarine wetland ecosystem health influenced by complex natural and anthropogenic factors. Sci. Total. Environ. 634, 1445–1462. doi: 10.1016/j.scitotenv.2018.04.085
Crist E. P. (1985). A TM tasseled cap equivalent transformation for reflectance factor data. Remote. Sens. Environ. 17 (3), 301–306. doi: 10.1016/0034-4257(85)90102-6
Cui B., He Q., Gu B., Bai J., Liu X. (2016). China’s coastal wetlands: Understanding environmental changes and human impacts for management and conservation. Wetlands 36 (S1), 1–9. doi: 10.1007/s13157-016-0737-8
Cui B., Yang Q., Yang Z., Zhang K. (2009). Evaluating the ecological performance of wetland restoration in the yellow river delta, China. Ecol. Eng. 35 (7), 1090–1103. doi: 10.1016/j.ecoleng.2009.03.022
Gorelick N., Hancher M., Dixon M., Ilyushchenko S., Thau D., Moore R. (2017). Google Earth engine: Planetary-scale geospatial analysis for everyone. Remote. Sens. Environ. 202, 18–27. doi: 10.1016/j.rse.2017.06.031
Gu D., Zhang Y., Fu J., Zhang X. (2006). The landscape pattern characteristics of coastal wetlands in jiaozhou bay under the impact of human activities. Environ. Monit. Assess. 124 (1-3), 361–370. doi: 10.1007/s10661-006-9232-7
Huang B., Huang J., Gilmore Pontius R., Tu Z. (2018). Comparison of intensity analysis and the land use dynamic degrees to measure land changes outside versus inside the coastal zone of longhai, China. Ecol. Indic. 89, 336–347. doi: 10.1016/j.ecolind.2017.12.057
Hu S., Chen L., Li L., Wang B., Yuan L., Cheng L., et al. (2019). Spatiotemporal dynamics of ecosystem service value determined by land-use changes in the urbanization of anhui province, China. Int. J. Environ. Res. Public. Health. 16 (24), 5104. doi: 10.3390/ijerph16245104
Hu C., Shui B., Li W., Yang X., Zhang X. (2018). Assessing the ecological quality status of transplanted mangrove wetland in the oujiang estuary, China. Mar. Pollut. Bull. 133, 1–8. doi: 10.1016/j.marpolbul.2018.05.010
Ivits E., Cherlet M., Mehl W., Sommer S. (2009). Estimating the ecological status and change of riparian zones in Andalusia assessed by multi-temporal AVHHR datasets. Ecol. Indic. 9 (3), 422–431. doi: 10.1016/j.ecolind.2008.05.013
Jiang L., Liu Y., Wu S., Yang C. (2021). Analyzing ecological environment change and associated driving factors in China based on NDVI time series data. Ecol. Indic. 129, 107933. doi: 10.1016/j.ecolind.2021.107933
Jiang T.-t., Pan J.-F., Pu X.-M., Wang B., Pan J.-J. (2015). Current status of coastal wetlands in China: Degradation, restoration, and future management. Estuarine. Coast. Shelf. Sci. 164, 265–275. doi: 10.1016/j.ecss.2015.07.046
Jing Y., Zhang F., He Y., Kung H.-T., Johnson V. C., Arikena M. (2020). Assessment of spatial and temporal variation of ecological environment quality in ebinur lake wetland national nature reserve, xinjiang, China. Ecol. Indic. 110, 105874. doi: 10.1016/j.ecolind.2019.105874
Jogo W., Hassan R. (2010). Balancing the use of wetlands for economic well-being and ecological security: The case of the Limpopo wetland in southern Africa. Ecol. Econ. 69 (7), 1569–1579. doi: 10.1016/j.ecolecon.2010.02.021
Li H., Li L., Su F., Wang T., Gao P. (2021). Ecological stability evaluation of tidal flat in coastal estuary: A case study of liaohe estuary wetland, China. Ecol. Indic. 130, 108032. doi: 10.1016/j.ecolind.2021.108032
Liu L., Xu W., Yue Q., Teng X., Hu H. (2018). Problems and countermeasures of coastline protection and utilization in China. Ocean. Coast. Manage. 153, 124–130. doi: 10.1016/j.ocecoaman.2017.12.016
Liu J., Zang C., Tian S., Liu J., Yang H., Jia S., et al. (2013). Water conservancy projects in China: Achievements, challenges and way forward. Global. Environ. Change. 23 (3), 633–643. doi: 10.1016/j.gloenvcha.2013.02.002
Lu Q., Bai J., Zhang G., Wu J. (2020). Effects of coastal reclamation history on heavy metals in different types of wetland soils in the pearl river delta: Levels, sources and ecological risks. J. Cleaner. Product. 272, 122668. doi: 10.1016/j.jclepro.2020.122668
Ma C., Ai B., Zhao J., Xu X., Huang W. (2019). Change detection of mangrove forests in coastal guangdong during the past three decades based on remote sensing data. Remote. Sens. 11 (8), 921. doi: 10.3390/rs11080921
Ma T., Li X., Bai J., Cui B. (2019). Tracking three decades of land use and land cover transformation trajectories in china's large river deltas. Land. Degrad. Dev. 30 (7), 799–810. doi: 10.1002/ldr.3268
Ma Z. J., Melville D. S., Liu J. G., Chen Y., Yang H. Y., Ren W. W., et al. (2014). Rethinking china's new great wall. Science 346 (6212), 912–914. doi: 10.1126/science.1257258
Mao D., Wang Z., Du B., Li L., Tian Y., Jia M., et al. (2020). National wetland mapping in China: A new product resulting from object-based and hierarchical classification of landsat 8 OLI images. ISPRS. J. Photogramm. Remote. Sens. 164, 11–25. doi: 10.1016/j.isprsjprs.2020.03.020
Mao D., Yang H., Wang Z., Song K., Thompson J. R., Flower R. J. (2022). Reverse the hidden loss of china’s wetlands. Science 376 (6597), 1060–1061. doi: 10.1126/science.adc8833
Moran P. A. P. (1948). The interpretation of statistical maps. J. R. Stat. Soc. Ser. B (Methodological). 10 (2), 243–251. doi: 10.1111/j.2517-6161.1948.tb00012.x
Murray N. J., Clemens R. S., Phinn S. R., Possingham H. P., Fuller R. A. (2014). Tracking the rapid loss of tidal wetlands in the yellow Sea. Front. Ecol. Environ. 12 (5), 267–272. doi: 10.1890/130260
Newton A., Icely J., Cristina S., Perillo G. M. E., Turner R. E., Ashan D., et al. (2020). Anthropogenic, direct pressures on coastal wetlands. Front. Ecol. Evol. 8. doi: 10.3389/fevo.2020.00144
Niemeijer D., de Groot R. S. (2008). A conceptual framework for selecting environmental indicator sets. Ecol. Indic. 8 (1), 14–25. doi: 10.1016/j.ecolind.2006.11.012
Pettorelli N., Vik J. O., Mysterud A., Gaillard J.-M., Tucker C. J., Stenseth N. C. (2005). Using the satellite-derived NDVI to assess ecological responses to environmental change. Trends. Ecol. Evol. 20 (9), 503–510. doi: 10.1016/j.tree.2005.05.011
Prăvălie R., Sîrodoev I., Nita I.-A., Patriche C., Dumitraşcu M., Roşca B., et al. (2022). NDVI-based ecological dynamics of forest vegetation and its relationship to climate change in Romania during 1987–2018. Ecol. Indic. 136, 108629. doi: 10.1016/j.ecolind.2022.108629
Shi H., Lu J., Zheng W., Sun J., Li J., Guo Z., et al. (2020). Evaluation system of coastal wetland ecological vulnerability under the synergetic influence of land and sea: A case study in the yellow river delta, China. Mar. Pollut. Bull. 161, 111735. doi: 10.1016/j.marpolbul.2020.111735
Siddig A. A. H., Ellison A. M., Ochs A., Villar-Leeman C., Lau M. K. (2016). How do ecologists select and use indicator species to monitor ecological change? insights from 14 years of publication in ecological indicators. Ecol. Indic. 60, 223–230. doi: 10.1016/j.ecolind.2015.06.036
Sobrino J. A., Jiménez-Muñoz J. C., Paolini L. (2004). Land surface temperature retrieval from LANDSAT TM 5. Remote. Sens. Environ. 90 (4), 434–440. doi: 10.1016/j.rse.2004.02.003
Sokal R. R., Oden N. L. (1978). Spatial autocorrelation in biology: 1. methodology. Biol. J. Linn. Soc. 10 (2), 199–228. doi: 10.1111/j.1095-8312.1978.tb00013.x
Stefanov W. L., Netzband M. (2005). Assessment of ASTER land cover and MODIS NDVI data at multiple scales for ecological characterization of an arid urban center. Remote. Sens. Environ. 99 (1-2), 31–43. doi: 10.1016/j.rse.2005.04.024
Sun X., Li Y., Zhu X., Cao K., Feng L. (2017). Integrative assessment and management implications on ecosystem services loss of coastal wetlands due to reclamation. J. Cleaner. Product. 163, S101–S112. doi: 10.1016/j.jclepro.2015.10.048
Sun Z., Sun W., Tong C., Zeng C., Yu X., Mou X. (2015). China's coastal wetlands: Conservation history, implementation efforts, existing issues and strategies for future improvement. Environ. Int. 79, 25–41. doi: 10.1016/j.envint.2015.02.017
Tiner R. W. (2004). Remotely-sensed indicators for monitoring the general condition of “natural habitat” in watersheds: an application for delaware’s nanticoke river watershed. Ecol. Indic. 4 (4), 227–243. doi: 10.1016/j.ecolind.2004.04.002
Wang J., Chen J., Wen Y., Fan W., Liu Q., Tarolli P. (2021). Monitoring the coastal wetlands dynamics in northeast Italy from 1984 to 2016. Ecol. Indic. 129, 107906. doi: 10.1016/j.ecolind.2021.107906
Wang J., Han P., Zhang Y., Li J., Xu L., Shen X., et al. (2022). Analysis on ecological status and spatial–temporal variation of tamarix chinensis forest based on spectral characteristics and remote sensing vegetation indices. Environ. Sci. Pollut. Res. 29 (25), 37315–37326. doi: 10.1007/s11356-022-18678-1
Wang C., Jiang Q. O., Shao Y., Sun S., Xiao L., Guo J. (2019). Ecological environment assessment based on land use simulation: A case study in the heihe river basin. Sci. Total. Environ. 697, 133928. doi: 10.1016/j.scitotenv.2019.133928
Wang W., Liu H., Li Y., Su J. (2014). Development and management of land reclamation in China. Ocean. Coast. Manage. 102, 415–425. doi: 10.1016/j.ocecoaman.2014.03.009
Wang X., Xiao X., Xu X., Zou Z., Chen B., Qin Y., et al. (2021). Rebound in china’s coastal wetlands following conservation and restoration. Nat. Sustainabil. 4 (12), 1076–1083. doi: 10.1038/s41893-021-00793-5
Wu W., Zhi C., Gao Y., Chen C., Chen Z., Su H., et al. (2022). Increasing fragmentation and squeezing of coastal wetlands: Status, drivers, and sustainable protection from the perspective of remote sensing. Sci. Total. Environ. 811, 152339. doi: 10.1016/j.scitotenv.2021.152339
Xiong Y., Xu W., Lu N., Huang S., Wu C., Wang L., et al. (2021). Assessment of spatial–temporal changes of ecological environment quality based on RSEI and GEE: A case study in erhai lake basin, yunnan province, China. Ecol. Indic. 125, 107518. doi: 10.1016/j.ecolind.2021.107518
Xu H. (2013). A remote sensing urban ecological index and its application. Acta Ecologica Sinica. China. China. Acta Ecologica Sinica. 33 (24), 7853–7862. doi: 10.5846/stxb201208301223
Xu H., Wang Y., Guan H., Shi T., Hu X. (2019). Detecting ecological changes with a remote sensing based ecological index (RSEI) produced time series and change vector analysis. Remote Sens. 11 (20), 2345. doi: 10.3390/rs11202345
Yang S. L. (2005). Impact of dams on Yangtze river sediment supply to the sea and delta intertidal wetland response. J. Geophys. Res. 110 (F3), 01–12. doi: 10.1029/2004jf000271
Yang J., Huang X. (2021). The 30 m annual land cover dataset and its dynamics in China from 1990 to 2019. Earth. Syst. Sci. Data. 13 (8), 3907–3925. doi: 10.5194/essd-13-3907-2021
Yang M., Yang T., Zhang L., Lin J., Qin X., Liao M. (2018). Spatio-temporal characterization of a reclamation settlement in the shanghai coastal area with time series analyses of X-, c-, and l-band SAR datasets. Remote. Sens. 10 (2), 329. doi: 10.3390/rs10020329
Yang W., You Q., Fang N., Xu L., Zhou Y., Wu N., et al. (2018). Assessment of wetland health status of poyang lake using vegetation-based indices of biotic integrity. Ecol. Indic. 90, 79–89. doi: 10.1016/j.ecolind.2017.12.056
Yao K., Halike A., Chen L., Wei Q. (2022). Spatiotemporal changes of eco-environmental quality based on remote sensing-based ecological index in the hotan oasis, xinjiang. J. Arid. Land. 14 (3), 262–283. doi: 10.1007/s40333-022-0011-2
Yim J., Kwon B.-O., Nam J., Hwang J. H., Choi K., Khim J. S. (2018). Analysis of forty years long changes in coastal land use and land cover of the yellow Sea: The gains or losses in ecosystem services. Environ. Pollut. 241, 74–84. doi: 10.1016/j.envpol.2018.05.058
Zang Z., Wu X., Niu Y., Mao G. (2020). Analysis of the contributions of human factors and natural factors affecting the vegetation pattern in coastal wetlands. Ecosyst. Health. Sustainabil. 6 (1), 1827982. doi: 10.1080/20964129.2020.1827982
Zedler J. B., Kercher S. (2005). WETLAND RESOURCES: Status, trends, ecosystem services, and restorability. Annu. Rev. Environ. Resour. 30 (1), 39–74. doi: 10.1146/annurev.energy.30.050504.144248
Keywords: spatial-temporal variation, ecological environment quality, remote sensing ecological index, coastal estuarine wetlands, Google Earth Engine
Citation: Zhang Z, Cai Z, Yang J and Guo X (2022) Ecological environmental quality assessment of Chinese estuarine wetlands during 2000–2020 based on a remote sensing ecological index. Front. Mar. Sci. 9:981139. doi: 10.3389/fmars.2022.981139
Received: 29 June 2022; Accepted: 16 August 2022;
Published: 02 September 2022.
Edited by:
Tian Xie, Beijing Normal University, ChinaReviewed by:
Jie Wang, Anhui University, ChinaHuiping Jiang, Aerospace Information Research Institute (CAS), China
Copyright © 2022 Zhang, Cai, Yang and Guo. This is an open-access article distributed under the terms of the Creative Commons Attribution License (CC BY). The use, distribution or reproduction in other forums is permitted, provided the original author(s) and the copyright owner(s) are credited and that the original publication in this journal is cited, in accordance with accepted academic practice. No use, distribution or reproduction is permitted which does not comply with these terms.
*Correspondence: Zhen Zhang, emhhbmd6aGVuQGF1c3QuZWR1LmNu