 Kotaro Ono1*
 Aril Slotte1
 Sondre Hølleland1
 Steven Mackinson2
 Sigurður Þór Jónsson3
 Jan Arge Jacobsen4
 Anna Heiða Ólafsdóttir3
- 1Institute of Marine Research (IMR), Bergen, Norway
- 2Scottish Pelagic Fishermen’s Association, Fraserburgh, United Kingdom
- 3Marine and Freshwater Research Institute, Hafnarfjörður, Iceland
- 4Faroe Marine Research Institute, Tórshavn, Faroe Islands
Based on GIS-mapping and semi-parametric modelling of recaptures from PIT-tag experiments in the North Sea nursery area (September 2011), the Celtic Seas spawning area (May-June 2014-2021) and the Icelandic Waters feeding area (August 2015-2019), we argue that the distribution of Northeast Atlantic (NEA) mackerel is influenced by a size-dependent migratory behaviour. The time-space recapture dynamics revealed that larger mackerel tended to migrate a longer distance between spawning and feeding areas, either through a western route from the Celtic Seas into the Icelandic Waters and the Greenland Sea or by following the main route northwards through the Faroe-Shetland Channel into the Norwegian Sea. This long-distance travel resulted in turn in delayed arrival in the North Sea wintering area. During the return spawning migration into the Celtic Seas, larger individuals remained in the front, likely heading to spawning grounds farther south than smaller conspecifics. Migration patterns also evolved with time at liberty as the mackerel grew older and larger, while possibly covering a progressively wider area over its annual migration cycle as suggested from the tagging data. However, the study also showed large inter-annual variability in the recapture patterns which likely reflect changes in environmental condition (prey availability and ocean current), NEA mackerel population demographics, and the spatial fishery dynamics.
Introduction
Size structure has the potential to be an important driver for changes in migration patterns of fish because optimal swimming speed, which maximizes the distance travelled per unit energy expenditure, is proportional to body length (Ware, 1978). In fact, in migratory pelagic fish, one may typically observe size-dependent behaviour where the largest individuals undertake both longer feeding (Nøttestad et al., 1999; Eliasen et al., 2021; Homrum et al., 2022) and spawning migrations (Slotte, 1999; Slotte and Fiksen, 2000). In addition, size segregations can also occur between pelagic fish shoals (Pitcher and Parrish, 1993) linked to hydrodynamic advantages of swimming close to neighbours of similar size (Pitcher et al., 1985). Such collective behaviour related to size may in turn have direct implications on the size-based distributions of pelagic species due to the differential impact of social learning. Indeed, young/small spawners may establish their own migration pattern centred around their nursery area. But as individuals grow older, they migrate faster and farther, progressively mixing more with older experienced conspecifics and finally adopting their routes or choosing their own route if they dominate the school in numbers (Huse et al., 2002; Huse et al., 2010).
Northeast Atlantic (NEA) mackerel (Scomber scombrus) is a medium-sized highly migratory pelagic schooling fish that is widely distributed northwards from Gibraltar to Spitsbergen (36N°–76°N) and eastwards from Greenland to the Baltic Sea (20°W–36°E) (ICES, 2021). The species has a burst speed of up to 8 body lengths per second and an endurance speed of 1-3 body lengths per second (He and Wardle, 1988; Wardle and He, 1988). Typically, NEA mackerel spawns between Portugal and the North Sea (Bruge et al., 2016; Brunel et al., 2018), feeds in Norwegian Sea and adjacent waters (Astthorsson et al., 2012; Jansen et al., 2016; Pacariz et al., 2016; Nikolioudakis et al., 2019; Olafsdottir et al., 2019), and winters east of Shetland (Jansen et al., 2012). Based on analyses of data from scientific surveys and fishing fleet in combination with data on environmental and ecological changes, the current scientific understanding is that the distribution of NEA mackerel is mainly influenced by density-dependence and environmental conditions. But the influence of size-dependent migration behaviour on the observed distributional dynamics has largely remained unexplored to date.
To remedy that, scientists in Norway and Iceland have conducted annual tagging experiments along Ireland and British Isles during the spawning season in May-June from 2011 onwards (Norway), and during feeding in August off West Iceland between 2014-2019 (Iceland) (ICES, 2021). Although these PIT-tag experiments were originally designed for stock assessment (to estimate the abundance and mortality rates), the data offers an extraordinary opportunity for exploring size-dependent migratory behaviour. Nonetheless, these tagged mackerel of variable sizes also face varying oceanographic conditions both immediately after release and over successive migration cycles (Figures 1, 2) which could also influence their migration routes. Of particular interest are the variable strength of the north-eastward current towards the Faroe- and Shetland islands, the north-westward current toward Iceland with local eddies (Hátún et al., 2005; Larsen et al., 2012) and the distribution of prey (Olafsdottir et al., 2019) – on which mackerel depend heavily upon when energy storage levels are depleted after spawning (Jansen et al., 2021). This implies that tagging at different latitudes within a year, or at same location in different years, could potentially influence the results and interpretation of migration routes. Moreover, observations from tag deployments in May and June show that mackerel are often concentrated along the shelf, but also that the western limits have been extended towards Iceland after 2007 (Brunel et al., 2018). This western extension suggests that some proportion of the stock may have taken an alternative direct route north-west of Ireland towards the feeding grounds in Icelandic Waters and farther west to Greenland Sea, instead of following the route northwards to Norwegian Sea though the Faroe-Shetland channel (Iversen, 2002) before turning south-west again to the south (Figure 2). This direct route would require much lower migration speed and effort to reach the western feeding areas at a preferred time compared with the longer route through the Norwegian Sea.
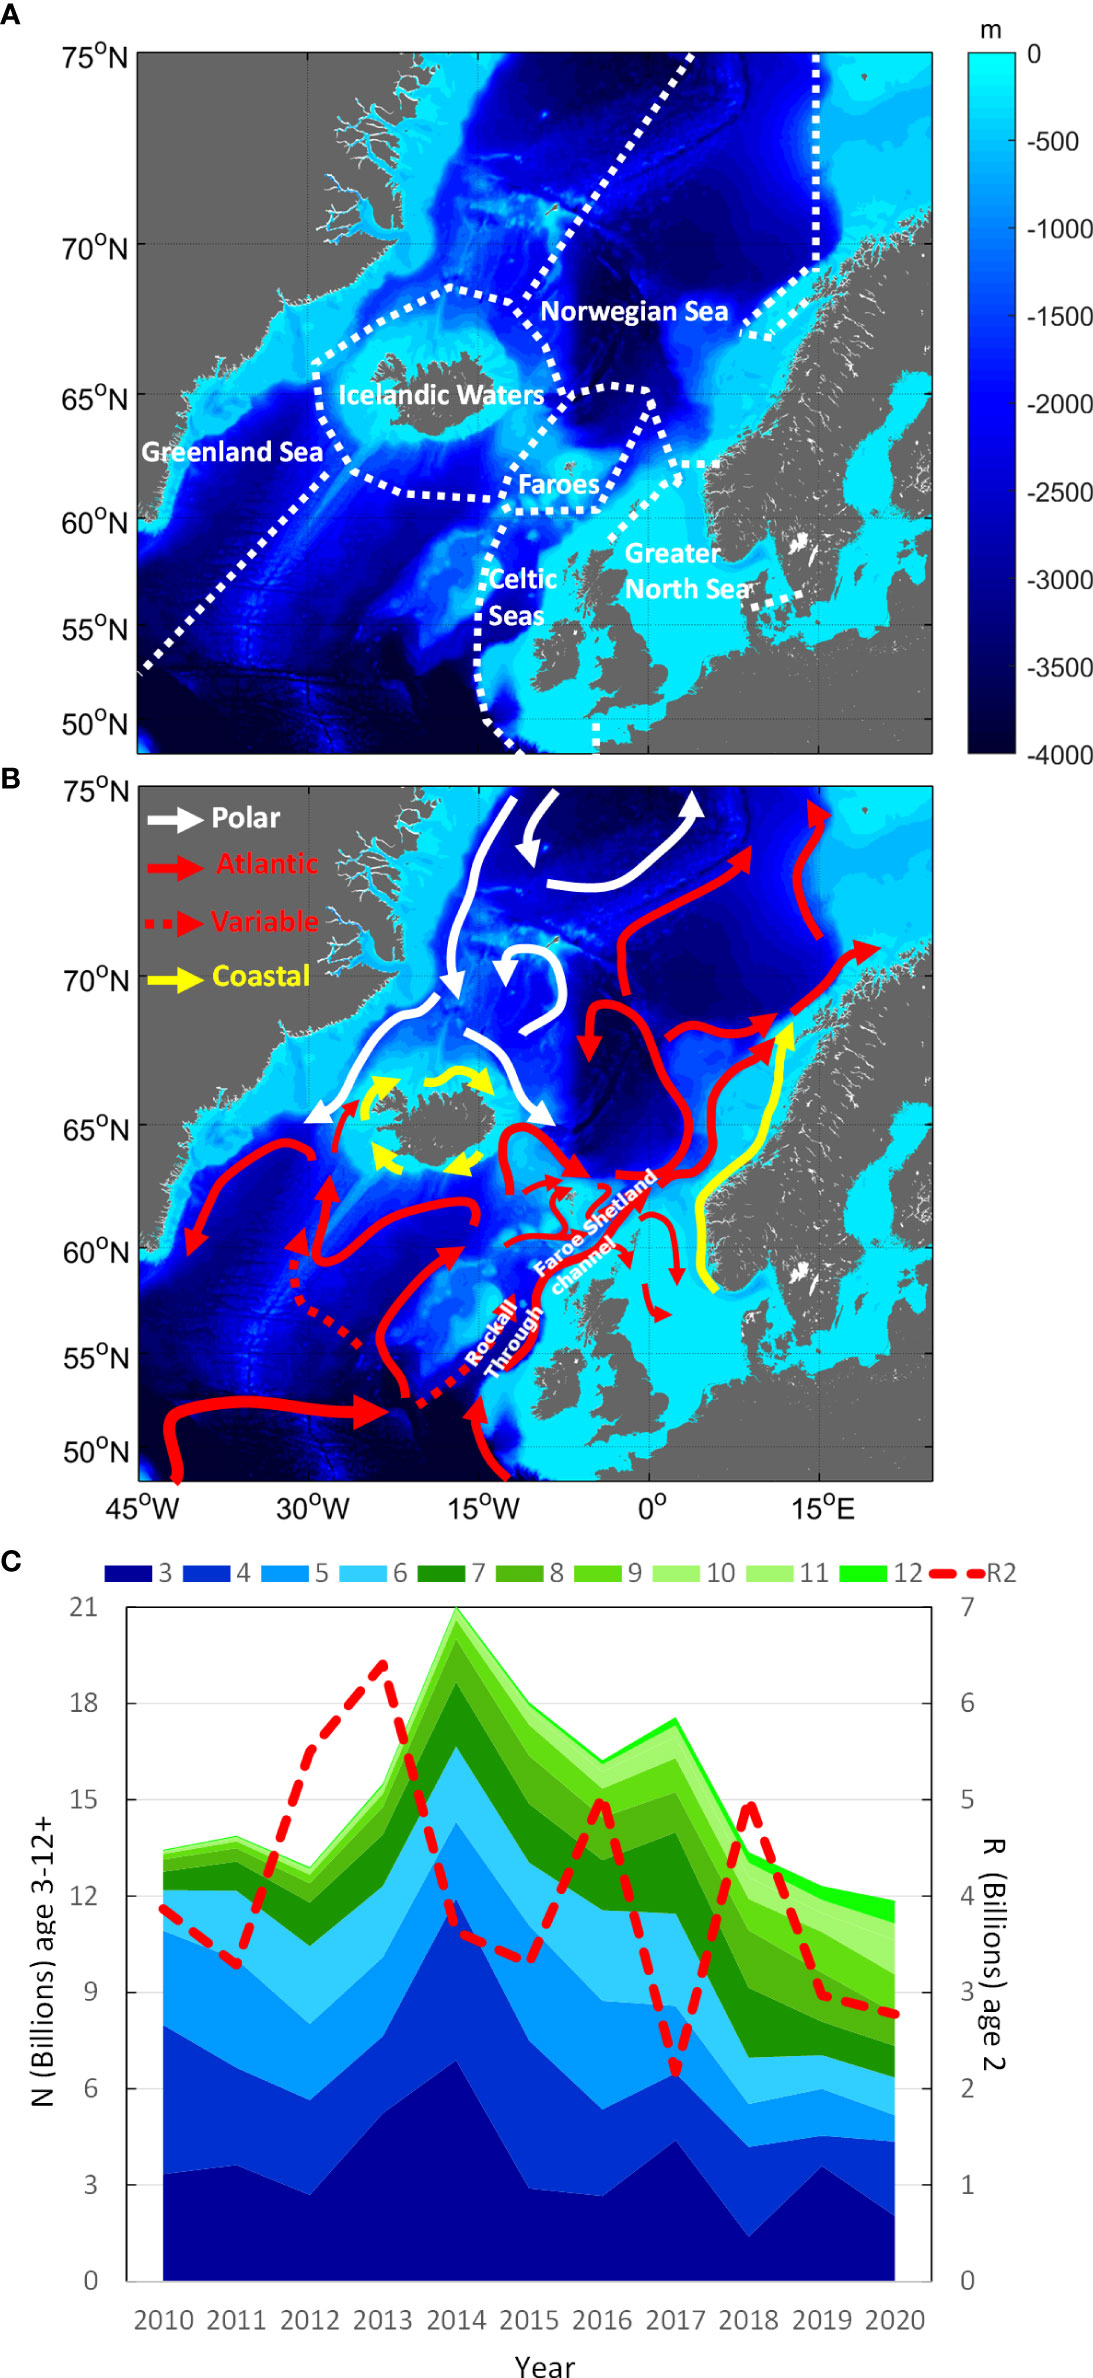
Figure 1 (A) ICES ecoregions used as basis for GAM modelling of recapture probabilities from PIT-tag experiments of NEA mackerel in Celtic Seas and Icelandic Waters 2014-2020. (B) The main features of the near-surface circulation in the eastern North Atlantic and the Nordic Seas (modified from Stefánsson and Ólafsson, 1991; Turrell et al., 1996; Hansen and Østerhus, 2000; Orvik, 2004). (C) Abundance at ages 3-12+ compared with recruitment at age 2 (ICES, 2021) to demonstrate stock decline and aging over the study period.
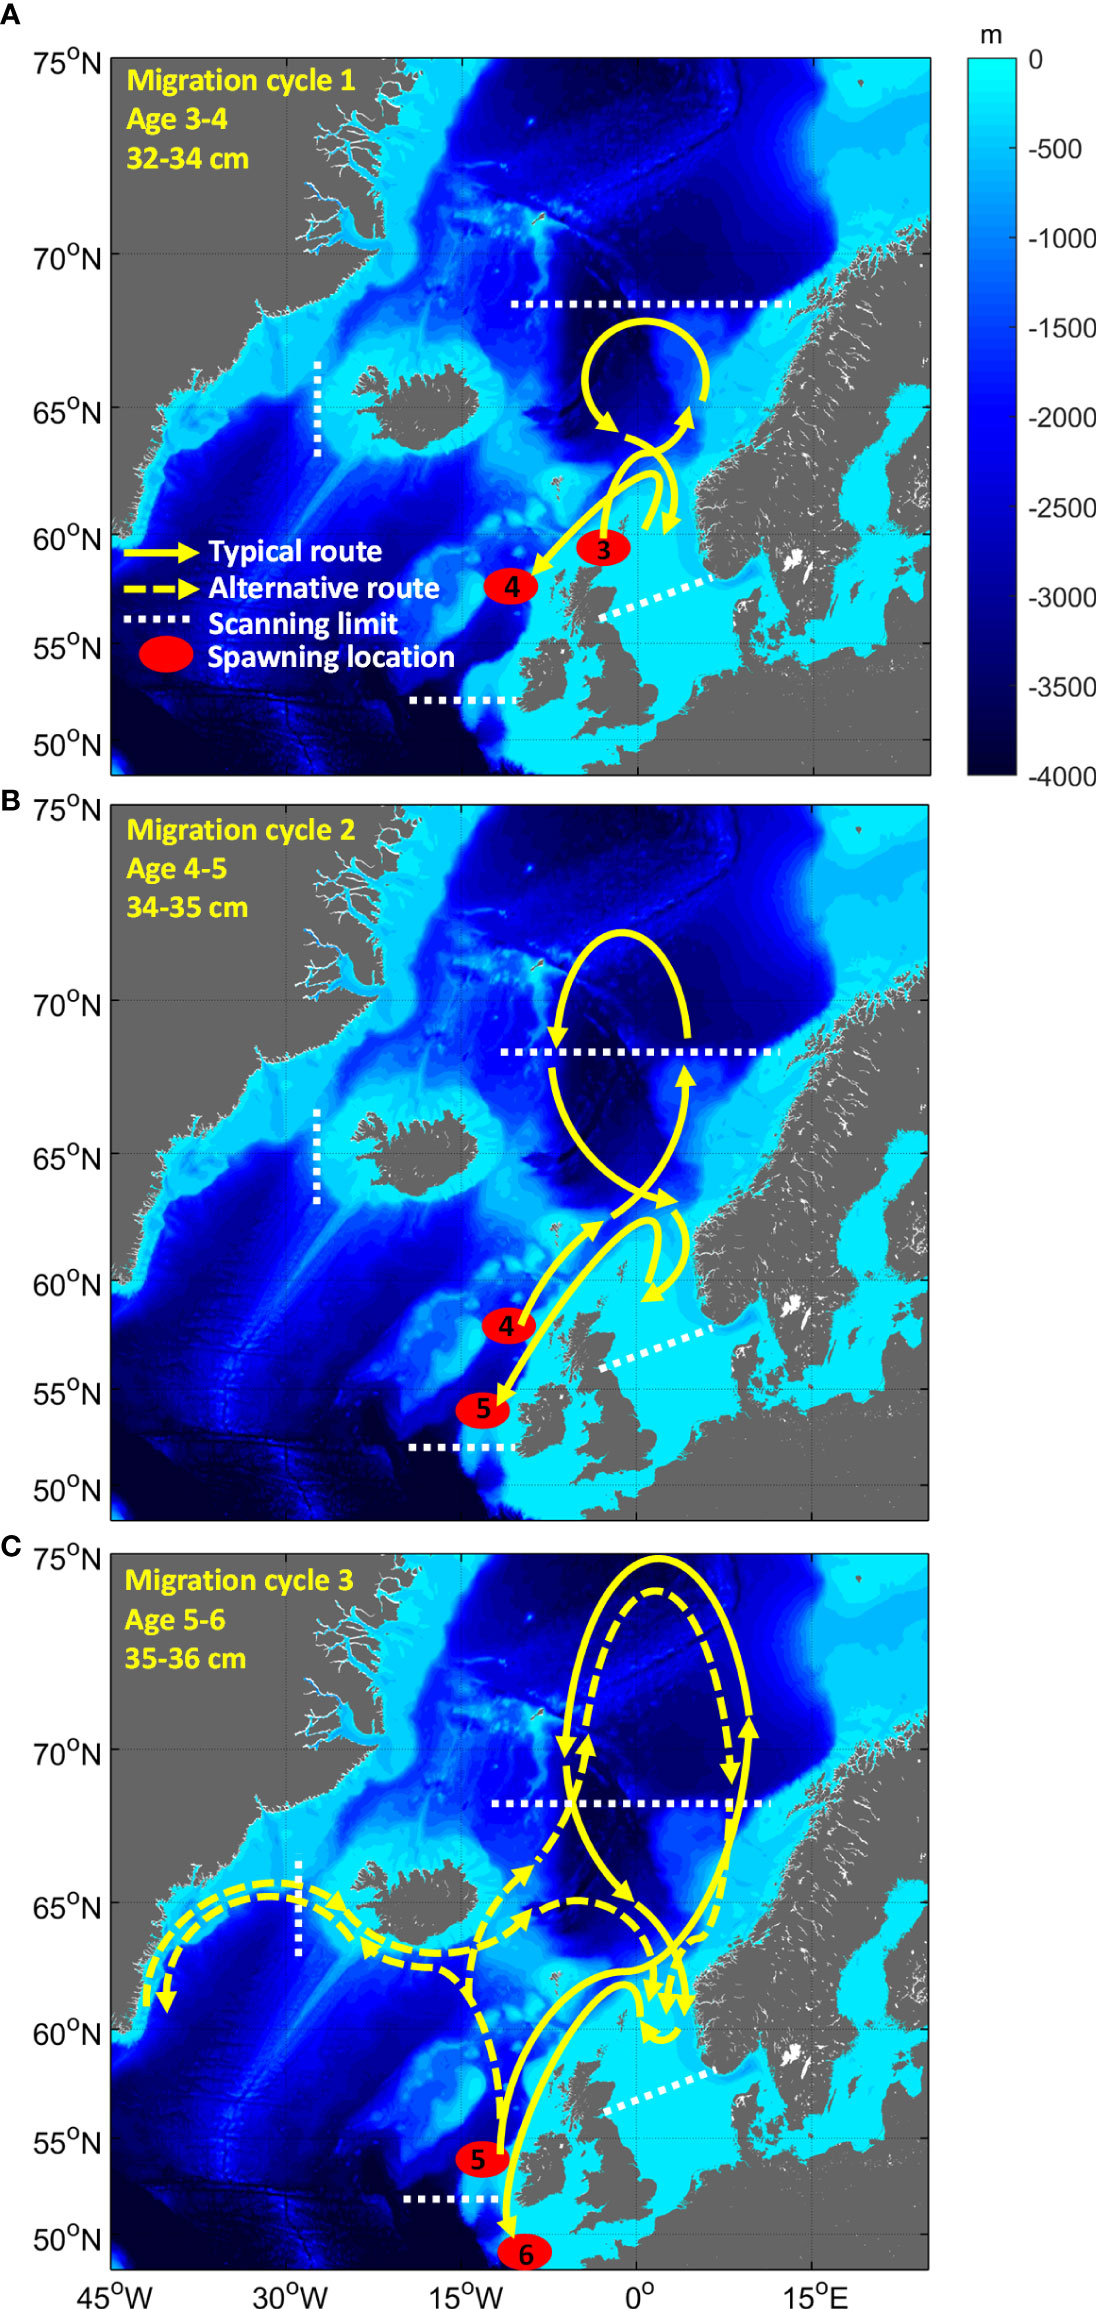
Figure 2 Illustration of the size dependent migration hypothesis for NEA mackerel with the wintering area in the Greater North Sea as the starting point. Maps show a hypothetical development of the migration cycles over three years (A–C), from spawning at age 3 (~32 cm in body length) until spawning at age 6 (~36 cm in body length). According to this hypothesis, mackerel may potentially migrate farther south to spawn (Bay of Biscay, Spain) and farther north (Spitsbergen) and west (Greenland) to feed when tagged at larger sizes or as they grow larger, thereby periodically being outside the fishing areas scanned for PIT-tags.
In this study, we use the Norwegian and Icelandic PIT-tagging experiments to accomplish three objectives:
1. Test the NEA mackerel size-dependent migration hypothesis i.e. using the wintering areas east of Shetland as starting point, mackerel will migrate farther south to spawn and farther north and west to feed as they grow older and larger (Figure 2). Our expectation is that tag recapture patterns will change with time at liberty as the fish grow older and larger.
2. Show that the recapture pattern is not only influenced by the size-dependent migration but is a result of a multitude of factors including the environment (e.g. ocean current, prey distribution), population demographics, and fishery dynamics. We expect that the recapture pattern will show clear inter-annual changes that are consistent with the above sources of influence.
3. Provide further support to past observations that some mackerel may have adopted a more direct route north-west of Ireland towards the feeding grounds in Icelandic and Greenland Waters. We expect that the examination of movement rate for hypothetical migration routes at different timing could provide support for the direct route hypothesis.
Material and methods
Study area
An overview of the study area with general oceanographic conditions is given in Figure 1. We used the ICES ecoregions (ICES, 2020) as basis for our spatiotemporal analysis of tag recaptures. Here Greenland Sea (GS), Icelandic Waters (ICW), Faroes (F), and Norwegian Sea (NWS) represented the main feeding areas, the Greater North Sea (GNS) the main wintering area and the Celtic Seas (CES) the spawning area. Note that recaptures in the Faroes region were limited thus merged into the nearest neighbouring region for simplicity. Note also that we assumed that the progression of the fishery was representative of the location where the bulk of mackerel population was located. Unfortunately, fishing areas scanned for PIT-tags did not cover the full distribution area either during feeding (Olafsdottir et al., 2019) or spawning (Brunel et al., 2018). This implies that the tagged fish, especially at increasing sizes, will undertake migrations outside the area with scanned landings while potentially feeding westwards all the way to the Greenland Sea or north to Spitsbergen and during spawning farther south in Bay of Biscay and Iberian coast (Figure 2). This is an important underlying assumption relevant to interpreting the tag-recapture data, which we return to in the discussion.
PIT-tag methodology and data collection
The RFID tagging project on NEA mackerel was initiated in 2011 by the Institute of Marine Research (IMR) in Norway with the main objective to provide data for stock assessment by replacing the older steel tagging technology used from 1969-2009 (Tenningen et al., 2011; ICES, 2021).
IMR has developed monitoring systems where antennas are specially designed for pipes (round antennas) or conveyor belt systems (flat antennas) to detect the tagged fish as they are pumped from fishing vessels, or during production inside factories. During this process, fish are not measured; therefore, information on mackerel size at recapture is lacking in this study. These antennas are connected to readers that communicate directly with an IMR database providing updated information in real time. The project started with recapture information from 8 Norwegian factories in 2012 and increased to a total of 24 factories by 2018, also including factories in Iceland, Faroes, and Scotland from 2014 onwards. This has resulted in about a tenfold increase in scanned biomass compared to the period with steel tagging, now covering the main distribution of international fishery during the feeding, wintering and spawning migration - with the exception of fisheries south of Ireland (ICES, 2021).
Every year, since 2011 mackerel have been PIT-tagged during a month-long survey at main spawning grounds in Celtic Seas ecoregion in May. Common strategy for all years was to focus on high mackerel density fishing grounds based on past 50 years of tagging survey experience in the area, instead of conducting widespread tagging along the shelf (Tenningen et al., 2011). Still some spatial spreading of tagged fish occurred naturally during the search for fish. All tagged mackerel were captured by a commercial purse-seine fishing vessel equipped with 4 jigging machines, each with 5 or more hooks. Captured mackerel are put in 1 m round tanks with running water to recover for up to 30 minutes, before they are measured (length and weight), tagged, and released through pipes with running water on the opposite side of the vessel. The tag is inserted into the abdomen of both maturing, spawning, and spent individuals using a tagging gun with a needle. All PIT-tagging experiments, including the handling and tagging methodology, is approved by the Norwegian Animal Research Authority. During tagging there is a combined PC-reader system, where each unique tag ID is recorded together with the details on experiment, including: release number, measure of body length, exact time, GPS-position of tagging, as well as initials of tagger and assistants. These data are synchronized with the IMR database over internet several times during a tagging day.
During the years 2014-2019 Marine and Freshwater Research Institute, also conducted experiments with the similar methodology on feeding mackerel west of Iceland syncing data to the IMR database. The Icelandic Waters experiments were conducted on ~12 m jiggers, and focused on a quick release after tagging instead of giving the mackerel a recovery period in tanks on a small vessel.
In 2011, a one-time experiment focussing on immature mackerel was carried out along the Norwegian Coast in the North Sea. The individuals were caught in purse seines then transferred to sea pens in September. This experiment was dominated by 1-year olds of the 2010-year class, and referred to here as the 1-year old North Sea experiment.
A web-based software solution is used to monitor the different tagging surveys, scanning systems at the factories, and used to import data on catch information from all scanned landings, such as position in terms of ICES rectangle and catch size in kg. Catch information is delivered by responsible scientists from Iceland, Faroes, Scotland, and Norway based on registrations within each nation. When a tagged fish is automatically detected by the monitoring system it stores the unique ID together with info on exact time and factory of detection and links to the data previously stored at time of release. Later, at least once a year, recaptures are manually allocated to the specific landings and associated data in the database by linking to the catches produced at time of detection. Online links (APIs) to the PIT-tag database, description of data and data sharing agreements are given by Slotte et al. (2021).
Data selection for the analysis
In this work, we focused on the PIT-tag releases from three experiments. For the Celtic Seas experiment, we focused on the May-June period (i.e. 99% of the releases happens then, and a few in July) between 2014-2021 to ensure consistent coverage of the fishery. This corresponded to a total of 386574 tagged fish released over the 7 years-period. For the Icelandic Waters experiment – which provides information on fish undertaking a long western migration – a total of 15066 fish were tagged over six-years between 2014-2019. Finally, for the 2011 North Sea experiment on 1-year old, we focused on fish measuring 24-27 cm which corresponded to a total of 27013 individuals.
To study the recapture dynamics and the persistence of behaviour across returning periods, we included recapture data for up to three years after release. Recaptures continue after three years but these data were not analysed in the present study due to low sample size. Note also that recaptures mainly take place between July-February because factories with PIT-tag antenna systems do not process mackerel between March-June.
We examined the time at liberty of a tagged mackerel following their natural migration cycles – referred to as “migration cycle 1-3” hereon – covering the three years after release. Whether tagging was during the spawning period in the Celtic Seas or feeding in Icelandic Waters, “migration cycle 1” is determined as the period immediately after release until the end of February in the following year. A migration cycle as such then covers the feeding season in Icelandic Waters and Norwegian Sea, the following wintering in Greater North Sea, and finally the return spawning migration into Celtic Seas. Although no recapture data is available after February because the fishery has concluded, tagged fish will naturally continue to migrate over March-June perhaps farther south to Bay of Biscay and Iberian Coast. Thereafter, it will return during “migration cycle 2” to repeat its feeding-wintering-spawning migration over July-February, and so on. The 2011 North Sea experiment on 1-year old is an exception to the above migration cycle analysis as we follow the long-term spatial development of fish tagged in 2011 and their subsequent recaptures from 2012-2021.
In completeness, the data used for the analysis comprised 7072 recaptures from the Celtic Seas experiments (2014-2021), 301 recaptures from the Icelandic Waters experiments (2014-2019) and 149 recaptures from the 1-year old North Sea experiment (2011).
GIS mapping of tag-recapture data
Space-time dynamics in the tag-recapture data were illustrated with GIS-mapping for both Celtic Seas and Icelandic Waters PIT-tagging experiments, to compare the migration patterns over the three migration cycles. All GIS-mapping was based on the ICES statistical rectangles (0.5°N, 1°E) system used for reporting official landings.
The spatial distribution of numbers of mackerel released, scanned (biomass), and recaptured were mapped both aggregated across the study period, and for specific release years and the three migration cycles covered. For information on scanned numbers instead of biomass, one can look at the latest stock assessment report (ICES, 2021).
Similarly, catch month and recapture month within an ICES rectangle was calculated to illustrate the timing of the fishery and recaptures. Here within a year catch month was calculated as the month of the first catch where the cumulative catch weight exceeded 50% of the total catch within each ICES rectangle. When showing aggregated data over the study period these yearly estimates were used and the median catch month was calculated across catch year. The month of recapture was calculated as the median month of all recaptured mackerel within each ICES rectangle, migration cycle and release year.
To illustrate potential effects of the size and release location of the tagged fish, the median release body length and latitude was calculated for recaptured fish within ICES rectangles for each migration cycle, both as aggregated data across release years and for single release years. Note here that Icelandic Waters experiments did not have any latitudinal variation, and recaptures were not mapped based on that factor.
Finally, the total length distributions of the tagged fish were compared on a relative scale between the Celtic Seas and Icelandic Waters’ experiments to illustrate differences in mackerel size between the two tagging areas, both as aggregated data across the study period and for each single release year. To avoid confusion, it should be noted again that no recaptured fish are length measured, reported data on length distribution and median length within ICES rectangles are all taken from measurement made at the time of release.
For the North Sea experiment on the 1-year-olds, recaptures were also mapped by abundance in ICES rectangles over the period 2014-2021. In addition, we mapped the median age at recapture within ICES rectangle to demonstrate the spatial dynamics in recaptures from ages 2-10.
GAM modelling of space-time recapture probabilities
To further explore the space-time dynamics in the tag-recapture data, we modelled how the probability of recapture in each ICES ecoregion changed with body length of tagged fish, year and latitude of release as well as recapture date (in Julian days from June 1st of the release year, then standardized). This was examined for migration cycles 1, 2 and 3 (i.e. 0, 1, and 2 years after release), but only for the Celtic Seas experiments which had a vast amount of tag-recapture data with large spreads in tagging locations on a latitudinal scale. The analysis was done using generalized additive models (GAM) with binomial distribution and logit link.
Let be an indicator variable being 1 if the individual fish i is caught in region r and migration cycle and zero otherwise. We model the probability based on the individual fish length, release year, latitude of release and recapture date. For an individual fish caught in migration cycle h, the model for region r can be written as
where g is the logit link function. The function s, a thin plate regression spline as implemented in the mgcv R package (Wood, 2011), was used to model the effect of latitude, fish length, and recapture date. A separate model was run for each combination of region r and lag h to estimate the effect of each covariate and all models were implemented in R using the function gam in the mgcv package. Each data point was weighted by the inverse of the sample size (number of recapture individuals for that year) to alleviate the effect of unequal annual recapture probability.
The model results were presented as marginal effects, indicating how the variable on the x-axis changes the log-odds of recapturing a mackerel compared to an “average” fish in a specific region and migration cycle, all else equal. The “average” fish is defined as measuring 35cm, released from latitude 52.5°, in 2017, and recaptured at the mean recapture date for the specific ecoregion and migration cycle. For ease of visual representations, all marginal effect plots were scaled to start at 0.
As the main purpose of this study was to examine the effect of each variable, we did not perform a model selection and kept all four variables for all analyses. However, a separate analysis was conducted to examine possible changes in covariate effect after model selection (using AIC), but the results showed that all stayed qualitatively the same (Supplementary S1). Furthermore, residual diagnostics indicated that all models were reasonable and did not show any large deviations from modelling assumptions (Supplementary S2). All codes and data are available on https://github.com/Kotkot/IMRtag.
Estimating potential movement rate between tag and recapture locations
Movement rate – body lengths per second between release and recapture locations – were explored to exemplify potential mackerel rate of movement. First, the centre of gravity (COG) and median timing was calculated for both releases and recaptures in specific areas and period during migration cycle 1 for both the Celtic Seas and Icelandic Waters experiments. Then, distance between release and recapture COGs were estimated either as straight lines or anticipated routes, which formed the basis to estimate the potential movement rate together with individual body lengths and tag-recapture times which was then compared between different routes and to the current state of knowledge (Nøttestad et al., 2016a). Therefore, this movement rate should not be interpreted as the actual fish swimming speed but rather as an approximation of the overall movement rate of an individual after accounting for the influence of current which might make the individual reach sooner/later their destination.
Six theoretical migration routes were explored. We looked at two possibilities between Celtic Seas spawning grounds and Icelandic Waters: one that exemplified a direct route and another one that represented a longer, more traditional route through the Norwegian Sea. For both cases, we focused on individuals that were recaptured in June-July in southern Iceland from the Celtic Seas experiment. The third route also focused on feeding migration but this time between Celtic Seas spawning grounds and recaptures in Norwegian Sea in July-August. The fourth and fifth routes were based on the Icelandic experiment and illustrated route options during a return migration from western grounds. These focused on mackerel tagged in August at the west coast of Iceland, which were then either recaptured at the east coast of Iceland or in the Norwegian Sea in August-September. The last route focused on spawning migration between wintering area in the Greater North Sea and Celtic Seas spawning area. For the latter, a slightly different approach was taken to calculate the migration speed: It used the recapture data from all experiments and migration cycle 1-3, where migration distance was calculated between the COG of recaptures in October-November and February. The main fishery has usually ceased by December as the annual quota has already been taken. Therefore, the few recaptures in December are likely not representative of the wintering distribution, thus excluded from the COG calculation. However, we anticipate that the onset of spawning migration happened mid-December (Walsh et al., 1995). We therefore used December 15th as the start date of the spawning migration. Otherwise, individual body lengths and recapture times in February were used as basis for estimated spawning migration speed.
Results
Size and spatial distribution of tagged mackerel
The PIT-tagged mackerel in the Celtic Seas experiments between 2014-2021 were mainly distributed along the Irish shelf 51-55°N until 2019, then farther north to 61°N since 2020 i.e. the year with Covid sailing restrictions at IMR (Figure S1). For the Icelandic Waters experiments between 2014-2019, all fish were basically tagged in the same area on the west coast (65°N) (Figure 3A).
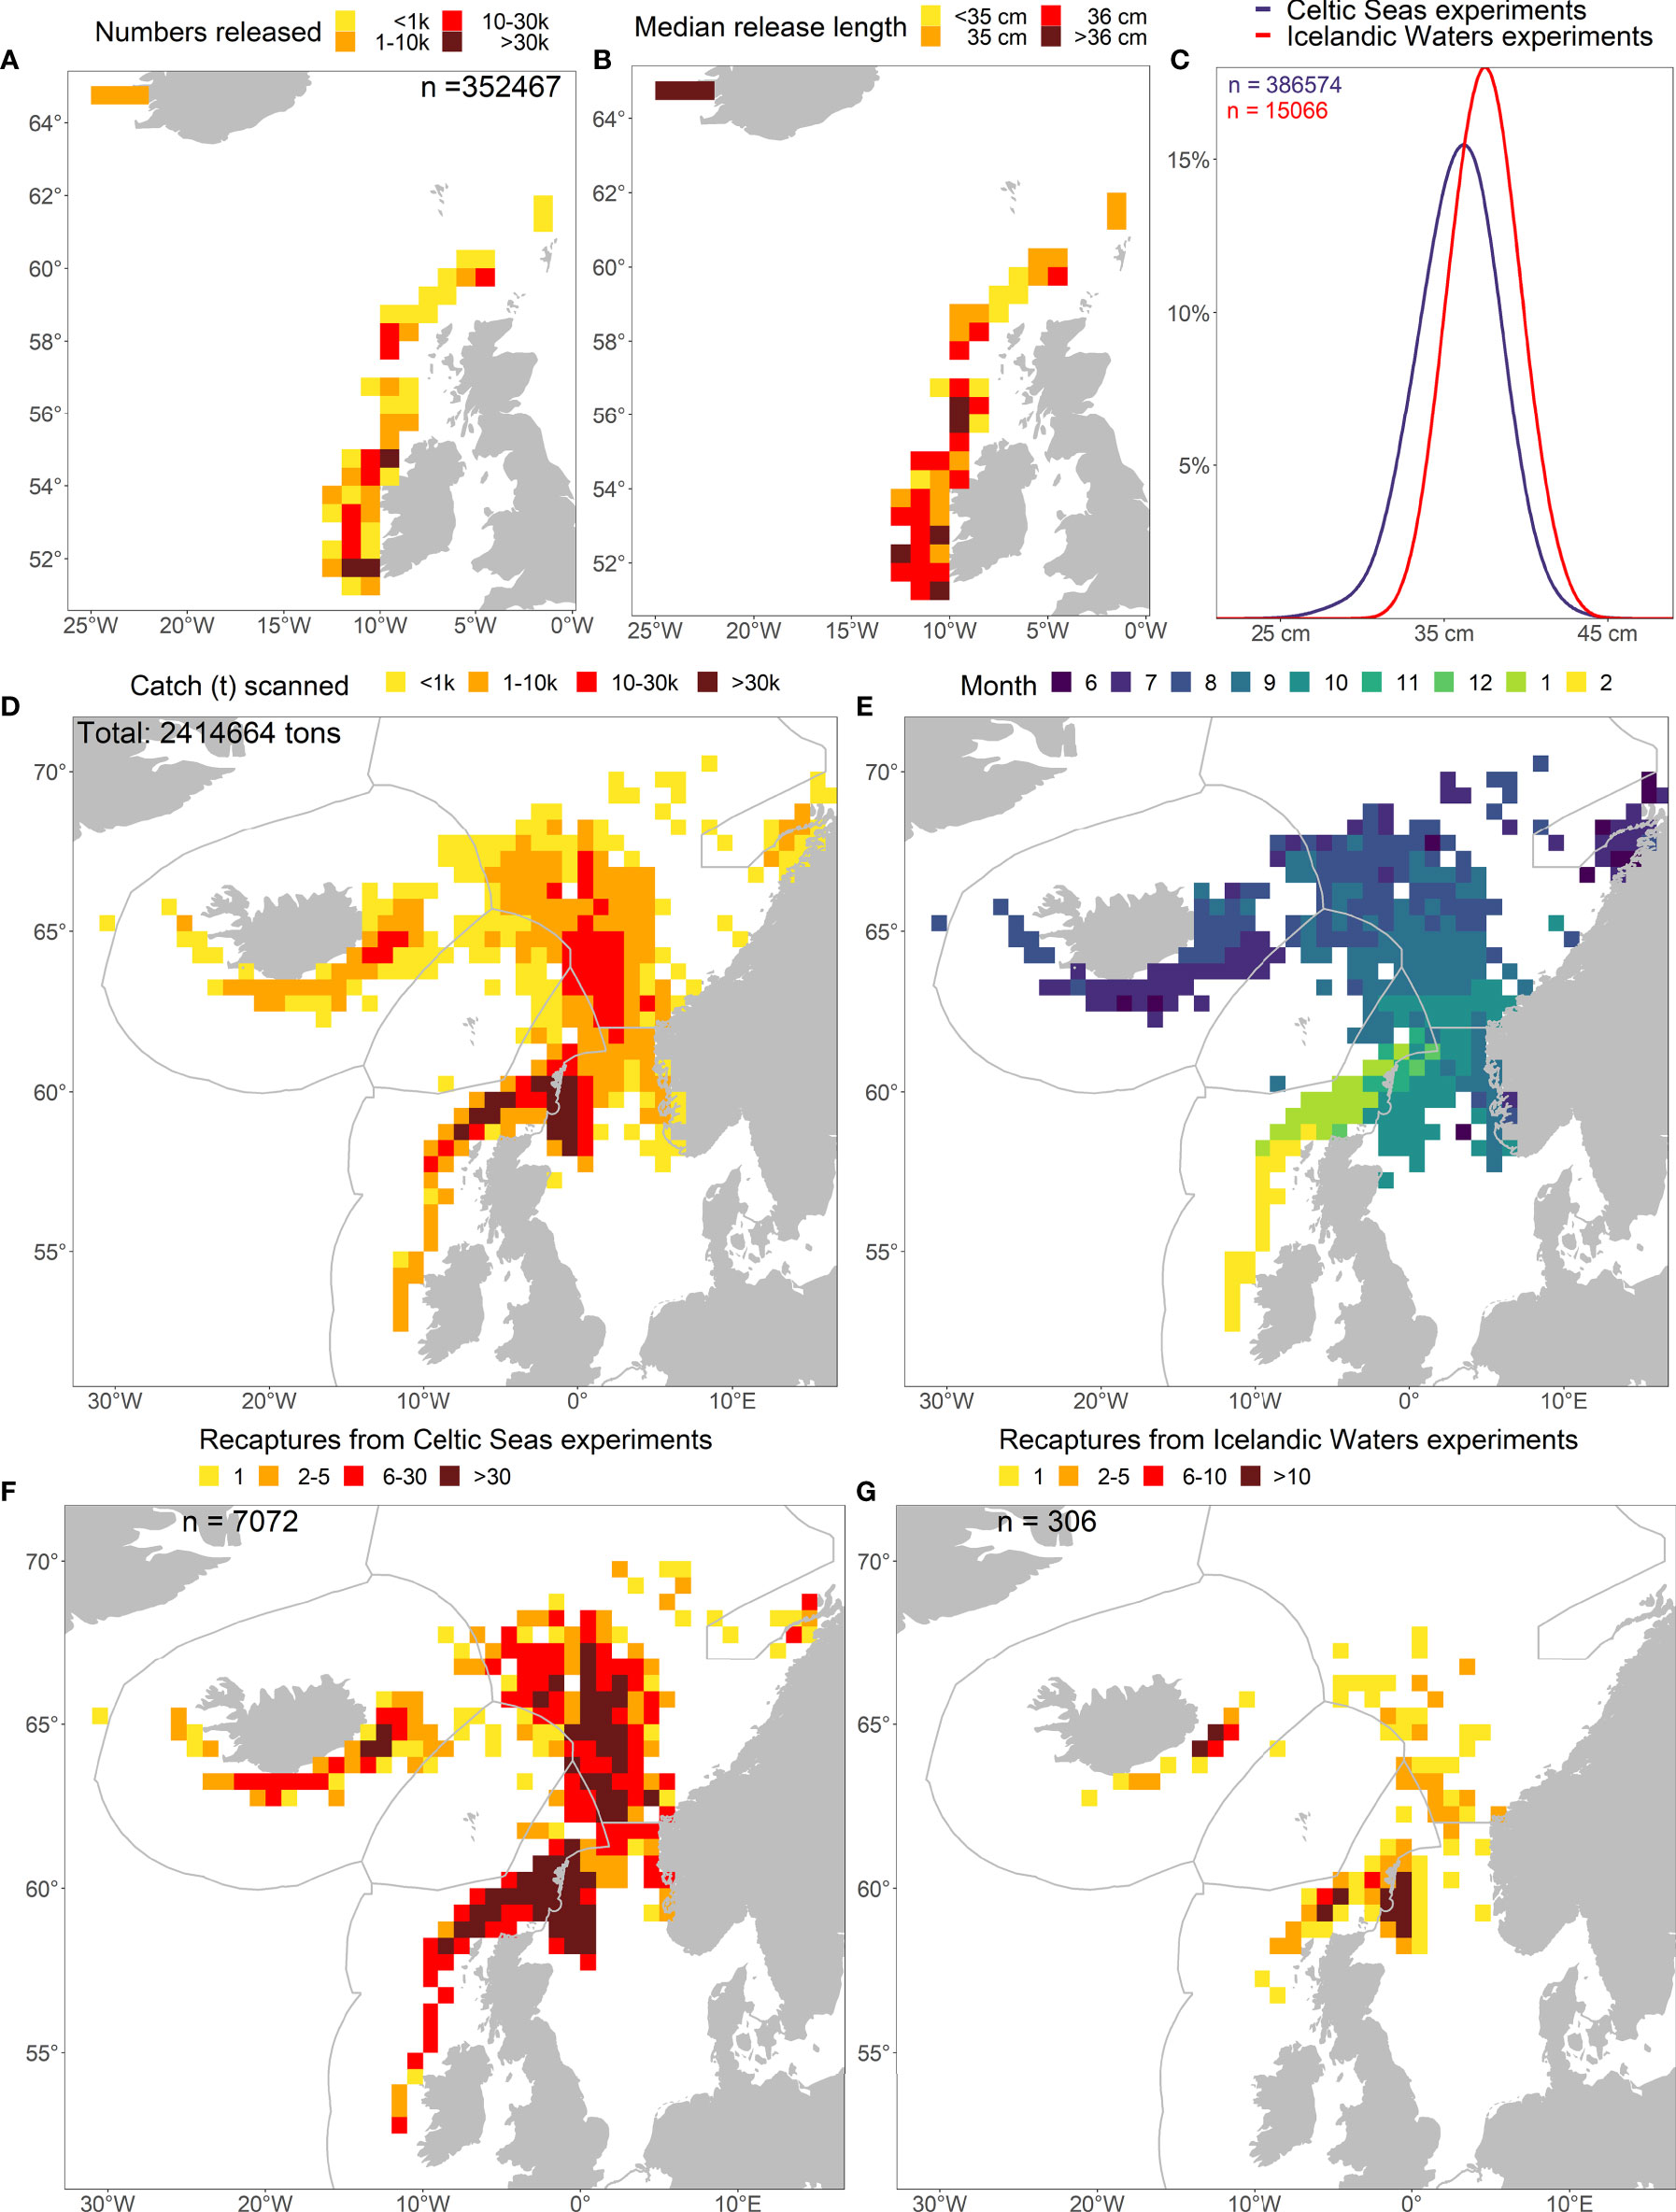
Figure 3 Spatial distribution of (A) numbers of PIT-tagged mackerel in Celtic Waters (May-June 2014-2021) and Icelandic Waters (August 2014-2019) and the concurrent (B) median body length at release. (C) shows the relative length distribution between the Celtic Seas and Icelandic Waters experiments and (D) the associated distribution of commercial catch scanned for PIT-tags, (E) recapture month, and (F, G) numbers recaptured from the Celtic Seas and Icelandic Waters experiments. The data follows the natural progression of the fishery and the annual migration from feeding in July until spawning migration in February next year.
The PIT-tagged mackerel varied in body lengths between 22-49 cm and were much larger in the Icelandic Waters tagging area than in the Celtic Seas (Figures 3B, C). Size distribution also appeared remarkably similar between years in the Celtic Seas, with the exception of 2017 with smaller fish and 2020 with bimodal distribution with peaks at 33 cm and 37 cm (Figure S1). The tagged fish showed a broader size distribution and remained overall smaller in the Celtic Seas experiment than in the Icelandic Waters experiment in all years between 2014-2019 (Figure S1).
In general, mackerel size distribution at different latitudes seemed to be quite random. In a couple of years, released fish appeared a bit smaller in the north than south (2014, 2016) and another year the opposite (2017). However, the 2020 release from the north had more small fish in general.
Progression of the fishery scanned for tags
Over the study period 2014-2021, close to 2.5 million tonnes of mackerel were scanned for tags. In terms of densities, the wintering period in the Greater North Sea and spawning migration into Celtic Seas typically showed the largest concentrations of landings within ICES rectangles (Figure 3D). The space-time dynamics in the fishery driving the recaptures followed the typical seasonal migration pattern of the mackerel stock between the different ICES ecoregions i.e. shortly after the tagging period in the Celtic Seas (May-June), the fishery started in Icelandic Waters in June-July, moving eastwards into the Norwegian Sea during August-September, before entering the wintering areas in the Greater North Sea in October-December and ending in January-February during the return spawning migration to the Celtic Seas (Figure 3E). This observed catch pattern in terms of densities and timing was also very similar for all years, with a small change in 2020-2021 where the fishery started already in July in the Norwegian Sea (Figure S1).
Space-time dynamics in recaptures
Similar recapture patterns were observed from the Celtic Seas experiments (Figure 4A) and the Icelandic Waters experiments (Figure 4B) when aggregating data over all release years. Naturally, the density of recaptures followed the progression and intensity of the fishery throughout the ecoregions, with a similar pattern repeating over the three migration cycles.
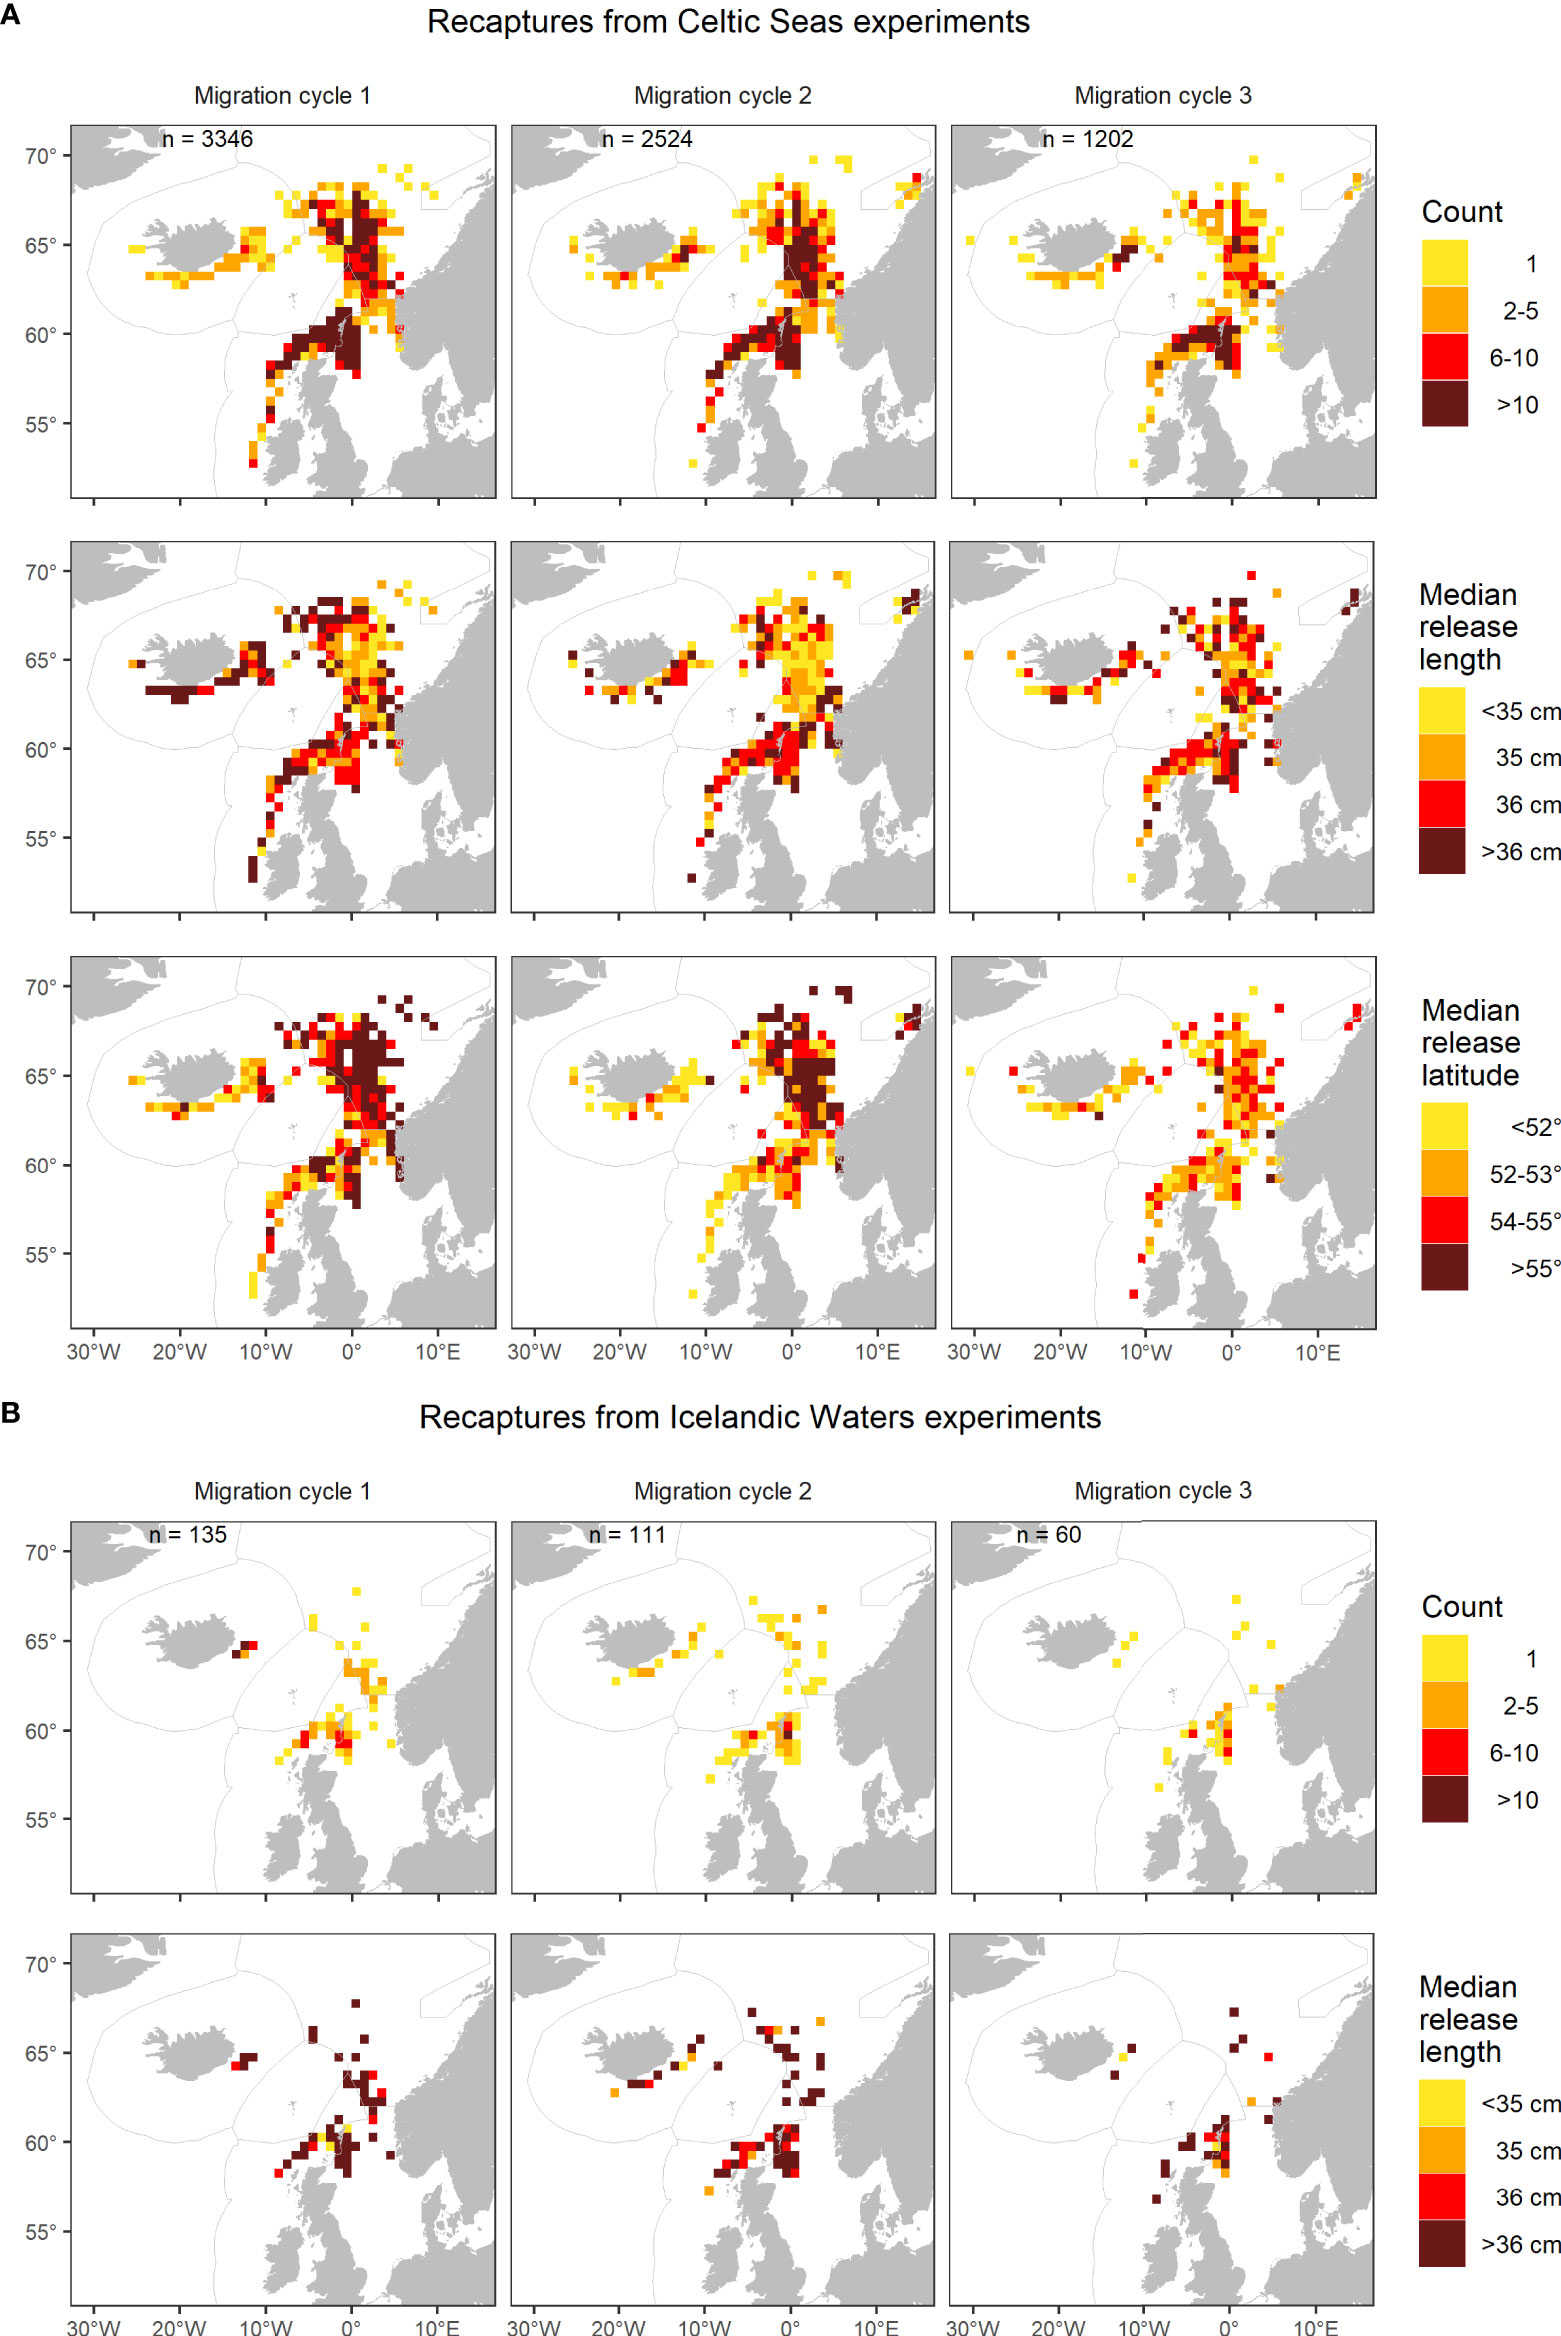
Figure 4 (A) Spatial distribution in the number of recaptured mackerel from the Celtic Seas experiments across 2014-2021, as well as their median release length and latitude for migration cycles 1-3. This is contrasted with (B) the Icelandic Waters experiments across 2014-2019 with information on recapture count and median release length. A migration cycle follows the natural progression of the fishery and the annual migration from feeding in July until spawning migration in February next year (see Figure 3).
However, distinct spatial changes in recapture patterns with time at liberty were observed for median body length at release, especially from the Celtic Seas experiments (Figure 4A). During migration cycle 1, the largest fish tagged in Celtic Seas were more commonly found during the feeding period in Icelandic Waters and Norwegian Sea, and during the return spawning migration into Celtic Seas, than in the wintering area in Greater North Sea. However, this tendency tended to disappear over migration cycles 2-3. A similar tendency with time at liberty was observed in the Icelandic Waters experiments, only less distinct, which is likely linked to the smaller data set and larger size at release.
The spatial recapture patterns related to median release latitude in Celtic Seas also changed considerably with time at liberty (Figure 4A). During migration cycle 1, fish released in the northernmost part (>55°N) of the tagging area clearly concentrated in the Norwegian Sea during feeding season or in the wintering area in the Greater North Sea. On the other hand, fish released farther south in the tagging area were more concentrated in Icelandic Waters during feeding season and in the Celtic Seas during the spawning migration. These patterns slowly change during migration cycle 2-3, and by cycle 3, fish released north of 55°N only dominated a few ICES rectangles. On the other hand, fish recaptured in Icelandic Waters or the Celtic Seas in cycle 2 were still released farther south (<54°N) than those recaptured in the Norwegian Sea and Greater North Sea. The above pattern disappeared for migration cycle 3.
Moreover, there was a lot of interannual variability in the recapture pattern from the Celtic Seas experiments (Figure S2). For example, 2017 stood out during migration cycle 1 as recaptures in the Norwegian Sea were dominated by fish from northern releases (Figure S2D). Similarly, fish recaptured in Greater North Sea in 2017 were relatively small compared to other years (Figure S2C). Moreover, the recapture patterns in 2021 changed considerably with more landings in late summer and autumn from the Norwegian Sea as Norway was no longer able to fish within the UK EEZ.
In the Icelandic Waters experiments, the annual space-time recapture patterns were generally less clear due to lower numbers of recaptures (Figure S3). However, the migration route from Iceland followed the same pattern on annual basis with fish moving east into the Norwegian Sea in late summer and autumn, back to Greater North Sea in late autumn and further down to the Celtic Seas in January-February. Here, 2016 stood out as the only year where a high proportion of mackerel was already recaptured during migration cycle 1 in Icelandic Waters (Figure S3A) i.e. the same month (August) as the fish release (Figure S1). Additionally, a significant proportion of the 2016 release also returned to Icelandic Waters to feed during migration cycle 2. It is also to be noted that for all fish released in Icelandic Waters, there were always some that returned back within the two subsequent migration cycles.
Finally, the North Sea experiment in 2011 on 1-year old mackerel (2010 year-class) showed the same distributional pattern as for the Celtic or Icelandic Waters experiments (on the adult fish) when aggregated over 2012-2021 (Figure 5A). However, we noted a westwards and southwards expansion in the recapture positions as they grew older (Figure S4). The median age at recapture during the feeding migration in Icelandic Waters and early spawning migration to the Celtic Seas were typically around 5-8. This was contrasted with younger age groups (2-4) that were commonly found in the Norwegian Sea and Greater North Sea (Figure 5B).
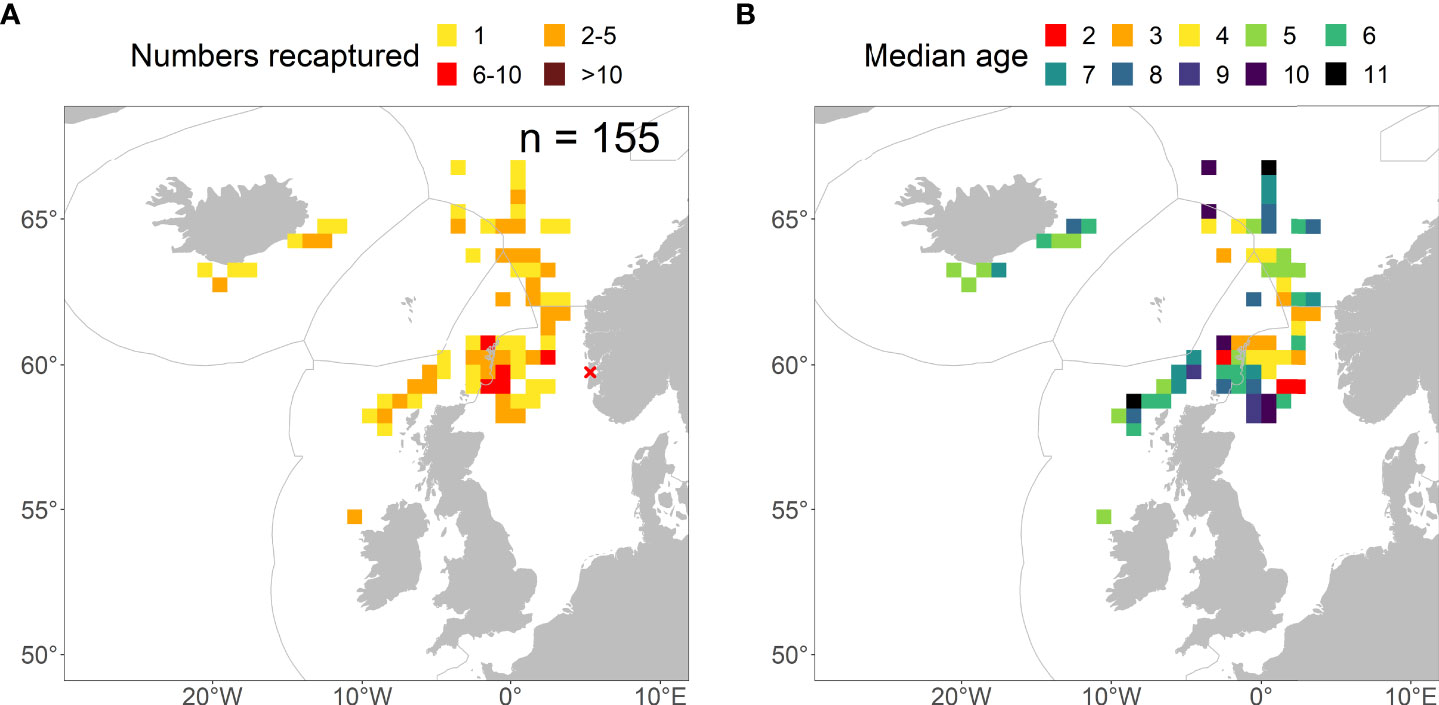
Figure 5 (A) Spatial distribution of recaptures aggregated over 2012-2021 from the PIT-tagging experiment on 1-year old mackerel (27013 individuals between 24-27 cm) released from the Norwegian Coast (red cross) in September 2011. (B) Spatial distribution of the median age at recapture within ICES rectangles over the same scanning period. Note that if median age was in half unit, it was rounded downwards to whole age.
Model predictions of recapture probabilities
The GAM-modelling exercise was able to retrace the seasonal dynamics of the fishery starting in Iceland, then moving towards Norwegian Sea, Greater North Sea, before ending in the Celtic Seas, i.e. the timing was the main factor influencing probability of recapture within a region (Figure 6). However, the exercise also demonstrated that recapture probabilities within ecoregions were influenced by the additional factors such as release size, latitude, and year across the migration cycles.
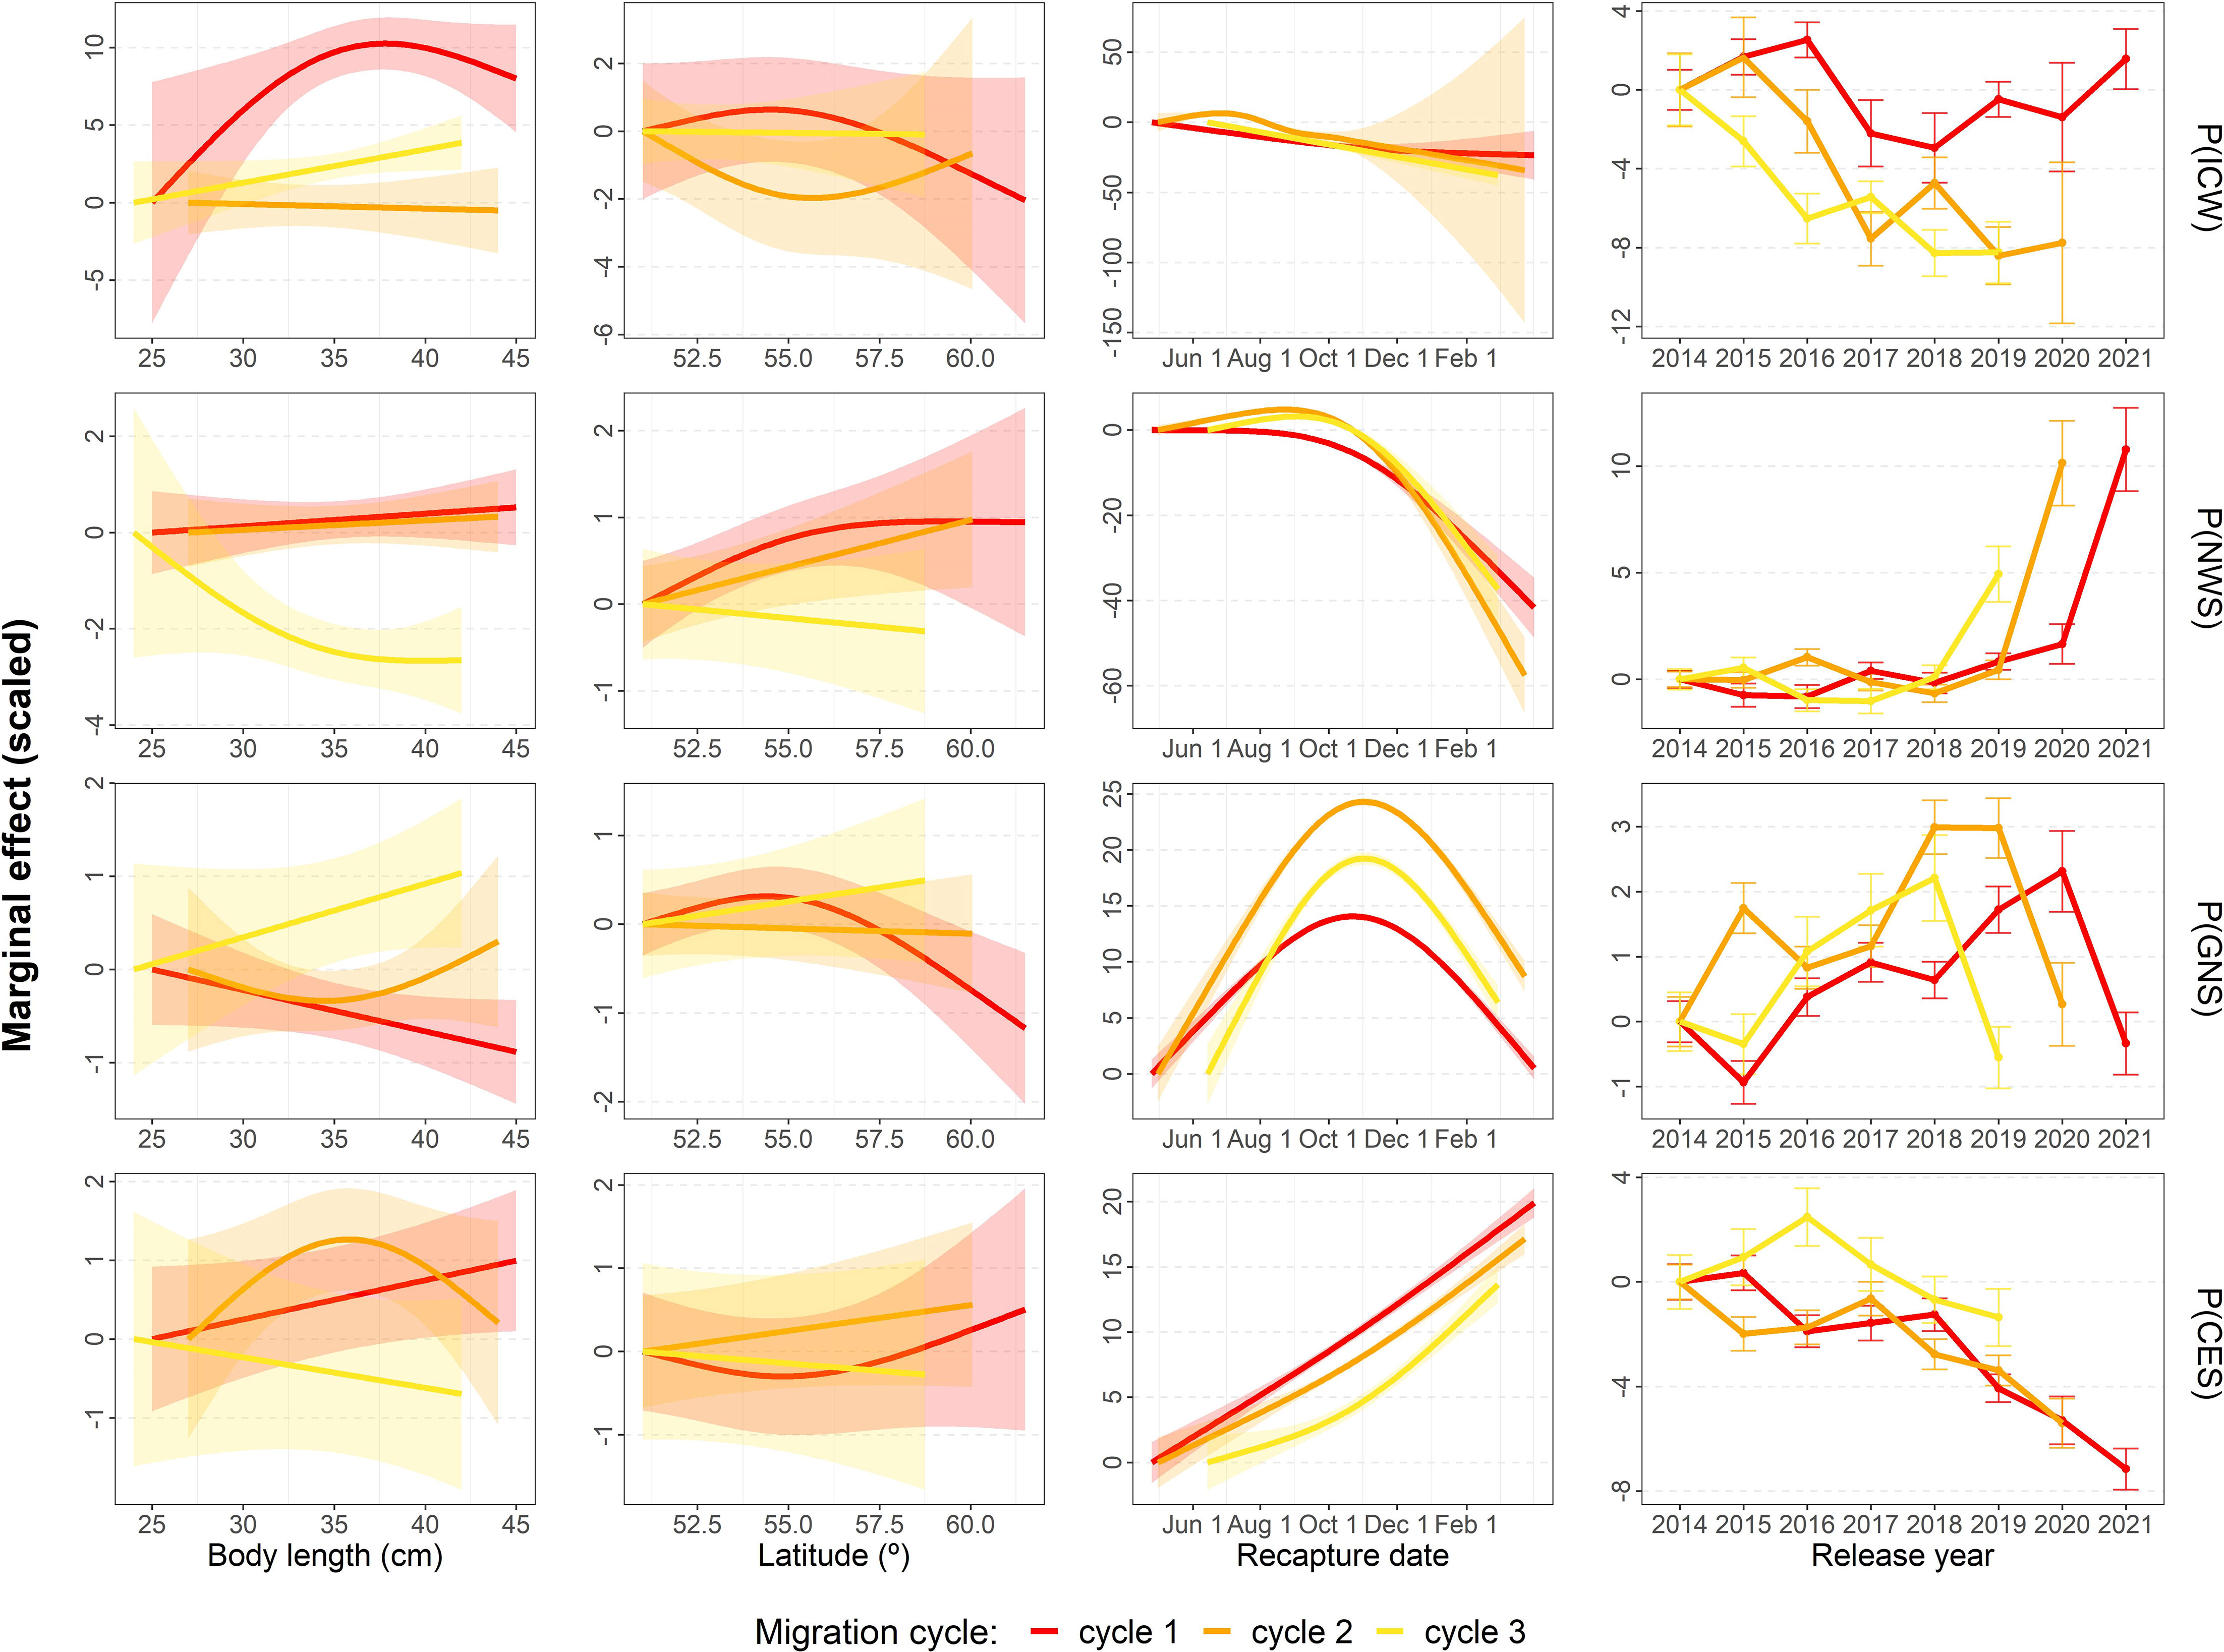
Figure 6 Marginal effects (link scale) of mackerel body size at release, release latitude, recapture date, and release year, by migration cycle on the predicted probability of being recaptured, for each ICES ecoregion i.e. Icelandic Waters (ICW), Norwegian Sea (NWS), Greater North Sea (GNS), and Celtic Seas (CES). The marginal effects show how the variable on the x-axis changes the log-odds probability of recapturing a mackerel compared to an “average” fish (defined as measuring 35cm, released from latitude 52.5°, in 2017, and recaptured at the mean recapture date for the specific ecoregion and migration cycle). A higher value therefore means a higher probability of recapture. For ease of visual representations, all marginal effect plots were scaled to start at 0.
During the first migration cycle after tagging (Figure 6– red lines), the probability of recaptures in Icelandic Waters, the Celtic Seas and Norwegian Sea increased with size at release, whereas it decreased in the Greater North Sea. On the other hand, tagging farther to the north increased the probability of recaptures in the Norwegian Sea and the Celtic Seas, whereas they decreased for Icelandic Waters and the Greater North Sea. It is however to be noted that there was a marked change in recapture patterns in 2021 linked to Norwegian fishermen shifting their fishing effort from Greater North Sea to Norwegian Sea. Thus, when removing the 2021 data from the analysis, the latitude effect in the Celtic Seas for migration cycle 1 shifted from positive to negative but all other results stayed qualitatively the same (Figure S5). The effects of release size and latitude also tended to fade out over migration cycles and, to some degree, changed directions as the cycles progressed. For example, while the positive effect of release size was relatively maintained in Icelandic waters, the positive effect of release latitude disappeared with migration cycles. In the Norwegian Sea, the positive effects of both release size and latitude during the first migration cycle slowly faded out (cycle 2) and even shifted over to negative effects during migration cycle 3. In the Greater North Sea, both the negative effects of release size and latitude slowly reversed to being positive over the migration cycles. Finally, in the Celtic Seas, the effect of size and release latitude changed from positive to negative over the cycles.
Moreover, the probability of recapture increased over the study period in the Norwegian Sea and Greater North Sea (except the last year), whereas it decreased in the Celtic Sea, a result that was stable over migration cycles 1-3. Note, however, that in 2021 there was a sudden increase in recapture probabilities in Norwegian Sea, and concurrent drop in the Greater North Sea. In the Icelandic waters, recapture probabilities during the first migration cycle decreased until 2018 with a subsequent increase 2019-2021, while it slowly declined over the study period for migration cycles 2-3.
Potential migration speeds over annual cycles between spawning-feeding-wintering areas
Migration speeds between the two potential routes (1 and 2) towards Icelandic Waters were very different (Figure 7). The direct feeding migration route from southern Ireland to southern Iceland (route 1, Figure 7) required a median movement rate of ~0.6 body lengths per second, whereas the alternative route through the Faroe-Shetland channel into the Norwegian Sea demanded twice the movement rate with ~1.1 body lengths per second (route 2, Figure 7).
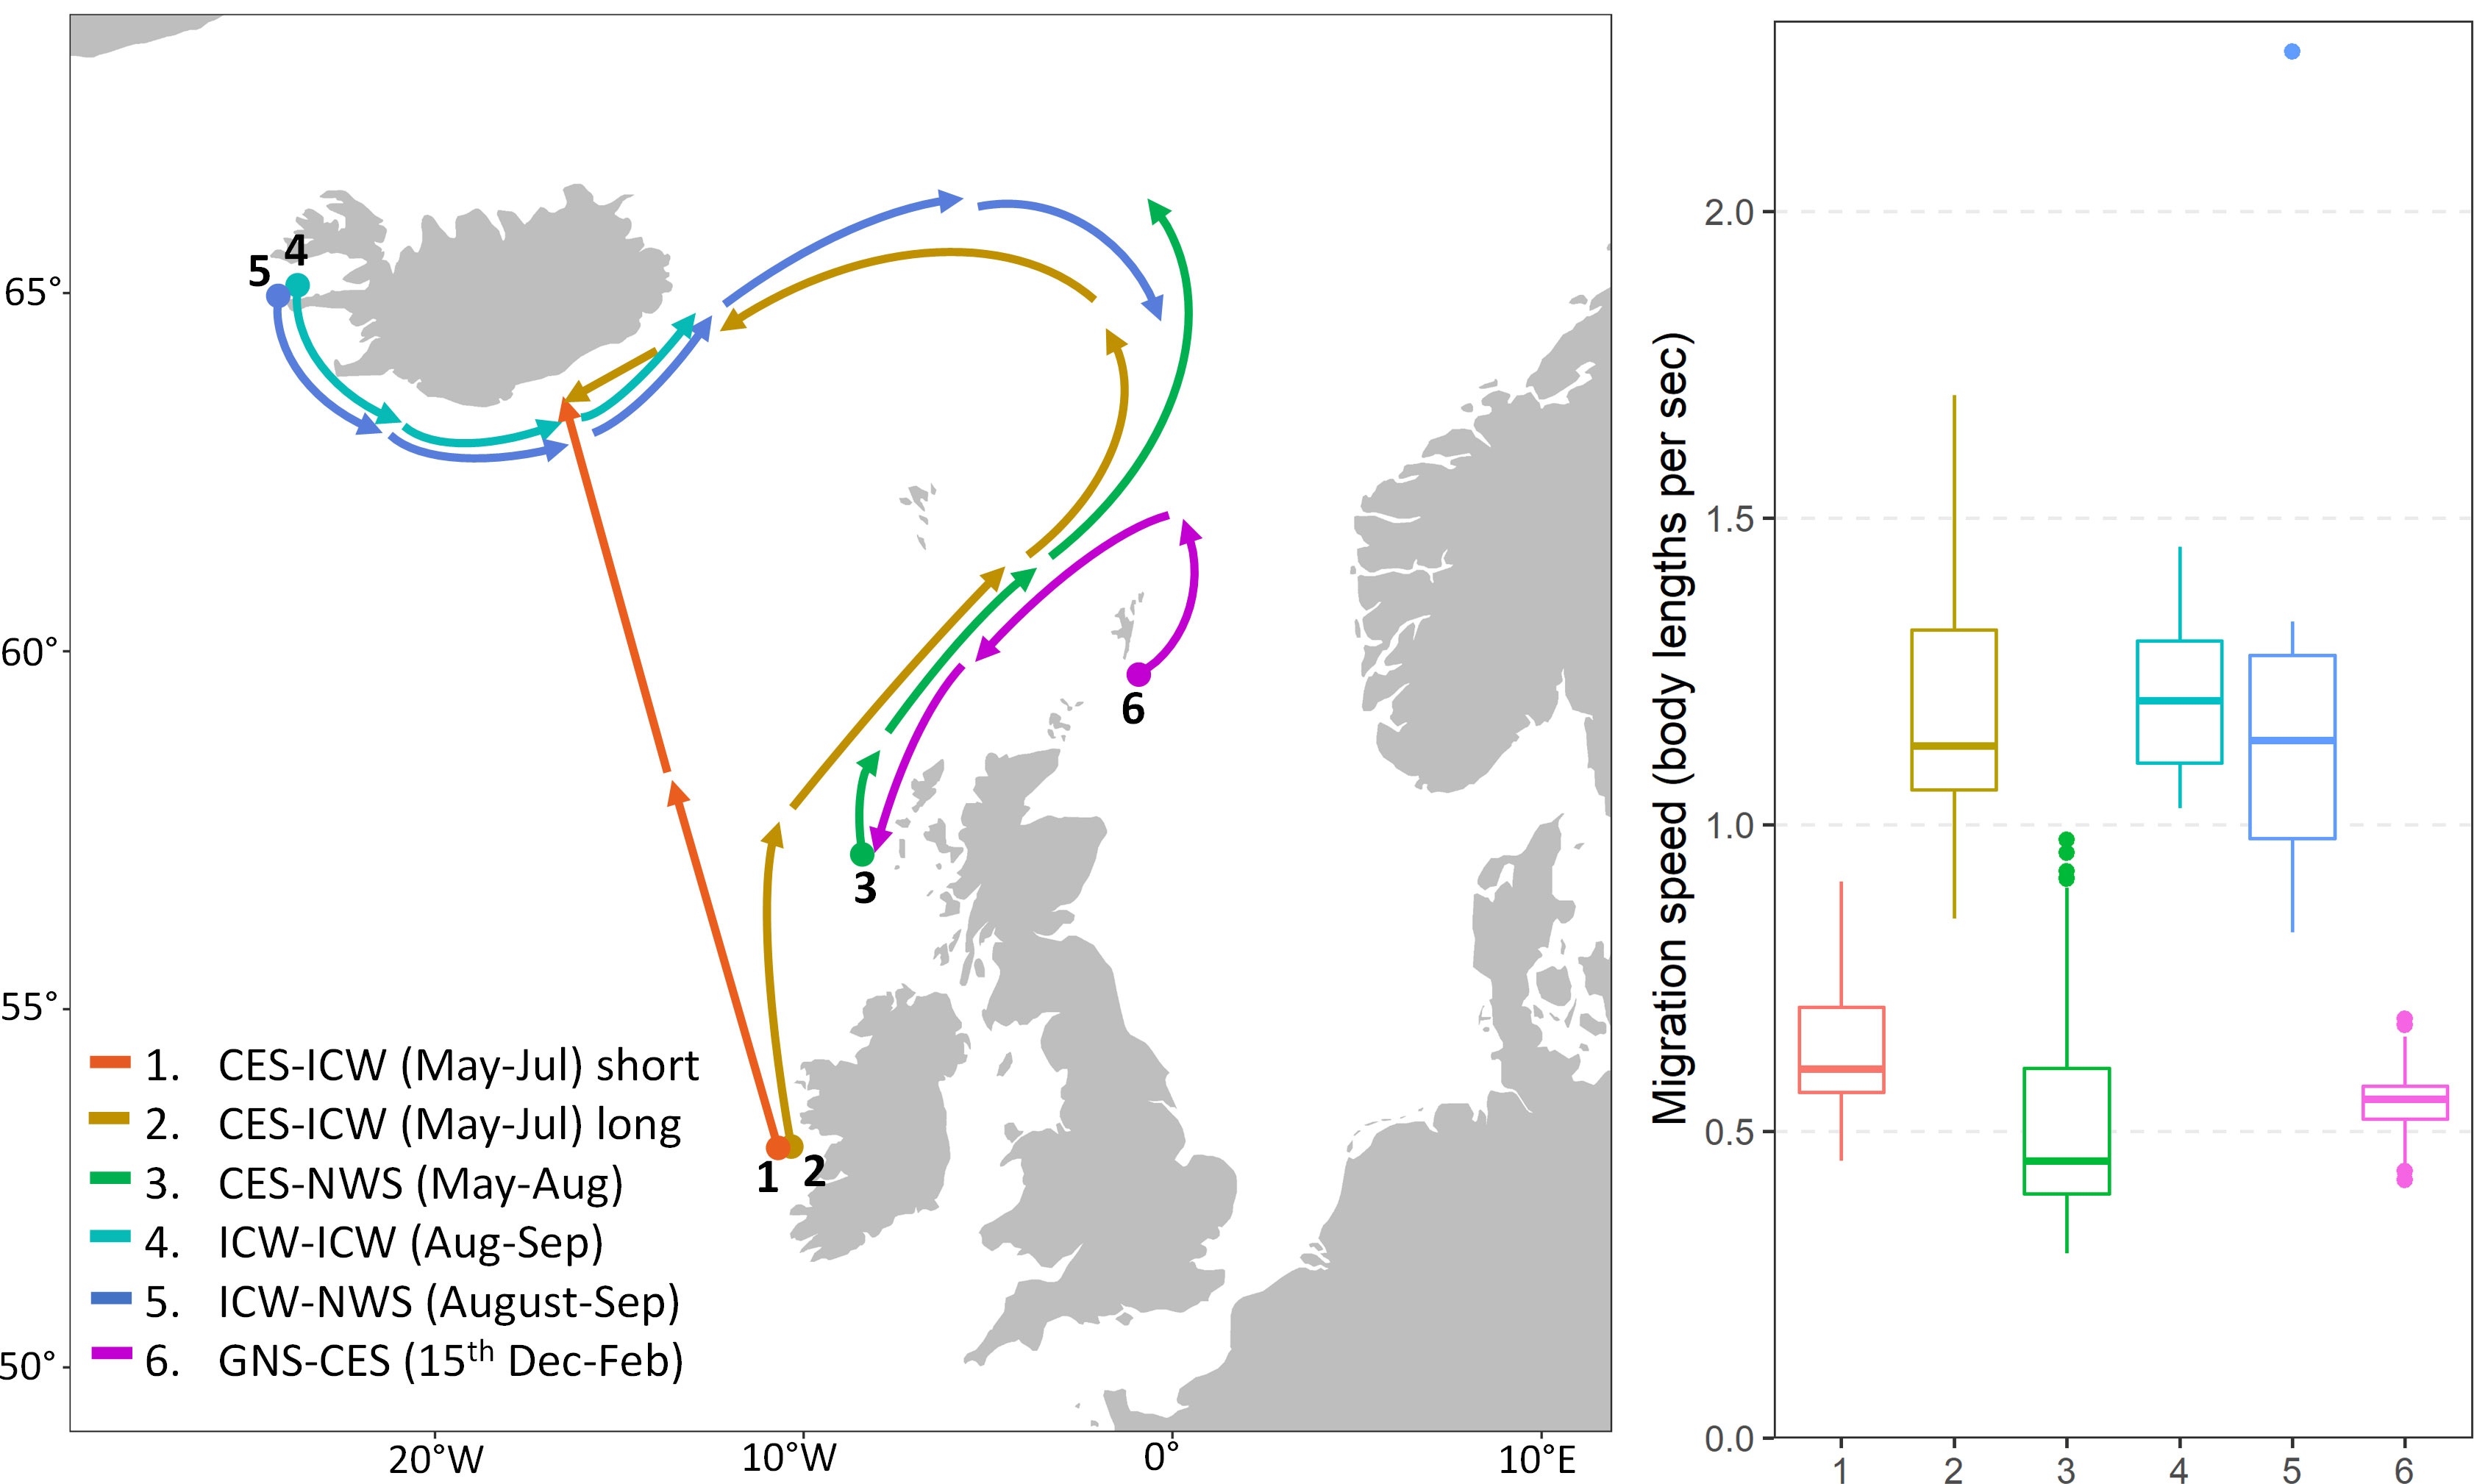
Figure 7 Estimated movement rate (body lengths/s) of tagged mackerel for each assumed routes and periods. Routes 1-5 are based on the centre of gravity of the individuals released then recaptured at the specified area and period during migration cycle 1. While the distance for each route is fixed, duration is calculated based on individual tag-recapture information. Route 6, on the other hand, includes recaptures from all experiments and migration cycles 1-3. The migration route is calculated between the centre of gravity of the recaptures in October-November and February, but the start of the spawning migration is assumed be on 15th December for all individuals.
In comparison, the expected movement rate of a fish traveling between northern Ireland to the Norwegian Sea in search of prey through the Faroe-Shetland channel (route 3, Figure 7), was around 0.4 body lengths per second, which was comparable to the estimate from the direct feeding migration route to Iceland.
The median estimated movement rate of returning mackerel (from feeding grounds west of Iceland – route 4 and 5, Figure 7) were around 1.1-1.2 body lengths per seconds, which were approximately double the rate of the ones in feeding migration from spawning grounds (route 1 and 3, Figure 7). These individuals (route 4 and 5, Figure 7) correspond to fish at the end of the feeding season with more directional migration towards wintering grounds.
Finally, the estimated median movement rate for route 6 i.e. fish that have finished their feeding migration and now heading southwards for spawning grounds – was more comparable to the feeding movement rate, between 0.5-0.6 body lengths per second.
Discussion
In the present study we took advantage of the extensive PIT-tag data on the Northeast Atlantic mackerel to deepen our knowledge on the complex migration patterns that is exhibited by the NEA mackerel. What we found was that:
Migration patterns changed with growth and age with larger individuals traveling farther distances
We observed a clear effect of size at tagging on recapture probabilities in different regions. The largest fish was more likely to be recaptured feeding at distances far away (Icelandic Waters and Norwegian Sea) from the release sites in the Celtic Seas, than in the wintering area close to release sites (Greater North Sea). This would indeed fit a scenario where the largest fish migrate faster and farther to feed under a high-density situation with competition for food (Nøttestad et al., 1999). The International Ecosystem Survey (IESSNS) – which conducts an annual swept area survey on mackerel over its entire summer feeding distribution – also reported that abundance of bigger fish was typically increasing towards north and west (ICES, 2021) supporting the results from the PIT-tagging experiments in the Celtic Seas. These survey observations also provide evidence that mackerel migrated farther north and west from the fishery scanned for tags (Figure 2), which implies that migration distance in northern and western directions estimated from the tagging studies are likely underestimated (actual distances are greater). Similarly, the 2011 experiment on 1-year olds in the North Sea showed that mackerel migrated further as they grow older between wintering, feeding and spawning grounds: not many young fish were observed in Icelandic Waters and/or Celtic Seas, but started appearing when they reached age 5-8. Such observations are in line with the modelling results where the effect of body length on the recapture probability in the Norwegian Sea gradually turned from positive to negative over the migration cycles. During the first migration cycle, only the biggest fish migrated into the fishing area in the Norwegian Sea. However, two years later, all tagged fish not yet recaptured had grown and extended their feeding migration. This probably developed over time to a degree that the smallest fish tagged finally entered the Norwegian Sea area during their third migration cycle, whereas the largest fish migrated even farther to the north, outside the fishing area, towards Spitsbergen as observed in the IESSNS surveys (Figure 1, Nikolioudakis et al., 2019; Olafsdottir et al., 2019; ICES, 2020).
Similarly, the spawning distribution may extend much farther south than the Celtic Seas tagging area to Bay of Biscay and Iberian Coast (Brunel et al., 2018). Mackerel tagged in the Celtic Seas spawning area is a mixture of maturing, spawning, and spent animals. Since mackerel are indeterminate batch spawners (dos Santos Schmidt et al., 2021; Jansen et al., 2021), some could have migrated from a southern spawning ground when they were caught in the Celtic Seas. This was also supported by the modelling results where we found that the ones arriving first to Celtic Seas are likely the bigger fish [which is also confirmed by the data (Figure S4C)]. However, as individuals grow older and bigger, they develop a higher migration potential, and the biggest mackerel might have already migrated farther south than where the fishery operates. This would explain why the effect of body length reversed over the migration cycle as the largest fish would be less and less available to the factory to be recaptured.
Larger mackerel had a delayed arrival in the wintering area
Recapture data indicated that larger mackerel had a lower probability of recapture in the wintering area off Shetland (during the main fishing season in the area during October-November). The smallest fish, feeding in the more south-easterly part of Norwegian Sea closer to the wintering area – as demonstrated by the IESSNS survey (ICES, 2021) – would naturally arrive earlier at the wintering grounds and thus have a higher chance of being recaptured by the fishery. The largest fish that extended their feeding migrations into the north and west would arrive later and have a lower chance of recapture by the fishery. Similar observations have also been made for the NSS herring stock feeding westwards in the Norwegian Sea into Icelandic Waters and returning to winter in the open ocean or coastal northern Norwegian Waters (Homrum et al., 2022).
Larger mackerel stayed in the front during southward spawning migration
Contrary to the wintering situation off Shetland, larger mackerel were more likely to be recaptured in the Celtic Seas during early spawning migration in January-February than smaller ones. This observation supports the hypothesis that the timing of spawning migration and the likely final distance to spawning grounds may be size dependent as is the case for the Norwegian spring spawning herring (Slotte, 1999; Slotte and Fiksen, 2000).
There are a couple of important underlying assumptions to this hypothesis. Firstly, individuals may carry out repeat spawning at their natal ground, but there is no adaptation towards such behaviour. This implies that they may grow up very widespread at various nurseries from south to north (Jansen et al., 2015) – which is natural according to the spawning distribution of the adult mackerel (Brunel et al., 2018) – with a tendency to spawn nearby their nursery area as first/second-time spawners. However, as they get older, they will increasingly mix with older repeat spawners and, through social learning (Huse et al., 2002; Huse et al., 2010), end up taking the same route northwards to areas in the Norwegian Sea and adjacent waters with higher growth potential (Olafsdottir et al., 2016). This will in turn lead them into the main wintering area east of Shetland before they embark their southward spawning migrations (Jansen et al., 2012). Such patterns also fit with the knowledge gained from tagging experiments on mackerel in 1994 off the coast of Spain on large spawners, where most of the recaptures came from the fishery in the wintering area east of Shetland or during early spawning migration west of British Isles and Ireland (Uriarte and Lucio, 2001).
Feeding migration patterns were linked to the release locations on a latitudinal scale
The GAM models showed that fish tagged farther to the south were more likely recaptured in Icelandic waters and Greater North Sea over the first migration cycle, whereas fish tagged farther north were more likely recaptured in the Norwegian Sea and Celtic Seas during the first migration cycle. This also fitted well with the detailed dynamics observed from median release latitude within ICES rectangles, except maybe for the link between tagging at lower latitudes and higher recapture probabilities in the Greater North Sea. However, this exception appeared to be sensitive to the northward shift in tagging sites in 2020-2021 (time with covid 19 restrictions) as well as the sudden shift in Norwegian fishery in 2021 from Greater North Sea wintering area to Norwegian Sea feeding area after being disallowed from fishing within UK EEZ
The fact that fish tagged farther south is more likely to go to Iceland was evident both in the model and the mapping of median release latitude. These mackerel released from the south may have encountered different oceanographic conditions than their counterparts released from the north leading them to take a direct route from Ireland to the Icelandic Waters crossing to the south of Faroes. Indeed in the south, mackerel are more likely influenced by the north-westward current toward Iceland with local eddies (Hátún et al., 2005; Larsen et al., 2012). This contrasts with the more common northwards route into the Norwegian Sea through the Faroe-Shetland channel. Additionally, surface ocean currents seem to split around the northern end of Rockall Through between a route towards Faroe-Shetland Channel and a route towards Iceland, following the two main pathways of Atlantic current in this area (Figure 1). Observations from Brunel et al. (2018) and ICES (2019) on egg distribution over large areas between Ireland and Iceland (Figure 1) also support the idea that a proportion of the mackerel spawning off Ireland and further south may take a route directly from Ireland to Iceland, not only entering through the Faroese-Shetland channel as previously presumed (Iversen, 2002).
On the other hand, individuals tagged in the northern region are more likely to encounter strong coastal currents that may guide them towards the more common north-eastward migration route through the Faroes-Shetland channel, perhaps also limiting their potential westwards movement, as suggested by the increasing effect of latitude on mackerel recapture in the Norwegian Sea both from the GAM model and the median latitude mapping within ICES rectangles.
Prey availability is another crucial factor affecting the choice of migration path of post-spawning mackerel, especially during periods of reduced growth and condition of the stock. Mackerel tends to migrate in north-westerly directions towards more productive waters in Norwegian Sea, Icelandic Waters and Greenland Sea where they have been observed to feed heavily during summer (Langøy et al., 2012; Bachiller et al., 2016; Óskarsson et al., 2016), but the feeding conditions until they reach these areas are not well known. The spring bloom is tightly linked to zooplankton availability and tend to start earlier at lower latitudes and progress northwards towards summer (Friedland et al., 2016) in the same direction as the mackerel feeding migration. Spawning and post-spawning mackerel have to migrate through oceanographic conditions influenced by the subpolar gyre which influences the phytoplankton blooms and zooplankton availability (Hátún et al., 2016; Hátún et al., 2017). Relatedly, the distribution of blue whiting was found to be in tight connection with the subpolar gyre and prey availability, where the blue whiting fishery was distributed more north-westwards of Ireland in periods with low gyre (Hátún et al., 2009). It has also been suggested that the poleward expansion of mackerel is nutrient driven, with an indication of a probable direct migration route from Ireland to Iceland based on silicate concentrations (Pacariz et al., 2016). Phytoplankton blooming data from satellite remote sensing has recently been used as one of the main drivers to predict mackerel migrations from spawning grounds to feeding areas. This was also able to predict mackerel distribution south of Faroes between Ireland and Iceland (Boyd et al., 2020), but failed to predict observed migration even farther west to Icelandic Waters and Greenland Sea as observed in the egg surveys in recent years (Brunel et al., 2018; ICES, 2019). Hence, mackerel spawning off Ireland or even farther south could in fact increase the probability of taking a direct route to Iceland following higher prey densities. Moreover, they could potentially combine feeding with the releases of last batches of eggs during their way towards Iceland, which could also explain why egg densities are low in this extended spawning area westwards compared with areas closer to the shelf (Brunel et al., 2018; ICES, 2019).
Finally, a likely explanation for the link between tagging farther north and higher recaptures during return spawning migration (to the Celtic Seas) could be their tendency of repeated adopted migration patterns i.e. mackerel having reached large sizes with increased migration potential would tend to maintain early onset of and longer spawning migrations southwards if favourable for larval survival and lifetime fitness (Slotte and Fiksen, 2000) (Figure 2).
Examination of movement rate suggested that mackerel may have taken advantage of the direct route to Iceland
If mackerel took the direct route between Ireland and Icelandic Waters, it would imply a median movement rate of 0.6 body lengths per second by the time they were caught in July. If they took the longer, more traditional route instead, they would rather be at 1.1 body lengths per second. When compared to the mackerel released in Celtic Seas and recaptured in in Norwegian Sea in August, the later moved at a rate of around 0.4 body lengths per second. In both cases, these mackerel were most likely in low-condition after spawning and were searching for prey. Tank experiments have suggested that mackerel have a long term endurance speed of around 1 body length per second (He and Wardle, 1988). However, field tracking experiment using sonar also showed that feeding and searching behaviour to locate prey also limits swimming speed (Nøttestad et al., 2016b). Furthermore, the movement rate calculated in this study (though simplistic as we do not know the exact swimming path) takes into account the effect of current speed (which could both increase or decrease their actual swimming speed but we do not have answers to that). All in all, we therefore argue that the movement rate of 1.1 body lengths per second is not realistic for these mackerel searching for prey and that the direct route to Iceland is probably more likely.
As for the movement rate of mackerel moving from west to east of Iceland towards central Norwegian Sea in August-September, we estimated at around 1.1-1.2 body lengths per second. Here, mackerel were most likely at the end of their feeding season and heading back to their wintering grounds. In such a case, migration would be more directional and closer to endurance speed of the species as prey densities are declining, and less time is used for feeding.
Finally, during early spawning migration (Jan-March), one can expect mackerel to have a more directional migration, swimming close to endurance speed, as feeding is close to absent (Jansen et al., 2021). However, we estimated a lower rate of 0.5-0.6 body lengths per second which were more comparable to the early feeding migration from spawning grounds. This result is in accordance with Walsh et al. (1995) who estimated a migration rate southward from Scotland to be 13.0 cm s-1, 17.8 cm s-1 and 25.9 cm s-1 for the months of December, January, and February, respectively. This translates to 0.37-0.74 body lengths per second for a 35cm mackerel, which is very similar to our results. It is also to be noted that the migration rate of Walsh et al. (1995) also includes the influence of current as in our study case.
Multiple factors contributed together to the observed changes in recapture patterns over the study period
In addition to the aforementioned environmental effects (e.g. currents, prey field), several other factors could have potentially contributed to the significant changes in mackerel movement directionality observed between 2014-2021. For example, migration pattern could change abruptly after large new recruitment events due to short term establishment of migration pattern: the hypothesis of numerical dominance (Huse et al., 2002; Huse et al., 2010). Additionally, the decreasing migration towards Iceland corresponded to a period with extensive exploitation of the adult fish (ICES, 2021). Hence, the abruptly reduced migration to Icelandic Waters and farther west could also simply be a result of fishing, where a component with this adopted feeding migration over time was fished down/out to a degree that younger fish with other adopted migration routes took the lead as observed for the NSS herring. In fact, mackerel began retracting from the western feeding grounds in Greenland Sea and Icelandic Waters in 2016 (ICES, 2021), meaning that the relatively large 2014 and 2016 year classes (see Figure 1C) did not follow in the pathways of the large 2010-2011 year classes dominating in the westernmost feeding area. Moreover, changes in fishing dynamics, irrespective of the mackerel behaviour, could also have caused these changes in recapture locations. Therefore, changes in recapture probabilities over time in the Norwegian Sea feeding area, the Greater North Sea wintering area and the Celtic Seas spawning area were likely influenced by a combined effect of a declining stock, resulting in changes in distribution, and fisherman behaviour in response to regulation changes. This was especially the case in 2021, where the Norwegian fishery mostly focused their catch in the Norwegian Sea as opposed to the wintering grounds around Shetland due to the discontinuation of the coastal state agreement on mackerel with the UK departure from the European Union. This subsequently affected the recapture probability patterns which dropped in Greater North Sea and increased in Norwegian Sea.
Conclusions
In summary, the results of the present study have shown the potential of using the tag-recapture data to learn more about mackerel migration behaviour and larger scale distribution patterns in the Northeast Atlantic. One main conclusion is that the observed dynamics are complex and there are many unresolved questions related to migration routes and the explicit link between mackerel movement choice and prey/environmental conditions. However, we were still able to detect signs of size dependent migrations, changing with time as fish grows older likely under the additional influence of population decline and aging along with environmental changes and spatial fishery dynamics. The results of the present study therefore fill in a gap in the literature on size dependent mackerel migration and encourage future effort to follow up on the topic on a population level by analysing trends in mackerel size and age using the surveys and fishery data. Such work is needed before one can give a more conclusive explanations to the observed large-scale changes we have seen in the distribution of the mackerel since early 2000s.
Finally, the PIT-tag time series of mackerel is planned to be continued in the future, which presents a potential for follow-up studies on the effects of social learning, adaptations of migration routes, and establishment of migration patterns over time. Besides, the tagging monitoring program is set-up in a way that makes it possible for any other countries to start tagging in their areas, and/or install RFID-antennas at their factories or factory vessels landing mackerel and connect to the same data base system. Hence, there lies a great opportunity within the tagging program itself to expand, which would certainly increase the potential for further research to increase our understanding of mackerel behaviour in the future.
Data availability statement
The datasets presented in this study can be found in online repositories. The names of the repository/repositories and accession number(s) can be found below. The official reference and link to data used in the present study is Slotte et al. (2021) and http://metadata.nmdc.no/metadata-api/landingpage/f9e8b1cff4261cf6575e70e56c4c3b3, respectively. All the code is available at https://github.com/Kotkot/IMRtag . The continuously updated data can be viewed at https://smartfishmap.hi.no and downloaded directly to R using the taggart R package available at https://github.com/IMRpelagic/taggart.
Ethics statement
The animal study was reviewed and approved by Norwegian Animal Research Authority.
Author contributions
KO, AS and SH have developed main ideas behind study with input from AÓ, SM, JJ, SJ. KO was in charge of the analysis, whereas SH produced data figures and contributed to the analysis. AS led the study and took main charge of writing the manuscript with significant input from KO and SH. AÓ, SM, JJ and SJ reviewed various versions of the manuscript. AS is responsible for the PIT-tagging program, including Norwegian tagging experiments, scanning and recaptures. AÓ, SM and JJ are responsible for scanning and recaptures at Icelandic, Scottish and Faroese factories, respectively. SJ was responsible for Icelandic tagging experiments. All authors contributed to the article and approved the submitted version.
Funding
This study was carried out as part of the project “Sustainable multi-species harvest from the Norwegian Sea and adjacent ecosystems” funded by the Research Council of Norway (project number 299554).
Acknowledgments
We also thank Hjalmar Hátun with his help on Figure 1 and text on main current in the study area.
Conflict of interest
The authors declare that the research was conducted in the absence of any commercial or financial relationships that could be construed as a potential conflict of interest.
Publisher’s note
All claims expressed in this article are solely those of the authors and do not necessarily represent those of their affiliated organizations, or those of the publisher, the editors and the reviewers. Any product that may be evaluated in this article, or claim that may be made by its manufacturer, is not guaranteed or endorsed by the publisher.
Supplementary material
The Supplementary Material for this article can be found online at: https://www.frontiersin.org/articles/10.3389/fmars.2022.983962/full#supplementary-material
References
Astthorsson O., Valdimarsson H., Gudmundsdottir A., O´skarsson G. (2012). Climate-related variations in the occurrence and distribution of mackerel (Scomber scombrus) in icelandic waters. ICES J. Mar. Sci. 69, 1289–1297. doi: 10.1093/icesjms/fss084
Bachiller E., Skaret G., Nøttestad L., Slotte A. (2016). Feeding ecology of northeast Atlantic mackerel, Norwegian spring-spawning herring and blue whiting in the Norwegian Sea. PloS One 11 (2), e0149238. doi: 10.1371/journal.pone.0149238
Boyd R. J., Sibly R., Hyder K., Walker N., Thorpe R., Roy S. (2020). Simulating the summer feeding distribution of northeast Atlantic mackerel with a mechanistic individual-based model. Prog. Oceanog 183, 102299. doi: 10.1016/j.pocean.2020.102299
Bruge A., Alvarez P., Fontán A., Cotano U., Chust G. (2016). Thermal niche tracking and future distribution of Atlantic mackerel spawning in response to ocean warming. Front. Mar. Sci. 3, 1–13. doi: 10.3389/fmars.2016.00086
Brunel T., van Damme C. J. G., Samson M., Dickey-Collas M. (2018). Quantifying the influence of geography and environment on the northeast Atlantic mackerel spawning distribution. Fisheries Oceanog 27, 159–173. doi: 10.1111/fog.12242
dos Santos Schmidt T. C., Thorsen A., Slotte A., Nøttestad L., Kjesbu O. A. (2021). First thorough assessment of de novo oocyte recruitment in a teleost serial spawner, the northeast Atlantic mackerel (Scomber scombrus) case. Sci. Rep. 11, 21795. doi: 10.1038/s41598-021-01234-1
Eliasen S. K., Homrum E., Jacobsen J. A., Kristiansen I., Óskarsson G. J., Salthaug A., et al. (2021). Spatial distribution of different age groups of herring in Norwegian Sea, may 1996–2020. Front. Mar. Sci. 8. doi: 10.3389/fmars.2021.778725
Friedland K. D., Record N. R., Asch R. G., Kristiansen T., Saba V. S., Drinkwater K. F., et al. (2016). Seasonal phytoplankton blooms in the north Atlantic linked to the overwintering strategies of copepods. Elementa 2016, 1–19. doi: 10.12952/journal.elementa.000099
Hansen B., Østerhus S. (2000). North Atlantic-Nordic Seas exchanges. Prog. Oceanogr. 45, 109–208. doi: 10.1016/S0079-6611(99)00052-X.
Hátún H., Azetsu-Scott K., Somavilla R., Rey F., Johnson C., Mathis M., et al. (2017). The subpolar gyre regulates silicate concentrations in the north Atlantic. Sci. Rep. 7, 1–9. doi: 10.1038/s41598-017-14837-4
Hátún H., Lohmann K., Matei D., Jungclaus J. H., Pacariz S., Bersch M., et al. (2016). An inflated subpolar gyre blows life toward the northeastern Atlantic. Prog. Oceanog 147, 49–66. doi: 10.1016/j.pocean.2016.07.009
Hátún H., Payne M. R., Beaugrand G., Reid P. C., Sandø A. B., Drange H., et al. (2009). Large Bio-geographical shifts in the north-eastern Atlantic ocean: From the subpolar gyre, via plankton, to blue whiting and pilot whales. Prog. Oceanog 80, 149–162. doi: 10.1016/j.pocean.2009.03.001
Hátún H., Sande A. B., Drange H., Hansen B., Valdimarsson H. (2005). Ocean science: Influence of the atlantic subpolar gyre on the thermohaline circulation. Science 309, 1841–1844. doi: 10.1126/science.1114777
He P., Wardle C. (1988). Endurance at intermediate swimming speeds of Atlantic mackerel, scomber scombrus l., herring, clupea harengus l., and saithe, pollachius virens l. J. Fish Biol. 33, 255–266. doi: 10.1111/j.1095-8649.1988.tb05468.x
Homrum E., Óskarsson G. J., Ono K., Hølleland S., Slotte A. (2022). Changes towards stable good somatic condition and increased gonad investment of Norwegian spring-spawning herring (Clupea harengus) after 2005 are linked to extended feeding period. Frontier Mar. Sci 9, 803171. doi: 10.3389/fmars.2022.803171
Huse G., Fernö A., Holst J. C. (2010). Establishment of new wintering areas in herring co-occurs with peaks in the ‘first time/repeat spawner’ ratio. Mar. Ecol. Prog. Ser. 409, 189–198. doi: 10.3354/meps08620
Huse G., Railsback S., Fernö A. (2002). Modelling changes in migration pattern of herring: Collective behaviour and numerical domination. J. Fish Biol. 60, 571–582. doi: 10.1111/j.1095-8649.2002.tb01685.x
ICES (2019). Working Group on Mackerel and Horse Mackerel Egg Surveys (WGMEGS). ICES Scientific Reports. 1 (66), 233. doi: 10.17895/ices.pub.18618143
ICES (2020). “Definition and rationale for ICES ecoregions,” in Report of the ICES Advisory Committee ICES Advice 2020, (Ecoregions), 12. doi:10.17895/ices.advice.6014.
ICES (2021). Working group on widely distributed stocks (WGWIDE). ICES Sci. Rep. 3:95, 874. doi: 10.17895/ices.pub.8298
Iversen S. A. (2002). Changes in the perception of the migration pattern of northeast Atlantic mackerel during the last 100 years. ICES J. Mar. Sci. 215, 382–390. doi:10.17895/ices.pub.8877
Jansen T., Campbell A., Kelly C., Hátún H., Payne M. R. (2012). Migration and fisheries of north East Atlantic mackerel (Scomber scombrus) in autumn and winter. PloS One 7 (12), e51541. doi: 10.1371/journal.pone.0051541
Jansen T., Kristensen K., Kooij J., Van Der, Post S., Campbell A., et al. (2015). Nursery areas and recruitment variation of northeast Atlantic mackerel (Scomber scombrus). ICES J. Mar. Sci. 72, 1779–1789. doi: 10.1093/icesjms/fsu186
Jansen T., Post Sø., Kristiansen T., Óskarsson G. J., Boje J., MacKenzie B. R., et al. (2016). Ocean warming expands habitat of a rich natural resource and benefits a national economy. Ecol. Appl. 26, 2021–2032. doi: 10.1002/eap.1384
Jansen T., Slotte A., dos Santos C., Schmidt T., Reedtz Sparrevohn C., Arge Jacobsen J., et al. (2021). Bioenergetics of egg production in northeast Atlantic mackerel changes the perception of fecundity type and annual trends in spawning stock biomass. Prog. Oceanog 16, 198. doi: 10.1016/j.pocean.2021.102658
Langøy H., Nøttestad L., Skaret G., Broms C., Fernö A. (2012). Overlap in distribution and diets of Atlantic mackerel (Scomber scombrus), Norwegian spring-spawning herring (Clupea harengus) and blue whiting (Micromesistius poutassou) in the Norwegian Sea during late summer. Mar. Biol. Res. 8, 442–460. doi: 10.1080/17451000.2011.642803
Larsen K. M. H., Hatun H., Hansen B., Kristiansen R. (2012). Atlantic Water in the faroe area: sources and variability. ICES J. Mar. Sci. 69, 802–808. doi: 10.1093/icesjms/fss028
Nøttestad L., Diaz J., Peña H., Søiland H., Huse G., Fernö A. (2016b). Feeding strategy of mackerel in the Norwegian Sea relative to currents, temperature, and prey. ICES J. Mar. Sci. 73, 1127–1137. doi: 10.1093/icesjms/fsv239
Nøttestad L., Giske J., Holst J. C., Huse G. (1999). A length-based hypothesis for feeding migrations in pelagic fish. can. J. Fish. Aquat. Sci. 56, 26–34. doi: 10.1139/cjfas-56-s1-26
Nøttestad L., Utne K. R., Óskarsson G. J., Jónsson S. Þ., Jacobsen J. A., Tangen Ø., et al. (2016a). Quantifying changes in abundance, biomass, and spatial distribution of northeast Atlantic mackerel (Scomber scombrus) in the Nordic seas from 2007 to 2014. ICES J. Mar. Sci. 73, 359–373. doi: 10.1093/icesjms/fsv218
Nikolioudakis N., Skaug H. J., Olafsdottir A. H., Jansen T., Jacobsen J. A., Enberg K. (2019). Drivers of the summer-distribution of northeast Atlantic mackerel (Scomber scombrus) in the Nordic seas from 2011 to 2017; a Bayesian hierarchical modelling approach. ICES J. Mar. Sci. 76, 530–548. doi: 10.1093/icesjms/fsy085
Olafsdottir A. H., Slotte A., Jacobsen J. A., Oskarsson G. J., Utne K. R., Nøttestad L. (2016). Changes in weight-at-length and size-at-age of mature northeast Atlantic mackerel (Scomber scombrus) from 1984 to 2013: effects of mackerel stock size and herring (Clupea harengus) stock size. ICES J. Mar. Sci. 73, 1255–1265. doi: 10.1093/icesjms/fsv142
Olafsdottir A. H., Utne K. R., Jacobsen J. A., Jansen T., Óskarsson G. J., Nøttestad L., et al. (2019). Geographical expansion of northeast Atlantic mackerel (Scomber scombrus) in the Nordic seas from 2007 to 2016 was primarily driven by stock size and constrained by low temperatures. Deep-Sea Res. Part II: Topical Stud. Oceanog 159, 152–168. doi: 10.1016/j.dsr2.2018.05.023
Orvik K. A. (2004). The deepening of the Atlantic water in the Lofoten Basin of the Norwegian Sea, demonstrated by using an active reduced gravity model. Geophys. Res. Lett. 31, 1–5. doi: 10.1029/2003GL018687.
Óskarsson G. J., Gudmundsdottir A., Sveinbjörnsson S., Sigurðsson Þ. (2016). Feeding ecology of mackerel and dietary overlap with herring in icelandic waters. Mar. Biol. Res. 12, 16–29. doi: 10.1080/17451000.2015.1073327
Pacariz S. V., Hátún H., Jacobsen J. A., Johnson C., Eliasen S., Rey F. (2016). Nutrient-driven poleward expansion of the northeast Atlantic mackerel (Scomber scombrus) stock: A new hypothesis. Elementa 2016, 1–13. doi: 10.12952/journal.elementa.000105
Pitcher T. J., Magurran A. E., Edwards J. I. (1985). Schooling mackerel and herring choose neighbours of similar size. Mar. Biol. 322, 319–322. doi: 10.1007/BF00397518
Pitcher T. J., Parrish J. K. (1993). “The functions of shoaling behaviour,” in The behaviour of teleost fishes, 2nd ed. Ed. Pitcher T. J. (London: Chapman and Hall), 363–439.
Slotte A. (1999). Effects of fish length and condition on spawning migration in Norwegian spring spawning herring (Clupea harengus l. Sarsia 84, 111–127. doi: 10.1080/00364827.1999.10420439
Slotte A., Fiksen (2000). State-dependent spawning migration in Norwegian spring-spawning herring. J. Fish Biol. 56, 138–162. doi: 10.1006/jfbi.1999.1145
Slotte A., Ólafsdóttir A., Jónsson S., Jacobsen J. A., Mackinson S. (2021)PIT-tag time series for studying migrations and use in stock assessment of north East Atlantic mackerel (Scomber scombrus). Available at: http://metadata.nmdc.no/metadata-api/landingpage/f9e8b1cff4261cf6575e70e56c4c3b3e.
Stefánsson U., Ólafsson J. (1991). Nutrients and fertility of Icelandic waters. Rit Fiskid. 7, 1–56.
Tenningen M., Slotte A., Skagen D. (2011). Abundance estimation of northeast Atlantic mackerel based on tag recapture data-a useful tool for stock assessment? Fisheries Res. 107, 68–74. doi: 10.1016/j.fishres.2010.10.009
Turrell W. R., Slesser G., Payne R., Adams R. D., Gillibrand P. A. (1996). Hydrography of the East Shetland Basin in relation to decadal North Sea variability. ICES J. Mar. Sci. 53, 899–916. doi: 10.1006/jmsc.1996.0112
Uriarte A., Alvarez P., Iversen S., Molloy J., Villamor B., Martins M. M., et al. (2001). Migration of adult mackerel along the Atlantic European shelf edge from a tagging experiment in the south of the Bay of Biscay in 1994. Fish. Res. 50, 129–139. doi: 10.1016/S0165-7836(00)00246-0
Walsh M., Reid D. G., Turrell W. R. (1995). Understanding mackerel migration off Scotland: Tracking with echosounders and commercial data, and including environmental correlates and behaviour. – ICES J. Mar. Sci. 52, 925–939. doi: 10.1006/jmsc.1995.0089
Wardle C., He P. (1988). Burst swimming speeds of mackerel, scomber scombrus l. J. Fish Biol. 32, 471–478. doi: 10.1111/j.1095-8649.1988.tb05382.x
Ware D. M. (1978). Bioenergetics of pelagic fish: Theoretical change in swimming speed and ration with body size. J. Fisheries Res. Board Canada 35, 220–228. doi: 10.1139/f78-036
Keywords: Atlantic mackerel, size-dependent migration, GIS, semi-parametric model, PIT tag, tag-recapture
Citation: Ono K, Slotte A, Hølleland S, Mackinson S, Jónsson SÞ, Jacobsen JA and Ólafsdóttir AH (2022) Space-time recapture dynamics of PIT-tagged Northeast Atlantic mackerel (Scomber scombrus) reveal size-dependent migratory behaviour. Front. Mar. Sci. 9:983962. doi: 10.3389/fmars.2022.983962
Received: 01 July 2022; Accepted: 17 October 2022;
Published: 11 November 2022.
Edited by:
Francois Bastardie, Technical University of Denmark, DenmarkReviewed by:
Sophia N. Wassermann, University of Washington, United StatesDavid Richardson, Northeast Fisheries Science Center (NOAA), United States
Çetin Keskin, Istanbul University, Turkey
Copyright © 2022 Ono, Slotte, Hølleland, Mackinson, Jónsson, Jacobsen and Ólafsdóttir. This is an open-access article distributed under the terms of the Creative Commons Attribution License (CC BY). The use, distribution or reproduction in other forums is permitted, provided the original author(s) and the copyright owner(s) are credited and that the original publication in this journal is cited, in accordance with accepted academic practice. No use, distribution or reproduction is permitted which does not comply with these terms.
*Correspondence: Kotaro Ono, a290YXJvLm9ub0BoaS5ubw==