 U. Rashid Sumaila1,2*
 Andrea Pierruci3
 Muhammed A. Oyinlola1
 Rita Cannas4
 Rainer Froese5
 Sarah Glaser6
 Jennifer Jacquet7
 Brooks A. Kaiser8
 Ibrahim Issifu1,2
 Fiorenza Micheli9
 Rosamond Naylor10
 Daniel Pauly1
- 1Institute for the Oceans and Fisheries, University of British Columbia, Vancouver, BC, Canada
- 2School of Public Policy and Global Affairs, University of British Columbia, Vancouver, BC, Canada
- 3COISPA, Technology and Research—Experimental Station for the Study of Sea Resources, Bari, Italy
- 4Department of Life and Environmental Sciences, Universita’ degli Studi di Cagliari, Cagliari, Italy
- 5GEOMAR Helmholtz Centre for Ocean Research, Kiel, Germany
- 6Secure Fisheries, A program of One Earth Future, Boulder, CO, United States
- 7Department of Environmental Studies, New York University, New York, NY, United States
- 8Department of Sociology, Environmental and Business Economics, University of Southern Denmark, Esbjerg Ø, Denmark
- 9Hopkins Marine Station and Stanford Center for Ocean Solutions, Stanford University, Pacific Grove, CA, United States
- 10Department of Earth System Science and Center on Food Security and the Environment, Stanford University, Stanford, CA, United States
The recent rapid growth in aquaculture production reported by the United Nations Food and Agriculture Organization may have inadvertently generated what we denote here as aquaculture over-optimism. An extreme form of this is the notion that we need not worry about sustaining wild fish stocks because we can meet the global need through farming. Here we investigate whether the recent growth in aquaculture production can be maintained, and we compare aquaculture production projections with the future need for fish to find out whether aquaculture over-optimism can be justified. We show relevant evidence suggesting that aquaculture growth rates in all the cases studied have already reached their peak and have begun declining. Also, our results indicate that without wild fish, the world will face a fish food shortage of about 71 million tonnes annually by 2030, and the aquaculture production growth rate would have to be 3 times current average projected production by the FAO, the World Bank and the OECD in 2030. Finally, the current geographical distribution of farmed fish production suggests that even if aquaculture over-optimism is physically, economically, technically and ecologically feasible, its socio-economic cost to low-income coastal countries could be devastating.
Introduction
Aquaculture is currently lauded as one of the fastest-growing food systems in the world (Klinger & Naylor, 2012; Troell et al., 2014), growing from a few million tonnes in 1950 to over 90 million tonnes per year more recently (FAO, 2018; FAO, 2020a; FAO, 2022). This impressive growth may have generated what we denote here as aquaculture over-optimism, i.e., the belief that aquaculture can continue to grow at its recent rate or even faster, and therefore be able to meet global demand for fish single-handedly.
Data provided by the FAO show that aquaculture production has been growing much faster than global wild catch since the 1980s (Figure 1A) (FAO, 2018), with the FAO (2022) drawing attention to “another all-time record of 122.6 million tonnes of farmed fish production in live weight in 2020”. It is worth noting that FAO farmed production quantities include farmed algae and oyster-shells” (Edwards et al., 2019). In addition, researchers (e.g., (M. J. Gentry et al., 2017; Lester et al., 2018; Oyinlola et al., 2018; Costello & Connor, 2019) have modelled potential production and suggest possibilities for aquaculture expansion based on suitable fish farming areas. For example, Gentry et al. (2017) projected that global offshore aquaculture production could grow by more than 100 times the current production of finfish, concluding that “the current total landings of all wild-capture fisheries could be produced using less than 0.015% of the global ocean area”. Costello et al. (2019) took an analytical and econometric look at potential mariculture production and concluded that the ocean could produce six times more than what it does currently, providing almost two-thirds of the total protein demand of the world population.
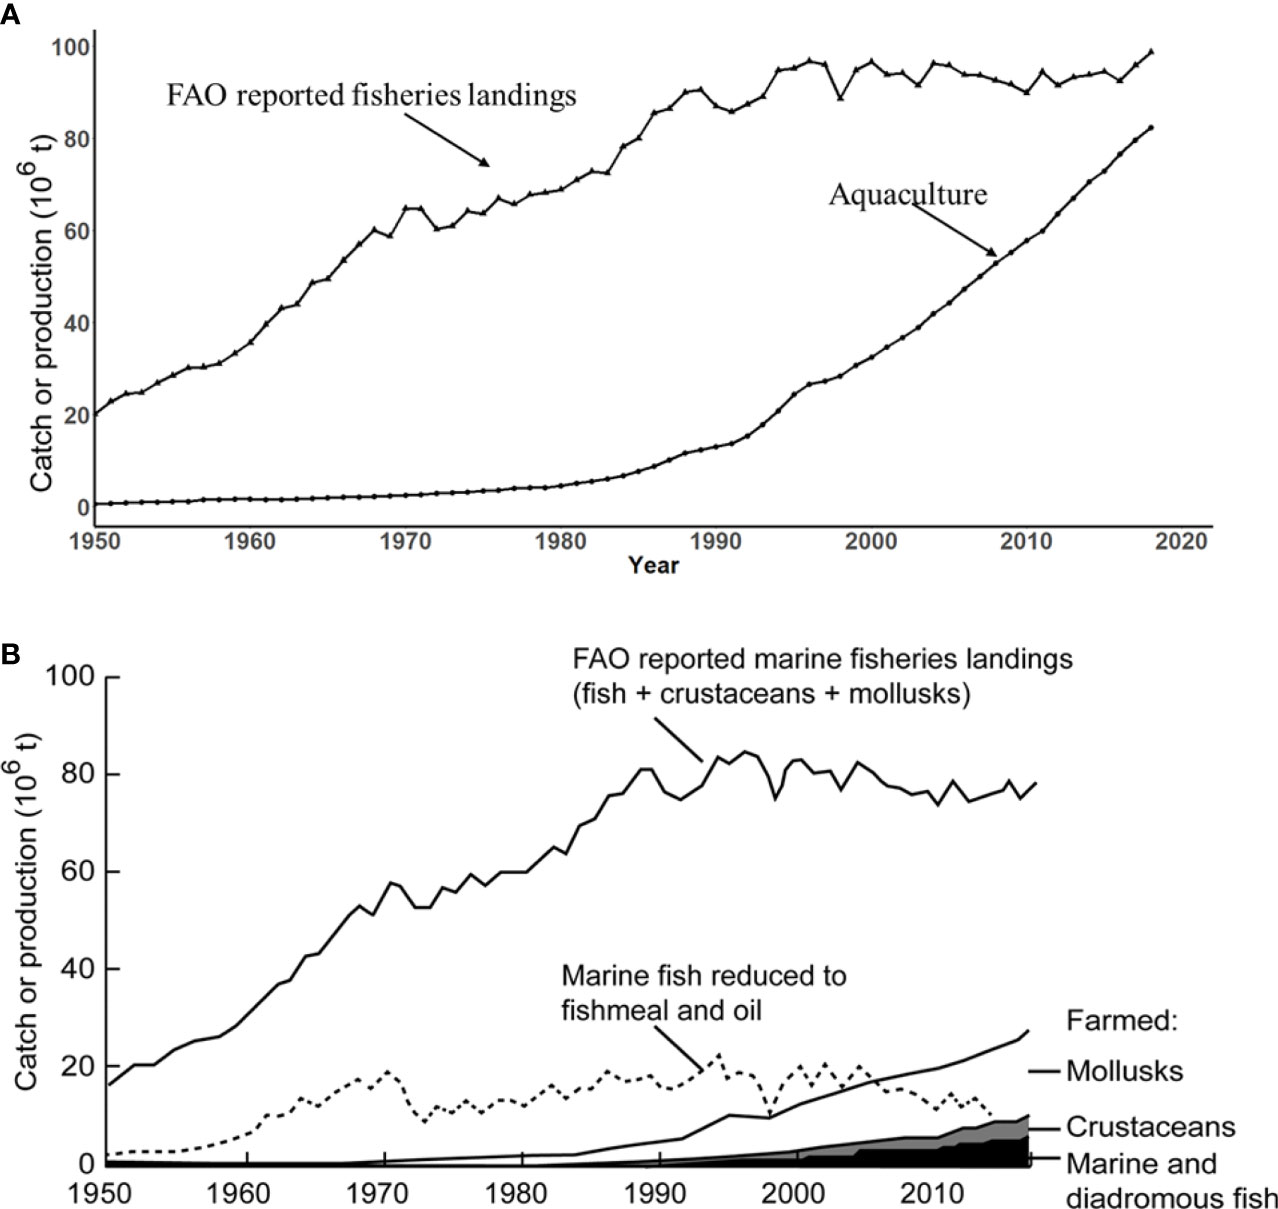
Figure 1 Comparison between fisheries catches and aquaculture. (A) Global food fish production from aquaculture and fisheries; (B) Comparison between the magnitudes of global marine fisheries catches (from FAO) and the production of marine and diadromous fish (incl. salmon) and invertebrates (crustaceans and molluscs) through mariculture. Note that molluscs (mostly bivalves farmed in China) need no feed, but that farmed fish and crustaceans do, with feeds based on fisheries catches (dotted line).
Granted that the above authors discussed the conditions and scenarios under which their prediction may come true,—e.g., responsible policymaking, expanding the production of non-fed mariculture, climate change mitigation—but these nuances and conditions were lost in the media coverage, with titles such as, “Can sustainable aquaculture feed the world?” and, “Aquaculture could feed the world and protect the planet - if we get it right”, most probably unintentionally feeding into broader aquaculture over-optimism. The aquaculture industry regularly uses the narrative of “food security” although empirical evidence of the degree to which aquaculture has fed hungry or nutritionally-deficient people is missing. In Bangladesh, for example., shrimp are referred to as ‘white gold’, not for their nutritional value but their export value (Ahmed & Diana, 2015), a fact notably at odds with the idea that aquaculture directly feeds the world’s poor.
Here, we first investigate, using publicly available data (FAO, 2020b and FAO, 2022) whether the recent rate of growth of aquaculture production can be maintained (Liu & Sumaila, 2008). Second, we compare projections of aquaculture production with those of future needs for fish to find out whether aquaculture optimism can be justified. Third, we describe the geography of aquaculture production compared to wild aquatic species catch, both freshwater and marine, and compare and contrast global access inequalities for the two sources of fish, respectively. Even though the latter analysis has been done earlier (e.g. Jennings et al., 2016; Belton et al., 2020), we highlight social and economic aspects of the geography of aquaculture production by comparing it to the geography of wild fish catch, highlighting the socio-economic implication of this difference.
Methods
Can the recent growth rate of aquaculture production be maintained into the future?
We analyze time-series data that illustrates aquaculture’s changing productivity from 1950 to 2018 as we belief this time series will give a better picture of the long term trends the paper is concerned about. The period from 2019 to 2021 are the COVID-19 years, and therefore extending our analysis to include this period would only distort the picture. The data used for this analysis are collected by the Food and Agriculture Organisation (FAO) and include total farmed aquatic animal and plant production for different countries. We identified the top ten farmed species with the highest production quantity between 2014 and 2018. These top ten species accounted for nearly 70% of the reported world aquaculture production in 2018 (FAO, 2020a). We analyze the trends in aquaculture production and growth rates for China and the next nine top fish farming countries in the world. We also analyze the growth rate of aquaculture production on different continents, which are at different stages in the development of their aquaculture sector to find out whether the ‘age’ of aquaculture on a continent is a factor in its growth rate.
Non-fed species do not have a direct negative impact on wild fish because they do not require aquafeed in the form of fishmeal and oil, although intensive operations can have indirect effects on wild fish through habitat and flow alteration (Gallardi, 2014). These species have been identified as having a net contribution to global food security (Jacquet et al., 2017). It is, therefore, useful to find out if farming non-fed species has a different production growth rate pattern than fed farmed species.
We used five-year moving average growth rates of production to help decide whether the annual incremental growth rates of production are increasing, decreasing or remaining stable over time. Five-year moving average growth rates were used to help discern the most relevant changes in trends and to therefore gauge the potential of global aquaculture production into the future.
We analyzed three groups of aquatic animals that are farmed worldwide. Note that aquatic animals refer to either a single species, a group of species (where identification to the species level is not possible), or an interspecies hybrid. These three groups included (i) the top ten farmed aquatic animals; (ii) the top 10 fed and non-fed aquatic animals; (iii) species-group based class (total categories for finfish = 103; bivalves = 33; crustaceans = 31; grouped in Table S1). Each group represents the top ten aquatic animals with the highest aquaculture production estimated as the sum of total production from 2014 to 2018 (Table 2; Figure S1). To simplify, we introduced four new groups of aquatic animals (Carp, Catfish, Tilapias, Oyster, Mussel, Salmon, Seabream, Trouts and Shrimp & Prawn) containing different species relating to the same family (Table S1).
We then evaluated the total production by continent and report the five-year mean production by weight before the peak year of the growth rate (of production), and the last five years in the period of our analysis, i.e., 2014 to 2018, for all the farmed species assessed. Also, we analyzed the growth rates for farmed species in each group using a piecewise linear analysis. We then calculated the same numbers by continent and displayed the results for the last five years of the period of the analysis.
It is worth reiterating here that, we do not include 2019 to 2021 data in our analysis due to the fact that the COVID-19 pandemic has had a profound impact on the normal dynamics of fisheries and aquaculture globally, by stopping production, changing consumer demand, disrupting markets due to lockdowns, curfews, physical distancing in operations and onboard vessels, and port restrictions (FAO, 2022).
Can aquaculture production meet most of the global demand for food fish?
Modelling exercises have been conducted recently to project fish demand and supply, including those by (i) the World Bank-FAO-IFPRI Fish 2030 analysis (WorldBank, 2013); (ii) the OECD-FAO Agricultural outlook model (OECD-FAO, 2019) and by the FAO (2018). We summarize these projections in Table 1. To explore whether aquaculture can single-handedly meet the global demand for food fish, we used the data in Table 1 to calculate the average annual projected global demand and supply of food fish from the world’s fish farms in 2030.

Table 1 Projected global per capita fish consumption growth rate, demand and aquaculture production.
Geographic distribution of current aquaculture production
We analyze the global distribution of aquaculture production by country and continent and compare and contrast this with wild marine and freshwater species caught by country and continent to reveal how current aquaculture production is skewed relative to wild catch, and its socio-economic implications.
Data from the FAO FishStat database (FAO, 2020b) for inland and marine aquaculture, and inland fisheries landings data (the 1950–2019 Global Production dataset: http://www.fao.org/fishery/statistics/global-aquaculture-production/en) were employed to conduct the analysis contained in this contribution. The R statistical software (R Core Development Team 1018) (R Core Team, 2020) is used to analyze the data.
Results and discussion
Aquaculture production growth rate trends
Our analysis shows that the five-year moving average growth rates of production have peaked (Table 2A). Examining production data more closely reveals that the five-year moving average growth rate of aquaculture production peaked at 14.1% in 1996, while the equivalent moving average for wild catch peaked at 8.4% in 1963. Positive trends in aquaculture production and the difference in current growth rates between the two sectors may have led to the expectation of a continued high growth rate of aquaculture. The fed (mainly finfish and crustacean) and non-fed farmed species (e.g., algae and filter-feeding molluscs) identified in this study represent ~60% and ~20% of global aquaculture production for the same period, respectively (Tables 2B, C; Figures 2C–F).
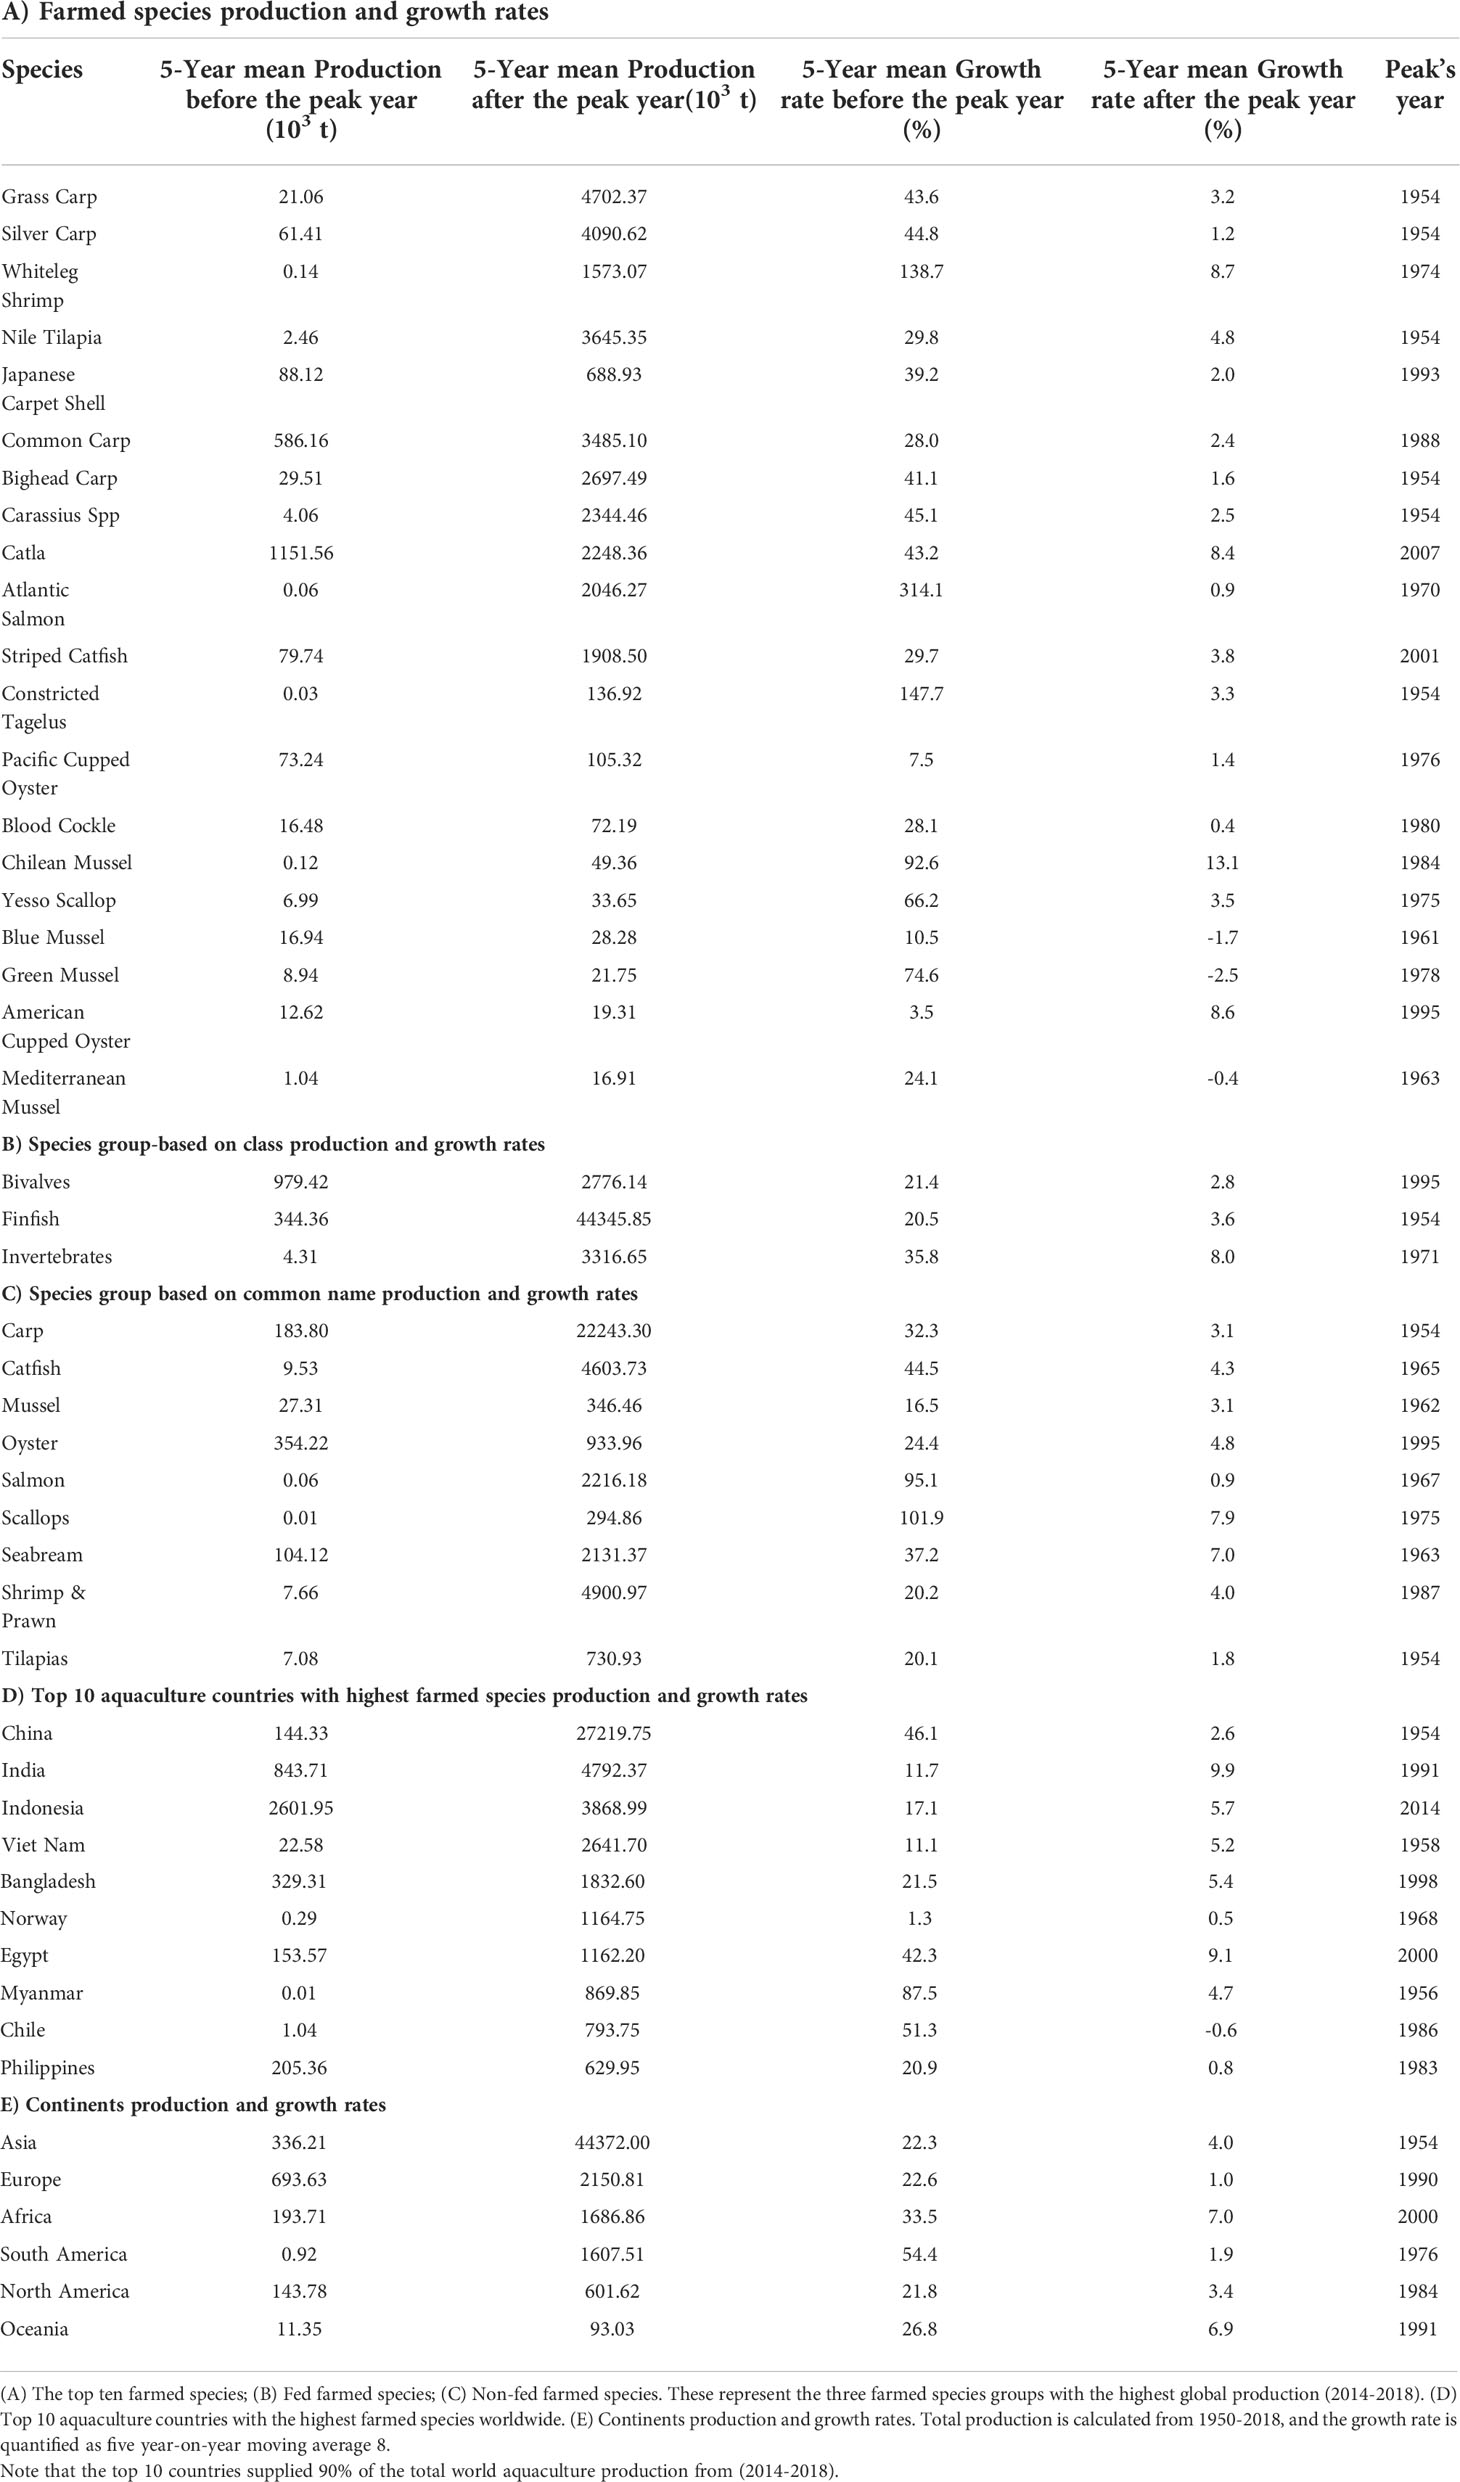
Table 2 Aquaculture production and growth rates: 5-year mean production and growth rates before and after the peak year.
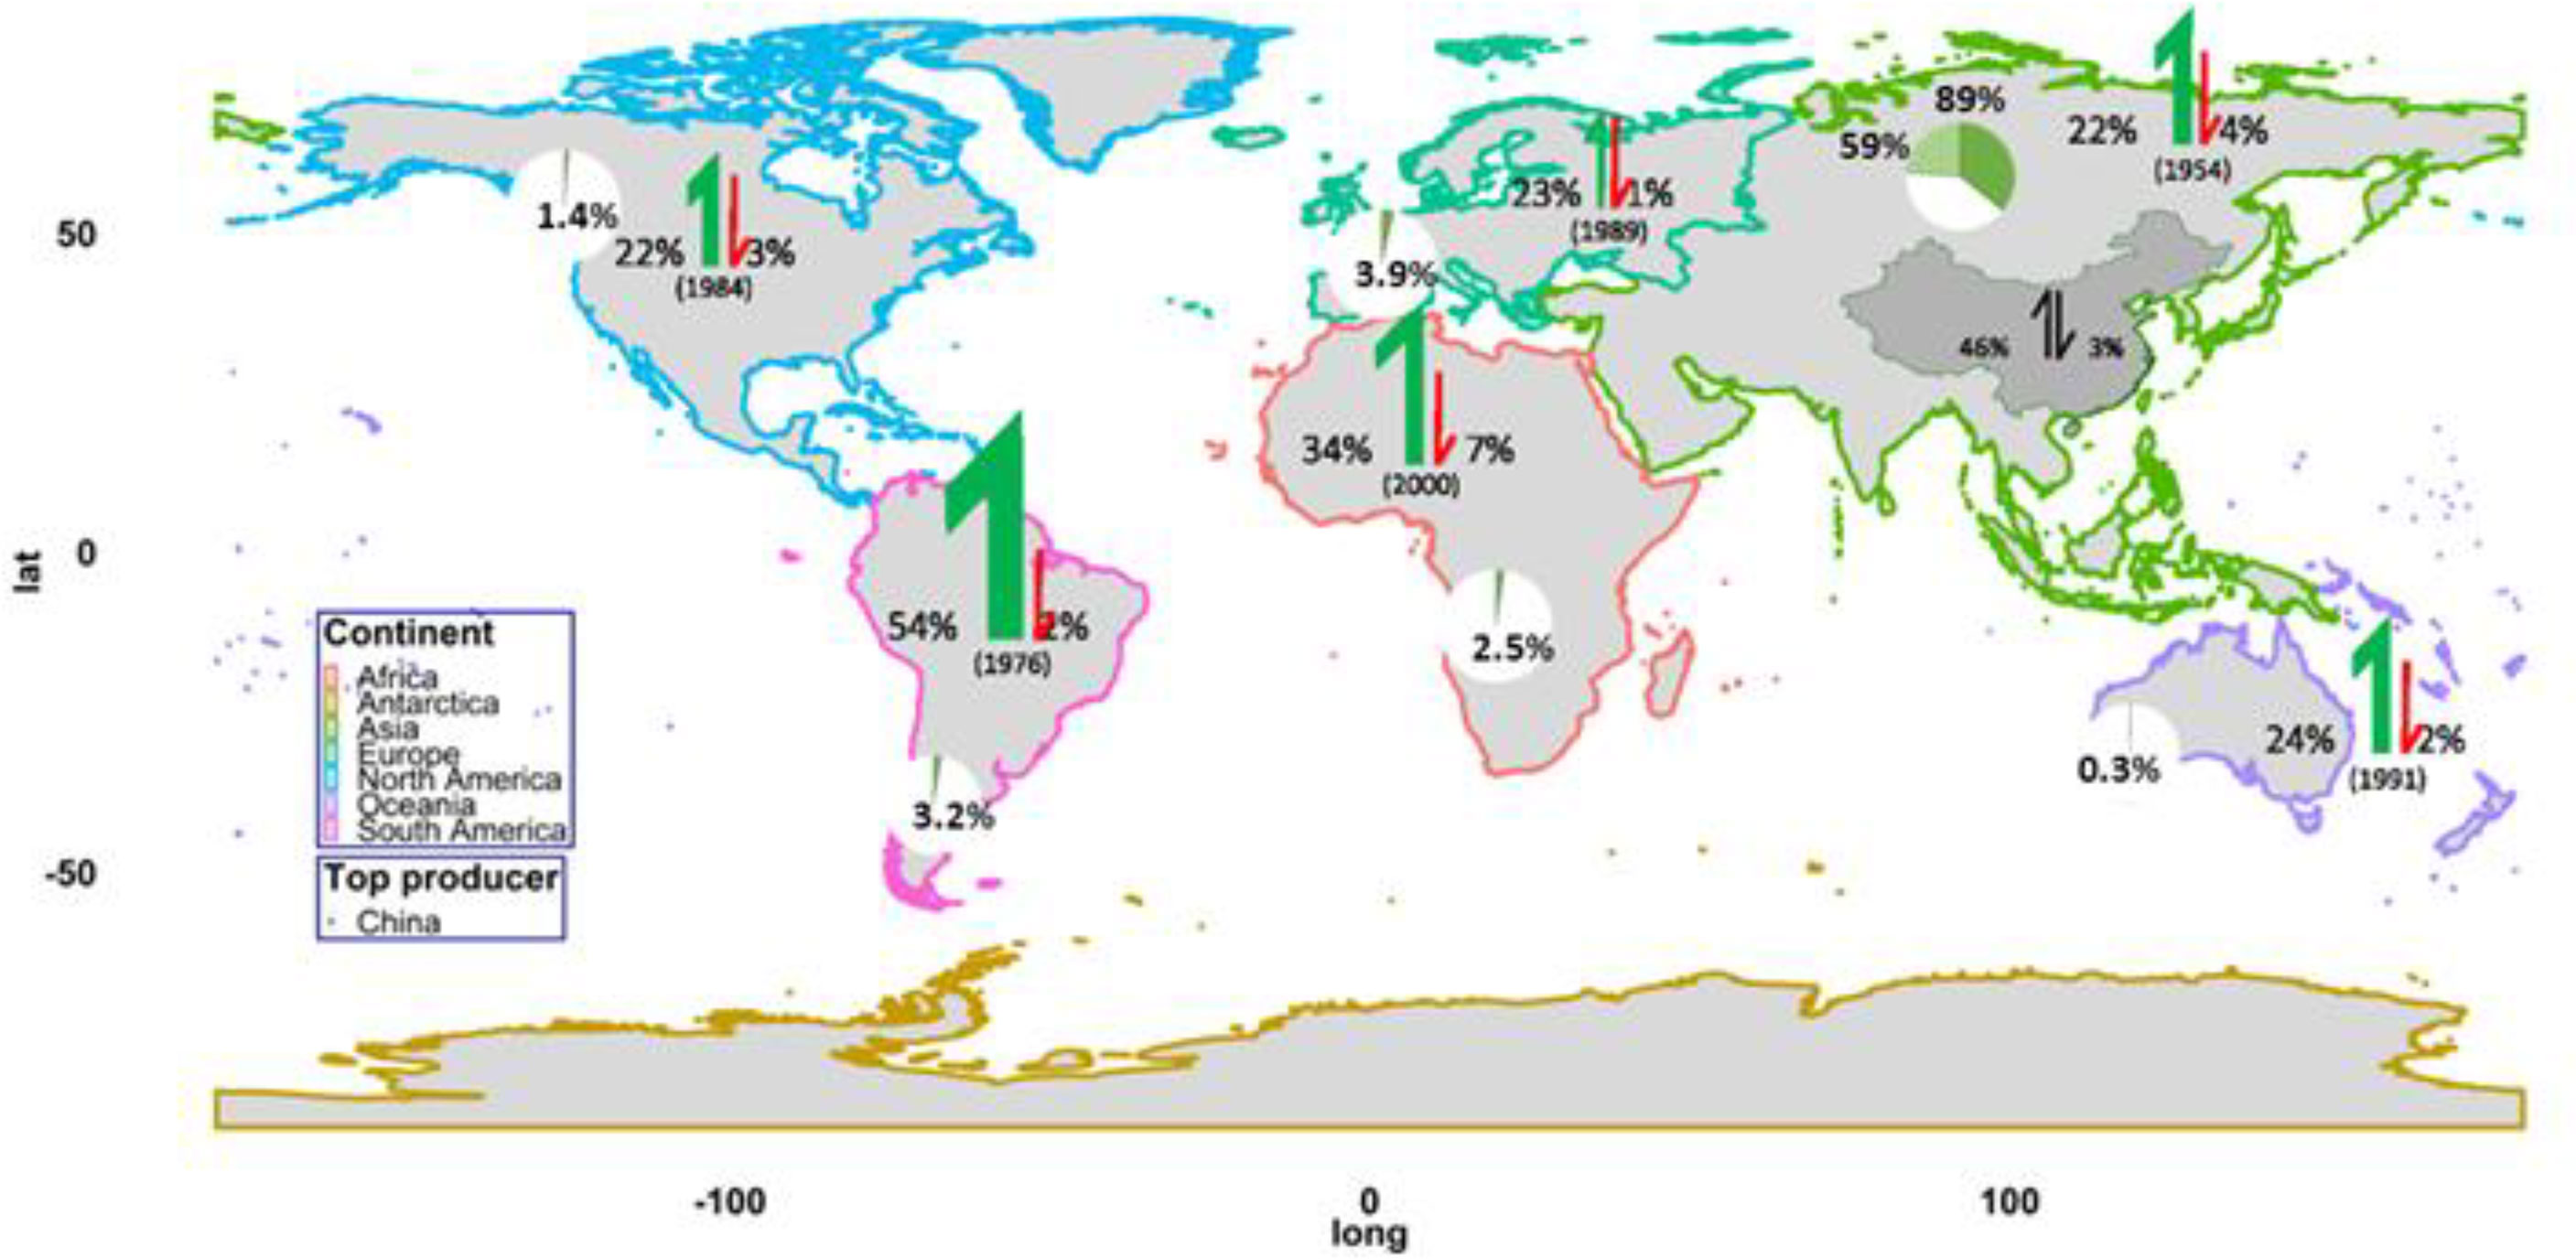
Figure 2 Global aquaculture production and growth rates. Pie charts show the global aquaculture production (%) by continents from 2014 to 2018. Asian pie chart also illustrates the percentage of contribution from the world’s largest’ producer (China). Green and red arrows indicate the five year-on-year moving average growth rate (%) before the peak growth rate and five-year moving average between 2014 and 2018, respectively.
We find that while the total production for the top ten farmed species continues to increase, the growth rates have peaked, and are decreasing. This result also applies to the top ten fed and non-fed farmed species (Figure 3; Table 2; Figure S1). The total production of all the three groups has been increasing since 1950, yet the growth rates are declining with the biggest decline recorded for the top ten non-fed aquatic species (Figure 3). This is an important and surprising result because non-fed species production is viewed as a key contributor to food security, and it is ecologically less damaging compared to fed species, and can minimize animal welfare concerns (Jacquet et al., 2017). Our analysis suggests that Atlantic salmon (Salmo salar) is the species with the highest drop in growth rate in the world, decreasing from 314% (five-year moving average before the production peaked in 1970) to just 0.9% recently (Table 2A).
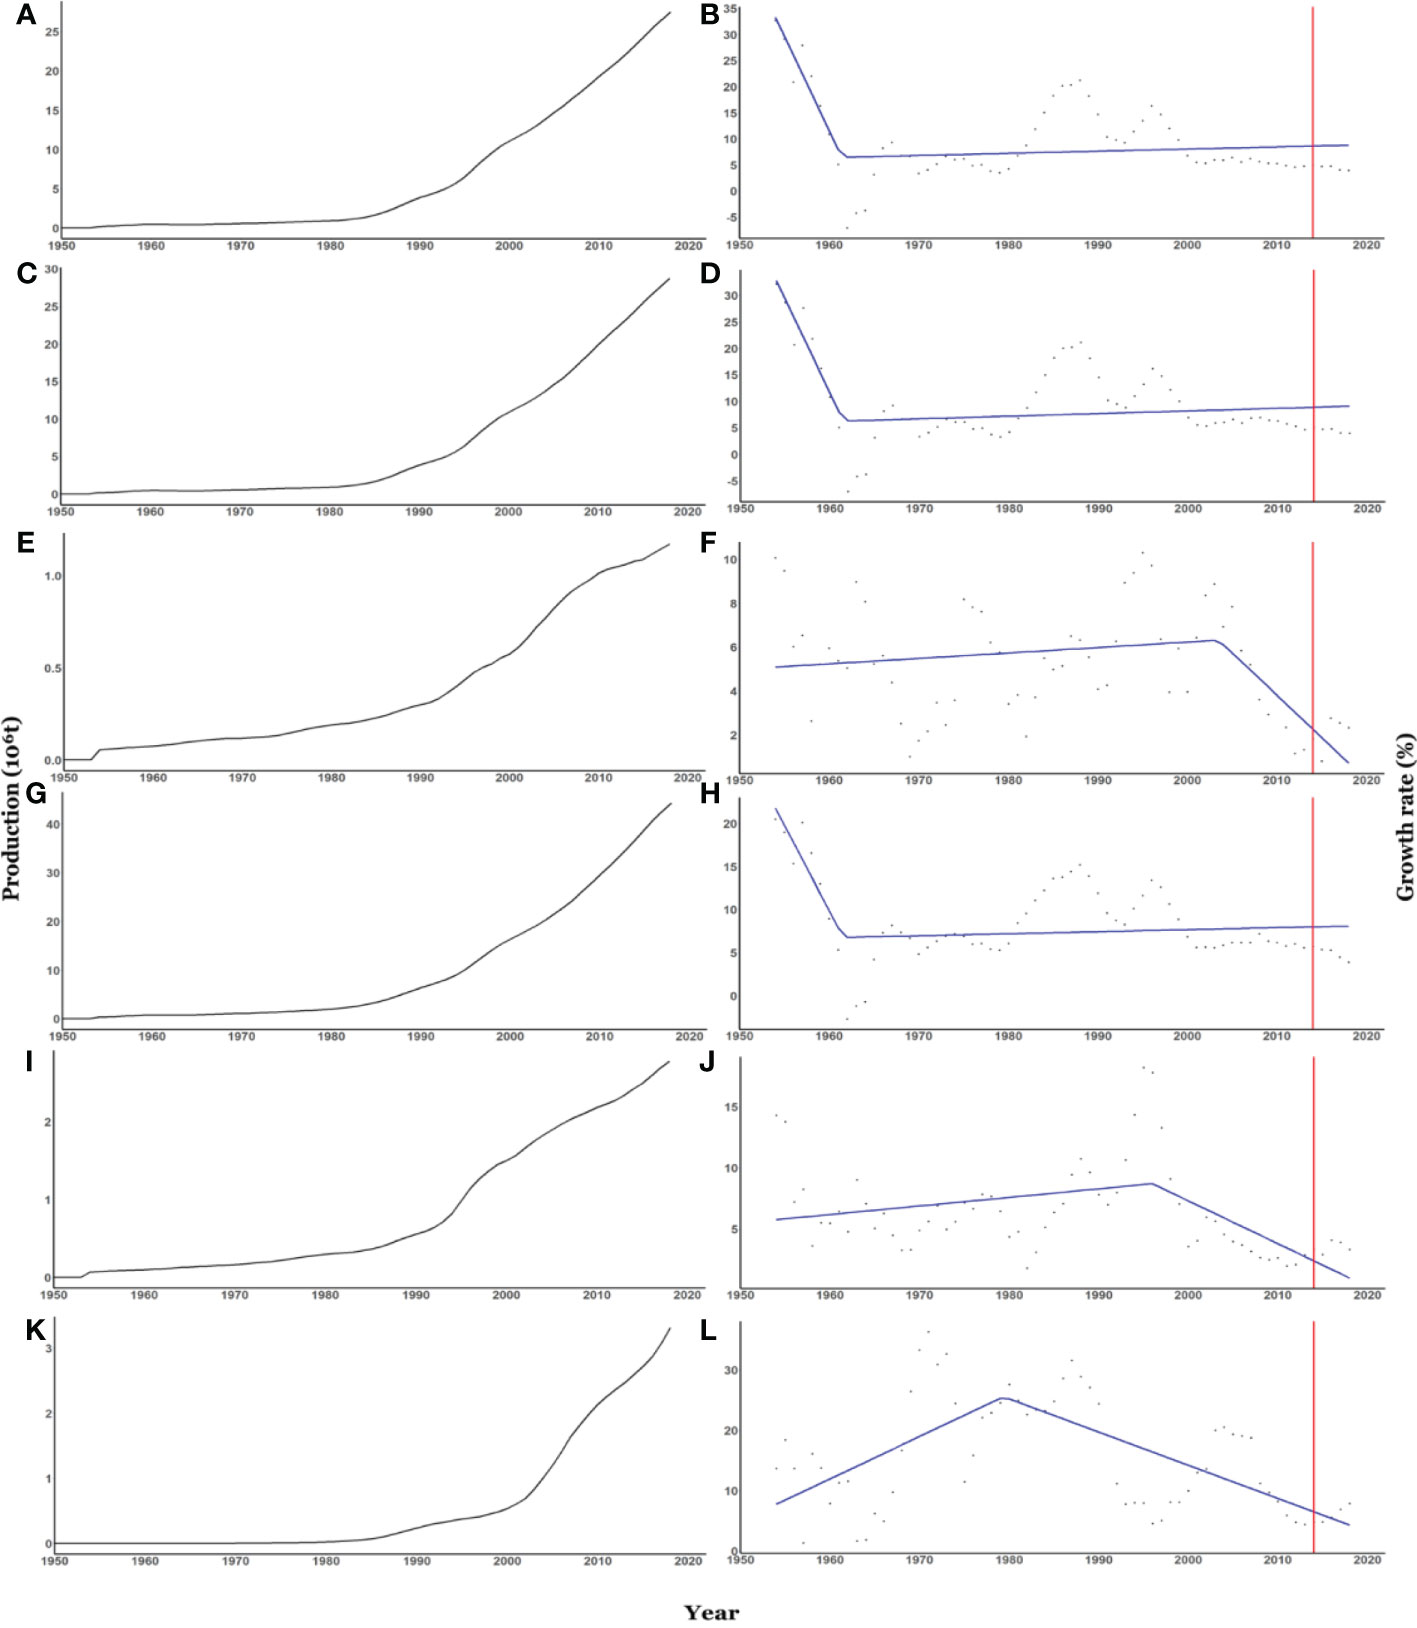
Figure 3 Total farmed species production and growth rates. Figures (A, B) illustrates the top ten farmed species; (C, D) the top ten Fed farmed species; (E, F) the top ten Non-fed farmed species; (G, H) finfish farmed species; (I, J) Bivalves farmed species; (K, L) Invertebrates farmed species). Total production is calculated from 1950-2018, and the growth rate is quantified as five year-on-year moving average from the peak growth production to 2018. The red line highlights the trends for the last five years (2012-2018). The five year-on-year moving average trends are (B) slope1 = -3.67, slope 2 = 0.05;, R2 = 0.5; (D) slope1= -3.55, slope2 = 0.05, R2 = 0.5; (F) slope1 = 0.02, slope2 = -0.39, R2 = 0.27; (H) slope1 = -3.30, slope2 = 0.03, R2 = 0.52; (J) slope1 = -3.69, slope2 = -0.02, R2 = 0.23; (L) slope1 = 0.61, slope2=-0.6, R2 = 0.42. Data source: Food and Agriculture Organisation (FAO).
The data reveal an order of magnitude drop in the growth rate of Chinese aquaculture production: from 46.1% over the five years before the growth rate peaked in 1954 to 2.6% in the five years to 2018 (Table 2D). The results reported in Table 2D show that the growth rates of the next top nine aquaculture producing countries follow similar patterns of growth rate. For instance, Myanmar’s growth rate of production five years to the peak year in 1956 dropped from 87.5% to 4.7% in the five years to 2018, while that of Chile dropped from 51.3% to -0.6% and that of Thailand dropped from 32.7% to -3.7% most likely because of the White Spot disease crisis that hit Thailand from 2011. Indonesia’s current growth rate at 9.9% is the highest among the top ten producing countries, but even here, there has been a drop compared to the country’s growth rate of 11.7% five years before its peak in 2014. Also, Norway’s growth which peaked in 1968 with 1.3% five years prior has dropped to a 0.5% growth rate currently.
Trends in aquaculture growth rates by continent are not different from the patterns for different configurations of species and countries. Aquaculture production growth rates have peaked in all continents, with peak years ranging from 1954 in Asia to 2000 in Africa (Figure 2). The growth rate of aquaculture production in Asia, the world’s leading aquatic animals farming continent by far, dropped from 22.3% five years to its peak in 1954 to 4.0% in the five years leading up to 2018 (Figure 2). The growth rate in South America was 54.4% before it peaked in 1976 at 1.9% recently. On the other hand, Africa has the highest current growth rate, at 7.0%, which reached its maximum in 2000 at a rate of 32% five years before the peak year.
Can aquaculture production meet most or the global demand for fish food?
In 2018, wild fisheries and fish farms supplied ~ 96.4 and 82.2 million tonnes of food fish, respectively (FAO, 2020). From Table 1, we see that the average annual projected demand for food fish in 2030 by the FAO, the World Bank and the OECD is 173 million tonnes. These same institutions have projected an average annual aquaculture production of 101 million tonnes annually, which means they expect the annual growth rate of aquaculture production to be ~2% relative to the 2018 production level. These numbers suggest that for aquaculture to supply most or all of the total global fish demand, totaling 173 million tonnes by 2030, the supply from fish farms would have to grow by. at least up to, 3 times the average projected annual growth rate by the FAO, World Bank and the OECD.
But wouldn’t technological innovation help aquaculture achieve a 3-fold annual growth rate relative to the predictions of these 3 important global institutions? Well, one could say that anything in life is possible but the evidence on the ground says otherwise. For aquaculture to defy the projections of these 3 institutions, the gains in technology and management must be very substantial, and the economics has to work out, especially, during this COVID-19 pandemic, which disrupted global production reversing previously favorable trends as reported in FAO (2022). The total factor productivity changes from 1996 to 2008 for the Norwegian salmon aquaculture industry was 1–2% a year, where the contribution from technical efficiency change is between 0.2 and 1.2% and that from technological change is between 0.6 and 0.8% (Asche et al., 2013). This information does not seem to support the hope that we can innovate ourselves out of the well-founded growth projections of the FAO, World Bank and the OECD. What is more, technological development in this case ultimately faces the limitations of the biological system. For example, if you try to intensify fish farming as Chile has tried, the whole system blows up due to increased disease prevalence and algae bloom (Trainer et al., 2020). There are also limitations in management and economics. The returns on investment to new technology have to pay off, and unless real fish prices increase significantly, some of these investments will not pay off easily. Capping these barriers to the ‘‘expected’’ aquaculture growth is the uncertainty involved both in raising the animals and those on the marine ecosystem itself.
The geographic distribution of wild fish catch and aquaculture production and its socio-economic implications
Current aquaculture production is geographically concentrated, with Asia accounting for ~90% of global aquaculture production (Figure 4). The remaining 10% of the global output is shared between the other five continents, with Europe contributing ~4%. Catch of wild aquatic animals is less concentrated geographically, with Asia accounting for 54% (and China 18%) of world production (Figure 4). Further comparison of these two sources of food fish vividly demonstrates how aquaculture production is skewed geographically (Figure 4): (i) of the 206 countries in our study, 58 produced on average <100 t of farmed fish a year between 2012 and 2018. The number of countries with such low catch of wild aquatic animals is only 27; (ii) while China alone produces 60% of total production of farmed fish, two hundred and one countries cumulatively produce 60% of total wild aquatic animal production, highlighting the extreme geographical bias of farmed fish production; (iii) SIDS (Small Island Developing States), coastal African and South American countries would likely suffer significant food insecurity if we allow wild aquatic animals to be depleted (Figure 4). Thus, providing most of the world’s food fish through aquaculture will have significant socio-economic, nutritional and food security implications for these countries, and by extension, the world at large (Srinivasan et al., 2010; Hicks et al., 2019; Pauly, 2019).
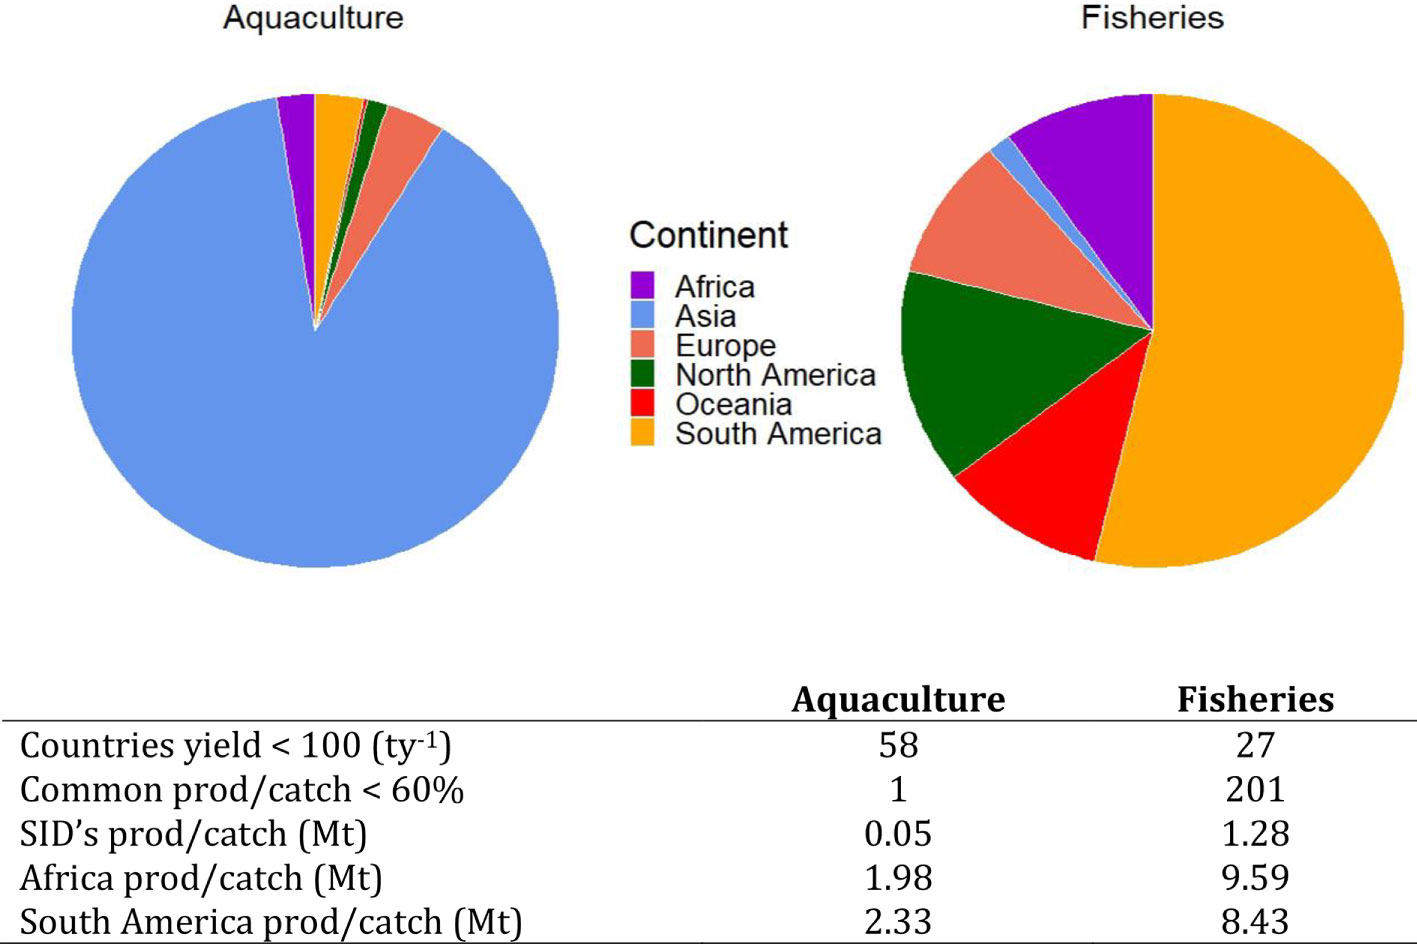
Figure 4 Global food fish production is unbalanced. The continental percentage contribution to global food fish production from aquaculture and fisheries catch.
Given the trends in growth rates, the projections about global aquaculture growth are likely inflated. In particular, the results regarding shellfish are telling because many of the extreme “optimists” suggest that shellfish should dominate production in the future to minimize stress on marine ecosystems via pollution and feed sourcing (Wang et al., 2015). Yet the biggest declines in growth appear to be in the non-fed category (Figures 3E, F). Also, the skewness of current aquaculture production with China alone producing ~60% of global production implies that many developing coastal communities, with little purchasing power, would suffer increasing nutritional and food insecurity if most fish supply were to be produced by farming. This is because it would be difficult to meet their needs by importing aquatic animals from the few big aquaculture producing countries. Even if it were technologically, environmentally and economically feasible to supply all or most of the world’s fish from farms, there may be compelling socio-economic reasons for conserving, rebuilding and sustaining wild aquatic living species (Teh and Sumaila, 2020; Sumaila, 2021; Cheung et al., 2022). For example, if Europe were to rebuild and properly manage its fisheries, catches in European waters could increase by about 5 million tonnes, which is more than the current annual European aquaculture production (Froese et al., 2018). Indeed, global fisheries catches could generate an annual increase exceeding 16 million tonnes with sound management (Costello et al., 2016).
Our analysis suggests that the notion that fish farms alone could supply most of the fish that the world needs seems unrealistic, especially as both global incomes and population continue to grow. Aquaculture is not unlike other food systems, including wild fisheries, in that “new production” activities usually grow fast and then growth tapers off, as inevitably, declining marginal returns to inputs, resource constraints, and compound growth laws set in. While we do not argue against carefully thought out sustainable aquaculture in support of nutritional and food security, the growth trends for the sector presented in this contribution mean that reliance on aquaculture to solve a myriad of global food insecurity problems is unrealistic. One of the most serious consequences of aquaculture over-optimism is that it could strongly reduce the incentive to re-build and conserve wild fisheries except wild forage fish used in feeds, and the world needs to guard against this happening to avoid social and economic consequences for many coastal communities, especially in the Global South. Instead of aquaculture over-optimism, it would be better to focus on the ethical ways to sustain aquaculture production within changing social values and the planet’s biogeophysical limits.
It seems to us that aquaculture over-optimists overlook three important points: (i) fisheries catches are usually compared to farmed production of marine animals and plants (Figures 1A, B), and these artificially inflates the perception that aquaculture contributes much more than it does to food fish supply; (ii) just like wild fish catch, the growth rate of aquaculture production has also peaked, and rates of growth have since declined; and (iii) the fact that wild fish catch peaked about 30 years earlier than the growth rate of aquaculture production is to be expected because, as depicted in the catch trends in Figure 1B, modern industrial high volume fish farming started decades after modern industrial high volume wild fisheries took off. It is the nature of many industries (and economies) that growth rates are high in the beginning, reach a peak, and eventually taper off. These initial high growth rates are ultimately slowed down by the inevitable constraints that emerge with increasing production. The biological, economic, and institutional challenges of maintaining extremely high growth rates on an expanding production base in the face of resource constraints cannot be underestimated. In the case of aquaculture, such limitations include space, water, disease and pest pressure, climate change and variability, base products for fishmeal and fish oil (including forage fish), and cultural norms (Godfray et al., 2010; Costello et al., 2019; Cottrell et al., 2019; Garlock et al., 2020).
As we further consider the sustainability of global food supply in terms of nutrition, ecological impacts, and distribution (Hirvonen et al., 2020; Fanzo et al., 2021), we must modify many of our current projections of aquaculture production in light of slowing growth rates, and acknowledge the current unsustainable trends so that we can put aquaculture on a better path towards contributing to meeting global food fish demand sustainably and equitably (Naylor et al., 2021; Short et al., 2021).
Data availability statement
The original contributions presented in the study are included in the article/Supplementary Material. Further inquiries can be directed to the corresponding author.
Author contributions
URS conceived of the study. URS, AP, II, and MO carried out the analysis. Figures and tables were created by AP, II, MO, and URS. All authors made substantive contributions to the analysis and text.
Acknowledgments
URS acknowledges OceanCanada (895-2013-1009) and Solving FCB (895-22022-1002), both research partnerships at the University of British Columbia (UBC) that are supported by the Social Sciences and Humanities Research Council of Canada (SSHRC). AP thanks the Department of Life and Environmental Sciences (Animal Biology and Ecology) while MO thanks the Changing Oceans Research Unit also at UBC.
Conflict of interest
The authors declare that the research was conducted in the absence of any commercial or financial relationships that could be construed as a potential conflict of interest.
Publisher’s note
All claims expressed in this article are solely those of the authors and do not necessarily represent those of their affiliated organizations, or those of the publisher, the editors and the reviewers. Any product that may be evaluated in this article, or claim that may be made by its manufacturer, is not guaranteed or endorsed by the publisher.
Supplementary material
The Supplementary Material for this article can be found online at: https://www.frontiersin.org/articles/10.3389/fmars.2022.984354/full#supplementary-material
References
Ahmed N., Diana J. S. (2015). Threatening@ white gold: Impacts of climate change on shrimp farming in coastal Bangladesh. Ocean Coast. Manage. 114, 42–52. doi: 10.1016/j.ocecoaman.2015.06.008
Asche F., Guttormsen A. G., Nielsen R. (2013). Future challenges for the maturing Norwegian salmon aquaculture industry: An analysis of total factor productivity change from 1996 to 2008. Aquaculture 396-399, 43–50. doi: 10.1016/j.aquaculture.2013.02.015
Belton B., Little D. C., Zhang W., Edwards P., Skladany M., Thilsted S. H. (2020). Farming fish in the sea will not nourish the world. Nat. Commun. 11 (1), 5804. doi: 10.1038/s41467-020-19679-9
Cheung W. W., Palacios-Abrantes J., Frölicher T. L., Palomares M. L., Clarke T., Lam V. W., et al. (2022). Rebuilding fish biomass for the world's marine ecoregions under climate change. Global Change Biol 28 (21), 6254–6267. doi: 10.1111/gcb.16368
Costello C., Cao L., Gelcich S., Cisneros M., Free C., Froehlich H. (2019). The future of food from the sea (Washington, DC: World Resources Institute).
Costello M. J., Connor D. W. (2019). Connectivity is generally not important for marine reserve planning. Trends Ecol. Evol. 34 (8), 686–688. doi: 10.1016/j.tree.2019.04.015
Costello C., Ovando D., Clavelle T., Strauss C. K., Hilborn R., Melnychuk M. C., et al. (2016). Global fishery prospects under contrasting management regimes. Proc. Natl. Acad. Sci. U.S.A. 113 (18), 5125–5129. doi: 10.1073/pnas.1520420113
Cottrell R. S., Nash K. L., Halpern B. S., Remenyi T. A., Corney S. P., Fleming A., et al. (2019). Food production shocks across land and sea. Nat. Sustainability 2 (2), 130–137. doi: 10.1038/s41893-018-0210-1
Edwards P., Zhang W., Belton B., Little D. C. (2019). Misunderstandings, myths and mantras in aquaculture: Its contribution to world food supplies has been systematically over reported. Mar. Policy 106, 103547. doi: 10.1016/j.marpol.2019.103547
Fanzo J., Haddad L., Schneider K. R., Béné C., Covic N. M., Guarin A., et al. (2021). Rigorous monitoring is necessary to guide food system transformation in the countdown to the 2030 global goals. Food Policy 104, 102163. doi: 10.1016/j.foodpol.2021.102163
FAO (2018). The state of world fisheries and aquaculture 2018 - meeting the sustainable development goals (Rome).
FAO (2020a). The state of world fisheries and aquaculture 2020. sustainability in action (Rome). doi: 10.4060/ca9229en
FAO (2020b). “FishStatJ - software for fishery statistical time series,” in FAO fisheries and aquaculture department(Rome). Available at: http://www.fao.org/fishery/.
FAO (2022). The state of world fisheries and aquaculture 2022. towards blue transformation (Rome). doi: 10.4060/cc0461en
Froese R., Winker H., Coro G., Demirel N., Tsikliras A. C., Dimarchopoulou D., et al. (2018). Status and rebuilding of European fisheries. Mar. Policy 93, 159–170. doi: 10.1016/j.marpol.2018.04.018
Gallardi D. (2014). Effects of bivalve aquaculture on the environment and their possible mitigation: A review. Fish. Aquac. J. 05 (03), 1–8. doi: 10.4172/2150-3508.1000105
Garlock T., Asche F., Anderson J., Bjørndal T., Kumar G., Lorenzen K., et al. (2020). A global blue revolution: Aquaculture growth across regions, species, and countries. Rev. Fish. Sci. Aquac. 28 (1), 107–116. doi: 10.1080/23308249.2019.1678111
Gentry R. R., Froehlich H. E., Grimm D., Kareiva P., Parke M., Rust M., et al. (2017). Mapping the global potential for marine aquaculture. Nat. Ecol. Evol. 1 (9), 1317–1324. doi: 10.1038/s41559-017-0257-9
Godfray H. C. J., Beddington J. R., Crute I. R., Haddad L., Lawrence D., Muir J. F., et al. (2010). Food security: The challenge of feeding 9 billion people. Science 327 (5967), 812–818. doi: 10.1126/science.1185383
Hicks C. C., Cohen P. J., Graham N. A. J., Nash K. L., Allison E. H., D'Lima C., et al. (2019). Harnessing global fisheries to tackle micronutrient deficiencies. Nature 574 (7776), 95–98. doi: 10.1038/s41586-019-1592-6
Hirvonen K., Bai Y., Headey D., Masters W. A. (2020). Affordability of the EAT–lancet reference diet: a global analysis. Lancet Global Health 8 (1), e59–e66. doi: 10.1016/s2214-109x(19)30447-4
Jacquet J., Sebo J., Elder M. (2017). Seafood in the future: bivalves are better. Solutions 8 (1), 27–32. Available at: https://thesolutionsjournal.com/2017/01/11/seafood-future-bivalves-better/
Jennings S., Stentiford G. D., Leocadio A. M., Jeffery K. R., Metcalfe J. D., Katsiadaki I., et al. (2016). Aquatic food security: insights into challenges and solutions from an analysis of interactions between fisheries, aquaculture, food safety, human health, fish and human welfare, economy and environment. Fish. Fish. 17 (4), pp.893–pp.938. doi: 10.1111/faf.12152
Klinger D., Naylor R. (2012). Searching for solutions in aquaculture: Charting a sustainable course. Annu. Rev. Environ. Resour. 37 (1), 247–276. doi: 10.1146/annurev-environ-021111-161531
Lester S. E., Stevens J. M., Gentry R. R., Kappel C. V., Bell T. W., Costello C. J., et al. (2018). Marine spatial planning makes room for offshore aquaculture in crowded coastal waters. Nat. Commun. 9 (1), 945. doi: 10.1038/s41467-018-03249-1
Liu Y., Sumaila U. R. (2008). Can farmed salmon production keep growing? Mar. Policy 32 (3), 487–501. doi: 10.1016/j.marpol.2007.09.012
Naylor R. L., Kishore A., Sumaila U. R., Issifu I., Hunter B. P., Belton B., et al. (2021). Blue food demand across geographic and temporal scales. Nat. Commun. 12 (1), 1–14. doi: 10.1038/s41467-021-25516-4
OECD-FAO (2019). Agricultural outlook 2019-2028. (Rome: Paris/Food and Agriculture Organization of the United States). doi: 10.1787/19991142
Oyinlola M. A., Reygondeau G., Wabnitz C. C. C., Troell M., Cheung W. W. L. (2018). Global estimation of areas with suitable environmental conditions for mariculture species. PloS One 13 (1), e0191086. doi: 10.1371/journal.pone.0191086
Pauly D. (2019). Micronutrient richness of global fish catches. Nature 574, 41–42. doi: 10.1038/d41586-019-02810-2
R Core Team (2020). R: A language and environment for statistical computing (Vienna, Austria: R Foundation for Statistical Computing). Available at: https://www.r-project.org/.
Short R. E., Gelcich S., Little D. C., Micheli F., Allison E. H., Basurto X., et al. (2021). Harnessing the diversity of small-scale actors is key to the future of aquatic food systems. Nat. Food 2 (9), 733–741. doi: 10.1038/s43016-021-00363-0
Srinivasan U. T., Cheung W. W., Watson R., Sumaila U. R. (2010). Food security implications of global marine catch losses due to overfishing. J. Bioeconomics 12 (3), 183–200. doi: 10.1007/s10818-010-9090-9
Sumaila U. R. (2021). Infinity fish: Economics and the future of fish and fisheries. (London, United Kingdom: Academic Press).
Teh L. S., Sumaila U. R. (2020). Assessing potential economic benefits from rebuilding depleted fish stocks in Canada. Ocean Coast. Manage. 195, 105289. doi: 10.1016/j.ocecoaman.2020.105289
Trainer V. L., Moore S. K., Hallegraeff G., Kudela R. M., Clement A., Mardones J. I., et al. (2020). Pelagic harmful algal blooms and climate change: Lessons from nature’s experiments with extremes. Harmful Algae 91, 101591. doi: 10.1016/j.hal.2019.03.009
Troell M., Naylor R. L., Metian M., Beveridge M., Tyedmers P. H., Folke C., et al. (2014). Does aquaculture add resilience to the global food system? Proc. Natl. Acad. Sci. U.S.A. 111 (37), 13257–13263. doi: 10.1073/pnas.1404067111
Wang Q., Cheng L., Liu J., Li Z., Xie S., De Silva S. S. (2015). Freshwater aquaculture in PR China: trends and prospects. Rev. Aquac. 7 (4), 283–302. doi: 10.1111/raq.12086
World Bank (2013). Fish to 2030: Prospects for fisheries and aquaculture. World Bank Report Number 83177-GLB (Washington, DC: The World Bank). Available at: https://openknowledge.worldbank.org/handle/10986/17579.
Keywords: aquaculture, growth, global, future projections, historical growth
Citation: Sumaila UR, Pierruci A, Oyinlola MA, Cannas R, Froese R, Glaser S, Jacquet J, Kaiser BA, Issifu I, Micheli F, Naylor R and Pauly D (2022) Aquaculture over-optimism? Front. Mar. Sci. 9:984354. doi: 10.3389/fmars.2022.984354
Received: 01 July 2022; Accepted: 13 October 2022;
Published: 14 November 2022.
Edited by:
Marcel Martinez-Porchas, Consejo Nacional de Ciencia y Tecnología (CONACYT), MexicoReviewed by:
Francesco Cicala, Center for Scientific Research and Higher Education in Ensenada (CICESE), MexicoMiguel A. Olvra-Novoa, CINVESTAV -Marine Resources Dept., Mexico
Copyright © 2022 Sumaila, Pierruci, Oyinlola, Cannas, Froese, Glaser, Jacquet, Kaiser, Issifu, Micheli, Naylor and Pauly. This is an open-access article distributed under the terms of the Creative Commons Attribution License (CC BY). The use, distribution or reproduction in other forums is permitted, provided the original author(s) and the copyright owner(s) are credited and that the original publication in this journal is cited, in accordance with accepted academic practice. No use, distribution or reproduction is permitted which does not comply with these terms.
*Correspondence: U. Rashid Sumaila, ci5zdW1haWxhQG9jZWFucy51YmMuY2E=