 A-L. Ferchaud1*†
 E. Normandeau1†C. Babin1†
 K. Præbel2†Rasmus Hedeholm3
 C. Audet4†J. Morgan5M. Treble6†
 W. Walkusz6†P. Sirois7
 L. Bernatchez1†
- 1Département de Biologie, Institut de Biologie Intégrative et des Systèmes (IBIS), Université Laval, Québec, QC, Canada
- 2Norwegian College of Fishery Science, UiT the Arctic University of Norway, Tromsø, Norway
- 3Sustainable Fisheries Greenland, Skørping, Denmark
- 4Institut des sciences de la mer de Rimouski, Université du Québec à Rimouski, Rimouski, QC, Canada
- 5Fisheries and Oceans Canada, St. John’s, NF, Canada
- 6Fisheries and Oceans Canada, Winnipeg Department, Arctic Aquatic Research Division, Winnipeg, AB, Canada
- 7Chaire de recherche sur les espèces aquatiques exploitées, Département des sciences fondamentales, Université du Québec à Chicoutimi, Chicoutimi, QC, Canada
Characterizing the extent of genetic differentiation among individuals and its distribution across the genome is increasingly important to inform both conservation and management of exploited species. The Greenland Halibut is one of the main demersal fish species to be commercially exploited in Eastern Canada, and accurate information on geographic population structure and local adaptation is required to ensure the long-term presence of this species. We generated high-quality whole-genome sequencing data for 1,297 Greenland Halibut sampled across 32 locations throughout the Northwest Atlantic (from Arctic Canadian and Greenlandic coasts to the Gulf of St Lawrence). Population genetic structure was analyzed, revealing an absence of population differentiation between Canada and west Greenland but significant genetic differentiation between the Gulf of Saint Lawrence and the remainder of the Northwest Atlantic. Except for Gulf of Saint Lawrence, Greenland Halibut thus appear to be panmictic throughout the Northwest Atlantic. Environmental Association Analyses revealed that the environment explained up to 51 % might be replaced by 51% of the differentiation observed between the two stocks, with both ocean-bottom and surface variables (e.g., temperature and oxygen) involved in the observed genomic differentiation. Altogether, these results indicate that phenotypic differences previously observed between the Gulf of Saint Lawrence and the Northwest Atlantic likely resulted from functional adaptive divergence to their respective environmental conditions. Using coalescent simulations, we also assessed how high levels of migration between the two stocks would allow Greenland Halibut to potentially escape unfavorable environmental conditions in the Gulf of Saint Lawrence. In addition to supporting the management of this important exploited species, this work highlights the utility of using comprehensive genomic datasets to characterize the effects of climate change across a wider range of species.
Introduction
Defining biologically meaningful units with the aim of sustaining biodiversity is one of the major goals of populations management and conservation biology (Moritz, 1994; Allendorf et al., 2012). In particular, the detection of genetic structure provides a crucial tool to identify such units and to assess the degree of connectivity among populations (Bernatchez et al., 2017). Neglecting to consider population structure may increase risks of overexploitation or mis-management (Waples, 1998), especially in a world governed by anthropogenically driven climate change where species and populations are under constant pressure to adapt to new environmental conditions (Smith and Bernatchez, 2008; Sheffers et al., 2016). If environmental changes are persistent, phenotypic plasticity, migration and adaptation can help a species avoid extinction. Species living in marine ecosystems are traditionally considered to be highly connected due to their large population sizes and the limited numbers of effective barriers to gene flow found in these ecosystems (Nielsen et al., 2009). Because of these conditions, combined with a complex life-cycle, high fecundity and the potential for long-distance migration and dispersal, the use of neutral genetic markers in marine organisms has often not been powerful enough to separate populations into divergent groups (Gagnaire et al., 2015). However, with the advent of new and affordable high-throughput sequencing, genomic analyses of population structure in marine species have increasingly revealed diverse and complex signatures of population differentiation (Lamichhaney et al., 2012; Benestan et al., 2015; Bradbury et al., 2015; Lamichhaney et al., 2017, Van Wyngaarden et al., 2018, Xuereb et al., 2018). These patterns range from genome-wide polygenic variation associated with subtle, coordinated shifts in allele frequency at multiple loci (e.g. Gagnaire et al., 2012; Pavey et al., 2015; Babin et al., 2017) to localized genomic regions housing structural variants or genes of large effect within otherwise undifferentiated genomes (Kess et al., 2019; Matschiner et al., 2022). Across studies, genomic differentiation in marine species has been found to be associated with behavioral traits (Prince et al., 2017; Kess et al., 2019), spawning time (Lamichhaney et al., 2017) and environmental variation (Bradbury et al., 2010; Lamichhaney et al., 2012; Benestan et al., 2016; Stanley et al., 2018; Kess et al., 2021). These observations support the hypothesis that genetic differentiation in marine species often underlies adaptive differences that delineate significant ecological diversity. Most genomic studies investigating the association between genotypes and environment (GEA, Genotype Environment Association) were first based on reduced-representation sequencing of natural populations (e.g. RAD-Seq, RNA-Seq, targeted sequencing, SNP-chips) and allowed the identification of important candidate genes or loci involved in climate adaptation. In contrast, whole-genome sequencing (WGS) delivers data on the entire genome of individuals and provides information on the spatial pattern of variation along chromosomes (when a reference genome is available) (Fuentes-Pardo and Ruzzante, 2017). If GEAs are combined with WGS data, a comprehensive set of loci is used for correlation to environmental variables and, depending on population structure and the strength of differentiation along the environmental gradient, minor effect loci can also be uncovered (De Villemereuil et al., 2014; Bernatchez, 2016). Moreover, GEAs do not require prior knowledge of specific phenotypic traits; they are therefore less labor-intensive and more affordable, even for genomes of intermediate sizes, due to decreasing costs of sequencing technologies.
Greenland Halibut, Reinhardtius hippoglossoides (Walbaum, 1792), is a highly-migratory (Vihtakari et al., 2022), cold-water, long-lived, slow-growing, and economically valuable groundfish (DFO, 2021) with a circumpolar distribution throughout the Northern Hemisphere (Vihtakari et al., 2021). It supports several commercial fisheries throughout the Arctic and the North Atlantic oceans as well as in the Estuary and Gulf of Saint Lawrence (EGSL), Canada (Bowering and Brodie, 1995; Bowering and Nedreaas, 2000; Treble et al., 2008; Delaney et al., 2012). Greenland Halibut are known to spawn during winter months (Gundersen et al., 2010). Following emergence, larvae drift along in the upper layers of the water column for a few months and then settle in nursery areas until adult form is reached (Sohn et al., 2010). Knowledge of nursery areas is limited and only a few have been confirmed in the North Atlantic: Disko Bay (Greenland: Stenberg et al., 2016) and the Svalbard archipelago (Albert and Vollen, 2015). In the EGSL, there are two known nurseries described by Ait Youcef et al. (2013), with the main nursery being located in the estuary and the secondary one in the northeast region of the Anticosti Island. In addition to long-distance migration, this groundfish is also known to undertake vertical movements and can make use of the pelagic environment for up to one fourth of an individual’s lifetime (Boje et al., 2014). Both the important larval dispersal and migratory capacity of the species make it difficult to define stock limits and assess connectivity and population dynamics (Jørgensen, 1997; Stenberg et al., 2016; Barkley et al., 2018; Vihtakari et al., 2022, Bassi et al., submitted). Given the growing importance of this fishable resource, several studies have aimed at documenting the population structure of Greenland Halibut in the North Atlantic. However, results have been ambiguous and sometimes contradictory. Studies based on morphological features (Bowering, 1983; Bowering, 1988; Riget et al., 1992), growth and maturity rates (Templeman, 1973; Morgan and Bowering, 1997; Morgan et al., 2003), tag-recovery data (Boje, 2002), physiological patterns and the abundance and prevalence of parasites (Khan et al., 1982; Arthur and Albert, 1993) revealed some differences between sampled localities. In particular, Greenland Halibut from EGSL has been proposed to be a single population distinct from other stocks in the Atlantic based on prevalence of blood parasites (Khan et al., 1982; Arthur and Albert, 1993). Throughout the North Atlantic, previous genetic studies based on either allozymes, microsatellites or few numbers of single nucleotide polymorphism (SNP) have shown some, albeit weak, transatlantic differentiation (Fairbairn, 1981; Riget et al., 1992; Knutsen et al., 2007; Westgaard et al., 2017). Based on microsatellite markers, Pomilla et al. (2008) identified two genetically distinguishable stocks throughout the Northwest Atlantic with a geographic intermingling and a possible admixing suggesting that only a single unit for management through the Northwest Atlantic would be reasonable until more information is available. Similarly, Roy et al. (2014) concluded that a single, panmictic population is present in the Northwest Atlantic. Vis et al. (1997) detected a weak genetic distinctiveness of the EGSL population when compared with the rest of the Atlantic, but this difference was not significant. A recent study based on genotyping-by-sequencing (GBS) approach confirmed the significant distinctiveness of the EGSL and revealed a fluctuating contribution from the Newfoundland – Labrador area to the EGSL stock over the years (Carrier et al., 2020).
In the absence of clear population structure, the Northwest Atlantic Fisheries Organization (NAFO) divided the Northwest Atlantic into separate management units on the basis of limited empirical evidence: (1) Baffin Island – West Greenland (NAFO Subarea 0 + 1 (offshore)), (2) Cumberland Sound and West Greenland fjords (NAFO Divisions 0B and 1B to F), (3) Labrador – eastern Newfoundland (NAFO Subarea 2 + Divisions 3KLMNO), and (4) the Gulf of Saint Lawrence (NAFO Subarea 4) (Vihtakari et al., 2022). While recent stock assessments suggest that the Baffin Island – West Greenland stock is at low risk, with a biomass index above the average throughout the time series 1997 to 2017 (Northwest Atlantic Fisheries Organization 2020a), a recent slight declining trend in exploitable biomass has been observed in the Labrador – eastern Newfoundland stock (Northwest Atlantic Fisheries Organization 2020b), and a decrease of more than 60 % in exploitable biomass has been observed since 2004 in the Gulf of Saint Lawrence stock (DFO, 2019) which corresponds to the southern limit of the species’ distribution.
In this study, the aim was to characterize the genome-wide variation of Greenland Halibut using high-quality whole-genome sequencing data from 1,297 fish sampled from 32 locations across the Northwest Atlantic, from Arctic Canadian and Greenlandic coasts to the Gulf of St Lawrence. Specifically, (i) population genetic structure throughout the Northwest Atlantic was assessed, (ii) connectivity between distinguishable stocks was estimated, (iii) use of genotype-environment association analyses to identify potential candidate genes or loci involved in climate adaptation was made and (iv) environmental association with the genome-wide differentiation observed between stocks was corroborated.
Materials and method
Sampling
With the collaboration of Fisheries and Oceans Canada (DFO) and volunteer fishermen, an extensive sampling was conducted in the Northwest Atlantic Ocean to collect Greenland Halibut specimens throughout its geographical range. A total of 1,366 fish were sampled across 32 locations from the Gulf of Saint Lawrence to Nunavut (in the Canadian Artic) and along the Greenland Coast during summer and fall 2016 and 2017 across 32 localities (mean N = 43, ranging from 17 to 76, Figure 1, Table 1). Fish were caught using benthic trawls as part of the annual multispecies surveys conducted by the Department of Fisheries Organization. Fish were lethally sampled and a part of the pelvic fin was collected and stored in 95 % ethanol (EtOH) until DNA extraction.
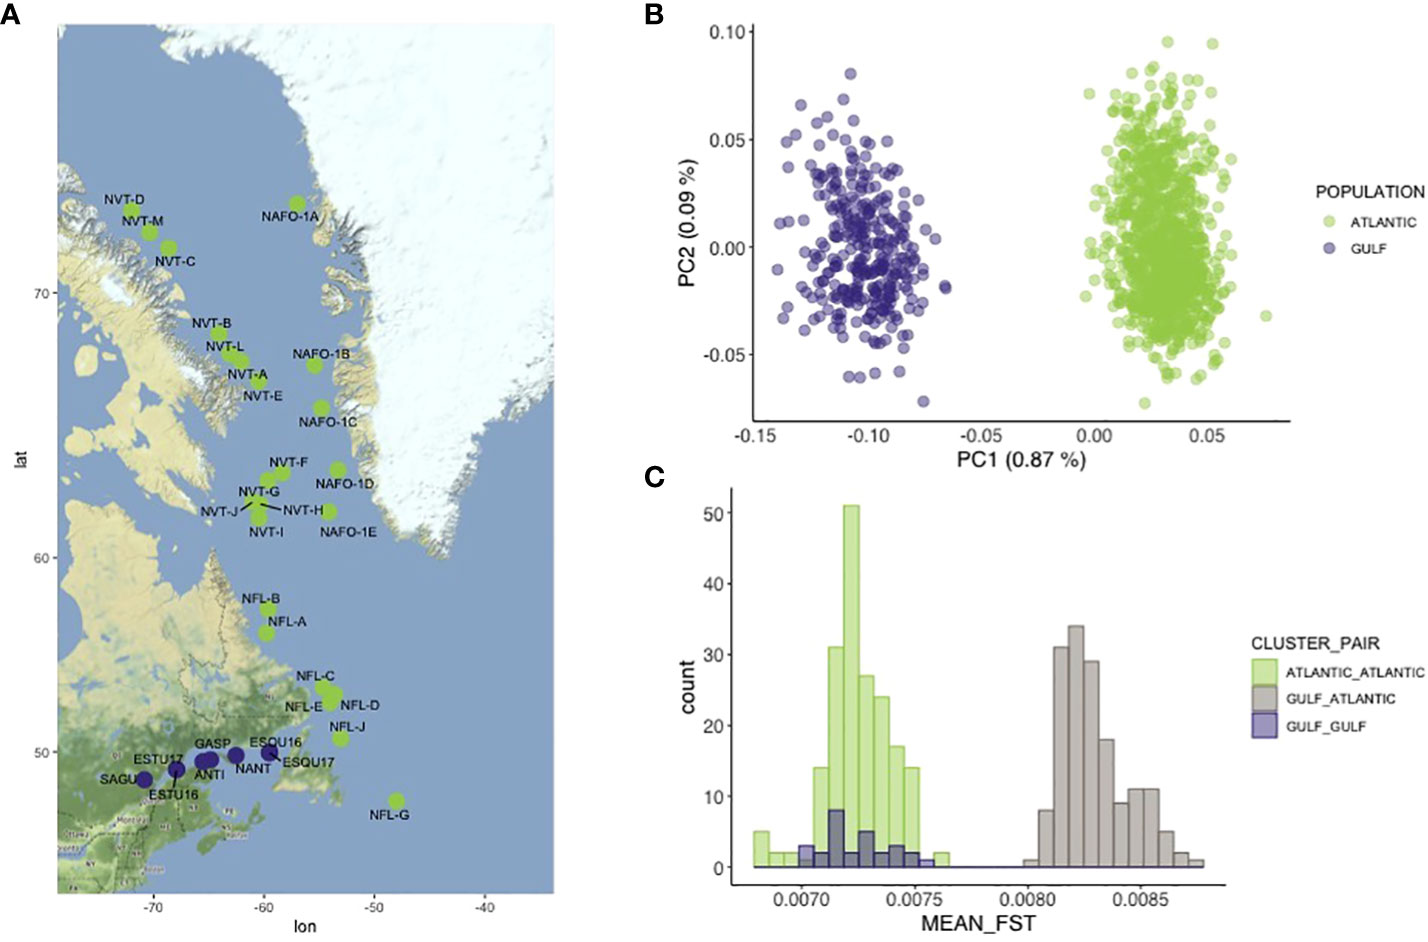
Figure 1 (A) Geographic locations of the 32 sampling sites studied across the Northwest Atlantic. Locations are colored according to PCA results discriminating locations form the Gulf of Saint Lawrence (purple) and locations from the rest of the Northwest Atlantic (green). (B) Two first axis of the principal component analysis obtained without the 18 detected migrants (see main text for detail). (C) Distribution of the global mean pairwise Fst estimated across all sampling localities.
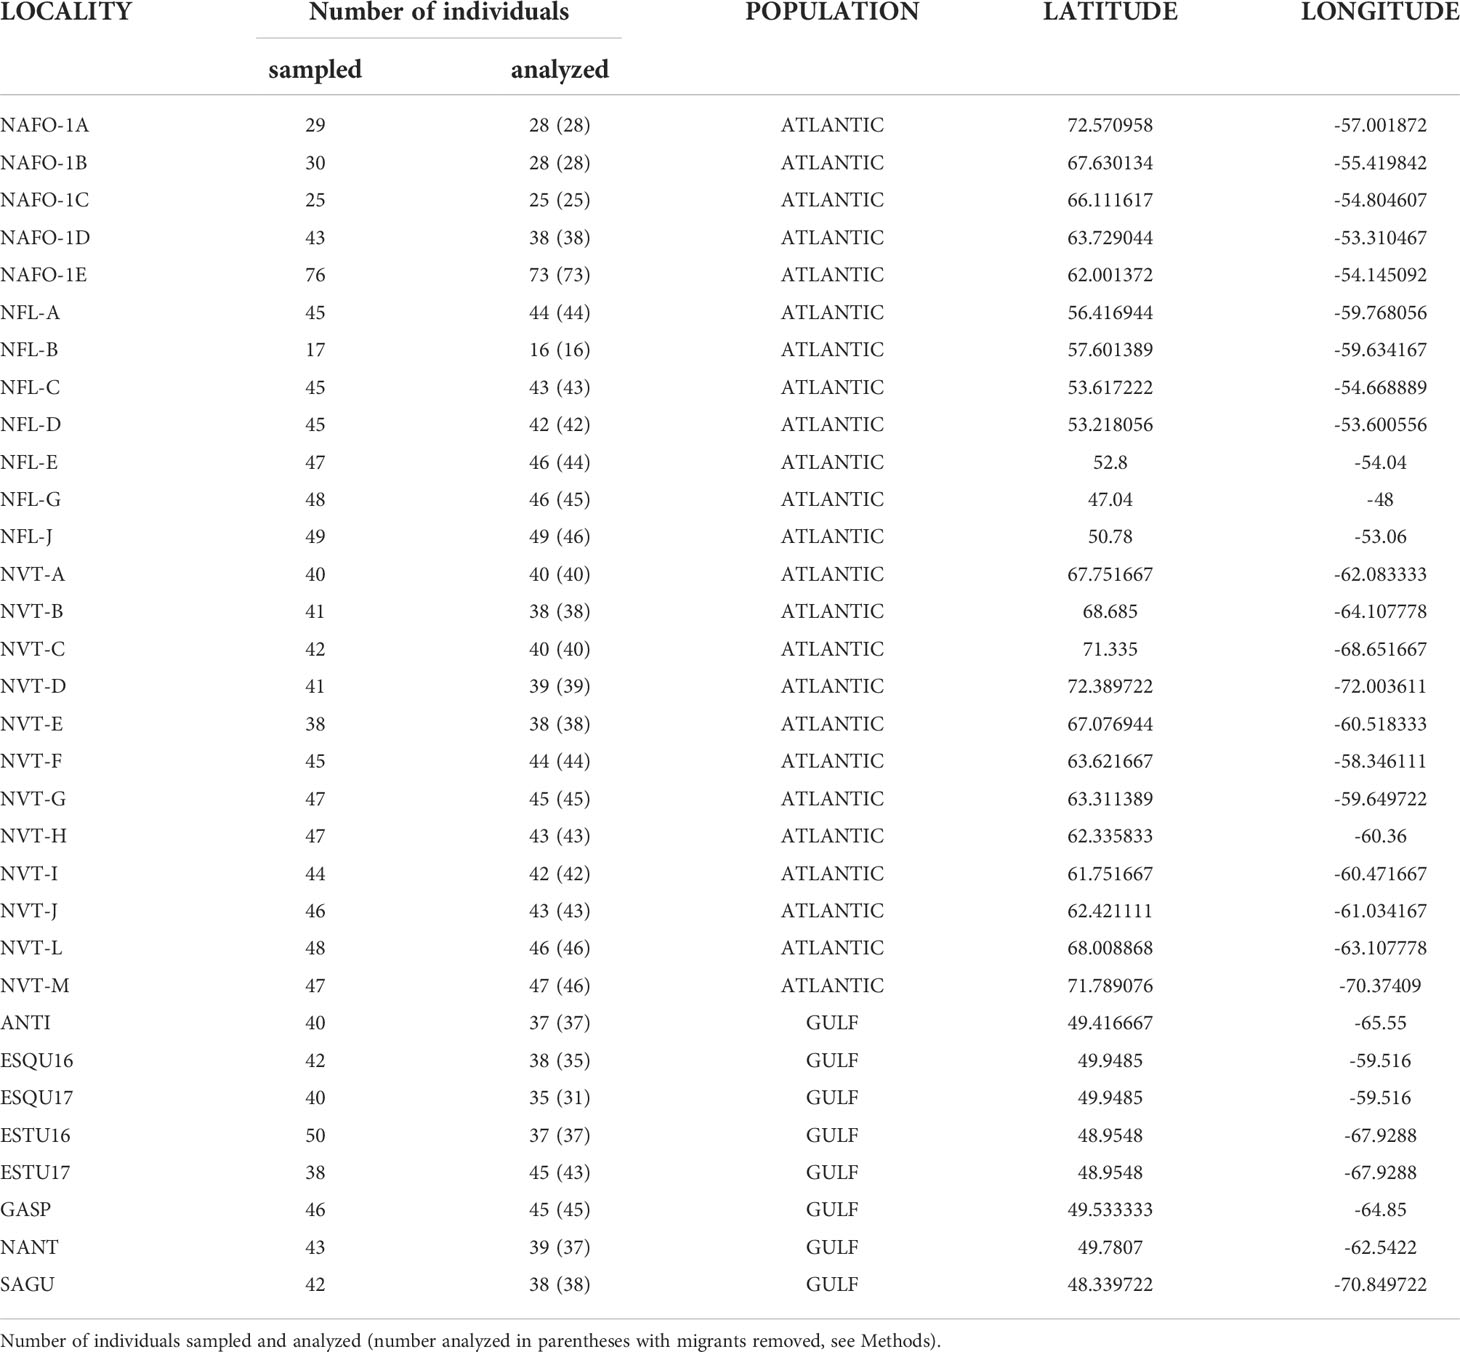
Table 1 32 locations analyzed in this study.
DNA extraction, libraries and sequencing
Genomic DNA was extracted from a fin-clip using a salt-extraction protocol (Aljanabi and Martinez, 1997) with an RNase A treatment (Qiagen). DNA quality of each extract was evaluated with Nanodrop 2000 (ThermoFisher scientific) and migration on a 1 % agarose gel electrophoresis. Following Therkildsen and Palumbi (2016), DNA fragments shorter than 1kb were removed by treating each extract with Axygen magnetic beads in a 0.4:1 ratio and eluting the DNA in 10mM Tris-Cl, pH 8.5. We measured DNA concentrations with the Accuclear ultra high sensitivity dsDNA quantification kit (Biotium) and normalized all samples at a concentration of 5ng/μL. Then, sample DNA extracts were randomized, distributed in plates (96 -well see details about randomization and number of plates used in Supplementary Material) and re-normalized at 2ng/μL.
Whole-genome high-quality libraries were prepared for each sample according to the protocol described in Baym et al. (2015) and Therkildsen and Palumbi (2016). Briefly, a tagmentation reaction using enzyme from the Nextera DNA sample preparation kit (Illumina), which simultaneously fragments the DNA and incorporates partial adapters, was carried out in a 2.5μl volume with approximately 2 ng of input DNA. Then, we used a two-step PCR procedure with a total of 12 cycles (8 + 4) to add the remaining Illumina adapter sequence with dual index barcodes and to amplify the libraries. The PCR was conducted with the KAPA Library Amplification Kit and custom primers derived from Nextera XT barcode sets A, B, C and D (total of 384 possible combinations, see Supplementary Material S1). Amplification products were purified from primers and size-selected with a two-steps Axygen magnetic beads cleaning protocol, first with a ratio 0.5:1, keeping the supernatant (medium and short DNA fragments), second with a ratio 0.75:1, keeping the beads (medium fragments). Final concentrations of the libraries were quantified with the Accuclear ultra high sensitivity dsDNA quantification kit (Biotium) and fragment size distribution were estimated with an Agilent BioAnalyzer for a subset of 10 to 20 samples per plate. Finally, equimolar amounts of 93 to 95 sample libraries were combined into 19 separate pools for sequencing on 19 lanes of paired-end 150bp reads on an Illumina HiSeq 4000 at the Norwegian Sequencing Center at the University of Oslo. Several samples were used in different pools and sequencing lanes in order to test for a putative sequencing lane effect in genetic variation (performing a PCA analysis as described in Ferchaud et al., 2022). No sequencing lane effect was detected and only one replicate for each sample (the one with the highest number of reads) was kept for the subsequent analysis. Given our multiplexing (up to 95 individuals per lane) and genome size (~ 600 Mb), we targeted a low sequencing coverage around 1.26 X in average. Individual samples containing too low or too high number of reads (top 2.5 % and bottom 2.5 %) were discarded from the dataset and subsequent analysis were conducted on 1,297 individuals (mean N per location = 41, ranging from 16 to 73, Table 1).
Sequencing filtering and processing
Raw reads were trimmed, filtered for quality, mapped to the reference genome (Ferchaud et al., 2022), cleaned for duplicates reads and mapping quality and then re-aligned using the pipeline available at https://github.com/enormandeau/wgs_sample_preparation, inspired by (Therkildsen and Palumbi, 2016) and fully described in Ferchaud et al. (2022). Given that more than 96 % of the assembly is comprised into the anchored 24 chromosomes (Ferchaud et al., 2022), raw reads were mapped against a reduced version of the Greenland Halibut reference genome excluding the unassembled scaffolds. Moreover, the sex-linked chromosomes recently identified in this species (chr 10 and chr 21, Ferchaud et al., 2022) were also removed in order to avoid unexpected biases in structuration due to sex-linked markers in further analysis (Benestan et al., 2017). Individuals presenting too low coverage (more than 2sd below the mean) were excluded from the analysis. For low-coverage whole-genome sequencing (lcWGS) data, the recommended practice is to avoid basing downstream analysis on called genotypes (Nielsen et al., 2011) and to use a probabilistic approach based on genotype likelihoods instead. Several models for computing genotype-likelihood-based on read data have been implemented in the program ANGSD (Korneliussen et al., 2014) and it is currently the most widely used and versatile software package for the analysis of lcWGS (Lou et al., 2021). Therefore, ANGSD v0.931 was used for most of our subsequent analyses according to the pipeline documentation available at https://github.com/clairemerot/angsd_pipeline. For all analyses, input reads were filtered to remove reads with a samtools flag above 255 (not primary, failure and duplicate reads, tag -remove_bads = 1), with mapping quality below 30 (-minMapQ 30) and to remove bases with quality below 20 (-minQ 20). We also filtered in order to keep only SNPs covered by at least one read in at least 50 % of individuals (-minInd) and removed SNPs in putative repeated regions allowing a maximum depth of 3 times the number of individuals (-setMaxDepth). Finally, for most of the subsequent analyses (unless mentioned otherwise), we kept SNPs with minor allele frequency above 5 %.
We first ran ANGSD to estimate genotype likelihoods (GL) with the GATK model (-doGlf 2 -GL 2 -doCounts 1), the spectrum of allele frequency (-doSaf 1) and the minor allele frequency (-doMaf 1) options. The major allele was based on the genotype likelihood and was the most frequent allele across all samples (-doMajorMinor 1). From this first analysis, we generated (i) a beagle file with GL estimates and (ii) a list of variants passing those filters and their respective major and minor alleles that were used for most subsequent analyses. The R program (R Core Team, 2020) was employed for graphic output in subsequent analyses, via the package ggplot (Wickham, 2016).
Clustering analysis
Genome-wide variation across samples was explored using PCAangsd (Meisner and Albrechtsen, 2018) on the genotype likelihoods. This program extracts a covariance matrix that is then decomposed into principal component analysis (PCA) with R, using a scaling 2 transformation adding an eigenvalues correction, to obtain the individual PC scores (Legendre and Legendre, 1998). Two clusters were identified by this analysis (on PC1, see results section). 18 of the 1,297 individuals were not correctly assigned to their geographic cluster and were considered migrants between the Gulf and the Northwest Atlantic. These migrants were confirmed using another clustering identification approach. To do so, NGSadmix (Skotte et al., 2013) was run with K = 2 (the K numbers revealed by the PCA above) to estimate admixture proportions across individuals. Once confirmed by the two approaches (PCAangsd and NGSadmix), migrants were removed before conducting a new PCA analysis and subsequent analyses.
Genome-wide pairwise FST comparisons was estimated in two rounds. First, in order to avoid bias due to lower numbers of samples, only locations with sample sizes above 30 were kept (28 locations out of 32, see Table 1) and pairwise FST estimations were performed (378 comparisons in total). A bimodal distribution of the mean global FST values from those 378 comparisons confirmed the existence of the two populations revealed by the PCA (Figure 1C). The presence of Isolation-By-Distance (IBD) was tested using a correlation between genomic differentiation estimates (FST/(1- FST)) and log (geographic distance) (Rousset, 1997) across the sampled locations. Secondly, estimation of genome-wide FST was conducted between these two identified populations (Gulf versus Northwest Atlantic) in order to detect any genomic regions implied in this differentiation. To achieve this, individuals were pooled into two groups accordingly to the results of the PCA and, in order to avoid bias due to sample size differences between the two groups, the largest group (Northwest Atlantic) was randomly sub-sampled to 303 individuals, the number of samples available for the Gulf. To perform genome-wide FST estimations, allele-frequency spectrum (-doSaf 1) and minor allele frequencies were calculated for each locality (or population in the second round) with the previous list of variant positions (-sites) and their polarisation as major or minor alleles (-doMajorMinor 3). Then, genome-wide FST was estimated using the realSFS function in ANGSD between localities and then summarized across sliding-windows of 25Kb with a step of 5Kb.
Given that recent studies have documented the increasing importance of structural variants in genome diversity, and notably chromosomal inversions (Wellenreuther and Bernatchez, 2018), including in marine species (e.g. Berg et al., 2016; Cayuela et al., 2020), we scanned the genome for putative inversions or non-recombining haploblocks. To do so, we first ran localPCAs (Li and Ralph, 2019) with PCAangsd on genotype likelihoods in non-overlapping windows of 200 SNPs in each chromosome to extract local covariance matrices and obtained local PCAs of genomic variation (as detailed above). We then used the R package Lostruct (Li and Ralph, 2019) which measures the similarity between local PCA (PC1 and PC2 for each 200 SNP window) using Euclidean distances. Similarity was mapped using multidimensional scaling (MDS) of up to 20 axes. Clusters of outlier windows (presenting similar PCA patterns) were defined along each MDS axis as those with values beyond 4 standard deviations from the mean, following (Huang et al., 2020). Adjacent clusters with less than 20 windows between them were pooled, and clusters with less than 5 windows were not considered. Different window sizes (from100 to 1000), different subsets of PCs (1 to 3 PCs) and different thresholds yielded consistent results. A typical signature of a polymorphic inversion is three groups of individuals appearing on a PCA: the two homokaryotypes for the alternative arrangements and, as an intermediate group, the heterokaryotypes. All clusters of outlier windows were thus examined either by a PCA as single blocks, or divided into several blocks when discontinuous.
Environmental association/adaptation
Recent values (2000 - 2014) for 14 environmental variables were extracted as monthly averages from Bio-Oracle (Tyberghein et al., 2012), one of the most commonly used global environment datasets for marine species (data used were updated on September 3th 2021). Mean surface layer values were obtained for the following variables: temperature, salinity, current velocity, ice thickness, chlorophyll, dissolved oxygen, nitrate, phosphate, phytoplankton and silicate. Mean benthic layers were also collected for variables showing variation at maximum depth across locations (i.e., current velocity, dissolved oxygen, temperature and salinity). Layers were imported into ArcGIS and values at each geographic coordinate corresponding to Greenland Halibut sampling locations were extracted using the “Extract Values to Points” tool implemented in the program.
Two regression approaches were used to investigate GEA, utilizing matrices of dependent and independent (explanatory) variables. The explanatory matrix contained environmental variables and the dependent matrix contained genotypic data (here a matrix of minor allele frequencies by sampling locations). From the 28 locations containing more than 30 individuals, we excluded two locations that were sampled across two consecutive years at the same location (ESTU17 and ESQU17) as well as the SAGU locality, for which environmental data was not available in the Bio-Oracle database. We thus aimed to identify SNPs associated with both surface and benthic variables among Greenland Halibut from different sampling locations. First, Redundancy Analysis (RDA) was conducted as a multi-locus GEA method to detect loci under selection (Forester et al., 2018). The function “rda” was used to compute the RDA on the model for each collected environmental variable independently (see Laporte et al., 2016; Le Luyer et al., 2017 and Ferchaud et al., 2020 for examples of similar methodology). An analysis of variance (ANOVA; 1,000 permutations) was then performed to assess the global significance of the RDAs, and the percentage of variance explained (PVE) was computed with the function “RsquareAdj”. When not mentioned, R functions were part of the VEGAN package (Oksanen et al., 2020). Only significant environmental variables were retained (Table S2) and correlation between them was tested with a Pearson correlation test. Correlated variables (with a Pearson coefficient > 0.7) were reduced by performing a PCA and retaining significant PCs following the Kraiser-Guttman and Broken Stick model (Borcard et al., 2011) (See Supplementary Material S3). Final redundancy analyses were then performed on each group of correlated variables and resumed by a PCA. SNPs linked to environmental variables were then defined following instructions from the online tutorial proposed by Brenna Forester (Forester et al., 2018; https://popgen.nescent.org/2018-03-27_RDA_GEA.html). We defined outliers as loci with loadings outside of 3 standard deviations from the mean (two-tailed p-value = 0.0027). The distribution of those outliers throughout the genome was explored by plotting the absolute value of the SNPs loadings on a Manhattan plot using gglplot2 library in R. For our second GEA method, we used Latent Factor Mixed Models (LFMMs), as implemented in the lfmm2 R package (Cayle et al., 2019) on the environmental variables defined as significant by the RDA analyses. The number of latent factors was set equal to K =2, corresponding to the elbow value in the PCA scree plots as evaluated from a PCA on a LD-pruned dataset. False discovery rate was assessed following the recommendations of François et al. (2016), using a Benjamini-Hochberg correction. The log10 of the p-value of SNPs was plotted on a Manhattan plot using the gglplot2 library on R. Finally, in order to assess how environmental conditions may modulate the extant of genetic differentiation between Greenland Halibut from the Gulf of Saint Lawrence and the Atlantic, a linear regression was performed between the number of SNPs harboring Fst values above 0.05 and the numbers of outliers detected both by RDA and LFMM (fdr= 0.01) approaches across the chromosomes, using the GLM function implemented in R with a binomial variance and logit link.
Migration estimations
The pattern of migration between the two observed populations was assessed using fastsimcoal2 (Excoffier et al., 2021). Fastsimcoal2 is a continuous time coalescence-based genetic simulation program that enables the estimation of demographic parameters under flexible scenarios from the site frequency spectrum (SFS) under a maximum-likelihood approach. Site frequency spectrum is defined as the sampling distribution of allele frequency at any random polymorphic locus in the genome and is commonly used for inferring population genetic parameters (Chen et al., 2007; Chen, 2012). SFS-based methods have received considerable great interest since the emergence of next generation sequencing, particularly due to computing time of these methods being independent of the length of the genome being analyzed (Gutenkunst et al., 2009; Chen, 2012). Moreover, several approaches of fitting the SFS using exact derivations or approximations have been developed (Gutenkunst et al., 2009; Excoffier et al., 2013, Liu and Fu, 2020) and it has been shown that the expected SFS could be robustly estimated using coalescent simulations (Excoffier et al., 2013). The statistics summarized in the SFS can also be considered for multiple populations and corresponds to the joint distribution of allele frequencies across di-allelic variants (joint SFS). SFS and joint SFS can be predicted from low-coverage data notably through the use of the genotype likelihood approach implemented in ANSGD (Nielsen et al., 2011).
Site allele frequency was first estimated for each of the two populations (Gulf of Saint Lawrence and the Atlantic) using -dosaf 1 in ANGSD with the GATK model (-GL 2), and the command -anc referring to the Greenland Halibut reference genome (Ferchaud et al., 2022). No minor allele frequency filter was applied since variants present in low frequency could be highly informative on demographic history. We kept only SNPs covered by at least one read in at least 80 % of individuals (-minInd) and removed SNPs in putative repeated regions, allowing a maximum depth of 3 times the number of individuals (-setMaxDepth) to filter putative genotyping error and paralogous. The realSFS function was then performed to get an unfolded joint SFS. This joint SFS was projected in the δaδi program (version 1.6.3 Gutenkunst et al., 2009) to remove missing data before being converted to a fastsimcoal2 format using a custom script. Estimating demographic parameters is highly time consuming for large sample sizes, therefore each population was randomly reduced to 100 individuals. The resulted observed joint SFS was then fed into fastsimcoals2 while an expected joint SFS was estimated under a model of two populations (with constant effective size) connected by gene flow. While recent studies have pointed out that failure to include complex parameters in extensive simulations can lead to biases in parameter estimations (e.g. Momigliano et al., 2021), the objective of this analysis was to get relative migration rates between the two groups rather than to get a comprehensive picture of the demographic history and we decided to use a simpler model. Effective size of the two populations (NPOP1 and NPOP2 uniformly distributed between 100 and 100 000) and migration rates between them (MIG21 and MIG12) were the parameters of the model. This model was replicated 100 times, simulating 200,000 coalescents (-n 200000), and containing at least 10 observed SFS entry counts (-C 10) over 40 optimization cycles, to estimate demographic parameters by maximum composite likelihood (-M) using the –nosingleton option to exclude genotyping error. Point estimates of the different demographic parameters were selected from the runs with the highest maximum composite likelihood.
Finally, we calculated interval confidences of parameter estimates from 10 parametric bootstrapped join SFS, and re-estimating parameters each time. The outputs of the 10 independent fastsimcoal runs from the 10 bootstrapped Join SFS were individually examined before being pooled together. For each run, the difference between the maximum likelihood estimated from the model and the maximum likelihood observed from the join SFS was calculated and only runs expressing the lowest difference (i.e., in the plateau with the lowest values) were retained. Estimated parameters of the retained runs were pooled together over the 10 independent runs to get confidence interval.
Results
After mapping the reads of 1,366 Greenland Halibut samples to the reference genome, cleaning for quality and processing for SNP identification with genotype likelihoods, we identified 5,347,751 single nucleotide polymorphisms (SNPs) with a minor allelic frequency (MAF) above 5 % across the 1,297 individuals with adequate coverage (see Material and Method section).
Differentiation between Gulf of Saint Lawrence and Northwest Atlantic
Genome-wide variation analyzed by a global PCA displayed two clusters, with PC1 explaining 0.86 % of the total genetic variation (Figure S1A). Those two clusters were respectively composed of the individuals from the Gulf and those inhabiting the rest of the Northwest Atlantic. Other PC axes did not reveal additional clusters. In particular, this suggests that there is no genetic differentiation between fish from the Canadian and Greenlandic waters, suggesting that they form a single panmictic population (Figure S1A). However, 18 individuals that were not correctly assigned to their respective geographic clusters were detected. It is suspected that these individuals could be migrants between the Gulf and the Northwest Atlantic (Figure S1B). When the PCA was re-run without the migrants, it displayed the same two distinct groups composed of individuals from the Gulf on one side and individuals from the rest of the Northwest Atlantic on the other side, with PC1 explaining 0.87 % of the genetic variation (Figure 1B).
Pairwise genome-wide FST estimations performed across sampling localities corroborated this clustering result. The distribution of mean estimates revealed two non-overlapping modes of FST values corresponding to (i) mean pairwise FST estimates among sampling locations within each group and (ii) mean estimates among sampling locations between the two groups (Figure 1C). Pairwise genome-wide FST between Gulf and Northwest Atlantic exhibited higher and non-overlapping values (median = 0.0083, range: 0.0080-0.0087) than estimates within the Gulf (median = 0.0072, range 0.0070-0.0075) or estimates within Atlantic (median = 0.0072, range: 0.0067-0.0075). No evidence of isolation by distance was detected, either between Gulf and Northwest Atlantic (r2 adj = 0.006369, p-value = 0.1575) or within the Gulf (r2 adj = 0.03719, p-value = 0.1648), although a very weak but not significant relationship within the Northwest Atlantic cluster was found between geographical distance and genetic differentiation (r2 adj = 0.009861, p-value = 0.09122, Figure S2).
Genome-wide FST estimations between the Gulf and the Atlantic revealed low levels of genetic differentiation along the genome (mean FST = 0.0018, range:0.00023-0.32). This mean global FST between the two groups could appear low compared to the mean estimates among sampling localities between the two groups (median Fst = 0.0083). In Supplementary Material S2, we show that this effect is attributed to the sample sizes used: 30 versus 30 individuals when estimating pairwise localities compared to 303 versus 303 individuals when estimating FST between the two groups. However, several peaks of differentiation were found along the genome (Figure 2). In particular, three sliding-window peaks exhibited FST values above 0.05, respectively in Chr03 (maxFST = 0.25), Chr05 (maxFST = 0.054) and in Chr23 (maxFST = 0.063). Figure S3 displays the SNP FST values for 200 Kbp windows surrounding these peaks as well as other regions revealing highest Fst values (FstChr03 = 0.30, FstChr05 = 0.18, FstChr07 = 0.17, FstChr12 = 0.18, FstChr15 = 0.15 and FstChr23 = 0.32).
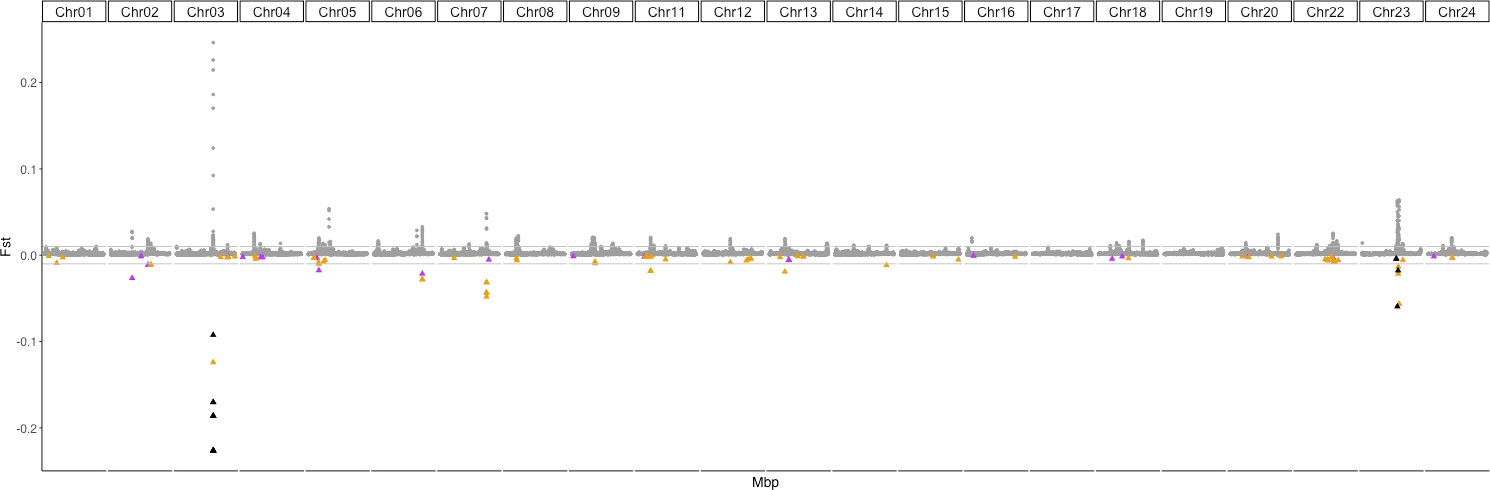
Figure 2 Genome-wide Fst differentiation estimated between fish from the Gulf of Saint Lawrence and the Northwest Atlantic in sliding windows of 25 Kb within each chromosome (sex-linked chromosomes, Chr 10 and Chr21 (Ferchaud et al., 2022) have been removed. Horizontal grey lines indicate Fst values of 0.01 and -0.01. Colored triangles correspond to outliers found in association with environmental variables by the RDA and LFMM (fdr = 0.0001) approaches. For clarity, Fst values of those SNPs have been reported in negative values as triangles. Purple triangles correspond to sliding windows containing SNPs found in association with bottom dissolved oxygen, those in yellow correspond to the sliding windows presenting SNPs associated with temperature-related variables. Black triangles identify sliding windows containing SNPs putatively in association with both the bottom dissolved oxygen and temperature-related variables and non-outliers in dark grey dots.
We retrieved 25,000 pb flanking regions upstream and downstream of the genomic location of the three SNPs exhibiting high Fst, based on the reference genome, to search for coding regions. The search was conducted using the database Nucleotide collection (nr/nt) using Megablast on the NCBI Blast + platform (Camacho et al., 2009). In Chr03, a match with a transcript of the green-sensitive opsin gene was found (99.51 % and 99.67 % of identity with Atlantic Halibut (Hippoglossus hippoglossus) and Pacific Halibut (Hippoglossus stenolepsis) transcripts respectively), in Chr05 the best hit was with the RIC8 guanine nucleotide exchange factor B transcript (94.99 % of identity with Atlantic and Pacific Halibut transcripts), in Chr07 the putative translation initiation factor eIF4E (81.75 % identity with the turbot, Scophtalmus maximus), the zinc finger protein 365 transcript (93.69 % of identity with Pacific Halibut) and the guanylate cyclase activator 1d (guca1d, 92.91 % of identity with Atlantic Halibut) were respectively the best hit for Chr12 and Chr15 and the transcript of the 24-dehydrocholesterol reductase (dhcr24) matched with the highest peak of differentiation in Chr23 (with 92.65 % of identity with the Japanese flounder (Paralichthys olivaceus) transcript).
Lostruct analysis detected five outlier genomic windows along the genome, respectively on Chr05, Chr06, Chr13, Chr19 and Chr23 displaying three distinct clusters in each that could represent the signature of an inversion (Figure S4). However, there was no variation in the geographic distribution of the different karyotypes for any of those putative structural variants, suggesting that there are not involved in the differentiation between fish from the Gulf and those from the rest of the Northwest Atlantic.
Genotype-environment association
Out of 14 environmental variables tested, seven were found to be significantly associated with genomic variation in Greenland Halibut using the RDA; two variables at maximum depth (bottom temperature and bottom dissolved oxygen) and five environmental variables at the surface of the sea (surface temperature, surface salinity, surface chlorophyll, surface phytoplankton and surface nitrate) Table S2. Pairwise Pearson correlation tests conducted among those seven variables revealed that six of them were highly correlated (r > 0.7, Supplementary Material S3). Only bottom dissolved oxygen was not highly correlated to the other variables (mean coefficient correlation with other variables = 0.45). Variation brought by the 6 related variables, hereafter denoted as “temperature-related” variables, was resumed by the first axis of a PCA (explaining more than 77% of the variation, see Supplementary Material S3) and relative loadings of each locality were then used to perform the final RDA. An RDA performed with the bottom dissolved oxygen was also used to detect outliers specifically associated with this variable. A total of 2,097 SNPs was detected as putative temperature-related outliers, whereas 1,851 SNPs were detected as putative oxygen-related outliers. For both variables, putative outliers were spread all along the genome (Figure S5). SNPs in association with environmental variables were also detected by LFMM. While considering a very conservative false discovery rate of 0.0001 in order to exclude putative false positives, a total of 95 SNPs was detected to be associated with temperature-related variables and 41 were associated to the bottom dissolved oxygen. All of those putative oxygen-related outlier SNPs were also detected by the RDA approach, while 94/95 of the putative temperature-related were in common with RDA outliers. With a less conservative false discovery rate (fdr = 0.01), 537 SNPS were detected as putatively associated with temperature-related variables and 282 SNPs putatively associated with the bottom dissolved oxygen and more than 92 % of them (respectively, 497/537 and 262/282) were confirmed by the RDA. As for the RDA analysis, outliers detected by LFMM were widely distributed throughout the genome but they were more concentrated in Chr 3 and Chr 23 (Figure 3). Moreover, while most of the outliers detected by both GEA analyses were unique to a single environmental variable, 15 of them were shared between the temperature and the bottom dissolved oxygen. All of those 15 putative outliers were located within the two most highly differentiated genomic regions between the Gulf and the Northwest Atlantic (Chr 03: 17,709,400 bp and Chr23: 9,606,635 bp, Figure 3). 80 % of them (12 out of 15) were located within a 21,000 bp region of Chr03 (Chr03: 17,709,400 bp, Figure 3) and the remaining SNPs (3 out of 15) were located in Chr23 (Chr23: 9,606,635 bp). Finally, a significant positive correlation was found across the chromosomes between the number of outliers associated with environment variables and the number of SNPs with high Fst values (Figure 4, = 0.51, p-value = 1.27 10-4).
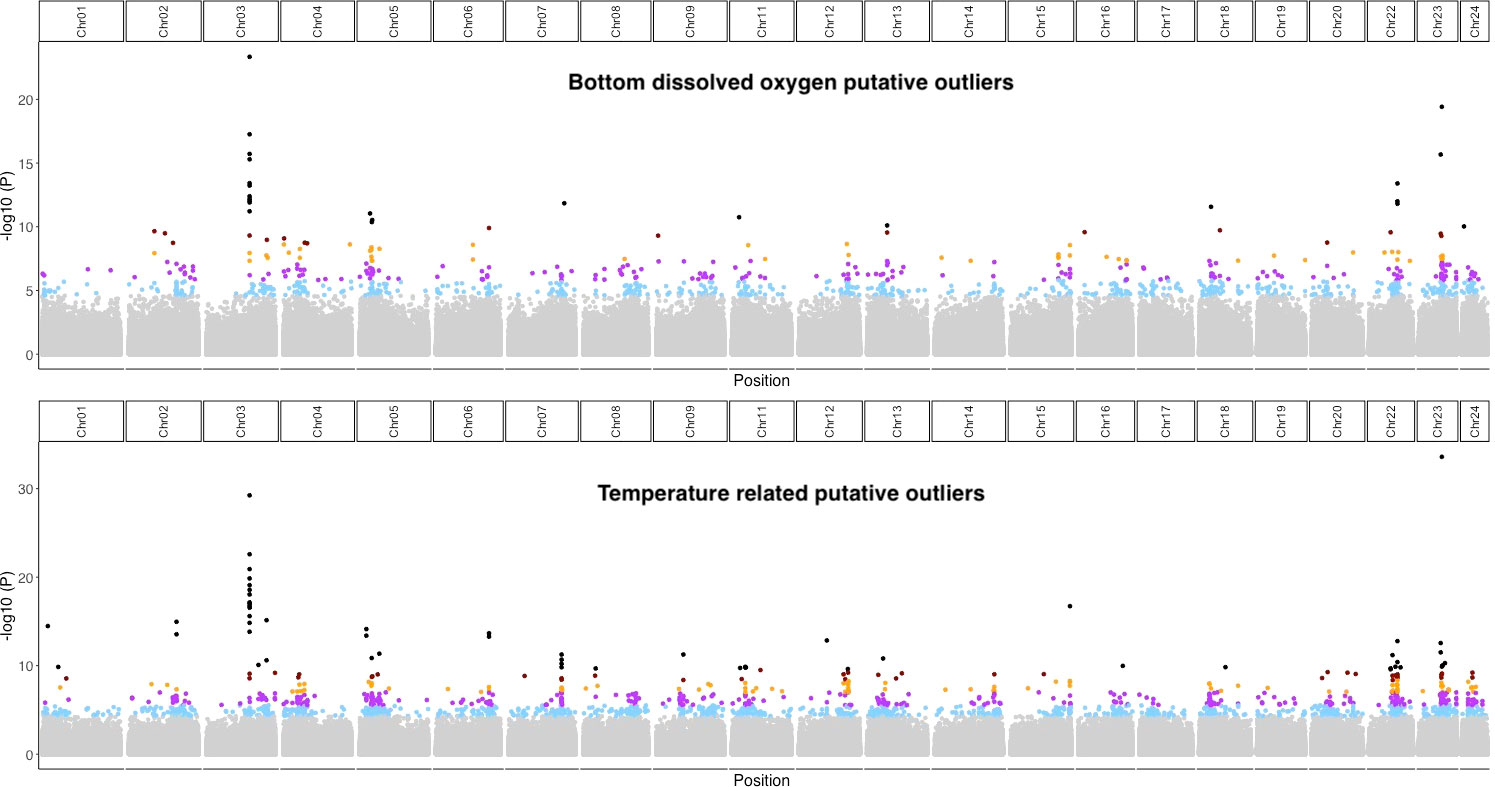
Figure 3 Genome-wide Environmental Association detected by LFMM 2 with bottom dissolved oxygen (upper panel) and temperatures related variables (lower panel). The Manhattan plot show the -log10 of the p-value provided by LFMM2 for each SNP. Dots are colored according to False Discovery Rate (black:< 0.00001, brown:<0.0001, orange:< 0.001, purple:< 0.01, light blue:< 0.05 and grey: no outliers).
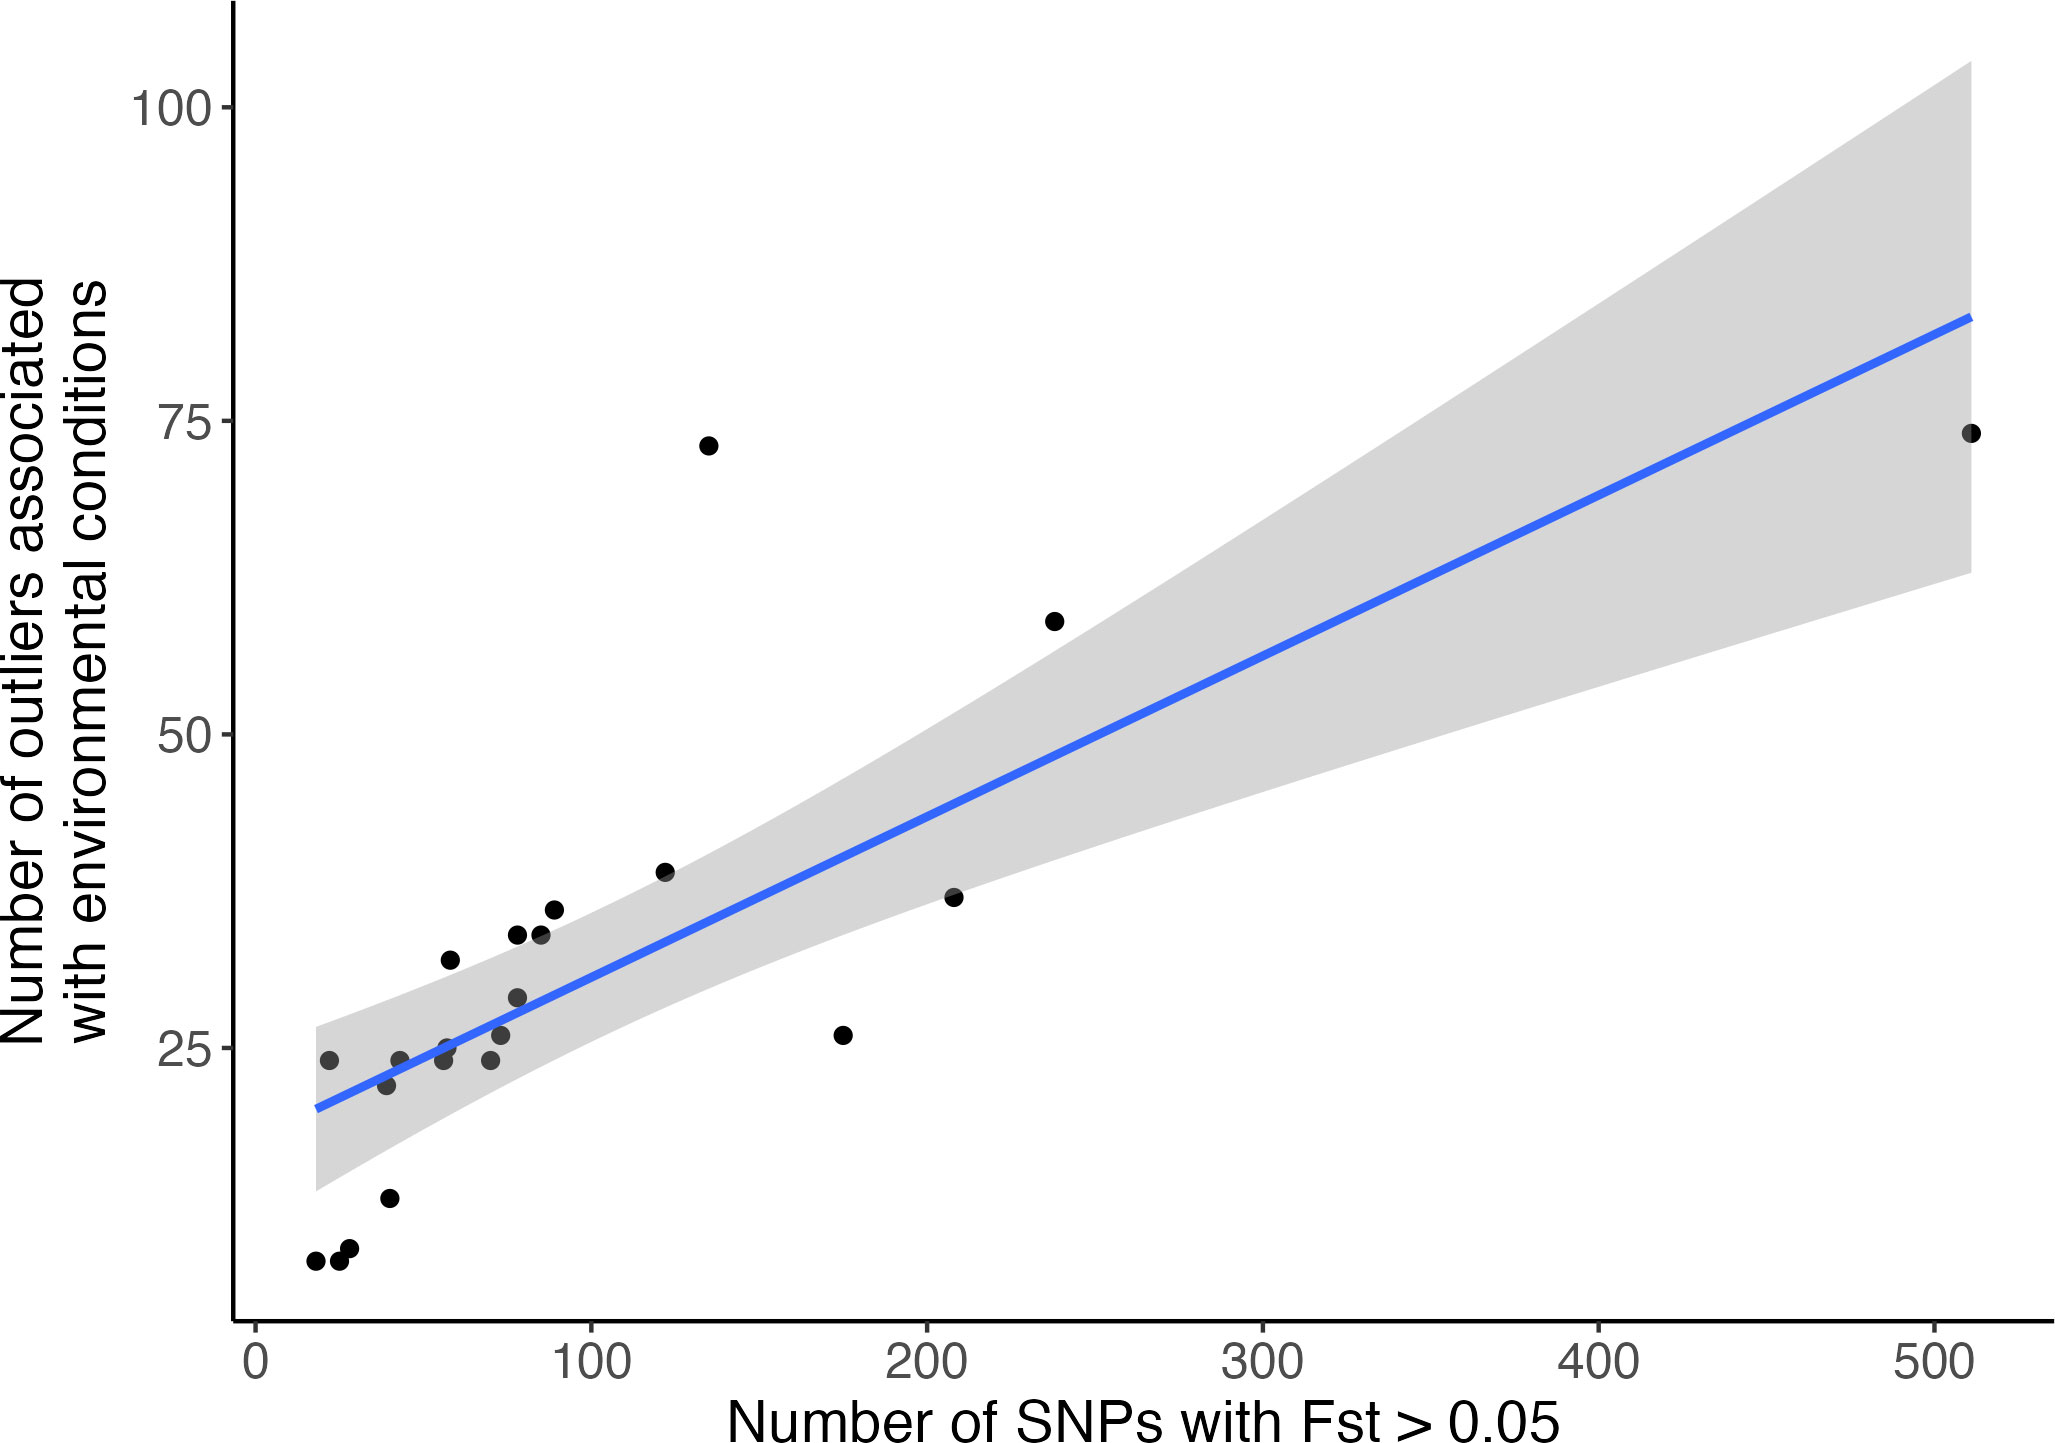
Figure 4 Relationship between the number of SNPs with Fst estimates higher than 0.05 and the number of SNPs detected in putative association with both bottom dissolved oxygen and temperature-related variables for each chromosome (adjusted r-squared = 0.51, p-value = 1.26e-04).
Migration between the Gulf and the Northwest Atlantic
Migration rate (proportion of migrants per generation) from the Northwest Atlantic to the Gulf (mAtl_Gulf =0.0022 [0.0020; 0.0024]) was significantly higher than the migration rate from the Gulf to the Northwest Atlantic (mGulf_Atl=0.0017 [0.0015; 0.0019], t= -2.629, p-value = 0.008). According to the following estimated effective size, NGulf = 47,517 [45,083; 49,951] and NAtl = 57,757 [55,135; 60,378], significantly more migrants per generation were estimated to move from the Northwest Atlantic to the Gulf (63 [54; 72]) than in the other direction (41 [34; 48]). Empirical numbers of migrants detected by clustering analyses also report an asymmetric gene flow between the two populations. Seven migrants were observed in the Northwest Atlantic (sample size =983), whereas 7 migrants were detected in the Gulf (sample size = 314), leading to a higher proportion of migrants detected from Northwest Atlantic to the Gulf (10/314 = 0.03), than from the Gulf to the Northwest Atlantic (7/983 = 0.007).
Discussion
In this study, we conducted the first genome-wide investigation of genomic variation in Greenland Halibut, sequencing the whole genome of 1,297 individuals distributed throughout the Northwest Atlantic. This high genomic resolution allowed us to statistically confirm the previously supposed specificity of the Gulf stock and to determine that the divergence is mainly driven by environmental variables such as sea temperature, salinity and oxygen levels. As a result, the Gulf stock could be particularly vulnerable to the environmental changes that are expected in the context of a warming climate. Altogether, our results revealed a pattern of spatial selection in a marine fish species with high dispersal potential that will help support the management of this important exploited species.
Significant divergence between two stocks
Our analysis of population structure identified a weak but significant divergence between Greenland Halibut from the Gulf and those from the Northwest Atlantic. The small proportion of genomic variation explained (0.87 %), and low differentiation observed between the two stocks (mean FST = 0.0018), are both consistent with the weak structuration identified in other highly dispersed marine species (Jiménez-Mena et al., 2020; Le Moan et al., 2021) and often referred to as ‘cryptic structuration’ (Benestan et al., 2015; Le Moan et al., 2021). For example, Kess et al. (2021) identified a similar structure in Atlantic Halibut (Hippoglossus hippoglossus), based on 86,000 SNPs defined by restriction-site associated DNA sequencing, and estimated a lower genomic differentiation between the Gulf and adjacent areas on the continental shelf than we found for the Greenland Halibut (Atlantic Halibut; meanFST = 0.0005, minFST = 0, maxFST = 0.068 versus Greenland Halibut; meanFST = 0.0018, minFST = 0.00023, maxFST =0.32). This difference between the two species could be attributed to intrinsic biological features (notably, Atlantic Halibut spawn in nearshore waters along the west coast of Newfoundland (e.g. Belle-Isle Strait) that is geographically intermediate between the Northwest Atlantic and the Gulf (Le Bris et al., 2018), while the main Greenland Halibut spawning area is presumed to be in the Davis Strait (Gundersen et al., 2010). Alternatively, the two different genomic approaches to cover the genomic variation could explain the difference in observed Fst values between the two studies. The whole-genome screening we used enabled finding all the SNPs that were differentiated, including in the very restricted genomic regions explaining most of the differentiation between the two groups (see below for the discussion about those differentiation peaks). It is likely that a restricted approach like the one used for the Atlantic Halibut would miss such narrow regions, potentially leading to a lower average differentiation. Moreover, the high sample size used in our Fst estimations (303 individuals for each population) reduces the stochasticity that comes with to low sampling sizes and this could also lead to more power to find the differentiation peaks (Supplementary Material S2). Previous studies conducted on Greenland Halibut were based either on allozymes (Fairbairn, 1981; Riget et al., 1992), 12 microsatellites (Roy et al., 2014), or 96 SNPs (Westgaard et al., 2017). They reported an absence of structure and even claimed panmixia throughout the Northwest Atlantic (Roy et al., 2014). However, the reversal in relative frequency of the two most abundant mitochondrial haplotypes highlighted by Vis et al. (1997) did hint at a genetic difference between the Gulf of Saint Lawrence and the Atlantic. Recently, Carrier et al. (2020) used a Genotyping-by-Sequencing approach to reveal significant genetic differences between Greenland Halibut living in the Gulf and two offshore locations in Newfoundland. In this study, we have elucidated the genomic structure for Greenland Halibut throughout the Northwest Atlantic by covering the entire genomic variation across 1,297 individuals. In addition to confirming the significant specificity of the Gulf, we also observed an absence of distinction between Greenland Halibut from the Canadian and Greenland waters. This result suggests extensive mixing along the slope of the entire North Atlantic continental shelf where Greenland Halibut occurs. In addition to analyses of spatial distribution of settling larvae showing that larvae from geographical separate spawning areas could intermix (Stenberg et al., 2016), tagging studies indicate that mixing occurs between stock areas at juvenile and adult life-stages (Vihtakari et al., 2022). Our study fills gaps related to lack of knowledge about stock structure in Greenland Halibut and allows for the first time to conclude that Greenland Halibut occurring from NAFO Subareas 0 to 3 could be managed as a single unit.
Moreover, the absence of Isolation-By-Distance observed throughout the Gulf and the Northwest Atlantic, confirms the panmictic situation of Greenland Halibut in the Northwest Atlantic and is consistent with what we know about Greenland Halibut migratory behavior, in that the spatial scale within each stock is within the dispersal capabilities of this species. Indeed, Greenland Halibut of the Northwest Atlantic are highly migratory; fish tagged and released in Davis Strait, Baffin Bay, and the fjords of southwestern and eastern Greenland have moved south and been caught on the northern slopes of the Grand Bank of Newfoundland and as far east as Denmark Strait (between Greenland and Iceland) (Boje, 2002; Vihtakari et al., 2022).
Environment association
Despite high effective population sizes and connectivity between the two clusters, our results revealed a significant genetic differentiation between the Gulf and the Northwest Atlantic. This observation suggests that natural selection, in addition to genetic drift, might have driven contemporary Greenland Halibut population structure in the Northwest Atlantic. Our results revealed that environmental variables explain 51 % of the differentiation between the two populations. Specifically, we found that both temperature-related variables (bottom temperature, surface temperature, surface salinity, surface nitrate and primary productivity, estimated with phytoplankton and chlorophyll) and bottom dissolved oxygen represent key selective agents that appear to drive adaptive divergence between the Gulf and the Northwest Atlantic. Marine landscape genomic studies combining traditional landscape approaches with large genomic datasets have identified significant associations between environmental variables and genetic structure in other marine species such as Atlantic Herring (Clupea harengus) (Limborg et al., 2012), Atlantic cod (Gadhus morhua) (Berg et al., 2015), eastern oyster (Crassostrea virginica), purple sea urchin (Strongylocentrotus purpuratus) (Pespeni et al., 2013), sea scallop (Placepecten magellanicus) (Van Wyngaarden et al., 2018), sea cucumber (Parastichopus californicus) (Xuereb et al., 2018), European hake (Merluccius merluccius) (Milano et al., 2014), American Lobster (Homarus americanus) (Benestan et al., 2015; Dorant et al., 2020) and flatfish species such as Sole (Solea solea) (Diopere et al., 2018) and Atlantic Halibut (Hippoglossus hippoglossus) (Kess et al., 2021). In the Northwest Atlantic, based on a climate-associated multispecies cryptic cline, Stanley et al. (2018) revealed a biogeographic break along with a steep climatic gradient driven by temperature.
Strong selection acting on individual locus
Outliers in association with environmental variables have been discovered all along the genome and it is noteworthy that every high peak of differentiation between the two populations is associated with environmental variation (Figure 2 and Figure 4). Each of the two highest peaks (located in Chr03 (Fst = 0.30) and Chr23 (Fst = 0.32)) harbors SNP outliers associated with both the temperature-related variables and the bottom dissolved oxygen. The striking differences in allele frequencies between the two identified populations suggests that these restricted genomic regions as well as the other highly differentiated regions (like the ones found in Chr5, 7, 12 and 15) might be under strong selective pressure (Figure 2 and Figure S3). For these regions, and particularly for Chr12 (Figure S3), a single SNP is responsible for the large changes in allele frequencies among locations from the Gulf and those within the Northwest Atlantic, suggesting that an individual locus is experiencing strong selection.
Are Greenland Halibut adapting to climate change?
Our Genotype-Environment Association analysis revealed that both surface and bottom environmental variables are associated with genomic variation in Greenland Halibut. Although Greenland Halibut is primarily considered a deep-water fish, it uses both pelagic and bottom environments (Boje et al., 2014). For example, Vollen and Albert (2008) and Albert et al. (2011) documented extensive vertical activity of Greenland Halibut along the continental slope in Europe. It was found that individuals spend up to one fourth of their lives in the pelagic environment. This time is divided between the pelagic larvae phase and what is thought to be foraging on pelagic prey (Nygaard & Boje, 2011), thus exposing the fish to every layer of the water column and their associated environmental conditions. Warming ocean temperatures, both at the surface and in the deep waters, were at record levels in the Gulf of Saint Lawrence in 2020 (Galbraith et al., 2021). Climate data revealed that overall warming was detected in the Gulf in 2021. The observed surface warming falls in line with global warming data (about one degree per 100 years) but in the deep layers an increase of one-and-a-half Celsius degrees was measured over a period of 12 years (Galbraith et al., 2021), clearly outpacing global climate models. The last year for which below-normal temperatures at 300 m were observed was 2009. Since then, these temperatures have risen steadily. Given that deep water from the continental shelf flowing and diffusing into the Gulf of Saint Lawrence is also very warm, the situation is likely to continue (Neto et al., 2021). That flow is a mix of the deep-reaching Gulf Stream current moving north and the Labrador current moving south (Claret et al., 2018; Neto et al., 2021). Lately, the Gulf Stream has become dominant over the Labrador current (Neto et al., 2021), and while we don’t know if this is a permanent, cooling events are not expected in this area (Galbraith et al., 2021). With the Gulf Stream (oxygen-poor tropical and sub-tropical water) becoming more important than the Labrador current (well-oxygenated sub-arctic water) important environmental changes could be coming to the Gulf ecosystem. Oxygen levels in the Gulf of Saint Lawrence are rapidly decreasing, even outpacing the global and the North Atlantic basin average deoxygenation rates (Claret et al., 2018). Our study revealed that genomic variation in Greenland Halibut is associated with dissolved oxygen at deep layers of the water column. Interestingly, we found that the highest differentiation expressed between the Gulf and the Northwest Atlantic, located in Chr23, matches with the Delta (24)-sterol reductase gene known to be involved in the response to oxidative stress. Greenland Halibut inhabiting waters of the Saint Lawrence system might already suffer from hypoxia and allele frequency shift observed at this genomic region might be seen as an adaptive response to those conditions. Youcef et al. (2013) found a strong association between high Greenland Halibut densities and low dissolved oxygen concentration in the Gulf, suggesting that this species could already be highly tolerant to hypoxic conditions. They report that the negative effects of hypoxia, if present, could be compensated by other factors such as food availability and/or refuge from predation. However, Dupont-Prinet et al. (2013) revealed that juvenile Greenland Halibut are less tolerant to hypoxia than adults, notably due to a slower digestion process. The authors concluded that juveniles from the Saint Lawrence system were living at the edge of their metabolic capacities and that growth and distribution could be affected if further declines in dissolved oxygen occurred. The recent observed reduction in oxygen availability could make Greenland Halibut less tolerant to hypoxia. In addition to warm and poorly oxygenated waters, Greenland Halibut also has to cope with the recent nitrate increase in the Gulf of Saint Lawrence (Blais et al., 2021; Lavoie et al., 2021). Our analysis indeed revealed a genome-wide association with nitrate in surface waters, suggesting that Greenland Halibut may be responding to this observed increase. Nitrate occurs naturally at low concentrations in waterways but human activities, such as extensive use of agricultural fertilizers, the consumption of fossil fuels and increasing urban pressures, have increased nitrate concentrations to records levels in many places (Camargo et al., 2005; Claret et al., 2018), including in the Saint Lawrence system, where nitrate inventories in the surface water in recent years have been slightly above normal (Blais et al., 2021). Excess nitrate can trigger eutrophication events, where the growth of aquatic plants and cyanobacteria is spurred, subsequently stripping the water column of oxygen. Ultimately, fish exposed to nitrate increases become more susceptible to hypoxia (Gomez-Isaza et al., 2021). Finally, the genomic association found with productivity (chlorophyll and phytoplankton) may be mainly attributed to the high productivity, notably the phytoplankton spring bloom, occurring throughout the Saint Lawrence system (Lavoie et al., 2021).
The genotype-environment associations highlighted by our results and particularly the association between environmental variables and specific narrow genomic regions suggest that natural selection is acting and that Greenland Halibut are undergoing adaptation to their changing environment. For example, environmental association with the Green sensitive opsin gene located in the second highest peak of differentiation between the Gulf and the Northwest Atlantic (Chr03) was revealed by our study. This gene has already been shown to be associated with somatic growth in the Barfin Flounder (Verasper moseri) (Kasagi et al., 2015). In addition, on the third highest peak of differentiation (Chr05) we found an association with the Guanine nucleotide exchange factor B (RIC8), known to be involved in gastrulation and in embryonic development (Tonissoo et al., 2010). Moreover, other putative candidate genes involved in the differentiation between the Gulf and the Atlantic support this scenario of ongoing adaption to environmental change. In Chr07, the transcript of the translation initiation factor eIF4E, known to regulate stress homeostasis and modulate host invasion (Batool et al., 2021), seems under selection. The detected Zinc finger protein 365 in Chr12 has been recently defined as a new maternal LPS-binding protein that defends zebrafish embryos against gram-negative bacterial infections (Du et al., 2018) and, in Chr15, the detected guanylate cyclase activator 1d has been shown to be involved into the regulation of the photoreceptor GC in the teleost’s retina (Imanishi et al., 2004). Altogether, our results indicate that previous phenotypic differences observed between the Gulf and the Northwest Atlantic in terms of parasitism (Arthur and Albert, 1993), growth rate (Templeman, 1973), fecundity (Morgan et al., 2003) and physiology (Khan et al., 1982) may all be part of the signature of a functional adaptive divergence in Greenland Halibut that is mainly driven by the stronger climate changes observed in the Gulf of Saint Lawrence than elsewhere is the North Atlantic.
Another coping mechanism – escape from the Gulf of Saint Lawrence
If regional warming and deoxygenation continue in the Gulf of Saint Lawrence, one can anticipate that adaptation would not be sufficient for Greenland Halibut to cope with this climate change (Pershing et al., 2015). Greenland Halibut is not only a species with a narrow optimum temperature, but it is the Gulf’s species which prefers the coolest temperatures (1°C to 5°C) along with the Northern shrimp (Pandalus borealis) (Brennan et al., 2016). In a 50-year prediction for the decade 2060-2070, Chabot et al. (2013) concluded that Greenland Halibut could potentially disappear from the Gulf with warmer waters negatively affecting productivity, abundance and distribution. The Greenland Halibut is also in competition for its food with the redfish (Sebastes fasciatus or S. mentella), for which warming waters are beneficial (DFO, 2021). Recently, it has been reported that Greenland Halibut cohorts that were abundant in 2012-2013 grew slower and took more time to reach their commercial size than was expected in 2018-2019. It is difficult to determine if this was the consequence of warming and poorly oxygenated waters, competition with redfish or other factors, but indices of abundance and biomass of fish above 40 cm are decreasing (DFO, 2021). Another point brought by our study is the connectivity detected between the Gulf and the Northwest Atlantic. The asymmetrical connectivity detected by our analysis is congruent with the main nursery located in the Saint Lawrence Estuary (Ait Youcef et al., 2013 and Bassi et al. submitted) and GBS results revealing the contribution of Newfoundland stocks to this nursery (Carrier et al., 2020). It has been hypothesized that fish from the Atlantic could potentially drift during their prolonged pelagic larval phase and enter into the Saint Lawrence system via Belle-Isle strait, where there is a cold-water current oriented toward the Gulf coming from Labrador (Carrier et al., 2020). The proportion of larvae entering the Gulf would thus depend on the strength of this current. Considering the ongoing ocean circulation shift mentioned above (Claret et al., 2018), we can hypothesize that the asymmetrical migration detected by our study could potentially reverse and that emigration from the Gulf would become more important than immigration from the Atlantic. This could be seen as a passive response to the current dynamic, but it could be also an active strategy of Greenland Halibut to cope with environmental conditions becoming unfavorable in the Gulf of Saint Lawrence.
Conclusion
The high genomic resolution used in our study allowed to confirm the previously supposed specificity of the Gulf of Saint Laurent and the very high connectivity within the remainder of the Northwest Atlantic, suggesting that except for the Gulf of Saint Lawrence, Greenland Halibut appear to be panmictic throughout the Northwest Atlantic. Environment association analyses revealed that divergence between the two stocks is mainly attributed to environmental variables such as sea temperature and dissolved oxygen and indicated that phenotypic differences previously observed between the Gulf of Saint Lawrence and the Northwest Atlantic likely resulted from functional adaptive divergence to their respective environmental conditions. Altogether our results suggest that the Gulf stock could be particularly vulnerable to the environmental changes that are expected in the context of a warming climate. Moreover, the high levels of migration assessed between the two stocks would allow Greenland Halibut to potentially escape unfavorable environmental conditions in the Gulf of Saint Lawrence. In addition to supporting the management of this important exploited species, this work highlights the utility of using comprehensive genomic datasets to characterize the effects of climate change across a wider range of species.
Data availability statement
The data presented in the study are deposited in the SRA NCBI repository, accession numbers are provided in Supplementary Material S4.
Ethics statement
Ethical review and approval were not required for the animal study because samples were collected during commercial fisheries.
Author contributions
LB and CA conceived the study. KP, JM, MT, RH and WW designed the sample collection. ALF and CB performed the DNA extraction and lab manipulation. ALF and EN analyzed the data. ALF led the writing. All authors contributed to the article and approved the submitted version.
Funding
This project was funded by a National Sciences and Engineering Research Council of Canada (NSERC strategic partnership program) grant to LB, CA, PS, and Réjean Tremblay, as well as by the Canadian Research Chair in Genomics and Conservation of Aquatic Resources, and Ressources Aquatiques Québec (RAQ).
Acknowledgments
We thank all biologists and technicians of Fisheries and Oceans Canada and the Greenland Institute of Natural Resources for collecting the samples. We also thank Cécilia Hernandez for help gathering all the samples in the lab and Justine Létourneau for help in DNA extraction. Brian Boyle, Claire Mérot and Nina Therkildsen provided key advice about sequencing and libraries preparation.
Conflict of interest
The authors declare that the research was conducted in the absence of any commercial or financial relationships that could be construed as a potential conflict of interest.
Publisher’s note
All claims expressed in this article are solely those of the authors and do not necessarily represent those of their affiliated organizations, or those of the publisher, the editors and the reviewers. Any product that may be evaluated in this article, or claim that may be made by its manufacturer, is not guaranteed or endorsed by the publisher.
Supplementary material
The Supplementary Material for this article can be found online at: https://www.frontiersin.org/articles/10.3389/fmars.2022.992504/full#supplementary-material
Supplementary Figure 1 | (A). The four first axes of the principal component analysis performed with all the 1,297 Greenland Halibut individuals. (B). Assignment of each of the 1,297 Greenland Halibut to the two clusters using NGSadmix.
Supplementary Figure 2 | Isolation-By-Distance among the Greenland Halibut localities sampled throughout the Northwest Atlantic. Relationship between the logarithm of the geographic distance and the corrected genetic differentiation for all the pairwise sampled localities.
Supplementary Figure 3 | SNP Fst values between the Gulf of Saint Lawrence and the Atlantic in the 100 Kbp flanking regions around the highest Fst peaks found in the genome.
Supplementary Figure 4 | Local PCA conducted for each of the outlier window detected by the Lostruct analysis. Despite the detection of three clusters within these windows, no geographical structuration is distinguishable. Therefore, those putative inversions are unlikely to be involved in the Gulf-Northwest Atlantic differentiation.
Supplementary Figure 5 | Genome-wide RDA absolute loading values for bottom dissolved oxygen and temperature-related variables found to be significantly associated with allele frequencies. Black dots correspond to SNPs that are significantly associated with the environmental variables, while grey dots indicate non-outliers SNPs.
Supplementary Table 1 | Mean pairwise Fst estimates among each locality containing more than 30 individuals.
Supplementary Table 2 | Results of the Redundancy of Analysis.
References
Ait Youcef W., Lambert Y., Audet C. (2013). Spatial distribution of Greenland halibut Reinhardtius hippoglossoides in relation to abundance and hypoxia in the estuary and gulf of St. Lawrence Fish. Oceanogr. 22, 41–60. doi: 10.1111/fog.12004
Albert O. T., Lambert Y., Vollen T., Freitas C., Heggenbakken L. (2011). “Distinguishing pelagic and demersal swimming of deepwater flatfish by recording of body angles,” in Advances in fish tagging and marking technology. Eds. McKenzie J., Parsons B., Seitz A., Kopf R. K., Mesa M., Phelps Q. (Bethesda, MD: American Fisheries Society), 507–528.
Albert O. T., Vollen T. (2015). A major nursery area around the Svalbard archipelago provides recruits for the stocks in both Greenland halibut management areas in the northeast Atlantic. ICES J. Mar. Sci. 72, 872–879. doi: 10.1093/icesjms/fsu191
Aljanabi S. M., Martinez I. (1997). Universal and rapid salt-extraction of high-quality genomic DNA for PCR-based techniques. Nucleid Acids Res. 25 (22), 4692–4693. doi: 10.1093/nar/25.22.4692
Allendorf F. W., Luikart G. H., Aitken S. N. (2012). Conservation and the genetics of populations (2nd Ed) (West Sussex: U. K. Wiley-Blackwell).
Arthur J., Albert E. (1993). Use of parasites for separating stocks of Greenland halibut (Reinhardtius hippoglossoides) in the Canadian Northwest Atlantic. Can. J. Fish. Aquat. Sci. 50, 2175–2181. doi: 10.1139/f93-243
Babin C., Gagnaire P.-A., Pavey S. A., Bernatchez L. (2017). RAD-seq reveals patterns of additive polygenic variation caused by spatially-varying selection in the American eel (Anguilla rostrata). Genome Biol. Evol. 9 (11), 2974–2986. doi: 10.1093/gbe/evx226
Barkley A. N., Fisk A. T., Hedges K. J., Treble M. A., Hussey N. E. (2018). Transient movements of a deep-water flatfish in coastal waters: Implications of inshore-offshore connectivity for fisheries management. J. Appl. Ecol. 55, 1071–1081. doi: 10.1111/1365-2664.13079
Bassi L., Tremblay R., Robert D., Bernatchez L., Ferchaud A.-L., Sirois P. Submitted Connectivity and natal sources of Greenland halibut in the gulf of st. Lawrence inferred from otolith chemistry (Canadian Journal of Fisheries Aquatic Science).
Batool W., Shabbir A., Lin L., Chen X., An Q., He X., et al. (2021). Translation initiation factor eIF4E positively modulates conidiogenesis, appressorium formation, host invasion and stress homeostasis in the filamentous fungi Magnaporthe oryzae. Front. Plant Sci. 12, 646343. doi: 10.3389/fpls.2021.646343
Baym M., Kryazhimskiy S., Lieberman T. D., Chung H., Desai M. M., Kishony R., et al. (2015). Inexpensive multiplexed library preparation for megabase-sized genomes. PloS One, 1–15. doi: 10.1371/journal.pone.0128036
Benestan L., Gosselin T., Perrier C., Sainte-Marie B., Rochette R., Bernatchez L., et al. (2015). RAD genotyping reveals fine-scale genetic structuring and provides powerful population assignment in a widely distributed marine species, the American lobster (Homarus americanus). Mol. Ecol. 24 (13), 3299–3315. doi: 10.1111/mec.13245
Benestan L., Quinn B. K., Maaroufi H., Laporte M., Clark F. K., Greenwood S. J., et al. (2016). Seascape genomics provides evidence for thermal adaptation and current-mediated population structure in American lobster (Homarus americanus). Mol. Ecol. 25, 5073–5092. doi: 10.1111/mec.13811
Benestan L., Moore J.-S., Sutherland B. J.G., Le Luyer J., Maaroufi H., Clément R., et al. (2017). Sex matters in massive parallel sequencing: Evidence for biases in genetic parameter estimation and investigation of sex determination systems. Mol. Ecol. 26, 6767–6783. doi: 10.1111/mec.14217
Berg P. R., Jentoft S., Star B., Ring K. H., Knutsen H., Lien S., et al. (2015). Adaptation to low salinity promotes genomic divergence in Atlantic cod (Gadus morhua l.). Genome Biol. Evol. 7 (6), 1644–1663. doi: 10.1093/gbe/evv093
Berg P. R., Star B., Pampoulie C., Sodeland M., Barth J. M.I., Knutsen H., et al. (2016). Three chromosomal rearrangements promote genomic divergence between migratory and stationary ecotypes of Atlantic cod. Sci. Rep. 6, 23246. doi: 10.1038/srep23246
Bernatchez L. (2016). On the maintenance of genetic variation and adaptation to environmental change: considerations from population genomics in fishes. J. Fish Biol. 89, 2519–2556. doi: 10.1111/jfb.13145
Bernatchez L., Wellenreuther M., Araneda C., Ashton D. T., Barth J. M. I., Beacham T. D., et al. (2017). Harnessing the power of genomics to secure the future of seafood. Trends Ecol. Evol. 32 (9), 665–680. doi: 10.1016/j.tree.2017.06.010
Blais M., Galbraith P. S., Plourde S., Devred E., Clay S., Lehoux C., et al. (2021). Chemical and biological oceanographic conditions in the estuary and gulf of saint Lawrence during 2020 (Canadian Science Advisory Secretariat (CSAS). Research Document 2021/060: Fisheries and Ocean Canada).
Boje J. (2002). Intermingling and seasonal migrations of Greenland halibut (Reinhardtius hippoglossoides) populations determined from tagging studies. Fish Bull. 100, 414–422. http://hdl.handle.net/1834/31074
Boje J., Neuenfeldt S., Sparrevohn C. R., Eigaard O., Behrens J. W. (2014). Seasonal migration, vertical activity, and winter temperature experience of Greenland halibut Reinhardtius hippoglossoides in West Greenland waters. Mar. Ecol. Prog. Ser. 508, 211–222. doi: 10.3354/meps10874
Borcard D., Gillet F., Legendre P. (2011). Numerical Ecology with R. Springer Science & Business Media.
Bowering W. R. (1983). Age, growth, and sexual maturity of Greenland halibut, Reinhardtius hippoglossoides (Walbaum), in the Canadian Northwest Atlantic. Fish. Bull. 81, 599–611.
Bowering W. R. (1988). An analysis of morphometric characters of Greenland halibut (Reinhardtius hippoglossoides) in the Northwest Atlantic using a multivariate analysis of covariance. Can. J. Fish. Aquat. Sci. 45 (4), 580–585. doi: 10.1139/f88-070
Bowering W., Brodie W. (1995). “Greenland Halibut (Reinhardtius hippoglossoides). a review of the dynamics of its distribution and fisheries off eastern Canada and Greenland,” in Deep-water fisheries of the north Atlantic oceanic slope. Ed. Hopper A. G. (Dordrecht, The Netherlands.: Kluwer Academic Publishers), 113–160. doi: 10.1007/978-94-015-8414-2_4
Bowering W. R., Nedreaas K. H. (2000). A comparison of Greenland halibut (Reinhardtius hippoglossoides (Walbaum)) fisheries and distribution in the Northwest and northeast Atlantic. Sarsia 85, 61–76. doi: 10.1080/00364827.2000.10414555
Bradbury I. R., Hubert S., Higgins B., Borza T., Bowman S., Paterson I. G., et al. (2010). Parallel adaptive evolution of Atlantic cod on both sides of the Atlantic ocean in response to temperature. Proc. R. Soc. B: Biol. Sci. 277 (1701), 3725–3734. doi: 10.1098/rspb.2010.0985
Bradbury I. R., Hamilton L. C., Dempson B., Robertson M. J., Bourret V., Bernatchez L., et al. (2015). Transatlantic secondary contact in Atlantic salmon, comparing microsatellites, a single nucleotide polymorphism array and restriction-site associated DNA sequencing for the resolution of complex spatial structure. Mol. Ecol. 24 (20), 5130–5144. doi: 10.1111/mec.13395
Brennan C. E., Blanchard H., Fennel K. (2016). Putting temperature and oxygen thresholds of marine animals in context of environmental change: A regional perspective for the scotian shelf and gulf of st. Lawrence. PloS One, 0167411. doi: 10.1371/journal.pone.0167411
Camacho J. A., Coulouris G., Avagyan V., Ma N., Papadopoulos J., Bealer K., et al. (2009). BLAST+: architecture and applications. BMC Bioinf. 10 (421), 1–9. doi: 10.1186/1471-2105-10-421
Camargo J. A., Alonso A., Salamanca A. (2005). Nitrate toxicity to aquatic animals: a review with new data for freshwater invertebrates. Chemosphere 58, 1255–1267. doi: 10.1016/j.chemosphere.2004.10.044
Carrier E., Ferchaud A.-L., Normandeau É., Sirois P., Bernatchez L. (2020). Estimating the contribution of greenland halibut (Reinhardtius hippoglossoides) stocks to nurseries by means of genotyping-by-sequencing: Sex and time matter. Evol. Appl. 13, 2155–2167. doi: 10.1111/eva.12979
Cayle K., Basile J., Johanna L., François O. (2019). LFMM 2: Fast and accurate inference of gene-environment associations in genome-wide studies. Mol. Biol. Evol. 36 (4), 852–860. doi: 10.1093/molbev/msz008
Cayuela H., Rougemont Q., Laporte M., Mérot C., Normandeau É., Dorant Y., et al. (2020). Shared ancestral polymorphisms and chromosomal rearrangements as potential drivers of local adaptation in a marine fish. Mol. Ecol. 29, 2379–2398. doi: 10.1111/mec.15499
Chabot D., Guénette S., Stortini C. (2013). “A review of the physiological susceptibility of commercial species of fish and crustaceans of the northwest Atlantic to changes in water temperature, dissolved oxygen, pH and salinity,” in Climate change impacts, vulnerabilities and opportunities analysis of the marine Atlantic basin. vol. 3012, vol. p . Eds. Shackell N., Greenan B., Pepin P., Chabot D., Warburton A., 83–167.
Chen H. (2012). The joint allele frequency spectrum of multiple populations: A coalescent theory approach. Theor. Population Biol. 81, 179–195. doi: 10.1016/j.tpb.2011.11.004
Chen H., Green R. E., Pääbo S., Slatkin M.. (2007). The joint allele-frequency spectrum in closely related species. Genetics 177, 387–398. doi: 10.1534/genetics.107.070730
Claret M., Galbraith E. D., Palter J. B., Bianchi D., Fennel K., Gilbert D., et al. (2018). Rapid coastal deoxygenation due to ocean circulation shift in the northwest Atlantic. Nat. Climate Change 8, 868–872. doi: 10.1038/s41558-018-0263-1
Delaney A., Jacobsen R. B., Hendriksen K. (2012). “Greenland Halibut in upernavik: a preliminary study of the importance of the stock for the fishing populace,” in Aalborg: Innovative fisheries management (Aalborg University).
De Villemereuil P., Frichot E., Bazin E., François O., Gagiotti O. E. (2014). Genome scan methods against more complex models: when and how much should we trust them? Mol. Ecol. 23, 2006–2019. doi: 10.1111/mec.12705
DFO (2019). Assessment of the gulf of St. Lawrence (4RST) Greenland Halibut stock in 2018). DFO Can. Sci. Advis. Sec. Sci. Advis. Rep. 2019/023
DFO (2021). Proceedings of the regional advisory meeting on the assessment of the gulf of St Vol. 23-24 (DFO Can. Sci. Advis. Sec. Proceed. Ser. 2021/017: Lawrence (4RST) Greenland halibut), 2021.
Diopere E., Vandamme S. G., Hablützel P. I., Cariani A., Van Houdt J., Rijnsdorp A., et al. (2018). Original article seascape genetics of a flatfish reveals local selection under high levels of gene flow. ICES J. Mar. Sci. 75 (2), 675–689. doi: 10.1093/icesjms/fsx160
Dorant Y., Cayuela H., Wellband K., Laporte M., Rougemont Q., Mérot C., et al. (2020). Copy number variants outperform SNPs to reveal genotype-temperature association in a marine species. Mol. Ecol. 29 (24), 4765–4782. doi: 10.1111/mec.15565
Du X., Zhou Y., Song L., Wang X., Zhang S.. (2018). Zinc finger protein 365 is a new maternal LPS-binding protein that defends zebrafish embryos against gram-negative bacterial infections. FASEB J. 32, 979–994. doi: 10.1096/fj.201700694R
Dupont-Prinet A., Vagner M., Chabot D. (2013). Impact of hypoxia on the metabolism of Greenland halibut (Reinhardtius hippoglossoides). Can. J. Fish. Aquat. Sci. 70, 461–469. doi: 10.1139/cjfas-2012-0327
Excoffier L., Dupanloup I., Huerta-Sanchez E., Sousa V. C., Foll M. (2013). Robust demographic inference from genomic and SNP data. PloS Genet. 9 (10), e1003905. doi: 10.1371/journal.pgen.1003905
Excoffier L., Marchi N., Marques D. A., Mattey-Doret R., Gouy A., Sousa V. C. (2021). fastsimcoal2: demographic inference under complex evolutionary scenarios. Bioinformatics 37 (24), 4882–4885. doi: 10.1093/bioinformatics/btab468
Fairbairn D. J. (1981). Biochemical genetic analysis of population differentiation in Greenland halibut (Reinhardtius hippoglossoides) from the Northwest Atlantic, gulf of St Lawrence, and Bering Sea. Can. J. Fish. Aquat. Sci. 38, 669–677. doi: 10.1139/f81-090
Ferchaud A.-L., Leitwein M., Laporte M., Boivin-Delisle D., Bougas B., Hernandez C. (2020). Adaptative and maladpative genetic diversity in small populations: Insights from the brook charr (Salvelinus fontinalis) case study. Mol. Ecol. 29, 3429–3445. doi: 10.1111/mec.15566
Ferchaud A.-L., Mérot C., Normandeau E., Ragoussis J., Babin C., Djambazian H. (2022). Chromosome-level assembly reveals a putative y-autosomal fusion in the sex determination system of the Greenland halibut (Reinhardtius hippoglossoides). G3: GenesGenomesGenetics 12 (1), doi: 10.1093/g3journal/jkab376
Forester B. R., Lasky J. R., Wagner H. H., Urban D. L. (2018). Comparing methods for detecting multilocus adaptation with multivariate genotype–environment associations. Mol. Ecol. 27, 2215–2233. doi: 10.1111/mec.14584
François O., Martins H., Caye K., Schoville S. D. (2016). Controlling false discoveries in genome scans for selection. Molecular Ecology 25, 454–469.
Fuentes-Pardo A. P., Ruzzante D. E. (2017). Whole-genome sequencing approaches for conservation biology: Advantages, limitations and practical recommendations. Mol. Ecol. 26, 5369–5406. doi: 10.1111/mec.14264
Gagnaire P.-A., Broquet T., Aurelle D., Viard F., Souissi A., Bonhomme F., et al. (2015). Using neutral, selected, and hitchhiker loci to assess connectivity of marine populations in the genomic era. Evol. Appl. 8, 769–786. doi: 10.1111/eva.12288
Gagnaire P.-A., Normandeau É., Bernatchez L. (2012). Comparative genomics reveals adaptive protein evolution and a possible cytonuclear incompatibility between European and American eels. Mol. Biol. Evol. 29 (10), 2909–2919. doi: 10.1093/molbev/mss076
Galbraith P. S., Chassé J., Shaw J.-L., Dumas J., Caverhil C., Lefaivre D., et al. (2021). Physical oceanographic conditions in the gulf of St (Canadian Science Advisory Secretariat (CSAS). Research Document 2021/045: Lawrence during 2020).
Gomez-Isaza D. F., Cramp R. I., Franklin C. E. (2021). Exposure to nitrate increases susceptibility to hypoxia in fish. Physiol. Biochem. Zool. 94 (2), 124–142. doi: 10.1086/713252
Gundersen A. C., Stenberg C., Fossen I., Lyberth B., Boje J., Jørgensen O. A. (2010). Sexual maturity cycle and spawning of Greenland halibut Reinhardtius hippoglossoides in the Davis strait. J. Fish Biol. 77, 211–226. doi: 10.1111/j.1095-8649.2010.02671.x
Gutenkunst R. N., Hernandez R. D., Williamson S. H., Bustamante C. D. (2009). Inferring the joint demographic history of multiple populations from multidimensional SNP frequency data. PloS Genet. 5, e1000695. doi: 10.1371/journal.pgen.1000695
Huang K, Andrew RL, Owens GL, Ostevik KL, Rieseberg LH. (2020). Multiple chromosomal inversions contribute to adaptive divergence of a dune sunflower ecotype. Mol. Ecol. 29, 2535–2549.
Imanishi Y., Yang L., Sokal I., Filipek S., Palczewski K., Baehr W. (2004). Diversity of guanylate cyclase-activating proteins (GCAPs) in teleost fish: Characterization of three novel GCAPs (GCAP4, GCAP5, GCAP7) from zebrafish (Danio rerio) and prediction of eight GCAPs (GCAP1-8) in pufferfish (Fugu rubripes). J. Mol. Evol. 59 (2), 204–217. doi: 10.1007/s00239-004-2614-y
Jørgensen O. A. (1997). Movement patterns of Greenland halibut, Reinhardtius hippoglossoides (Walbaum), at West Greenland, as inferred from trawl survey distribution and size data. J. Northw. Atl. Fish. Sci. 21, 23–37. doi: 10.2960/J.v21.a2
Jiménez-Mena B., Le Moan A., Christensen A., van Deurs M., Mosegaard H., Hemmer-Hansen J., et al. (2020). Weak genetic structure despite strong genomic signal in lesser sandeel in the north Sea. Evol. Appl. 13, 376–387. doi: 10.1111/eva.12875
Kasagi S., Mizusawa K., Murakami N., Andoh T., Furufuji S., Kawamura S., et al. (2015). Molecular and functional characterization of opsins in barfin flounder (Verasper moseri). Gene 556 (2), 182–191. doi: 10.1016/j.gene.2014.11.054
Kess T., Bentzen P., Lehnert S. J., Sylvester E. V.A., Lien S., Kent M. P., et al. (2019). A migration-associated supergene reveals loss of biocomplexity in Atlantic cod. Sci. Adv. 5, eaav2461. doi: 10.1126/sciadv.aav2461
Kess T., Einfeldt A. L., Wringe B., Lehnert S. J., Layton K. K.S., McBride M. C., et al. (2021). A putative structural variant and environmental variation associated with genomic divergence across the Northwest Atlantic in Atlantic halibut. ICES J. Mar. Sci. 78 (7), 2371–2384. doi: 10.1093/icesjms/fsab061
Khan R. A., Dawe M., Bowering R., Misra R. K. (1982). Blood protozoa as an aid for separating stocks of Greenland halibut, Reinhardtius hippoglossoides, in the northwestern Atlantic. Can. J. Fish. Aquat. Sci. 39 (9), 1317–1322. doi: 10.1139/f82-176
Knutsen H., Jorde P. E., Albert O. T., Hoelzel A. R., Stenseth N. C. (2007). Population genetic structure in the north Atlantic Greenland halibut (Reinhardtius hippoglossoides): influenced by oceanic current systems? Can. J. Fish. Aquat. Sci. 64, 857–866. doi: 10.1139/f07-070
Korneliussen T. S., Albrechtsen A., Nielsen R. (2014). ANGSD: Analysis of Next Generation Sequencing Data. BMC Bioinformatics 15(356).
Lamichhaney S., Martinez Barrio A., Rafati N., Sundström G., Rubin C.-J., Gilbert E. R., et al. (2012). Population-scale sequencing reveals genetic differentiation due to local adaptation in Atlantic herring. PNAS 109 (47), 19345–19350. doi: 10.1073/pnas.1216128109
Lamichhaney S., Fuentes-Pardo A. P., Rafati N., Ryman N., McCracken G. R., Bourne C., et al. (2017). Parallel adaptive evolution of geographically distant herring populations on both sides of the north Atlantic ocean. Proc. Natl. Acad. Sci. 114, E3452–E3461. doi: 10.1073/pnas.1617728114
Laporte M., Pavey S. A., Rougeux C., Pierron F., Lauzent M., Budzinski H., et al. (2016). RAD sequencing reveals within-generation polygenic selection in response to anthropogenic organic and metal contamination in north Atlantic eels. Mol. Ecol. 25 (1), 219–237. doi: 10.1111/mec.13466
Lavoie D., Lambert N., Starr M., Chassé J., Riche O., Le Clainche Y., et al. (2021). The gulf of st. Lawrence biogeochemical model: A modelling tool for fisheries and ocean management. Front. Mar. Sci. 8, 732269. doi: 10.3389/fmars.2021.7322
Le Bris A., Fisher J., Murphy H. M., Galbraith P. S., Castonguay M., Loher T., et al. (2018). Original article migration patterns and putative spawning habitats of Atlantic halibut (Hippoglossus hippoglossus) in the gulf of st. Lawrence revealed by geolocation of pop-up satellite archival tags. ICES J. Mar. Sci. 75 (1), 135–147. doi: 10.1093/icesjms/fsx098
Le Luyer J., Laporte M., Beacham T. D., Kaukinen K. H., Withler R. E., Leong J. S., et al. (2017). Parallel epigenetic modifications induced by hatchery rearing in a pacific salmon. Proc. Natl. Acad. Sci. 114 (49), 12964–12969. doi: 10.1073/pnas.1711229114
Le Moan A., Bekkevold D., Hemmer-Hansen J. (2021). Evolution at two time frames: ancient structural variants involved in post-glacial divergence of the European plaice (Pleuronectes platessa). Heredity 126, 668–683. doi: 10.1038/s41437-020-00389-3
Limborg M., Helyar S. J., De Bruyn M., Taylor M. I., Nielsen E. E., Ogden R., et al. (2012). Environmental selection on transcriptome-derived SNPs in a high gene flow marine fish, the Atlantic herring (Clupea harengus). Mol. Ecol. 21, 3686–3703. doi: 10.1111/j.1365-294X.2012.05639.x
Li H., Ralph P. (2019). Local PCA shows how the effect of population structure differs along the genome. Genetics 211, 289–304. doi: 10.1534/genetics.118.301747
Liu X., Fu Y.-X. (2020). Stairway plot 2: demographic history inference with folded SNP frequency spectra. Genome Biol. 21 (280), 1–9. doi: 10.1186/s13059-020-02196-9
Lou R. N., Jacobs A., Wilder A. P., Therkildsen N. O. (2021). A beginner's guide to low-coverage whole genome sequencing for population genomics. Mol. Ecol. 30, 5966–5993. doi: 10.1111/mec.16077
Matschiner M., Barth J. M. I., Tørresen O. K., Star B., Baalsrud H. T., Brieuc M. S. O., et al. (2022). Supergene origin and maintenance in Atlantic cod. Nat. Ecol. Evol. 6, 469–481. doi: 10.1038/s41559-022-01661-x
Meisner J., Albrechtsen A. (2018). Inferring population structure and admixture proportions in low-depth NGS data. Genetics 210, 719–731. doi: 10.1534/genetics.118.301336
Milano I., Babbucci M., Cariani A., Atanassova M., Bekkevold D., Carvalho G. R., et al. (2014). Outlier SNP markers reveal fine-scale genetic structuring across European hake populations (Merluccius merluccius). Mol. Ecol. 23, 118–135. doi: 10.1111/mec.12568
Momigliano P., Florin A.-B., Merilä J. (2021). Biases in demographic modeling affect our understanding of recent divergence. Mol. Biol. Evol. 38 (7), 2967–2985. doi: 10.1093/molbev/msab047
Morgan M. J., Bowering W. R. (1997). Temporal and geographic variation in maturity at length and age of Greenland halibut (Reinhardtius hippoglossoides) from the Canadian north-west Atlantic with implications for fisheries management. ICES J. Mar. Sci. 54, 875–885. doi: 10.1006/jmsc.1996.0200
Morgan M. J., Bowering W. R., Gundersen A. C., Hoines Å., Morin B., Smirnov O., et al. (2003). A comparison of the maturation of Greenland halibut (Reinhardtius hippoglossoides) from populations throughout the north Atlantic. J. Northw. Atl. Fish. Sci. 31, 99–112. doi: 10.2960/J.v31.a7
Moritz C. (1994). Defining “Evolutionarily significant units”. Conserv. Trends Ecol. Evol. 9 (190), pp. 373–375. doi: 10.1016/0169-5347(94)90057-4
Neto A. G., Langan J. A., Palter J. B. (2021). Changes in the gulf stream preceded rapid warming of the Northwest Atlantic shelf. Commun. Earth Environ. 2 (74), 1–10. doi: 10.1038/s43247-021-00143-5
Nielsen E. E., Hemmer-Hansen J., Larsen P. F., Bekkevold D. (2009). Population genomics of marine fishes: identifying adaptive variation in space and time. Mol. Ecol. 18, 3128–3150. doi: 10.1111/j.1365-294X.2009.04272.x
Nielsen R., Paul J. S., Albrechtsen A., Song Y. S.. (2011). Genotype and SNP calling from next-generation sequencing data. Nat. Rev. Genet. 12, 443–451. doi: 10.1038/nrg2986
Northwest Atlantic Fisheries Organization (2020a) Greenland Halibut in subarea 0+1 (offshore). Available at: https://www.nafo.int/Portals/0/PDFs/Advice/2020/ghl_off.pdf.
Northwest Atlantic Fisheries Organization (2020b) Updated SCAA base case assessment for Greenland halibut. Available at: https://www.nafo.int/Portals/0/PDFs/sc/2020/scr20-030REV.pdf.
Nygaard R., Boje J. (2011). Standardized logbooks from the inshore longline fishery on Greenland halibut in the inshore part of div. 1A (Dartmouth: NAFO SCR 11/43 Serial No. N5928. Northwest Atlantic Fisheries Organization).
Oksanen J., Guillaume Blanchet F., Friendly M., Kindt R., Legendre P., McGlinn D., et al. (2020). Vegan: Community Ecology Package. R package version 2.5-7. https://CRAN.R-project.org/package=vegan
Pavey S. A., Gaudin J., Normandeau E., Dionne M., Castonguay M., Audet C., et al. (2015). RAD sequencing highlights polygenic discrimination of habitat ecotypes in the panmictic American eel. Curr. Biol. 25, 1666–1671. doi: 10.1016/j.cub.2015.04.062
Pershing A. J., Alexander M. A., Hernandez C. M., Kerr L. A., Le Bris A., Mills K. E., et al. (2015). Slow adaptation in the face of rapid warming leads to collapse of the gulf of Maine cod fishery. Sci. Res. 350 (6262), 809–812. doi: 10.1126/science.aac98
Pespeni M. H., Sanford E., Gaylord B., Hill T. M., Hosfelt J. D., Jaris H. K., et al. (2013). Evolutionary change during experimental ocean acidification. PNAS 110 (17), 6937–6942. doi: 10.1073/pnas.1220673110
Pomilla C., Treble M. A., Postma L. D., Lindsay M. M., Reist J. D. (2008). Initial genetic evidence of population structure of Greenland halibut (Reinhardtius hippoglossoides) in the Northwest Atlantic. J. Northw. Atl. Fish. Sci. 40, 1–15. doi: 10.2960/J.v40.m637
Prince D. J., O'Rourke S. M., Thompson T. Q., Ali O. A., Lyman H. S., Saglam I. K., et al. (2017). The evolutionary basis of premature migration in pacific salmon highlights the utility of genomics for informing conservation. Sci. Adv. 3, e1603198. doi: 10.1126/sciadv.1603198
R Core Team (2020). R: A Language and Environment for Statistical Computing. R Foundation for Statistical Computing, Vienna, Austria. URL https://www.R-project.org/.
Riget F., Boje J., Simonsen V. (1992). Analysis of meristic characters and genetic differentiation in Greenland halibut (Reinhardtius hippoglossoides) in the Northwest Atlantic. J. Northw. Atl. Fish. Sci. 12, 7–14. doi: 10.2960/J.v12.a1
Rousset F. (1997). Genetic differentiation and estimation of gene flow from f-statistics under isolation by distance. Genetics 145, 1219–1228. doi: 10.1093/genetics/145.4.1219
Roy D., Hardie D. C., Treble M. A., Reist J. D., Ruzzante D. E. (2014). Evidence supporting panmixia in Greenland halibut (Reinhardtius hippoglossoides) in the Northwest Atlantic. Can. J. Fish. Aquat. Sci. 71 (5), 763–774. doi: 10.1139/cjfas-2014-0004
Sheffers B. R., De Meester L., Bridge T. C.L., Hoffmann A. A., Pandolfi J. M., Corlett R. C., et al. (2016). The broad footprint of climate change from genes to biomes to people. Science 354 (6313), aaf7671. doi: 10.1126/science.aaf7671
Skotte L., Korneliussen T. S., Albrechtsen A. (2013). Estimating individual admixture proportions from next generation sequencing data. Genetics 195, 693–702. doi: 10.1534/genetics.113.154138
Smith T. B., Bernatchez L. (2008). Evolutionary change in human-altered environments. Mol. Ecol. 17, 1–8. doi: 10.1111/j.1365-294X.2007.03607.x
Sohn D., Ciannelli L., Duffy-Anderson J. T. (2010). Distribution and drift pathways of Greenland halibut (Reinhardtius hippoglossoides) during early life stages in the eastern Bering Sea and Aleutian islands. Fish. Oceanogr. 19 (5), 339–353. doi: 10.1111/j.1365-2419.2010.00549.x
Stanley R. R. E., Di Bacco C., Lowen B, Beiko R. G., Jeffery N. W., Van Wyngaarden M., et al. (2018). A climate-associated multispecies cryptic cline in the northwest Atlantic. Science 4 (3), sciadv.aaq0929. doi: 10.1126/sciadv.aaq0929
Stenberg C., Ribergaard M. H., Boje J., Sundby S. (2016). Larval drift and settling of Greenland halibut (R. hippoglossoides walbaum) in Northwest Atlantic with special focus on greenlandic waters (Danish Meteorological Institute) DMI Report, 16–21.
Templeman W. (1973). Distribution and abundance of the Greenland halibut, reinhardtius hippoglossoides (Walbaum) Vol. 10 (the Northwest Atlantic. ICNAF) Res. Bull., 84–98.
Therkildsen N. O., Palumbi S. R. (2016). Practical low-coverage genomewide sequencing of hundreds of individually barcoded samples for population and evolutionary genomics in nonmodel species. Mol. Ecol. Resour. 17 (2), 194–208. doi: 10.1111/1755-0998.12593
Tonissoo T., Lulla S., Meier R., Saare M., Ruisu K., Pooga M., et al. (2010). Nucleotide exchange factor RIC-8 is indispensable in mammalian early development. Dev. Dynamics 239, 3404–3415. doi: 10.1002/dvdy.22480
Treble M. A., Campana S. E., Wastle R. J., Jones C. M., Boje J. (2008). Growth analysis and age validation of a deepwater Arctic fish, the Greenland halibut (Reinhardtius hippoglossoides). Can. J. Fish. Aquat. Sci. 65, 1047–1059. doi: 10.1139/F08-030
Tyberghein L., Verbruggen H., Pauly K., Troupin C., Mineur F., De Clerck O., et al. (2012). Bio-ORACLE: a global environmental dataset for marine species distribution modelling. Global Ecol. Biogeogr. 21, 272–281. doi: 10.1111/j.1466-8238.2011.00656.x
Van Wyngaarden M., Snelgrove P. V. R., Dibacco C., Hamilton L. C., Rodríguez-Ezpeleta N., Zhan L., et al. (2018). Oceanographic variation influences spatial genomic structure in the sea scallop, Placopecten magellanicus. Ecol. Evol. 8, 2824–2841. doi: 10.1002/ece3.3846
Vihtakari M., Elvarsson B. Þ., Treble M., Nogueira A., Hedges K., Hussey N. E., et al. (2022). Migration patterns of Greenland halibut in the north Atlantic revealed by a compiled mark–recapture dataset. ICES J. Mar. Sci. 79 (6), 1902–1917. doi: 10.1093/icesjms/fsac127
Vihtakari M., Hordoir R., Treble M., Bryan M. D., Elvarsson B., Nogueira A., et al. (2021). Pan-Arctic suitable habitat model for Greenland halibut. ICES J. Mar. Sci. 78 (4), 1340–1356. doi: 10.1093/icesjms/fsab007
Vis M. L., Carr S. M., Davidson W. S. (1997). Greenland Halibut (Reinhardtius hippoglossoides) in the north Atlantic are genetically homogeneous. Can. J. Fish. Aquat. Sci. 54, 1813–1821. doi: 10.1139/f97-088
Vollen T., Albert O. T. (2008). Pelagic behavior of adult Greenland halibut (Reinhardtius hippoglossoides). Fish Bull. 106, 457–470.
Walbaum C. (1792). Pisces: Rejectee as a generic name and placed on the official index. Bull. of Zool. Nomencl. 23, 41–45.
Waples R. S. (1998). Separating the wheat from the chaff: Patterns of genetic differentiation in high gene flow species. J. Heredity 89 (5), 438–450. doi: 10.1093/jhered/89.5.438
Wellenreuther M., Bernatchez L. (2018). Eco-evolutionary genomics of chromosomal inversions. Trends Ecol. Evol. 33 (6), 427–440. doi: 10.1016/j.tree.2018.04.002
Westgaard J.-I., Saha A., Kent M., Hansen H. H., Knutsen H., Hauser L., et al. (2017). Genetic population structure in Greenland halibut (Reinhardtius hippoglossoides) and its relevance to fishery management. Can. J. Fish. Aquat. Sci. 74 (4), 475–485. doi: 10.1139/cjfas-2015-0430
Xuereb A., Normandeau É., Daigle R. M., Curtis J. M.R., Bernatchez L., Fortin M. J. (2018). Asymmetric oceanographic processes mediate connectivity and population genetic structure, as revealed by RADseq, in a highly dispersive marine invertebrate (Parastichopus californicus). Mol. Ecol. 27, 2347–2364. doi: 10.1111/mec.14589
Keywords: Greenland halibut, Gulf of Saint Lawrence, Northwest Atlantic, whole-genome sequencing, environmental association
Citation: Ferchaud A-L, Normandeau E, Babin C, Præbel K, Hedeholm R, Audet C, Morgan J, Treble M, Walkusz W, Sirois P and Bernatchez L (2022) A cold-water fish striving in a warming ocean: Insights from whole-genome sequencing of the Greenland halibut in the Northwest Atlantic. Front. Mar. Sci. 9:992504. doi: 10.3389/fmars.2022.992504
Received: 12 July 2022; Accepted: 05 August 2022;
Published: 02 September 2022.
Edited by:
Fran Saborido-Rey, Spanish National Research Council (CSIC), SpainReviewed by:
Pablo Saenz-Agudelo, Austral University of Chile, ChileNatalia Petit-Marty, Institute of Marine Research, Spanish National Research Council (CSIC), Spain
Copyright © 2022 Ferchaud, Normandeau, Babin, Præbel, Hedeholm, Audet, Morgan, Treble, Walkusz, Sirois and Bernatchez. This is an open-access article distributed under the terms of the Creative Commons Attribution License (CC BY). The use, distribution or reproduction in other forums is permitted, provided the original author(s) and the copyright owner(s) are credited and that the original publication in this journal is cited, in accordance with accepted academic practice. No use, distribution or reproduction is permitted which does not comply with these terms.
*Correspondence: A–L. Ferchaud, YW5uZWxhdXJlZmVyY2hhdWRAZ21haWwuY29t
†ORCID: Anne-Laure Ferchaud, orcid.org/0000-0002-9577-5508
Eric Normandeau, orcid.org/0000-0003-2841-9391
Charles Babin, orcid.org/0000-0002-7468-1756
Kim Præbel, orcid.org/0000-0002-0681-1854
Céline Audet, orcid.org/0000-0003-3366-210X
Margaret Treble, orcid.org/0000-0001-9365-2398
Wojciech Walkusz, orcid.org/0000-0003-0864-4487
Louis Bernatchez, orcid.org/0000-0002-8085-9709