 Tomislav Džoić
 Barbara Zorica
 Frano Matić
 Marija Šestanović
 Vanja Čikeš Keč
- 1Institute of Oceanography and Fisheries, Split, Croatia
- 2University Department of Marine Studies, University of Split, Split, Croatia
The anchovy (Engraulis encrasicolus, Linnaeus, 1758), one of the most important small pelagic fish species in the Adriatic, is currently described as a species that can be considered overfished. From 2013 to 2020, samples of anchovy eggs and larvae were collected through scientific surveys during the summer months. The collected ichthyoplankton data were combined with environmental data (measured satellite sea surface temperature and chlorophyll data, numerically simulated salinity, maps of primary production) to identify anchovy spawning habitats and environmental conditions affecting the anchovy early life stages. For this large dataset, a nonlinear method called Growing Neural Gas Network analysis was used to explain the multiple dependencies between anchovy and the explanatory environmental variables and represent them in 9 patterns called Best Matching Unit (BMU). Obtained values of anchovy early life stages abundances (eggs/m2; larvae/m2) showed a clear negative trend, which was easily observed both in the time series and in the annual spatial distributions. Among all measured environmental parameters that were previously mentioned, salinity showed a significant increase, which can be attributed to the cyclonic phase of the bimodal oscillatory system of the Adriatic and Ionian Seas. The calculated BMUs showed several interesting results that shed new light on previous findings: (a) there is a split between the richer northern and poorer southern parts of the Adriatic in terms of anchovy eggs and larvae abundances, (b) the Kvarner Bay, the west coast of Istria and the area around Dugi otok are consistently rich spawning grounds, (c) decreased abundance in the southern areas is a result of the influence of salinity, (d) an increase in chlorophyll can lead to an increase in egg count, (e) the positive effects of upwelling can be negated by an increase in salinity, (f) increased primary production is followed by increased egg count. Upwelling, as one of the factors that can influence larval and egg abundance by bringing nutrients up from the seafloor, showed increased spatial and temporal variability during the investigated period, which depended on the wind regime. Our analysis showed that neural network analysis can successfully describe the effects and interplay of environmental factors on the abundance of anchovy early life stages.
Introduction
Ensuring reproductive success is a guarantee of the fish populations persistence. Fish early life stages – eggs and larvae, had the highest vulnerability and mortality rates so choosing a spawning ground, where optimal biotical and abiotical conditions will ensure renewal of species, is crucial. Many migratory fish species seem to embrace a reproductive strategy known as natal homing. This strategy implies that fishes tend to spawn at the same geographical location where environmental conditions were most suitable year by year (Papi, 2006).
The anchovy (Engraulis encrasicolus, Linnaeus, 1758), along with sardine, is ecologically (ensures the transfer of energy from lower to higher trophic levels) and economically (contribution of its catches in overall landings of the Mediterranean and the Black Sea was 28.4% (2016 – 2018; FAO, 2020)) very important small pelagic fish species. This fish species is a short-living, fast-growing income-breeder which is also known as a highly fecund batch spawner with a protracted spawning season that in the Adriatic Sea lasts from March to September with its peak in April-July (Zorica et al., 2020). Multidecadal fluctuations of the anchovy population inhabiting the Adriatic Sea as well as the whole Mediterranean were perceived (FAO, 2020) and tackled by many scientific researchers. Recently observed climate changes (Grbec et al., 2015; Iona et al., 2018) induced alternation in the Adriatic ecosystem and thus most likely affected marine organisms. By now, it is known that the variability of environmental factors might indirectly/directly affect the anchovy population through limiting nutrition conditions (poor food quantity and quality; Basilone et al., 2017), changes in its reproductive strategy and recruitment strength (Santojanni et al., 2006; Zorica et al., 2013; Maynou et al., 2020; Patti et al., 2020).
Overviewing the literature, it was obvious that there are a lot of biological and fisheries studies on anchovy in the Adriatic Sea and worldwide, but still, only a few studies attempted to link and elucidate its accommodation to environmental parameters (Brochier et al., 2009; Martín et al., 2012; Patti et al., 2020; Fernández-Corredor et al., 2021; Fujita et al., 2021). Bearing in mind, that according to the last and available stock assessments for the Adriatic Sea anchovy is currently fished at biologically unsustainable levels (FAO, 2020) we found it crucial to investigate its area of spawning. Thus, the main goal of this study was to collect all available biological and environmental data to identify anchovy spawning habitats and their environmental conditions that underpin the Adriatic anchovy population dynamic. The complexity of such a high-dimensional, multiparametric data set required an analysis method that could easily deconvolve and classify nonlinear patterns. For this purpose, a computational method from the field of neural networks was used: the Growing Neural Gas Network (GNGS) (Martinetz and Schulten, 1991). Neural networks have already been used in the Adriatic to analyze microbial diversity (Šantić et al., 2021) and food web structures (Šolić et al., 2018), to reveal different patterns in surface currents (Mihanović et al., 2011), in long time series of ocean salinity and temperature (Matić et al., 2018), and finally in ocean color data (Kovač et al., 2014). The use of GNGS allowed to explain multiple dependencies that are not easily described by linear methods. In particular, when we consider the increase in salinity in the Adriatic (Mihanović et al., 2021) and the trend of global warming that strongly affect the Adriatic (Giorgi, 2006; Pastor et al., 2018). Another hypothesis to be investigated is the impact of the inter-year variability of the upwelling process in the eastern Adriatic on the primary production and consequently on the abundance of anchovy early life stages (Regner et al., 1987). Obtained knowledge should improve the development of conservation strategies throughout habitat protection or even the introduction of marine protected areas. Namely, according to the literature protection of spawning individuals and their areas of spawning has shown to have positive effects on population structure (Palm et al., 2007; Pedersen et al., 2009; Taylor et al., 2012).
Study area
Circulation in the Adriatic Sea (Figure 1), a semi-enclosed part of the Mediterranean Sea, follows a cyclonic pattern: the East Adriatic Current (EAC) flows in along the east coast and the West Adriatic Current (WAC) flows out along the west coast (Orlić et al., 1992; Cushman-Roisin et al., 2001). In addition to the northern Adriatic and east coast rivers, the Bimodal Oscillatory System (BiOS) has a major influence on salinity and nutrient loading, especially during ingression periods when the salty Levantine Intermediate Water (LIW) is transported towards the Adriatic Sea by cyclonic gyre in the Ionian Sea (Gačić et al., 2010; Mihanović et al., 2015; Batistić et al., 2019; Mihanović et al., 2021). In the summer wind regime over the Adriatic, three winds are mainly observed: the southeasterly (SE) scirocco, the northeasterly (NE) bora wind, and the superimposition of Etesian winds with the land-sea breezes that result in the northwesterly (NW) wind (Pandžić and Likso, 2005; Klaić et al., 2009). Their intensity is reduced compared to winter, resulting in low wind mixing, which causes a strong stratification in the sea (Buljan and Zore-Amanda, 1976). As a result of the listed conditions, the eastern part of the Adriatic Sea is characterized by low chlorophyll concentrations in summer, precisely this area is considered as an oligotrophic sea (Kovač et al., 2014; Kovač et al., 2018).
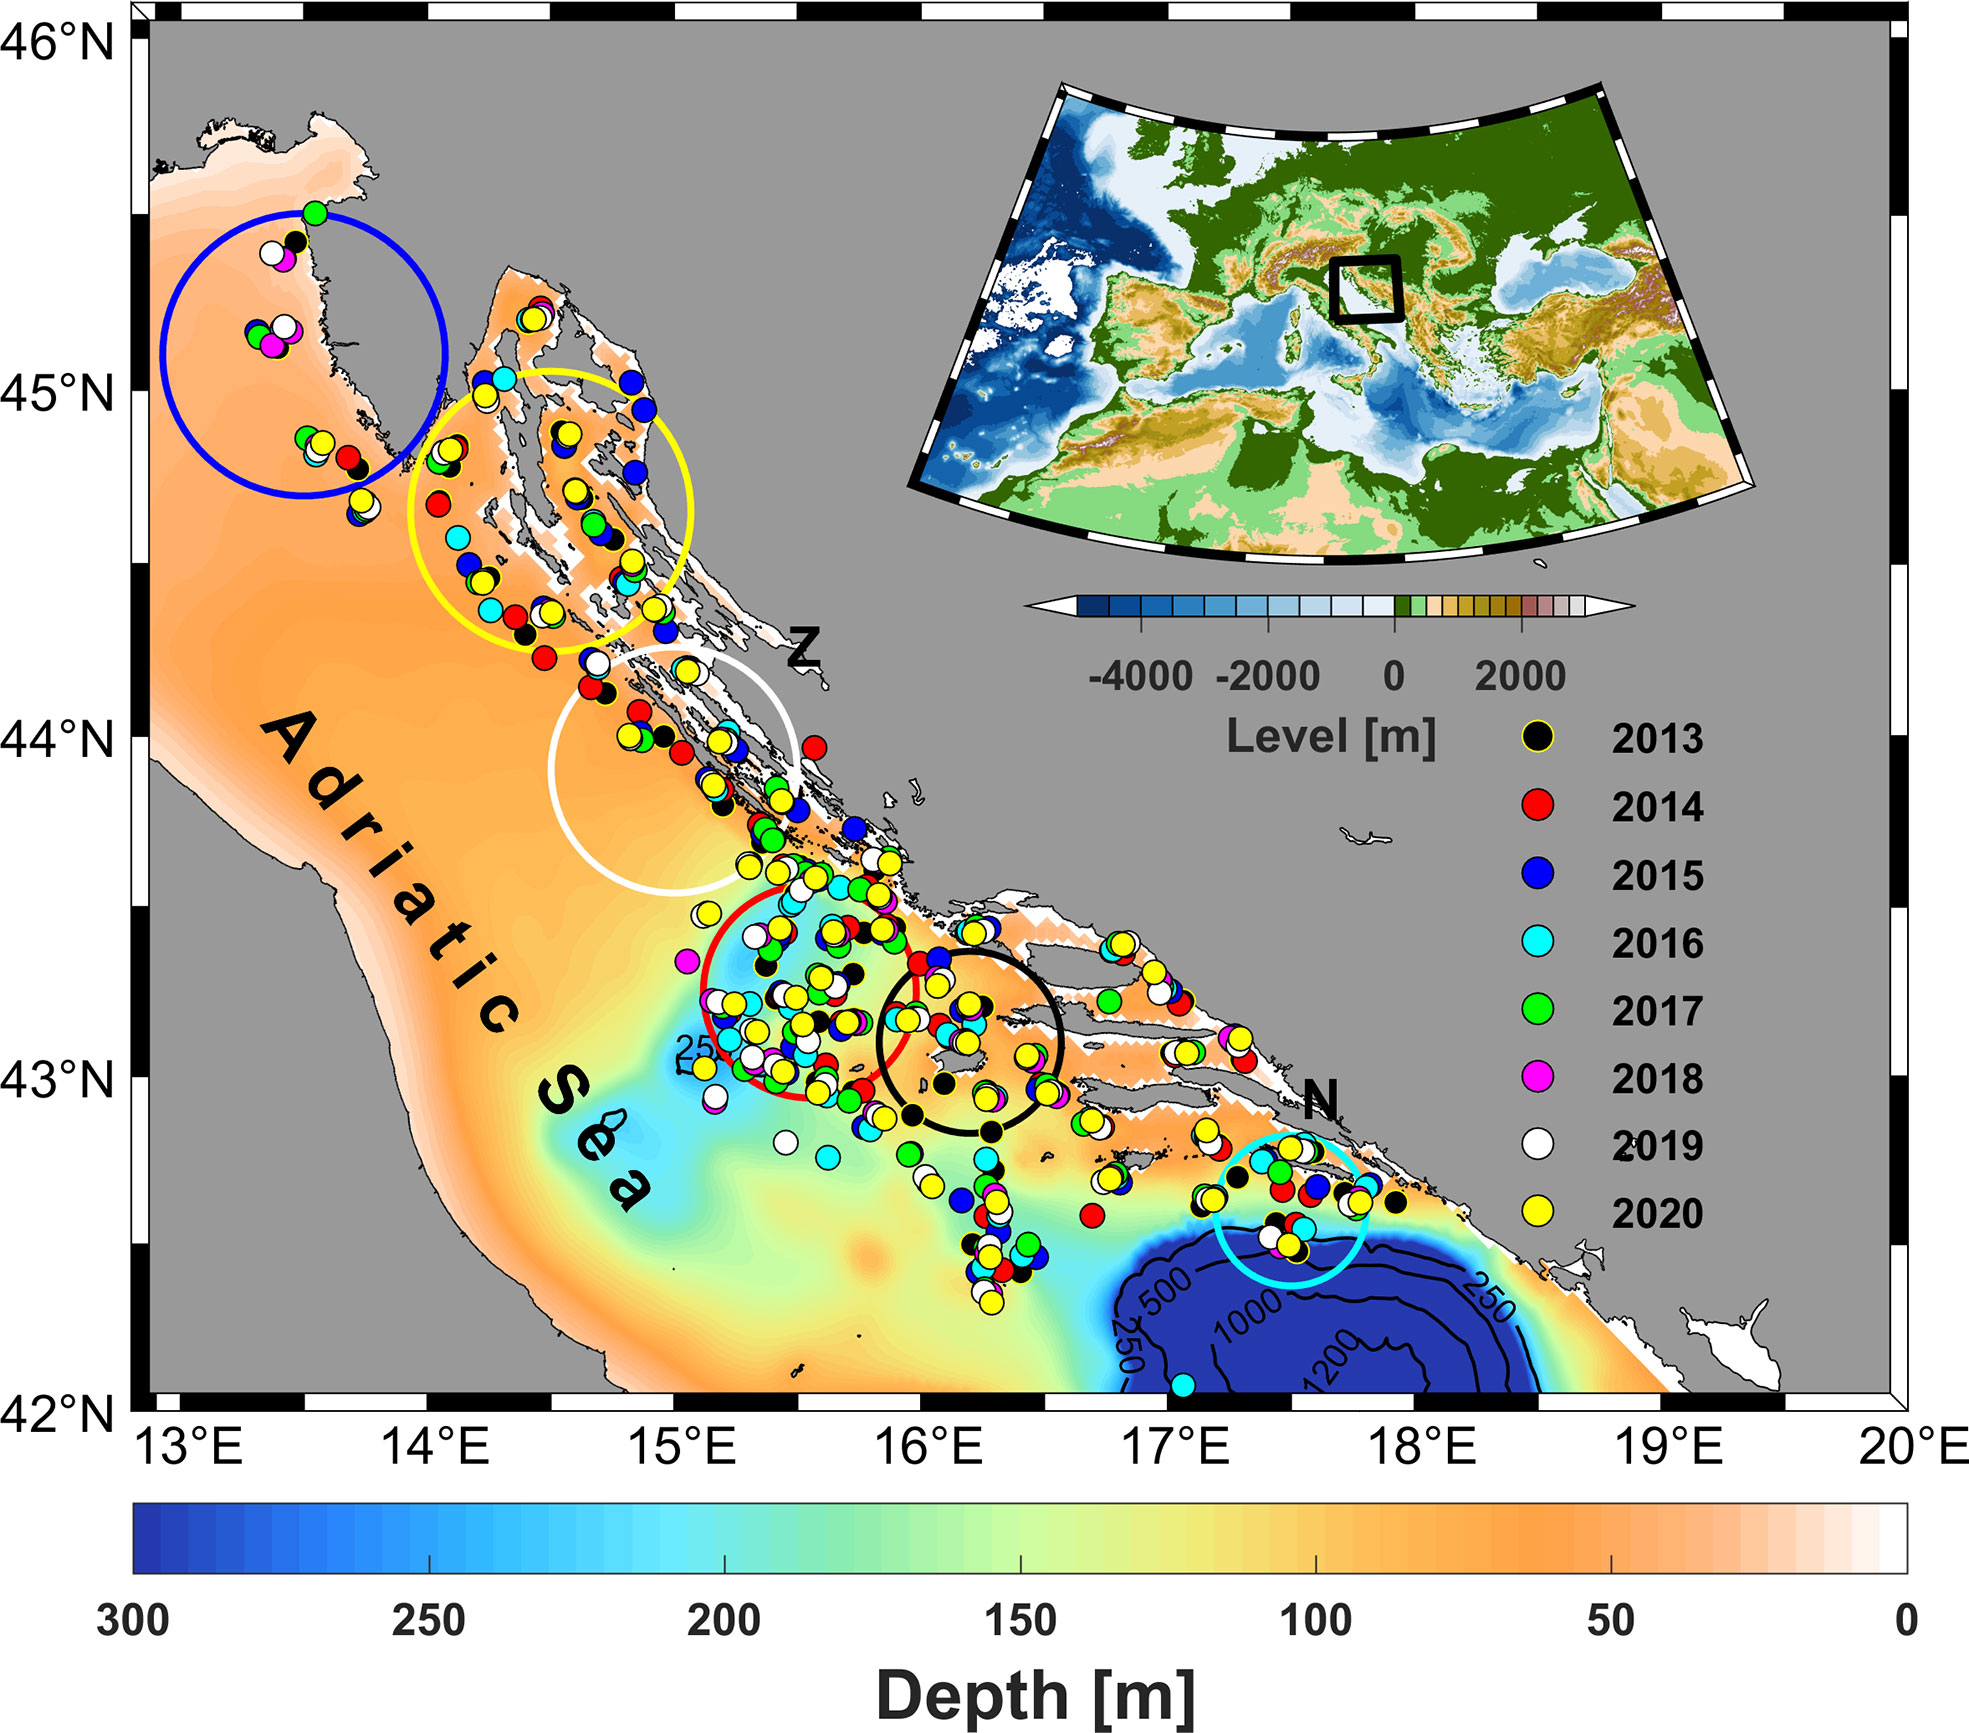
Figure 1 Map of the bathymetry of the Adriatic Sea showing the locations of sampling sites for anchovy eggs and larvae collected during the summer surveys from 2013 to 2020 in the eastern Adriatic Sea (Croatian fishing area), with a map of the bathymetry of the Mediterranean Sea and surrounding topography (upper right corner). Each sampling year is shown in a different color. The area of the west coast of Istria is marked with a blue circle, Kvarner Bay yellow, the area near the Dugi otok white, Jabuka pit red, the area around the island of Vis black and the area around the island of Mljet cyan. The mouth of the river Neretva is marked by a letter N and the mouth of the river Zrmanja by a letter Z.
Characteristics of anchovy spawning in the Adriatic sea
The spawning season of anchovy in the Adriatic Sea lasts from March to November, while the peak of its spawning occurs between April and July, depending on environmental factors (Sinovčić and Zorica, 2006; Zorica et al., 2013). In their study, they found a significant correlation between gonadosomatic index and upper layer salinity in the two preceding months. Moreover, according to previous findings (Moyle and Cech, 1988; Regner, 1996; Maynou et al., 2020), the onset of spawning in fish species living in warm areas is often associated with sea temperature, which eventually interacts synergistically with all other environmental parameters (wind mixing, stratification, chlorophyll a, plankton abundance, etc.). Since the beginning of the modern scientific investigation of the Mediterranean Sea, much work has been done to establish the relationship between anchovy populations and environmental parameters (Palomera et al., 2007; Bellido et al., 2008; Basilone et al., 2013; Maynou et al., 2014; Patti et al., 2020). Similar studies have been conducted in the Adriatic Sea, one of the richest basins for small pelagic fishes in the Mediterranean Sea. (Regner, 1972; Vučetić, 1975; Piccinetti et al., 1980; Regner, 1985; Regner, 1996; Zorica et al., 2019). Of particular importance is the study of the early stages of anchovy as an extremely vulnerable developmental stage, highly susceptible to environmental changes that can consequently affect the adult population (Costalago et al., 2015; Basilone et al., 2017). Overviewing the literature, the main spawning areas of Adriatic anchovy are located in coastal waters whose depth does not exceed 200 m (Gamulin and Hure, 1983; Regner, 1985). The more abundant west coast spawning area extends from the Gulf of Trieste through the Gulf of Venice to the Gargano Peninsula (Regner, 1985). As for the less abundant east coast, which is the focus of this study, the areas around the island of Palagruža, near the island of Vis (Regner, 1996), the Kvarner Bay (especially the Kvarnerić basin), the area along the outer coast of the island of Dugi otok and the central Dalmatian islands stands out due to their anchovy early life stages richness compared to their surroundings (Sinovčić, 2000; Zorica et al., 2015; Zorica et al., 2019; Zorica et al., 2020). A wide range was found when measuring temperature (11.6-27.6°C) and salinity (9.1-39.6) during the spawning season in the area of eastern Adriatic, which can describe both brackish and extremely saline waters characteristic of both summer and winter seasons (Regner, 1996).
Materials and methods
Ichthyoplankton sampling
Over the last eight years (2013-2020) each summer in the period between June-July scientific expedition “Mediterranean International Bottom Trawl-Surveys (MEDITS)” was carried out along the eastern Adriatic Sea (Croatian fishing ground). Throughout this survey, ichthyoplankton sampling was also performed. Namely, each year 50 to 65 ichthyoplankton samples were collected during daylight hours on board the RV “Bios Dva” (Table 1; Figure 1). Standard vertical plankton tows were made using a WP2 sampler (mouth opening, 0.255 m2; mesh size, 0.200 mm; custom made by artisan manufacturer Zoran Jurić, Dubrovnik). The WP2 net was put vertically down during a calm sea to a depth of 100 m or to 5 m above the seabed in marine areas with less than 100 m depth. Plankton samples were put in a marked plastic container, preserved in 4% buffered formalin/96% ethanol and transported to the laboratory.
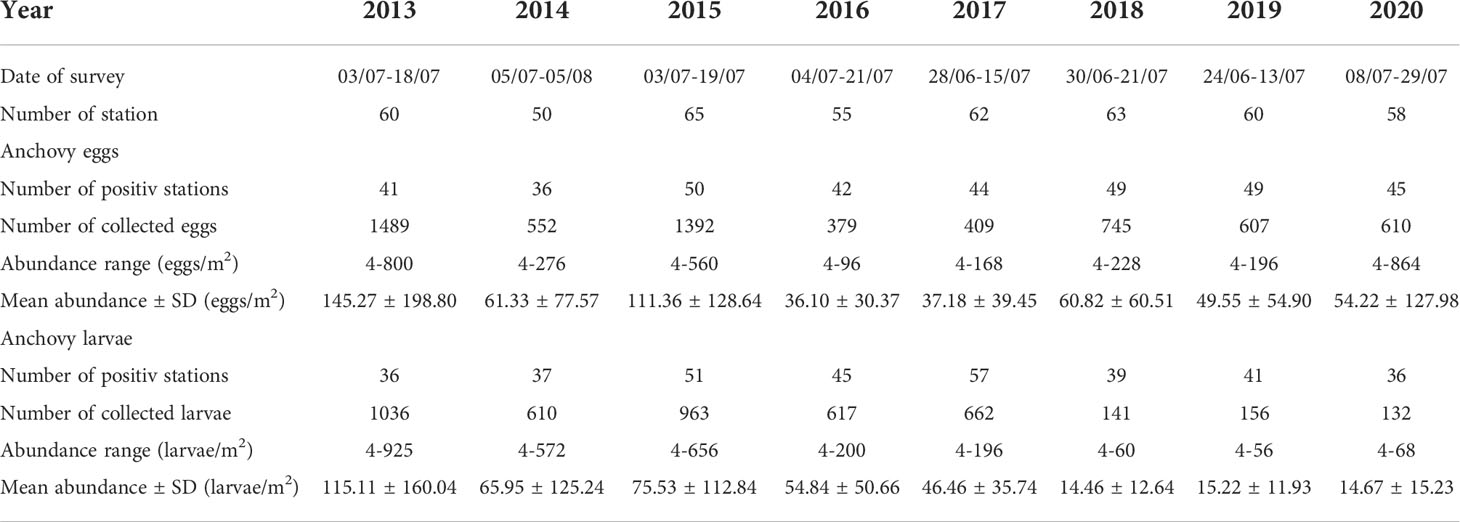
Table 1 Overview of sampling surveys done along the eastern Adriatic Sea (Croatian fishing ground) – date, number of sampling station as well as number of positive stations where anchovy early life stages (eggs and larvae) were collected, overall number of collected anchovy eggs and larvae per survey, their abundance ranges and mean values with its standard deviations (SD).
Biological analysis
In the laboratory, anchovy eggs and larvae were isolated from the ichthyoplankton samples under a stereomicroscope Zeiss SteREO Discovery.V12 and their abundance was standardized to numbers per square meter using the function given by Tanaka (1973).
Environmental and oceanographic data
Satellite level 3 Chlorophyll-a (Chl-a) concentration (mg m-3) data were obtained from the Ocean Colour Climate Change Initiative project (www.oceancolour.org/). Version 5.0 provided a spatial resolution of 1 km at a daily interval. The data were generated by a combination of the OCI, OCI2, OC2 and OCx algorithms (Sathyendranath et al., 2019).
Daily gap free level 4 satellite maps of sea surface temperature (SST) were downloaded from the Copernicus Marine Service data portal (http://marine.copernicus.eu). Remotely sensed SST datasets are statistically interpolated at a resolution of 1.11 km (Buongiorno Nardelli et al., 2013).
To determine the daily mean values of salinity in the Adriatic Sea, the results of the physical reanalysis of the Mediterranean Forecasting System were also downloaded from http://marine.copernicus.eu. The system is based on the Nucleus for European Modelling of the Ocean (NEMO) model with a 4 km horizontal grid resolution and 141 unevenly spaced vertical levels, with monthly mean discharges of the 39 rivers and accompanied by a variational data assimilation scheme for temperature and salinity vertical profiles and satellite sea level measurements (Simoncelli et al., 2019).
For each sampling location, the nearest wet spot was found in the NEMO model grid for a given day. In order to exclude the direct influence of meteorological factors, salinity values were extracted at a depth of 10 m from the selected wet grid point. The depth of 10 m is also the lower limit of the vertical distribution of anchovy eggs and the upper limit of the vertical distribution of larvae (Regner, 1985). The monthly mean salinity values for each July were also calculated at a depth of 10 m to provide a meaningful representation of the spatial distribution of salinity during the study period.
A similar procedure was performed for satellite SST data. For Chl-a, the procedure was slightly modified due to data gaps. Instead of one extraction point, an area with an additional 8 surrounding points (a 9 km2 box) was selected and the mean value was taken. In this way, the availability of Chl-a data was increased by an average of 10% per year compared to the case where only one extraction point was used.
Maps of primary production for the Adriatic Sea were obtained from global datasets of marine phytoplankton primary production based on the Ocean Colour Climate Change Initiative v4.2 monthly composites for the period from 1998 to 2020. This is a novel combination of high-quality multi sensor satellite measurements of ocean color with multiple in situ observations of photosynthetic phytoplankton parameters with the aim of calculating the extent of primary production for the global ocean (Kulk et al., 2020; Sathyendranath et al., 2020; Kulk et al., 2021b). The spatial resolution of the monthly products of marine primary production (mg m-2 d-1) was 9 km and the data were provided as netCDF files (Kulk et al., 2021a).
Growing neural gas
The Growing Neural Gas Network (GNG) is an unsupervised artificial neural network closely related to Self-Organising Maps (SOM) (Kohonen, 1982; Martinetz and Schulten, 1991). GNG operates on a principle that generates a certain number of winning neurons (called Best Matching Units, BMUs) based on the input data, i.e., it compresses the higher dimensional input to a lower dimension of neurons while preserving the structure of the data vector. In this work, the GNG method extracted characteristic temporal and spatial patterns from datasets comprising two anchovy variables measured in situ, one environmental modelled and two variables measured by satellite over an 8-year period. The main feature of GNG is its flexibility compared to SOM, i.e., no prior neuron distribution is required to find patterns in the input data. This feature makes GNG much more useful for anomaly detection (Šolić et al., 2018; Šantić et al., 2021). GNG analyses were performed using SOM Toolbox version 2.0 for MATLAB. Input data initially included five variables (number of anchovy eggs per square meter, number of anchovy larvae per square meter, Chl-a concentration, SST and salinity values) for a total of 473 stations. The five ecological variables were arranged as the five columns in an array, with rows representing 360 stations that resulted after removing 113 rows that contained members with NaNs. GNG training was extended to 3000 epochs with an initial step of 0.1 and the number of BMUs was set to 9. When the calculated BMUs were matched with the input data, the spatiotemporal order of the BMUs was determined. Corresponding statistics were calculated that included the annual frequency of each BMU and the range of associated environmental variables.
Upwelling detection method
Sea upwelling is a process when colder water from the deeper layers of the water column reaches the surface. In this surface region, the surface sea temperature has lower values than that of the surrounding sea. Therefore, the areas where upwelling occurs can be easily identified by satellite measurements of sea surface temperature (SST). In the coastal area of the eastern Adriatic, upwelling has been determined by analyzing the measured vertical profiles of temperature and density (Regner et al., 1987) and by analyzing satellite images of SST (Gačić et al., 1997). This process can be characterized as wind-induced coastal upwelling (Bergamasco and Gačić, 1996). During the summer months, upwelling is a consequence of winds such as bora (Cushman-Roisin and Korotenko, 2007), sirocco (Poulain et al., 2004) or NW winds (Beg Paklar et al., 2021) , which give a transient feature to the upwelling areas but strong enough to leave a signal in quasi-steady field (Gačić et al., 1997).
Due to the transient nature of the upwelling that occurs along the eastern and western coasts of the Adriatic, the choice of method for automatic detection of upwelling based on satellite SST data had to be robust. Instead of detection based on a spatial analysis, such as the calculation of the difference between a single pixel and the zonal mean temperature (Lehmann et al., 2012; Sproson and Sahlée, 2014) or the calculation of the SST gradient (Vazquez-Cuervo et al., 2017), detection based on an SST time series analysis was used in this work. From the downloaded L4 1 km satellite data, the daily SST values at each sampling location pixel in the L4 grid for each month of July during the period from 2013 to 2020 were compiled into one dataset. Thus, a dataset with a temporal dimension of 248 daily SST fields for the Adriatic Sea was obtained, from which the we computed, at each location, a July L4 satellite SST time average over all Julys in 2013-2020 period. Upwelling in the SST field was detected by calculating the difference between each pixel in the daily SST field and the calculated mean values over time. Although upwelling in the Adriatic is a phenomenon predominantly associated with the coast, it has also been observed over the eastern part of the Jabuka Pit (Beg Paklar et al., 2021), which can be classified as the open sea. For this reason, no additional condition was applied to limit the detection of upwelling only to the immediate vicinity of the coast, as was done in Lehmann et al., 2012. The detection threshold for upwelling was set to a difference of -2°C, which best describes the areas of strong upwelling that are most common in the area of Kvarner and the central Adriatic (Jabuka Pit and Dugi otok). For each July in the observed 8-year period, the number of days each pixel had a calculated temperature difference equal to or less than the detection limit was counted. Thus, a monthly map of upwelling frequency was constructed. Areas with a difference of -2°C could also be seen in other parts of the Adriatic. They have been excluded because they are outside the scope of this research interest and mostly the number of upwelling days in these areas was negligible compared to the number of days in active upwelling areas.
Results
Descriptive statistics of anchovy egg and larval abundances and environmental variables
Throughout these eight summer scientific surveys (2013-2020) 473 ichthyoplankton samples were collected (approximately 60 samples per expedition; Table 1, Figure 1). Out of all collected ichthyoplankton samples, about 74% of them had anchovy eggs and larvae. Overall, 6183 anchovy eggs and 4317 anchovy larvae were collected. On positive stations the anchovy egg abundance across the whole investigated period varied from 4 to 864 eggs/m2, while the mean egg abundance per survey went from 36.10 ± 30.37 eggs/m2 (2016) to 145.27 ± 198.80 eggs/m2 (2013). The range of anchovy larvae abundance within the investigated period was 4 to 952 larvae/m2. Considering this abundance at the survey level on an annual basis, the lowest mean value of larval abundance was recorded in 2018 (14.46 ± 12.64 larvae/m2), while the highest value (115.11 ± 160.04 larvae/m2) was recorded in 2013, when the highest value of abundance of anchovy eggs was also recorded (145.27 ± 198.80 eggs/m2). The lowest mean value of egg abundance was recorded in 2016 (36.10 ± 30.37 eggs/m2). Overviewing the obtained abundances of anchovy early life stages (eggs and larvae) over the investigated period of eight years, a clear decrease (negative trend for both variables) was observed (Supplementary Figure 1). A negative trend can also be observed visually by looking at the spatial distribution of anchovy eggs and larvae in the period 2013 - 2020 (Figure 2, 3). It manifested itself most clearly in the decrease of medium egg abundance (100 - 500 eggs/m2) from 20 percent share in total abundance to 5 percent during the 8-year period, in the increase of low egg abundance (1 - 100 eggs/m2) from 40 to 70 percent, while the number of stations without egg capture remained constant in the interval of 20 - 30 percent (Figure 2). The same pattern was also seen for anchovy larval abundances, with similar percentages and their decrease or increase for the same abundance classes for eggs (Figure 3). High values for eggs and larvae (500 - 700 eggs/m2 or larvae/m2, respectively) were either at the level of few occurrences or did not occur at all in some years. All anchovy and environmental data were summarized year by year in a boxplot (Figure 4). Outliers were skipped to provide a more meaningful report. 2013 was the year with the largest interquartile range (IQR) for larvae and the second largest for egg (Figures 4A, B). 2015 had the largest IQR for eggs (Figure 4B). Annual medians for eggs fluctuated closely around the median of the entire egg dataset throughout the study period (median value was 16), while annual medians for larvae peaked in 2017 (median value was 36) and then dropped dramatically to a value of 4 in 2020. Most striking, however, is the decline in IQR for both variables during the observation period. For eggs, this value is two and a half times lower in 2017 and twice as low in 2020 as in 2013, while for larvae it is almost ten times lower in 2020.The mean Chl-a value remained almost constant during the observation period, but in the last two years its IQR decreased compared to previous years (Figure 4C). In contrast to the anchovy variables, the SST annual medians and IQRS values did not show large fluctuations (Figure 4D). The medians of salinity varied between 37.8 and 38.5 between 2013 and 2018 with similar IQR values, but in 2019 and 2020 the medians reached 38.6 and 38.8 with a large decrease in IQR values (Figure 4E).
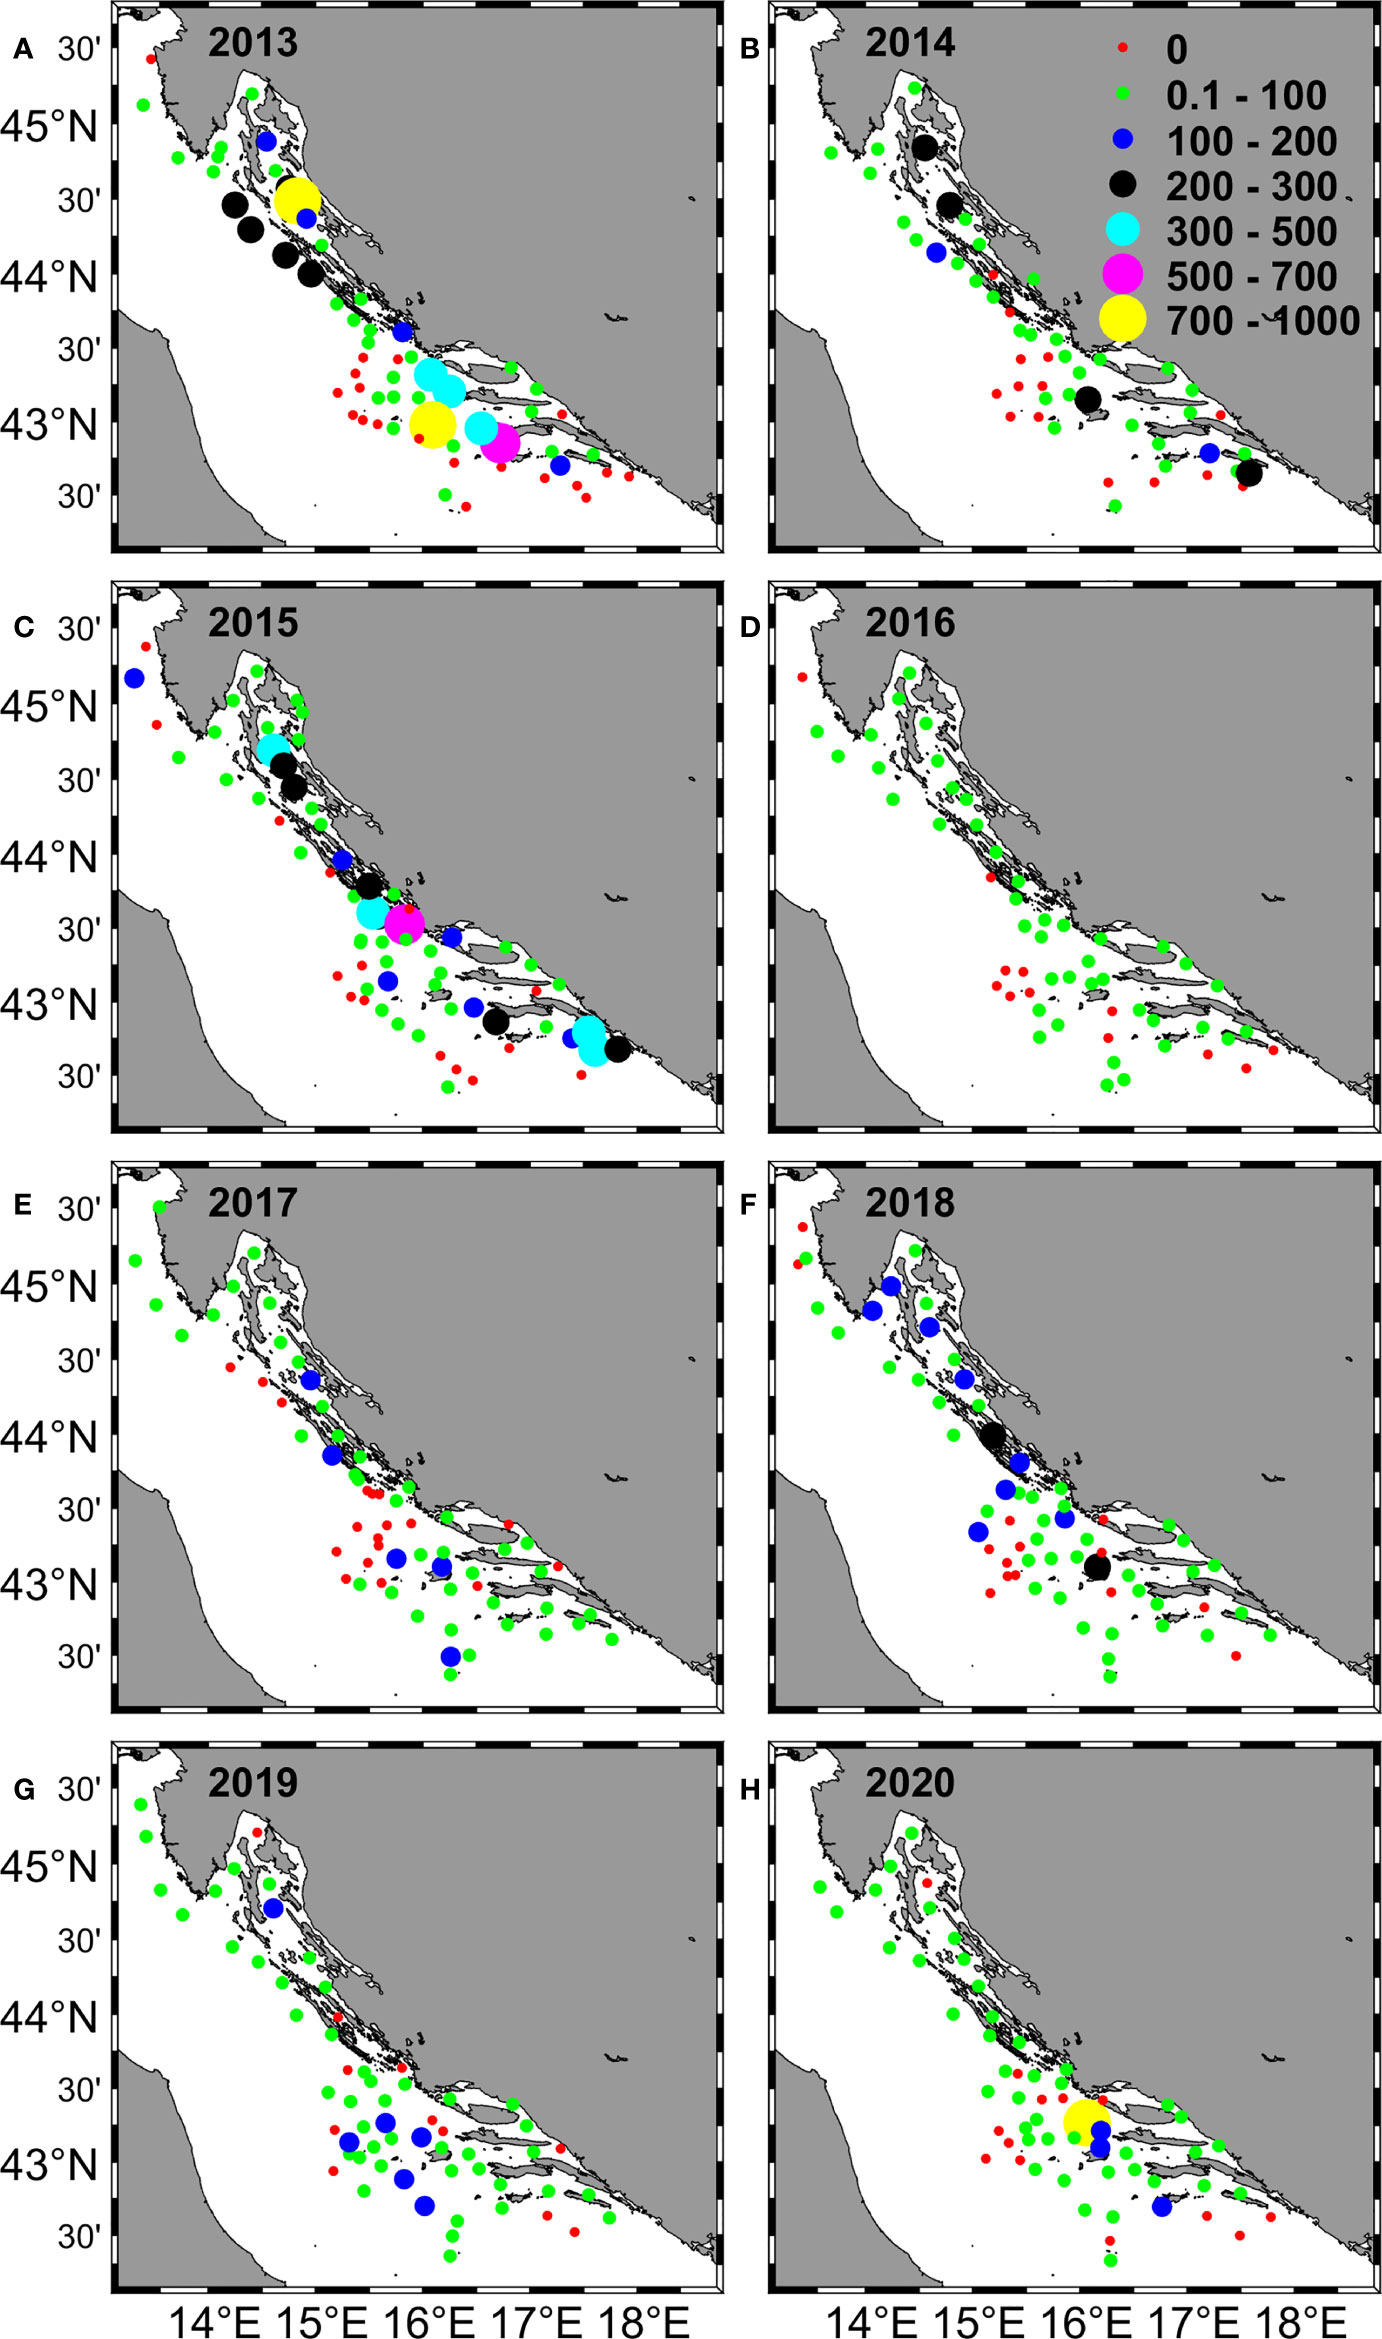
Figure 2 Distribution of Adriatic anchovy eggs collected in the eastern Adriatic Sea during summer surveys from 2013 to 2020 (A–H). The abundance of eggs (eggs/m2) is represented by different circle sizes and colors.
Figure 3 Distribution of Adriatic anchovy larvae collected in the eastern Adriatic Sea during the summer surveys from 2013 - 2020 (A–H). The abundance of larvae (larvae/m2) is represented by different circle sizes and colors.
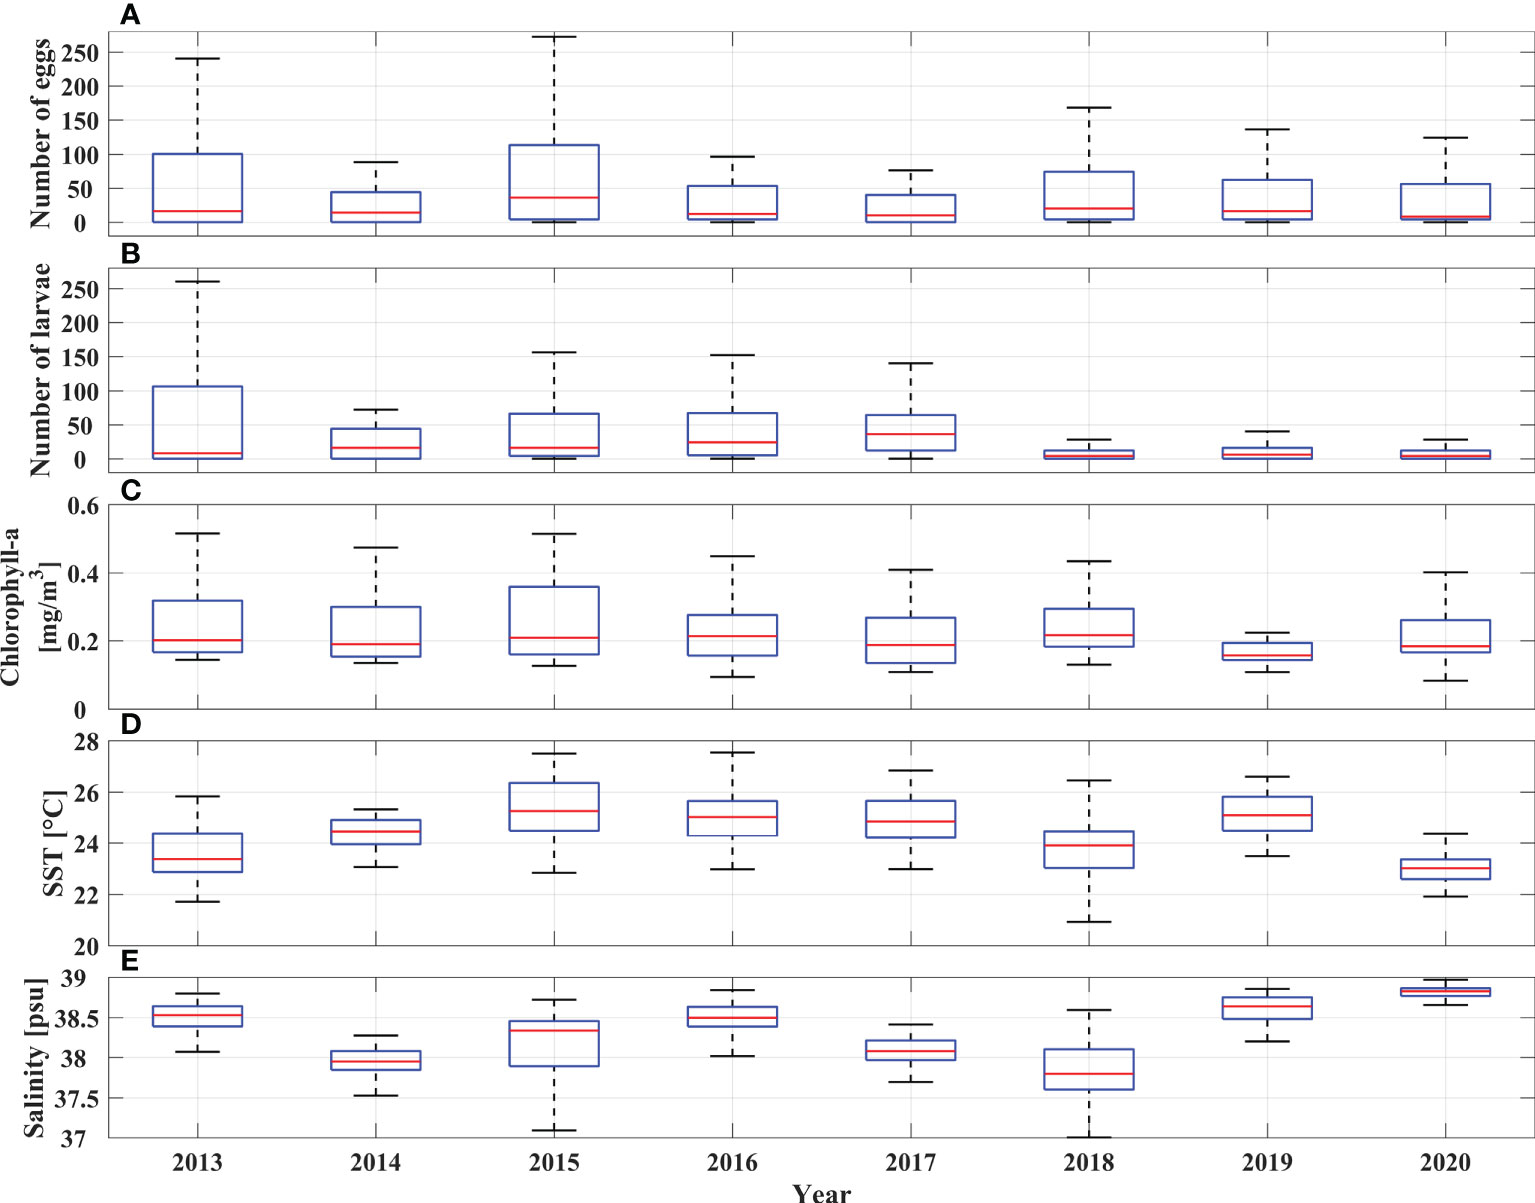
Figure 4 Boxplots of Adriatic anchovy egg (eggs/m2) (A) and larval abundance (larvae/m2) (B) collected through the summer surveys and the associated values of satellite Chlorophyll-a (mg/m3) (C), satellite sea surface temperature (°C) (D) and modeled salinity (E) for the period 2013 - 2020.
Relationships between the abundance of anchovy eggs and larvae and environmental parameters
GNG analysis cataloged the abundance of anchovy eggs and larvae along with salinity, SST, and Chl-a in 9 BMUs. To better illustrate the relationship between the analyzed variables, the BMUs anomalies were calculated and presented with bar graphs (Figure 5A). The procedure for calculating the anomalies was as follows: for each variable cataloged in nine BMUs, a separate normalization of the real values was performed, i.e., a standardized difference from the mean values was made. The reason for this was that they contribute equally when calculating the neural gas and besides that, they do not have a dimension. The occurrence of BMU was calculated as the smallest distance between BMU and particulate data vector. After that, for each BMU, we calculated the overall frequency of occurrence for the entire period (shown later in the text) and the frequency of occurrence for each year separately (Figure 5B). The BMUs were plotted on the map of the Adriatic Sea for each analyzed year to get a better insight into the spatio-temporal variability of all input variables and their connection to the dynamics of the Adriatic Sea (Figure 6). In addition, BMU values were plotted in Supplementary Figure 2 and presented in Supplementary Table 1.
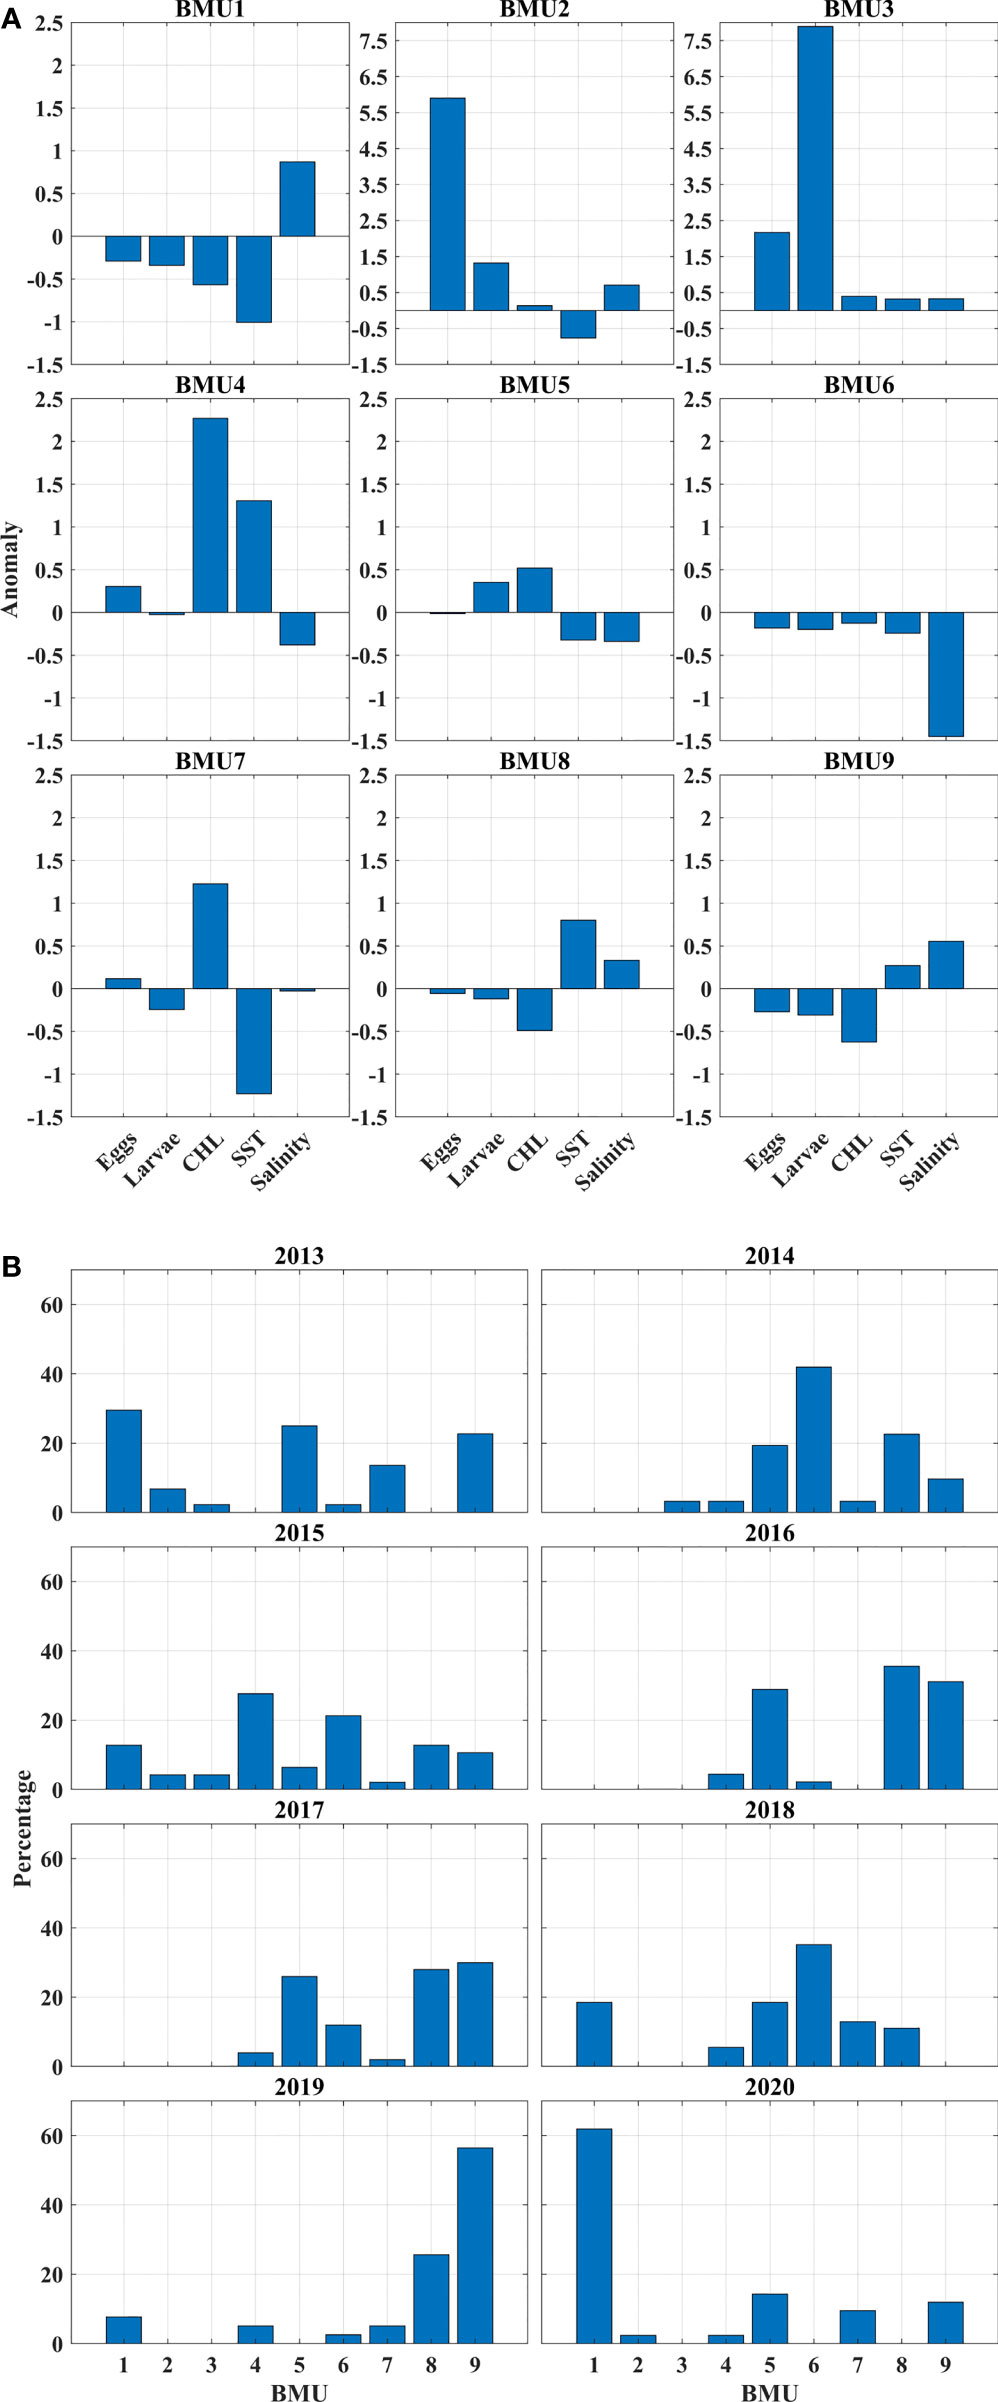
Figure 5 (A) Bar chart of Adriatic anchovy egg and larval abundance, environmental (Chl-a) and oceanographic (SST and salinity) variables cataloged in nine best matching units (BMUs) and represented by anomalies. (B) Bar chart of the frequency of occurrence of nine BMUs for each year in the 2013 - 2020 survey period.
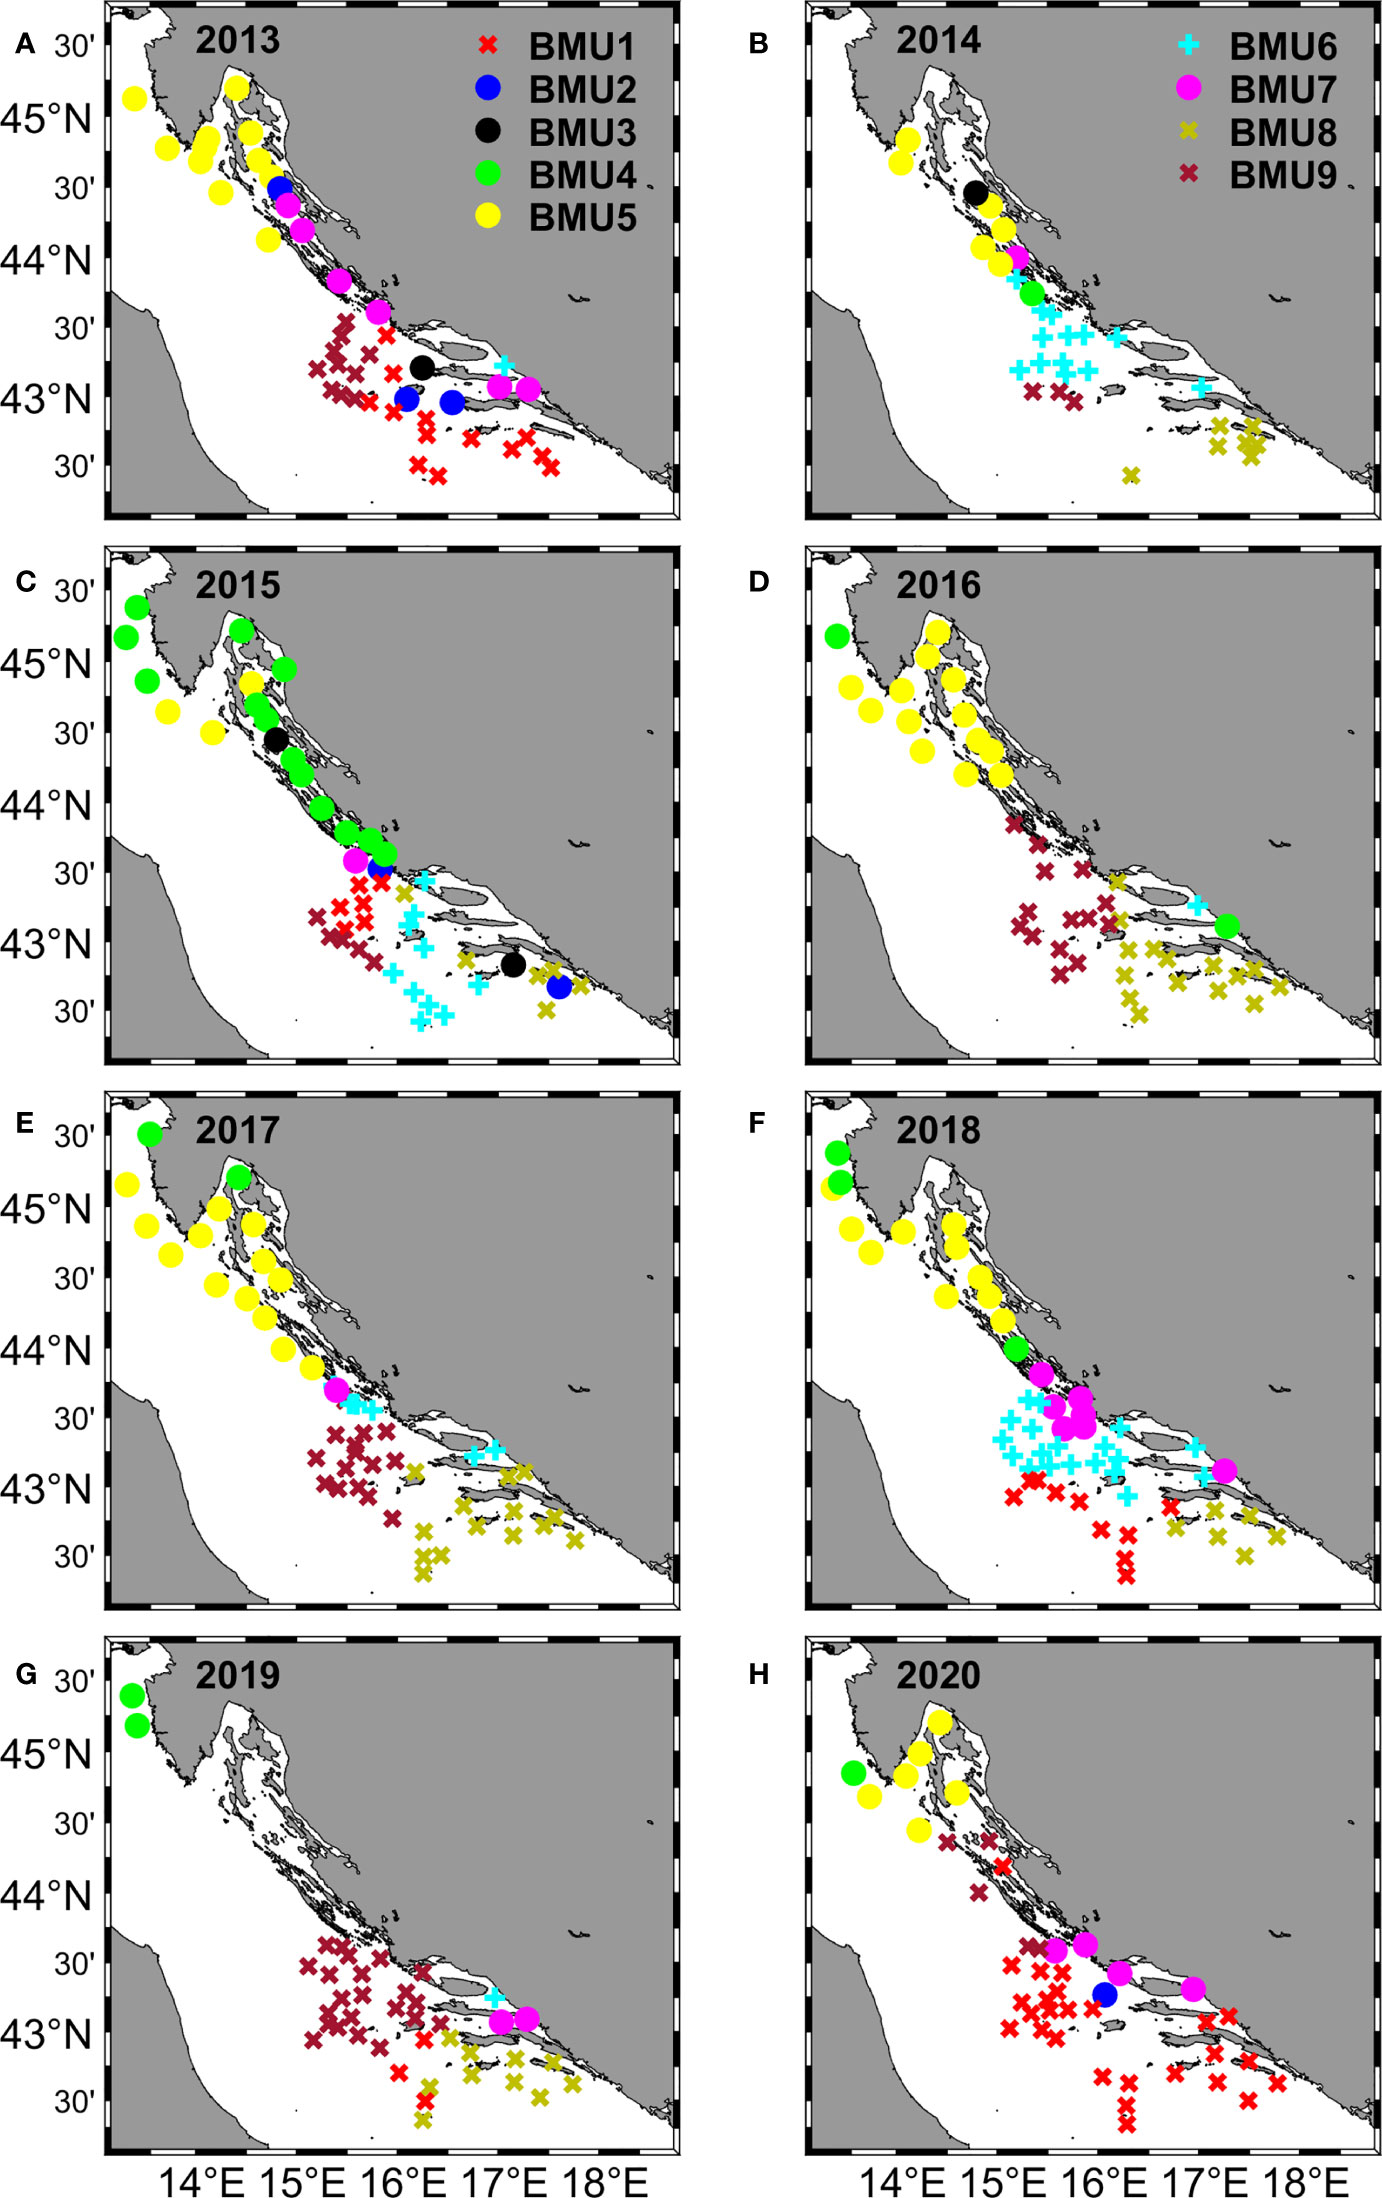
Figure 6 Spatial distribution in the eastern Adriatic Sea of the nine Best Matching Units (BMUs) for each year during the 2013 - 2020 survey period (A–H). BMUs are represented by a different color and are divided into three different groups, identified by different symbols: X, denoting BMUs with elevated salinity and low numbers of eggs and larvae (1, 8, 9) ) (less abundant BMUs in further text) ; o, denoting BMUs with elevated abundance of eggs and larvae (2, 3, 4, 5, 7) (more abundant BMUs in further text); +, denoting BMUs with low salinity and low numbers of eggs and larvae (6).
BMU1 represented a pattern that occurred in 16% of all cases. It was characterized by a negative anomaly for eggs and larvae, Chl-a and SST, but with the highest positive anomaly for salinity. It occurred in the central and southern Adriatic Sea in 2013, 2015, 2018 and 2019 within 10-30% of cases and in 2020 with more than 50% of cases. Considering the BMU values, extremely low concentrations of eggs and larvae were observed, coupled with a Chl-a concentration of 0.2 mg/m3, SST of 23°C and salinity of 38.7, which is the highest value of all BMUs.
BMU2 accounted for only 2% of the total cases. The main features were the highest positive anomaly in egg count combined with positive anomalies in larvae, Chl-a and salinity and a negative anomaly in SST. It occurred in 2013 in Kvarner Bay and near the island of Vis, in 2015 near the island of Mljet, and in 2020 north of the island of Vis. The BMU values showed the largest number of eggs (about 600), the second largest number of larvae (about 150), accompanied by average values for Chl-a (0.25 mg/m3) and SST (23.4°C) and the second largest value for salinity (38.59).
BMU3 described the pattern with the rarest occurrence with a proportion of only 1%, characterized by the highest positive anomaly for larvae, the second highest anomaly for eggs and positive anomalies for all other parameters. It occurred from 2013 to 2016 in the Kvarner Bay and near the islands of Vis and Mljet. The BMU values confirmed the BMU anomalies, with the second highest number of eggs (about 200) and the highest number of larvae (about 600) coinciding with the average values for Chl-a, SST and salinity.
BMU4 occurred in 7% of the total cases. Looking at the annual percentages, they ranged from zero (2013) to about 5% (2014, 2016, 2017 and 2018) to 15% in 2020 and almost 30% in 2015. It had the highest overall positive anomalies for Chl-a and SST, accompanied by a positive anomaly for eggs and negative anomalies for larvae and salinity. From 2014 to 2020, it always occurred in the area of the west coast of Istria, with some occurrences in Kvarner Bay and the area of Dugi otok. In terms of values, this BMU had the highest Chl-a concentration (0.48 mg/m3) and the highest SST (26°C) with salinity slightly above 38. The number of eggs was the third highest (82) and the number of larvae was low (34).
BMU5 is the second most common pattern with 17% of occurrence. It is described with positive larval and Chl-a anomalies paired with negative anomalies for SST, salinity and eggs. It occurred in all years except 2019 and varied in frequency from a few percent (2015) to more than a quarter of annual cases in 2016 and 2017. A look at the BMU map showed that BMU5 had a similar distribution pattern to BMU4: it mainly included the west coast of Istria, the Kvarner Bay and the area of the island of Dugi otok. BMU values for Chl-a, SST and salinity did not deviate much from the other BMUs, while the number of larvae was third in total abundance.
BMU6 was in terms of anomalies total opposite to BMU3 with negative anomalies for all variables and it had 14% of total incidence. When its annual percentage exceeded 20%, it appeared in the areas of the Jabuka Pit, the island of Vis, and west of the island of Mljet (2014, 2015, 2018). In the cases where it appeared in a very small percentage, it was usually near the mouth of the river Neretva (2013, 2017, 2019). BMU6 had the lowest salinity of 37.62, along with low numbers of eggs and larvae.
BMU7 occurred in 6% of cases. The main features were a mildly positive anomaly for anchovy eggs paired with a markedly positive anomaly for Chl-a. Negative anomalies ranged from mild for larvae and salinity to markedly negative for SST. Annual frequency never exceeded 13%, with the caveat that it did not occur in 2016. The spatial scope included the area of the island of Dugi otok, the eastern parts of the Jabuka Pit and a few occurrences near the mouth of the Neretva River. BMU7 had the lowest value for SST (22.85°C), the second highest for Chl-a (0.37 mg/m3), increased egg count (64) with lower values for salinity and larvae compared to the other BMUs.
BMU8 was characterized by negative anomalies for egg and larval numbers and Chl-a, but with positive anomalies for SST and salinity. Its total abundance was 16%. It was most abundant south of the island of Vis and in the area of the island of Mljet. In 2013 and 2020 there was no occurrence of this BMU, while in other years annual abundances varied from 12 in 2015 to 35% in 2016. As for the values, the most important features were the second highest SST value (25.43°C), high salinity (38.43), one of the lowest values for Chl-a (0.18) and a very low number of eggs and larvae.
BMU9 described 21% of the samples and was the most frequent pattern overall. In terms of anomalies, it had the same distribution of positive and negative anomalies as BMU8, but at the same time, the salinity for this BMU was higher than the SST value. It covered the area north of BMU8 and extended from the island of Vis through the Jabuka pit to the northern edges of the island of Dugi otok. In 2016 and 2017 it was present in one-third of the occurrences and in 2019 it was the most common BMU with more than half of the occurrences. BMU values were similar to BMU8, but salinity was slightly higher. Upon closer examination, it was found that these 9 BMUs can be divided into three new categories that facilitate further discussion (Figure 6; Supplementary Figure 2). The three new groups were identified by different symbols: X, for BMUs with increased salinity and low numbers of eggs and larvae (1, 8, 9) (less abundant BMUs in further text); o, for BMUs with increased abundance of eggs and larvae (2, 3, 4, 5, 7) (more abundant BMUs in further text); +, for BMU with low salinity and low numbers of eggs and larvae (6).
Salinity in the eastern part of Adriatic Sea
Looking at the monthly averages of the modelled spatial distribution of salinity at 10 m depth during the study period, three different patterns can be identified in the eastern part of the Adriatic. In the first pattern, salinity in most eastern areas ranged between 38.3 and 38.6 (2013, 2015, 2016). The second pattern was characterized by lower salinity values (below 38.3) (2014, 2017, 2018) and the third pattern had predominantly salinity values of 38.6 (2019, 2020).
Upwelling in the eastern part of Adriatic Sea
In July, in the eastern part of the Adriatic, there was a strong spatial and temporal variability in the occurrence of upwelling areas identified by the upwelling detection method (Figure 8). Spatially, there were three distinct areas extending from north to south: the area of the Kvarner Bay in the north, the area of the Jabuka Pit and the island of Dugi otok in the middle, and the area around the island of Mljet in the south. Regarding the number of days in which the upwelling occurred, three divisions were made: strong upwelling with a number of days greater than and equal to seven, weak upwelling with a number of days less than seven and non-existent with zero occurrences. The strong upwelling in July 2013 (Figure 8A) and in July 2020 (Figure 8H) was caused by frequent bora winds in the Kvarner Bay area and by frequent NW winds in the areas of the Jabuka Pit, the island of Dugi otok and Mljet (DHMZ, 2013; DHMZ, 2020). The years between 2013 and 2020 in the eastern part of the Adriatic were characterized by the complete absence of upwelling (2014, 2016, 2017 and 2019) (Figures 8B, D, E, G) or weak upwelling (2015 and 2018) (Figures 8C, F) caused by a small number of days with bora and NW winds (DHMZ, 2013; DHMZ, 2014; DHMZ, 2015; DHMZ, 2016; DHMZ, 2017; DHMZ, 2018; DHMZ, 2019).
Primary production in the eastern part of the Adriatic Sea
To obtain a downright result from the monthly fields of primary production, the anomalies of primary production were calculated by subtracting the mean value for the entire period 2013 – 2020 from each monthly field and dividing the result by the standard deviation of the entire period. The obtained spatial distribution of primary production anomalies in June for the eastern part of the Adriatic showed us a significant spatio-temporal variability for the observed period (Figure 9), ranging from a strongly increased production in the whole observed area (2013), to a slightly increased production in the areas of Kvarner Bay, Dugi otok and Jabuka Pit (2015, 2017 and 2018), to a weaker or stronger decrease (2014, 2016, 2019 and 2020). The observed productivity decline spanned too short a period to statistically verify the negative trend, but the decline in 2014 coincides with the start of the new regime of reduced productivity (Kovač et al., 2018).
Discussion
Anchovy, as a highly important fishery species in the Adriatic Sea, but also worldwide, has been monitored for decades through national monitoring programs that refer to catch data and data from echosounder surveys. Based on the collected data, Adriatic anchovy stock assessments have been made and nowadays its stock is defined as overexploited and in overexploitation (GFCM, 2021). Although standardized ichthyoplankton surveys have not been routinely conducted in the Adriatic Sea, from 2013 till today ichthyoplankton sampling has been carried out within the summer scientific expedition “Mediterranean International Bottom Trawl-Surveys (MEDITS)” to provide spatio-temporal insight in anchovy early life stages occurrences and abundances which may shed light on the lately recorded diminished reproductive potential. Successive ichthyoplankton sampling during the summer months (June-July) over the last eight years (2013 – 2020) revealed the presence of anchovy eggs and larvae over the entire continental shelf of the eastern Adriatic Sea (Croatian fishing ground). This, as well as the values of their abundance ranges (4 – 864 eggs/m2; 4 – 952 larvae/m2), were consistent with previous findings (Gamulin and Hure, 1983; Regner, 1985) for this study area. Between years, abundances of early life stages of anchovy were found to fluctuate slightly but generally showed a decreasing trend over the years. (Supplementary Figure 1). This declining trend in anchovy early life stages coincides with the declining trend in estimated spawning stock biomass that has been associated with fishing pressure (GFCM, 2021). Although fishing mortality could be the cause of this decline, the observed fluctuation in their abundance could also be related to a coincidence/inconsistency between the peak of spawning and the sampling period. Previous scientific studies that investigated the long-term variability in the number of anchovy eggs and larvae in the Mediterranean Sea or the Adriatic Sea and their relationship with ecological parameters mainly used linear methods such as regression, correlation and Generalized Additive Models to analyze four main parameters: SST, salinity, Chl-a concentration and depth (Fernández-Corredor et al., 2021). Our study broke with this common practice of linear methods and showed that nonlinear GNG can be used to explain multiple dependencies, which was also the first hypothesis in this work. We succeeded in describing the interplay between anchovy and environmental variables and presenting it in the context of more understandable patterns. SST, Chl-a and salinity were the main environmental parameters used. However, unlike in previous papers, depth was not considered. The reason for this was that any depth greater than 100 m during sampling was written as 100, resulting in the 100 m depth accounting for more than 30 percent of the measurements.
One of the results of the GNG analysis that catches the eye is the variability of the spatial distribution of BMUs, which shows us that there is a line that divides the Adriatic Sea into two parts: the northern one, where the more abundant BMUs predominate, and the southern one, where the less abundant BMU predominate (Figure 6).The increased abundance of eggs in the Kvarner Bay and near the mouth of the Zrmanja River is consistent with previous studies (Zorica et al., 2015; Zorica et al., 2020), but the constant classification of the west coast of Istria as an area richer in anchovy eggs and larvae is a novelty. It can be said that the average position of the dividing line was at the southern end of Dugi otok, but this position was not fixed in all years, as it fluctuated in the north-south direction. In 2020, it shifted significantly to the north (Figure 6H), as shown by the extension of less abundant and saltier BMUs to the southern edge of Kvarner Bay. The main features of this BMUs, are a positive anomaly for salinity, a negative anomaly for Chl-a, and low numbers of eggs and larvae. This northward push of salinity-dominated BMUs is well supported by the descriptive statistics for salinity, which show a sharp increase in salinity at all stations over the past two years (Figure 4E) and a previously documented overall high salinity in the Adriatic Sea (Mihanović et al., 2021). The aforementioned northerly propagation of higher salinity values in the last two observed years is even more evident in the modeled salinity fields from which the salinity values included in the GNG analysis were extracted (Figure 7). The increase in salinity was mainly due to the BiOS cyclonic regime that brought salty LiW into the Adriatic and dominated during the period 2013-2020, with the exception of 2017 and 2018. The year 2017 was characterized by a transitional phase of BiOS, when the inflow into the Adriatic continued but salinity was still high due to very dry conditions and low river discharge (Beg Paklar et al., 2020; Mihanović et al., 2021). In 2018, BiOS changed to an anticyclonic regime. This change was also captured by GNG, as indicated by the prevalence of the lowest salinity BMU6 in the central Adriatic in 2018 (Figure 6E). Apart from the influence of BiOS, BMU6 successfully mapped the effects of the increase in freshwater due to the combination of river inflow and rain in 2014 (Figure 6B) (Mihanović et al., 2018; Kokkini et al., 2020) and the average lower salinity values in the southern Adriatic in 2015 (Figure 6C) (Mihanović et al., 2021). BMU from more abundant class located near the mouth of the Neretva River associated a slightly increased egg abundance with river flows that brought freshwater and decreased salinity in 2013, 2018 and 2019 (Supplementary Table 2). In the central Adriatic near the island of Dugi otok and the Jabuka Pit, the influence of more frequent upwelling, which brought colder water to the surface, was evident in 2013, 2018, and 2020 (Figure 8). From previous studies, these areas are considered important spawning areas due to the abundance of upwelled nutrients (Regner et al., 1987; Sinovčić, 2000; Zorica et al., 2015; Zorica et al., 2019; Zorica et al., 2020). When looking at BMUs with a focus on salinity, we found that lower numbers of eggs and larvae were associated with BMUs with higher salinity values (above 38.4), which we classified as less abundant BMUs, and with BMU6 with lower salinity (37.6) (Supplementary Figure 2 and Supplementary Table 1).Together, they accounted for nearly 60% of total BMU cases from 2013 to 2020, and during the observed period, their annual cumulative share not only never fell below 55%, but reached as high as 90% in 2019 (Figure 5B)¸ For the more abundant BMUs, but not those with extreme values (2, 3), salinity ranged from 38.10 to 38.26, and their cumulative proportion showed a downward trend toward 10% in 2019 (Figure 5B). Together, they accounted for nearly 30% of the total BMU cases from 2013 to 2020 during the investigated period. BMUs from the more abundant class but with extreme abundance of eggs and larvae (2, 3) were an exception to the salinity effects observed for the other BMUs of the same class. Their cumulative abundance was about 3% and, in some years, they were not observed at all (2015, 2016, 2017, 2018) (Figure 5B). In terms of salinity, their values 38.59 and 38.42 were higher than the salinity values for less abundant but more frequent BMUs such as 4, 5 and 7. Considering only the salinity part of the BMU analysis, we see that a dome-shaped relationship was observed for the BMUs comprising 97% of the analysis, where the most frequent but not the most abundant BMUs were associated with salinity values between 38.1 and 38. 3. It was known from previous studies in the Adriatic Sea that anchovy eggs were found in environments where salinity reached values between 9.1 and 38.7 (Betulla Morello and Arneri, 2016) and a positive correlation between abundance and salinity was found in a small-scale study area (Mandić et al., 2019), but in this work, we uncover a nonlinear relationship between abundance and salinity, which is particularly important when considering the increase in salinity in the Adriatic Sea, which is mainly driven by the decrease in river outflow, lower precipitation, and the influx of saline water from the Mediterranean Sea (Mihanović et al., 2021; Matić et al., 2022). Besides for salinity, anchovies also showed high tolerance for temperature during spawning (peak values were observed in a range between 18 and 28°C) (Betulla Morello and Arneri, 2009). Similar results were found using GNG in this paper, where no strong relationship between abundance and temperatures was observed. BMUs with increased abundance of eggs and larvae covered the entire temperature range: from the lowest value 22.84°C associated with river inflow and upwelling to the highest value of 26°C. The third environmental parameter we attempted to link to abundance was satellite-measured Chl-a. Compared to the two previously analyzed parameters, it showed a significant positive relationship with abundance, consistent with previous studies (Maynou et al., 2020). In all BMUs classified as more abundant, Chl-a levels exceeded 0.2 mg/m3. These values represent a significant increase in Chl-a concentration in an oligotrophic environment such as the eastern part of the Adriatic Sea (Kovač et al., 2018). Previously in this paper, we investigated what is behind anchovy spawning by examining three environmental parameters and their interplay by GNG analysis. Of the physical processes going on in the background, we looked at the BiOS during salinity analysis. And during the SST analysis, the importance of upwelling became clear (Figure 8). This was especially true for more abundant BMU7, which had lower SST values, higher Chl-a values, egg and larval abundances, and was located in areas previously known for upwelling (Gačić et al., 1997) (Figure 6). BMUs from all three groups were observed on the outer coast of Dugi otok and the eastern part of the Jabuka Pit in strong upwelling years 2013 and 2020 and in weak upwelling years 2015 and 2018. The strong upwelling in 2013 had no significant effect on the increase in abundance of eggs and larvae in the Jabuka Pit, as we can see from the distribution of less abundant BMUs. The reason is that in 2013 extremely high air temperatures were measured in this part of the Adriatic, so the areas under the influence of upwelling did not have an overall low SST, considering the whole period of investigation (DHMZ, 2014a). Closer to the mainland, where upwelling is more frequent, more abundant BMUs with the lowest SST values were found. 2015, although with far fewer upwelling days compared to 2013, had a similar distribution of BMUs in the eastern Jabuka Pit. Another year of weak upwelling, 2018, had a different spatial distribution of BMUs in the area compared to previous years: more saline but less abundant BMUs were replaced by less saline and also less abundant BMUs, but egg-rich and low SST BMUs appeared near the mainland. And finally, when we look at 2020 with a pronounced upwelling in the same area, we see that less abundant BMUs are the most common, while the more abundant BMUs are rare. Thus, the GNG analysis shows that upwelling influence on abundance can be diminished by the influence of salinity. This phenomenon was most easily seen by comparing the July 2013 and 2020 maps: strong upwelling is observed (Figures 8A, H), but high salinities covered the entire Adriatic Sea in 2020 (Figure 7H), resulting in lower primary production (Figure 9H) and lower abundance of eggs (Figure 2H) and larvae (Figure 3H) compared to 2013 (Figures 9A, 2A, 3A).We found a positive relationship between egg and larval abundances and Chl-a concentration, but this only raises the question of primary production. Previous analyses of long-term data showed that primary production can affect anchovy spawning with a delay of up to 2 months (Regner, 1996; Zorica et al., 2013). To test this claim, anomalies in primary production were examined in July (Figure 9) for the direct relationship and in April, May and June (Supplementary Figures 3, 4 and 5) for the delayed relationship. In the most productive years of 2013 and 2015 (Figures 4A, B), there was a strong positive anomaly since May for the entire basin (2013) and for the north-eastern part of the Adriatic basin (2015), culminating in very high primary production in July in both years. This was reflected in a large number of stations along the entire eastern coast where a large number of eggs were sampled (Figures 2A, C; 3A, C), or, in terms of BMUs, in an increased spread of more abundant BMUs. In the case of 2018, a different time shape has appeared. April, May and June had positive anomalies of primary production in the eastern part of the Adriatic, but in July the value of the anomaly decreased. Thus, the question of which month makes a greater contribution to spawning abundance, the current month or the previous one, cannot be answered accurately by looking at the monthly mean values. However, using this tool, it can be clearly stated that abundance increases in areas where there has been a large primary production up to two months prior to sampling. And conversely, which is particularly observable for 2014 and 2019, negative primary production before and during sampling is reflected in lower abundance.
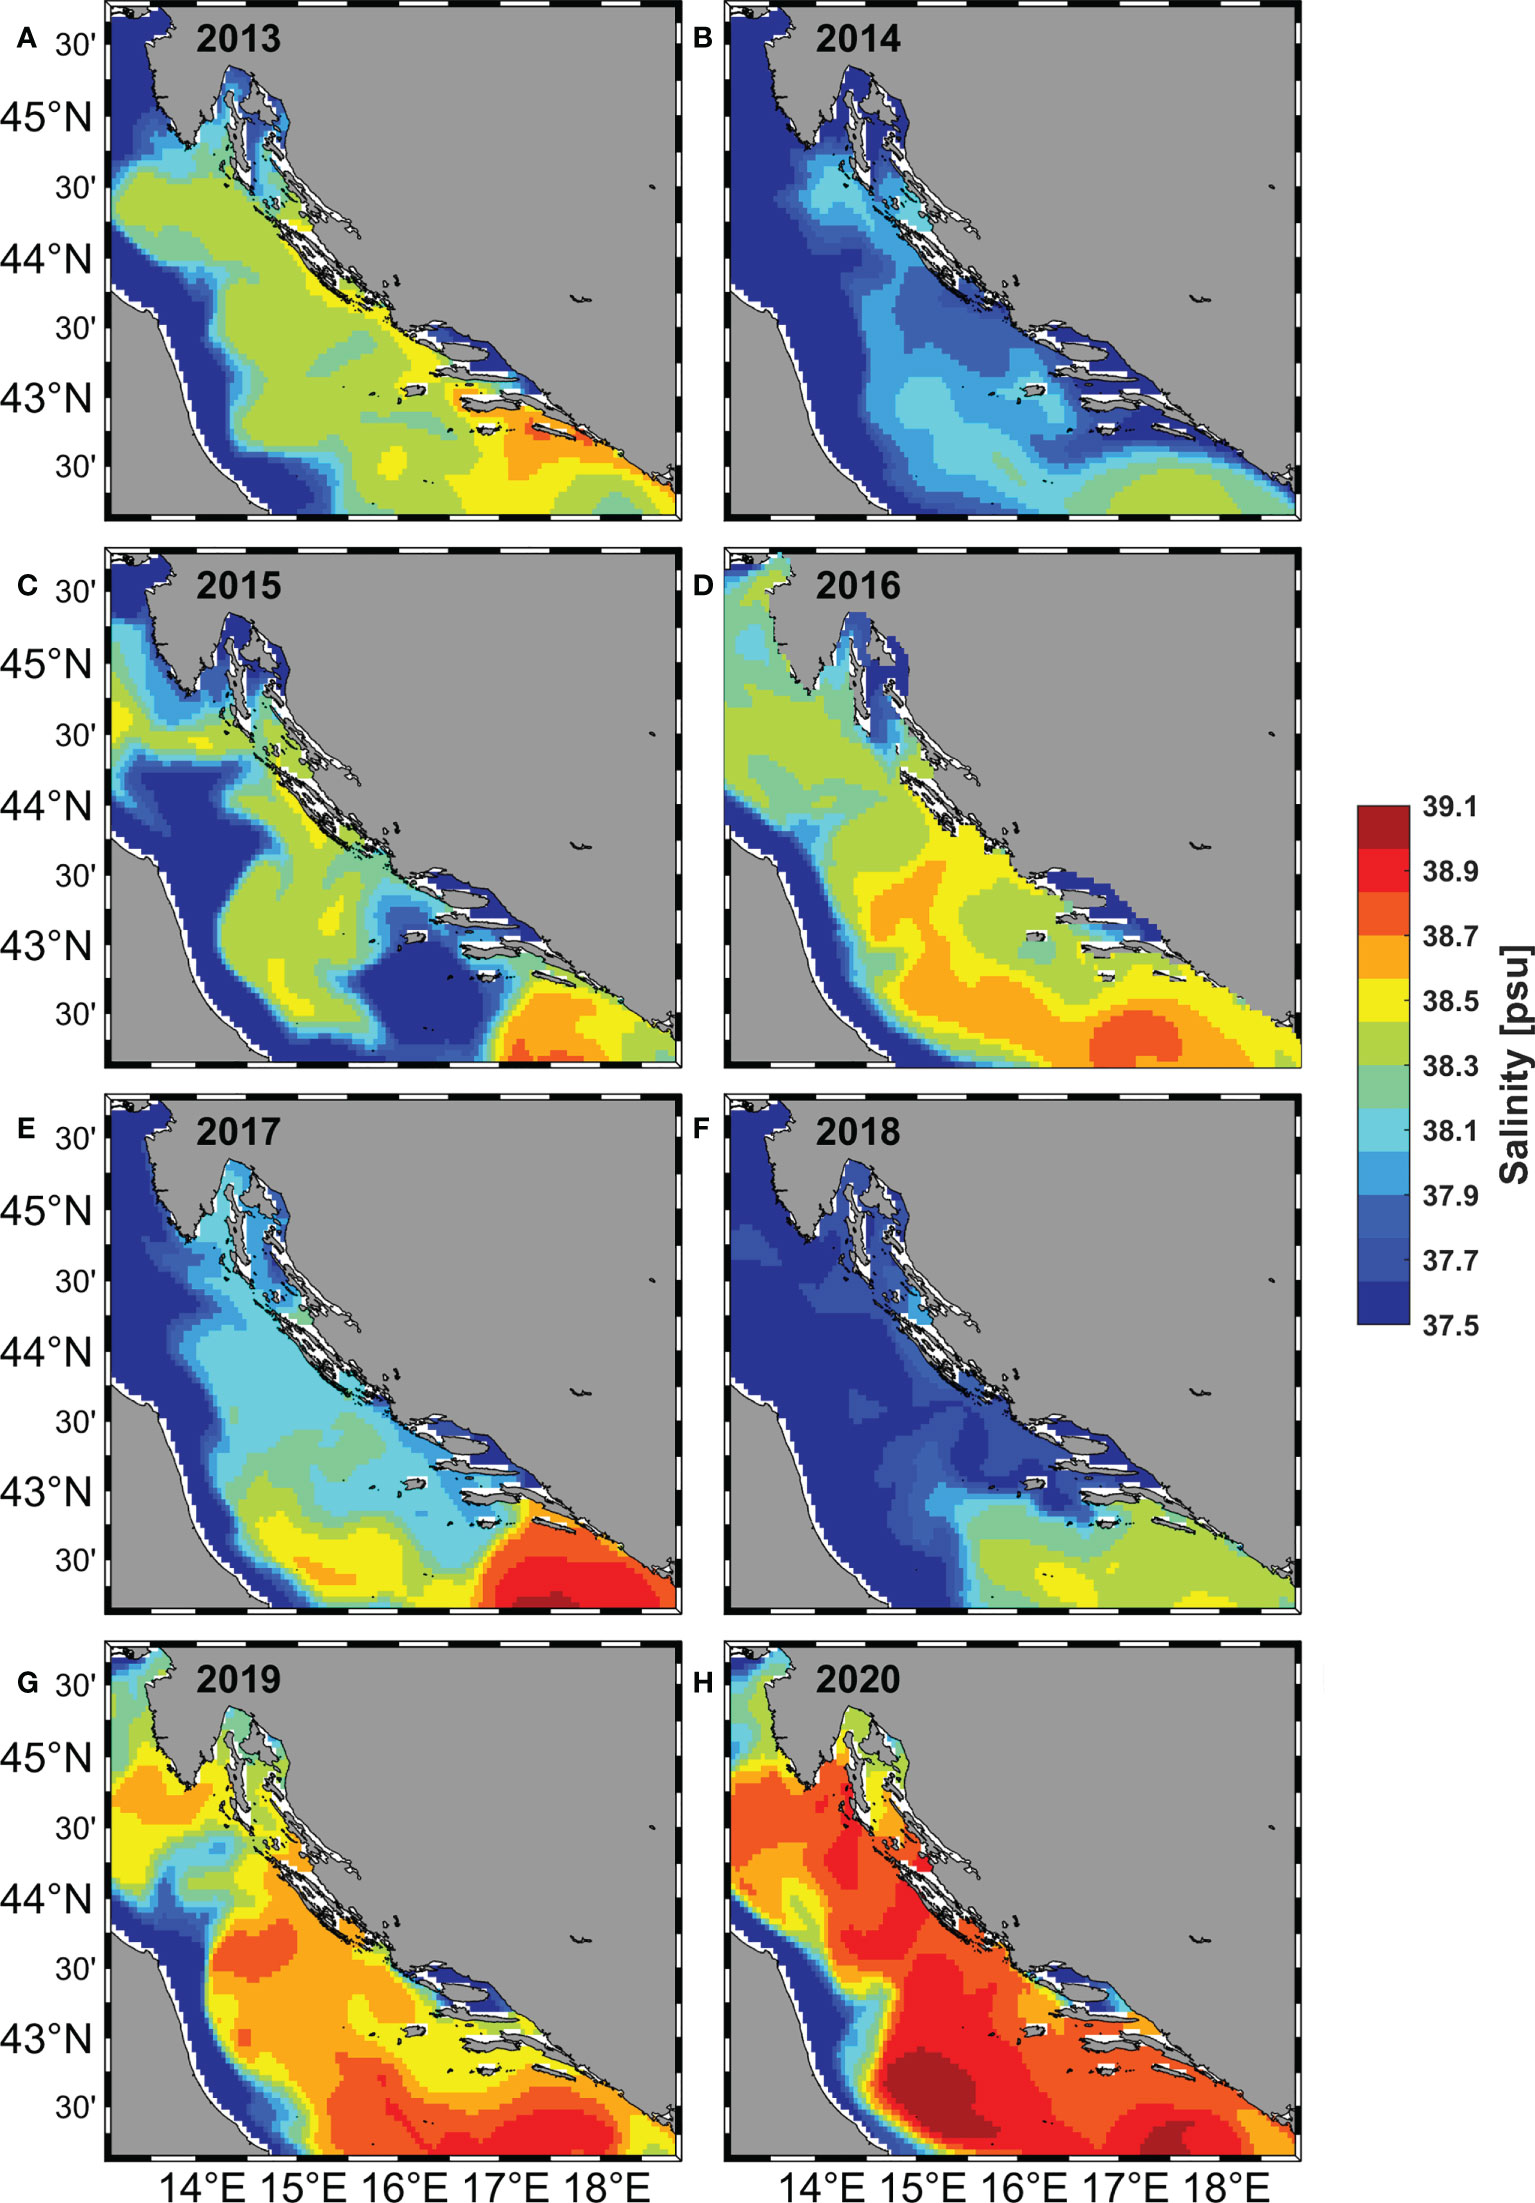
Figure 7 Monthly average map of the modelled salinity at 10 m depth in the Adriatic Sea for the month July in the period 2013 – 2020 (A–H).
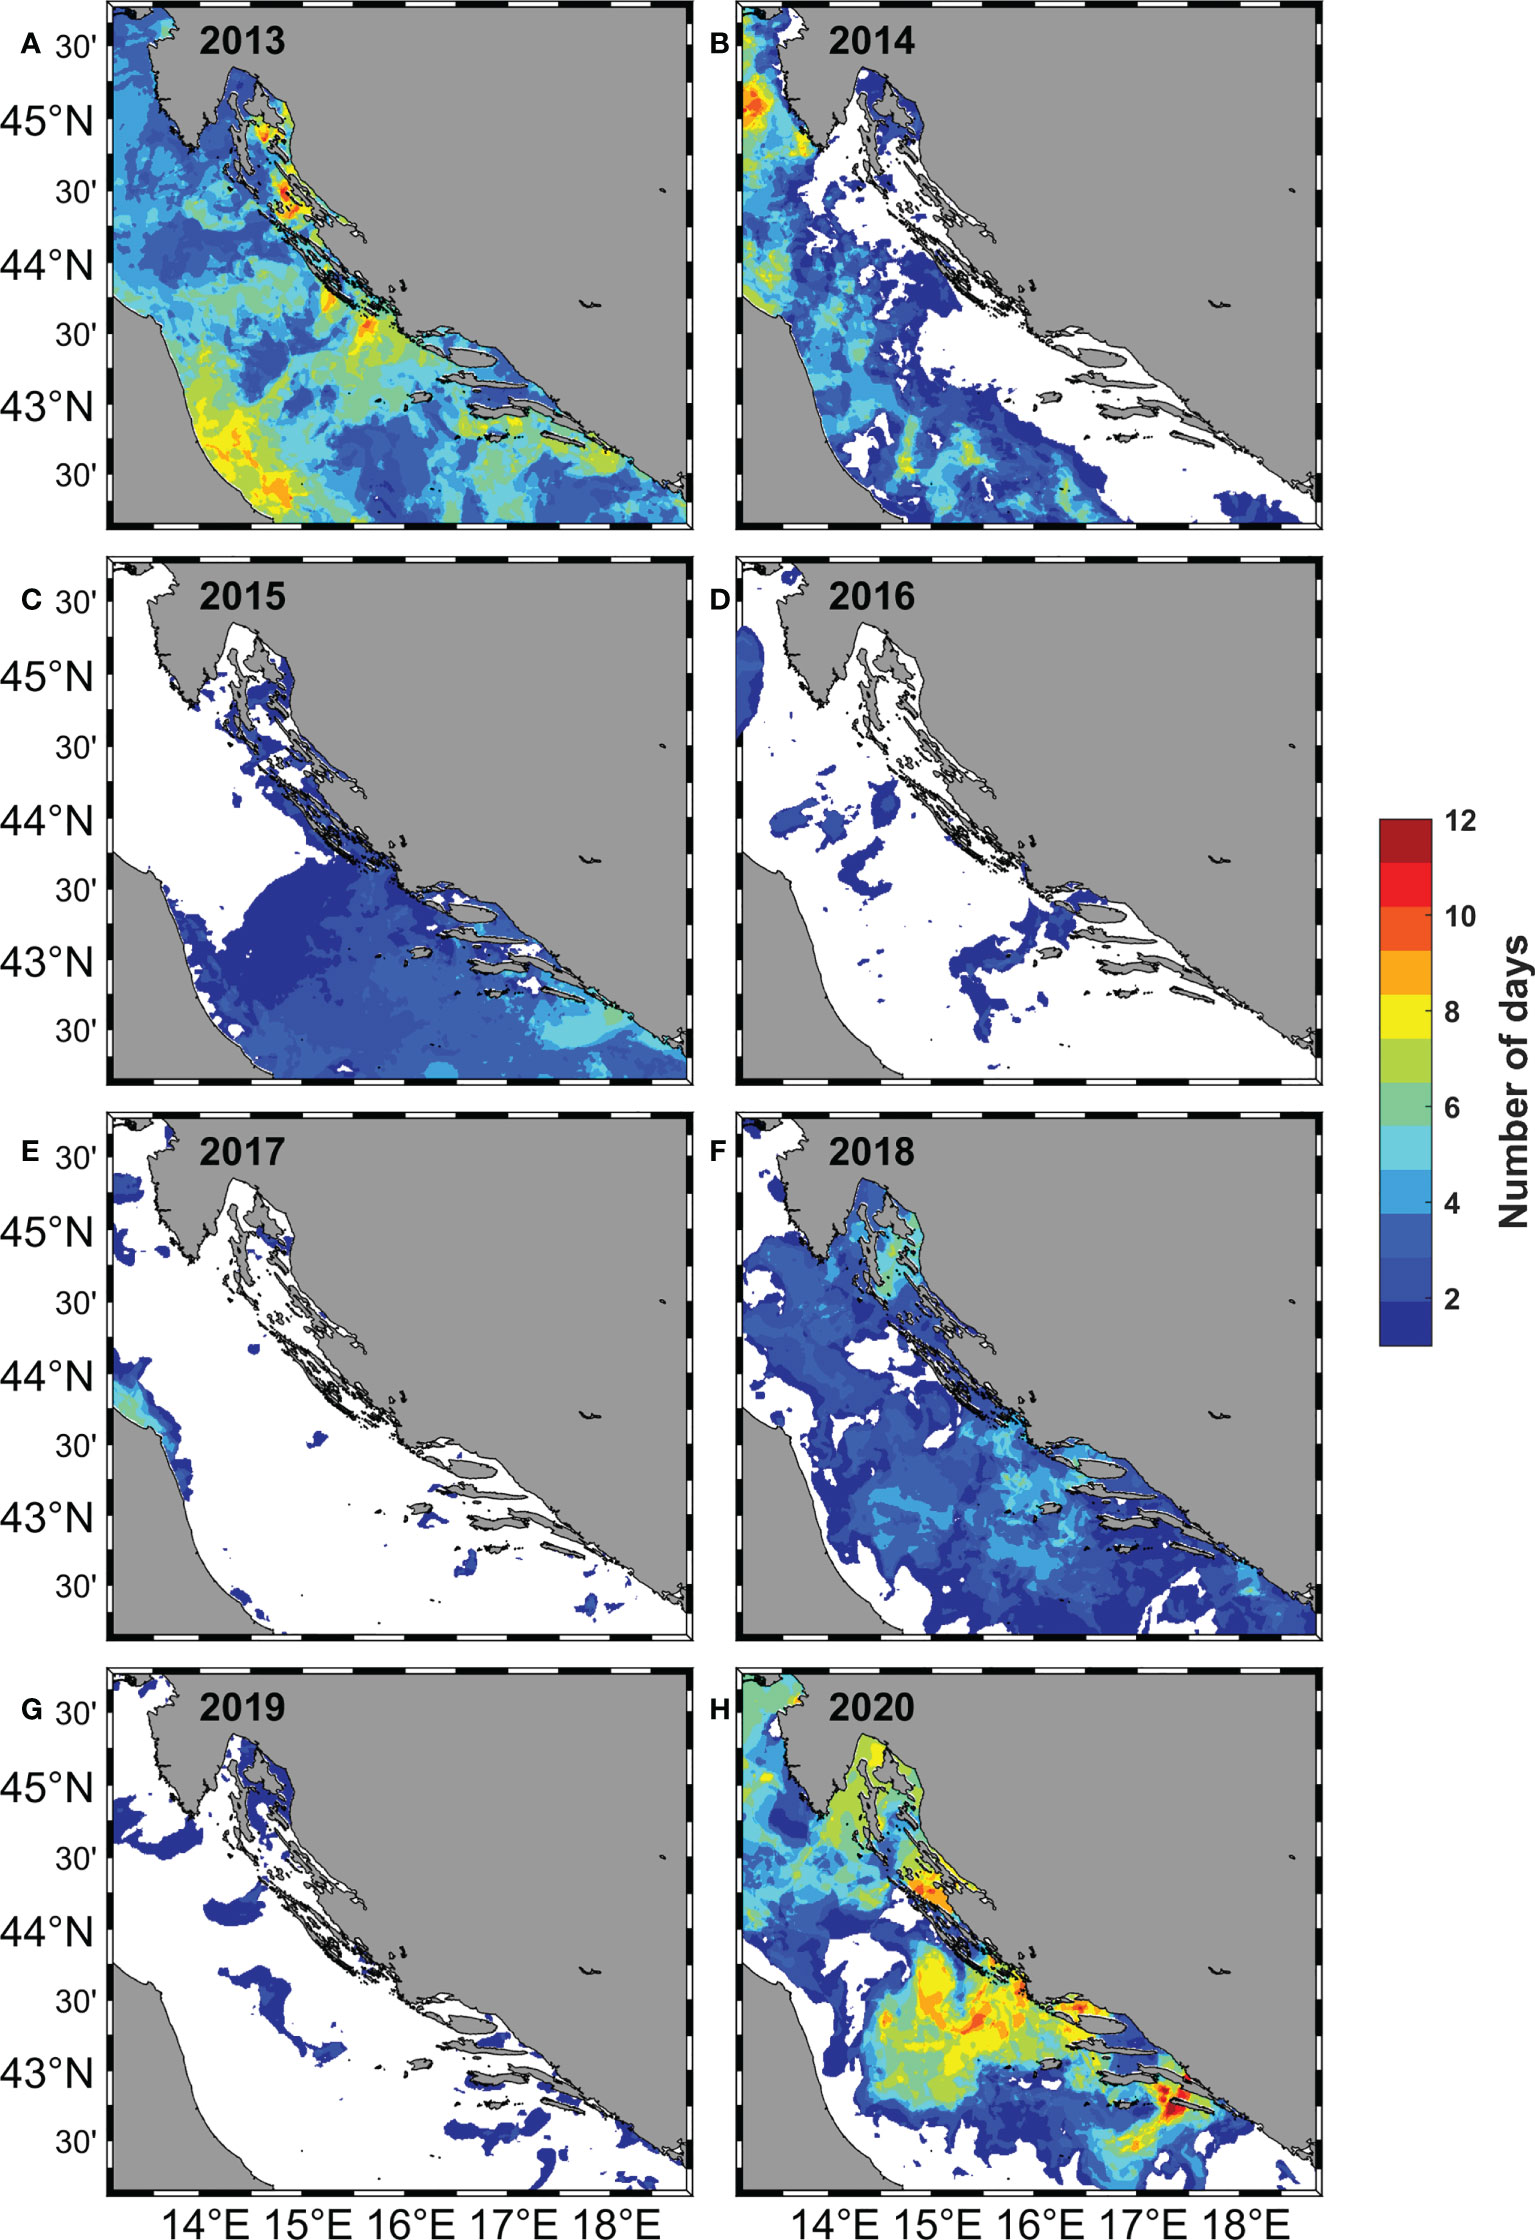
Figure 8 Number of days for the month of July in 2013 - 2020 (A–H) when upwelling occurred, was determined using the upwelling detection method based on SST maps.
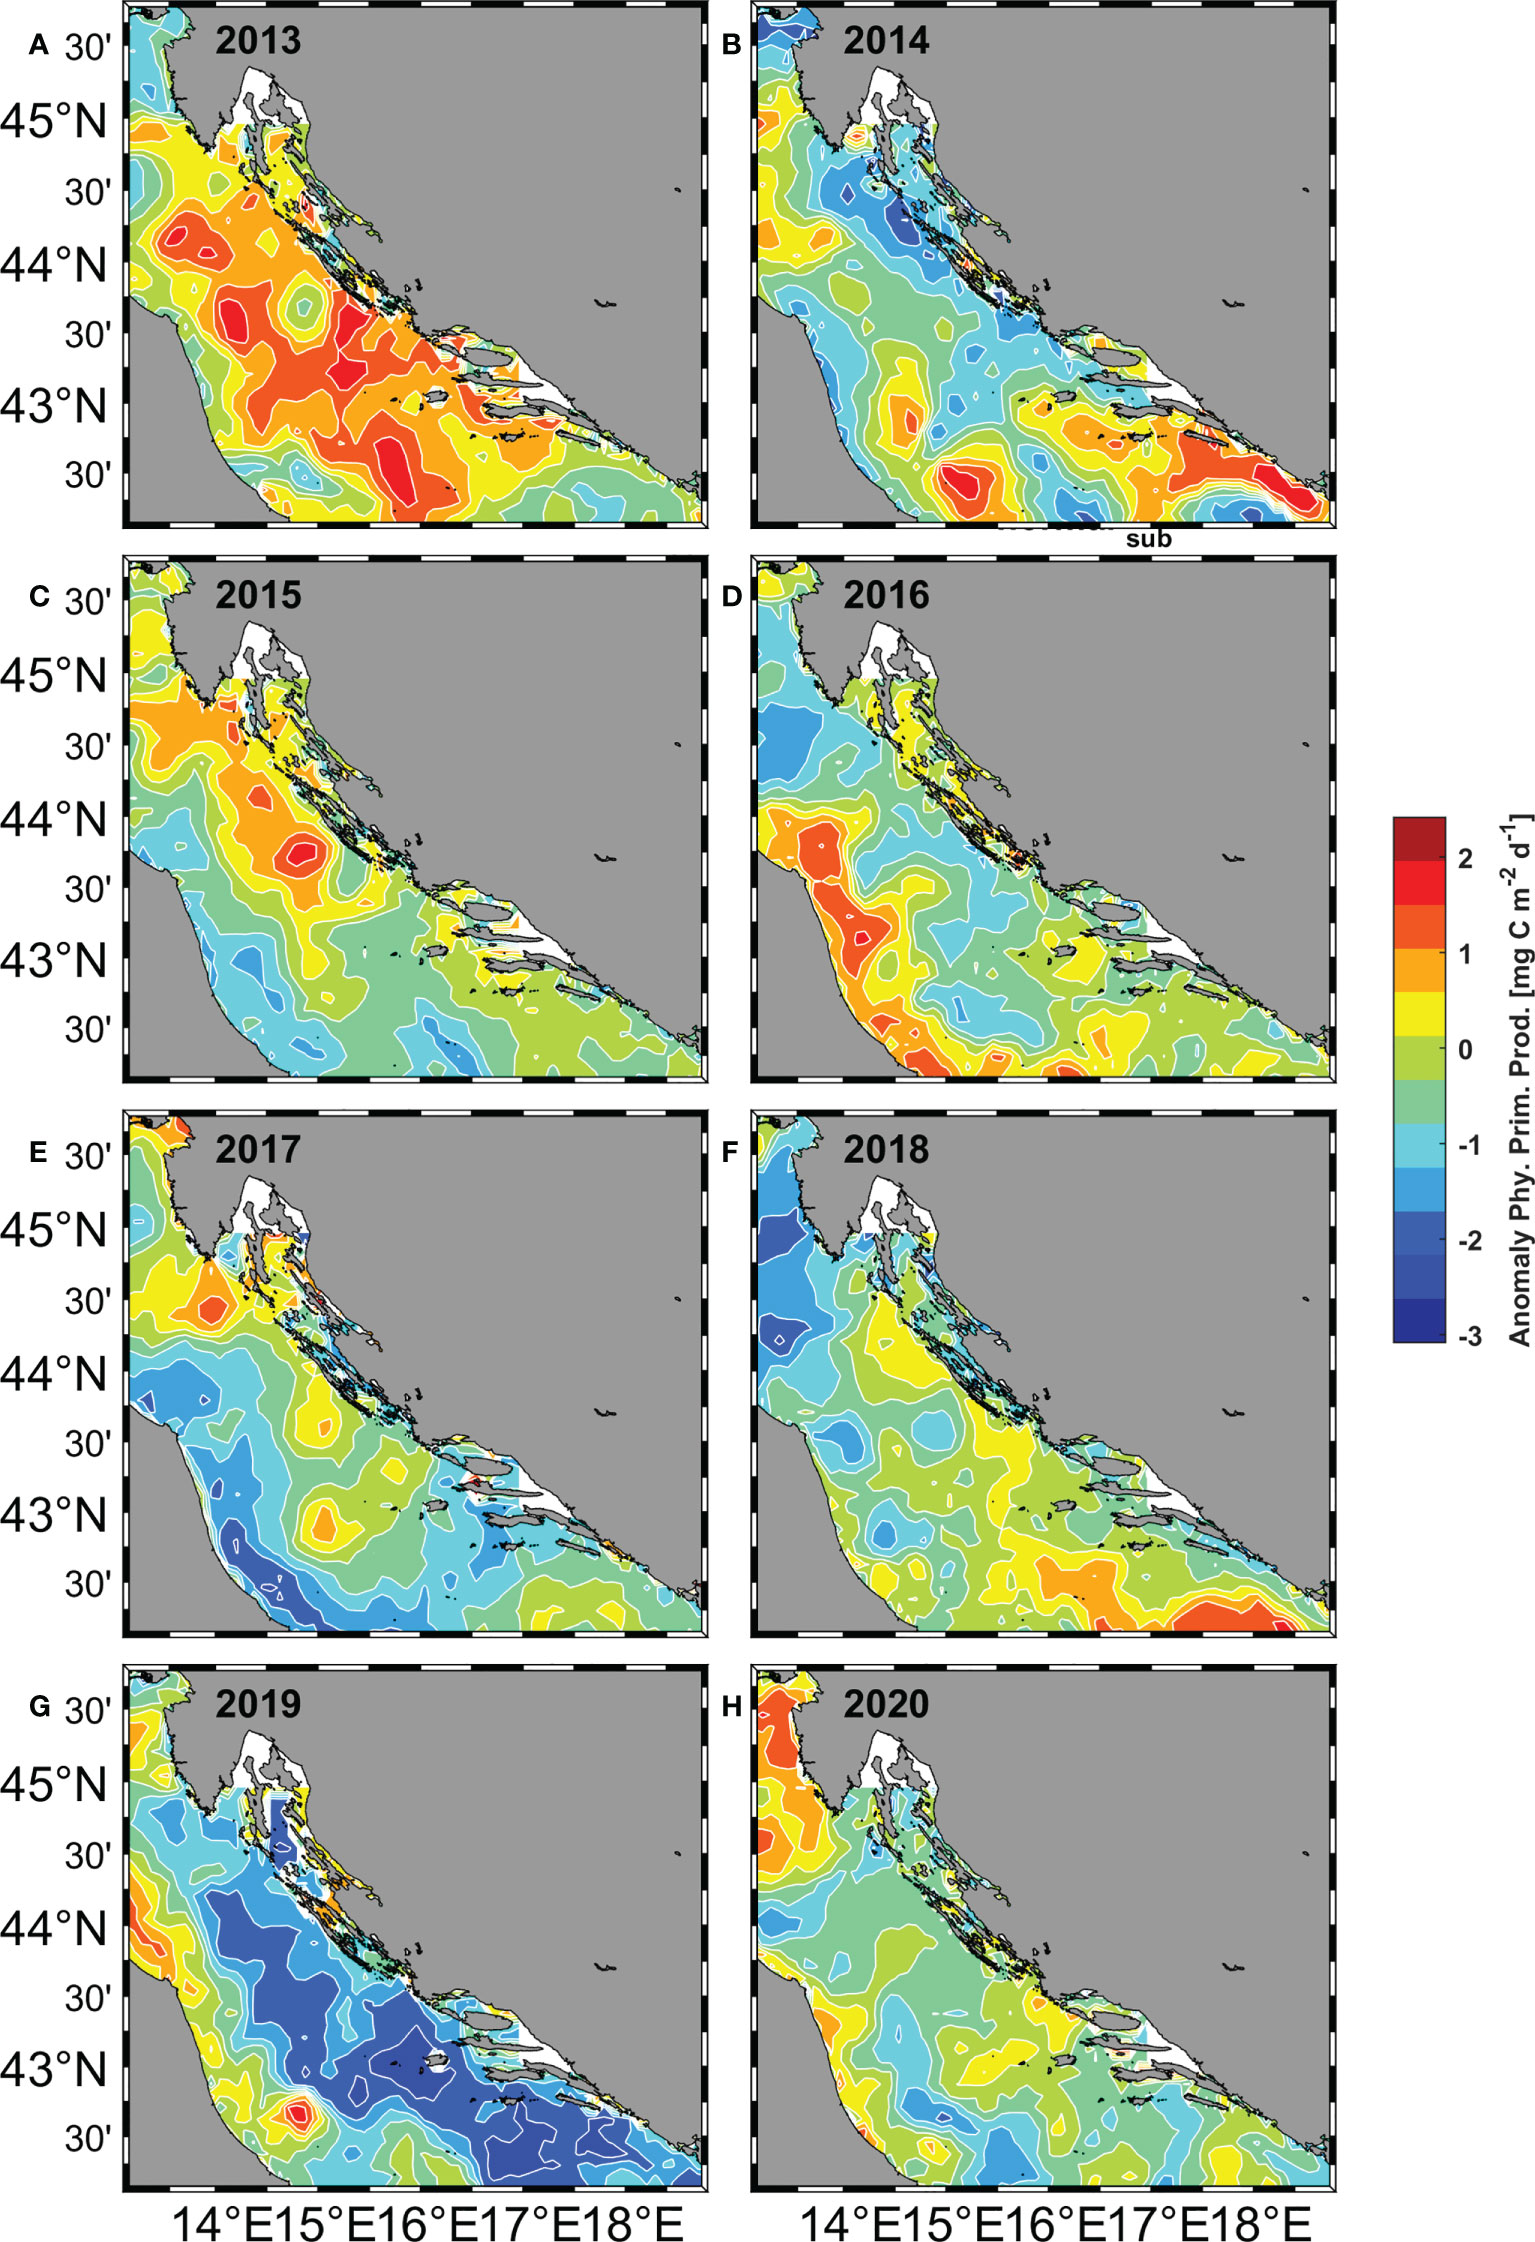
Figure 9 Spatial distribution of phytoplankton primary production anomalies in the Adriatic Sea for the month of July in the period 2013 - 2020 (A–H).
Conclusions
Neural network analysis was used for the first time in the Adriatic Sea to analyze an 8-year multiparametric dataset of anchovy eggs and larvae together with environmental parameters such as Chl-a concentration, salinity and SST. The results showed us that this type of analysis helped us overcome the limitations of using linear methods and extract spatiotemporal patterns that explain the multi-year variability of egg and larval abundances in an oligotrophic sea like the Adriatic. We found that abundance is mainly influenced by the interaction interplay of Chl-a and salinity and that temperature does not play a direct role. However, the influence of temperature should not be ignored, even if it was not detected here, because warming of the Mediterranean Sea and consequently the Adriatic Sea can have direct effects on primary production, which affects the abundance of adult fish and consequently can affect on the recruitment success in the next season (Giorgi, 2006; Pastor et al., 2018; Patti et al., 2020). The long-term anchovy data series used in this work allowed us to link them to a climate index such as BiOS. In this work, the effects of climate change through salinity were well described, but the link with the transport of nutrients to the Adriatic Sea was missing. As for the recent increase in salinity, we have only just captured its impact, as we do not yet know how salinization will affect the environment in the long term. Although the analysis in this work has been exhaustive, other questions have arisen that can be addressed by incorporating other environmental parameters, such as nutrient data, phyto- and zooplankton sampling, vertical profiles of temperature, oxygen, Chl-a and salinity. Due to measurement gaps, we cannot always rely on satellite data and measured data are always more reliable than modelled data. The sampling strategy needs to be modified to cover as much of the spawning period as possible, focusing on areas of abundant spawning where station locations need to remain consistent over the years. With these enumerated methods and improvements, we will be able to fill in the large gaps in our knowledge of the early biology of anchovy, providing a more complete picture of how climate change is affecting anchovy stocks in the Adriatic.
Data availability statement
The datasets presented in this study can be found in online repositories. The names of the repository/repositories and accession number(s) can be found in the article/Supplementary Material.
Ethics statement
Ethical review and approval was not required for the animal study because the performed research involved sampling of marine animals including vertebrates (fishes) and invertebrates (crustaceans). Animals were collected through scientific surveys and caught with methodology normally used in scientific sampling or in fishery practices and were not exposed to any unnecessary pain, injuries, or suffering in this study.
Author contributions
TD and BZ did the conceptualization, data curation, formal analysis, funding acquisition, investigation, methodology, resources, supervision, validation, visualization, and writing. FM and TD were involved in GNG analysis. TD was involved in upwelling analysis. MŠ and VC did the ichthyoplankton analysis. All authors contributed to the article and approved the submitted version.
Funding
This work has been supported by United through Knowledge Fund (UKF) project PORES, by Croatian Science Foundation under the projects UIP-2019-04-1737 (SSA@EDAL), IP-2018-01-8013 (ESAmar) and IP-2018-01-9849 (MAUD), by research project “Data Collection Framework (DCF)” founded by the Ministry of Agriculture of the Republic of Croatia and by European Union from European Structural and Investment Funds 2014. – 2020.
Acknowledgments
The SOM Toolbox version 2.0 for MATLAB was developed by E. Alhoniemi, J. Himberg, J. Parhankangas and J. Vesanto ath the Helsinki, University of Technology, Finland and it is available at http://www.cis.hut.fi/projects/somtoolbox/. The Mediterranean Forecasting System (MFS) results were downloaded from Copernicus Marine Service pages (http://marine.copernicus.eu). The global, monthly marine phytoplankton primary production products (in mg C m-2 d-1) for the period of 1998 to 2020 at 9 km spatial resolution (derived from the Ocean Colour Climate Change Initiative v4.2 dataset) were downloaded from https://catalogue.ceda.ac.uk. Satellite level 3 Chlorophyll-a (Chl-a) concentration (mg m-3) data were obtained from the Ocean Colour Climate Change Initiative project (www.oceancolour.org/). Neretva River discharge climatology was kindly provided by Federalni hidrometeorološki zavod, Bosnia and Herzegovina. To all crew and scientists engaged in data collection.
Conflict of interest
The authors declare that the research was conducted in the absence of any commercial or financial relationships that could be construed as a potential conflict of interest.
Publisher’s note
All claims expressed in this article are solely those of the authors and do not necessarily represent those of their affiliated organizations, or those of the publisher, the editors and the reviewers. Any product that may be evaluated in this article, or claim that may be made by its manufacturer, is not guaranteed or endorsed by the publisher.
Supplementary material
The Supplementary Material for this article can be found online at: https://www.frontiersin.org/articles/10.3389/fmars.2022.997937/full#supplementary-material
References
Basilone G., Bonanno A., Patti B., Mazzola S., Barra M., Cuttitta A., et al. (2013). Spawning site selection by European anchovy (Engraulis encrasicolus) in relation to oceanographic conditions in the strait of Sicily. Fish. Oceanogr. 22, 309–323. doi: 10.1111/fog.12024
Basilone G., Mangano S., Pulizzi M., Fontana I., Giacalone G., Ferreri R., et al. (2017). European Anchovy (Engraulis encrasicolus) age structure and growth rate in two contrasted areas of the Mediterranean Sea: The paradox of faster growth in oligotrophic seas. Mediterr. Mar. Sci. 18, 504–516. doi: 10.12681/mms.2059
Batistić M., Viličić D., Kovačević V., Jasprica N., Garić R., Lavigne H., et al. (2019). Occurrence of winter phytoplankton bloom in the open southern Adriatic: Relationship with hydroclimatic events in the Eastern Mediterranean. Cont. Shelf Res. 174, 12–25. doi: 10.1016/j.csr.2018.12.011
Beg Paklar G., Pasaric Z., Orlic M., Stanesic A. (2021). A close look at the middle Adriatic upwelling: schematized ROMS model simulations. EGU General Assembly 2021, 19–30. doi: 10.5194/egusphere-egu21-12014
Beg Paklar G., Vilibić I., Grbec B., Matić F., Mihanović H., Džoić T., et al. (2020). Record-breaking salinities in the middle Adriatic during summer 2017 and concurrent changes in the microbial food web. Prog. Oceanogr. 185, 1–17. doi: 10.1016/j.pocean.2020.102345
Bellido J. M., Brown A. M., Valavanis V. D., Giráldez A., Pierce G. J., Iglesias M., et al. (2008). Identifying essential fish habitat for small pelagic species in Spanish Mediterranean waters. Hydrobiologia 612, 171–184. doi: 10.1007/978-1-4020-9141-4_13
Bergamasco A., Gačić M. (1996). Baroclinic response of the Adriatic Sea to an episode of bora wind. J. Phys. Oceanogr. 26, 1354–1369. doi: 10.1175/1520-0485(1996)026<1354:BROTAS>2.0.CO;2
Betulla Morello E., Arneri E. (2016). Anchovy and sardine in the Adriatic Sea - an ecological review. Oceanography Mar. Biology: Annu. Rev. 47, 209–256. doi: 10.1201/9781420094220-8
Brochier T., Colas F., Lett C., Echevin V., Cubillos L. A., Tam J., et al. (2009). Small pelagic fish reproductive strategies in upwelling systems: A natal homing evolutionary model to study environmental constraints. Prog. Oceanogr 83, 261–269. doi: 10.1016/j.pocean.2009.07.044
Buljan M., Zore-Amanda M. (1976). Oceanographical properties of the Adriatic Sea. Oceanogr. Mar. Biol. Ann. Rev. 14, 11–98.
Buongiorno Nardelli B., Tronconi C., Pisano A., Santoleri R. (2013). High and ultra-high resolution processing of satellite Sea surface temperature data over southern European seas in the framework of MyOcean project. Remote Sens. Environ. 129, 1–16. doi: 10.1016/j.rse.2012.10.012
Costalago D., Garrido S., Palomera I. (2015). Comparison of the feeding apparatus and diet of European sardines Sardina pilchardus of Atlantic and Mediterranean waters: Ecological implications. J. Fish Biol. 86, 1348–1362. doi: 10.1111/jfb.12645
Cushman-Roisin B., Gačić M., Poulain P.-M., Artegiani A. (2001). Physical oceanography of the Adriatic Sea (Dordrecht: Kluwer Academic Publishers), 304.
Cushman-Roisin B., Korotenko K. A. (2007). Mesoscale-resolving simulations of summer and winter bora events in the Adriatic Sea. J. Geophys. Res. Oceans 112, 1–12. doi: 10.1029/2006JC003516
DHMZ (2013). Meteorološki i hidrološki bilten (Croatian: Croatian Meteorological and Hydrological Service), 47.
DHMZ (2014). Meteorološki i hidrološki bilten (Croatian: Croatian Meteorological and Hydrological Service), 55.
DHMZ (2014a). Climate monitoring and assessment for 2013 (Croatian: Croatian Meteorological and Hydrological Service).
DHMZ (2015). Meteorološki i hidrološki bilten (Croatian: Croatian Meteorological and Hydrological Service), 55.
DHMZ (2016). Meteorološki i hidrološki bilten (Croatian: Croatian Meteorological and Hydrological Service), 52.
DHMZ (2017). Meteorološki i hidrološki bilten (Croatian: Croatian Meteorological and Hydrological Service), 51.
DHMZ (2018). Meteorološki i hidrološki bilten (Croatian: Croatian Meteorological and Hydrological Service), 44.
DHMZ (2019). Meteorološki i hidrološki bilten (Croatian: Croatian Meteorological and Hydrological Service), 54.
DHMZ (2020). Meteorološki i hidrološki bilten (Croatian: Croatian Meteorological and Hydrological Service), 45.
FAO (2020). “The state of Mediterranean and black Sea fisheries 2020,” in The state of Mediterranean and black Sea fisheries 2020(Rome: FAO). doi: 10.4060/cb2429en
Fernández-Corredor E., Albo-Puigserver M., Pennino M. G., Bellido J. M., Coll M. (2021). Influence of environmental factors on different life stages of European anchovy (Engraulis encrasicolus) and European sardine (Sardina pilchardus) from the Mediterranean Sea: A literature review. Regional Stud. Mar. Sci. 41, 101606. doi: 10.1016/j.rsma.2020.101606
Fujita T., Yamamoto M., Kono N., Tomiyama T., Sugimatsu K., Yoneda M. (2021). Temporal variations in hatch date and early survival of Japanese anchovy (Engraulis japonicus) in response to environmental factors in the central seto inland Sea, Japan. Fish. Oceanogr. 30, 527–541. doi: 10.1111/fog.12535
Gačić M., Eusebi Borzelli G. L., Civitarese G., Cardin V., Yari S. (2010). Can internal processes sustain reversals of the ocean upper circulation? the Ionian Sea example. Geophys. Res. Lett. 37, 1–5. doi: 10.1029/2010GL043216
Gačić M., Marullo S., Santoleri R., Bergamasco A. (1997). Analysis of the seasonal and interannual variability of the sea surface temperature field in the Adriatic Sea from AVHRR data, (1984-1992). J. Geophys. Res. Oceans 102, 22937–22946. doi: 10.1029/97JC01720
Gamulin T., Hure J. (1983). Mriješćenje i mrestilišta pelagičnih riba u jadranskom moru (Sardina pilchardus, engraulis encrasicolus, scomber scombrus, sardinella aurita and Sprattus sprattus sprattus). /The spawning and spawning areas of pelagic fishes (Sardina pilchardus, engraulis encrasicolus, scomber scombrus, sardinella aurita and Sprattus sprattus sprattus). Acta Adriat. 24, 97–131.
GFCM (2021) Working group on stock assessment of small pelagic species (WGSASP). Available at: https://www.fao.org/gfcm/technical-meetings/detail/ru/c/1412431/.
Giorgi F. (2006). Climate change hot-spots. Geophys. Res. Lett. 33, L08707. doi: 10.1029/2006GL025734
Grbec B., Morović M., Matić F., Gladan NinčevićŽ., Marasović I., Vidjak O., et al. (2015). Climate regime shifts and multi-decadal variability of the Adriatic Sea pelagic ecosystem. Acta Adriat. 56, 47–66.
Iona A., Theodorou A., Sofianos S., Watelet S., Troupin C., Beckers J. M. (2018). Mediterranean Sea Climatic indices: Monitoring long-term variability and climate changes. Earth Syst. Sci. Data 10, 1829–1842. doi: 10.5194/essd-10-1829-2018
Klaić Z. B., Pasarić Z., Tudor M. (2009). On the interplay between sea-land breezes and etesian winds over the Adriatic. J. Mar. Sys. 78 101–, 118. doi: 10.1016/j.jmarsys.2009.01.016
Kohonen T. (1982). Self-organized formation of topologically correct feature maps. Biol. Cybern. 43, 59–69. doi: 10.1007/BF00337288
Kokkini Z., Mauri E., Gerin R., Poulain P. M., Simoncelli S., Notarstefano G. (2020). On the salinity structure in the south Adriatic as derived from float and glider observations in 2013–2016. Deep-Sea Res. Part II: Top. Stud. Oceanogr. 171, 1–11. doi: 10.1016/j.dsr2.2019.07.013
Kovač Ž., Morović M., Matić F. (2014). Uncovering spatial and temporal patterns of Adriatic Sea colour with self-organizing maps. Int. J. Remote Sens. 35, 2105–2117. doi: 10.1080/01431161.2014.885667
Kovač Ž., Platt T., Gladan Ž.N., Morović M., Sathyendranath S., Raitsos D. E., et al. (2018). A 55-year time series station for primary production in the Adriatic Sea: Data correction, extraction of photosynthesis parameters and regime shifts. Remote Sens. 10, 1460. doi: 10.3390/rs10091460
Kulk G., Platt T., Dingle J., Jackson T., Jönsson B. F., Bouman H. A., et al. (2020). Primary production, an index of climate change in the ocean: Satellite-based estimates over two decades. Remote Sens. 12, 826. doi: 10.3390/rs12050826
Kulk G., Platt T., Dingle J., Jackson T., Jönsson B. F., Bouman H. A., et al. (2021a). Correction: Kulk et al. primary production, an index of climate change in the ocean: Satellite-based estimates over two decades. Remote Sens 12, 826. doi: 10.3390/rs13173462
Kulk G., Platt T., Dingle J., Jackson T., Jönsson B. F., Bouman H. A., et al. (2021b). BICEP / NCEO: Monthly global Marine Phytoplankton Primary Production, between 1998-2020 at 9 km resolution (derived from the Ocean Colour Climate Change Initiative v4.2 dataset). Centre Environ. Data Analysis. doi: 10.5285/69b2c9c6c4714517ba10dab3515e4ee6
Lehmann A., Myrberg K., Höflich K. (2012). A statistical approach to coastal upwelling in the Baltic Sea based on the analysis of satellite data for 1990-2009. Oceanologia 54, 369–393. doi: 10.5697/oc.54-3.369
Mandić M., Pestorić B., Marković O., Durović M., Drakulović D. (2019). Plankton community of trafficked ports as a baseline reference for non indigenous species arrivals. case study of the port of bar (South Adriatic Sea). Mediterr. Mar. Sci. 20, 718–726. doi: 10.12681/mms.19135
Martinetz T. M., Schulten K. J. (1991). “A “Neural gas” network learns topologies, in teuvo kohonen; kai mäkisara,” in 'Proceedings of the international conference on artificial neural networks 1991. Eds. Simula O., Kangas &J. (North-Holland, Amsterdam: Espoo, Finland), 397–402.
Martín P., Sabatés A., Lloret J., Martin-Vide J. (2012). Climate modulation of fish populations: The role of the Western Mediterranean oscillation (WeMO) in sardine (Sardina pilchardus) and anchovy (Engraulis encrasicolus) production in the north-western Mediterranean. Clim. Change 110, 925–939. doi: 10.1007/s10584-011-0091-z
Matić F., Džoić T., Kalinić H., Ćatipović L., Udovičić D., Juretić T., et al. (2022). Observation of abrupt changes in the Sea surface layer of the Adriatic Sea. J. Mar. Sci. Eng. 10, 848. doi: 10.3390/jmse10070848
Matić F., Kalinić H., Vilibić I. (2018). Interpreting self-organizing map errors in the classification of ocean patterns. Comput. Geosci. 119, 9–17. doi: 10.1016/j.cageo.2018.06.006
Maynou F., Sabatés A., Raya V. (2020). Changes in the spawning habitat of two small pelagic fish in the northwestern Mediterranean. Fish. Oceanogr. 29, 202–214. doi: 10.1111/fog.12464
Maynou F., Sabatés A., Salat J. (2014). Clues from the recent past to assess recruitment of Mediterranean small pelagic fishes under sea warming scenarios. Clim. Change 126, 175–188. doi: 10.1007/s10584-014-1194-0
Mihanović H., Cosoli S., Vilibić I., Ivanković D., Dadić V., Gačić M. (2011). Surface current patterns in the northern Adriatic extracted from high-frequency radar data using self-organizing map analysis. J. Geophys Res. Oceans 116, 08033–08031. doi: 10.1029/2011JC007104
Mihanović H., Janeković I., Vilibić I., Kovačević V., Bensi M. (2018). Modelling interannual changes in dense water formation on the northern Adriatic shelf. Pure Appll. Geophys. 175, 4065–4081. doi: 10.1007/s00024-018-1935-5
Mihanović H., Vilibić I., Dunić N., Šepić J. (2015). Mapping of decadal middle Adriatic oceanographic variability and its relation to the BiOS regime. J. Geophys Res. Oceans 120, 5615–5630. doi: 10.1002/2015JC010725
Mihanović H., Vilibić I., Šepić J., Matić F., Ljubešić Z., Mauri E., et al. (2021). Observation, preconditioning and recurrence of exceptionally high salinities in the Adriatic Sea. Front. Mar. Sci. 8. doi: 10.3389/fmars.2021.672210
Moyle P. B., Cech J. J. (1988). Fish: An introduction to ichthyology. 2nd Edition, Prentice-Hall, Inc Englewood Cliffs, N.J.
Orlić M., Gačić M., La Violette P. E. (1992). The currents and circulation of the Adriatic Sea. Oceanol. Acta 15, 109–124.
Palm D., Brännäs E., Lepori F., Nilsson K., Stridsman S. (2007). The influence of spawning habitat restoration on juvenile brown trout (Salmo trutta) density. Can. J. Fish. Aquat. Sci. 64, 509–515. doi: 10.1139/F07-027
Palomera I., Olivar M. P., Salat J., Sabatés A., Coll M., García A., et al. (2007). Small pelagic fish in the NW Mediterranean Sea: An ecological review. Prog. Oceanogr. 74, 377–396. doi: 10.1016/j.pocean.2007.04.012
Pandžić K., Likso T. (2005). Eastern Adriatic typical wind field patterns and large-scale atmospheric conditions. Int. J. Climatol. 25, 81–98. doi: 10.1002/joc.1085
Papi F. (2006). Navigation of marine, freshwater and coastal animals: Concepts and current problems. Mar. Freshw. Behav. Physiol. 39, 3–12. doi: 10.1080/10236240600563057
Pastor F., Valiente J. A., Palau J. L. (2018). Sea Surface temperature in the Mediterranean: Trends and spatial patterns, (1982–2016). Pure Appl. Geophys. 175, 4017–4029. doi: 10.1007/s00024-017-1739-z
Patti B., Torri M., Cuttitta A. (2020). General surface circulation controls the interannual fluctuations of anchovy stock biomass in the central Mediterranean Sea. Sci. Rep. 10, 1554. doi: 10.1038/s41598-020-58028-0
Pedersen M. L., Kristensen E. A., Kronvang B., Thodsen H. (2009). Ecological effects of re-introduction of salmonid spawning gravel in lowland Danish streams. River Res. Appl. 25, 626–638. doi: 10.1002/rra.1232
Piccinetti C., Regner S., Specchi M. (1980). Etat des stocks d'anchois et de sardine en adriatique. FAO Fisheries Rep. 239, 43–52.
Poulain P. M., Mauri E., Ursella L. (2004). Unusual upwelling event and current reversal off the Italian Adriatic coast in summer 2003. Geophys. Res. Lett. 31, 1–4. doi: 10.1029/2003gl019121
Regner S. (1972). Contribution to the study of the ecology of the planktonic phase in the life history of the anchovy, engraulis encrasicolus (Linnaeu), in the central Adriatic. Acta Adriat. 14, 1–40.
Regner S. (1985). Ecology of planktonic stages of anchovy, Engraulis encrasicolus (Linnaeus 1758) in central Adriatic. Acta Adriat. 26, 5–113.
Regner S. (1996). Effects of environmental changes on early stages and reproduction of anchovy in the Adriatic Sea. Sci. Mar. 60 (Supl. 2.), 167–177.
Regner S., Regner D., Marasović I., Kršinić F. (1987). Spawning of sardine, Sardina pilchardus (Walbaum 1792), in the Adriatic under upwelling conditions. Acta Adriat. 28 1–2, 161–198.
Šantić D., Piwosz K., Matić F., Vrdoljak Tomaš A., Arapov J., Dean J. L., et al. (2021). Artificial neural network analysis of microbial diversity in the central and southern Adriatic Sea. Sci. Rep. 11, 1–15. doi: 10.1038/s41598-021-90863-7
Santojanni A., Arneri E., Bernardini V., Cingolani N., Di Marco M., Russo A. (2006). Effects of environmental variables on recruitment of anchovy in the Adriatic Sea. Clim. Res. 31, 181–193. doi: 10.3354/cr031181
Sathyendranath S., Brewin R. J., Brockmann C., Brotas V., Calton B., Chuprin A., et al. (2019). An ocean-color time series for use in climate studies: The experience of the ocean-color climate change initiative (OC-CCI). Sensors 19, 4285. doi: 10.3390/s19194285
Sathyendranath S., Platt T., Kovač Ž., Dingle J., Jackson T., Brewin R. J., et al. (2020). Reconciling models of primary production and photoacclimation. Appl. Opt. 59, C100. doi: 10.1364/ao.386252
Simoncelli S., Fratianni C., Pinardi N., Grandi A., Drudi M., Oddo P., et al. (2019). Mediterranean Sea Physical Reanalysis (CMEMS MED-Physics) (Version 1) [Data set]. Copernicus Monitoring Environment Marine Service (CMEMS). doi: 10.25423/MEDSEA_REANALYSIS_PHYS_006_004
Sinovčić G. (2000). Anchovy, Engraulis enerasicolus (LINNAEU: Biology, population dynamics and fisheries case study. Acta Adriat. 41, 3–53.
Sinovčić G., Zorica B. (2006). Reproductive cycle and minimal length at sexual maturity of Engraulis encrasicolus (L.) in the zrmanja river estuary (Adriatic Sea, Croatia). Estuar. Coast. Shelf Sci. 69, 439–448. doi: 10.1016/j.ecss.2006.04.003
Šolić M., Grbec B., Matić F., Šantić D., Šestanović S., Gladan NinčevićŽ., et al. (2018). Spatio-temporal reproducibility of the microbial food web structure associated with the change in temperature: Long-term observations in the Adriatic Sea. Prog. Oceanogr. 161, 87–101. doi: 10.1016/j.pocean.2018.02.003
Sproson D., Sahlée E. (2014). Modelling the impact of Baltic Sea upwelling on the atmospheric boundary layer. Tellus A: Dyn. Meteorol. Oceanogr. 66, 24041. doi: 10.3402/tellusa.v66.24041
Tanaka S. (1973). Stock assessment by means of ichthyoplankton surveys. FAO Fisheries Tech. Paper 122, 33–51.
Taylor B. M., McIlwain J. L., Kerr A. M. (2012). Marine reserves and reproductive biomass: A case study of a heavily targeted reef fish. PloS One 7, e39599. doi: 10.1371/journal.pone.0039599
Vazquez-Cuervo J., Torres H. S., Menemenlis D., Chin T., Armstrong E. M. (2017). Relationship between SST gradients and upwelling off peru and chile: Model/satellite data analysis. Int. J. Remote Sens. 38, 6599–6622. doi: 10.1080/01431161.2017.1362130
Vučetić T. (1975). Synchronism of the spawning season of some pelagic fishes (sardine, anchovy) and the timing of the maximal food (zooplankton) production in the central Adriatic. Pubbl Stn Zool Napoli 39, 347–365.
Zorica B., Čikeš Keč V., Goran B., Viktor K. (2015). Spatial distribution of sardine and anchovy early life stages along the eastern Adriatic sea. in. Front. Mar. Sci. 2. doi: 10.3389/conf.fmars.2015.03.00009
Zorica B., Čikeš Keč V., Pešić A., Gvozdenović S., Kolitari J., Mandić M. (2019). Spatiotemporal distribution of anchovy early life stages in the eastern part of the Adriatic Sea in relation to some oceanographic features. J. Mar. Biol. Assoc. UK 99, 1205–1211. doi: 10.1017/S0025315418001145
Zorica B., Čikeš Keč V., Vrgoč N., Isajlović I., Piccinetti C., Mandić M., et al. (2020). A review of reproduction biology and spawning/ nursery grounds of the most important adriatic commercial fish species in the last two decades. Acta Adriat. 61, 89–100. doi: 10.32582/aa.61.1.7
Keywords: small pelagic fish, eggs (ova), larvae, upwelling, neural network, eastern Mediterranean
Citation: Džoić T, Zorica B, Matić F, Šestanović M and Čikeš Keč V (2022) Cataloguing environmental influences on the spatiotemporal variability of Adriatic anchovy early life stages in the eastern Adriatic Sea using an artificial neural network. Front. Mar. Sci. 9:997937. doi: 10.3389/fmars.2022.997937
Received: 19 July 2022; Accepted: 21 September 2022;
Published: 06 October 2022.
Edited by:
Milica Mandic, University of Montenegro, MontenegroReviewed by:
Ana Pesic, University of Montenegro, MontenegroMatjaz Licer, National Institute of Biology (NIB), Slovenia
Copyright © 2022 Džoić, Zorica, Matić, Šestanović and Čikeš Keč. This is an open-access article distributed under the terms of the Creative Commons Attribution License (CC BY). The use, distribution or reproduction in other forums is permitted, provided the original author(s) and the copyright owner(s) are credited and that the original publication in this journal is cited, in accordance with accepted academic practice. No use, distribution or reproduction is permitted which does not comply with these terms.
*Correspondence: Barbara Zorica, em9yaWNhQGl6b3IuaHI=
†These authors have contributed equally to this work and share first authorship