 Yuri Fukai
 Kohei Matsuno
 Amane Fujiwara
 Koji Suzuki
- 1Graduate School of Environmental Science, Hokkaido University, Sapporo, Japan
- 2Faculty/Graduate School of Fisheries Sciences, Hokkaido University, Hakodate, Japan
- 3Arctic Research Center, Hokkaido University, Sapporo, Japan
- 4Research Institute for Global Change, Japan Agency for Marine-Earth Science and Technology, Yokosuka, Japan
- 5Faculty of Environmental Earth Science, Hokkaido University, Sapporo, Japan
Diatoms form dense blooms in the Pacific Arctic region from spring to summer, supporting the unique benthic-pelagic coupling ecosystems. Although the Arctic has a severe light-limited season from autumn to winter, diatoms can proliferate in spring when sufficient light becomes available for photosynthesis. One of the crucial strategies for diatoms to survive in unfavorable growing conditions is to form resting stages. Because of enhanced primary and export production in the Pacific Arctic shelves, many viable diatom resting stages can be detected in the surface sediments. However, little is known about the photophysiological response of viable diatom cells, including resting stages, in sediments to light availability. We conducted a laboratory experiment investigating the photophysiological capabilities of the diatom cells containing resting stages using surface sediments from the Chukchi Sea shelf. As a result, diatoms grew dramatically after light exposure, and Chaetoceros socialis complex highly contributed to the enhanced diatom abundance. Their photophysiological changes were also evident from the maximum quantum efficiency (Fv/Fm) of photochemistry in photosystem II, 13C-based photosynthetic-energy (PE) parameters, diadinoxanthin (DD)-diatoxanthin (DT) pool size, and the de-epoxidation state (DES) of DD. Even after the excess light exposure suppressed the photosynthetic activity in the microalgal cells, the diatoms recovered quickly, indicating the high photophysiological plasticity to dynamic light changes. Therefore, our results suggest that diatoms in surface sediments have a high seeding potential for blooms in the Pacific Arctic shelf region.
1 Introduction
The Pacific Arctic region with seasonal sea ice is experiencing rapid seasonal sea ice retreat, along with other environmental changes and biological responses in lower to upper trophic organisms (Grebmeier and Maslowski, 2014). The northern Bering and Chukchi Seas within the Pacific Arctic region have shallow shelves and display large microalgal blooms from spring to summer, with the highest daily primary production among the world’s oceans (Springer et al., 1996). The algal blooms are traditionally thought to initiate from the proliferation of ice algae in the marginal ice zone, followed by phytoplankton blooms in open waters (e.g., Horner and Schrader, 1982). Recently, a massive algal bloom occurring under the sea ice, the so-called “under-ice phytoplankton bloom” (Arrigo et al., 2012), has been widely recognized on the pan-Arctic scale (Ardyna et al., 2020). On the other hand, for proliferation, the microalgae need to survive in the prolonged darkness (up to several months annually) during winter using various strategies (McMinn and Martin, 2013).
Diatoms generally dominate algal communities in sea ice, water column, and surface sediments of the Pacific Arctic region (e.g., von Quillfeldt, 2000; Sergeeva et al., 2010; Ardyna et al., 2020; Fukai et al., 2021; Suzuki et al., 2021). Diatoms form resting stages under unfavorable conditions for their growth, such as macronutrient limitation (Durbin, 1978; Garrison, 1984; Smetacek, 1985; McQuoid and Hobson, 1996), iron starvation (Sugie and Kuma, 2008), and low-light conditions (Hargraves and French, 1983), so that they can survive even in the unsuitable environments. Because most diatom resting stages have heavy frustules, they can quickly sink to the seafloor and sometimes highly contribute to the sinking particulate organic carbon (POC) flux (Rynearson et al., 2013). The sinking POC flux in the northern Bering and Chukchi Seas, supported by diatoms, sometimes reaches the highest ever documented across the global oceans (Lalande et al., 2020; O’Daly et al., 2020). Diatom cells settled on the seafloor support the high concentration of diatom resting stages in sediments of the northern Bering and Chukchi Seas (Fukai et al., 2021). Therefore, the distribution of diatom resting stage assemblages in sediments might reflect the past blooms in the water column (Pitcher, 1990; Itakura et al., 1997). The diatom assemblages in sediments of the Pacific Arctic region could also be influenced by the timing of sea ice retreat and the amount of primary production in the water column (Fukai et al., 2019; Fukai et al., 2021). The open-water bloom-forming diatom species such as Chaetoceros spp. and Thalassiosira spp. observed in the water column (von Quillfeldt, 2000; Sergeeva et al., 2010; Fukai et al., 2020; Suzuki et al., 2021) are mainly dominated in the resting stage community in the sediments of the northern Bering and Chukchi Seas (Fukai et al., 2021).
The diatom resting stages sinking to and accumulated on the seafloor can germinate and resume cell growth when they assimilate sufficient light (Hollibaugh et al., 1981). The high contributions of diatom resting stages in sediments to spring diatom blooms have been reported in temperate Hakata Bay, Japan (Shikata et al., 2009) and the coastal shallow Arctic Svalbard (Hegseth et al., 2019). Previous studies observed increases in cell abundance, biomass, and pigment concentration in seawater from the sediments (e.g., Shikata et al., 2009), but there is little evidence of how algal assemblages respond to light regimes when they germinate and resume photosynthesis. It is critical to pile up the physiological knowledge about the carbon fixation by diatoms in sediments because they can play a significant role in primary production in the Arctic Ocean after a long dark period (Hegseth et al., 2019; Johnsen et al., 2020). In the Pacific Arctic shelves, sediments can be re-suspended by the fast flow in the Bering Strait (Abe et al., 2019) and strong wind events (Uchimiya et al., 2016). In addition, irradiance reaching the shallow seafloor of the Pacific Arctic may increase because of the future thinner sea ice and earlier sea ice retreat (Nicolaus et al., 2012; Horvat et al., 2017). Therefore, our understanding of photophysiological responses by microalgae in sediments to light exposure would provide valuable insights into the primary production processes in the Pacific Arctic shelves.
Natural diatoms face considerable variation in irradiance, which is especially prominent in the Arctic (Cohen et al., 2020). For acclimating to the light variation, diatoms possess photophysiological strategies. Short-term (minutes to hours) acclimation in diatoms mainly includes the diadinoxanthin-diatoxanthin cycle (i.e., de-epoxidation of diadinoxanthin to diatoxanthin) and non-photochemical quenching (NPQ) that dissipate excess excitation energy and quench chlorophyll fluorescence (Goss and Lepetit, 2015; Yan et al., 2019). Additionally, changes in the structure and composition of the photosystems in diatoms support the hourly to daily photoacclimation (Brunet et al., 2011). In hourly to daily high light conditions, changes in cellular pigment composition can be observed, and photoprotective carotenes are generally increased in their cells (Brunet et al., 2011). In contrast, the contents of light-harvesting photosynthetic pigments can be decreased concomitantly (Brunet et al., 2011). To explore the photosynthetic response of microalgae, including diatoms, to light exposure, the photosynthesis-energy (P-E) curve experiment has been conducted (e.g., Isada et al., 2019; Yoshida et al., 2020b). From the P-E relationship, the maximum carbon fixation rate (Pmax), light utilization coefficient (α), photoinhibition parameter (β), and photoacclimation index (Ek) can be derived to estimate the photoacclimation status of microalgae (Sakshaug et al., 1997). Although photophysiological parameters, including P-E parameters, were assessed in many studies for microalgal communities (e.g., Isada et al., 2019; Yoshida et al., 2020b), there have been few studies focused on photophysiological responses by microalgae in sediments.
In this study, we aimed to unravel the responses of diatoms that survived in the prolonged darkness of ca. 9 months after sampling from surface Chukchi shelf sediments to light exposure with particular reference to their photosynthetic physiology in terms of pigment composition, the maximum quantum yield of photochemistry (Fv/Fm) in photosystem II, and the P-E parameters.
2 Materials and methods
2.1 Spatial distribution of viable diatom assemblages in sediments
2.1.1 Sampling of sediments
Sampling was conducted on the shallow shelves in the southern Chukchi Sea (Figure 1) from October 7–20, 2020, during the R/V Mirai MR20-05C expedition (Japan Agency for Marine-Earth Science and Technology). Sediment samples were collected using a Smith-McIntyre bottom sampler, and then the surface sediments (0–3 cm) were divided using an acrylic tube and a spatula. Subsamples of the surface sediments were stored in darkness at 3°C until further experimental procedures on land.
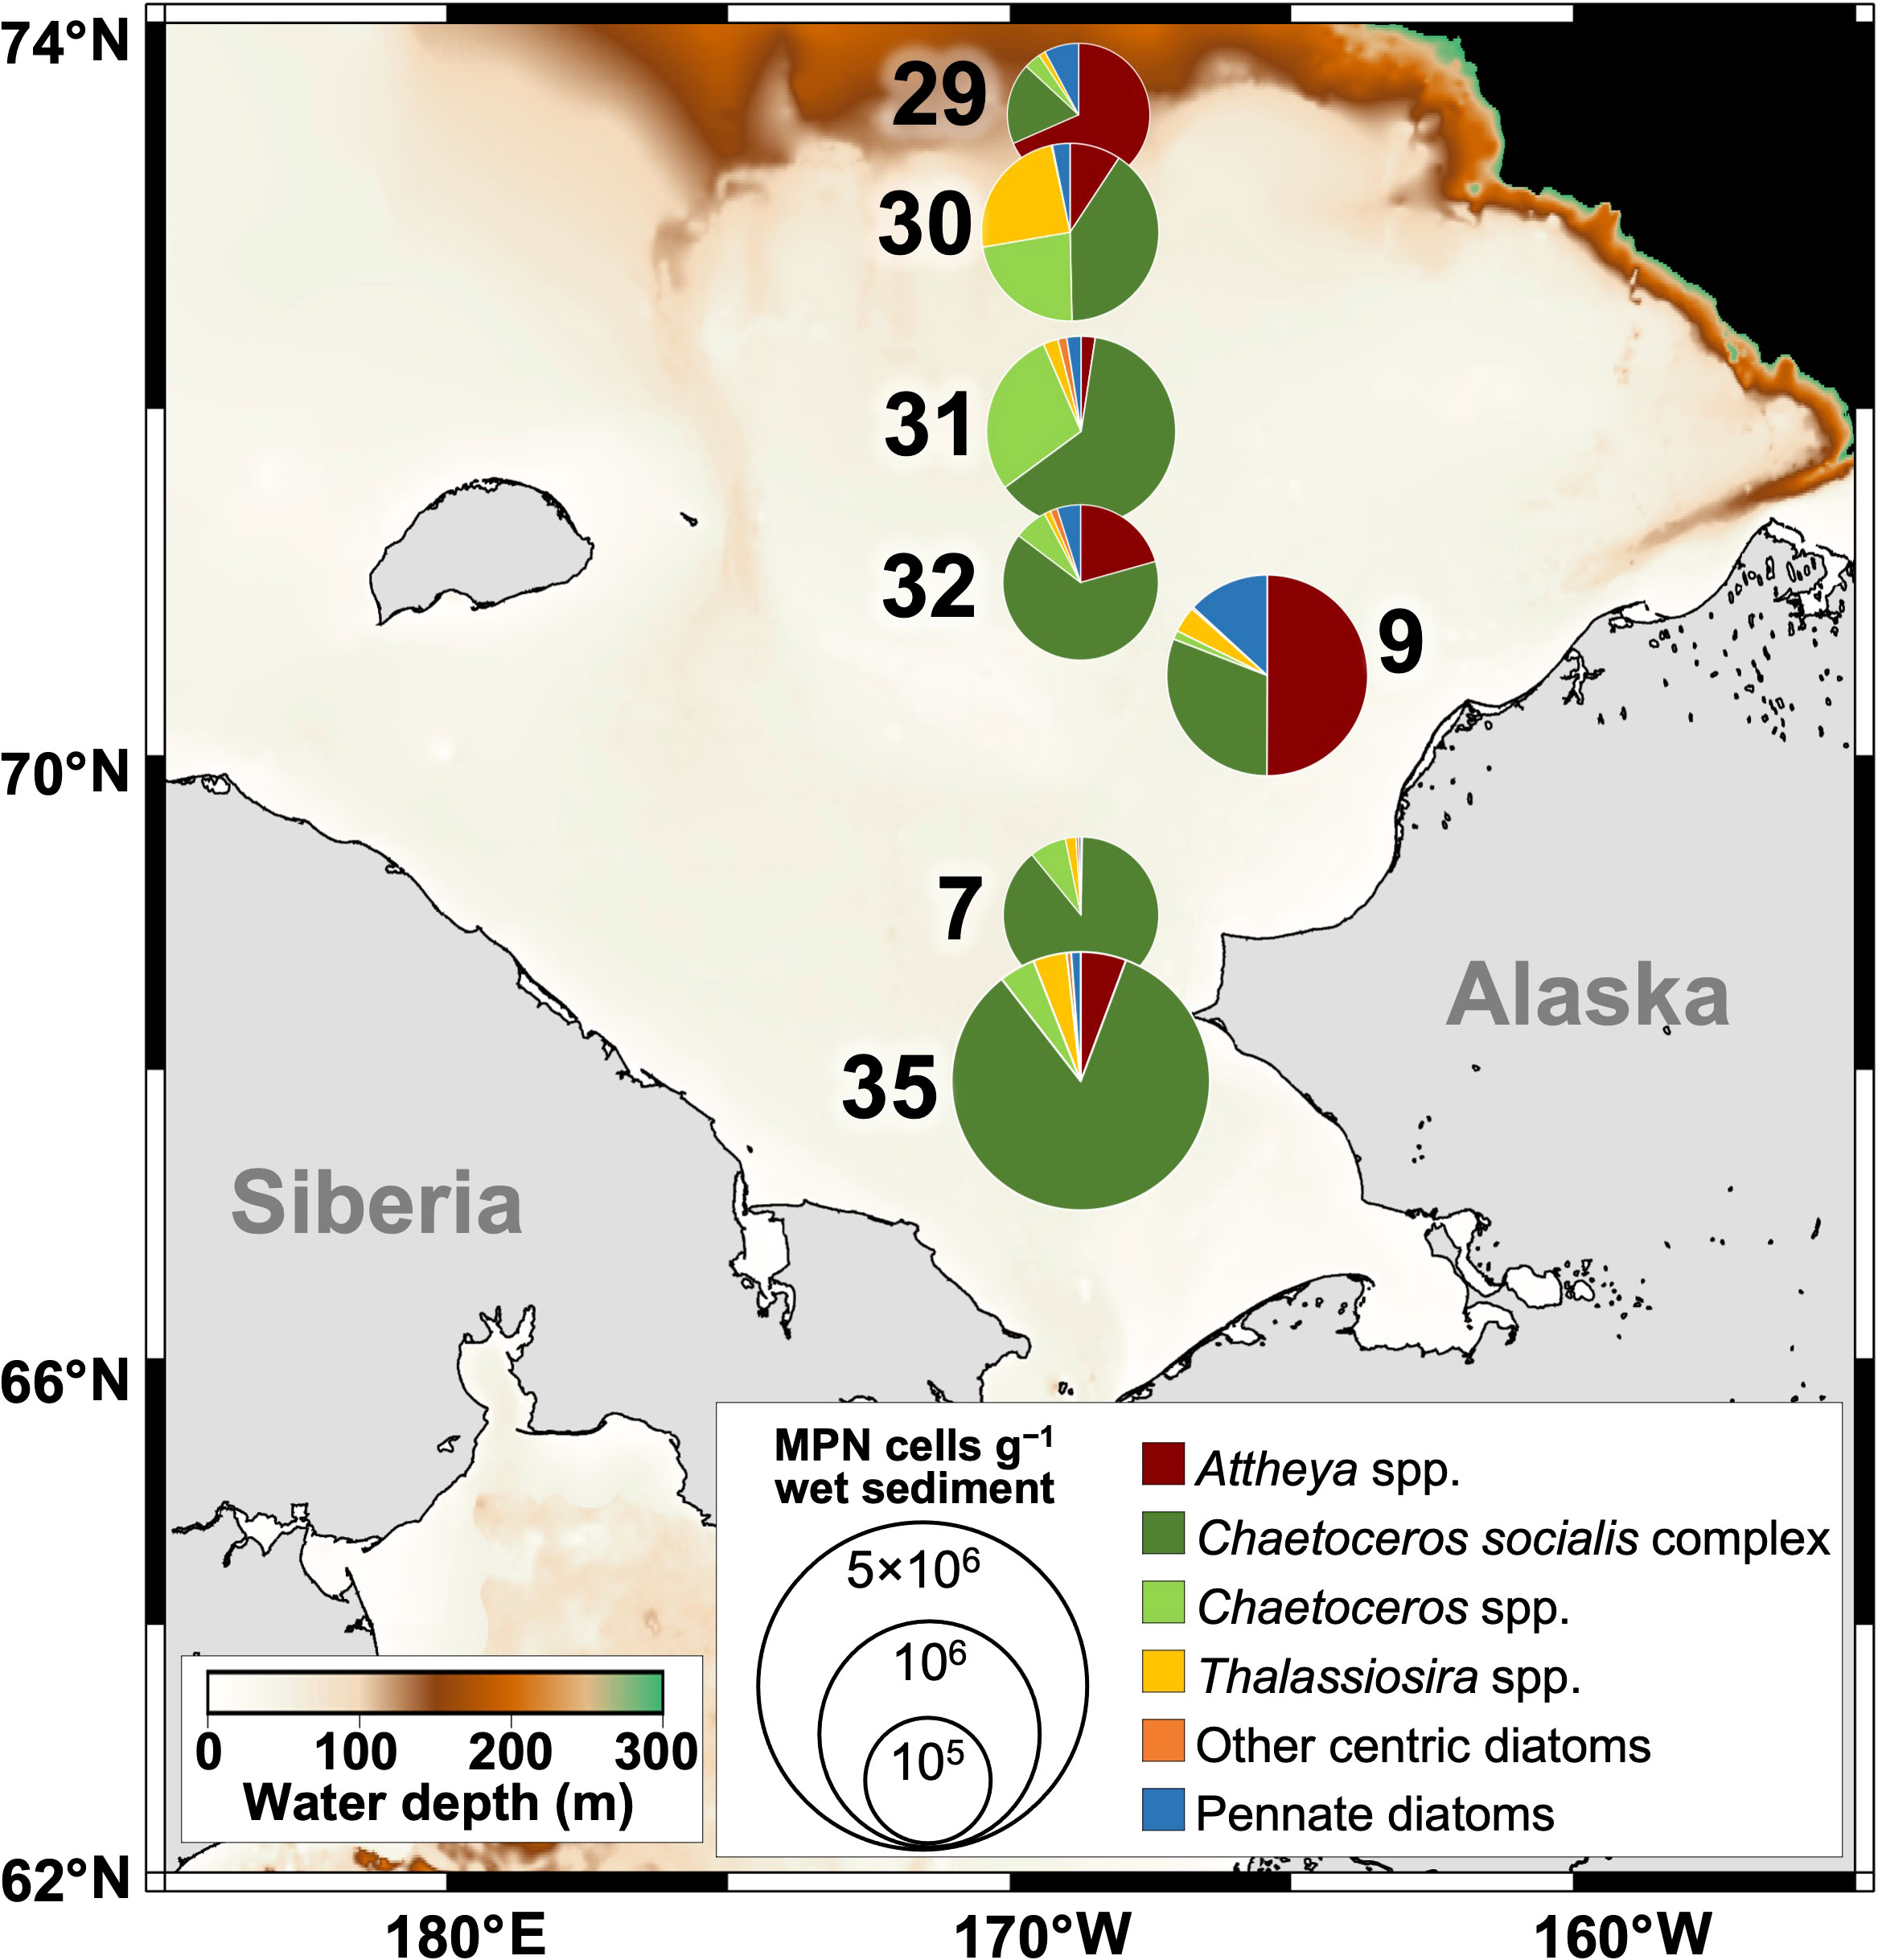
Figure 1 Locations of the sediment sampling in October 2020 and the horizontal distribution and composition of viable diatom cells in the Chukchi Sea sediments as estimated by the MPN method. Color contours and numbers indicate the bottom depth and station name, respectively.
2.1.2 Quantification of viable diatom cells in sediments
The concentrations of viable diatom cells in the sediment samples were analyzed by the most probable number (MPN) method (Imai et al., 1984; Imai et al., 1990). The sediments stored for four months in the dark were homogenized and suspended in the sterilized filtered seawater at a concentration of 0.1 g mL−1 (=100 dilution). The subsequent serial tenfold dilutions (10−1 to 10−6) were made with f/2 medium (Guillard and Ryther, 1962). Then 1 mL aliquots of the diluted suspensions were inoculated into five replicate wells of disposable tissue culture plates (48 wells). Incubation was carried out at a temperature of 5°C and under the white light-emitting diode (LED) light (LXHL-BW02, Lumileds, Netherlands) with about 50 μmol photons m−2 s−1 and a 12 h light:12 h dark photocycle for 10 days, following Fukai et al. (2021). The appearance of vegetative cells of planktonic diatoms in each well (i.e., “positive well”) was examined using an inverted light microscope. Based on the number of positive wells out of the five replicates in each dilution series, the most probable number (MPN for a series of 5 tenfold dilutions) of each diatom species in the sediment sample (MPN cells g−1 wet sediment) was then calculated according to the statistical table by Throndsen (1978).
2.2 Laboratory experiment for investigating benthic algal photophysiology
2.2.1 Viable diatom cells in sediments
To accurately determine the concentrations and composition of viable diatom cells in sediments used in the laboratory experiment, the MPN method was conducted again immediately before the laboratory experiment (Imai et al., 1984; Imai et al., 1990) because the experiment was implemented after 5 months from the estimation of the spatial distribution of viable diatoms (see section 2.1.2). The procedures were the same, except that the incubation was carried out at 3°C and under the white fluorescent light of about 60 μmol photons m−2 s−1 with a 12 h light:12 h dark photocycle for 9 days.
2.2.2 Experimental set-up
Sediments and the near-bottom seawater collected at station 35 (bottom depth: 53.9 m) and a site (69.03°N, 168.83°W) (bottom depth: 51.3 m) near station 7, respectively, were used for the experiment. Sediments were sampled as described above. Subsamples of the surface sediments were stored in darkness at 3°C for about 9 months until the experiment was started. The near-bottom seawater was collected with a Niskin water sampler, filtered immediately using a Merck Sterivex filter (pore size 0.22 μm), and sterilized by an autoclave (121°C, 20 minutes). The sterilized filtered seawater was stored at 3°C until use.
For the sediment incubation, a sediment subsample (1.1 g) was suspended into the 4.4 L sterilized filtered seawater. Then, the sediment suspended seawater was stored in darkness at 3°C for about 16 hours to acclimate to the experiment temperature. After the acclimation, samplings and sample analyses (see below for details) on day 0 were conducted before the sediment suspended seawater was divided into two 2 L bottles, which were moved into the experimental incubator at 3°C with white fluorescent light (LMGA1WG21K50A410F, Prince Industry Inc., Japan) of 300 μmol photons m−2 s−1 (High Light; HL) or 30 μmol photons m−2 s−1 (Low Light; LL), respectively. The two irradiance levels were set to simulate different light regimes in the water column. A square-shaped illumination cycle was set at 12 h light: 12 h dark for 7 days in both light conditions. The experiments were conducted three times to test the repeatability of the results.
In this study, the following parameters were determined: the concentrations of viable diatom cells, including resting stages, in sediments, the composition and concentrations of microalgal pigments, the maximum photochemical quantum yield (Fv/Fm) of photosystem II for microalgae, the concentrations of diatom cells, and 13C based P-E parameters. Samples for these parameters, except for the concentrations of viable diatom cells in sediments, were obtained from HL and LL bottles according to the procedures detailed below.
2.2.3 Microalgal pigments
Samplings for microalgal pigments were conducted every day (i.e., from day 0 to day 7). Samples of 10 or 20 mL were filtered onto Whatman GF/F filters under a gentle vacuum (<0.013MPa). The filter was immediately frozen in the deep freezer at −80°C until further analysis. Microalgal pigments were extracted using the N, N-dimethylformamide (DMF) bead-beating technique and analyzed by Ultra-High Performance Liquid Chromatography (UHPLC) following Suzuki et al. (2015).
The chlorophyll a (chl a) specific growth rate (μchl a, day-1) was calculated as the slope of the regression line plotting the natural log-transformed chl a concentration against the incubation time. The concentrations of light-harvesting photosynthetic pigments (LHP) were estimated with the sum of chl a, chl c, and fucoxanthin, whereas the sum of diadinoxanthin (DD) and diatoxanthin (DT) was treated as an indicator of photoprotective pigments. The size of xanthophyll pool (DD-DT pool) was assessed as the sum of DD and DT normalized by chl a (i.e., ([DD] + [DT])/[chl a]) (Yoshida et al., 2020a), where [DD], [DT], and [chl a] indicate the concentrations of diadinoxanthin, diatoxanthin, and chl a, respectively. In addition, the pool size of carotenes was estimated from the concentration of carotenes normalized by chl a (i.e., [carotenes]/[chl a]), where [carotenes] denotes the concentration of carotenes.
The de-epoxidation state index (DES; Ruban et al., 2004) in the diadinoxanthin-diatoxanthin cycle was calculated as follows:
When the concentrations of DD and DT were null, the data were excluded from the calculation.
2.2.4 Maximum photochemical quantum yield of photosystem II
The maximum quantum yield of photochemistry in photosystem II (i.e., Fv/Fm) for microalgae was measured every day using a pulse amplitude modulated fluorometer (Water-PAM, Walz, Germany). Samples were acclimated in darkness at 3°C for about 1 hour before the measurement and then put into a quartz cuvette. The minimum fluorescence (Fo) after the dark acclimation and the maximum fluorescence under the saturation pulse (Fm) were determined. The saturating pulse was provided by red light-emitting diodes (LEDs), which had a peak illumination at 660 nm of 4000 μmol photons m−2 s−1 and lasted for 600 ms. The Fv/Fm was calculated as follows:
The fluorescence measurements were conducted twice per sample.
2.2.5 Diatom cell counting
Samples for diatom cell counting were obtained every day. The sample of 9 mL was fixed by neutral formalin at a final concentration of 2%. If necessary, the samples were then settled and concentrated by 2.0- to 3.3- fold. Aliquots (1 mL) of the sub-samples were transferred to a glass slide to count and identify the diatoms under an inverted microscope (Olympus BH2 BHS system, Olympus, Tokyo, Japan; 10 × oculars and 40 × objective lenses). The diatoms were counted and identified from more than 150 cells, including the sufficient counting (more than 50 cells) of the dominant species (Edler and Elbrächter, 2010). It was difficult to distinguish the resting stages of the genus Thalassiosira from their vegetative cells; therefore, the total cell numbers were estimated in this study. The cell-specific growth rate (μcell, day-1) was calculated as the slope of the regression line plotting the natural log-transformed cell concentrations against the incubation time.
2.2.6 13C-based Photosynthesis-Energy curve experiment
The Photosynthesis-Energy (P-E) curve experiments were conducted on day 0, 1, 4, and 7. The culture samples were dispensed into eleven 30 mL acid-cleaned polycarbonate bottles. As an initial sample, a bottle of a sample without any isotope addition was filtered onto a Whatman GF/F glass fiber filter pre-combusted over 5 hours at 450°C. The other ten sample bottles were inoculated with a known amount of NaH13CO3 solution (99 atom% 13C, Shoko Co., Ltd.), equivalent to ca. 10% of dissolved inorganic carbon (DIC) in the medium. These 13C-enriched samples were set on an incubator by Babin et al. (1994) and kept at 3°C under ten different light intensities from 1.47 to 1770 μmol photons m−2 s−1 using a PCS-UMX250 light source (Nippon PI Co., Ltd.) for 2 hours. After incubation, the samples were filtered on pre-combusted GF/F glass fiber filters. All filters were stored in a deep freezer at −80°C until further analysis. The duplicate samples of DIC in the medium without NaH13CO3 enrichment were obtained in 120 mL glass bottles. The DIC concentrations were determined using a Total Alkalinity Titrator ATT-05 (Kimoto Electric Co., Ltd) with authentic standards (KANSO Technos).
The filters were thawed, exposed to the fumes of HCl to remove inorganic carbon, and entirely dried in a desiccator under a vacuum. The amount of particulate organic carbon (POC) and the atom percent of 13C in each sample were determined by an online element analyzer (FlashEA1112, Thermo Finnigan)/isotope ratio mass spectrometer (Delta-V, Thermo Finnigan).
The chl a concentration normalized photosynthetic carbon fixation rates were calculated following Hama et al. (1983) based on the 13C technique and chl a concentration measured by UHPLC. The P-E curve fitting and parameters were obtained from the photoinhibition model of Platt et al. (1980) with the “phytotools” package (Silsbe and Malkin, 2015) of R software (version 4.0.4, R Development Core Team, 2021: https://www.r-project.org).
where the superscript B denotes the normalization by chl a concentration, and P is the photosynthetic rate, EPAR inc is the irradiance at each position of the incubator, Ps is the hypothetical maximum photosynthetic rate in the absence of photoinhibition, α is the initial slope of the P-E curve, and β is the photoinhibition parameter. The maximum photosynthetic rate, PBmax, is calculated as follows:
The photoacclimation index, Ek, was derived from the following equation.
To estimate the maximum quantum yield of carbon fixation, microalgal absorption coefficient values under the HL and LL conditions were measured on day 7. The duplicate water samples (10 or 20 mL) were filtered onto Whatman GF/F filters. The filters were covered with aluminum foil and stored in a deep freezer (−80°C) until further analyses. A spectrophotometer (MPS-2450, Shimadzu) equipped with an end-on-type photomultiplier tube was used to measure the absorption spectra of the total particles on the filters at every 1 nm. Then, the algal pigments on the filters were extracted by soaking in methanol, and the absorption spectra of detritus on the filter were measured in the same manner. The measured absorption spectra of the total particles and the detritus were corrected for the path-length amplification effect following the equation of Stramski et al. (2015).
where ODs (λ) and ODf (λ) are the absorption spectra of suspension and filter, respectively. Then, the absorption coefficient (ap (λ)) values were calculated for the total particles and the detritus, respectively, following (Kishino et al., 1985):
where s is the filtered area (m2) and v is the filtered volume (m3) of the samples. The absorption coefficient of microalgae (aph) was obtained by subtracting the absorption coefficient of the detritus from that of the total particles. The P-E parameters for light absorbed by microalgae ( and ) were derived from the equations described above using the photosynthetic absorbed radiation at each position of the incubator (EPUR inc). The subscript PUR indicates the light absorbed by microalgae, and the EPUR inc was calculated as follows (Dubinsky, 1980):
where
where EL (λ) is the incubator lamp spectrum. The maximum quantum yield of carbon fixation (Φc max, mol C (mol photon)-1) was calculated by the following equation:
where [chl a] is the chl a concentration (mg m-3) and 0.0231 is a factor to convert milligrams of carbon to moles, μmol photons to mol photons, and hours to seconds (Isada et al., 2009).
2.3 Statistical analyses
Differences among treatments and incubation time or period were tested using one-way analysis of variance (ANOVA) and post hoc Tukey-Kramer test. To compare differences in the values between day 0 and day 1 in HL or between HL and LL, t-test was conducted for each treatment. Also, the differences in the concentration of viable diatom cells in the sediment at station 35 were estimated twice using the MPN method with t-test. All statistical analyses were performed using R software (version 4.0.4, R Development Core Team, 2021).
3 Results
3.1 Spatial distribution of viable diatom cells in sediments of the Chukchi Sea shelf
The viable diatom cells determined by the MPN method ranged from 1.90 × 10⁵ to 1.91 × 10⁶ MPN cells g−1 wet sediment (Figure 1 and Supplementary Table 1). The concentrations reached 106 MPN cells g−1 wet sediment only at station 35. Centric diatoms were predominant throughout the region, and the relatively high contributions of Chaetoceros socialis complex to the total viable diatom cells were found at almost all stations (40–89%), except stations 9 and 29 (31% and 18%, respectively). At stations 9 and 29, Attheya spp. were dominant in the viable diatoms, while the genus comprised only 0.30–21% at the other stations. Other genera showed a locally high proportion. For example, Thalassiosira spp. accounted for 24% of the diatom assemblage at station 30 and Chaetoceros spp. contributed 23% and 29% of the diatoms at stations 30 and 31, respectively. The other centric diatoms, including Actinoptychus sp., Paralia sulcata, Skeletonema spp., Leptocylindrus spp., and Odontella spp., appeared from the sediments but little contributed to the diatom communities. Pennate diatoms, such as Asteroplanus karianus, Fragilariopsis spp., Navicula spp., and Cylindrotheca closterium, emerged from the sediments at all stations, but the proportion was relatively low over the study region (0.47–13%).
3.2 Incubation experiment
3.2.1 Viable diatoms in sediments
The concentrations of viable diatoms in sediments at station 35, estimated immediately before the onset of the experiment, were 6.0 × 10⁵ ± 4.7 × 10⁵ MPN cells g−1 wet sediment. The total concentrations decreased from that of the former estimation of viable diatom cells at station 35 (t-test, p< 0.05), while the diatom composition and the appearing diatom species were not different from each other (Figures 1, 2 and Supplementary Table 2). Centric diatoms accounted for 97%, and the genera of Chaetoceros and Thalassiosira contributed to 93% of the community. Chaetoceros socialis complex was primarily dominated (79%). The other centric diatoms, including Attheya spp., Detonula pumila, Odontella spp., P. sulcata, Skeletonema spp., L. danicus, and Melosira sp., sometimes appeared from the sediment but little contributed to the community. Pennate diatoms, such as A. karianus, Fragilariopsis spp., and Navicula spp., also appeared, but the relative abundance was very low.
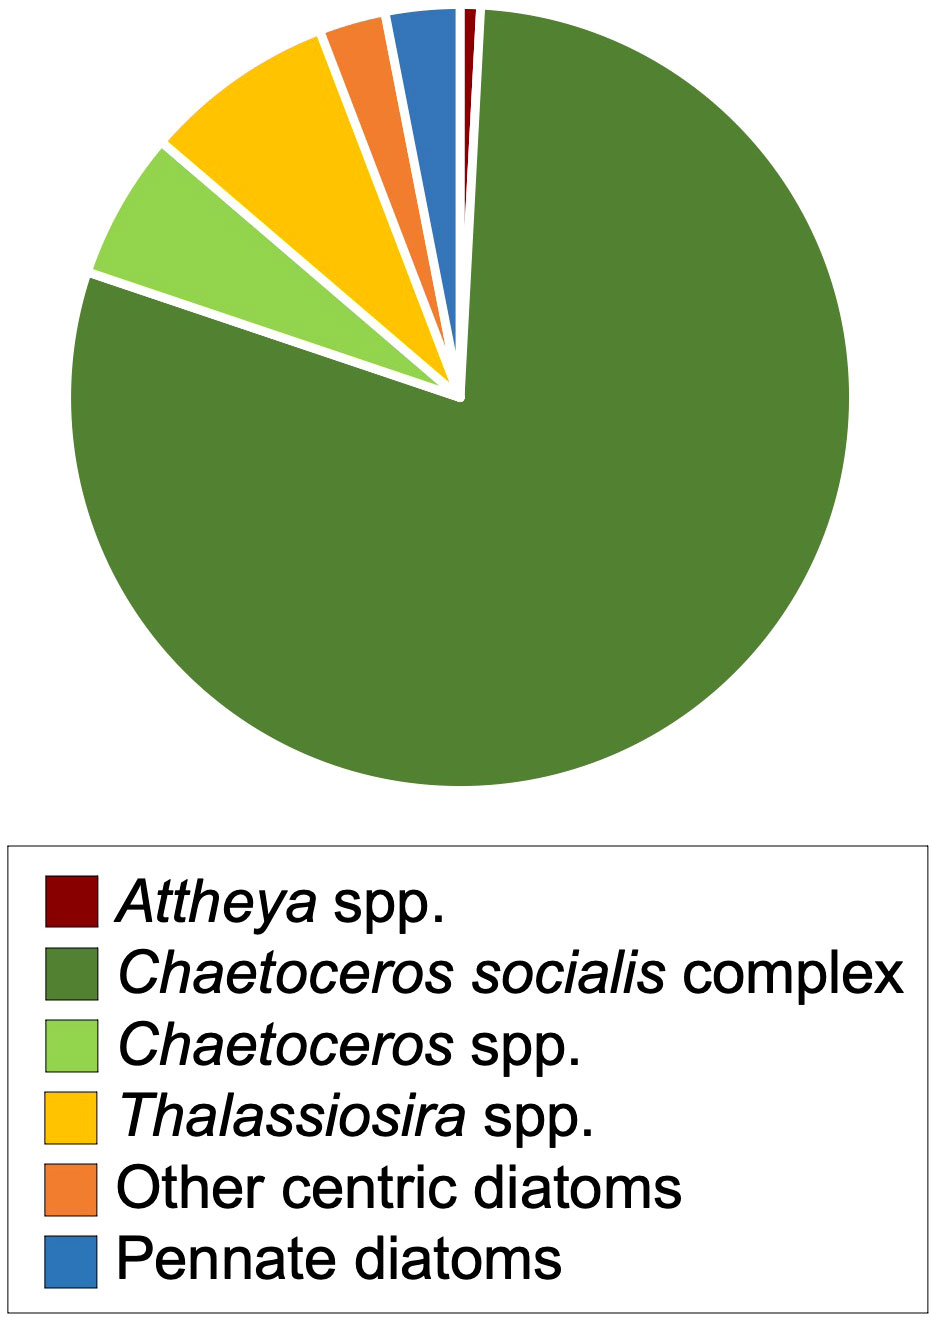
Figure 2 The composition of viable diatom cells at station 35 by the MPN method, which was assessed just before the incubation experiment.
3.2.2 Microalgal pigments
The sum of chl a and chl c concentration increased in both HL and LL and became more than double the initial level in HL on day 5 and in LL on day 4 (Figures 3A, B, and Supplementary Table 3). Similarly, fucoxanthin concentrations increased in both treatments (Figures 3A, B, and Supplementary Table 3). In HL on day 4 and LL on day 3, the concentrations of fucoxanthin reached double the initial levels.
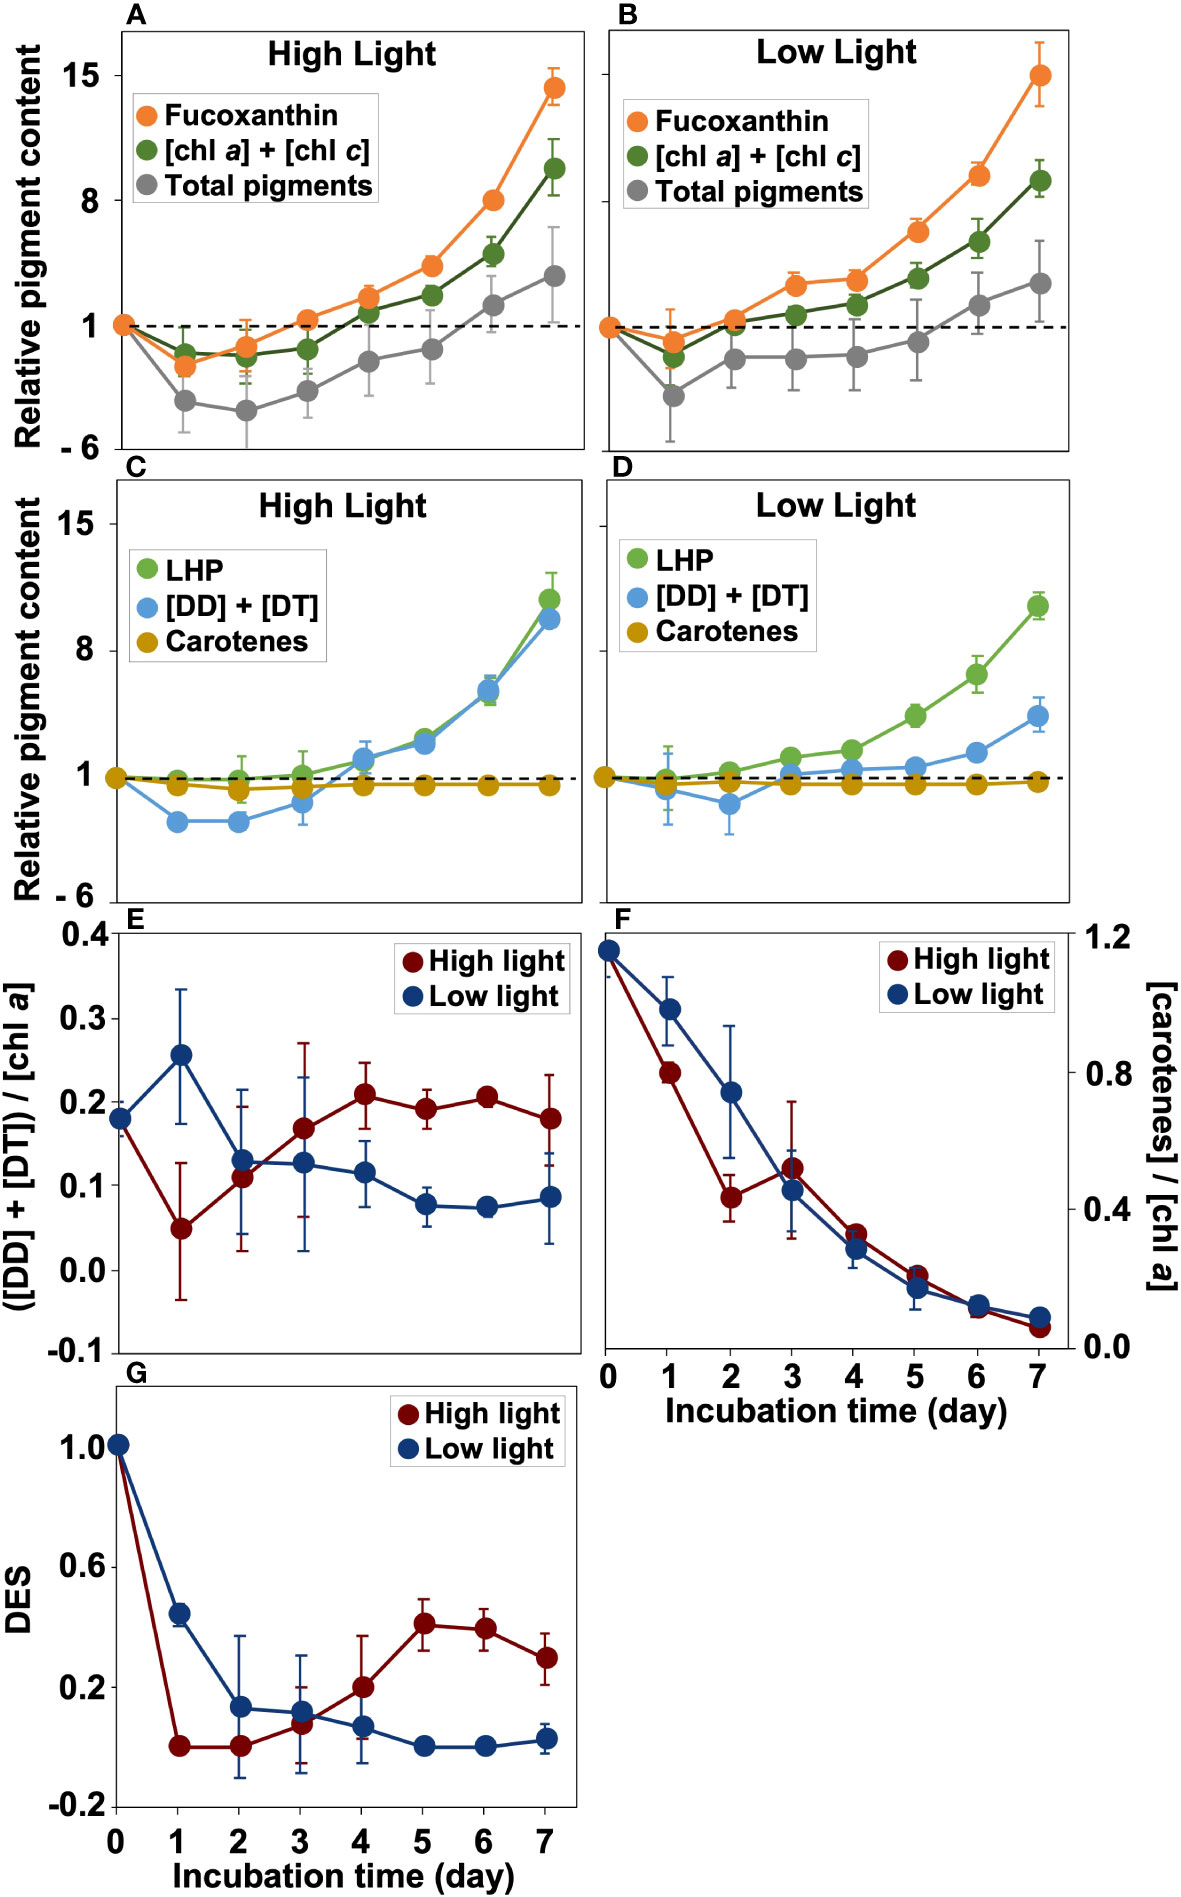
Figure 3 (A–D) The wight-based relative pigment concentration to that on day 0 during the incubation. Fucoxanthin, the sum of chl a and chl c ([chl a] + [chl c]), and total concentrations of measured pigments (chlorophyll a, chlorophyll b, chlorophyll c, chlorophyllide a, 19’-butanoyloxyfucoxanthin, fucoxanthin, neoxanthin, diadinoxanthin, diatoxanthin, carotenes) in the high (300 µmol photons m-2 s-1) (A) and low light (30 µmol photons m-2 s-1) (B) conditions. Light-harvesting pigments (chl a, chl c, plus fucoxanthin; LHP), diadinoxanthin plus diatoxanthin ([DD]+[DT]), and carotenes in the high (300 µmol photons m-2 s-1) (C) and low (30 µmol photons m-2 s-1) (D) light conditions. Note that the value below 1.0 are showed as the reciprocal value. (E, F) Variations of ([DD] + [DT])/[chl a] (i.e., DD-DT pool size) and [carotenes]/[chl a] (i.e., carotene pool size). (G) The de-epoxidation state index (DES; [DT]/([DD]+[DT])) during incubation. Mean values ( ± SD) indicate the average of three independent measurements.
The trends of the concentration of diadinoxanthin and diatoxanthin (i.e., [DD] + [DT]) were also distinct between HL and LL (Figures 3C, D, and Supplementary Table 3). In HL, the [DD] + [DT] initially decreased, reduced by 22% of initial on day 1, and thereafter increased after day 3 (Figure 3C). On the other hand, the [DD] + [DT] gradually increased with time under LL (Figure 3D). The LHP concentrations under HL and LL increased from day 3 and day 2, respectively, and reached about 10 times on day 7 from the initial value (Figures 3C, D). In HL, the DD-DT pool size estimated from [DD] + [DT])/[chl a] (Figure 3E) decreased on day 1 due to the decrease in [DD] + [DT], although the decline was not significant (t-test, p =0.05). After day 1, the DD-DT pool size under HL returned to the initial level by day 3, whereas the ratio in LL decreased to almost half the initial pool size. The carotene pool size (i.e., [carotene]/[chl a]) decreased over incubation (Figure 3F).
The DES value was the highest on day 0 and initially decreased in HL and LL. After that, there were an increasing trend and a decreasing trend in HL and LL, respectively (Figure 3G).
3.2.3 Diatom cell abundance
The diatom cell abundance increased during incubation (Figure 4 and Supplementary Table 3). The chl a-specific and the cell-specific growth rates were significantly different between the periods from day 0 to day 4 and from day 4 to day 7 in both HL and LL (one-way ANOVA and Tukey-Kramer test, p< 0.05). Both of the growth rates were larger in the second half (i.e., exponential growth phase) than in the first half (i.e., lag phase; Figure 5).
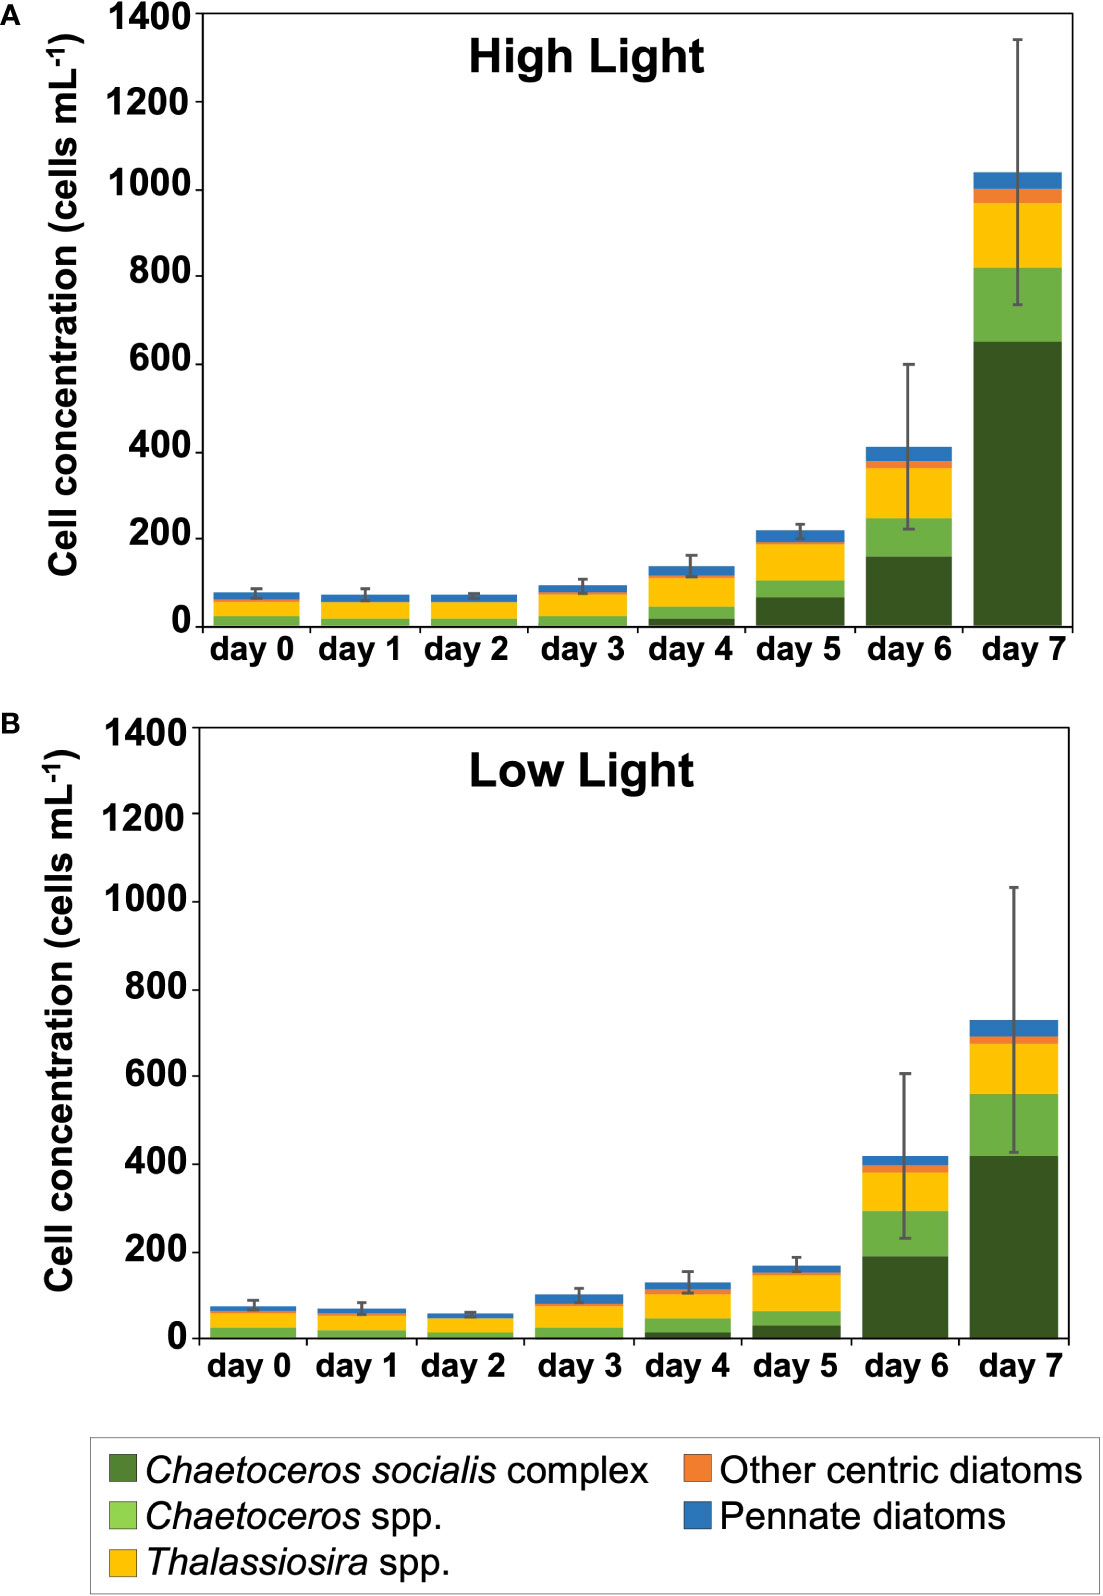
Figure 4 Cell concentration and composition of diatoms, which were identified and counted using an inverted light microscope, during incubation under the high (300 µmol photons m-2 s-1) (A) and low (30 µmol photons m-2 s-1) (B) light conditions. Mean values ( ± SD) indicate the average of three independent measurements.
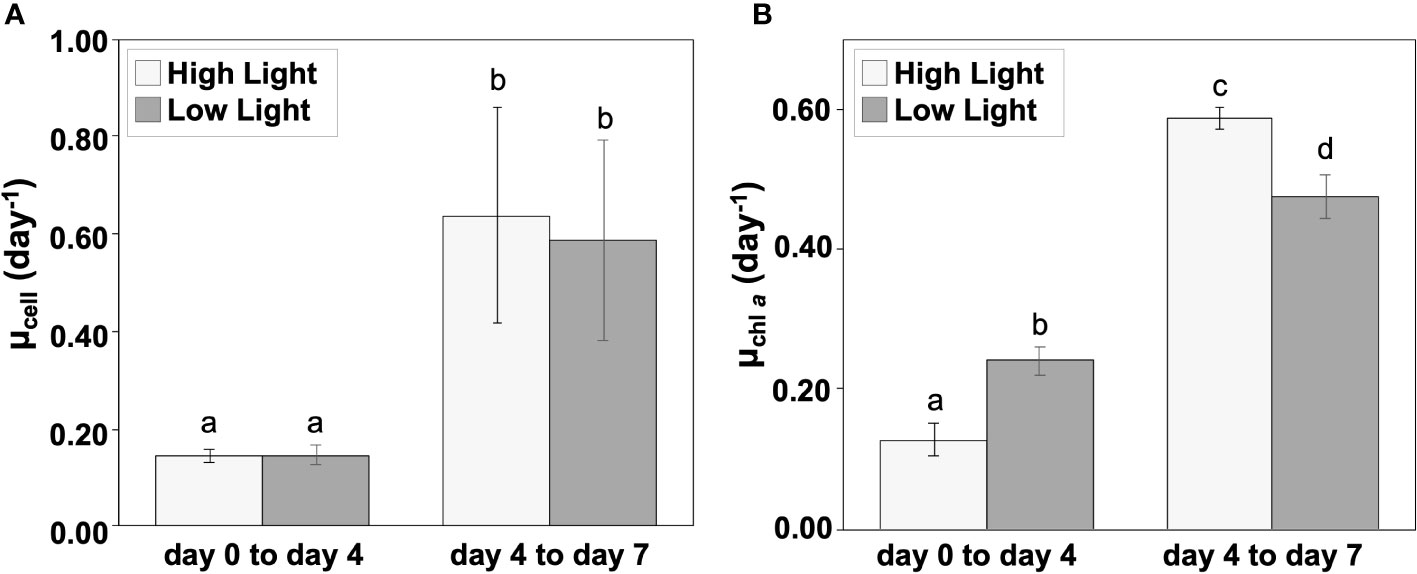
Figure 5 Cell-specific (A) and chl a-specific (B) growth rate during the incubation of two periods (day 0 to day 4 and day 4 to day 7). Light gray and gray represent the high (300 µmol photons m-2 s-1) and low (30 µmol photons m-2 s-1) light conditions, respectively. The alphabets indicate significant differences among groups (one-way ANOVA and Tukey-Kramer test, p< 0.05). Mean values ( ± SD) indicate the average of three independent measurements.
The HL and the LL microscopy data showed that centric diatoms dominated the microalgal communities, and Chaetoceros and Thalassiosira were the main genera (26–79% and 14–54%, respectively) (Figure 4 and Supplementary Table 3). On day 0, all Chaetoceros cells were in resting stages (data not shown). While Thalassiosira spp. accounted for a high percentage of the community from the initial to middle period, the proportion of C. socialis complex rapidly increased in the exponential growth phase from day 4 to day 7 under HL and LL. The other centric diatoms, mainly including D. pumila, Odontella spp., and P. sulcata, sometimes emerged, but their contributions were low (1.8–7.6%) in terms of abundance. Pennate diatoms appeared from all samples, but the contributions to the diatom communities kept relatively low in HL and LL (3.6–20% and 5.4–19%, respectively). The difference in the cell concentrations of diatoms between HL and LL on day 7 was not statistically significant (t-test, p > 0.05).
3.2.4 Fv/Fm
Distinct changes over time in Fv/Fm were observed between HL and LL (Figure 6 and Supplementary Table 3). Although Fv/Fm under LL increased from 0.14 ± 0.02 on day 0 until the end of incubation, the ratio in HL significantly decreased from day 0 to day 1 (t-test, p< 0.05) and then improved with time. The maximum values of Fv/Fm reached 0.50 ± 0.03 and 0.61 ± 0.01 on day 7 in HL and the LL, respectively.
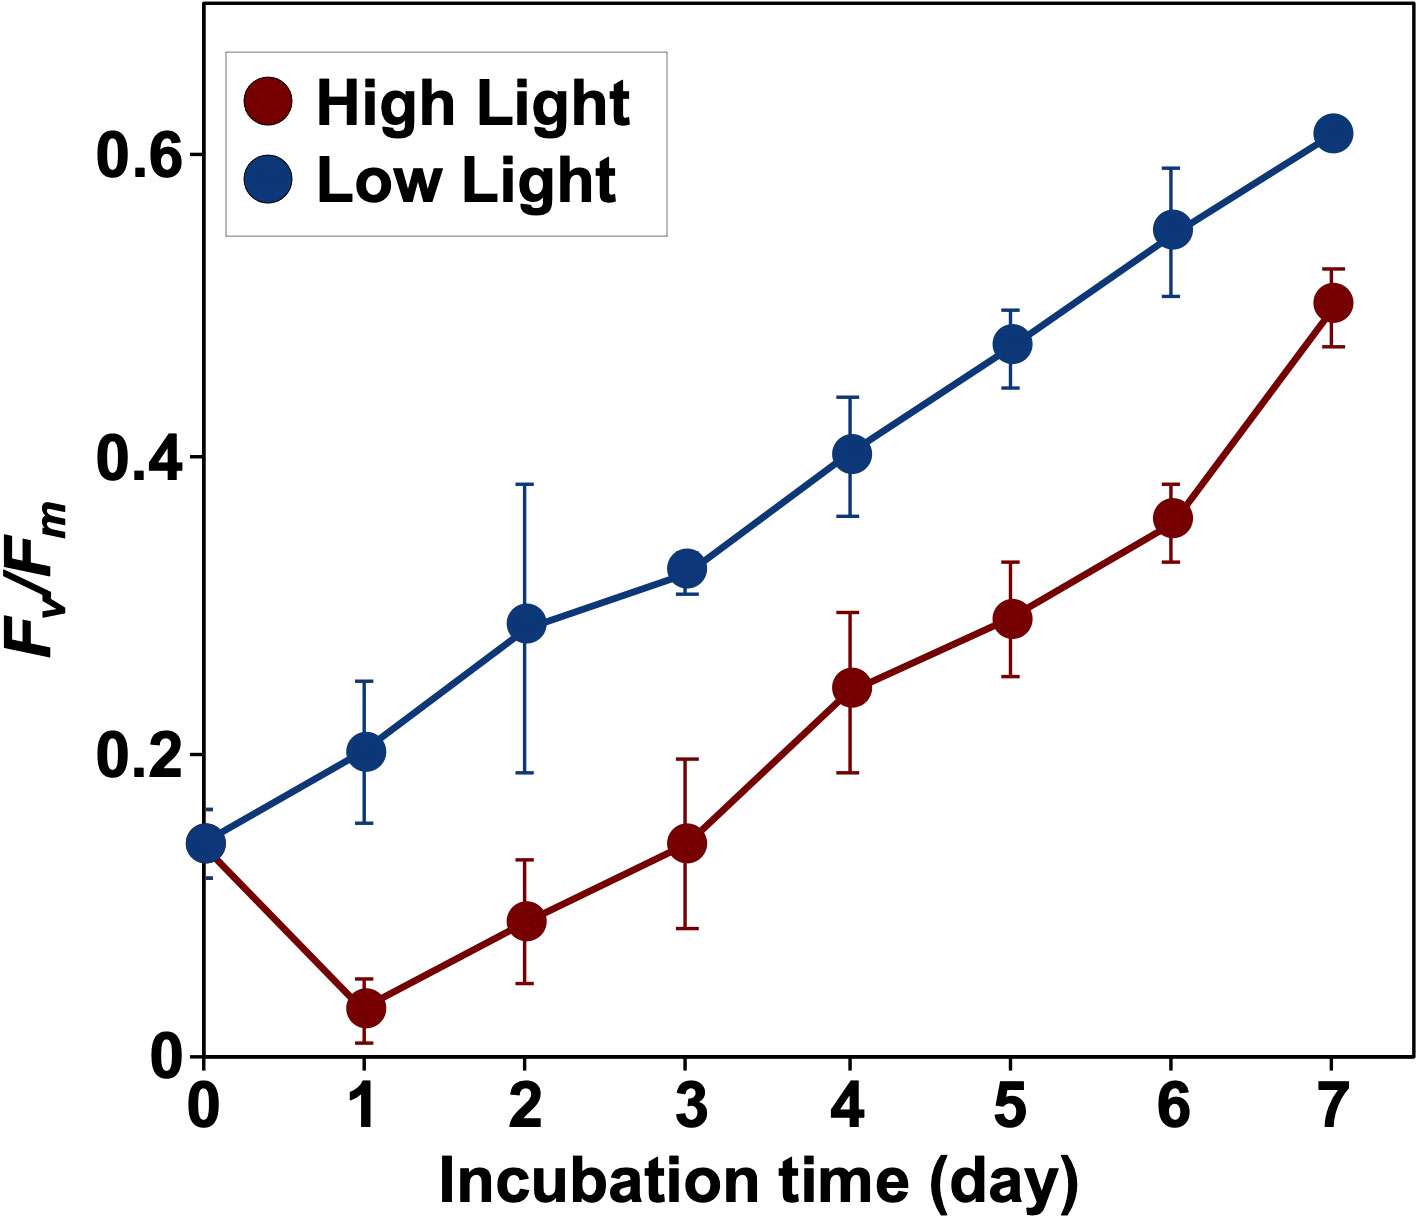
Figure 6 Variations in the maximum photochemical efficiency of PSII (Fv/Fm) during incubation. Mean values ( ± SD) indicate the average of three independent measurements.
3.2.5 P-E parameters
The P-E curve experiments revealed that relationships between algal carbon fixation rate normalized by chl a concentration and incubation light intensity significantly changed during the experiment (Figures 7, 8 and Supplementary Table 4). The initial slope αB decreased dramatically from day 0 to day 1 in both light conditions (one-way ANOVA and Tukey-Kramer test, p< 0.05) (Figure 8A), but changed only slightly thereafter. The maximum carbon fixation rate normalized by chl a concentration (PBmax) increased until day 4 under HL and LL (Figure 8B). On day 1, PBmax in the HL condition became lower than in the LL. The photoacclimation index, Ek, had an increasing trend from day 0 to day 7 and reached 130 and 109 μmol photons m-2 s-1 in HL and LL, respectively (Figure 8C). The Ek was slightly higher in HL than in LL throughout the incubation period. The maximum quantum yield of carbon fixation (Φc max) was relatively high on day 0 (0.018 mol C (mol photon)-1) but sharply declined on day 1 (one-way ANOVA and Tukey-Kramer test, p< 0.05) and then increased with time (Figure 8D). Differences in the values of Φc max between HL and LL were relatively small after day 1, but the value of LL was slightly higher than that of HL throughout incubation.
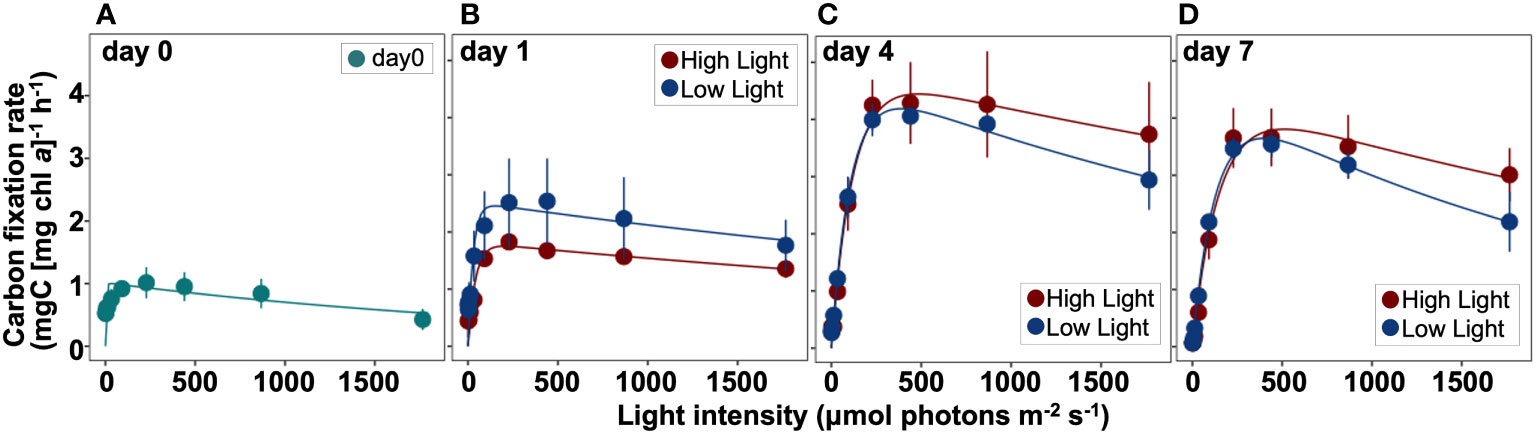
Figure 7 Photosynthesis-Energy (P-E) curves during incubation on day 0 (A), day 1 (B), day 4 (C), and day 7 (D) fitted by the photoinhibition model of Platt et al. (1980). The vertical axis indicates the carbon fixation rate normalized by chl a concentration (mg C [chl a]-1 h-1), and the horizontal one indicates the light intensity (μmol photons m-2 s-1) during incubation. The red and blue colors represent the high (300 µmol photons m-2 s-1) and low (30 µmol photons m-2 s-1) light conditions, respectively. Mean values ( ± SD) indicate the average of three independent measurements.
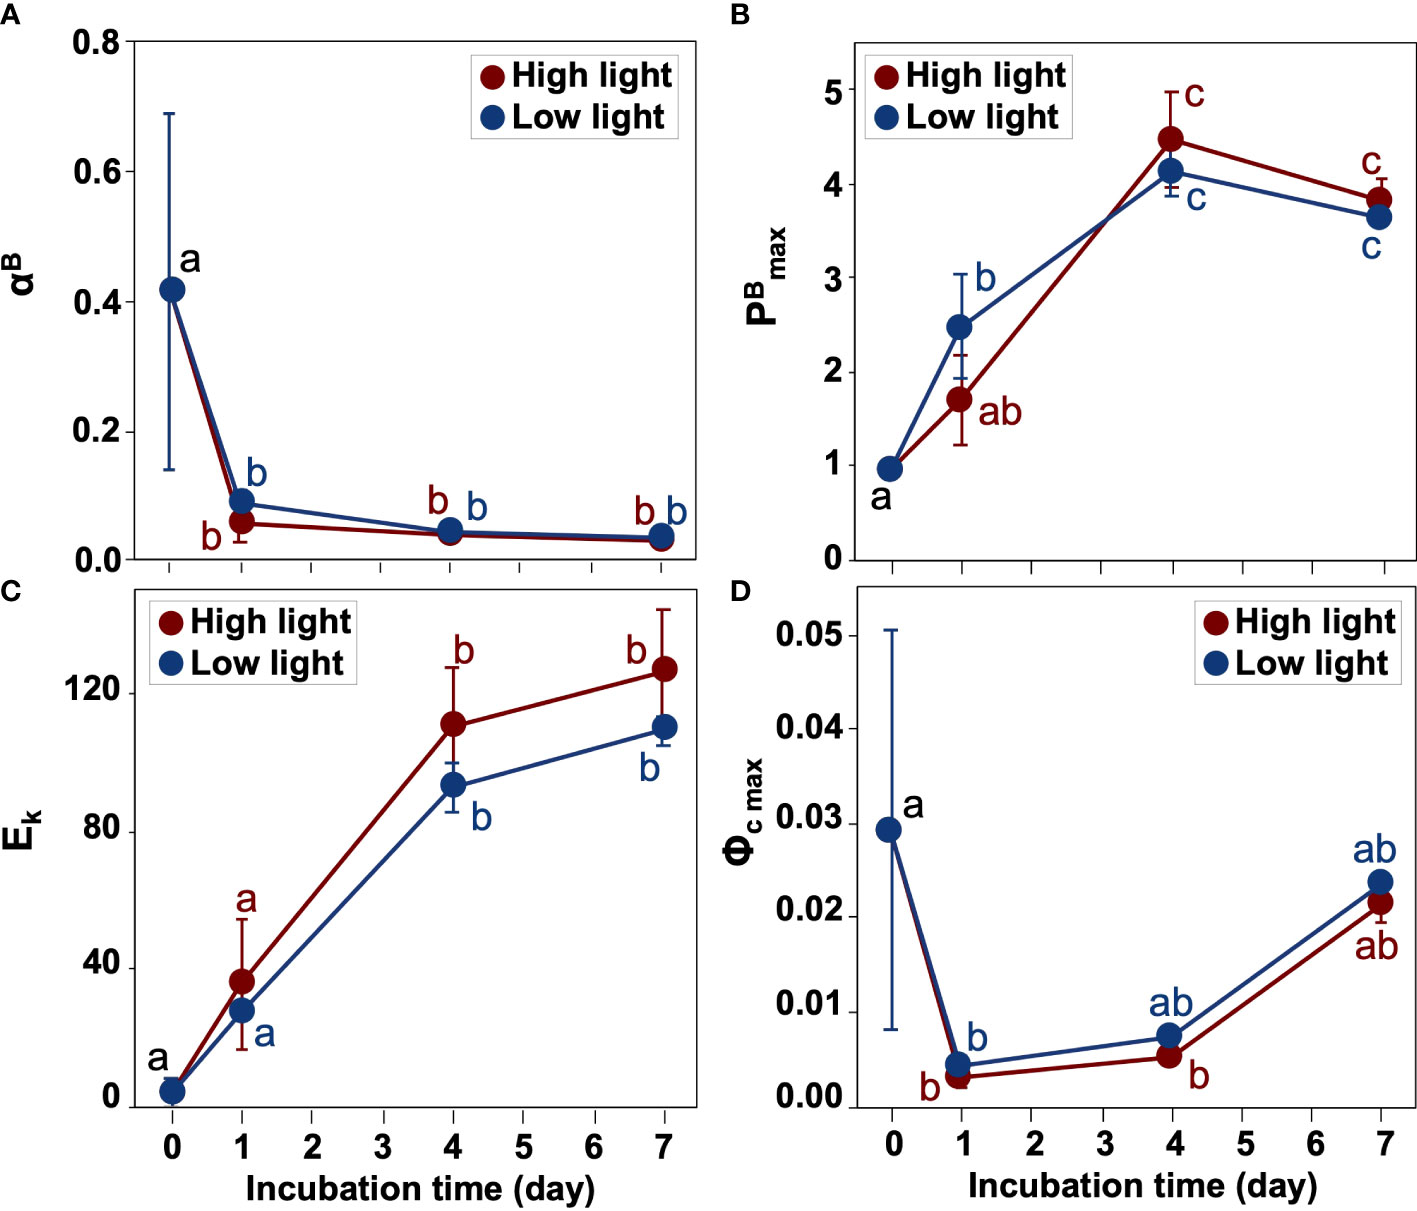
Figure 8 Variations in photosynthetic parameters during incubation. (A) the initial slope of the P-E curve normalized by chl a concentrations, αB ((mg C [chl a]-1 h-1) (μmol photons m-2 s-1)-1), (B) the maximum photosynthetic rate normalized by chl a concentration, PBmax (mg C [chl a]-1 h-1), (C) the photoacclimation index, Ek (μmol photons m-2 s-1), and (D) the maximum quantum yield of carbon fixation, Φc max (mol C (mol photon)-1). The red and blue colors represent the high (300 µmol photons m-2 s-1) and low (30 µmol photons m-2 s-1) light conditions, respectively. The alphabets indicate significant differences among groups (one-way ANOVA and Tukey-Kramer test, p< 0.05). Mean values ( ± SD) represent the average of three independent measurements.
4 Discussion
4.1 Critical diatom seed community in the Chuckchi Sea shelf sediments
The viable diatom cells containing resting stages are accumulated with high abundance in sediments of the northern Bering and the Chukchi Sea shelves (Tsukazaki et al., 2018; Fukai et al., 2019; Fukai et al., 2021). In this study, the concentrations of viable diatom cells in sediments obtained by the MPN were similar to those previously reported over the Pacific Arctic shelves (Fukai et al., 2021). In particular, the region around station 35, showing the highest concentration of viable diatom cells in this study, is the so-called biological hot spots (Grebmeier et al., 2015). Thus the abundant viable diatom cells may reflect the increased productivity in the water column (Fukai et al., 2021). It is also known that lateral advection can enhance particle export in the biological hot spots of the northern Bering Strait (Cooper et al., 2015). Common diatoms in the water column of the Pacific Arctic have been observed in the sediments (Matsuno et al., 2014; Fukai et al., 2020). The dominant C. socialis complex found at all stations in this study is known to form dense blooms in the Chukchi Sea from July to August (Sergeeva et al., 2010). Suzuki et al. (2021) revealed that C. socialis complex became predominant in the microalgal communities in terms of abundance with an increase in the water column stratification in the northern Bering and Chukchi Seas during summer. O’Daly et al. (2020) showed that the sinking POC flux in the Chukchi Sea was among the highest ever documented across the global oceans, and sinking particles consisting of aggregated diatoms and viable diatom cells were observed. Indeed, Chaetoceros spp., including C. socialis complex, dominated viable diatom communities in sediments of the northern Bering and southern Chukchi shelves (Fukai et al., 2021). Therefore, C. socialis complex, which is capable of resting stages and settled on the seafloor, can contribute to their proliferation in the water column once they are brought into sun-lit surface waters by physical mixing processes. According to Lalande et al. (2020), high sinking flux by pennate diatoms of Cy. closterium and Nitzschia frigida was observed in the Chukchi Sea. However, the two species were little observed from the sediments in this study. Tsukazaki et al. (2018) reported that some diatoms such as Pseudo-nitzschia delicatissima, Cy. closterium, Proboscia alata, and Thalassionema spp. dominated in the autumn water column in the Chukchi Sea cannot survive in the dark for more than 6 months. Also, few marine pennate diatoms are known to form resting stages in contrast to centric diatoms (McQuoid and Hobson, 1996). Therefore, not all diatoms growing in the water column can survive in the dark for a long time. However, it is also critical that many “seeds” of diatoms exist in the sediments of the Pacific Arctic shelf, and they can resume even after prolonged dark conditions.
4.2 Quick responses for light exposure and high photophysiological plasticity of viable diatom cells in sediments
The diatom composition on day 0 as counted directly under light microscopy differed from that estimated with the MPN method, especially in Thalassiosira spp. and C. socialis complex. Although the MPN technique can detect viable diatom cells (Imai et al., 1984), the abundance of Thalassiosira spp. determined by direct cell counting could include their dead cells. In contrast, we could have underestimated the abundance of C. socialis complex because they have small cell sizes (the apical axis is 2 μm at the minimum; Hasle and Syvertsen (1997)). Thus, although there were some uncertainties in cell counting, the enhanced growth of C. socialis complex contributed to the increased diatom abundance after light exposure.
Light availability is the main trigger for germinating and resuming cell growth from resting stages (Hollibaugh et al., 1981). However, drastic changes in light availability may be stressful for diatom cells because they need to acclimate to the light variability. Although β-carotene functions an antioxidant, the pigment is bound exclusively to photosystems I and II and not in the peripheral antenna (Wang et al., 2020; Xu et al., 2020; Buck et al., 2022). Thus, β-carotene can be used as a proxy for the amount of photosystems (Buck et al., 2022). The cellular contents of β-carotene in diatoms are reported to be relatively constant or increase after light exposure (e.g., Kuczynska et al., 2015; Telussa et al., 2019). In the present study, although the carotene pool size (i.e., [carotenes]/[chl a]) decreased in LL and HL, the underlying mechanisms are unclear and need to be investigated further. To protect the photosynthetic apparatus in diatoms from high light, the organisms can also utilize the diadinoxanthin-diatoxanthin cycle (Goss and Lepetit, 2015). Diatom resting stages are reported to have a sufficient xanthophyll pool to support the xanthophyll cycle (Oku and Kamatani, 1998). In addition, diatoms can alter cellular pigment composition on long time scales of hours to days to acclimate to the higher light by increasing photoprotective pigments (PPP) and decreasing light-harvesting pigments (LHP) (Brunet et al., 2011). This study showed temporal changes in DD-DT pool size between HL and LL. From day 0 to day 1, the DD-DT pool showed increasing and decreasing trends in LL and HL, respectively, although both trends were statistically insignificant. These results suggest that the algal community in HL suffered from excess light energy for photosynthesis. This speculation was supported by the results of Fv/Fm that dramatically decreased in HL and increased in LL on day 1. It is noteworthy that even under HL, resting-stages-containing viable diatom cells can actively resume growing with high Fv/Fm within a few days. Additionally, the DES showed intriguing behavior – it was the highest on day 0 before light exposure and then decreased. Diatoms in prolonged darkness can synthesize and accumulate diatoxanthin (i.e., the so-called dark NPQ), allowing them to take a low risk of reactive oxygen-dependent damage (Lacour et al., 2019; Lepetit et al., 2022). This capability could be important for diatoms in prolonged darkness because even a low photon flux might exceed their photosynthetic capacity. The dark NPQ could provide immediate photoprotection during re-illumination (Lacour et al., 2019; Lepetit et al., 2022). In HL, as the Fv/Fm increased and the DD-DT pool recovered, the increases in DES were observed, and the diadinoxanthin-diatoxanthin cycle might work well, allowing the cells to grow actively.
The quick physiological response to irradiance was also observed in the carbon fixation, which was similar to the results of Kvernvik et al. (2018) showing that the high photosynthetic capacity of microalgae was established within 24 hours of reillumination during the polar night. In this study, all P-E parameters remarkably changed from day 0 and day 1. Especially, the drastic decrease in αB and increase in Ek indicated that the resting-stages-containing viable diatom cells could respond to light exposure within 24 hours and acclimate to higher light conditions for carbon fixation. Since αB can be biophysically expressed by the functional absorption cross-section of photosystem II (σPSII) and the numbers (n) of photosynthetic units in photosystem II (i.e., αB=σPSIT n ) (Sakshaug et al., 1997), the viable diatom cells could decrease σPSII and/or the number of photosynthetic units immediately after light exposure. The optimum light intensities for carbon fixation in the vegetative cells under HL and LL during day 4 and day 7 were about 110–130 μmol photons m-2 s-1 as estimated by Ek. This value could be almost equivalent to those of Arctic microalgal communities in the euphotic layer (117 and 112 μmol photons m-2 s-1 in 50% and 1% light level, respectively; using the results of Platt et al. (1982) with the conversion factor of 4.66 μmol photons s-1 per watt used in Cota (1985)). In the Chukchi shelf, the bottom depths are shallow (ca. 50 m) and euphotic layers sometimes reaches deeper than 30 m during summer (Suzuki et al., 2021). Therefore, surface sediments, which contain abundant diatom resting stages (Fukai et al., 2021), can easily resuspend into the sunlit layer of the water column by wind events (Uchimiya et al., 2016).
It has been reported that cellular chl a concentrations in diatom resting stages are relatively high compared with vegetative cells (Hargraves and French, 1983), which would help diatom resting stages to survive under low light conditions. In this study, Ek on day 0 was only 4.11 ± 0.28 μmol photons m-2 s-1, indicating their dim-light acclimation. The Ek value was almost identical to those in Arctic ice algae (2.5 ± 1.7 μmol photons m-2 s-1; Cota, 1985). Interestingly, the maximum quantum yield of carbon fixation (Φc max) was relatively high on day 0 (Figure 8D), suggesting that the resting-stages-containing viable diatom cells in sediments can utilize photons efficiently for carbon fixation.
The maximum carbon fixation rate normalized by chl a concentration (PBmax) became more than double under LL from day 0 to day 1 and reached the maximum by day 4 in both light conditions. The maximum values (4.47 ± 0.740 mg C [mg chl a]-1 h-1 and 4.13 ± 0.213 mg C [mg chl a]-1 h-1 in HL and LL, respectively) were slightly higher than those from natural Arctic microalgal assemblages (1.32 ± 0.19 mg C [mg chl a]-1 h-1 and 1.29 ± 0.51 mg C [mg chl a]-1 h-1 in 50% and 1% light level, respectively; Platt et al., 1982) and ice algae (0.052 ± 0.027 mg C [mg chl a]-1 h-1; Cota, 1985) and the PBmax values of polar diatoms (0.2–2.46 mg C [mg chl a]-1 h-1; Lacour et al., 2017). The quick increase in PBmax contrasted with the response of cell abundance and chl a concentration which increased sharply in the second half of the incubation. Although PBmax generally increases with increasing temperature (e.g., Yoshida et al., 2018), the trend may not apply for polar diatoms at −1.6–4.0°C (Lacour et al., 2017). The PBmax is biophysically determined by the number of photosynthetic units (n) and the maximum turnover rate of a photosynthetic unit (τ-1) (Sakshaug et al., 1997). Therefore, the dramatic increase in PBmax observed in this study could be attributed to changes in these parameters. Further study would be required to understand the behavior of PBmax in Arctic diatoms.
5 Conclusions
Changes in the sea ice environment in the Pacific Arctic region can affect light penetration in the water column (Nicolaus et al., 2012; Horvat et al., 2017), resulting in changes in the composition of microalgae (Ardyna and Arrigo, 2020) and viable diatom resting stages in sediments (Fukai et al., 2021). However, few studies have focused on photophysiological responses of viable diatom in sediments to light exposure. Previous studies showed the potential seeding effects of diatom resting stage germination (Shikata et al., 2009; Hegseth et al., 2019) based on increases in cell and pigment concentrations. In the present study, we revealed that viable diatom cells containing resting stages were abundant, and these of Chaetoceros socialis complex were dominated in sediments of the Chukchi Sea shelf, and they can resume growing even after the 9 months of darkness. There was no difference in the cell concentration of diatoms between LL and HL on day 7, suggesting that the microalgae were well acclimated to both light conditions. In the higher latitude region of the Pacific Arctic, there were different viable diatom communities dominated by Attheya spp., which could be associated with sea ice (Fukai et al., 2021). Therefore, further studies are needed to elucidate the photophysiological responses of various diatom communities to light availability. In this study, the responses of resting-stages-containing viable diatom cells to light exposure were more quickly in photosynthetic physiology (i.e., Fv/Fm, some of the P-E parameters and DD-DT pool size, and DES) than in abundance (i.e., cell concentration and chl a concentration). In particular, we found a swift decrease in αB and a gradual increase in Ek (Figure 8), indicating that the resting-stages-containing viable diatom cells responded to light exposure within 24 hours and acclimated gradually to higher light conditions for carbon fixation, respectively. Although the excess light exposure suppressed the photosynthetic activity in the microalgal cells at the onset of the experiment, which was evident by a decreased Fv/Fm of HL on day 0, they recovered quickly, indicating the high photophysiological plasticity to dynamic light changes (Kvernvik et al., 2018). We also revealed that the optimum light intensities for carbon fixation in the microalgal cells reactivated from sediments were about 110–130 μmol photons m-2 s-1, as estimated by Ek between day 4 and day 7. In the shallow Chukchi shelf, diatom resting stages in surface sediments may easily resuspend into the euphotic layer (Uchimiya et al., 2016). The photosynthetic capability of the viable diatom cells in sediments that quickly respond to light exposure even after long darkness would indicate their high seeding potential for blooms in the shallow Pacific Arctic shelf, which has historically acted as an effective carbon sink, characterized by tight benthic-pelagic coupling (O’Daly et al., 2020), and is called the “benthic biological hotspots” (Grebmeier et al., 2015).
Data availability statement
The original contributions presented in the study are included in the article/Supplementary Material. Further inquiries can be directed to the corresponding authors.
Author contributions
YF conceived this research. YF and AF conducted the fieldwork. YF and KS designed the experiment. YF did the experiment and analyses. YF and KS drafted the manuscript. YF, KM, AF, and KS contributed to improving the final manuscript. All authors contributed to the article and approved the submitted version.
Funding
This work was supported by the Japan Society for the Promotion of Science (JSPS) KAKENHI Grant Number JP20J20410 and Arctic Challenge for Sustainability II (ArCS II) (program grant number JPMXD1420318865) project.
Acknowledgments
We thank the captain, crew, and researchers on board the R/V Mirai (JAMSTEC) for their tremendous efforts during the field sampling. We also acknowledge Shigeto Nishino and Koki Tokuhiro for their support and assistance on the Mirai cruise. We greatly appreciate the valuable comments provided by Prof. Douglas Campbell and the two anonymous reviewers.
Conflict of interest
The authors declare that the research was conducted in the absence of any commercial or financial relationships that could be construed as a potential conflict of interest.
Publisher’s note
All claims expressed in this article are solely those of the authors and do not necessarily represent those of their affiliated organizations, or those of the publisher, the editors and the reviewers. Any product that may be evaluated in this article, or claim that may be made by its manufacturer, is not guaranteed or endorsed by the publisher.
Supplementary material
The Supplementary Material for this article can be found online at: https://www.frontiersin.org/articles/10.3389/fmars.2022.998711/full#supplementary-material
References
Abe H., Sampei M., Hirawake T., Waga H., Nishino S., Ooki A. (2019). Sediment-associated phytoplankton release from the seafloor in response to wind-induced barotropic currents in the Bering strait. Front. Mar. Sci. 6. doi: 10.3389/fmars.2019.00097
Ardyna M., Arrigo K. R. (2020). Phytoplankton dynamics in a changing Arctic ocean. Nat. Clim. Change 10, 892–903. doi: 10.1038/s41558-020-0905-y
Ardyna M., Mundy C. J., Mayot N., Matthes L. C., Oziel L., Horvat C., et al. (2020). Under-ice phytoplankton blooms: Shedding light on the “invisible” part of Arctic primary production. Front. Mar. Sci. 7. doi: 10.3389/fmars.2020.608032
Arrigo K. R., Perovich D. K., Pickart R. S., Brown Z. W., van Dijken G. L., Lowry K. E., et al. (2012). Massive phytoplankton blooms under Arctic Sea ice. Science 336, 1408–1408. doi: 10.1126/science.1215065
Babin M., Morel A., Gagnon R. (1994). An incubator designed for extensive and sensitive measurements of phytoplankton photosynthetic parameters. Limnol. Oceanogr. 39, 694–702. doi: 10.4319/lo.1994.39.3.0694
Brunet C., Johnsen G., Lavaud J., Roy S. (2011). “Pigments and photoacclimation processes,” in Phytoplankton pigments: Characterization, chemotaxnomy and applications in oceanography. Eds. Roy S., Llewellyn C. A., Egeland E. S., Johnsen G. (New York: Cambridge University Press), 445–471.
Buck J. M., Wünsch M., Schober A. F., Kroth P. G., Lepetit B. (2022). Impact of Lhcx2 on acclimation to low iron conditions in the diatom Phaeodactylum tricornutum. Front. Plant Sci. 13. doi: 10.3389/fpls.2022.841058
Cohen J. H., Berge J., Moline M. A., Johnsen G., Zolich A. P. (2020). “Light in the Polar Night,” in POLAR NIGHT Marine Ecology. Eds. Berge J., Johnsen G., Cohen J. H. (Switzerland: Springer, Cham), 37–66.
Cooper L. W., Savvichev A. S., Grebmeier J. M. (2015). Abundance and production rates of heterotrophic bacterioplankton in the context of sediment and water column processes in the Chukchi Sea. Oceanography 28, 84–99. doi: 10.5670/oceanog.2015.59
Cota G. F. (1985). Photoadaptation of high Arctic ice algae. Nature 315, 219–222. doi: 10.1038/315219a0
Dubinsky Z. (1980). “Light utilization efficiency in natural marine phytoplankton communities,” in Primary productivity in the Sea. Ed. Falkowski P. G. (New York: Plenum Press), 83–89.
Durbin E. G. (1978). Aspects of the biology of resting spores of Thalassiosira nordenskioeldii and Detonula confervacea. Mar. Biol. 45, 31–37. doi: 10.1007/BF00388975
Edler L., Elbrächter M. (2010). “The utermöhl method for quantitative phytoplankton analysis,” in Microscopic and molecular methods for quantitative phytoplankton analysis. Eds. Karlson B., Cusack C., Bresnan E. (Paris: UNESCO), 13–20.
Fukai Y., Abe Y., Matsuno K., Yamaguchi A. (2020). Spatial changes in the summer diatom community of the northern Bering Sea in 2017 and 2018. Deep Sea Res. Part II Top. Stud. Oceanogr. 181–182, 104903. doi: 10.1016/j.dsr2.2020.104903
Fukai Y., Matsuno K., Fujiwara A., Suzuki K., Richlen M. L., Fachon E., et al. (2021). Impact of sea-ice dynamics on the spatial distribution of diatom resting stages in sediments of the Pacific Arctic region. J. Geophys. Res. Oceans 126, e2021JC017223. doi: 10.1029/2021JC017223
Fukai Y., Matsuno K., Fujiwara A., Yamaguchi A. (2019). The community composition of diatom resting stages in sediments of the northern Bering Sea in 2017 and 2018: The relationship to the interannual changes in the extent of the sea ice. Polar Biol. 42, 1915–1922. doi: 10.1007/s00300-019-02552-x
Garrison D. L. (1984). “Planktonic diatoms” in Marine plankton life cycle strategies. Eds. Steidinger K. A., Walker L. M. (Boca Raton, FL: CRC Press), 1–17.
Goss R., Lepetit B. (2015). Biodiversity of NPQ. J. Plant Physiol. 172, 13–32. doi: 10.1016/j.jplph.2014.03.004
Grebmeier J. M., Bluhm B. A., Cooper L. W., Danielson S. L., Arrigo K. R., Blanchard A. L., et al. (2015). Ecosystem characteristics and processes facilitating persistent macrobenthic biomass hotspots and associated benthivory in the Pacific Arctic. Prog. Oceanogr. 136, 92–114. doi: 10.1016/j.pocean.2015.05.006
Grebmeier J. M., Maslowski W. (2014). “The Pacific Arctic region: An introduction,” in The Pacific Arctic region: Ecosystem status and trends in a rapidly changing environment. Eds. Grebmeier J. M., Maslowski W. (Dordrecht: Springer Netherlands), 1–15. doi: 10.1007/978-94-017-8863-2_1
Guillard R. R. L., Ryther J. H. (1962). Studies of marine planktonic diatoms. i. cyclotella nana hustedt, and Detonula confervacea (cleve) gran. J. Microbiol. 8, 229–239. doi: 10.1139/m62-029
Hama T., Miyazaki T., Ogawa Y., Iwakuma T., Takahashi M., Otsuki A., et al. (1983). Measurement of photosynthetic production of a marine phytoplankton population using a stable 13C isotope. Mar. Biol. 73, 31–36. doi: 10.1007/BF00396282
Hargraves P. E., French F. W. (1983). “Diatom resting spore: Significance and strategies,” in Survival strategies of the algae (New York: Cambridge University Press), 49–68.
Hasle G. R., Syvertsen E. E. (1997). “Marine diatoms,” in Identifying marine phytoplankton. Ed. Tomas C. R. (San Diego: Academic Press), 5–385.
Hegseth E. N., Assmy P., Wiktor J. M., Wiktor J. Jr., Kristiansen S., Leu E., et al. (2019). “Phytoplankton seasonal dynamics in kongsfjorden, svalbard and the adjacent shelf,” in Ecosystem of kongsfjorden, Svalbard. Eds. Hop H., Wiencke C. (Cham: Springer International Publishing), 173–227.
Hollibaugh J. T., Seibert D. L. R., Thomas W. H. (1981). Observations on the survival and germination of resting spores of three Chaetoceros (bacillariophyceae) species. J. Phycol. 17, 1–9. doi: 10.1111/j.1529-8817.1981.tb00812.x
Horner R., Schrader G. C. (1982). Relative contributions of ice algae, phytoplankton, and benthic microalgae to primary production in nearshore regions of the Beaufort Sea. ARCTIC 35, 485–503. doi: 10.14430/arctic2356
Horvat C., Jones D. R., Iams S., Schroeder D., Flocco D., Feltham D. (2017). The frequency and extent of sub-ice phytoplankton blooms in the Arctic ocean. Sci. Adv. 3, e1601191. doi: 10.1126/sciadv.1601191
Imai I., Itakura S., Itoh K. (1990). Distribution of diatom resting cells in sediments of harima-Nada and northern Hiroshima Bay, the Seto Inland Sea, Japan. bull. Coast. Oceanogr. 28, 75–84. doi: 10.32142/engankaiyo.28.1_75
Imai I., Itoh K., Anraku M. (1984). Extinction dilution method for enumeration of dormant cells of red tide organisms in marine sediments. Bull. Plankton Soc. Jpn. 312, 123–124.
Isada T., Hattori-Saito A., Saito H., Kondo Y., Nishioka J., Kuma K., et al. (2019). Responses of phytoplankton assemblages to iron availability and mixing water masses during the spring bloom in the oyashio region, NW Pacific. Limnol. Oceanogr. 64, 197–216. doi: 10.1002/lno.11031
Isada T., Kuwata A., Saito H., Ono T., Ishii M., Yoshikawa-Inoue H., et al. (2009). Photosynthetic features and primary productivity of phytoplankton in the oyashio and kuroshio–oyashio transition regions of the Northwest Pacific. J. Plankton Res. 31, 1009–1025. doi: 10.1093/plankt/fbp050
Itakura S., Imai I., Itoh K. (1997). “Seed bank” of coastal planktonic diatoms in bottom sediments of Hiroshima Bay, Seto Inland Sea, Japan. Mar. Biol. 128, 497–508. doi: 10.1007/s002270050116
Johnsen G., Leu E., Gradinger R. (2020). “Marine micro- and macroalgae in the polar night,” in POLAR NIGHT marine ecology: Life and light in the dead of night advances in polar ecology. Eds. Berge J., Johnsen G., Cohen J. H. (Cham: Springer International Publishing), 67–112. doi: 10.1007/978-3-030-33208-2_4
Kishino M., Takahashi M., Okami N., Ichimura S. (1985). Estimation of the spectral absorption coefficients of phytoplankton in the sea. Bull. Mar. Sci. 37, 9.
Kuczynska P., Jemiola-Rzeminska M., Strzalka K. (2015). Photosynthetic pigments in diatoms. Mar. Drugs 13, 5847–5881. doi: 10.3390/md13095847
Kvernvik A. C., Hoppe C. J. M., Lawrenz E., Prášil O., Greenacre M., Wiktor J. M., et al. (2018). Fast reactivation of photosynthesis in arctic phytoplankton during the polar night1. J. Phycol. 54, 461–470. doi: 10.1111/jpy.12750
Lacour T., Larivière J., Babin M. (2017). Growth, chl a content, photosynthesis, and elemental composition in polar and temperate microalgae. Limnol. Oceanogr. 62, 43–58. doi: 10.1002/lno.10369
Lacour T., Morin P.-I., Sciandra T., Donaher N., Campbell D. A., Ferland J., et al. (2019). Decoupling light harvesting, electron transport and carbon fixation during prolonged darkness supports rapid recovery upon re-illumination in the Arctic diatom Chaetoceros neogracilis. Polar Biol. 42, 1787–1799. doi: 10.1007/s00300-019-02507-2
Lalande C., Grebmeier J. M., Hopcroft R. R., Danielson S. L. (2020). Annual cycle of export fluxes of biogenic matter near Hanna shoal in the northeast Chukchi Sea. Deep Sea Res. Part II Top. Stud. Oceanogr. 177, 104730. doi: 10.1016/j.dsr2.2020.104730
Lepetit B., Campbell D. A., Lavaud J., Büchel C., Goss R., Bailleul B. (2022). “Photosynthetic light reactions in diatoms. II. the dynamic regulation of the various light reactions,” in The molecular life of diatoms. Eds. Falciatore A., Mock T. (Cham: Springer International Publishing), 423–464. doi: 10.1007/978-3-030-92499-7_16
Matsuno K., Ichinomiya M., Yamaguchi A., Imai I., Kikuchi T. (2014). Horizontal distribution of microprotist community structure in the western Arctic ocean during late summer and early fall of 2010. Polar Biol. 37, 1185–1195. doi: 10.1007/s00300-014-1512-z
McMinn A., Martin A. (2013). Dark survival in a warming world. Proc. R. Soc. B. 280, 20122909. doi: 10.1098/rspb.2012.2909
McQuoid M. R., Hobson L. A. (1996). Diatom resting stages. J. Phycol. 32, 889–902. doi: 10.1111/j.0022-3646.1996.00889.x
Nicolaus M., Katlein C., Maslanik J., Hendricks S. (2012). Changes in Arctic sea ice result in increasing light transmittance and absorption. Geophys. Res. Lett. 39, L24501. doi: 10.1029/2012GL053738
O’Daly S. H., Danielson S. L., Hardy S. M., Hopcroft R. R., Lalande C., Stockwell D. A., et al. (2020). Extraordinary carbon fluxes on the shallow Pacific Arctic shelf during a remarkably warm and low Sea ice period. Front. Mar. Sci. 7. doi: 10.3389/fmars.2020.548931
Oku O., Kamatani A. (1998). Resting spore formation and xanthophyll pigments of the marine planktonic diatom Chaetoceros pseudocurvisetus. Bull. Plankton Soc. Jpn. 45, 123–132.
Pitcher G. C. (1990). Phytoplankton seed populations of the cape peninsula upwelling plume, with particular reference to resting spores of Chaetoceros (bacillariophyceae) and their role in seeding upwelling waters. Estuar. Coast. Shelf Sci. 31, 283–301. doi: 10.1016/0272-7714(90)90105-Z
Platt T., Gallegos C. L., Harrison W. G. (1980). Photoinhibition and photosynthesis in natural assemblages of marine phytoplankton. J. Mar. Res. 38, 687–701.
Platt T., Harrison W. G., Irwin B., Horne E. P., Gallegos C. L. (1982). Photosynthesisand photoadaptation of marine phytoplankton in the Arctic. Deep-Sea Res. 29, 1159–1170. doi: 10.1016/0198-0149(82)90087-5
Ruban A., Lavaud J., Rousseau B., Guglielmi G., Horton P., Etienne A.-L. (2004). The super-excess energy dissipation in diatom algae: Comparative analysis with higher plants. Photosynth. Res. 82, 165. doi: 10.1007/s11120-004-1456-1
Rynearson T. A., Richardson K., Lampitt R. S., Sieracki M. E., Poulton A. J., Lyngsgaard M. M., et al. (2013). Major contribution of diatom resting spores to vertical flux in the sub-polar north Atlantic. Deep Sea Res. Part Oceanogr. Res. Pap., 82, 60–71. doi: 10.1016/j.dsr.2013.07.013
Sakshaug E., Bricaud A., Dandonneau Y., Falkowski P. G., Kiefer D. A., Legendre L., et al. (1997). Parameters of photosynthesis: Definitions, theory and interpretation of results. J. Plankton Res. 19, 1637–1670. doi: 10.1093/plankt/19.11.1637
Sergeeva V. M., Sukhanova I. N., Flint M. V., Pautova L. A., Grebmeier J. M., Cooper L. W. (2010). Phytoplankton community in the Western Arctic in July–August 2003. Oceanology 50, 184–197. doi: 10.1134/S0001437010020049
Shikata T., Nukata A., Yoshikawa S., Matsubara T., Yamasaki Y., Shimasaki Y., et al. (2009). Effects of light quality on initiation and development of meroplanktonic diatom blooms in a eutrophic shallow sea. Mar. Biol. 156, 875–889. doi: 10.1007/s00227-009-1131-3
Silsbe G. M., Malkin S. Y. (2015) CRAN - package phytotools. Available at: https://mran.microsoft.com/snapshot/2017-06-23/web/packages/phytotools/index.html (Accessed August 14, 2022).
Smetacek V. S. (1985). Role of sinking in diatom life-history cycles: Ecological, evolutionary and geological significance. Mar. Biol. 84, 239–251. doi: 10.1007/BF00392493
Springer A. M., McROY C. P., Flint M. V. (1996). The Bering Sea Green Belt: Shelf-edge processes and ecosystem production. Fish. Oceanogr. 5, 205–223. doi: 10.1111/j.1365-2419.1996.tb00118.x
Stramski D., Reynolds R., Kaczmarek S., Uitz J., Zheng G. (2015). Correction of pathlength amplification in the filter-pad technique for measurements of particulate absorption coefficient in the visible spectral region. Appl. Opt. 54, 6763–6782. doi: 10.1364/AO.54.006763
Sugie K., Kuma K. (2008). Resting spore formation in the marine diatom Thalassiosira nordenskioeldii under iron- and nitrogen-limited conditions. J. Plankton Res. 30, 1245–1255. doi: 10.1093/plankt/fbn080
Suzuki K., Kamimura A., Hooker S. B. (2015). Rapid and highly sensitive analysis of chlorophylls and carotenoids from marine phytoplankton using ultra-high performance liquid chromatography (UHPLC) with the first derivative spectrum chromatogram (FDSC) technique. Mar. Chem. 176, 96–109. doi: 10.1016/j.marchem.2015.07.010
Suzuki K., Yoshino Y., Nosaka Y., Nishioka J., Hooker S. B., Hirawake T. (2021). Diatoms contributing to new production in surface waters of the northern Bering and Chukchi Seas during summer with reference to water column stratification. Prog. Oceanogr. 199, 102692. doi: 10.1016/j.pocean.2021.102692
Telussa I., Rusnadi, Nurachman Z. (2019). Dynamics of β-carotene and fucoxanthin of tropical marine Navicula sp. as a response to light stress conditions. Algal Res. 41, 101530. doi: 10.1016/j.algal.2019.101530
Throndsen J. (1978). “The dilution-culture method,” in Phytoplankton manual (Paris: Unesco), 218–224.
Tsukazaki C., Ishii K.-I., Matsuno K., Yamaguchi A., Imai I. (2018). Distribution of viable resting stage cells of diatoms in sediments and water columns of the Chukchi Sea, Arctic ocean. Phycologia 57, 440–452. doi: 10.2216/16-108.1
Uchimiya M., Motegi C., Nishino S., Kawaguchi Y., Inoue J., Ogawa H., et al. (2016). Coupled response of bacterial production to a wind-induced fall phytoplankton bloom and sediment resuspension in the Chukchi Sea shelf, Western Arctic Ocean. Front. Mar. Sci. 3. doi: 10.3389/fmars.2016.00231
von Quillfeldt C. H. (2000). Common diatom species in Arctic spring blooms: Their distribution and abundance. Bot. Mar. 43, 499–516. doi: 10.1515/BOT.2000.050
Wang W., Zhao S., Pi X., Kuang T., Sui S.-F., Shen J.-R. (2020). Structural features of the diatom photosystem II–light-harvesting antenna complex. FEBS J. 287, 2191–2200. doi: 10.1111/febs.15183
Xu C., Pi X., Huang Y., Han G., Chen X., Qin X., et al. (2020). Structural basis for energy transfer in a huge diatom PSI-FCPI supercomplex. Nat. Commun. 11, 5081. doi: 10.1038/s41467-020-18867-x
Yan D., Endo H., Suzuki K. (2019). Increased temperature benefits growth and photosynthetic performance of the sea ice diatom Nitzschia cf. neglecta (Bacillariophyceae) isolated from Saroma lagoon, Hokkaido, Japan. J. Phycol. 55, 700–713. doi: 10.1111/jpy.12846
Yoshida K., Endo H., Lawrenz E., Isada T., Hooker S. B., Prášil O., et al. (2018). Community composition and photophysiology of phytoplankton assemblages in coastal Oyashio waters of the western North Pacific during early spring. Estuar. Coast. Shelf Sci. 212, 80–94. doi: 10.1016/j.ecss.2018.06.018
Yoshida K., Hattori H., Toyota T., McMinn A., Suzuki K. (2020a). Differences in diversity and photoprotection capability between ice algae and under-ice phytoplankton in Saroma-Ko lagoon, Japan: A comparative taxonomic diatom analysis with microscopy and DNA barcoding. Polar Biol. 43, 1873–1885. doi: 10.1007/s00300-020-02751-x
Yoshida K., Nakamura S., Nishioka J., Hooker S. B., Suzuki K. (2020b). Community composition and photosynthetic physiology of phytoplankton in the western subarctic Pacific near the Kuril islands with special reference to iron availability. J. Geophys. Res. Biogeosci 125, e2019JG005525. doi: 10.1029/2019JG005525
Keywords: diatom, diatom resting stages, photophysiology, sediment, Pacific Arctic shelves, Chukchi Sea
Citation: Fukai Y, Matsuno K, Fujiwara A and Suzuki K (2022) Photophysiological response of diatoms in surface sediments to light exposure: A laboratory experiment on a diatom community in sediments from the Chukchi Sea. Front. Mar. Sci. 9:998711. doi: 10.3389/fmars.2022.998711
Received: 20 July 2022; Accepted: 29 August 2022;
Published: 15 September 2022.
Edited by:
Ondrej Prasil, Institute of Microbiology, Academy of Sciences of the Czech Republic (ASCR), CzechiaReviewed by:
Bernard Lepetit, University of Konstanz, GermanyDouglas Andrew Campbell, Mount Allison University, Canada
Ane Kvernvik, The University Centre in Svalbard, Norway
Copyright © 2022 Fukai, Matsuno, Fujiwara and Suzuki. This is an open-access article distributed under the terms of the Creative Commons Attribution License (CC BY). The use, distribution or reproduction in other forums is permitted, provided the original author(s) and the copyright owner(s) are credited and that the original publication in this journal is cited, in accordance with accepted academic practice. No use, distribution or reproduction is permitted which does not comply with these terms.
*Correspondence: Yuri Fukai, ZnVrYWlAZWVzLmhva3VkYWkuYWMuanA=; Koji Suzuki, a29qaXNAZWVzLmhva3VkYWkuYWMuanA=