 Yufei Wang
 Meng Zhou
 Zhaoru Zhang
 Michael S. Dinniman3
- 1School of Oceanography, Shanghai Jiao Tong University, Shanghai, China
- 2Polar Research Institute of China, Ministry of Natural Resources, Shanghai, China
- 3Center for Coastal Physical Oceanography, Old Dominion University, Norfolk, VA, United States
Intrusions of the warm and nutrient-rich Circumpolar Deep Water (CDW) across the Ross Sea shelf break play an important role in providing heat for ice shelf basal melting and setting the physical environment for biochemical processes. Several mechanisms driving CDW intrusions into the Ross Sea were proposed such as mesoscale eddies, tidal rectification, and interactions between the Antarctic Slope Current (ASC) and topographic features. The seasonal variations in the poleward transport of CDW are investigated using ERA-Interim wind data and a Ross Sea circulation model based on the Regional Ocean Modeling System (ROMS) between September 1999 and September 2014. The analyses focus on the currents along the shelf break and deep troughs on the Ross Sea shelf and discuss the wind-driven Ekman pumping in both shelf and adjacent open ocean regions. The results reveal that the poleward intrusions generally move up onto the continental shelf along the eastern flanks of deep troughs. Seasonal variations of the ocean surface stress torque exerted by wind and sea ice in the off-shelf area are correlated with CDW intrusions. The maxima of CDW intrusions usually occur in austral summer. There is a significant temporal correlation on the seasonal time scale between the on-shelf intrusions in deep troughs in the western Ross Sea shelf and poleward Sverdrup transports in the adjacent off-shelf open ocean driven by the Ekman pumping. The analysis of ocean surface stress fields also indicates that the vorticity fluxes through the Ekman pumping are in favor of southward and northward transports in the eastern and western parts of the Ross Sea, respectively. The relationships between currents, CDW intrusions, and ocean surface stress fields imply the importance of air–sea interactions and potential climate change to the environment in the Ross Sea.
1 Introduction
The Ross Sea is an embayment lying in the Pacific sector of the Southern Ocean between Cape Adare at 170°E and Cape Colbeck at 158°W (Figure 1). South of the Ross Sea, there is the floating Ross Ice Shelf, the largest ice shelf on Earth. The broad Ross Sea continental shelf covers over 4.6 × 10⁵ km2, and the shelf break occurs at the 700-m isobath (Budillon et al., 2006; Smith et al., 2012). On the continental shelf, there are a series of southwest-northeastward-oriented submarine banks shallower than 400 m (e.g., the Mawson and Pennell Banks) and troughs with depths of 500–600 m (e.g., the Drygalski, Joides, and Glomar Challenger Troughs). The predominant causes for the southwest-northeastward-oriented bottom topography of the Ross Sea continental shelf are the glacial erosion and extrusion by the overlying ice sheets in the past (Anderson et al., 2014). The circulation, mixing, and heat–salt exchanges of water masses in the Ross Sea are significantly affected by the featured complex topography, especially the deep troughs (Dinniman et al., 2011; Morrison et al., 2020).
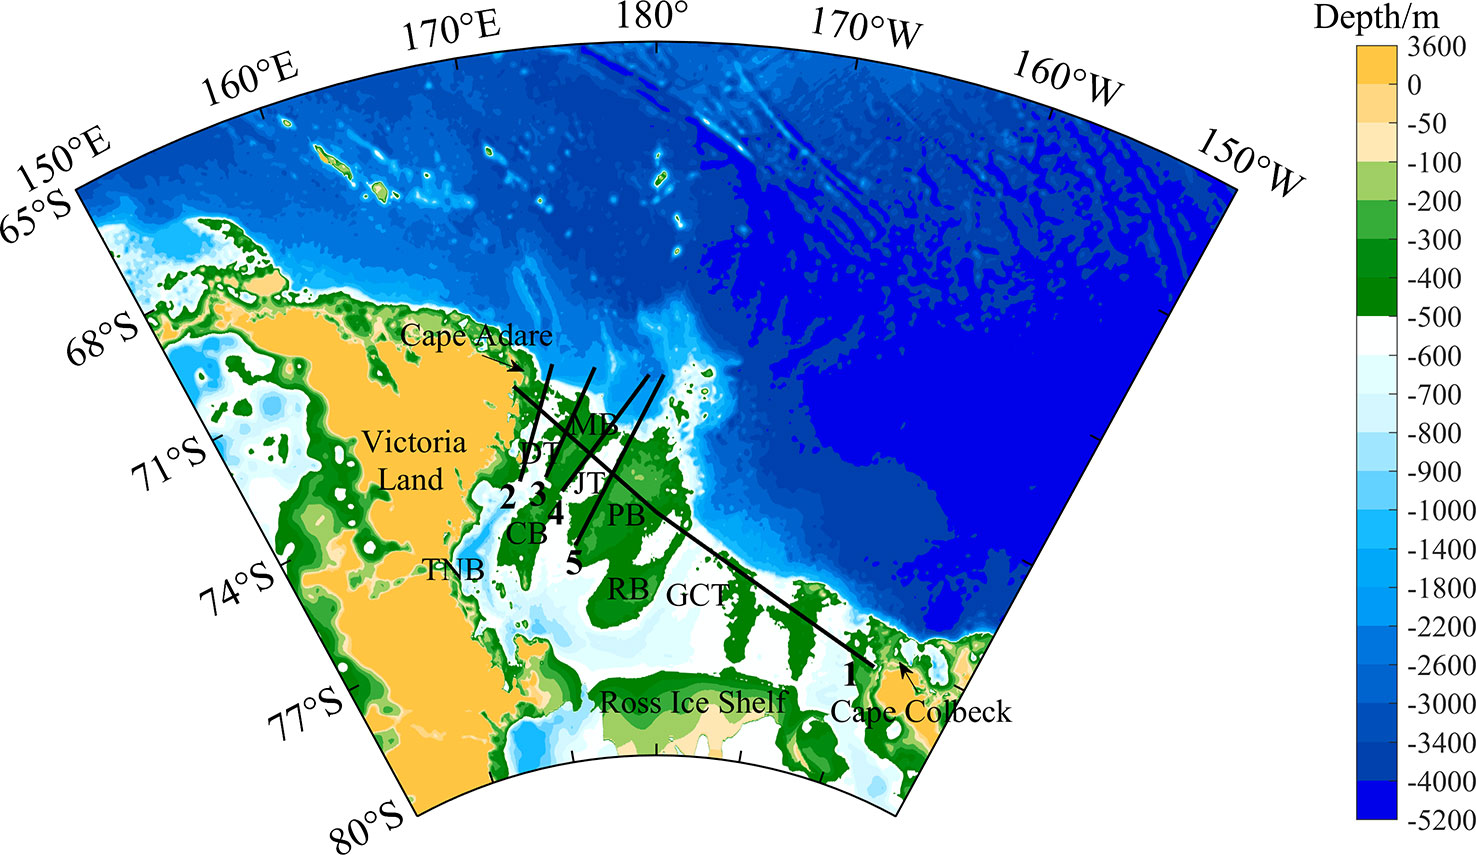
Figure 1 Bathymetry of the Ross Sea and its adjacent open ocean derived from ETOPO1 (Amante and Eakins, 2009). Major troughs include the Drygalski Trough (DT), the Joides Trough (JT), and the Glomar Challenger Trough (GCT); major banks include the Mawson Bank (MB), Crary Bank (CB), Pennell Bank (PB), and Ross Bank (RB). TNB, Terra Nova Bay. Transect 1 is indicated by the northwest–southeast solid black line close to the Ross Sea shelf break. Transects 2 and 3 are indicated by two southwest–northeast solid black lines along the western and eastern flanks of the Drygalski Trough (DT). Transects 4 and 5 are indicated by two southwest–northeast solid black lines along the western and eastern flanks of the Joides Trough (JT).
The hydrography, sea ice, and ecosystem in the Ross Sea and the stability of the Ross Ice Shelf are long considered related to deep intrusions of the warm Circumpolar Deep Water (CDW) into the Ross Sea shelf (Smith et al., 2012). A number of water masses can be found based on their formations and characteristics of potential temperature θ, salinity S, and neutral density γn on the continental shelf (Jackett and McDougall, 1997; Orsi et al., 1999; Orsi and Wiederwohl, 2009). The Antarctic Surface Water (AASW; γn< 28.0 kg·m−3) is usually fresh, and it is significantly affected by surface processes such as cooling/heating, air temperature, wind, and precipitation, which occupies the upper ocean. The Modified Circumpolar Deep Water (MCDW; 28.0< γn< 28.27 kg·m−3, θ > -1.5°C) is the warmest, and it is originated from CDW and modified by cooling and mixing with shelf waters. The shelf waters (γn > 28.27 kg·m−3) occupy the bottom layer and consist of the High-Salinity Shelf Water (HSSW; S > 34.62 psu, θ ~ −1.85°C), Low-Salinity Shelf Water (LSSW; S < 34.62 psu; θ ~ −1.80°C), Modified Shelf Water (MSW; θ > −1.85°C), and Ice Shelf Water (ISW; θ < −1.95°C), which are primarily originated from cooling, brine rejection from sea ice-formation processes, mixing processes, and interactions with the base of the Ross Ice Shelf (Budillon et al., 2003; Budillon et al., 2006). Exports of dense shelf waters with different properties have subsequent impacts on the outflows adjacent to the continental slope (Budillon et al., 2011). There are two major water masses on the slope: the CDW (28.0< γn< 28.27 kg·m−3, θ ~ 1.0°C), a significantly warm and nutrient-rich water mass, intrudes the continental shelf and consequently affects the ice shelf mass balance and biological processes (Smith et al., 2012; Hillenbrand et al., 2017); the Antarctic Bottom Water (AABW; γn > 28.27 kg·m−3, θ > −1.85°C), a mixture between shelf waters and CDW, forms the bottom layer in the Southern Ocean and plays an important role in abyssal circulations (Orsi et al., 1999; Budillon et al., 2006; Gordon et al., 2009).
CDW carried by the Antarctic Circumpolar Current (ACC) is the most voluminous water mass in the Southern Ocean (Worthington, 1981). Deep waters from different ocean basins (e.g., the North Atlantic Deep Water, the Pacific Deep Water, and the Indian Deep Water) mingle and mix in the ACC to form CDW (Orsi et al., 1995). For CDW to reach the Ross Sea continental shelf, it must cross the Antarctic Slope Front (ASF) and Antarctic Slope Current (ASC) (Gordon et al., 2009; Thompson et al., 2018). As a dynamic barrier, the ASF is locked on the Ross Sea continental slope, and the ASC is associated with the baroclinic pressure gradient resulting from the cross-front density gradient formed by the typically colder and denser deep shelf water south of the ASF and the warmer and lighter CDW north of the ASF (Budillon et al., 2011; Rintoul, 2018). Therefore, water mass exchanges crossing the ASF are well recognized as southward intrusions of CDW into the Ross Sea shelf and northward outflows of shelf waters. The movement and gradient of the ASF may adjust the currents on the slope, overflow of dense shelf water, and inflow of CDW (Gordon et al., 2009; Budillon et al., 2011; Gordon et al., 2015; Thompson et al., 2018).
The spatial–temporal variations and the mechanisms of CDW intrusions have been studied by field observations and numerical simulations in the past several decades (Klinck and Dinniman, 2010; Morrison et al., 2020). These studies indicated several mechanisms for CDW intrusions, including mesoscale eddies spinning from the ASF (Stewart and Thompson, 2015; Thompson et al., 2018), tidal rectification (Padman et al., 2009; Wang et al., 2013), topographic stirring of the ASC in deep troughs (Dinniman et al., 2007; Dinniman et al., 2011), vorticity balance adjustment induced by local topography and bottom friction (Palóczy et al., 2020), sea surface gradients due to dense shelf water transport off the shelf (Morrison et al., 2020), and variations of large-scale atmospheric forcings such as the Amundsen Sea Low, the Southern Annular Mode, and Southern Hemisphere westerlies (Thoma et al., 2008; Nakayama et al., 2018; Zhang et al., 2020).
The warm CDW occupies the geostrophic interior of the water column, with a core typically at 600–1,000-m depth in the open ocean near the Ross Sea slope. It is studied that the cross-shelf heat transport is related to local wind stress torque, while the vortex stretching over the shelf and slope also strongly influences the cross-shelf transport (Rodriguez et al., 2016; Palóczy et al., 2020). In the study of the eastern Amundsen Sea, the results indicate that the volume of CDW entering the deep trough on the shelf is driven by uplifts of both the undercurrent under the ASF and isopycnals by the Ekman pumping (Dotto et al., 2019). Off the shelf slope, previous results also revealed that the heat from the CDW core can be transported up to the continental slope where eddies associated with topographic features are responsible for transporting heat further into shelf regions. Strong correlations between meridional transports of water masses and heat and patterns of the Ekman transport convergence at both seasonal and interannual scales are found (Wåhlin et al., 2012; Dotto et al., 2019). As a result, based on the vorticity budget, meridional transport in a continental shelf region and its adjacent open ocean can be interpreted by the potential vorticity balance between topographic change, friction, baroclinic pressure gradients, and potential vorticity (Thompson et al., 2018; Palóczy et al., 2020).
In the open ocean, the dominant terms in the vorticity balance below the mixed layer and away from boundaries are reduced to the balance between the advection of planetary vorticity and vorticity input by wind stress torque (Thompson et al., 2018). The meridional Sverdrup transport driven by cyclonic wind fields in the open ocean has been considered one of the primary processes to maintain the ASF; the dynamics of the ASC is considered similar to a western boundary current compensating the deep southward Sverdrup transport (Nakayama et al., 2018; Thompson et al., 2018). Thus, seasonal and long-term variations of ocean surface stress fields in the Ross Sea and Southern Ocean will affect the Sverdrup transport, the strengths and locations of the ASF and ASC, and hence the intrusions of CDW into the Ross Sea shelf.
This study aims to describe the detailed pathway, process, and temporal variation of CDW intrusions into the Ross Sea shelf at both seasonal and interannual scales, discuss the relation between CDW intrusions in the deep troughs and large-scale wind-driven meridional transport in the broad off-shelf Ross Sea based on a high-resolution regional ocean circulation model, and hence bring insight into cross-shelf exchange processes around Antarctica.
2 Materials and methods
This study uses a coupled ocean–sea ice–ice shelf model covering the Ross Sea as described in Dinniman et al. (2018), which is conducted with the Regional Ocean Modeling System (ROMS; Shchepetkin and McWilliams, 2009). The model domain extends from 67.5°S to 85°S and includes the ocean cavity underneath the floating Ross Ice Shelf. The topography is using the International Bathymetric Chart of the Southern Ocean (IBCSO; Arndt et al., 2013) and Bedmap2 (Fretwell et al., 2013). The vertical sigma-layers are set to 24 levels of varying depths, which are concentrated toward the bottom and surface. The simulated sea ice is from the ROMS built-in dynamic ice model (Budgell, 2005), and its lateral boundary conditions are derived from the Special Sensor Microwave/Imager (SSM/I). In contrast, the ice shelf is simulated with a static model; iceberg calving and the thickness and extent changes of the Ross Ice Shelf are not considered. The dynamic and thermodynamic effects of the Ross Ice Shelf at the ocean–ice interface are parameterized (Holland and Jenkins, 1999; Dinniman et al., 2011). The model is initialized with temperature and salinity fields from the World Ocean Atlas 2001 (WOA01), which is also used on the lateral open boundaries. The model atmospheric forcing fields such as 6-hourly wind and air temperature and monthly sea level pressure and humidity are obtained from the ERA-Interim reanalysis product (Dee et al., 2011; Dinniman et al., 2018). In addition, the monthly climatologies of precipitation and cloud cover are from the Antarctic Mesoscale Prediction System (AMPS; Powers et al., 2003; Bromwich et al., 2005) and the International Satellite Cloud Climatology Project stage D2 (ISCCP D2; Rossow et al., 1996), respectively. The ocean tides are not included in this model.
The simulation ran for 15 years (September 15, 1999 to September 15, 2014) after a 6-year spin-up simulation, with the data saved at a 5-day interval. The horizontal resolution of the model is approximately 5 km. The topography, temperature, salinity, ocean current, and sea ice fields used in this study are produced by this model. The only exception is the bathymetry of the Ross Sea and its adjacent open ocean and land (shown in Figure 1) that is derived from ETOPO1, a 1 arc-minute global relief model developed by the National Oceanic and Atmospheric Administration (NOAA) (Amante and Eakins, 2009).
The monthly wind speed data at 10 m above the sea surface between 1999 and 2014 with a horizontal grid resolution of 0.125° were used for subsequent stress calculations, which were obtained from ERA-Interim (Dee et al., 2011). This wind dataset is a global atmospheric reanalysis dataset provided by the European Centre for Medium-Range Weather Forecast (ECMWF).
The wind stress over open water is normally estimated using the bulk formula (e.g., Dawe and Thompson, 2006; Dong et al., 2022)
where ρa= 1.29 kg·m−3 is the air density; = (u10,v10) is the 10-m wind vector; (u10,v10) are the zonal and meridional components, respectively; CD,ao is the air–ocean drag coefficient generally calculated by Large and Pond (1981):
It is necessary to consider the significant seasonal variation of sea ice due to freezing, melting, and drift in polar oceans. In the ice-covered area, the stress exerted by winds depends on the relative motions between the ice and the surface current vs. the 10-m wind. Compared to the 10-m wind, surface ice and water movements are negligible. Thus, the total wind stress is calculated by the combination of two stresses: the air–ocean stress and the air–ice stress , which is calculated by Equation 1 using CD,ai in place of CD,ao:
where A is sea ice concentration (0–1) and CD,ai = 1.89×10⁻³ is the air–ice drag coefficient depending on sea ice characteristics and distributions (Lüpkes and Birnbaum, 2005).
The ice–ocean surface stress is also calculated by the bulk formula (Timmermann et al., 2009)
where ρw = 1026 kg·m-3 is the seawater density; and are respectively the sea ice and ocean surface velocity, and the turning angle is negligible; CD,io = 3.0×10⁻³ is the drag coefficient between ice and ocean related to the ice surface and bottom roughnesses, concentration, thickness and length, and ridge distributions. Studies of drag coefficients have been carried out, and CD,io generally increases at first and then decreases with increasing sea ice concentration (Lu et al., 2011; Lu et al., 2016). A rough estimate of CD,io certainly bears the lack of detailed floe geometry and ice dynamics.
In short, CD,ao and CD,io are both the critical parameters that determine the drag forces at the ocean surface, that is, the momentum flux (Timmermann et al., 2009; Lu et al., 2011; Lu et al., 2016). The total oceanic stress , also named as wind- and ice-stress, referring to the drag forces on surface water exerted by winds and ice floes, can also be obtained by the area-weighted average of and (Yang, 2006; Timmermann et al., 2009), i.e.,
The Ekman vertical velocity Wek is related to the ocean surface stress (Enriquez and Friehe, 1995; Yang, 2006), and it is calculated as
where denotes the oceanic surface stress; f = 2Ωsinα is the Coriolis parameter, in which Ω is the rotation rate of the earth in the fixed coordinates and α is the latitude.
The Sverdrup transport Vsv is given by
where is the meridional gradient of the Coriolis parameter.
3 Results
3.1 Along-trough intrusions of CDW
Five transects were selected to describe the water mass mixing, transformation, exchange, and transport at the shelf break, of which Transect 1 is on the shelf approximately in parallel to the shelf break crossing all troughs and Transects 2–5 are along the western and eastern flanks of the Drygalski and Joides Troughs (Figure 1).
The depth-averaged currents in the austral summer (February) and winter (August) seasons along Transect 1 are shown in Figure 2. There are significant seasonal variations in the inflows and outflows along Transect 1. The inflow velocity reaches the maximum on the eastern flanks of the troughs, nearly 0.12 m·s−1 occurring in the Joides Trough during the summer and reduces to 0.06 m·s−1 during the winter; the outflow velocity reaches the maximum on the western flank of the Glomar Challenger Trough, near 0.11 m·s−1 during the summer and reduces to 0.10 m·s−1 during the winter (Figures 2A, B). From the flow velocity distributions and temperature profiles, it can be noted that the Drygalski, Joides, and Glomar Challenger Troughs are the main channels for CDW intrusions into the Ross Sea continental shelf. The temperature and salinity characteristics of the summer and winter water mass distributions are shown in Figures 2C–F. The surface water (0–100 m) is seasonally warm, low-salt, and quasi-homogeneous, especially in the western Ross Sea, where the temperature is higher than −0.5°C during summer and seasonally colder down to −1.80°C and saltier in winter. The cores of the MCDW (greater than −0.5°C) usually lie within a depth range from 200 to 400 m in both summer and winter, which slightly vary with topography and seasons. The warmest MCDW (~0.16°C) is seen over the eastern flank of the Glomar Challenger Trough. The shelf water is cold and salty. The saltier HSSW is concentrated at the bottom west of 175°W, and it is below 200 m in February and 300 m in August (Figures 2E, F). In contrast, the lighter LSSW spreads at the continental shelf east of 175°W.
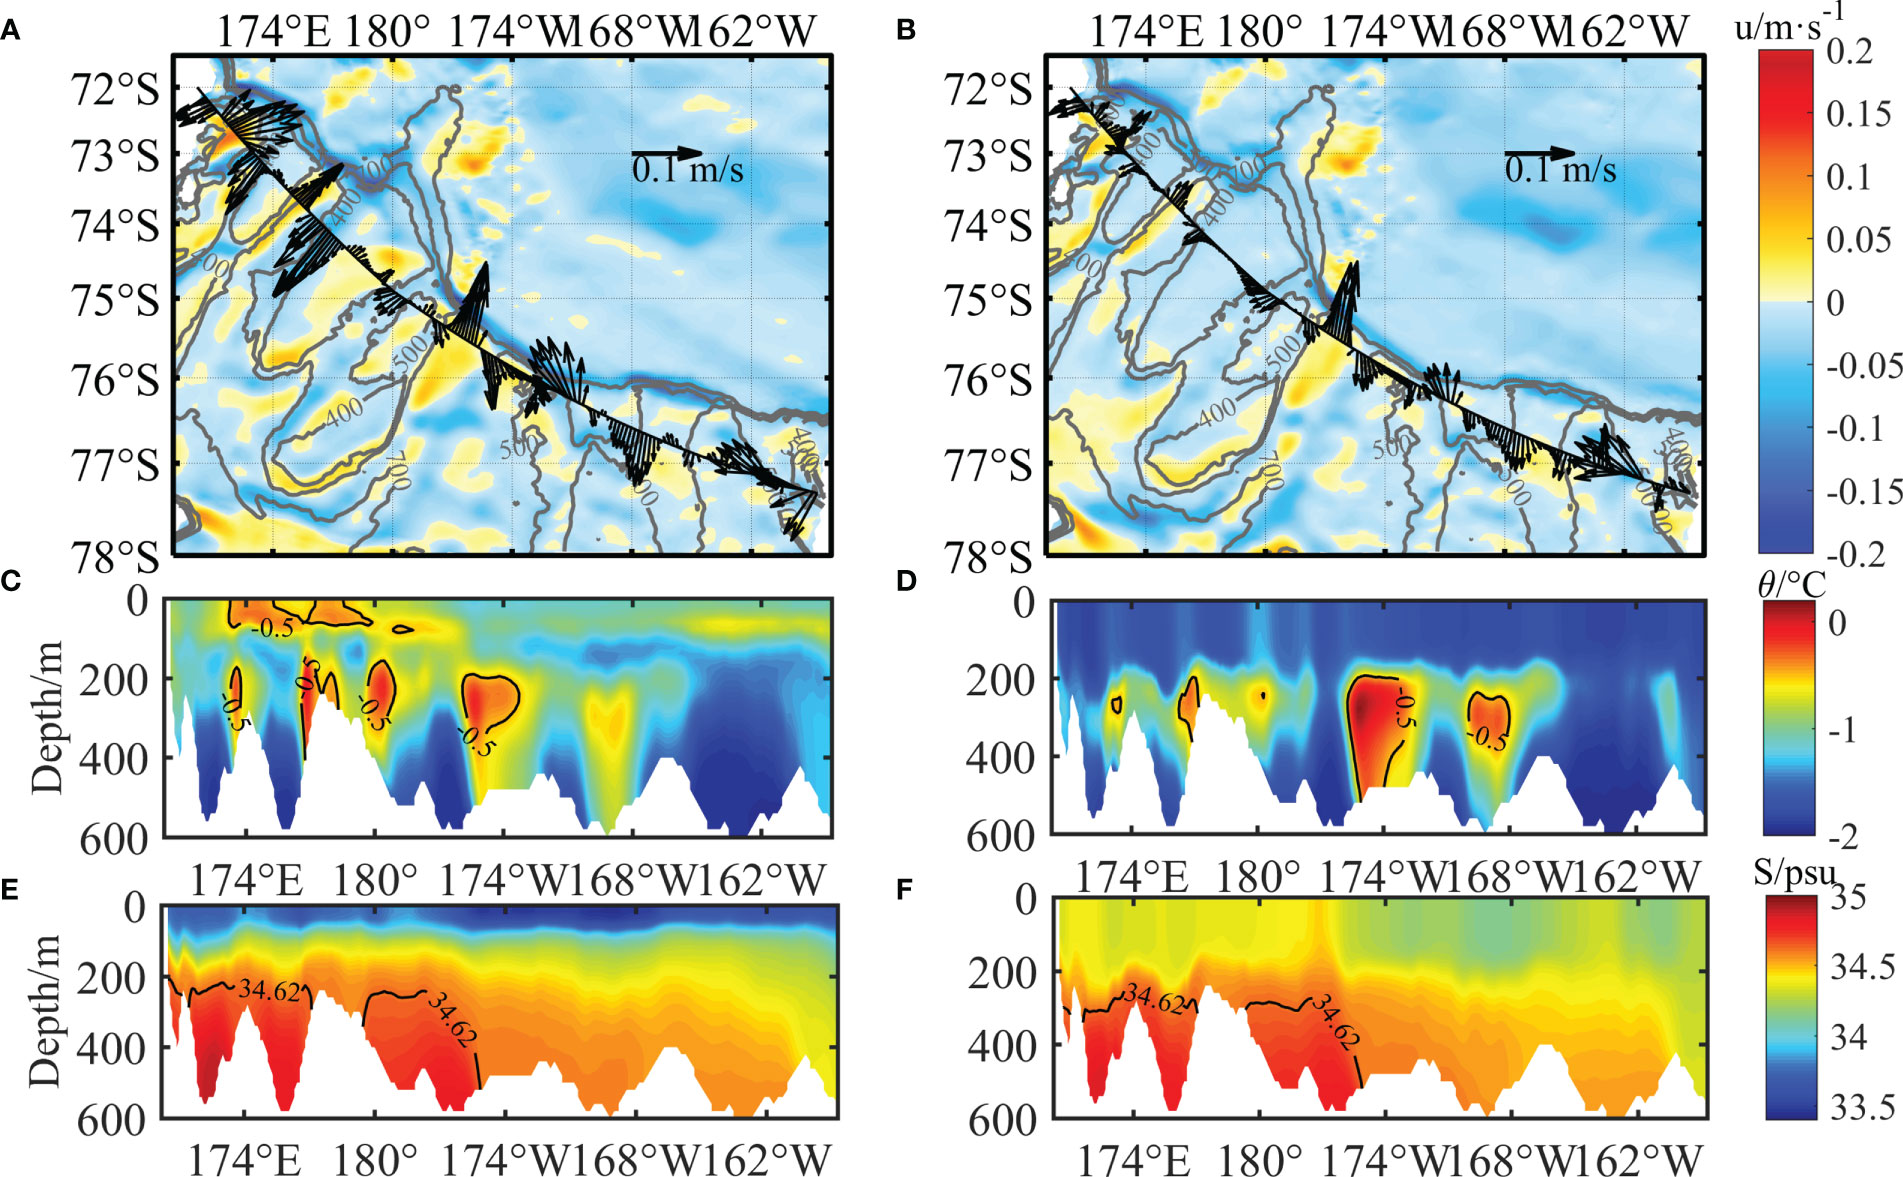
Figure 2 (A, B) Climatological depth-averaged currents (vectors) along Transect 1 and west–east components of velocities (blue, westward; red, eastward) in February and August, respectively, and isobaths (gray lines). (C, D) Climatological vertical sections of potential temperature (colors) along Transect 1 in February and August and −0.5°C isotherms (black lines) marking the core of MCDW. (E, F) Climatological vertical sections of salinity (colors) along Transect 1 in February and August and 34.62 psu isohalines (black lines) marking the HSSW and LSSW. MCDW, Modified Circumpolar Deep Water; HSSW, High-Salinity Shelf Water; LSSW, Low-Salinity Shelf Water.
The seasonally mean inflows and outflows across Transect 1 are calculated for periods between December and February, March and May, June and August, and September and November representing austral summer (DJF), autumn (MAM), winter (JJA), and spring (SON), respectively (Figure 3). Warm CDW inflows are typically found on the eastern flanks of the troughs, while shelf water outflows are on the western flanks. To estimate the two-way exchange of water masses in troughs, the off-shelf transports on the western flanks, on-shelf transports on the eastern flanks, and total net transports in the Drygalski, Joides, and Glomar Challenger Troughs are computed based on the transport estimates along Transect 1 (Figure 3) and in the shaded areas (Table 1). The results indicate that on-shelf transports of these three troughs all reach peaks in summer. The maximum on-shelf transport of 10.95 × 10⁵ m3·s−1 occurs in the Joides Trough during summer, almost six times higher than 1.86 × 10⁵ m3·s−1 during winter. Similar results are found in the Drygalski and Glomar Challenger Troughs where the on-shelf transports reach the maxima in summer and are relatively low in other seasons. The strong seasonality of on-shelf transports matches the result that was found through the mooring study in the Drygalski Trough (Castagno et al., 2017). The off-shelf transports are stronger within the troughs in the western part. The largest persistent off-shelf transport occurs up to 19.68 × 10⁵ m3·s−1 in autumn with small seasonal variations. In the Drygalski and Glomar Challenger Troughs, the total transports are positive in all seasons representing major off-shelf transports of shelf waters.
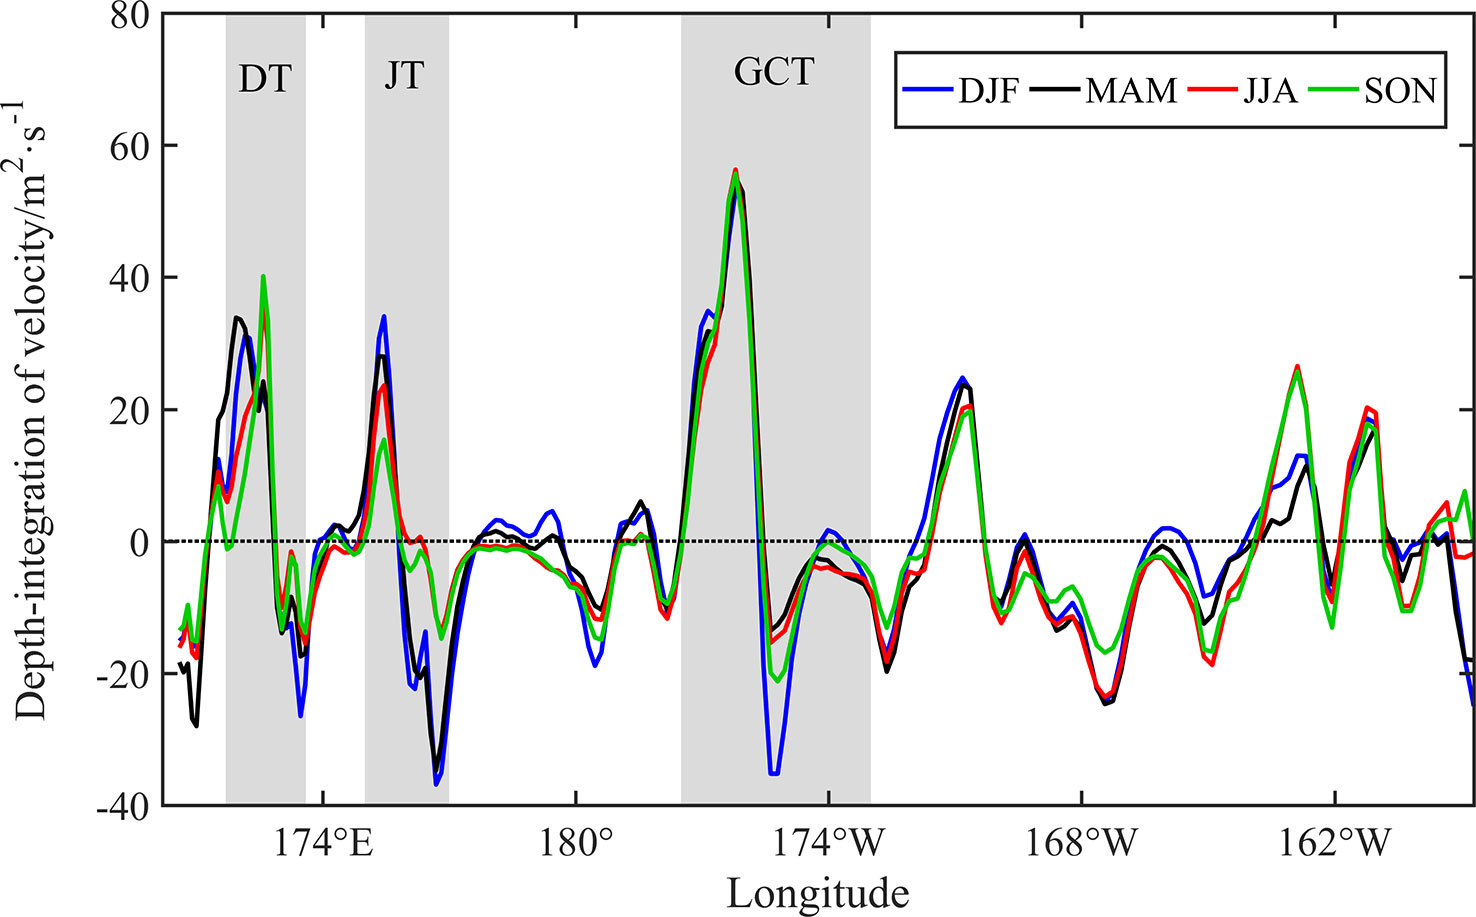
Figure 3 Climatological seasonal averages of depth-integrated cross-transect transports in m2·s−1 (positive, off-shelf; negative, on-shelf) along Transect 1. Gray areas indicate the DT, JT, and GCT. DJF, MAM, JJA, and SON denote December–January–February, March–April–May, June–July–August, and September–October–November, respectively. DT, Drygalski Trough; JT, Joides Trough; GCT, Glomar Challenger Trough.
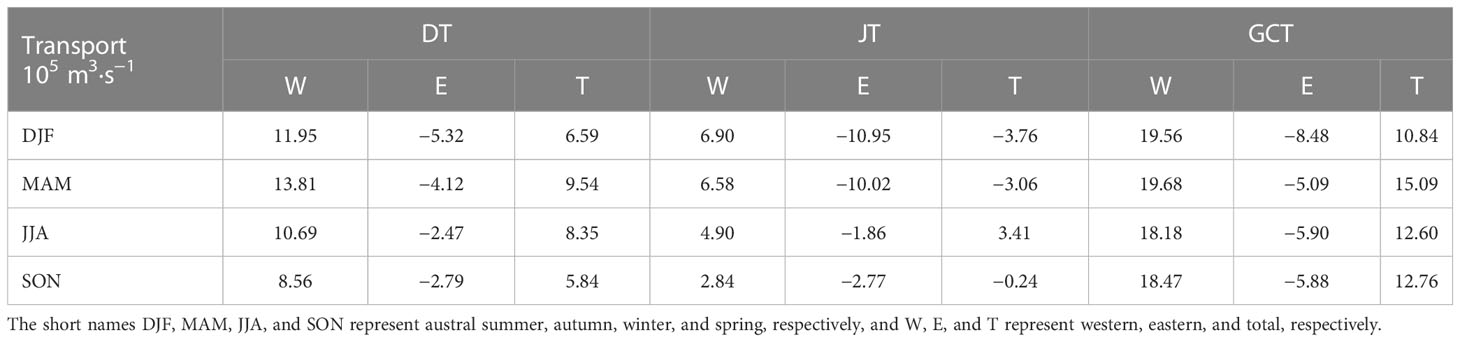
Table 1 The on-shelf (negative) and off-shelf (positive) transports across Transect 1 in the Drygalski Trough (DT), Joides Trough (JT), and Glomar Challenger Trough (GCT), whose widths are shown in Figure 3 (gray areas).
The extensions of warm CDW/MCDW within the deep troughs are further investigated from the horizontal velocities, potential temperature, and salinity along Transects 2–5 in Figure 4. The significantly tilted isotherms, isohalines, and isopycnals over the slope are associated with the ASF and ASC. The water masses converge at the shelf break, including the AASW, CDW, MCDW, MSW, HSSW, and AABW (Figure 5). The MCDW is filled between the fresher AASW and saltier MSW/HSSW on the shelf, and CDW is filled between the AASW and AABW in the open ocean.
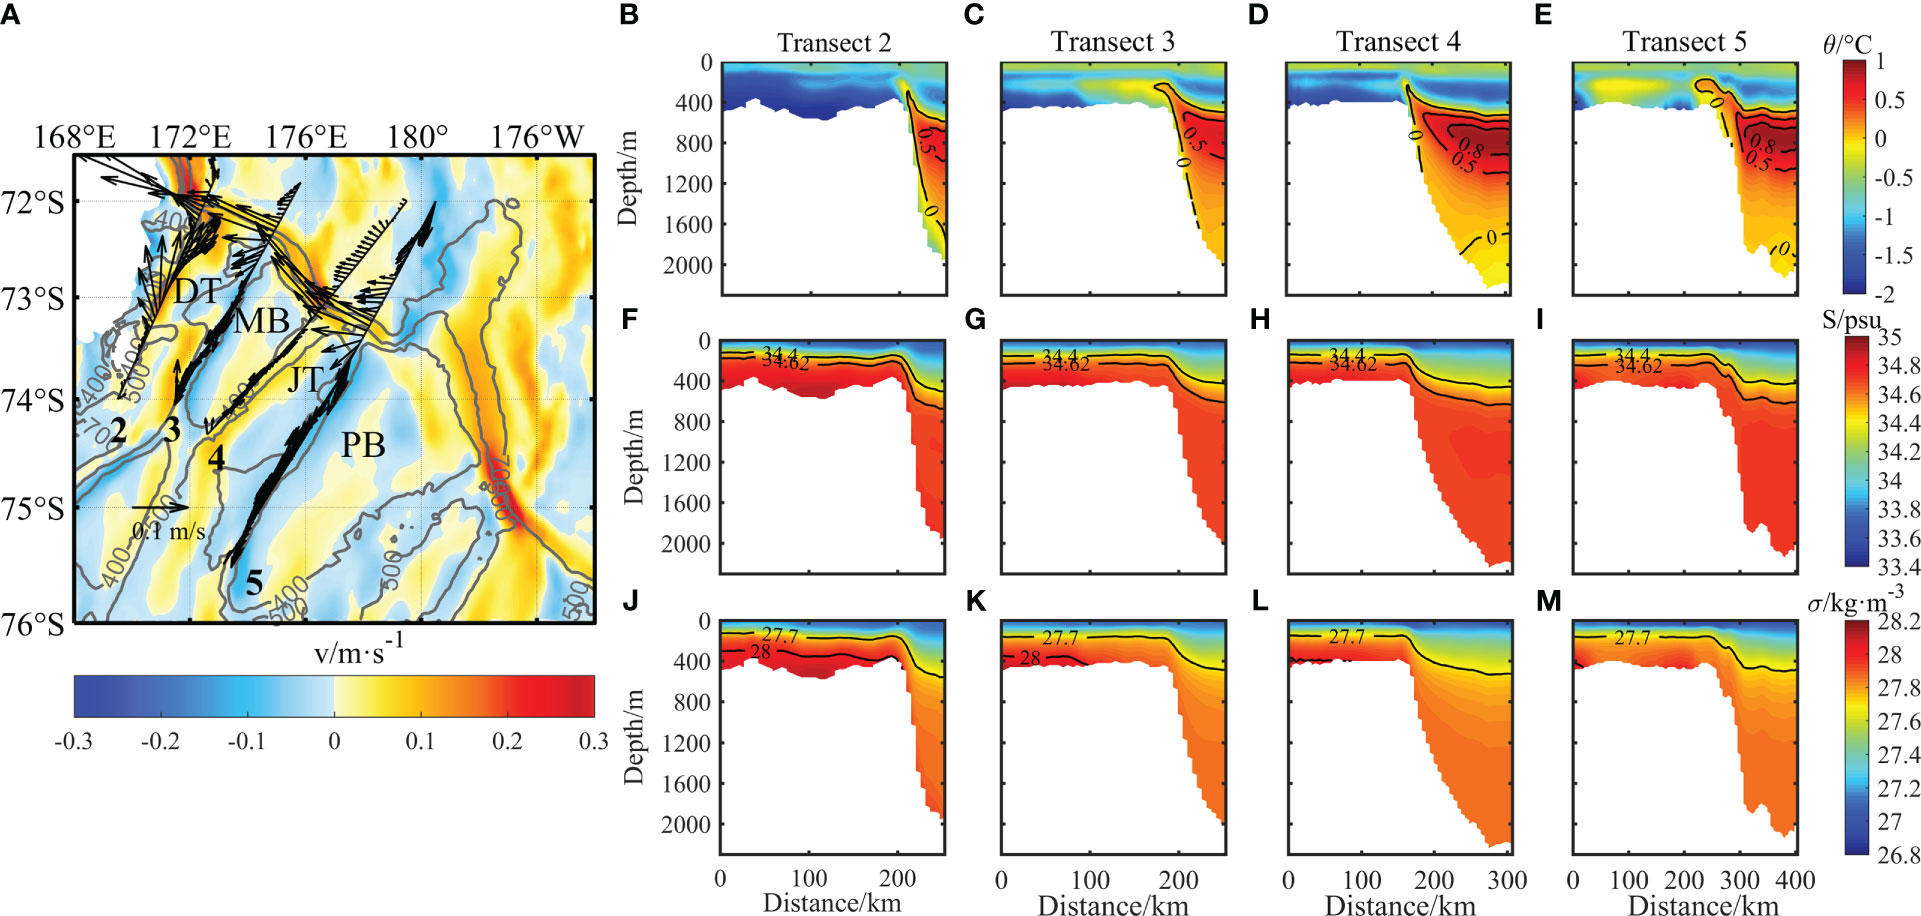
Figure 4 (A) Climatological February depth-transect averaged currents (vectors) along Transects 2–5 in Figure 1, south–north components (blue, southward; red, northward), and the isobaths (gray lines). (B–E) Potential temperature θ, (F–I) salinity S, and (J–M) potential density anomaly σ along Transects 2–5. The black lines indicate the isotherms, isohalines, or isopycnals.
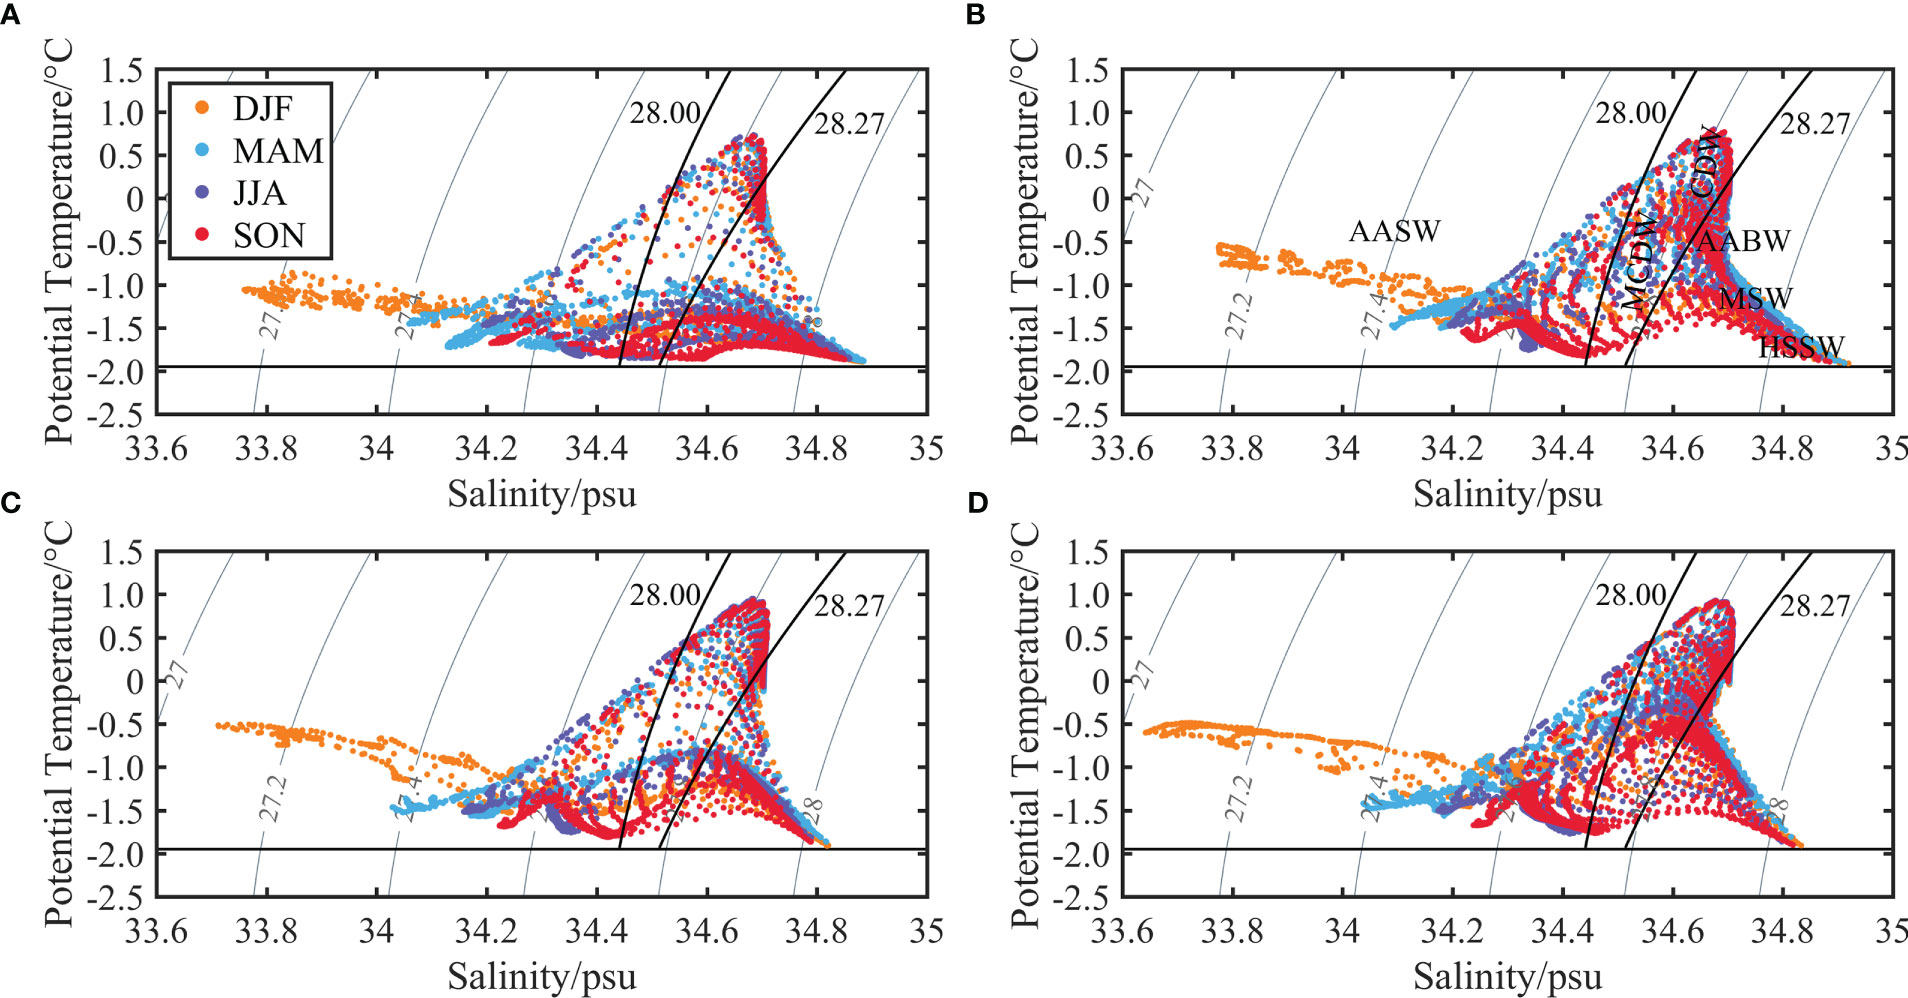
Figure 5 (A–D) Temperature–salinity diagrams on Transects 2, 3, 4, and 5 in Figure 1, respectively. Color codes represent four seasons; solid black lines are the 28.00 and 28.27 kg·m−3 neutral densities γn; the black horizontal line marks the upper θ limit of ISW (−1.95°C); the thin gray lines are the isopycnals.
The current vectors along all transects indicate a strong ASC on the slope. The on-shelf currents deviate from the ASC and turn southwestward along the eastern flanks of the Drygalski and Joides Troughs (Transects 3 and 5); the northward off-shelf currents reach and accelerate at the shelf break along the western flanks of the Drygalski and Joides Troughs (Transects 2 and 4) (Figure 4A). Warm saline CDW (θ > 0.5°C, S ~ 34.7 psu) occupies an intermediate layer between 600 and 1,000 m in the open ocean, part of CDW is upwelled above the bottom depth of a trough approximately 600 m near the slope, and parcels of CDW intrude southward in a depth range from 200 to 400 m on the shelf. In the Drygalski Trough, the coldest and saltiest HSSW fills the depressions. In the Joides Trough, a warmer intermediate layer is found, which results from more intense CDW intrusions.
Seasonal variations of water mass properties on Transects 2–5 are shown in Figure 5. The AASW is the lightest and freshest water mass and has a wide range of salinity from approximately 33.5 psu in January to 34.2 psu in August. On the contrary, the MSW and AABW lie in the bottom layer on the shelf. The shelf waters in the Drygalski Trough are saltier than those of the other troughs with the maximum salinity reaching 34.9 psu (Figure 5B). There is a lack of MCDW presence on Transects 2 and 4 (Figures 5A, C), implying that the outflow of the cold shelf waters dominates over the western flanks of the Drygalski and Joides Troughs (Figure 4).
The depth-transect averaged along-transect component of seasonal velocities within MCDW layers between 200 and 400 m in the Drygalski Trough (Transect 3) and the Joides Trough (Transect 5) is shown for the period between spring 1999 and winter 2014 (Figure 6). Among four seasons, the strongest MCDW seasonal on-shelf intrusions appear at approximately 86.7% and 66.7% in summer on Transects 3 and 5, respectively; the weakest seasonal intrusions appear at 60.0% in spring and approximately 53.3% in winter on Transects 3 and 5, respectively. The MCDW intruding velocities along Transect 5 are usually higher than those of Transect 3. The maximum velocity is near 0.09 m·s−1 in the summer period between December 2009 and February 2010 in the Joides Trough (Figure 6B).
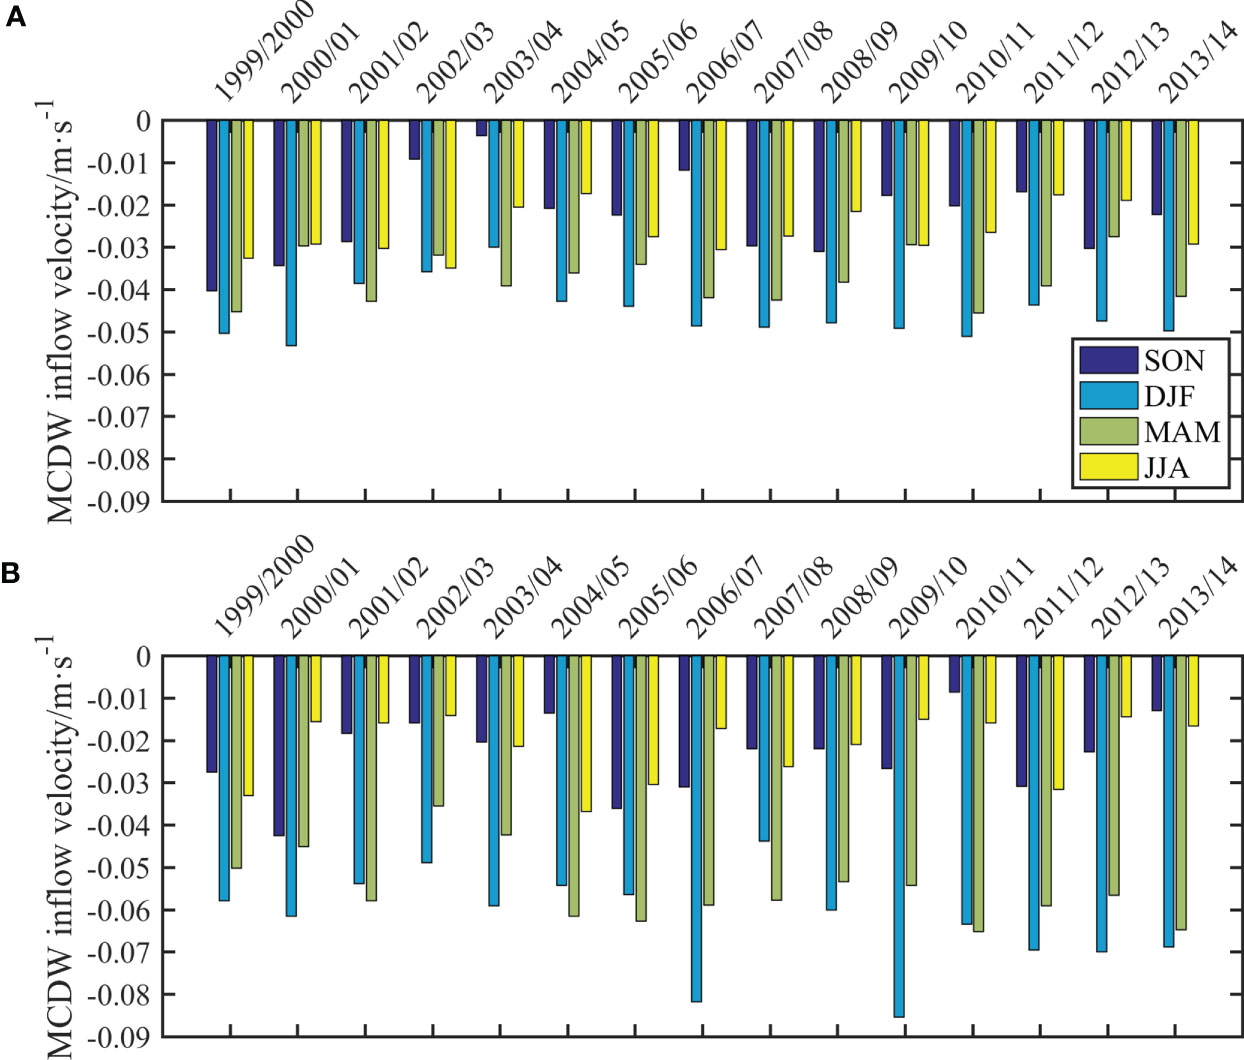
Figure 6 (A, B) The depth–transect averaged seasonal along-transect velocity component within the MCDW layer between 200 and 400 m along Transects 3 and 5, respectively. Negative values denote the on-shelf direction; the colors represent different seasons. MCDW, Modified Circumpolar Deep Water.
3.2 Ocean surface stress
The wind fields in the Ross Sea are featured by strong southerly winds in the western Ross Sea and weak westerly winds in the northeast (Figure 7). The Ross Sea is covered by sea ice for almost 9 months of the year in autumn, winter, and spring; is close to ice-free in summer; and reaches the lowest sea ice level in February each year. As a result of seasonal cooling, the sea ice quickly covers the Ross Sea in early autumn, continues to thicken and expand, and usually reaches the highest concentration in August and September when the sea ice area over the shelf is nearly 4.5 × 10⁵ km2. With the seasonal growth of ice concentration and strengthening wind between March and September, the deviations between ocean surface stress and wind stress increase (Figures 7C, D). It is more obvious in the western Ross Sea where the values of the ocean surface stress are usually less than half of the wind stress due to sea ice coverage. In winter and early spring, two kinds of stress have a strong northward component in the western Ross Sea, while the ice concentration is more than 80%, and the maximum wind and ocean surface stresses reach 1.6 and 1.2 dyne·cm−2, respectively.
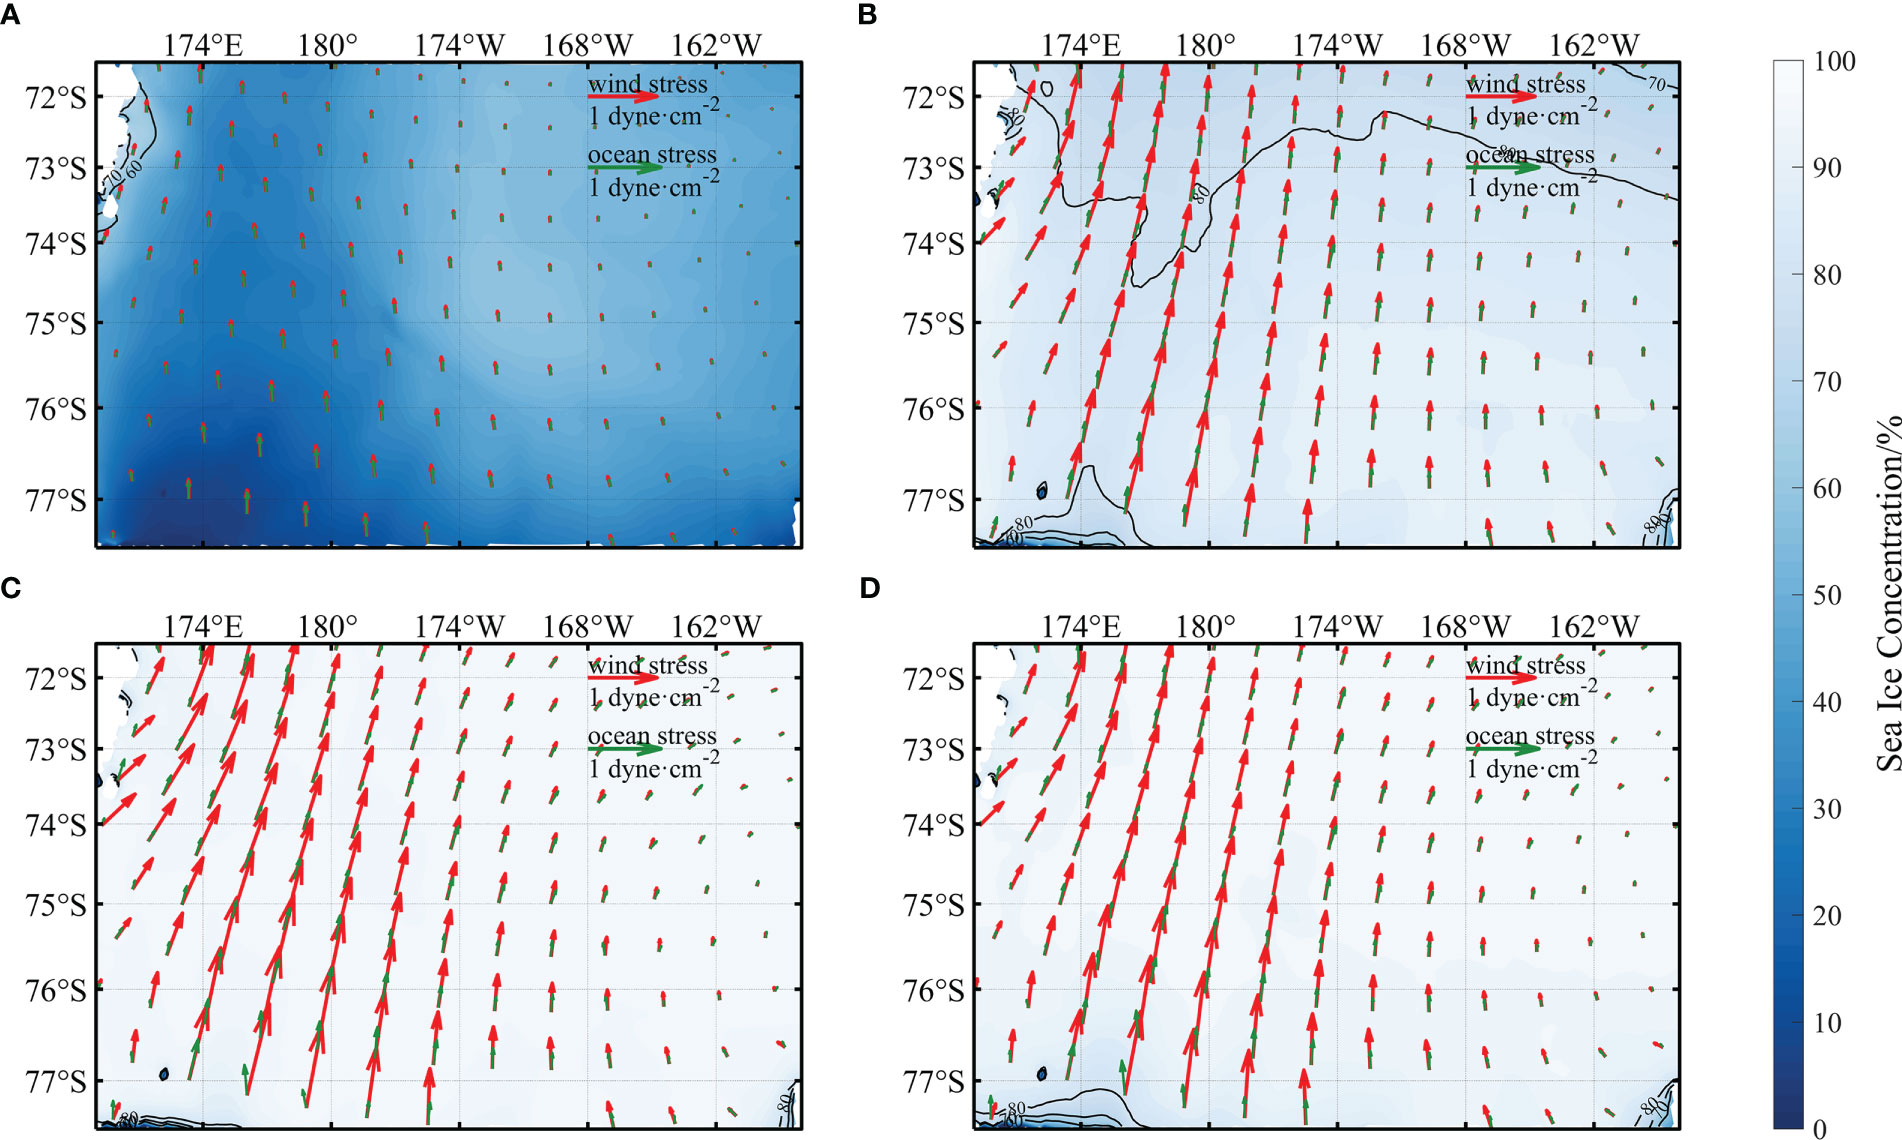
Figure 7 (A–D) Seasonal average wind stress (red vectors) and ocean surface stress (green vectors) fields and sea ice concentration (colors) in DJF, MAM, JJA, and SON, respectively. DJF, December–January–February; MAM, March–April–May; JJA, June–July–August; SON, September–October–November.
The spatial and seasonal distributions of the Ekman pumping are shown in Figure 8. On the Ross Sea shelf, a west–east gradient from prevailing downwelling to prevailing upwelling produced by the Ekman pumping can be found in all seasons. In summer, upwelling and downwelling areas can be divided clearly by 177°E (Figure 8A). The strong Ekman pumping is found near Terra Nova Bay in the western Ross Sea shelf.
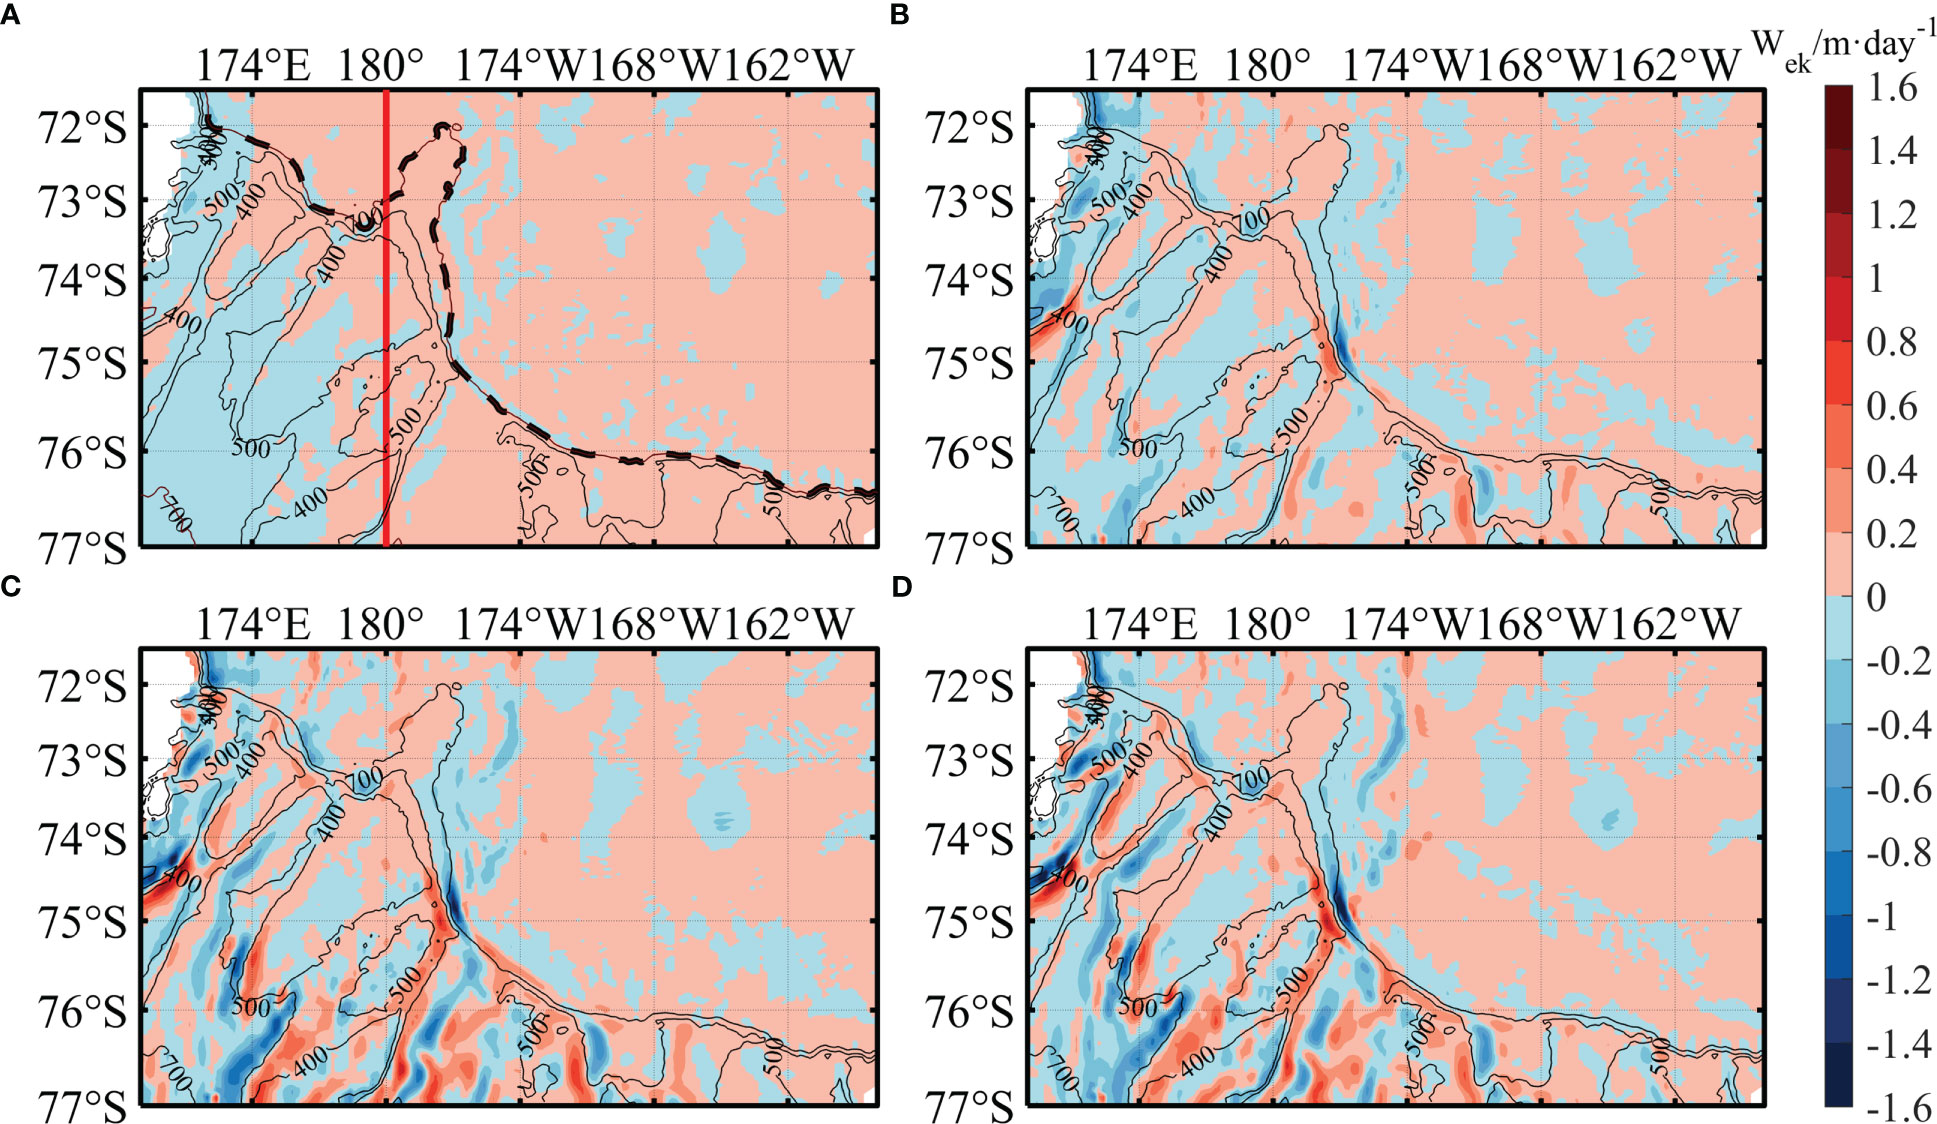
Figure 8 (A–D) Seasonal average Ekman pumping velocities Wek (positive: upward) in DJF, MAM, JJA, and SON, respectively. Thin gray lines represent isobaths, the black dash line is the 700-m isobath representing the shelf break, and the red solid line at the 180° longitude is arbitrarily chosen to divide the western and eastern parts of the Ross Sea predominated by downwelling and upwelling. DJF, December–January–February; MAM, March–April–May; JJA, June–July–August; SON, September–October–November.
The relationship between the ocean surface stress and water transport in the Ross Sea is investigated by calculating the meridional mean Ekman pumping velocity Wek using data in the off-shelf area deeper than 700 m between 71.5°S–77°S and 169°E–158°W. To understand the regional differences, the study area is divided by the 180° longitude into the western and eastern areas. To avoid potential influences from bottom topography and bottom friction, a depth of 700 m is chosen. Both the eastern shelf and off-shelf areas are predominated by positive Ekman pumping, which is in favor to produce a southward vorticity-induced transport, while the western shelf is predominated by negative Ekman pumping, which is in favor to produce a northward vorticity-induced transport (Figure 9). The circulation in the shallow shelf with complex topography is affected by viscosity, bottom friction, and density gradients induced by the growth and retreat of sea ice and winds (Assmann et al., 2003; Jendersie et al., 2018).
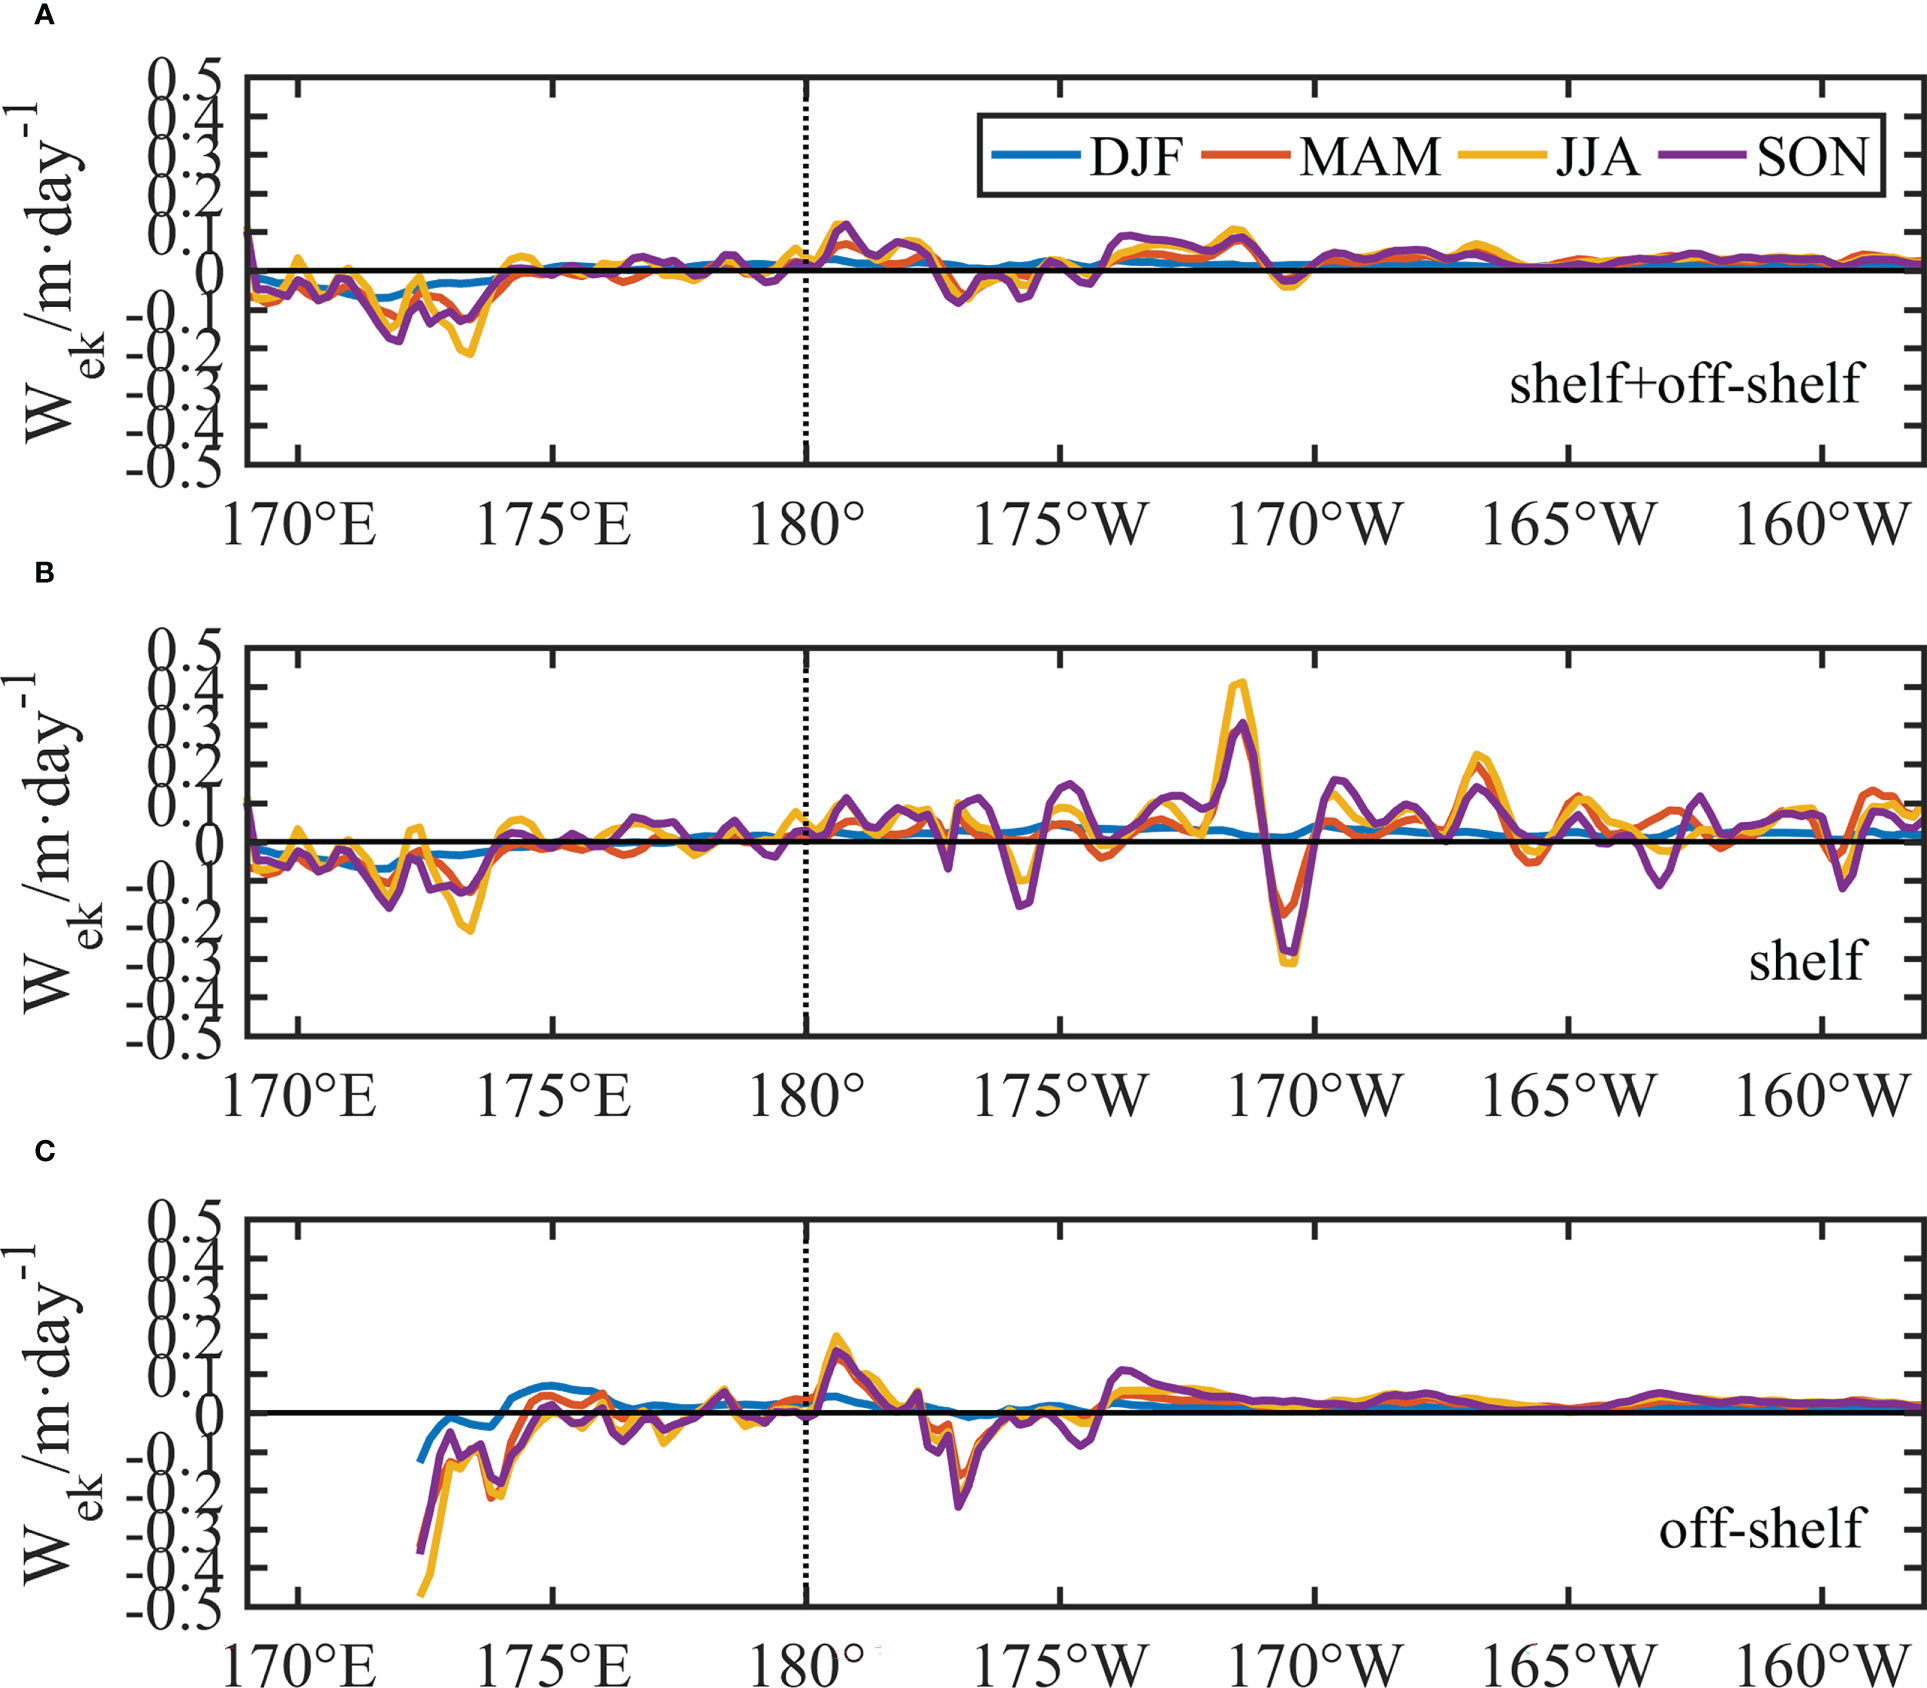
Figure 9 (A–C) Averaged seasonal Ekman pumping velocity Wek (positive: upward) in the entire area between 71.5°S–77°S in the latitude and 169°E–158°W in the longitude, the shelf area, and the off-shelf area, respectively. The shelf and off-shelf areas are divided by the 700-m isobath, and the black dash line represents the 180° longitude.
To further examine the temporal variations of CDW intrusions, the time series of depth-transect averaged along-transect component of seasonal velocity anomalies within the MCDW layer between 200 and 400 m on Transects 3 and 5 in the Drygalski and Joides Troughs, the time series of the on-shelf components of seasonal transport anomalies on the eastern flanks of the Drygalski and Joides Troughs marked as the shaded areas in Figure 3, and the time series of seasonal Sverdrup transport anomalies within the western off-shelf area are computed (Figure 10). Both the MCDW velocities and the on-shelf transports are negative in the Drygalski and Joides Troughs (Table 1 and Figure 6). The monthly, seasonal, and interannual correlations between the along-transect MCDW currents and transport vs. the Sverdrup transport in the off-shelf area are shown in Table 2. The monthly and seasonal correlations pass the significance test of p ≤ 0.01 with a correlation range from 0.19 to 0.76. The interannual correlations are negative in the Drygalski Trough between −0.67 and −0.76 and pass the significance tests (p ≤ 0.01), while interannual correlations in the Joides Trough are weak between −0.17 and −0.08 and fail to pass the significance test (p > 0.57).
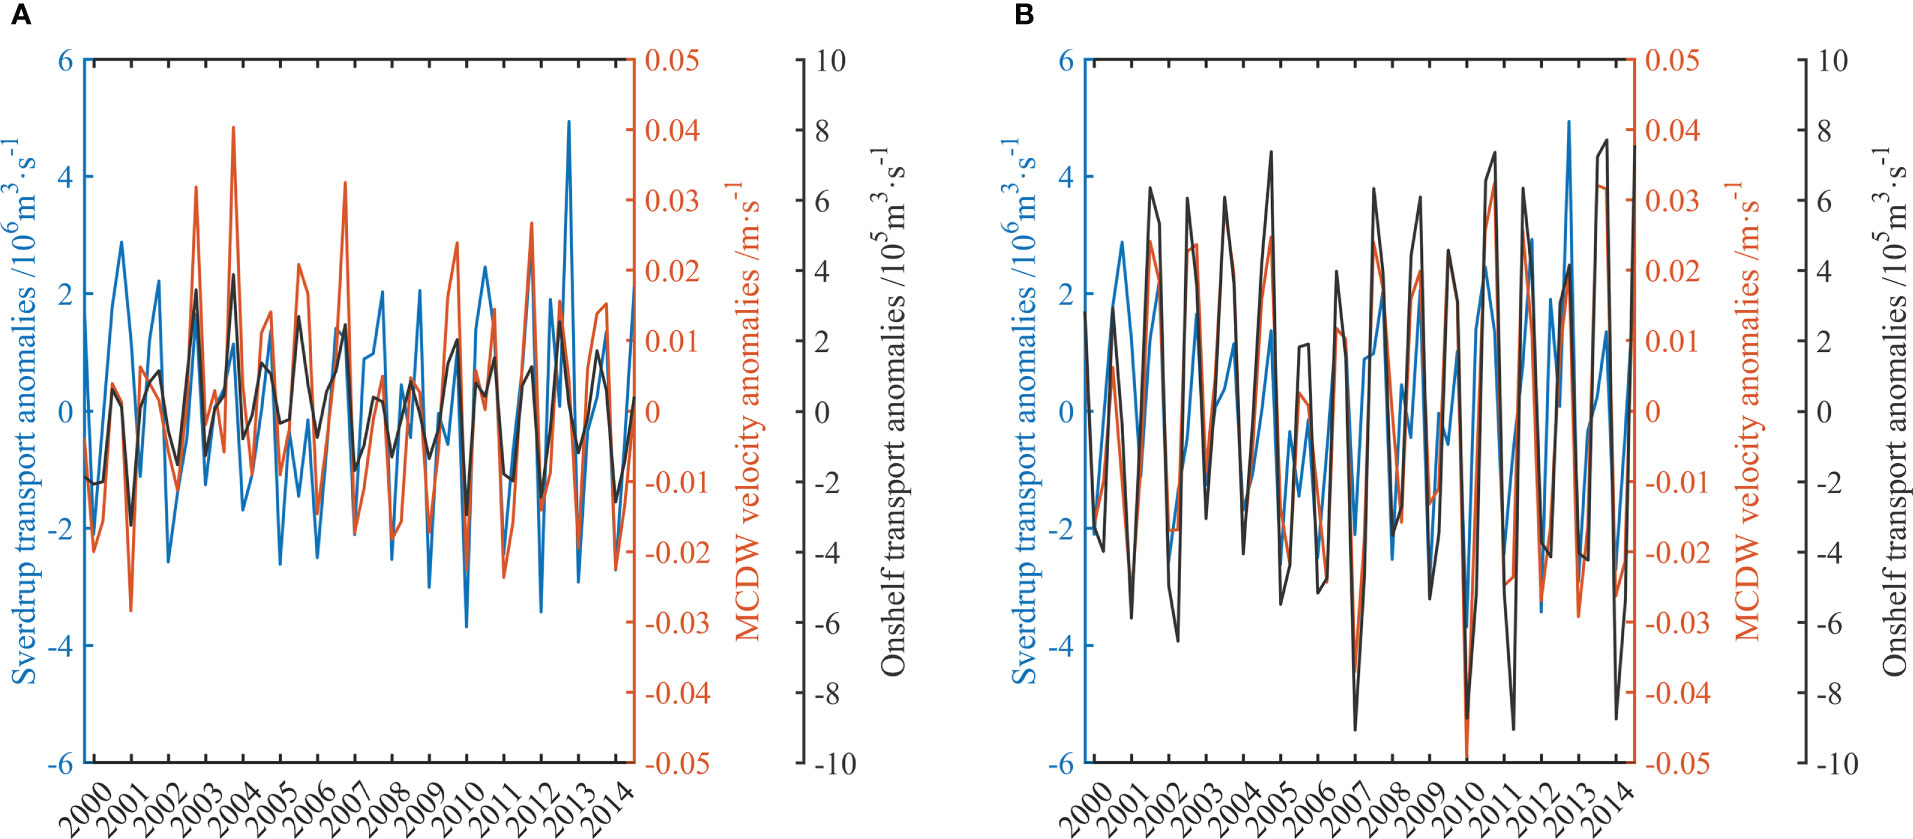
Figure 10 (A, B) Time series of depth-transect averaged along-transect component of seasonal velocity anomalies within the MCDW layer (red lines) between 200 and 400 m along Transects 3 and 5, respectively; on-shelf components of seasonal transport anomalies (black lines) on the eastern DT and JT; and seasonal Sverdrup transport (Vsv) anomalies (blue lines) within the western off-shelf area. The negative values represent on-shelf or southward. The correlation coefficients and p-values between these three time series are shown in Table 2. MCDW, Modified Circumpolar Deep Water.
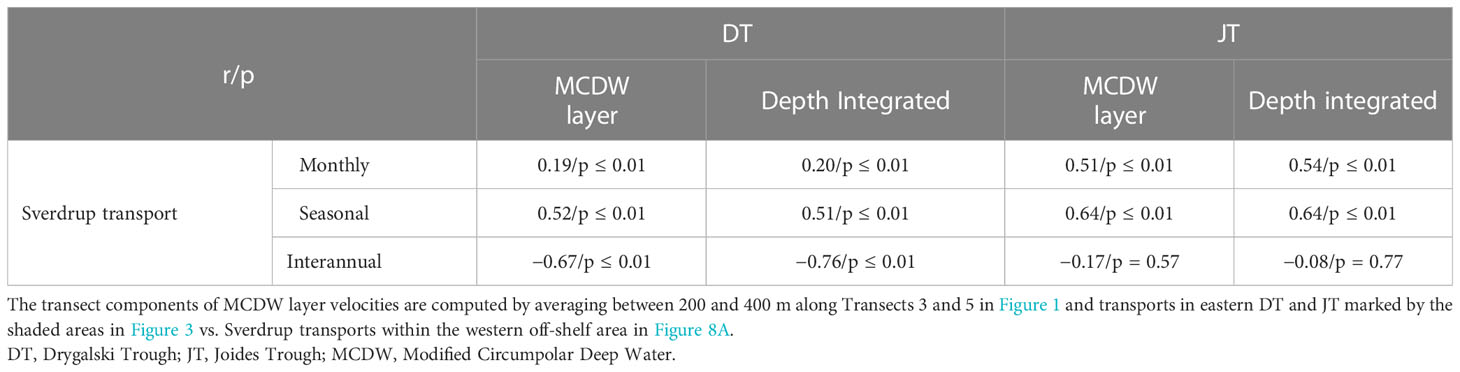
Table 2 Monthly, seasonal, and interannual regression analyses between along transect components of MCDW layer velocity anomalies and transport anomalies in DT and JT vs. Sverdrup transport anomalies.
4 Discussions
4.1 Effects of winds on the hydrographic fields and circulations on the shelf
Generally, the southerly winds dominate all seasons in the Ross Sea (Figure 7). The strong winds are more eminent over the western Ross Sea, especially over the Ross Bank and north of the Mawson Bank west of the Glomar Challenger Trough where the seasonal mean wind speed peaks range from 10 to 12 m·s−1. In addition, katabatic wind from the highland and synoptic wind events result in strong surface winds over the Ross Sea that can reach 10–25 m·s−1, although the eastern Ross Sea is less directly affected by katabatic winds (Parish and Cassano, 2003).
In austral summer, when sea ice extensively retreats, the ocean surface stress is mainly exerted by the wind, and hence the wind and ocean surface stresses are similar; the downward and upward Ekman pumping velocities are consistently found in the western and eastern parts of the Ross Sea, respectively. In other seasons with high ice coverages, sea ice alters the stress acting on the ocean, and hence, the ocean surface stress significantly deviates from the wind stress; the presence of sea ice introduces significant spatial variability to the ocean surface stress, but the general pattern of downwelling in the west and upwelling in the east persists (Figures 7, 8). The magnitudes of Ekman pumping velocities are even higher in autumn, winter, and spring due to stronger winds than that in summer.
The Ekman pumping to produce heat and vorticity fluxes and ice coverage to isolate heat flux and momentum can affect lateral thermohaline gradients and subsequent baroclinic pressure gradients, which drive the seasonal modulation of the deep circulations (Assmann et al., 2003). Considering a three-layer circulation pattern consisting of the surface mixed layer, middle MCDW layer, and bottom shelf waters layer on the Ross Sea shelf, the Ekman pumping and thermohaline gradients have significant effects on the circulations of the MCDW layer.
4.2 Uplift and southward intrusions of CDW at the shelf break
In previous studies, the mechanisms for CDW intrusions have been proposed as the compensation transport to surface Ekman transport and topographic Rossby adjustment of geostrophic currents at the curvatures of shelf breaks or deep troughs (Dinniman et al., 2007; Dinniman et al., 2011). Both observations and modeling results indicate that surface Ekman and compensation transports occur within the upper 100–200 m, which will not support a deep CDW transport (Schudlich and Price, 1998; Elipot and Gille, 2009). There is a need for mechanisms first driving CDW southward to the slope region, uplifting CDW up to the shelf depth, and then driving CDW southward into the Ross Sea continental shelf. The on-shelf transport of CDW for maintaining the ASF and ASC has been proposed as the result of the deep Sverdrup transport driven by cyclonic wind field in the Southern Ocean (Thompson et al., 2018). The pooling of warm CDW at the slope region shown in Figure 4 is presumably caused by the southward Sverdrup transport, which is further shown by the estimated results of the Ekman pumping in the off-shelf area of the Ross Sea in Figures 8, 9.
The main body of CDW at the slope region is approximately 600–1,000 m. Intruding into the shelf region between 200 and 400 m, a significant lift of CDW must be achieved. A theory has been proposed and studied by synoptic wind events and their duration (Zhou et al., 2013; Dotto et al., 2019). For example, a 15 m·s−1 cyclonic wind would take 2.5 days to raise a water parcel from a depth of 500 to 400 m. Because cyclones occur frequently with different strengths and durations, intrusions on the shelf region are a series of pulse events that are illustrated in Figure 4. Previous studies suggested that wind can change the stability, strength, and location of an ASF and hence affect the cross-shelf exchanges and thermobaricity (Budillon et al., 2011; Rintoul, 2018). The Ekman transport convergence can affect cross-shelf CDW transport by uplifting the undercurrent enhancing intrusions in deep troughs, enhancing sea surface gradients directly to drive cross-shelf CDW transport, and strengthening or weakening the transport barriers created by the ASF. Among other mechanisms, an increase in wind stress can enhance the cross-shelf density gradient by deepening the ASF so that shelf water overflow will increase and hence CDW inflow will increase due to the sea surface lowering (Kida, 2011; Morrison et al., 2020). The ASF is a transport barrier between CDW and shelf waters. The strength and stability of an ASF are strongly affected by wind-induced mixing and convergence, which in turn affect cross-slope transport (Kida, 2011). Meridional variations of ASF positions are also important, which are related to tidal excursions, Kelvin waves, and the Ekman transport (Padman et al., 2009; Budillon et al., 2011; Rintoul, 2018; Thompson et al., 2018).
The consistencies and correlations between the CDW intrusions in the Drygalski and Joides Troughs and the Sverdrup transport in the off-shelf area are clearly shown in Figure 10. The mechanism proposed by this study is as follows: in the off-shelf area, the negative wind stress torque leads the upward Ekman pumping and consequentially drives a deep southward Sverdrup transport, which not only maintains the ASF gradient but also provides the warm CDW water mass for intruding into the shelf. The monthly correlations between CDW intrusions and the southward Sverdrup transport in the off-shelf area are quite low approximately 0.19 and 0.20 for MCDW inflow velocities and on-shelf transports in the Drygalski Trough, respectively, while the correlations are high approximately 0.51 and 0.54 for MCDW inflow velocities and on-shelf transports in the Joides Trough, respectively. It can be speculated that the Drygalski Trough is close to the coast and that its currents are affected by local coastal winds and baroclinic pressure gradients. At the seasonal scale, the correlations between CDW intrusions and the southward Sverdrup transport in the off-shelf area are significantly increased up to more than 0.5 in both the Drygalski and Joides Troughs. However, at the interannual scale, the correlations between depth-transect averaged velocities and on-shelf transports vs. the Sverdrup transport in the off-shelf area become negative in the Drygalski Trough and not significant in the Joides Trough.
There are many potential intrusion mechanisms for further studies such as interactions between eddies and jets, effects of extreme wind events, time-dependent wind stress forcing, and time-dependent Sverdrup dynamics including Rossby waves (Parish and Cassano, 2003; Chen et al., 2022). The time-dependent relationships between the meridional transport, regional sum of wind stress torque, and layer thickness are revealed at monthly and seasonal scales, which provide a detailed framework of Sverdrup dynamics. Though details of time-dependent Sverdrup dynamics in the open ocean are lost due to using multi-year averaged seasonal and interannual variations and regional averages in the analysis of this paper, the results support the hypothesis on the Ekman pumping in the open ocean and CDW intrusions into the Ross Sea shelf region mediated through the meridional transport. Hence, wind-driven Sverdrup transport can influence the transport of CDW across the shelf both directly by altering the poleward flow of CDW and, indirectly, by altering the ASF and ASC that regulate the cross-shelf transport of CDW through eddies, topographic steering, and friction (Rintoul, 2018; Thompson et al., 2018).
4.3 Northward transport of surface and deep shelf waters
The northward outflows of waters on the western Ross Sea shelf may be driven by multiple processes such as southerly winds in the upper layer and density gradients at depth resulting from forming denser deep shelf waters. The net downwelling in the western shelf and net upwelling in the eastern shelf are consistent with basin-scale circulation patterns revealed in previous studies (Figure 8) (Padman et al., 2009; Stewart and Thompson, 2015).
The Ross Ice Shelf polynya and the Terra Nova Bay polynya in the western shelf have been considered to produce HSSW and deep northward outflows (Budillon et al., 2006; Bowen et al., 2021). A narrow western boundary current consisting mostly of the MCDW, MSW, and HSSW is found along the Drygalski Basin and the Drygalski Trough (Figures 2, 3, 4). The outflow exports via Cape Adare; mooring observations in the Drygalski Trough near the shelf break have revealed the dense plumes (Budillon et al., 2003; Budillon et al., 2006; Gordon et al., 2009). The seasonal variations of HSSW outflow within the Drygalski Trough match the results that were revealed by moorings adjacent to Cape Adare and the northern end of the Drygalski Trough, which have suggested an approximately 8-month period for the northward transit of dense water from the Terra Nova Bay polynya to the slope through the time series of salinity (Bowen et al., 2021). The warm CDW inflow may affect the HSSW outflow. For example, as the CDW intrusion increases, the HSSW may be diluted in troughs (Gordon et al., 2015).
In addition, the northward deep currents in the western area counterbalance the southward CDW intrusions driven by the Ekman pumping upwelling in the eastern Ross Sea shelf and the open ocean. The pattern of CDW intrusions in the eastern Ross Sea and outflows of HSSW in the western Ross Sea is very robust driven by overall wind fields.
5 Conclusions
The Ross Sea circulation is featured by intense cross-shelf water mass exchanges between warm CDW and cold shelf waters. The heat fluxes contribute to ice shelf melting, AABW formation, and then the global thermohaline circulation. The results from analyzing monthly, seasonal, and interannual on-shelf intrusions of CDW indicate that the intrusions mostly occur along the eastern flanks of deep troughs, while there are also outflows occurring along the western flanks of deep troughs. The on-shelf intrusions are stronger in austral summer and weaker in austral winter. The results from this study by analyzing stress torque indicate that the causes for the seasonal changes of CDW intrusions into the shelf are strongly associated with the Sverdrup transport produced by ocean surface stress torque in the off-shelf area and necessary uplift of CDW over the shelf depth.
Data availability statement
The original contributions presented in the study are included in the article/supplementary material. Further inquiries can be directed to the corresponding author.
Author contributions
YW and MZ designed the original ideas. YW analyzed the data and wrote the manuscript. MZ and ZZ contributed with discussion and conclusions. MD provided the model data. All authors contributed to the article and approved the submitted version.
Funding
This research was supported by the National Natural Science Foundation of China under contract No. 41941008, the Impact and Response of Antarctic Seas to Climate Change (Grant 583) under contract No. IRASCC 1-02-01B, the Shanghai Key Laboratory of Polar Life and Environment Sciences under contract No. 21DZ2260100, and the Shanghai Frontiers Science Center of Polar Science.
Conflict of interest
The authors declare that the research was conducted in the absence of any commercial or financial relationships that could be construed as a potential conflict of interest.
Publisher’s note
All claims expressed in this article are solely those of the authors and do not necessarily represent those of their affiliated organizations, or those of the publisher, the editors and the reviewers. Any product that may be evaluated in this article, or claim that may be made by its manufacturer, is not guaranteed or endorsed by the publisher.
References
Amante C., Eakins B. W. (2009). “ETOPO1 1 arc-minute global relief model: Procedures, data sources and analysis,” in NOAA Technical memorandum NESDIS NGDC-24 (Boulder, Colorado: National Geophysical Data Center, Marine Geology and Geophysics Division). doi: 10.1594/PANGAEA.769615
Anderson J. B., Conway H., Bart P. J., Witus A. E., Greenwood S. L., McKay R. M., et al. (2014). Ross Sea Paleo-ice sheet drainage and deglacial history during and since the LGM. Quat. Sci. Rev. 100, 31–54. doi: 10.1016/j.quascirev.2013.08.020
Arndt J. E., Schenke H. W., Jakobsson M., Nitsche F. O., Buys G., Goleby B., et al. (2013). The international bathymetric chart of the Southern Ocean (IBCSO) version 1.0–a new bathymetric compilation covering circum-Antarctic waters. Geophys. Res. Lett. 40, 3111–3117. doi: 10.1002/grl.50413
Assmann K., Hellmer H. H., Beckmann A. (2003). Seasonal variation in circulation and water mass distribution on the Ross Sea continental shelf. Antarctic Sci. 15 (1), 3–11. doi: 10.1017/S0954102003001007
Bowen M. M., Fernandez D., Forcen-Vazquez A., Gordon A. L., Huber B., Castagno P., et al. (2021). The role of tides in bottom water export from the western Ross Sea. Sci. Rep. 11, 2246. doi: 10.1038/s41598-021-81793-5
Bromwich D. H., Monaghan A. J., Manning K. W., Powers J. G. (2005). Real-time forecasting for the Antarctic: An evaluation of the Antarctic mesoscale prediction system (AMPS). Monthly Weather Rev. 133, 579–603. doi: 10.1175/MWR-2881.1
Budgell P. (2005). Numerical simulation of ice-ocean variability in the Barents Sea region: Towards dynamical down-scaling. Ocean Dyn. 55, 370–387. doi: 10.1007/s10236-005-0008-3
Budillon G., Castagno P., Aliani S., Spezie G., Padman L. (2011). Thermohaline variability and Antarctic Bottom Water formation at the Ross Sea shelf break. Deep-Sea Res. I 58 (10), 1002–1018. doi: 10.1016/j.dsr.2011.07.002
Budillon G., Pacciaroni M., Cozzi S., Rivaro P., Catalano G., Ianni C., et al. (2003). An optimum multiparameter mixing analysis of the shelf waters in the Ross Sea. Antarctic Sci. 15 (1), 105–118. doi: 10.1017/S095410200300110X
Budillon G., Salusti E., Tucci S. (2006). The evolution of density currents and nepheloid bottom layers in the Ross Sea (Antarctica). J. Mar. Res. 64 (4), 517–540. doi: 10.1357/002224006778715739
Castagno P., Falco P., Dinniman M. S., Spezie G., Budillon G. (2017). Temporal variability of the Circumpolar Deep Water inflow onto the Ross Sea continental shelf. J. Mar. Syst. 166, 37–49. doi: 10.1016/j.jmarsys.2016.05.006
Chen G., Huang R. X., Peng Q., Chu X. (2022). A time-dependent Sverdrup relation and its application to the Indian Ocean. J. Phys. Oceanogr. 52 (6), 1233–1244. doi: 10.1175/JPO-D-21-0223.1
Dawe J. T., Thompson L. (2006). Effect of ocean surface currents on wind stress, heat flux, and wind power input to the ocean. Geophys Res Lett. 33 (9), L09604. doi: 10.1029/2006GL025784
Dong H., Zhou M., Raj R. P., Smith W. O. Jr., Basedow S. L., Ji R., et al (2022). urface chlorophyll anomalies induced by mesoscale eddy-wind interactions in the northern Norwegian Sea. Front. Mar. Sci. 9, 1002632. doi: 10.3389/fmars.2022.1002632
Dee D. P., Uppala S. M., Simmons A. J., Berrisford P., Poli P., Kobayashi S., et al. (2011). The ERA-Interim reanalysis: configuration and performance of the data assimilation system. Q. J. R. Meteorol. Soc. 137 (656), 553–597. doi: 10.1002/qj.828
Dinniman M. S., Klinck J. M., Hofmann E. E., Smith W. O. Jr. (2018). Effects of projected changes in wind, atmospheric temperature, and freshwater inflow on the Ross Sea. J. Climate 31 (4), 1619–1635. doi: 10.1175/JCLI-D-17-0351.1
Dinniman M. S., Klinck J. M., Smith W. O. Jr. (2007). Influence of sea ice cover and icebergs on circulation and water mass formation in a numerical circulation model of the Ross Sea, Antarctica. J. Geophys. Res. 112, C11013. doi: 10.1029/2006JC004036
Dinniman M. S., Klinck J. M., Smith W. O. Jr. (2011). A model study of Circumpolar Deep Water on the West Antarctic Peninsula and Ross Sea continental shelves. Deep-Sea Res. II 58, 1508–1523. doi: 10.1016/j.dsr2.2010.11.013
Dotto T. S., Garabato A. C. N., Bacon S., Holland P. R., Kimura S., Firing Y. L., et al. (2019). Wind-driven processes controlling oceanic heat delivery to the Amundsen Sea, Antarctica. J. Phys. Oceanogr. 49, 2829–2849. doi: 10.1175/JPO-D-19-0064.1
Elipot S., Gille S. T. (2009). Ekman layers in the Southern Ocean: spectral models and observations, vertical viscosity and boundary layer depth. Ocean Sci. Discuss. 6, 277–341. doi: 10.5194/osd-6-277-2009
Enriquez A. G., Friehe C. A. (1995). Effects of wind stress and wind stress curl variability on coastal upwelling. J. Phys. Oceanogr. 25 (7), 1651–1671. doi: 10.1175/1520-0485(1995)025<1651:EOWSAW>2.0.CO;2
Fretwell P., Pritchard H. D., Vaughan D. G., Bamber J. L., Barrand N. E., Bell R., et al. (2013). Bedmap2: Improved ice bed, surface and thickness datasets for Antarctica. Cryosphere 7, 375–393. doi: 10.5194/tc-7-375-2013
Gordon A. L., Huber B. A., Busecke J. (2015). Bottom water export from the western Ross Sea, 2007 through 2010. Geophys. Res. Lett. 42, 5387–5394. doi: 10.1002/2015GL064457
Gordon A. L., Orsi A. H., Muench R., Huber B. A., Zambianchi E., Visbeck M. (2009). Western Ross Sea continental slope gravity currents. Deep-Sea Res. II 56 (13–14), 796–817. doi: 10.1016/j.dsr2.2008.10.037
Hillenbrand C.-D., Smith J. A., Hodell D. A., Greaves M., Poole C. R., Kender S., et al. (2017). West Antarctic Ice Sheet retreat driven by Holocene warm water incursions. Nature 547, 43–48. doi: 10.1038/nature22995
Holland D. M., Jenkins A. (1999). Modeling thermodynamic ice–ocean interactions at the base of an ice shelf. J. Phys. Oceanogr. 29, 1787–1800. doi: 10.1175/1520-0485(1999)029<1787:MTIOIA>2.0.CO;2
Jackett D., McDougall T. (1997). A neutral density variable for the world’s oceans. J. Phys. Oceanogr. 27 (2), 237–263. doi: 10.1175/1520-0485(1997)027<0237:ANDVFT>2.0.CO;2
Jendersie S., Williams M., Langhorne P. J., Robertson R. (2018). The density-driven winter intensification of the Ross Sea circulation. J. Geophys. Res.: Oceans 123, 7702–7724. doi: 10.1029/2018JC013965
Kida S. (2011). The impact of open oceanic processes on the Antarctic Bottom Water outflows. J. Phys. Oceanogr. 41, 1941–1957. doi: 10.1175/2011JPO4571.1
Klinck J. M., Dinniman M. S. (2010). Exchange across the shelf break at high southern latitudes. Ocean Sci. 6 (2), 513–524. doi: 10.5194/os-6-513-2010
Large W. G., Pond S. (1981). Open ocean momentum flux measurements in moderate to strong winds. J. Phys. Oceanogr. 11 (3), 324–336. doi: 10.1175/1520-0485(1981)011<0324:OOMFMI>2.0.CO;2
Lu P., Li Z., Cheng B., Leppäranta M. (2011). A parameterization of the ice-ocean drag coefficient. J. Geophys. Res.: Oceans 116, C07019. doi: 10.1029/2010JC006878
Lu P., Li Z., Han H. (2016). Introduction of parameterized sea ice drag coefficients into ice free-drift modeling. Acta Oceanol. Sin. 35 (1), 53–59. doi: 10.1007/s13131-016-0796-y
Lüpkes C., Birnbaum G. (2005). Surface drag in the Arctic marginal sea-ice zone: A comparison of different parameterisation concepts. Boundary-Layer Meteorol. 117 (2), 179–211. doi: 10.1007/s10546-005-1445-8
Morrison A. K., Hogg A. M., England M. H., Spence P. (2020). Warm Circumpolar Deep Water transport toward Antarctica driven by local dense water export in canyons. Sci. Adv. 6 (18), eaav2516. doi: 10.1126/sciadv.aav2516
Nakayama Y., Menemenlis D., Zhang H., Schodlok M., Rignot E. (2018). Origin of Circumpolar Deep Water intruding onto the Amundsen and Bellingshausen Sea continental shelves. Nat. Commun. 9 (1), 3403. doi: 10.1038/s41467-018-05813-1
Orsi A. H., Johnson G. C., Bullister J. L. (1999). Circulation, mixing, and production of Antarctic Bottom Water. Prog. Oceanogr. 43 (1), 55–109. doi: 10.1016/S0079-6611(99)00004-X
Orsi A. H., Whitworth T. III, Nowlin W. D. Jr. (1995). On the meridional extent and fronts of the Antarctic Circumpolar Current. Deep-Sea Res. I 42 (5), 641–673. doi: 10.1016/0967-0637(95)00021-W
Orsi A. H., Wiederwohl C. L. (2009). A recount of Ross Sea waters. Deep-Sea Res. II 56, 778–795. doi: 10.1016/j.dsr2.2008.10.033
Padman L., Howard S. L., Orsi A. H., Muench R. D. (2009). Tides of the northwestern Ross Sea and their impact on dense outflows of Antarctic Bottom Water. Deep-Sea Res. II 56, 818–834. doi: 10.1016/j.dsr2.2008.10.026
Palóczy A., McClean J. L., Gille S. T., Wang H. (2020). The Large-scale vorticity balance of the Antarctic continental margin in a fine-resolution global simulation. J. Phys. Oceanogr. 50 (8), 2173–2188. doi: 10.1175/JPO-D-19-0307.1
Parish T. R., Cassano J. J. (2003). The role of katabatic winds on the Antarctic surface wind regime. Monthly Weather Rev. 131 (2), 317–333. doi: 10.1175/1520-0493(2003)131<0317:TROKWO>2.0.CO;2
Powers J. G., Monaghan A. J., Cayette A. M., Bromwich D. H., Kuo Y. H., Manning K. M. (2003). Real-time mesoscale modeling over Antarctica: The Antarctic mesoscale prediction system (AMPS). Bull. Am. Meteorol. Soc. 84, 1533–1546. doi: 10.1175/BAMS-84-11-1533
Rintoul S. R. (2018). The global influence of localized dynamics in the Southern Ocean. Nature 558, 209–218. doi: 10.1038/s41586-018-0182-3
Rodriguez A. R., Mazloff M. R., Gille S. T. (2016). An oceanic heat transport pathway to the Amundsen Sea Embayment. J. Geophys. Res.: Oceans 121, 3337–3349. doi: 10.1002/2015JC011402
Rossow W. B., Walker A. W., Beuschel D. E., Roiter M. D. (1996). International satellite cloud climatology project (ISCCP) documentation of new cloud datasets. WMO/TD-737 (World Meteorological Organization), 115 pp. https://isccp.giss.nasa.gov/pub/documents/d-doc.pdf.
Schudlich R. R., Price J. F. (1998). Observations of seasonal variation in the Ekman layer. J. Phys. Oceanogr. 28 (6), 1187–1204. doi: 10.1175/1520-0485(1998)028<1187:OOSVIT>2.0.CO;2
Shchepetkin A. F., McWilliams J. C. (2009). Correction and commentary for “Ocean forecasting in terrain-following coordinates: Formulation and skill assessment of the regional ocean modeling system” by haidvogel et al., j. comp. phys. 227, pp. 3595–3634. J. Comput. Phys. 228 (24), 8985–9000. doi: 10.1016/j.jcp.2009.09.002
Smith W. O. Jr., Sedwick P. N., Arrigo K. R., Ainley D. G., Orsi A. H. (2012). The Ross Sea in a sea of change. Oceanography 25 (3), 90–103. doi: 10.5670/oceanog.2012.80
Stewart A. L., Thompson A. F. (2015). Eddy-mediated transport of warm Circumpolar Deep Water across the Antarctic shelf break. Geophys. Res. Lett. 42 (2), 432–440. doi: 10.1002/2014GL062281
Thoma M., Jenkins A., Holland D., Jacobs S. (2008). Modelling Circumpolar Deep Water intrusions on the Amundsen Sea continental shelf, Antarctica. Geophys. Res. Lett. 35, L18602. doi: 10.1029/2008GL034939
Thompson A. F., Stewart A. L., Spence P., Heywood K. J. (2018). The Antarctic Slope Current in a changing climate. Rev. Geophys. 56, 741–770. doi: 10.1029/2018RG000624
Timmermann R., Danilov S., Schröter J., Böning C., Sidorenko D., Rollenhagen K. (2009). Ocean circulation and sea ice distribution in a finite element global sea ice–ocean model. Ocean Model. 27, 114–129. doi: 10.1016/j.ocemod.2008.10.009
Wåhlin A. K., Muench R. D., Arneborg L., Björk G., Ha H. K., Lee S. H., et al. (2012). Some implications of Ekman layer dynamics for cross-shelf exchange in the Amundsen Sea. J. Phys. Oceanogr. 42 (9), 1461–1474. doi: 10.1175/JPO-D-11-041.1
Wang Q., Danilov S., Hellmer H., Sidorenko D., Schröter J., Jung T. (2013). Enhanced cross-shelf exchange by tides in the western Ross Sea. Geophys. Res. Lett. 40, 5735–5739. doi: 10.1002/2013GL058207
Worthington L. V. (1981). “The water masses of the world ocean: some results from a fine-scale census,” in Evolution of physical oceanography. Eds. Warren B. A., Wunsch C. (Cambridge: MIT Press), 44–69.
Yang J. (2006). The seasonal variability of the Arctic Ocean Ekman transport and its role in the mixed layer heat and salt fluxes. J. Climate 19 (20), 5366–5387. doi: 10.1175/JCLI3892.1
Zhang Z., Hofmann E. E., Dinniman M. S., Reiss C., Smith W. O. Jr., Zhou M. (2020). Linkage of the physical environments in the northern Antarctic Peninsula region to the Southern Annular Mode and the implications for the phytoplankton production. Prog. Oceanogr. 188, 102416. doi: 10.1016/j.pocean.2020.102416
Keywords: Ross Sea, Circumpolar Deep Water, wind stress, Ekman pumping, Sverdrup transport
Citation: Wang Y, Zhou M, Zhang Z and Dinniman MS (2023) Seasonal variations in Circumpolar Deep Water intrusions into the Ross Sea continental shelf. Front. Mar. Sci. 10:1020791. doi: 10.3389/fmars.2023.1020791
Received: 16 August 2022; Accepted: 22 February 2023;
Published: 10 March 2023.
Edited by:
Ming Li, University of Maryland, College Park, United StatesReviewed by:
Riccardo Farneti, The Abdus Salam International Centre for Theoretical Physics (ICTP), ItalyStephen Rintoul, Commonwealth Scientific and Industrial Research Organisation (CSIRO), Australia
Copyright © 2023 Wang, Zhou, Zhang and Dinniman. This is an open-access article distributed under the terms of the Creative Commons Attribution License (CC BY). The use, distribution or reproduction in other forums is permitted, provided the original author(s) and the copyright owner(s) are credited and that the original publication in this journal is cited, in accordance with accepted academic practice. No use, distribution or reproduction is permitted which does not comply with these terms.
*Correspondence: Meng Zhou, bWVuZy56aG91QHNqdHUuZWR1LmNu