 Isabel Seguro
 Alina D. Marca
 Jamie D. Shutler
 Jan Kaiser
- 1Centre for Ocean and Atmospheric Sciences, School of Environmental Sciences, University of East Anglia (UEA), Norwich, United Kingdom
- 2Centre for Geography and Environmental Science, College of Life and Environmental Sciences, University of Exeter, Penryn, United Kingdom
Shelf seas represent only 10% of the World’s Ocean by area but support up to 30% of its primary production. There are few measurements of biological production at high spatial and temporal resolution in these physically and biologically dynamic systems. Here, we use dissolved oxygen to-argon (O2/Ar) ratios and oxygen triple isotopes in O2 (16O, 17O, 18O) to estimate net community production, N(O2/Ar), and gross O2 production, G(17O), in summer and autumn 2014 and spring and summer 2015 in the Celtic Sea, as part of the UK Shelf-Sea Biogeochemistry Programme. Surface O2/Ar concentration ratios were measured continuously using a shipboard membrane inlet mass spectrometer. Additional depth profiles of O2/Ar concentration ratios, δ(17O) and δ(18O) were measured in discrete water samples from hydrocasts. The data were combined with wind-speed based gas exchange parameterisations to calculate biological air-sea oxygen fluxes. These fluxes were corrected for diapycnal diffusion, entrainment, production below the mixed layer, and changes over time to derive N(O2/Ar) and G(17O). The Celtic Sea showed the highest G(17O) in summer 2014 (825 mmol m–2 d–1) and lowest during autumn 2014 (153 mmol m–2 d–1). N(O2/Ar) was highest in spring 2015 (43 mmol m–2 d–1), followed by summer 2014 (42 mmol m–2 d–1), with a minimum in autumn 2014 (–24 mmol m–2 d–1). Dividing the survey region into three hydrographically distinct areas (Celtic Deep, Central Celtic Sea and Shelf Edge), we found that Celtic Deep and Shelf Edge had higher N(O2/Ar) in summer (71 and 63 mmol m–2 d–1, respectively) than in spring (49 and 22 mmol m–2 d–1). This study shows regional differences in the metabolic balance within the same season, as well as higher net community production in summer than in spring in some areas and years. The seasonal patterns in biological production rates and the export efficiency (f-ratio) identified the importance of biology for supporting the Celtic Sea’s ability to act as a net CO2 sink. Our measurements thus help improve our understanding of the biological carbon pump in temperate shelf seas.
Introduction
Europe’s population is increasing in coastal areas and predicted to continue growing in the future (Neumann et al., 2015). Northwest European shelf seas are also of high importance for recreational, artisanal and industrial fisheries (Sharples et al., 2013). An increasing population leads to an expansion in land use, industry, shipping, and therefore carbon dioxide (CO2) emissions and pollution. These pressures can directly affect the biological functioning of these coastal areas (e.g., changes in biological community composition) (Painting et al., 2017).
At the base of the shelf sea food web, phytoplankton provide key marine services like atmospheric CO2 uptake and sustaining fisheries (Sharples et al., 2009; Sharples et al., 2013). Phytoplankton are responsible for marine primary production and thus play a key role in the global carbon cycle. A fraction of the fixed organic carbon sinks to the seabed, reducing the amount of CO2 at the sea surface and enabling more CO2 to be taken up from the atmosphere. Despite shelf seas covering only about 10% of the ocean by area, they are responsible for 30-50% of inorganic and >80% of organic carbon burial (Bauer et al., 2013). The northwest European shelf is also the interface between coastal zones and the Atlantic Ocean. Therefore, quantifying biological production is essential to understand its role in CO2 uptake and carbon export to the shelf seabed or to Atlantic deep waters.
Photosynthetic phytoplankton activity is determined by a combination of biogeochemical variables (nutrients, light, turbulence, temperature, etc.) that change seasonally (Seguro et al., 2015). Climate change is expected to alter this seasonal cycle (Henson et al., 2013; Landschützer et al., 2018), but it is still uncertain how these changes would affect the global carbon cycle (Bopp and Le Quéré, 2013). It is therefore important to quantify and understand spatial and seasonal variations in biological production and to help predict the impacts of growing populations and climate change.
Temperate shelf sea areas have been sampled more often than the open ocean because of their economic and ecologic importance. Previous studies of biological production in the Celtic Sea with “traditional” methods do not agree well (Joint and Pomroy, 1983; Holligan et al., 1984; Joint et al., 1986; Rees et al., 1999; Joint and Groom, 2000; Joint et al., 2001; Robinson et al., 2009; Hickman et al., 2012; Poulton et al., 2014), in part because of the inherent differences of each method (14C, 18O, 15N, fast repetition rate fluorometry (FRRF), chlorophyll a, etc.) and their known biases (e.g., artifacts associated with incubation) (Marra, 2009; Robinson et al., 2009), but also because these areas are heterogeneous dynamic systems that require higher temporal and spatial resolution than the open ocean and snapshot sampling usually fails to capture their variability (Seguro et al., 2019). While satellite observations provide high spatial and temporal coverage when there are no clouds, these observations are mostly limited to the sea surface layer. Moreover, algorithms used to estimate net biological production and carbon export from satellite images need to be validated with in situ measurements, but different ways of estimating biological production have large uncertainties associated with methodological artefacts, assumptions on photosynthetic quotients or integration times (Cullen, 2001; Robinson et al., 2009). Those uncertainties makes it more difficult to evaluate satellite data-based approaches and limit our knowledge of primary production in shelf seas. Thus, our understanding of the inter-annual, seasonal and spatial variability of biological production in temperate shelf seas, like the Celtic Sea, is still incomplete. In the context of climate change, with increasing CO2 and ocean warming (IPCC, 2021), understanding how physical parameters (e.g., temperature) affect biological production is needed for predicting the ecological and biogeochemical response on CO2 uptake and subsequent O2 release.
The method based on oxygen isotopes to measure gross production without incubation (Luz and Barkan, 2000) provide a unique opportunity to understand the variability of dynamics systems at unprecedent high spatial resolution. To our knowledge, this is the first study of seasonal productivity in the Celtic Sea using the concentrations of oxygen (O2), its isotopologues, and argon (Ar) as biogeochemical tracers.
While CO2 is consumed, O2 is produced during photosynthesis, therefore O2 concentration changes can be used to estimate biological O2 production. O2 concentrations are also affected by physical processes such as air-sea gas exchange and mixing. We can quantify net community production (gross production minus respiration) by measuring O2 supersaturation and using argon as a tracer to separate physical and biological factors affecting O2 supersaturations (Craig and Hayward, 1987; Kaiser et al., 2005). Moreover, the isotopic signature of photosynthetic O2 is different from atmospheric O2 (Thiemens et al., 1995; Luz and Barkan, 2005) the latter of which is absorbed by the water through gas exchange. This difference in signature is due to the anomalous enrichment of stratospheric O3 in 17O and 18O and isotope exchange with CO2, leading to a corresponding 17O and 18O depletion in atmospheric O2, relative to photosynthetic O2 (Luz and Barkan, 2000). Using the three oxygen isotopologues 16O2, 16O17O, and 16O18O together allows us to eliminate the influence of respiration and any associated isotope effect. These differences in isotopic signature make it possible to quantify gross biological production by measuring the isotopic composition of dissolved oxygen. Gross biological production and net community production can then be converted to carbon-based quantities using photosynthetic stoichiometric quotients (Laws, 1991; Marra, 2002).
The data presented here combine high frequency underway observations of O2/Ar supersaturation, Δ(O2/Ar), and discrete samples for oxygen triple isotopes (16O, 17O, 18O), providing estimates of seasonal net community production, N(O2/Ar), and gross biological O2 production, G(17O). The budget calculations account for production in the euphotic zone, air-sea gas exchange, diapycnal mixing, temporal changes and entrainment. We investigated the regional differences in the metabolic balance, estimate export efficiency f as N(O2/Ar)/G(17O) ratio and respiration as R = G(17O)–N(O2/Ar), and its relationship with temperature.
Material and methods
Study area
The temperate Celtic Sea is part of the northwest European shelf and adjoins the northeast Atlantic Ocean. Temperate seas are characterised by seasonal differences in temperature, wind speeds, and irradiance. The spring bloom usually starts in April when the water column becomes stratified and lasts up to two months. During summer, the water column remains stratified. Autumn starts with deepening of the surface mixed layer due to changes in winds and heat fluxes, leading to a fully mixed water column in winter (Simpson and Sharples, 2012). The currents are spatially variable and considered weak compared with the adjacent areas of the European Shelf Sea, especially in spring and summer when the winds are weaker than in autumn and winter (Holt et al., 2001). We sampled during three seasons (two summers, one autumn and one spring) on RRS Discovery cruises DY026 in August 2014, DY018 in November 2014, DY029 in April 2015 and DY033 in July 2015 as part of the NERC Shelf-Sea Biogeochemistry (SSB) programme. Up to 14 stations were sampled on every cruise, following a similar cruise track. Not all the stations were sampled on every cruise, but at least 3 main stations called A (51° N 6° W), CCS (49.5° N 8.5° W) and CS2 (48.5° N 9.5° W) were. The main stations were binned with the nearby ones, dividing the Celtic Sea into three areas, representing inner, middle and outer shelf: Celtic Deep (CD; 51°–50° N 8°–6° W; 100 m seabed depth), Central Celtic Sea (CCS; 50°–49.3° N 8.8°–8° W; 150 m seabed depth) and Shelf Edge (SE; 49.3–48° N 10–8.8° W; 200 m seabed depth), respectively (Table 1, Figure 1).
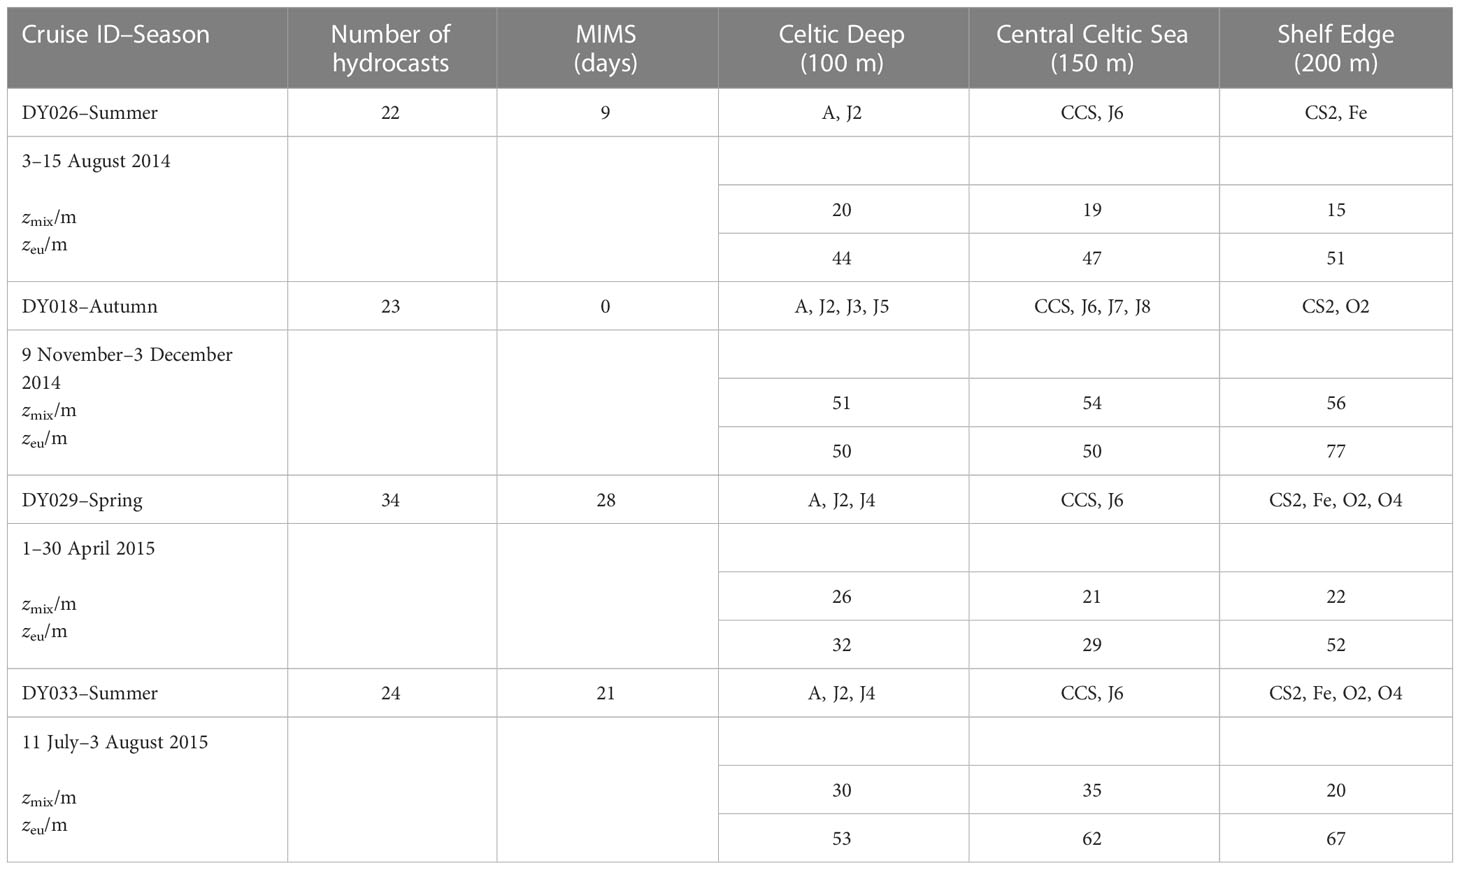
Table 1 Overview of data collected, mixed layer depth (zmix), euphotic zone (zeu) and stations (A, J2, J3, J4, J5, J6, J7, J8, CCS, O2, O4, CS2, Fe) at the three regions (Celtic Deep, Central Celtic Sea and Shelf Edge) with seabed depths (100 m, 150 m, 200 m) during the four cruises in autumn 2014, autumn 2015, spring 2015 and summer 2015.
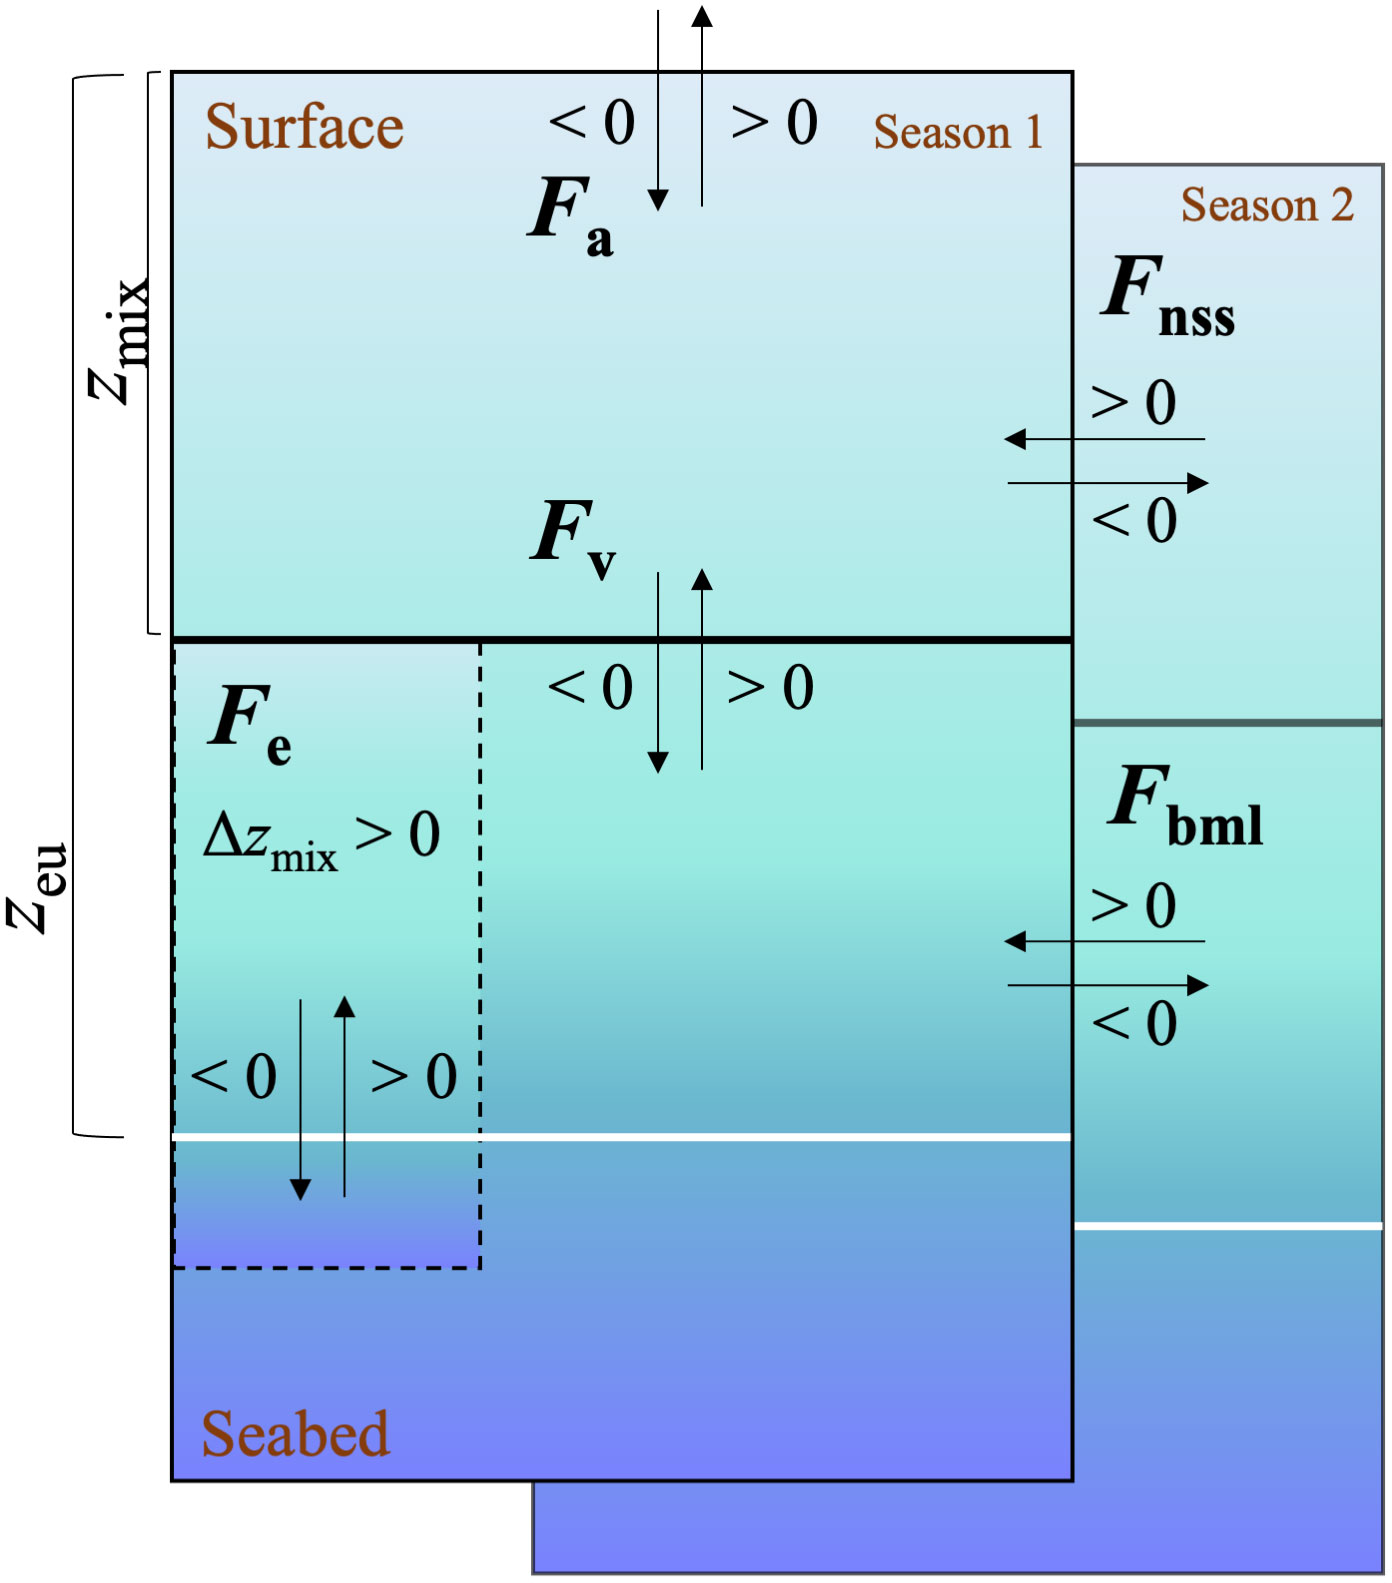
Figure 1 Schematic view of the box model for equation 1 and 2. N(O2/Ar) or G(17O) = Fa–Fv–Fe + Fnss + Fbml, where each term of the box model can apply to either (O2/Ar) or (17O). The direction of the arrow shows the addition or subtraction of the F terms to the mixed layer when they are >0 or <0. Solid black line represents zmix, white line represents zeu and dashed line represents the deepening of the mixed layer to below the lower integration depth zeu.
Methods
Along-track O2/Ar ratios were determined using a shipboard membrane inlet mass spectrometer (MIMS) connected to the ship’s underway seawater (USW) intake. We also collected discrete samples for oxygen triple isotopes that were subsequently analysed with a dual-inlet isotope ratio mass spectrometer (IRMS Finnigan MAT 252) in the Stable Isotope Laboratory at UEA. Discrete samples were taken at six depths from Niskin bottles attached to a conductivity-temperature-depth (CTD) rosette water sampler.
Continuous measurements
Continuous O2/Ar ratio measurements were performed by MIMS. The MIMS was set-up according to Kaiser et al. (2005), with modifications detailed by Seguro et al. (2019). We calibrated the MIMS data with daily air-equilibrated water samples. On each cruise, at least one ship-transect passed the three areas Celtic Deep (stations A, J2, J3, J4, J5), Central Celtic Sea (stations CCS, J6, J7, J8) and Shelf Edge (stations CS2, Fe, O2, O4). USW data collection started in the English Channel and continued uninterrupted on all cruises, apart from cruise DY018 when the MIMS had an electronics fault. To compensate, discrete O2/Ar samples were taken every day from the USW and analysed by IRMS at UEA.
Discrete measurements
Samples for the analysis of oxygen triple isotopes and O2/Ar were collected in evacuated 330 ml-glass flasks with high-vacuum stopcocks (Louwers Hapert), filled up to about 70% their volume, slightly below the optimum fill level (Seguro et al., 2019). The flasks contained 7 mg dry HgCl2 to stop biological activity after sampling (Emerson et al., 1995). All samples were taken around midday to avoid bias due to diurnal variability. The standard deviation of Δ(O2/Ar) duplicates was 0.1% or better. The standard deviation for dry air reference samples was 0.03 ‰ for δ(17O), 0.06 ‰ for δ(18O) and 8 ppm for the 17O excess, defined as 17Δ = δ(17O)–0.5179 δ(18O) (Kaiser, 2011a), all with respect to O2 in tropospheric air.
The in situ oxygen concentration, c(O2), was determined using a CTD-mounted oxygen sensor, calibrated against discrete samples analysed on board by automatic Winkler titration to a potentiometric endpoint (Culberson, 1991; Holley and Hydes, 1995).
Net community and gross biological production calculation in the euphotic zone
To calculate net community production, N(O2/Ar), and gross production, G(17O), in the euphotic zone, we considered air-sea exchange fluxes (Fa), vertical diapycnal diffusion (Fv), entrainment due to mixed-layer depth changes (Fe) as well as non-steady state changes (temporal variations) in the mixed layer (Fnss) and in the euphotic zone below (Fbml) (Figure 1).
as described in the following paragraphs. The bottom of the euphotic zone (zeu) was chosen as lower integration depth and was determined to be the depth corresponding to 1% of incident light using a PAR sensor mounted to the CTD (PAR: photosynthetically active radiation). All the terms on the right side of the equation adds to the mixed layer budget when > 0, apart from the Fa term that is defined by convention as negative when entering in the ocean from the atmosphere (Figure 1).
Air-sea exchange fluxes (Fa)
Δ(O2/Ar) reflects the influence of biological processes (production and respiration of oxygen) (Craig and Hayward, 1987). Δ(O2/Ar) is not significantly affected by physical processes such bubble injection and exchange because of the similar solubility and diffusivity of O2 and Ar. Δ(O2/Ar) together with the gas exchange coefficient k(O2) (Nightingale et al., 2000) and the oxygen saturation concentration csat(O2) (García and Gordon, 1992; Hamme and Emerson, 2004) can be used to calculate the biological O2 air-sea exchange flux Fa(O2/Ar):
Sometimes, only the first term of Eq. 3 is used for the biological O2 air-sea exchange flux and designated Fbio, but here we use the full expression Fa(O2/Ar) (Kaiser et al., 2005; Seguro et al., 2019) The second term in Fa arises from small differences in the Schmidt numbers Sc of O2 and Ar. It is generally ≪ 0.1Fa and therefore often neglected.
Oxygen triple isotopes samples were used to estimate gross production via the dual delta method (Kaiser, 2011a; Kaiser and Abe, 2012), which avoids approximations and accounts for kinetic fractionation during invasion and evasion at the air-sea interface. Parameters used are as follows: 18ϵ = –2.095 ‰ and 17ϵ = –1.082 ‰ for the 18O/16O and 17O/16O kinetic isotope fractionations during O2 evasion (Knox et al., 1992; Kaiser, 2011a); δsat for the isotope delta value of dissolved O2 in equilibrium with the atmosphere at the measured temperature and salinity (Benson and Krause, 1984; Luz and Barkan, 2009), γ = 17ϵR/18ϵR = 0.5179 for the ratio of the 17O/16O and 18O/16O respiration fractionations (Luz and Barkan, 2005); 17δP = –11.644 ‰ and 18δP = –22.832 ‰ for the isotope deltas of photosynthetic O2 with respect to tropospheric O2 (Kaiser, 2011a; Kaiser, 2011b; Kaiser and Abe, 2012).
Vertical diapycnal diffusion (Fv)
Fvs is calculated using a vertical eddy-diffusion coefficient of Kz = (3 ± 2) × 10–5 m2 s–1 (Osborn, 1980; Simpson and Sharples, 2012; Palmer et al., 2013) and the O2/Ar concentration gradients evaluated at the bottom of the euphotic zone (Castro-Morales et al., 2013; Seguro et al., 2019)
where cmix(O2) is the mixed-layer O2 concentration.
Similarly, the diapycnal diffusion influence on G(17O) is calculated as (Seguro et al., 2019):
Entrainment (Fe)
Entrainment of water below the mixed layer depth (zmix) affects N(O2/Ar) and G(17O) when the mixed layer deepens (Δzmix > 0) to below the lower integration depth zeu, i.e., zmix + Δzmix > zeu. Δt is the number of days elapsed between the dates Δzmix has been determined. Following Castro-Morales et al. (2013) and Seguro et al. (2019) the resulting fluxes are
Temporal changes (Fnss)
Fnss can be estimated from samples taken at the same place at different times (e.g., 24 h or more apart) (Seguro et al., 2019). In this case, calculated as changes between seasons for the same area sampled.
Production below the mixed layer (Fbml)
is not affected by gas exchange and is only relevant at depths between zmix and the lower integration depth, zeu. Because there is no exchange with the atmosphere below the mixed layer, we use O2 values instead O2/Ar.
The isotopic composition below the mixed layer will change only due to biological processes, as it will not be affected by air exchange signal with time. The equation is the same as Eq. 10 but using δ values measured below the mixed layer (Luz and Barkan, 2009; Kaiser, 2011b).
Our estimates do not include horizontal advection because the sampling pattern did not allow us to obtain the required data. However, we expect that horizontal gradients perpendicular to the transect are relatively weak (Pingree and Le Cann, 1989). Also, advection is likely dominated by tidal flows, with weak residual currents, (Brown et al., 2003; Sharples et al., 2013), making them less important for our estimates over longer timescales of weeks to months. Upwelling fluxes can also be neglected in the sampled area.
Metabolic efficiency
The combination of net community production and gross production allow us to calculate the metabolic efficiency of the biological pump, f(O2) = N(O2/Ar)/G(17O), an estimate of the part of gross production available for export (Laws et al., 2000; Haskell et al., 2017; Seguro et al., 2019). Values > 0 indicate net autotrophy (spring and summer); values< 0 net heterotrophy (autumn). Since we do not always have estimates of all terms in the budget for N(O2/Ar) and G(17O) (from equations 1 and 2), we also define fa(O2) = Fa(O2/Ar)/Fa(17O) (from equations 3 and 4) as a proxy for the metabolic efficiency of the mixed layer only.
Results
Seasonal cycle of surface Δ(O2/Ar) and biological fluxes
Discrete and continuous O2/Ar measurements were carried out on cruises DY026, DY029, and DY033; discrete ones only on cruise DY018. All cruises followed similar transects. Summer 2014 (DY026) and summer 2015 (DY033) showed net autotrophic conditions with surface Δ(O2/Ar) = (4 ± 2) % and (2 ± 1) %, respectively (Figure 2). In autumn 2014 (DY018), Δ(O2/Ar) was (–1 ± 1) %. The highest Δ(O2/Ar) values were found in spring 2015 (DY029), with a mean of (6 ± 4) %. Persistently low Δ(O2/Ar) was observed in the English Channel south of Lyme Bay, east of 4° W, with negative values in both summer 2014 and 2015 and values near equilibrium in spring. Sea-surface temperature (SST) satellite images (not shown) indicate a change in temperature in this area, which may be associated with a change of the physical and biogeochemical regime that could explain the lower Δ(O2/Ar).
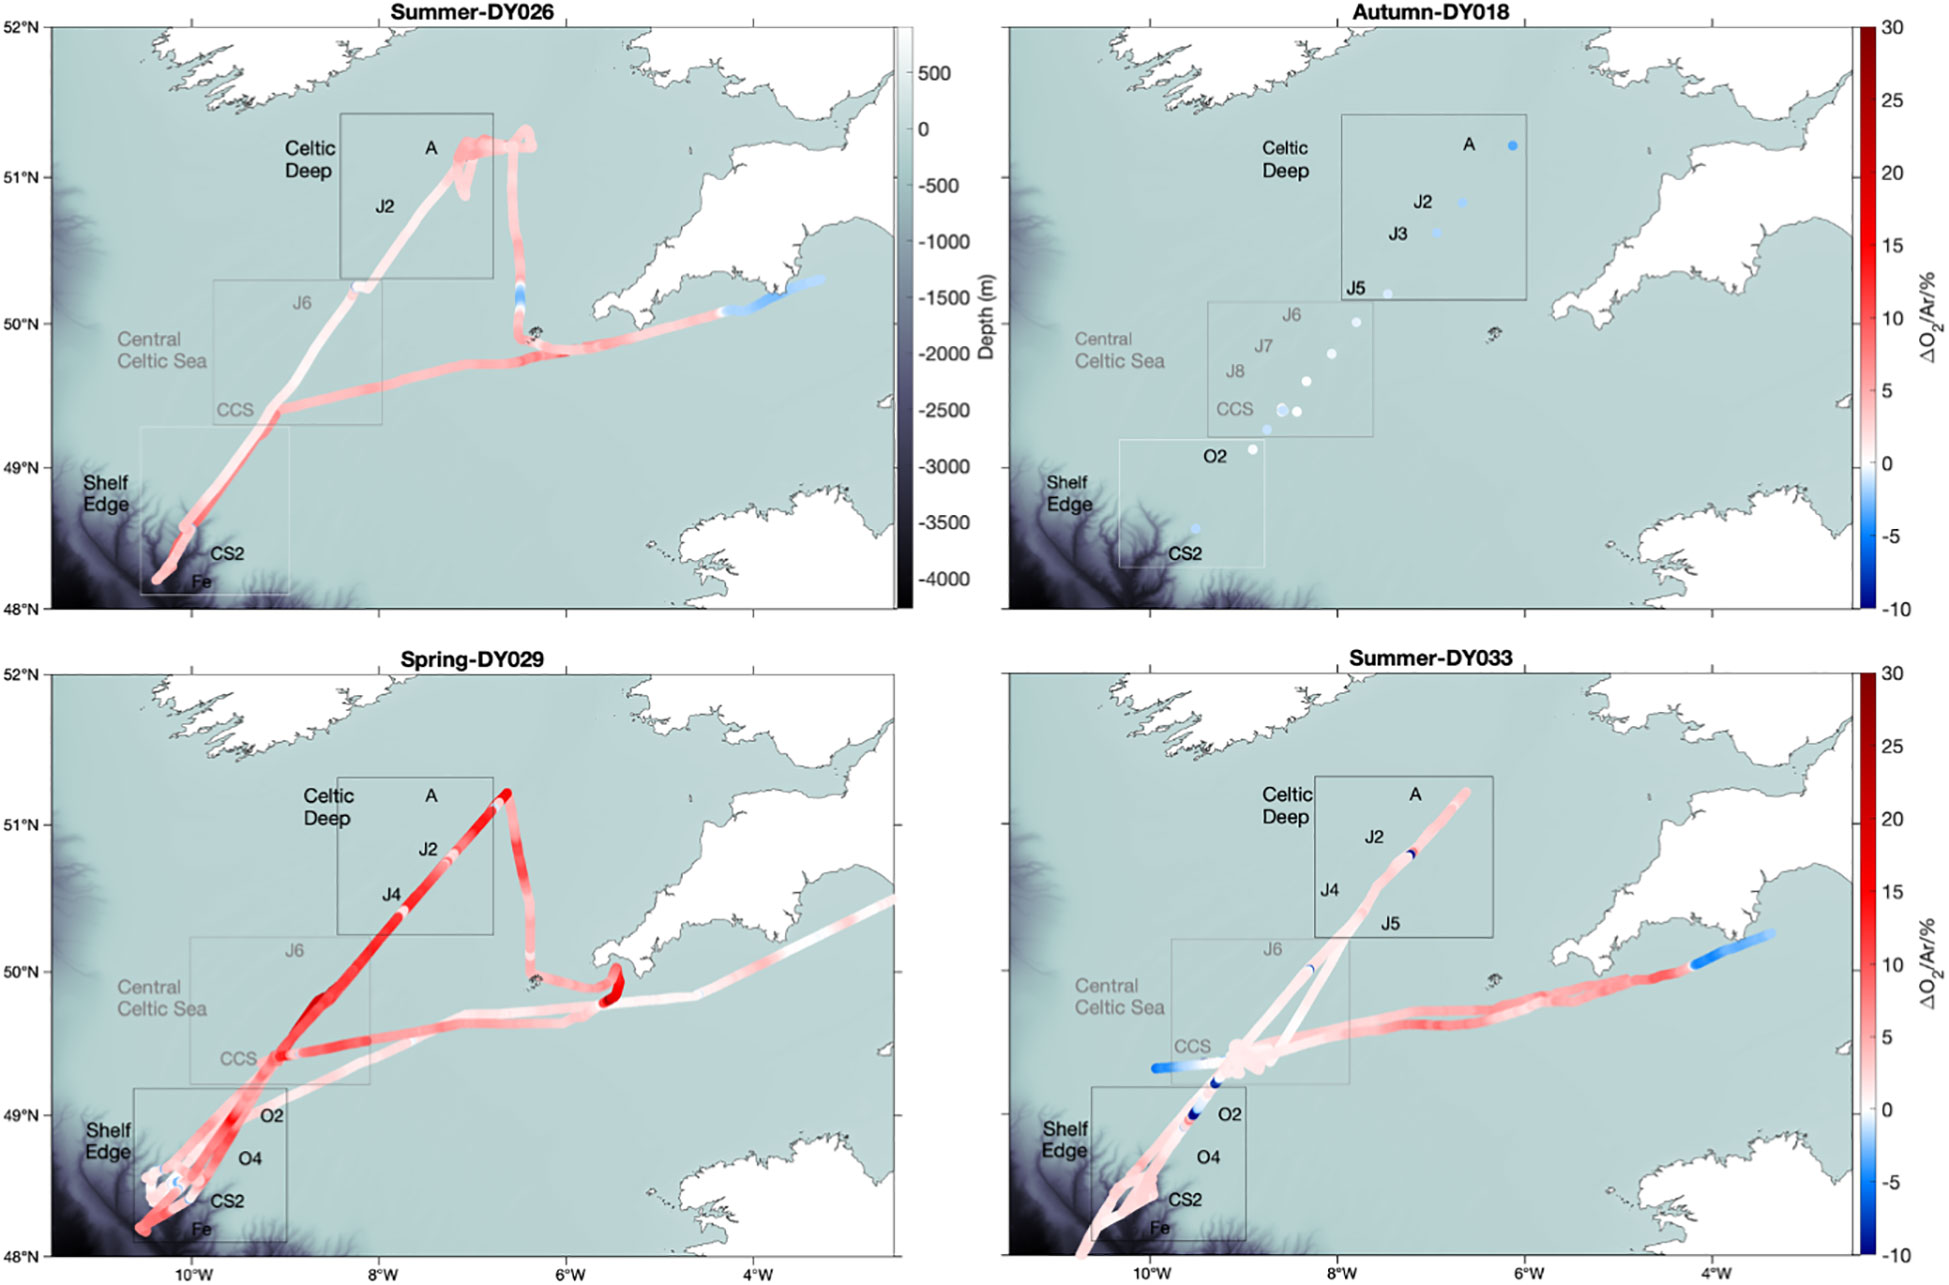
Figure 2 USW Δ(O2/Ar) analysed by MIMS in summer 2014 (DY026), summer 2015 (DY033), autumn 2014 (DY018) and spring 2015 (DY029). Red colour shows Δ(O2/Ar) > 0 and blue Δ(O2/Ar)< 0.
Seasonal variations of 17Δ and Δ(O2/Ar) in the water column
The Central Celtic Sea showed distinct vertical profiles of 17Δ and Δ(O2/Ar) during each season (Figure 3). At beginning of autumn, the lowest 17Δ of 24 ppm is found near the surface, increasing with depth. The highest surface values of 50 to 60 ppm occur in spring and summer. In spring, we observed a 17Δ decrease with depth, whereas in summer 17Δ formed a subsurface maximum (>100 ppm) below the mixed layer and rapidly decreased deeper down.
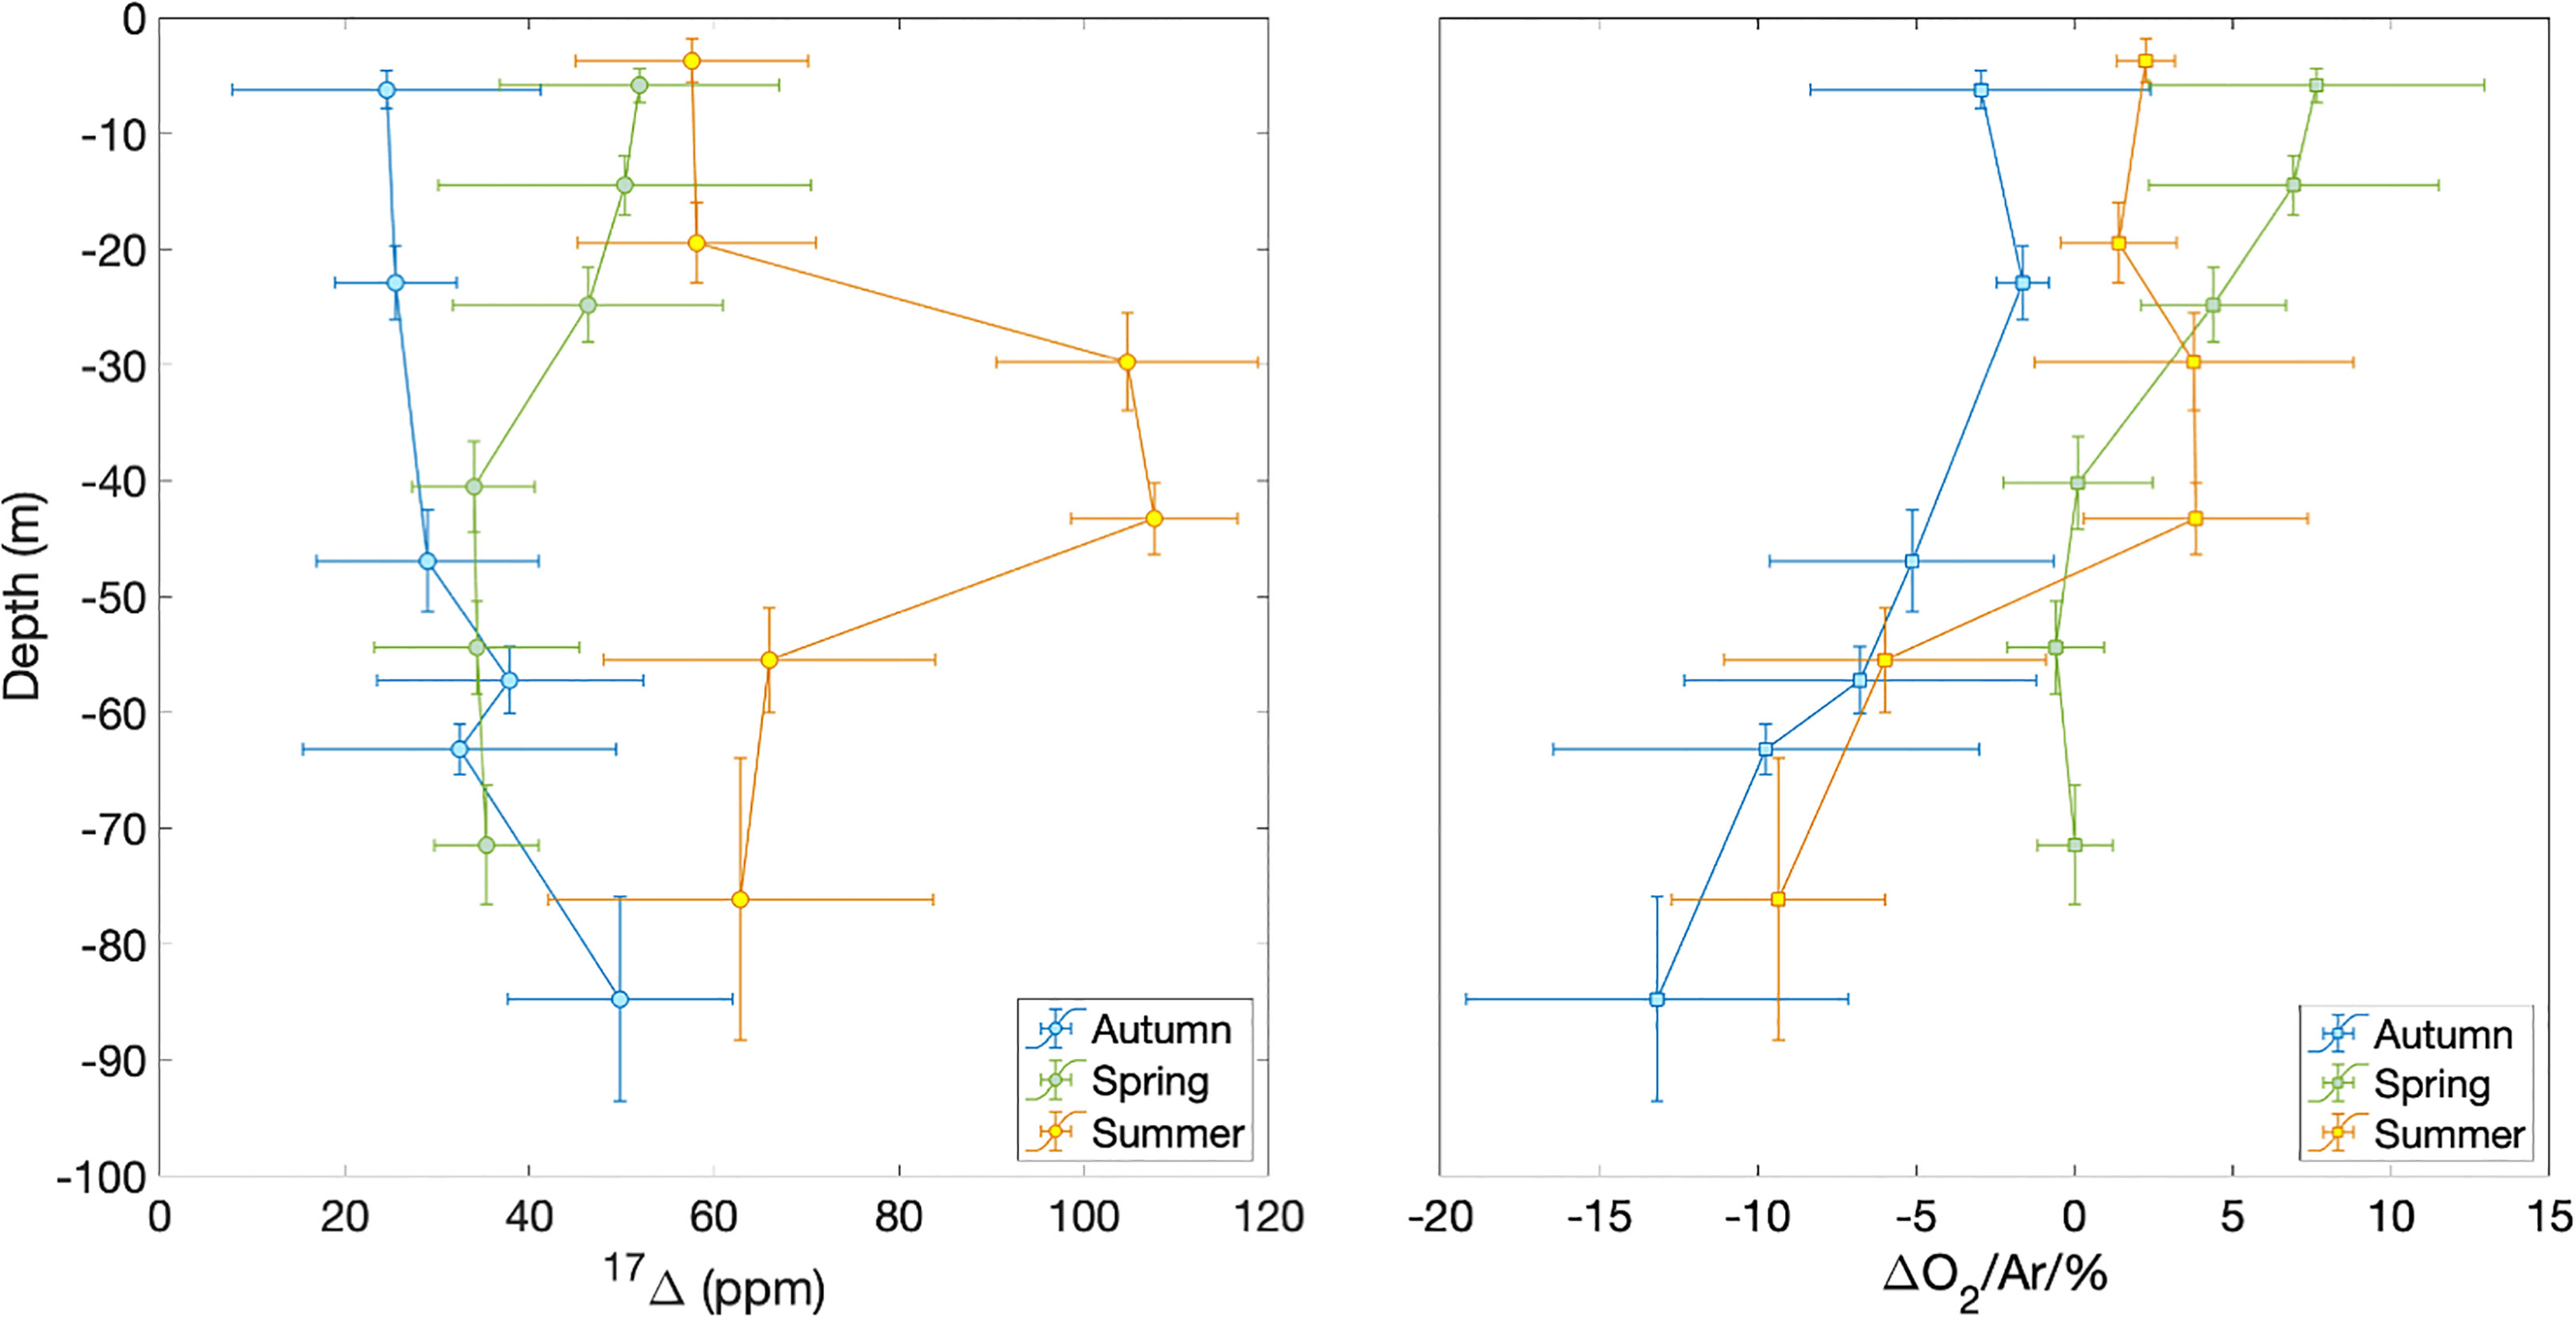
Figure 3 17Δ and Δ(O2/Ar) depth profiles at station CCS in autumn 2014 (blue), spring 2015 (green) and summer 2015 (orange). Horizontal error bars show standard deviation of samples binned over depth intervals indicated by the vertical bars.
Δ(O2/Ar) values generally decrease with depth during all seasons, except for a summer subsurface maximum that coincides with the 17Δ maximum. Surface Δ(O2/Ar) is > 5% spring, 1–2% in summer and< 0 in autumn.
Net community production, gross production, and the efficiency of the biological pump
We calculated G(17O) and N(O2/Ar) for the whole of the Celtic Sea for each cruise. Mean values of the three areas in the Celtic Sea show the highest values of gross production in summer 2014 and summer 2015 (825 and 401 mmol m–2 d–1) and minima during autumn and spring (153 and 202 mmol m–2 d–1) (Table 2). Net community production was highest in spring 2015 and summer 2014 (43 and 42 mmol m–2 d–1), followed by summer 2015 (29 mmol m–2 d–1), and lowest in autumn (–24 mmol m–2 d–1). G(17O). Both f(O2) summer values (0.05 and 0.07) were lower than spring (0.21), and negative in autumn (–0.16), but all seasons showed significant variability across the sampling domain (Table 2).
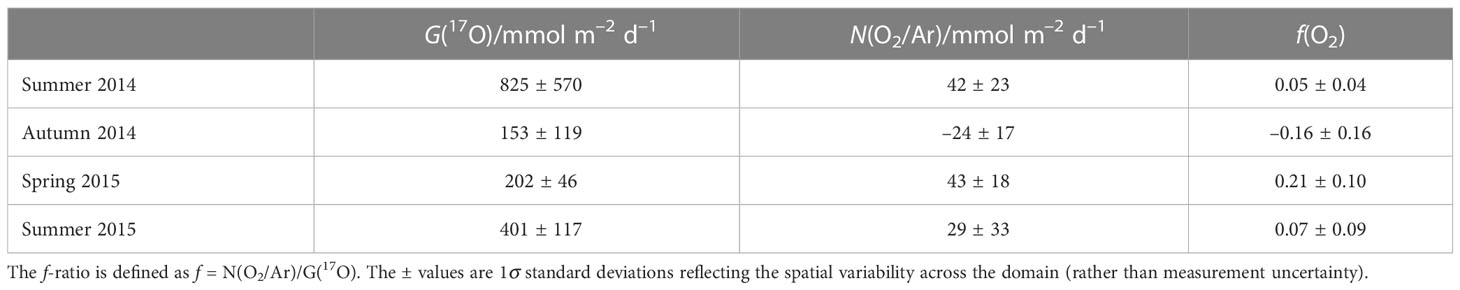
Table 2 Average gross O2 production G(17O) and net community O2 production N(O2/Ar), by season.
To evaluate how gross and net community production vary regionally, mean G(17O) and N(O2/Ar) were calculated by dividing the Celtic Sea into three areas: Celtic Deep (CD), Central Celtic Sea (CCS), and Shelf Edge (SE) (Figure 2 and Tables 1, 3).
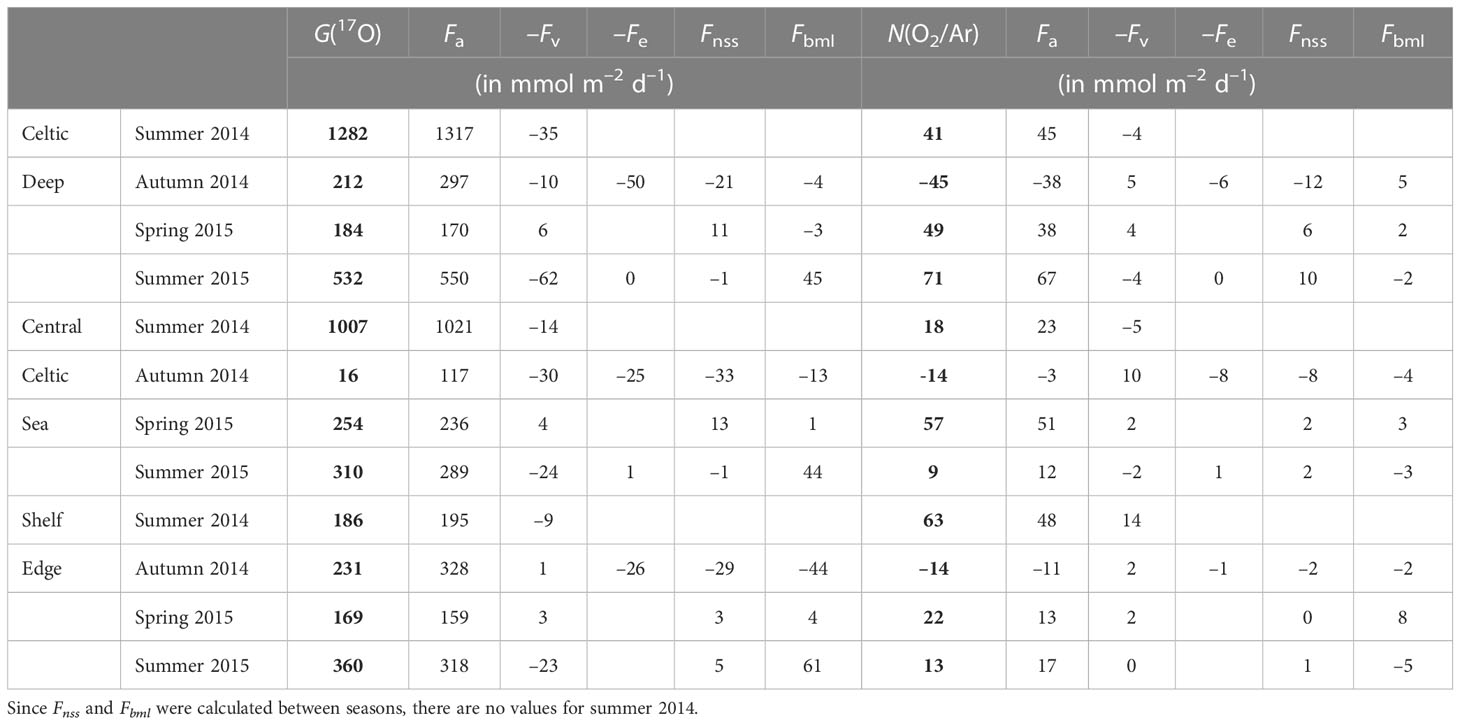
Table 3 Seasonal variations of G(17O) = Fa(17O)–Fv(17O)–Fe(17O) + Fnss(17O) + Fbml(17O) and N(O2/Ar) = Fa(O2/Ar)–Fv(O2/Ar)–Fe(O2/Ar) + Fnss(O2/Ar) + Fbml(O2/Ar) for the Celtic Deep, Central Celtic Sea and Shelf Edge areas.
For CD, G(17O) was higher in summer (1282 and 532 mmol m–2 d–1 in 2014 and 2015, respectively) and lower in spring and autumn (184 and 212 mmol m–2 d–1). Fa(17O) dominated G(17O), with the other flux terms being mostly negligible, except for autumn when the mixed layer deepened, and Fe(17O) reached (50 mmol m–2 d–1). Fv(17O) was higher in summer (35 and 62 mmol m–2 d–1 in 2014 and 2015, respectively), while Fbml(17O) was higher in summer 2015 (45 mmol m–2 d–1) and negligible at other seasons.
Similar to G(17O), the air-sea exchange flux Fa(O2/Ar) dominated N(O2/Ar) at CD. N(O2/Ar) was higher in spring and summer (49 to 71 mmol m–2 d–1), with an autumn minimum of –45 mmol m–2 d–1. Fv(O2/Ar), Fe(O2/Ar), Fnss(O2/Ar), and Fbml(O2/Ar) all make minor contributions of –12 to +10 mmol m–2 d–1, corresponding to (0.2 ± 0.1) Fa(O2/Ar).
For CCS, G(17O) was smaller than for CD but still highest in summer (1007 and 310 mmol m–2 d–1 in 2014 and 2015, respectively) and lowest in autumn (16 mmol m–2 d–1). However, spring G(17O) was higher at CCS (254 mmol m–2 d–1) than at CD. Just as at CD, Fa(17O) generally approximates to G(17O), with the other flux terms being negligible except for autumn. In summer 2015, Fbml(17O) made significant (44 mmol m–2 d–1), albeit minor, contribution.
The highest N(O2/Ar) at CCS occurred in spring (51 mmol m–2 d–1), while both summers were low (18 and 9 mmol m–2 d–1) and autumn was negative (–14 mmol m–2 d–1). In general, Fe, Fnss, and Fbml showed the same patterns at CCS as at CD.
For SE, G(17O) was similar in all the seasons (from 169 to 360 mmol m–2 d–1) and dominated by Fa(17O). Fv(17O) was highest absolute value in summer (–23 mmol m–2 d–1) and negligible in autumn. Fe(17O) was only relevant in autumn (as at CD and CCS). Fnss(17O) and Fbml(17O) were negative in autumn (–29 and –44 mmol m–2 d–1, respectively) and positive in spring and summer, with a maximum Fbml(17O) of 61 mmol m–2 d–1 in summer 2015, but still<0.2 Fa(17O).
Summer 2014 N(O2/Ar) was the highest of all regions and seasons at SE (63 mmol m–2 d–1). In spring, N(O2/Ar) was the lowest of the three regions (22 mmol m–2 d–1). In autumn, N(O2/Ar) was equally low to CCS (–14 mmol m–2 d–1). Fv(O2/Ar) was mostly negligible except for summer 2014 (–14 mmol m–2 d–1). Fe(O2/Ar) was not significant. Fnss(O2/Ar) amounted to 0.2 Fa(O2/Ar) in autumn but was negligible in the other seasons. Fbml(O2/Ar) had a maximum in spring (8 mmol m–2 d–1) and a minimum in summer 2015 (–5 mmol m–2 d–1).
These results show that the non-Fa terms, which are often neglected in open-ocean applications, can make significant, if generally minor, contributions to gross and net community production in the Celtic Sea. The relative influences of the non-Fa terms are largest in autumn and are often non-negligible then. In summer, production below the mixed layer (Fbml) and diapycnal diffusion (Fv) can also be relevant.
To test whether metabolic efficiency and therefore carbon export could be parameterised in terms of a more readily measured variable, we plotted mixed-layer metabolic efficiency fa(O2) against sea surface temperature ϑ (Figure 4). Our dataset contains only one season, autumn, at specific conditions of heterotrophy (and therefore no carbon available for export), mixed water column, as well as a narrow temperature range (12.5–14 °C). Therefore, we excluded the autumn data and investigated fa(O2) and ϑ relationship under net autotrophic conditions only. While the relationship between fa(O2) and ϑ does not seem to be very regionally, it is clearly clustered by seasons. The lowest temperatures (9.5–12 °C) correspond to spring with the highest fa(O2) values. The highest temperatures (15–18 °C) correspond to summer with positive, but lower than spring fa(O2). The spring and summer values decrease with temperature following fa(O2) = (–0.022 ± 0.004) ϑ/°C + 0.41 ± 0.05 (n = 66; r2 = 0.34; p< 10-6) (Figure 4). Such a parameterisation may also be useful for data interpolation purposes.
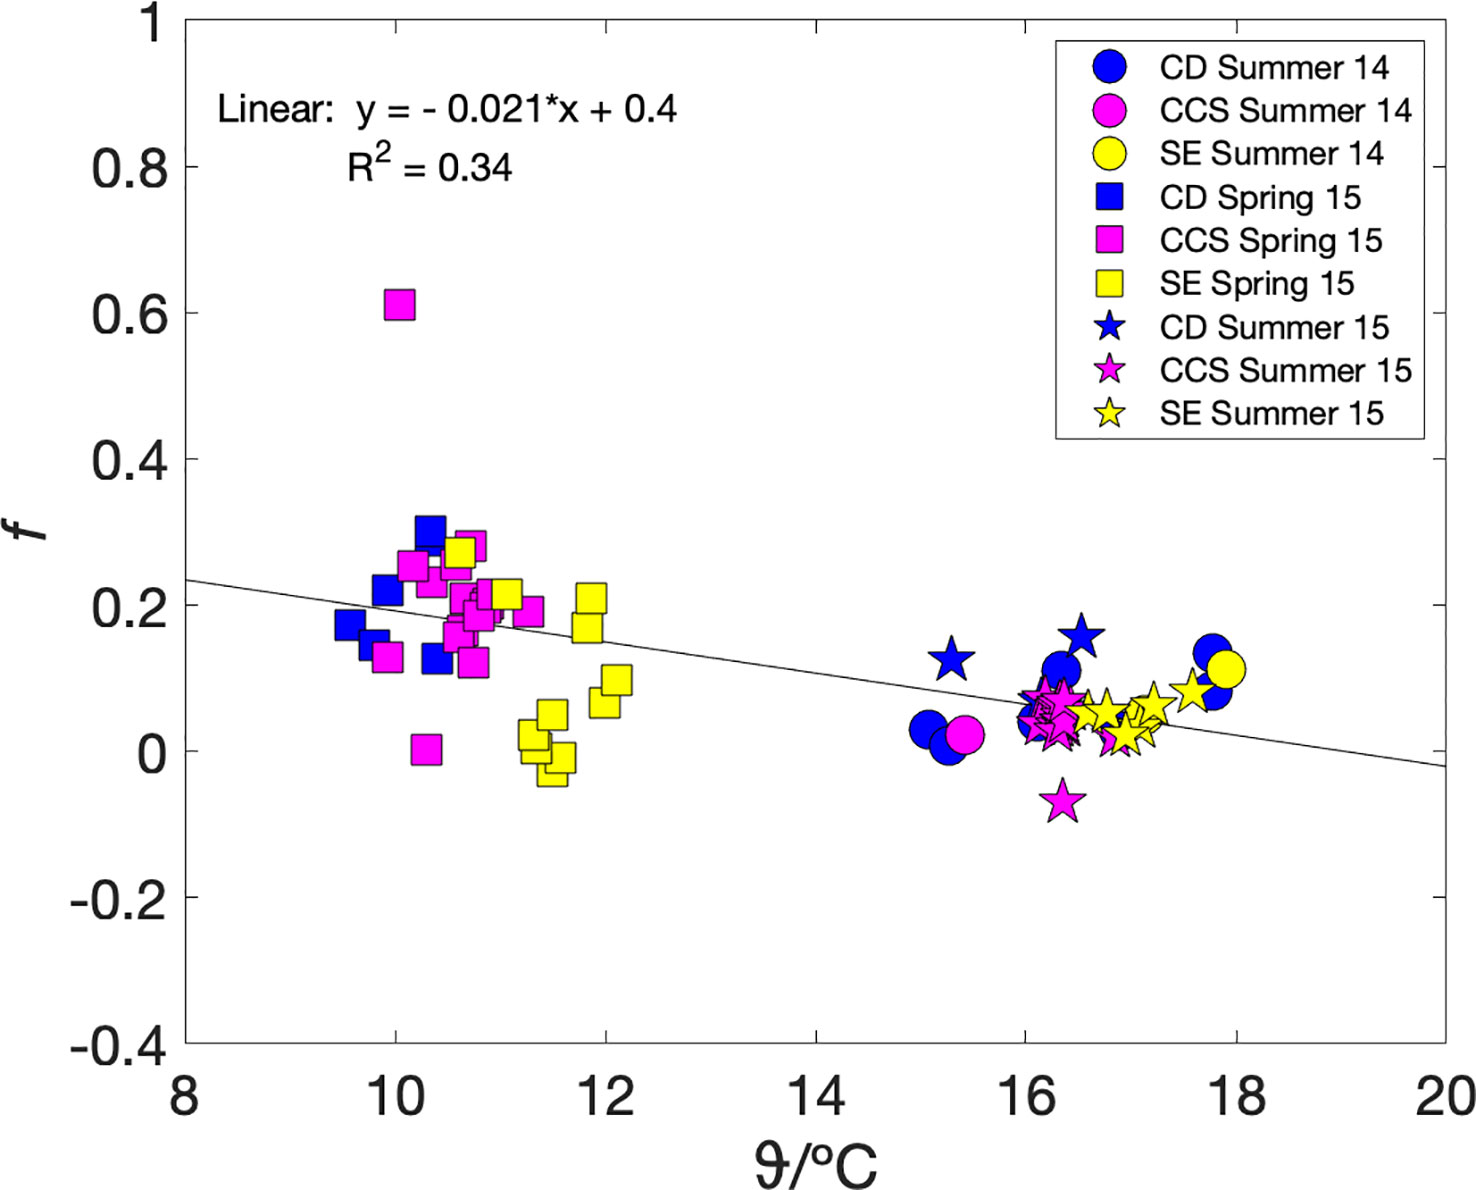
Figure 4 fa = Fa(O2/Ar)/Fa(17O) versus temperature during summer 2014 (circles), autumn 2014 (triangles), spring 2015 (squares) and summer 2015 (stars), colour coded by areas Celtic Deep (CD) in blue, Central Celtic Sea (CCS) in magenta, and Shelf Edge (SE) in yellow. A linear fit to the spring and summer data gives fa(O2) = (–0.022 ± 0.004) ϑ/°C + 0.41 ± 0.05 (black line).
We also looked at the relationship between community respiration (R) and sea surface temperature ϑ. Community respiration can be calculated as R = G(17O)–N(O2/Ar) using the regionally and seasonally aggregated values in Table 3. However, because the number of thus available data points was only small (n = 12), we also calculated it from the mixed-layer air-sea exchange flux terms, i.e., using Ra = Fa(17O)–Fa(O2/Ar), because–as described above–the Fa terms dominated both G(17O) and N(O2/Ar). Both methods gave similar weak positive linear relationships with temperature (Figure 5): R = (63 ± 40) ϑ/°C–(5.2 ± 5.7) × 103 (n = 12; r2 = 0.20; p = 0.15) and Ra = (58 ± 20) ϑ/°C–(4.5 ± 2.7) × 103 (n = 86; r2 = 0.10; p = 0.004).
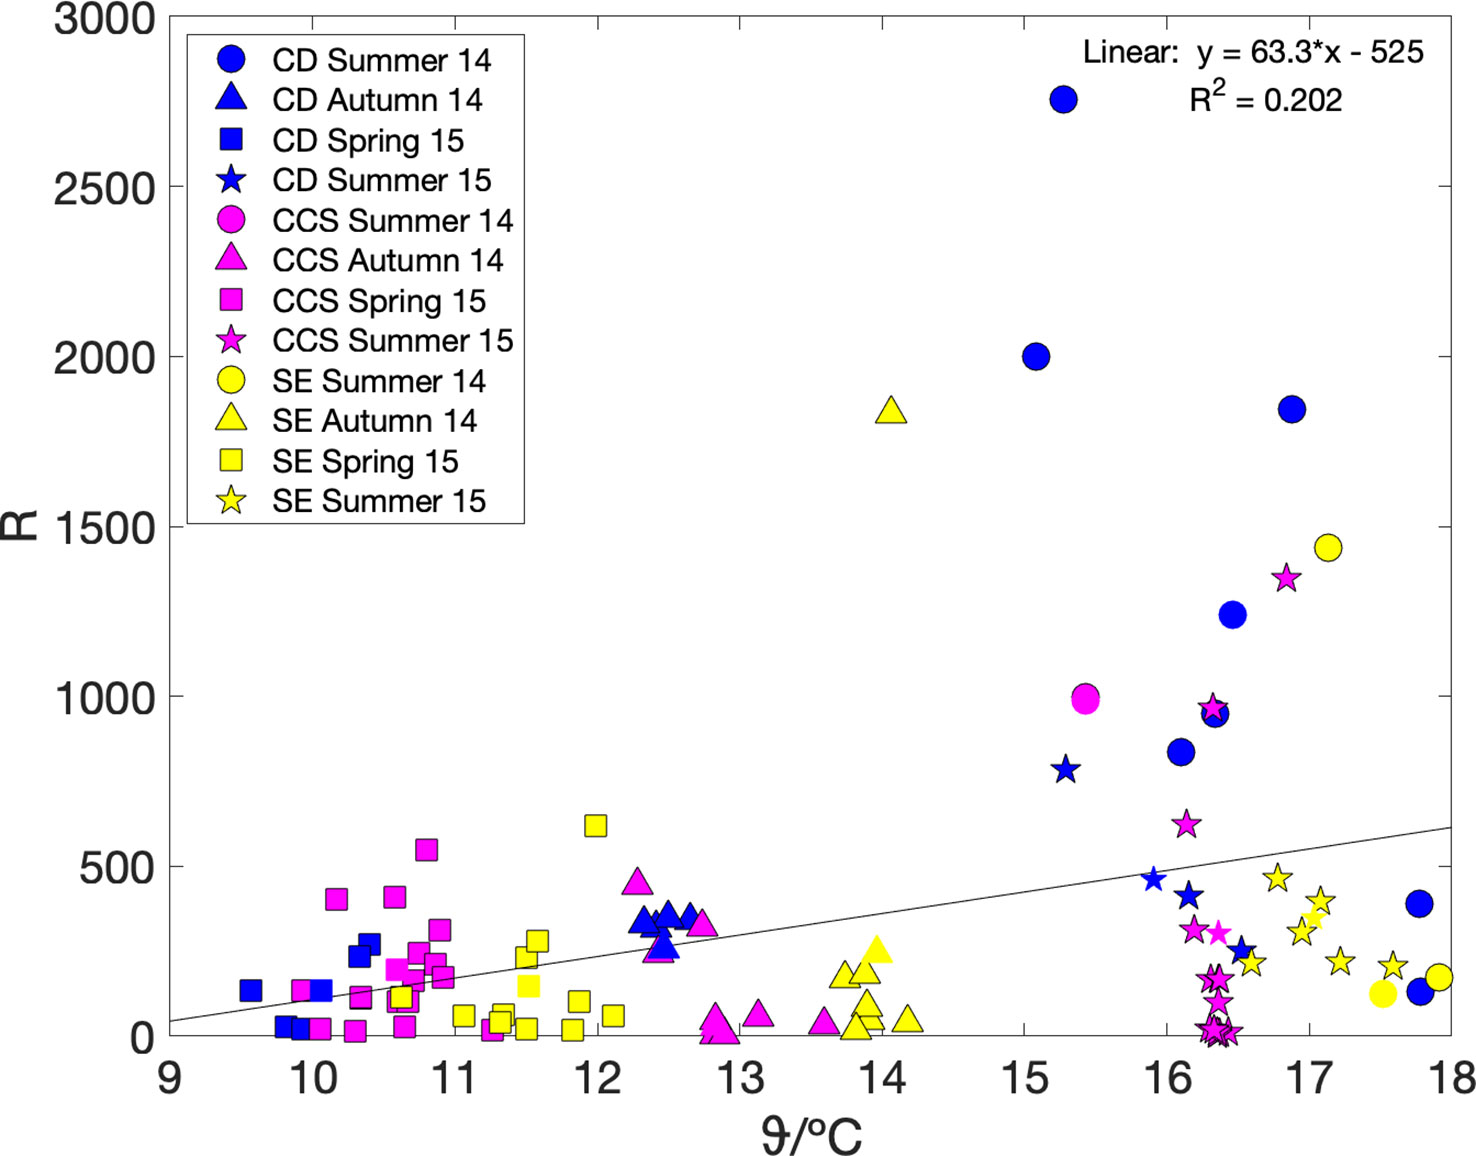
Figure 5 Regionally aggregated community respiration R = G(17O)–N(O2/Ar) (coloured symbols) and R estimated from air-sea fluxes only Ra = Fa(17O)–Fa(O2/Ar) (coloured symbols with black edge), plotted versus sea surface temperature. Colours and shapes are as in Figure 3. A linear fit to the regionally aggregated R values gives R = (63 ± 40) ϑ/°C–(5.2 ± 5.7) × 103.
Discussion
Instantaneous signal of biological production in the water column
From the Δ(O2/Ar) and 17Δ depth profiles, it is possible to get semi-quantitative diagnostic information about the biogeochemical processes occurring in the euphotic zone. In autumn, the water column was not fully mixed yet during the sampling time, but less stratified than in summer. The water column gets fully mixed in winter (Sharples et al., 2013). The 17Δ increase with depth in the autumn profile suggests ventilation bringing the 17Δ signal closer to the equilibrium value with air (Luz and Barkan, 2000). At the same time, 17Δ below the mixed layer is higher than at the surface because of the absence of air-sea gas exchange and the gross production signal, typically formed in the deep chlorophyll maximum during summer, remaining “trapped” below the mixed layer (Supplementary Material 1). This gross production in deeper layers is possible when the euphotic zone is deep enough to permit photosynthesis (e.g., nutrient-replete below the mixed layer and within the euphotic zone) (Supplementary Material 2). Δ(O2/Ar) tells us how much of this biological oxygen remains in the water column after respiration. In autumn, negative values of Δ(O2/Ar) means that respiration is greater than production, and therefore showing heterotrophic conditions. The effect of respiration increases with depth because of the absence of surface ventilation and decreasing photosynthesis due to decreasing PAR. Therefore, Δ(O2/Ar)< 0 in the autumn water column may indicate net heterotrophy due to the decrease in photosynthesis but also due to mixing with cooler low-O2 deep waters from outside the shelf (Sharples et al., 2013; Humphreys et al., 2019) that can also reduce Δ(O2/Ar).
In spring, the water column is stratified, due to solar surface irradiance and weakening of wind stress. The spring bloom showed the highest surface 17Δ values. The 17Δ increase is the result of accumulating gross production signal due to winter nutrients that permit optimum conditions for the bloom. These can also be seen in the positive Δ(O2/Ar) values that decrease as expected with depth due to decreasing PAR.
A subsurface chlorophyll a (Chl a) concentration maximum (45 ± 5 m), or deep chlorophyll maximum (DCM), below the mixed layer (30 ± 10 m) was detected by the CTD fluorometer (Supplementary Material 1) and associated with the maximum 17Δ biological signal in summer. Surface (0–20 m) and deep (60–90 m) 17Δ values are of similar magnitude, only slightly lower in the surface due to ventilation (Wilhelm et al., 2004). Interestingly, respiration, calculated as G(17O)–N(O2/Ar), was stronger in summer than in spring or even autumn, especially in the deeper layer. This was also found by Haskell et al. (2017) at the beginning of summer in the Southern California Bight, another coastal area. Δ(O2/Ar) in summer was lower than in spring but still > 0 for much of the water column and< 0 below the DCM.
Seasonal and interannual production rate patterns and export
Gross production and net community production were both dominated by the air-sea exchange fluxes. While the other budget terms can quantitatively alter the calculated production rates, the general seasonal patterns seen in surface 17Δ and Δ(O2/Ar) are conserved well. Including budget terms other than Fa(O2/Ar) and Fa(17O) can make the calculations more accurate but reduces the spatial resolution (e.g., when calculating Fnss from a revisited station). However, when logistically possible, (e.g., revisiting the same station two times or doing sampling from parallel platforms), biological production should include the whole euphotic zone when it is deeper than the mixed layer depth and account for vertical diapycnal diffusion, entrainment and non-steady state changes.
Additional uncertainty in the calculation of production comes from the lack of our ability to account for horizontal advection and current velocity. Again, this could be overcome by sampling from multiple platforms to estimate horizontal gradients and the use of mooring data to estimate mean advection velocities. Negative Fe(17O), Fnss(17O), and Fbml(17O) mainly in the autumn season highlight the entrainment of different deep-water mass. Such negative values were also found by Haskell et al. (2017). In Haskell’s study, the main reason for these negative values was entrainment, mixing and non-steady state transient changes over time. For the present study there are two plausible effects: 1) the influence of different water masses and 2) bias during sampling. The first hypothesis agrees with Haskell et al. (2017) as we also found entrainment of low-Δ(17O) waters during autumn and summer. The second hypothesis applies specially to the summer sampling. The calculation of gross production below the mixed layer is challenging because, while any sample within the mixed layer should have the same Δ(17O) value, samples taken below the mixed layer do not. A gradual decrease in Chl a and oxygen concentrations from just below the mixed layer depth is normally seen in winter and spring profiles, but not in summer when a peak in Chl a and oxygen below the mixed layer was found. This peak is not always constant with time and depth and can be only one or two meters thick. Discrete samples taken from 20 L-Niskin bottles collect water from a specific depth but at a resolution of about 2 m. That means that a high photosynthetic isotopic signal from thin layers may be missed by taking samples just one meter below the peak and therefore the measured values would be “diluted” by a low photosynthetic signal during the sampling process. These samples would still have a 17Δ value above equilibrium, but because the numerical methods used to calculate non-steady state terms, it can result in negative flux. For example, when calculating d17Δ/dt, if the first sample is taken at the subsurface maximum and the second sample has a lower value (but still > 0), the result will be a negative non-steady state term. In the case of entrainment, this is explained by a low 17Δ value diluting the mixed layer.
Looking at the Fa(17O) in different seasons and regions, we can say that the steady state assumption could be valid mainly in spring and summer but not in autumn, where Fa(17O) is overestimated by 40% for CD and SE, and six times higher for CCS. Similarly, Fa(O2/Ar) is a relatively good approximation of N(O2/Ar) if errors up to 20% are accepted, except for autumn when the other flux terms must also be considered.
A few studies have measured biological production in the Celtic Sea, which we have converted to O2 equivalents here as per Seguro et al. (2019): Values ranged from 38 to 2400 mmol m–2 d–1 for gross production and 11-760 mmol m–2 d–1 for production using 14C, 13C, 18O, O2 incubation methods and FRRF as in situ technique (Joint et al., 1986; Rees et al., 1999; Joint et al., 2001; Robinson et al., 2009; Hickman et al., 2012; Poulton et al., 2014). However, there were often methodological differences (e.g., the inclusion of heterotrophs or not, in situ vs incubation) and uncertainties from converting to O2 equivalents make comparisons difficult (Juranek and Quay, 2013). Moreover, Robinson et al. (2009) made an exhaustive comparison of eight biological production estimation methods and found great discrepancies between them.
As far as we are aware, the only other publication on G(17O) and N(O2/Ar) measurements in the Celtic Sea is our own study (Seguro et al., 2019), which did not include the Fnss(17O) term of changes between seasons.
High-frequency underway observations of Δ(O2/Ar) allowed us to see the heterogeneity of surface biological production during three different seasons and interannually for two summers. The two summers showed similar spatial patterns, with generally autotrophic conditions, but also values close to zero between 49.5° N and 51° N and even more consumption than oxygen production in the English Channel east of 4° W. Although the summer spatial patterns are similar in both years, Δ(O2/Ar) in 2015 was half that of 2014. This is reflected in the mean N(O2/Ar) value and in G(17O), which is half in summer 2015 than 2014.
Net community production during the summer season is lower (42 mmol m–2 d–1 in 2014 and 29 mmol m–2 d–1 in 2015) than found in a previous study from 2011 in the Celtic Sea (63 to 180 mmol m–2 d–1) (Poulton et al., 2014).
On the other hand, our G(17O) is one order of magnitude higher (825 mmol m–2 d–1 in 2014 and 401 mmol m–2 d–1 in 2015) than 14C-based primary production measured in 2003 and 2005 (Hickman et al., 2012) (38 to 88 mmol m–2 d–1) for the summer season. These differences could be due to discrepancies between methods, since the 14C methods provides rates closer to net primary production (including autotrophic respiration), compared with G(17O), which includes any water-splitting, O2-producing reaction. Clearly, interannual variability is also likely playing a role in causing these differences, e.g., in previous studies SST was (13.0 ± 0.5) °C, while it was (16.5 ± 0.5) °C for summer 2014 and 2015.
Parallel study estimated air-sea CO2 fluxes at the CCS site during the spring bloom, they converted their data into oxygen net community production using photosynthetic quotient 1.4 and the values agreed well (Humphreys et al., 2019). Although we do not have winter data, our results follow the same pattern as the parallel CO2 study that suggests the area of study is a net sink of atmospheric CO2.
Interestingly, the metabolic efficiency of f(O2) does not differ much between the two summers in 2014 and 2015. Considering the whole Celtic Sea, this means that although gross production may change between years, planktonic respiration adjusts accordingly and therefore the efficiency of the system is similar, but importantly not the absolute organic carbon export flux (or at least the potential for it). In contrast, autumn showed negative f values, indicating that O2 accumulated during summer was respired, and therefore there was no carbon available for export since organic matter was remineralised in the mixed layer. Spring had the highest f(O2) values, likely due to winter nutrient availability that permit optimum photosynthesis conditions.
Linear relationships between temperature and export production (Laws et al., 2000) as well as on respiration (Vázquez-Domínguez et al., 2007) has been previously investigated. We found a linear relationship between f(O2) and temperature that may provide a useful predictor for carbon export in this temperate shelf sea based on temperature only. Although our parameterisation may only apply to the Celtic Sea (e.g., nutrient availability in the area may be typically linked to seasonal temperature), other studies have found similar negative dependences of f on temperature, e.g., –0.05 °C–1 in a temperate coastal upwelling off the coast California (Haskell et al., 2017). Based on our results, an increase of sea surface temperature by 1°C would reduce export to deep waters by 2%. This suggests that future increases in temperature could cause a reduction in annual net carbon export. Although further observations would be needed to make this parameterisation more robust, these first findings may have major implications on our understanding on how shelf seas may change the efficiency of carbon export due to ocean warming.
The weak positive relationship between respiration and temperature we found for the Celtic Sea can hardly be called statistically significant, but qualitatively agrees with the Mediterranean Sea study of Vázquez-Domínguez et al. (2007). However, the effect of temperature alone in marine systems is complex and may not fully explain marine metabolism (Lawrence and William, 2001). Since different seas may have completely different community taxonomy, physical conditions and nutrient status, a single model to predict respiration rate change solely from temperature does not seem to be adequate. However, several studies showing relationships between temperature and export or respiration may help to predict the effect of local ocean warming.
Conclusions
During the UK NERC Shelf-Sea Biogeochemistry Programme in 2014–15, spring and summer in the Celtic Sea were net autotrophic, while autumn was net heterotrophic. Although the sampling programme did not cover the whole year, the variability between seasons was well characterised, the two summer seasons showed similar production rates, plus the magnitude of the values measured suggests that the Celtic Sea is a net autotrophic system on an annual basis.
The number of samples and therefore the spatial resolution were reduced when including budget terms other than air-sea exchange fluxes in the calculations. Air-sea exchange fluxes (Fa) alone can deviate by up to six times from estimates that cover the whole of the euphotic zone and account for non-steady state inventory changes, entrainment, and vertical eddy diffusion, depending on season and conditions. This highlights the need for high-resolution measurements in dynamic regions such as the Celtic Sea. Reducing the sampling protocol to snapshots may bias the biological production estimates in shelf seas. On the flip side, more comprehensive calculation frameworks entail higher overall uncertainty and widen the confidence intervals for the final values. Nevertheless, seasonal variability in respiration and metabolic efficiency are consistent regardless of the calculation used. After all, net community production is highest in spring and gross production is highest in summer. The whole Celtic Sea is net autotrophic during spring and summer, but in general decreases towards the outer shelf. The Celtic Sea shifts to net heterotrophic in autumn and shows higher respiration during summer. Hence, this study characterised the seasonal biological net and gross production rates, highlighting the importance of high-resolution measurements and showed that the biological pump helps support the Celtic Sea being a net carbon sink. Further studies in the Celtic Sea would benefit from similar temporal and spatial data coverage, to accurately understand the rates and efficiency of carbon export for the whole shelf and how global climate change may affect them.
Data availability statement
The datasets presented in this study have been deposited with the British Oceanography Data Centre (BODC) and can be found under https://doi.org/10.5285/fab73b69-21b9-5ae8-e053-6c86abc0960c.
Author contributions
IS, AM, JS, and JK designed the study and fieldwork. IS carried out the fieldwork and IS, AM, and JK the laboratory analyses. IS, JS, and JK contributed to processing the data. All authors contributed to the article and approved the submitted version.
Funding
IS was funded by UK Natural Environment Research Council (NERC) grant no. NE/L000172/1 and a Cefas CASE studentship. JS was supported by NERC grant nos. NE/K002058/1 and NE/K002511/1. JK was supported by NERC grant no. NE/K002473/1.
Acknowledgments
This work contains data supplied by NERC, for which Jo Hopkins and Charlotte Williams (National Oceanography Centre, Liverpool) are data originators. The data are available under NERC Open Government License (https://www.bodc.ac.uk/data/bodc_database/nodb/project/17041/). CCMP V2.0 wind speeds were obtained from Remote Sensing Systems (https://www.remss.com/measurements/ccmp; accessed 3 May 2022). The support of crew and scientists during research cruises DY026, DY018, DY029 and DY033 is gratefully acknowledged. Maps were generated using M_Map toolbox of Rich Pawlowicz (https://www.eoas.ubc.ca/~rich/map.html).
Conflict of interest
The authors declare that the research was conducted in the absence of any commercial or financial relationships that could be construed as a potential conflict of interest.
Publisher’s note
All claims expressed in this article are solely those of the authors and do not necessarily represent those of their affiliated organizations, or those of the publisher, the editors and the reviewers. Any product that may be evaluated in this article, or claim that may be made by its manufacturer, is not guaranteed or endorsed by the publisher.
Supplementary material
The Supplementary Material for this article can be found online at: https://www.frontiersin.org/articles/10.3389/fmars.2023.1037470/full#supplementary-material
References
Bauer J. E., Cai W.-J., Raymond P. A., Bianchi T. S., Hopkinson C. S., Regnier P. A. G. (2013). The changing carbon cycle of the coastal ocean. Nature 504, 61–70. doi: 10.1038/nature12857
Benson B. B., Krause D. (1984). The concentration and isotopic fractionation of oxygen dissolved in fresh water and seawater in equilibrium with the atmosphere. Limnol. Oceanogr. 29, 620–632. doi: 10.4319/lo.1984.29.3.0620
Bopp L., Le Quéré C. (2013). “Ocean carbon cycle,” In Le Quéré C., Saltzman E. S. eds. Surface ocean–lower atmosphere processes. doi: 10.1029/2008GM000780
Brown J., Carrillo L., Fernand L., Horsburgh K. J., Hill A. E., Young E. F., et al. (2003). Observations of the physical structure and seasonal jet-like circulation of the celtic Sea and st. george's channel of the Irish Sea. Continental Shelf Res. 23, 533–561. doi: 10.1016/S0278-4343(03)00008-6
Castro-Morales K., Cassar N., Shoosmith D. R., Kaiser J. (2013). Biological production in the bellingshausen Sea from oxygen-to-argon ratios and oxygen triple isotopes. Biogeosciences 10, 2273–2291. doi: 10.5194/bg-10-2273-2013
Craig H., Hayward T. (1987). Oxygen supersaturation in the ocean: biological versus physical contributions. Science 235, 202–205. doi: 10.1126/science.235.4785.199
Culberson C. H. (1991). Dissolved oxygen, in WOCE Operations Manual - Part 3.1.3: WHP Operations and Methods. WHP Office Report WHPO 91-1. WOCE Report No. 68/91. Revision 1, edited, Woods Hole. Massachusetts, USA.
Cullen J. J. (2001). Primary production methods. InEncyclopedia of Ocean Sciences Halifax: Academic Press 4, 2277–2284. doi: 10.1006/rwos.2001.0203
Emerson S., Quay P. D., Stump C., Wilbur D., Schudlich R. (1995). Chemical tracers of productivity and respiration in the subtropical pacific ocean. J. Geophys. Res. 100, 15873. doi: 10.1029/95JC01333
García H. E., Gordon L. I. (1992). Oxygen solubility in seawater: better fitting equations. Limnol. Oceanogr. 37, 1307–1312. doi: 10.4319/lo.1992.37.6.1307
Hamme R. C., Emerson S. R. (2004). The solubility of neon, nitrogen and argon in distilled water and seawater. Deep Sea Res. Part I: Oceanogr. Res. Pap. 51, 1517–1528. doi: 10.1016/j.dsr.2004.06.009
Haskell W. Z., Prokopenko M. G., Hammond D. E., Stanley R. H. R., Sandwith Z. O. (2017). Annual cyclicity in export efficiency in the inner southern California bight. Global Biogeochem. Cycles 31, 357–376. doi: 10.1002/2016GB005561
Henson S., Cole H., Beaulieu C., Yool A. (2013). The impact of global warming on seasonality of ocean primary production. Biogeosciences 10, 4357–4369. doi: 10.5194/bg-10-4357-2013
Hickman A. E., Moore C. M., Sharples J., Lucas M. I., Tilstone G. H., Krivtsov V., et al. (2012). Primary production and nitrate uptake within the seasonal thermocline of a stratified shelf sea. Mar. Ecol. Prog. Ser. 463, 39–57. doi: 10.3354/meps09836
Holley S. E., Hydes D. J. (1995). Procedure for the determination of dissolved oxygen in seawater. James Rennell Centre Ocean Circulation Internal Document 20, 38.
Holligan P., Leb W. P., Purdie D., Harris R. (1984). Photosynthesis, respiration and nitrogen supply of plankton populations in stratified, frontal and tidally mixed shelf waters. Mar. ecol. Prog. Ser. 17, 201–213. doi: 10.3354/meps017201
Holt J. T., James I. D., Jones J. E. (2001). An s coordinate density evolving model of the northwest European continental shelf: 2. seasonal currents and tides. J. Geophys. Res.: Oceans 106, 14035–14053. doi: 10.1029/2000JC000304
Humphreys M. P., Achterberg E. P., Hopkins J. E., Chowdhury M. Z. H., Griffiths A. M., Hartman S. E., et al. (2019). Mechanisms for a nutrient-conserving carbon pump in a seasonally stratified, temperate continental shelf sea. Prog. Oceanogr. 177, 101961. doi: 10.1016/j.pocean.2018.05.001
IPCC (2021). Climate change 2021: the physical science basis. contribution of working group I to the sixth assessment report of the intergovernmental panel on climate change. Eds. Masson-Delmotte V. ,. P., Zhai A., Pirani S. L., Connors C., Péan S., Berger N., Caud Y., Chen L., Goldfarb M. I., Gomis M., Huang K., Leitzell E., Lonnoy J. B. R., Matthews T. K., Maycock T., Waterfield O., Yelekçi R., Yu, Zhou B. (Cambridge, United Kingdom and New York, NY, USA: Cambridge University Press).
Joint I., Groom S. B. (2000). Estimation of phytoplankton production from space: current status and future potential of satellite remote sensing. J. Exp. Mar. Biol. Ecol. 250, 233–255. doi: 10.1016/S0022-0981(00)00199-4
Joint I. R., Owens N. J. P., Pomroy A. J. (1986). Seasonal production of photosynthetic picoplankton and nanoplankton in the celtic Sea. Mar. Ecol. Prog. Ser. 28, 251–258. doi: 10.3354/meps028251
Joint I. R., Pomroy A. J. (1983). Production of picoplankton and small nanoplankton in the celtic Sea. Mar. Biol. 77, 19–27. doi: 10.1007/BF00393206
Joint I., Wollast R., Chou L., Batten S., Elskens M., Edwards E., et al. (2001). Pelagic production at the celtic Sea shelf break. Deep Sea Res. Part II: Topical Stud. Oceanogr. 48, 3049–3081. doi: 10.1016/S0967-0645(01)00032-7
Juranek L. W., Quay P. D. (2013). Using triple isotopes of dissolved oxygen to evaluate global marine productivity. Annu. Rev. Mar. Sci. 5, 503–524. doi: 10.1146/annurev-marine-121211-172430
Kaiser J. (2011a). Corrigendum to "Technical note: consistent calculation of aquatic gross production from oxygen triple isotope measurements" published in biogeosciences, 8, 1793–1811, 2011. Biogeosciences 8, 2561–2565. doi: 10.5194/bg-8-1793-2011
Kaiser J. (2011b). Technical note: consistent calculation of aquatic gross production from oxygen triple isotope measurements. Biogeosciences 8, 1793–1811.
Kaiser J., Abe O. (2012). Reply to nicholson's comment on "Consistent calculation of aquatic gross production from oxygen triple isotope measurements" by kaiser, 2011). Biogeosciences 9, 2921–2933. doi: 10.5194/bg-9-2921-2012
Kaiser J., Reuer M. K., Barnett B., Bender M. L. (2005). Marine productivity estimates from continuous O2/Ar ratio measurements by membrane inlet mass spectrometry. Geophys. Res. Lett. 32, L19605. doi: 10.1029/2005GL023459
Knox M., Quay P. D., Wilbur D. (1992). Kinetic isotopic fractionation during air-water gas transfer of O2, N2, CH4, and H2. J. Geophys. Res. 97, 20335. doi: 10.1029/92JC00949
Landschützer P., Gruber N., Bakker D. C. E., Stemmler I., Six K. D. (2018). Strengthening seasonal marine CO2 variations due to increasing atmospheric CO2. Nat. Climate Change 8, 146–150. doi: 10.1038/s41558-017-0057-x
Lawrence R. P., William J. W. (2001). Temperature and substrates as interactive limiting factors for marine heterotrophic bacteria. Aquat. Microbial. Ecol. 23, 187–204. doi: 10.3354/ame023187
Laws E. A. (1991). Photosynthetic quotients, new production and net community production in the open ocean. Deep Sea Res. Part A. Oceanogr. Res. Pap. 38, 143–167. doi: 10.1016/0198-0149(91)90059-O
Laws E. A., Falkowski P. G., Smith W. O., Ducklow H., Mccarthy J. J. (2000). Temperature effects on export production in the open ocean. Global Biogeochem. Cycles 14, 1231–1246. doi: 10.1029/1999GB001229
Luz B., Barkan E. (2000). Assessment of oceanic productivity with the triple-isotope composition of dissolved oxygen. Science 288, 2028–2031. doi: 10.1126/science.288.5473.2028
Luz B., Barkan E. (2005). The isotopic ratios 17O/16O and 18O/16O in molecular oxygen and their significance in biogeochemistry. Geochim. Cosmochim. Acta 69, 1099–1110. doi: 10.1016/j.gca.2004.09.001
Luz B., Barkan E. (2009). Net and gross oxygen production from O2/Ar, 17O/16O and 18O/16O ratios. Aquat. Microbial. Ecol. 56, 133–145. doi: 10.3354/ame01296
Marra J. (2002). Approaches to the measurement of plankton production. In Williams P. J. L. B., Thomas D. N., Reynolds C. S. eds. Phytoplankton Productivity, 78–108. doi: 10.1002/9780470995204.ch4
Marra J. (2009). Net and gross productivity: weighing in with 14C. Aquat. Microbial. Ecol. 56, 123–131. doi: 10.3354/ame01306
Neumann B., Vafeidis A. T., Zimmermann J., Nicholls R. J. (2015). Future coastal population growth and exposure to sea-level rise and coastal flooding–a global assessment. PloS One 10, e0118571. doi: 10.1371/journal.pone.0118571
Nightingale P. D., Malin G., Law C. S., Watson A. J., Liss P. S., Liddicoat M. I., et al. (2000). In situ Evaluation of air-sea gas exchange parameterizations using novel conservative and volatile tracers. Global Biogeochem. Cycles 14, 373–387. doi: 10.1029/1999GB900091
Osborn T. R. (1980). Estimates of the local rate of vertical diffusion from dissipation measurements. J. Phys. Oceanogr. 10, 83–89. doi: 10.1175/1520-0485(1980)010<0083:EOTLRO>2.0.CO;2
Painting S. J, Collingridge K. A., Durand D., Grémare A., Créach V., Arvanitidis C., et al (2020). Marine monitoring in Europe: is it adequate to address environmental threats and pressures? Ocean Science 16, 235–252. doi: 10.5194/os-16-235-2020
Palmer M. R., Inall M. E., Sharples J. (2013). The physical oceanography of Jones bank: a mixing hotspot in the celtic Sea. Prog. Oceanogr. 117, 9–24. doi: 10.1016/j.pocean.2013.06.009
Pingree R. D., Le Cann B. (1989). Celtic and armorican slope and shelf residual currents. Prog. Oceanogr. 23, 303–338. doi: 10.1016/0079-6611(89)90003-7
Poulton A. J., Stinchcombe M. C., Achterberg E. P., Bakker D. C. E., Dumousseaud C., Lawson H. E., et al. (2014). Coccolithophores on the north-west European shelf: calcification rates and environmental controls. Biogeosciences 11, 3919–3940. doi: 10.5194/bg-11-3919-2014
Rees A. P., Joint I., Donald K. M. (1999). Early spring bloom phytoplankton-nutrient dynamics at the celtic Sea shelf edge. Deep Sea Res. Part I: Oceanogr. Res. Pap. 46, 483–510. doi: 10.1016/S0967-0637(98)00073-9
Robinson C., Tilstone G. H., Rees A. P., Smyth T. J., Fishwick J. R., Tarran G. A., et al. (2009). Comparison of in vitro and in situ plankton production determinations. Aquat. Microbial. Ecol. 54, 13–34. doi: 10.3354/ame01250
Seguro I., García C. M., Papaspyrou S., Gálvez J. A., García-Robledo E., Navarro G., et al (2015). Seasonal changes of the microplankton community along a tropical estuary. Regional Stud. Mar. Sci. 2, 189–202. doi: 10.1016/j.rsma.2015.10.006
Seguro I., Marca A. D., Painting S. J., Shutler J. D., Suggett D. J., Kaiser J. (2019). High-resolution net and gross biological production during a celtic Sea spring bloom. Prog. Oceanogr. 177, 101885. doi: 10.1016/j.pocean.2017.12.003
Sharples J., Ellis J. R., Nolan G., Scott B. E. (2013). Fishing and the oceanography of a stratified shelf sea. Prog. Oceanogr. 117, 130–139. doi: 10.1016/j.pocean.2013.06.014
Sharples J., Moore C. M., Hickman A. E., Holligan P. M., Tweddle J. F., Palmer M. R., et al. (2009). Internal tidal mixing as a control on continental margin ecosystems. Geophys. Res. Lett. 36, L23603. doi: 10.1029/2009GL040683
Simpson J. H., Sharples J. (2012). Introduction to the physical and biological oceanography of shelf seas (Cambridge: Cambridge University Press). doi: 10.1017/CBO9781139034098
Thiemens M. H., Jackson T., Zipf E. C., Erdman P. W., Van Egmond C. (1995). Carbon dioxide and oxygen isotope anomalies in the mesosphere and stratosphere. Science 270, 969–972. doi: 10.1126/science.270.5238.969
Vázquez-Domínguez E., Vaqué D., Gasol J. M. (2007). Ocean warming enhances respiration and carbon demand of coastal microbial plankton. Global Change Biol. 13, 1327–1334. doi: 10.1111/j.1365-2486.2007.01377.x
Keywords: net community production, gross production, O2/Ar, oxygen triple isotopes, shelf seas, seasonality, biological carbon pump
Citation: Seguro I, Marca AD, Shutler JD and Kaiser J (2023) Different flavours of oxygen help quantify seasonal variations of the biological carbon pump in the Celtic Sea. Front. Mar. Sci. 10:1037470. doi: 10.3389/fmars.2023.1037470
Received: 05 September 2022; Accepted: 06 April 2023;
Published: 30 May 2023.
Edited by:
Gilles Reverdin, Centre National de la Recherche Scientifique (CNRS), FranceReviewed by:
John Patrick Dunne, Princeton University, United StatesOsamu Abe, Nagoya University, Japan
Copyright © 2023 Seguro, Marca, Shutler and Kaiser. This is an open-access article distributed under the terms of the Creative Commons Attribution License (CC BY). The use, distribution or reproduction in other forums is permitted, provided the original author(s) and the copyright owner(s) are credited and that the original publication in this journal is cited, in accordance with accepted academic practice. No use, distribution or reproduction is permitted which does not comply with these terms.
*Correspondence: Isabel Seguro, SS5TZWd1cm8tUmVxdWVqb0B1ZWEuYWMudWs=