 Hugo Dayan
 Ronan McAdam
 Mélanie Juza
 Simona Masina
 Sabrina Speich
- 1Laboratoire de Météorologie Dynamique (LMD), Institut Pierre-Simon Laplace (IPSL), Université Paris Sciences et Lettres (PSL) - Ecole Normale Supérieure, Paris, France
- 2Ocean Modeling and Data Assimilation Division, Fondazione Centro Euro-Mediterraneo sui Cambiamenti Climatici - CMCC, Bologna, Italy
- 3Balearic Islands Coastal Observing and Forecasting System (SOCIB), Palma, Spain
In the Mediterranean Sea, marine ecosystems and the resource-based economy are shared among many countries, making this a regional sea of important geopolitical and economic stakes. Over the last decades, marine heat waves (MHWs) in the Mediterranean Sea have caused mass-mortality events in various marine species and critical losses for seafood industries. MHWs are expected to become more intense, longer and more frequent through anthropogenic warming. This study proposes to better understand how much each Mediterranean country’s Exclusive Economic Zone (EEZ) waters may be affected by MHW changes, to contribute to decision support for management and adaptation at national scale. The variability of surface and subsurface MHWs is assessed over the 1987-2019 period in the Mediterranean EEZs, which are ocean areas where sovereign states have special rights. Combining high-resolution satellite observations and a regional reanalysis, sea surface temperature and ocean heat content are used to define surface and subsurface MHWs. The MHW characteristics selected in this study highlight the important differences between surface and subsurface extreme events. MHW frequency is higher at the surface than in the subsurface and has significantly increased in most EEZs both at the surface and in the subsurface, while MHW duration is longer in the subsurface than at the surface in all EEZs. MHW intensities decrease with depth, while its increase over time is more disparate throughout the basin. MHW maximum intensity displays significant positive trends with higher surface values in the western Mediterranean Sea, while in the subsurface it reaches its extreme values in the EEZs of the Levantine basin. In contrast, MHW cumulative intensity exhibits its extreme trend values in the eastern Mediterranean Sea both at the surface and in the subsurface. The choice of a “Top-Ten” list of EEZs shows that the impact to EEZs is different depending on the MHW characteristics and the depth, emphasizing the need to consider all MHW characteristics and to avoid focusing only on the surface. Overall, the results highlight the necessity of strengthening surface and subsurface observing systems in most national waters to better establish local-scale risk assessments and to respond to diverse stakeholder needs.
1 Introduction
Spanning approximately 2.5 million km2 between Europe, Northern Africa, and Southwestern Asia, the Mediterranean Sea covers only 0.82% of the ocean surface and represents only 0.32% of the volume of the global ocean (Defant, 1961), and is connected to it by the narrow and shallow Strait of Gibraltar. Despite its relatively small size, the Mediterranean Sea hosts more than 17 000 marine species (between 4% and 18% of the world’s marine species) (Coll et al., 2010), 20-30% of which are endemic (the highest rate of endemism in the world)1, making the Mediterranean Sea one of the main reservoirs of marine biodiversity (Bianchi and Morri, 2000). In particular, extremely important resident and transient populations of top pelagic predators, such as dolphins, whales, tuna and swordfish, are hosted by this small-scale ocean (Würtz, 2010).
This regional sea is also the seat of important geopolitical and economic stakes, as it is surrounded by twenty-one sovereign countries from three continents which share marine ecosystems and an economy based on natural resources (Sacchi, 2011). Due to its geographical location, limited size and semi-enclosed nature, the Mediterranean Sea is very sensitive and reacts quickly to anthropogenic influences; overexploitation (Tsikliras et al., 2013; Vasilakopoulos et al., 2014), pollution (Danovaro, 2003), increasing urbanization (Elmqvist et al., 2013), population growth (Benoit and Comeau, 2005) and climate change (Gambaiani et al., 2009; Navarra and Tubiana, 2013; Guiot and Cramer, 2016) are putting exceptional pressure on the Mediterranean Sea environment, ecosystems, services and resources (Liquete et al., 2016; Martín-López et al., 2016). Moreover, both the northern and southern Mediterranean regions are marked by socio-economic, political and religious disparities which may significantly influence the future development and management of the Mediterranean ecosystem (Würtz, 2010).
In the context of global warming, the average sea surface temperature (SST) in the Mediterranean Sea has risen at a rate of 0.041 ± 0.006 °C/year over 1982-2018 (Pisano et al., 2020), approximately 0.037 ± 0.003°C/year over 1993-2019 (Von Schuckmann et al., 2020) and 0.038 ± 0.002°C/year over 1982-2020 (Juza and Tintoré, 2021), corresponding to about three times the global ocean warming rate over the four last decades (IPCC, 2021), with a high spatial variability of trend estimations (Juza and Tintoré, 2021; Ibrahim et al., 2021). The vertically integrated ocean heat content (OHC) is a well-suited indicator for assessing global warming (Hansen et al., 2011; Von Schuckmann et al., 2016; Trenberth et al., 2018), as it corresponds to the energy absorbed by the ocean and stored as internal energy for an indefinite time period. Over the 2005-2020 period, the OHC in the upper 700 m of the Mediterranean Sea increased by 3.59 ± 1.02 Wm-2 (corresponding to a warming trend of 0.041 ± 0.012°C/year) (Kubin et al., 2022). Considering a longer period (1993-2018), the trend, as estimated by a regional reanalysis, is 1.5 ± 0.2 Wm-2 (Escudier et al., 2020), which implies an acceleration of subsurface warming in the past decade. Showing greater signal-to-noise ratio and lower natural variability than SST (Wijffels et al., 2016; Cheng et al., 2018a; Cheng et al., 2018b), OHC is better suited to detecting and attributing human influences than SST. Overall, the Mediterranean Sea is one of the world’s largest and most vulnerable climate change “hot spots” (Giorgi, 2006; Lionello, 2012; Cramer et al., 2018). Among the physical impacts of this context-specific warming, Diffenbaugh et al. (2007) showed that the occurrence of hot extremes increased by 200–500% in the whole basin. By the end of the 21st century, the Mediterranean Sea is projected to be warmer and dryer (Giorgi and Lionello, 2008; Mariotti et al., 2008; IPCC, 2021). Under this warming, biological organisms will deplete to a greater or lesser extent depending on the specific-species heat tolerance - differing substantially from one species to another - and their capacity to adapt outside their tolerance limits.
Since the beginning of the 21st century, the particularly rapid warming trend of the Mediterranean Sea surface has been associated with a strong increase in marine heatwaves (MHWs) (Bensoussan et al., 2019; Ibrahim et al., 2021; Juza and Tintoré, 2021; Juza et al., 2022; Pastor and Khodayar, 2022). MHWs are defined as prolonged periods of anomalously warm ocean temperature (Hobday et al., 2016), and have been the focus of growing attention over the last two decades because of their impact on the oceans as a whole (IPCC, 2014; Frölicher et al., 2018; Oliver et al., 2018; IPCC, 2021; Oliver et al., 2021). Across the global ocean, MHWs have disastrous effects on marine species (Smale et al., 2019; Bensoussan et al., 2019; Turner et al., 2020; Smith et al., 2022), habitats such as seagrass meadows (Arias-Ortiz et al., 2018), kelp forests (Wernberg, 2021), coral reef (Hughes et al., 2018; Asner et al., 2022) and human societies (Oliver et al., 2018; Smith et al., 2022; IPCC, 2022). In the past, the Mediterranean Sea experienced several MHWs which caused economic and ecological damage, such as critical losses of seafood products and mass mortality events, such as in the summer of 1999 (Perez et al., 2000; Cerrano et al., 2000; Garrabou et al., 2001; Linares et al., 2005) and in the summer of 2003 (Schiaparelli et al., 2007; Diaz-Almela et al., 2007; Garrabou et al., 2009; Munari, 2011).
MHWs are not exclusively confined to the sea surface (Galli et al., 2017; Schaeffer and Roughan, 2017; Darmaraki et al., 2019b; Garrabou et al., 2022), but can also propagate deeper into the water column (Darmaraki et al., 2019a; Elzahaby and Schaeffer, 2019; Juza et al., 2022) that can cause negative ecological consequences (Schaeffer and Roughan, 2017; Santora et al., 2020; Garrabou et al., 2022). Expected to become more intense and frequent (IPCC, 2021), MHWs will severely compromise the many benefits and services provided by Mediterranean ecosystems, such as maintenance of biodiversity, food, regulation of air quality (Mills et al., 2013; Liquete et al., 2016; Martín-López et al., 2016; Smale et al., 2019; Holbrook et al., 2020), and human society (Oliver et al., 2018; IPCC, 2022). It is therefore imperative to produce indicators of subsurface MHW events to complement existing surface indicators based on SST.
MHWs in the Mediterranean Sea have been addressed by previous studies at the basin scale (Galli et al., 2017; Darmaraki et al., 2019a; Darmaraki et al., 2019b; Garrabou et al., 2022; Simon et al., 2022), in smaller areas studies (Bensoussan et al., 2019; Ibrahim et al., 2021; Androulidakis and Krestenitis, 2022) and finally at sub-regional scale, splitting the basin into dynamical (Juza et al., 2022; Pastor and Khodayar, 2022) or biological (Dayan et al., 2022) sub-regions. To focus on the link with the marine habitat, a more detailed regional division of the Mediterranean basin should be considered (Simon et al., 2022). According to Bianchi et al. (2012), the areas of interest in the Mediterranean Sea should be defined biologically rather than geographically to address the MHW-related specific impacts on each species and therefore providing location-specific and species-specific monitoring and indicators to end-users. However, dealing with this “geobiological” complexity at the scale of a large basin such as the Mediterranean is extremely challenging. Indeed, a large variety of end-users are involved, such as marine ecosystems managers, fisheries organizations, marine protected area (MPA) managers and aquaculture farms. Taking this highly complex challenge into account and to help provide context for future ecological and economic impact studies, this study proposes to go beyond the limit set by the complexity of a biological-approach by exploring a national-scale approach. Rather than responding individually to many end-users, this work focuses on Exclusive Economic Zones (EEZs) - where special rights are held by a sovereign country - as an initial stakeholder-oriented approach.
Our choice to split and classify the Mediterranean Sea using EEZs to assess MHWs is motivated by the need for smaller-scale subdivisions (Juza and Tintoré, 2021; Juza et al., 2022), as well as estimates of the subsurface extension of these processes (Simon et al., 2022). In particular, the EEZ classification has been chosen to respond to societal needs, although it is not based on specific ocean processes or ecosystem requirements. The EEZ partitioning (the boundaries of which may be modified in the future depending on the agreement and delegation of the different countries), is a pragmatic way of regionalizing relevant marine information for decision support in the very particular and sensitive social, economic and cultural contexts. Mediterranean EEZ boundaries are not yet completely decided and defined (see for example Scovazzi, 2022). However, for practicality, we have used EEZ boundaries provided by Flanders Marine Institute (2019).
By doing so, this manuscript aims at bridging the gap between scientific metrics of physical oceanic extreme events and MHW indicators relevant to different groups of end users. Indeed, whereas often MHWs are defined at the scale of an ocean basin or sea from sea surface temperature derived by satellites observations, end users (fisheries organizations, MPAs managers, aquaculture farmers) are interested in more regional, if not local, expressions of MHWs between the surface and the depths of interest. Moreover, the paper aims at highlighting the need to strengthen surface and subsurface monitoring systems in national waters, and to strongly encourage the development of better national adaptation strategies in order to address the impacts of MHWs. The results of this study produced at the EEZ-scale will be useful to (local and national) decision makers and stakeholders who may depend on decisions made at the national or even transnational level.
To better understand how much each Mediterranean country’s territorial sea and adjacent waters may be affected by these changes, this study assesses the variability of surface and subsurface - as ecological species may be more impacted in the subsurface (Simon et al., 2022) - MHWs over the period 1987-2019 in the whole Mediterranean Sea EEZ areas. Combining satellite observations and a regional reanalysis in the Mediterranean, both at daily and high spatial resolutions, over their common period 1987-2019, SST and OHC in the upper 20, 40 and 100 m layers are used to identify surface and subsurface MHWs. Differently from previous and recent papers which used only the sea surface temperature, this study proposes OHC as an additional MHW indicator which detects MHWs below the surface. The indicators obtained from OHC can be combined with SST-based surface indicators to provide a more complete assessment of the MHWs impacts on ecological species which live below the surface. The chosen layers for the OHC indicators correspond to ocean layers in which there is a deep chlorophyll maximum - an indication of high biological activity, since chlorophyll is at the base of the ocean food web - (Siokou-Frangou et al., 2010; Lavigne et al., 2015), and thus strong economic interests such as in commercial fisheries and aquaculture (Sacchi, 2011). In particular, these layers host some of the top pelagic predators, such as bluefin tuna whose larvae are vertically distributed down to 20-30 m (e.g., Alvarez-Berastegui et al., 2018). The latter take advantage of these depths close to the surface to live in during the first month and breed, as the surface layers provide the best environmental conditions for their survival2. For each EEZ, surface and subsurface MHWs characteristics (frequency, duration, total days, maximum intensity and cumulative intensity) are analyzed to explore how they differ in means and trends.
First, the ocean datasets and MHW detection methods will be described in Section 2. Then, the spatial distribution and the temporal evolution of MHWs at the surface and in the subsurface both at the (sub)-basin and EEZ scales from the different datasets will be presented in Section 3. In particular, main differences in the changing behaviors of MHWs across the EEZ areas will be highlighted and quantified, with a closer look at two singular MHW events in two specific EEZs. Finally, the results will be discussed, and limitations and recommendations to help make pragmatic and scientific decisions on the best usage of MHW indicators across scales and regions, and to better meet the needs of end users, will be provided in Section 4.
2 Materials and methods
2.1 MHW identification
MHWs occur when ocean temperatures are much warmer than normal for an extended period of time. In this study, we used the MHW detection algorithm from Hobday et al. (2016), freely available online3. MHWs at the surface are usually defined with SST. Here, in addition to identifying MHWs at the surface, we use subsurface temperatures and OHC to identify subsurface MHWs. OHCs integrated within the upper 20, 40 and 100 m have been chosen to illustrate and assess two MHW spatio-temporal signatures at two different integrated depths, as different marine species are accustomed to moving through different depth ranges (Würtz, 2010).
2.1.1 Statistical-based approach
The approach from Hobday et al. (2016) defines a MHW as being a SST value that exceeds a threshold value for at least five consecutive days. The threshold value they use is the daily 90th percentile of the local SST distribution over a long-term reference period. Two successive MHWs with a break of two days or less are considered a single continuous event. Finally, the daily climatological mean and threshold are smoothed using a 30-day moving window as recommended by Hobday et al. (2016), to extract useful climatologies from inherently variable data. Hobday et al. (2016) define a hierarchy of various metrics to describe characteristics of a MHW event; in this study, we use frequency (number of discrete events), duration (consecutive period of time that the temperature exceeds the threshold), total days (annual total days during which the temperature exceeds the threshold, which results from a combination of frequency and duration), maximum intensity - highest temperature anomaly value relative to the mean climatology - and cumulative intensity - integral of intensity over the duration of the event, which results from a combination of duration and intensity - (see Hobday et al., 2016 for more details on the calculation of each of these metrics). The mean and long-term trends of these metrics are analyzed over 1987-2019, which is the common period to both products used in this study. The linear trend is assessed with the least-squares method (Wilks, 2011). The statistical significance of the estimated trends is provided by the modified Mann-Kendall trend test, intended for autocorrelated data, recently used in Mohamed et al. (2021). It is a non-parametric test, meaning there is no underlying assumption made about the normality of the data (Hamed and Ramachandra Rao, 1998; Wang et al., 2020). The uncertainty given by the 95% confidence interval of the trend is provided by a standard statistical method (Thomson and Emery, 2014). The climatology corresponds to the period 1987–2016, a 30-year climatology as recommended by Hobday et al. (2016). Each dataset uses its own climatology to detect MHW events.
2.1.2 Spatial and temporal detection of MHWs
We detected MHW events using SST and OHC in two statistically different step methods, depending on the perspective from which we present the results. From a spatial perspective (subsection 3.1, 3.2.1 and 3.2.2), we first detected MHWs for each grid cell, and then computed the mean and trend of each MHW metric for each cell. From a temporal perspective, which provides time series at EEZ-scale (subsection 3.3), we first computed the spatial average of SST and OHC in each EEZ, and then the mean and trend for each metric.
2.2 Data description
A satellite-derived SST record and a high-resolution regional physical reanalysis of the Mediterranean Sea are used to identify MHWs.
2.2.1 Satellite data (REP)
The SST_MED_SST_L4_REP_OBSERVATIONS_010_0214 product (herein referred to REP), which is distributed by the Copernicus Marine Service, provides a long-term daily SST time series over the Mediterranean Sea and the adjacent North Atlantic box at a 1/20° resolution grid covering the period from January 1st 1982 to present (Pisano et al., 2016; Saha et al., 2018; Merchant et al., 2019). It is built from “a consistent reprocessing of the collated level-3 (merged single-sensor, L3C) climate data record provided by the ESA Climate Change Initiative (CCI) and the Copernicus Climate Change Service (C3S) initiatives, but also includes in input an adjusted version of the AVHRR Pathfinder dataset version 5.3 to increase the input observation coverage”3.
2.2.2 Reanalysis (MEDREA)
We employed the high-resolution, 4D, multi-decadal physical reanalysis of the Mediterranean Sea (MED_MULTIYEAR_PHYS_006_0045; herein referred to MEDREA), which is distributed by the Copernicus Marine Service (Escudier et al., 2020), to identify subsurface MHWs. MEDREA has a horizontal resolution of 1/24° (~4.5km), 141 vertical z-levels, and extends from 1987 to 2019 (at the time of writing). A 3DVar data assimilation scheme (Dobricic and Pinardi, 2008) is used to assimilate along-track sea level anomalies, in situ temperature and salinity profiles. We note that satellite-derived SST is not directly assimilated but it is used to correct surface heat fluxes; the SST product used is the same as used and described in this work. Atmospheric forcings (momentum water and heat fluxes) are derived from the ECMWF ERA5 atmospheric reanalysis (Hersbach et al., 2020), while climatological monthly mean runoff for 39 rivers is also included. More details on model setup, assimilation and verification can be found in Escudier et al. (2020).
When compared to basin-wide mean SST from REP, MEDREA displays a positive bias which is consistent across the basin and decreases across the coverage period (Escudier et al., 2021). The impact of the bias on MHW representation will be explored in subsection 3.1. Escudier et al. (2021) have also assessed the model against in situ depth profiles, detecting a temperature negative surface bias and a positive bias peak at roughly 40 m. Again, these biases may affect the representation of subsurface conditions. Fortunately, both the bias and the error are greatly reduced compared to the previous, lower resolution version reanalysis. We also point out that the number of in situ profiles assimilated is consistently at the highest values between 20 and 100 m. An extensive evaluation of the MEDREA performance is presented in the QUality Information Document (QUID) of the Copernicus Marine Product MEDSEA_MULTIYEAR_PHY_006_0046.
Here, the daily OHC is computed within the upper 20, 40 and 100 m layers from MEDREA reanalysis daily data covering the 1987-2019 time period, using the following calculation of the OHC:
where cp is the specific heat capacity (3996 J/(kg.°C)), ρ is seawater density (1026 kg/m3), and T is the temperature (in °C) at depth z (in m). In this study, z1 is 0 m while z2 is 20, 40 or 100 m.
2.3 Sub-regional approach based on a division by EEZ areas
In this study, the Mediterranean Sea is split into EEZ areas, whose boundaries are georeferenced locations provided by the database VLIMAR Gazetteer and the MARBOUND7 (Figure 1, Table 1). The purpose of this approach is to integrate information which could be used to establish mitigation and adaptation strategies at a national scale. The 1982 United Nations Convention on the Law of the Sea defined an EEZ as “an area beyond and adjacent to the territorial sea, subject to the specific legal regime established in this Part [see “Part V – Exclusive Economic Zone, Articles 55, 56” Law of the Sea. United Nations.], under which the rights and jurisdiction of the coastal State and the rights and freedoms of other States are governed by the relevant provisions of this Convention”. Among the special rights held by a sovereign country is the exploration and use of marine resources, including energy production from water and wind. As highlighted in Dayan et al. (2022) and Juza et al. (2022), the high spatial variability of ocean response to global warming and extreme events in the Mediterranean led us to split the extended EEZs for scientific relevance in relation with this variability. Indeed, some countries, such as Italy, France, Spain and Greece, have relatively large EEZ areas (Figure 1); we divided these EEZ areas into sub-EEZ areas (Figure 1) to separate the strong spatial variability of the surface and subsurface warming throughout the whole EEZ. While the Mediterranean Sea is surrounded by twenty-one sovereign countries, three of them (Slovenia, Monaco and Bosnia and Herzegovina) have a very small coastline, and thus an EEZ area too small to be properly represented by the model grid resolutions used by MEDREA.
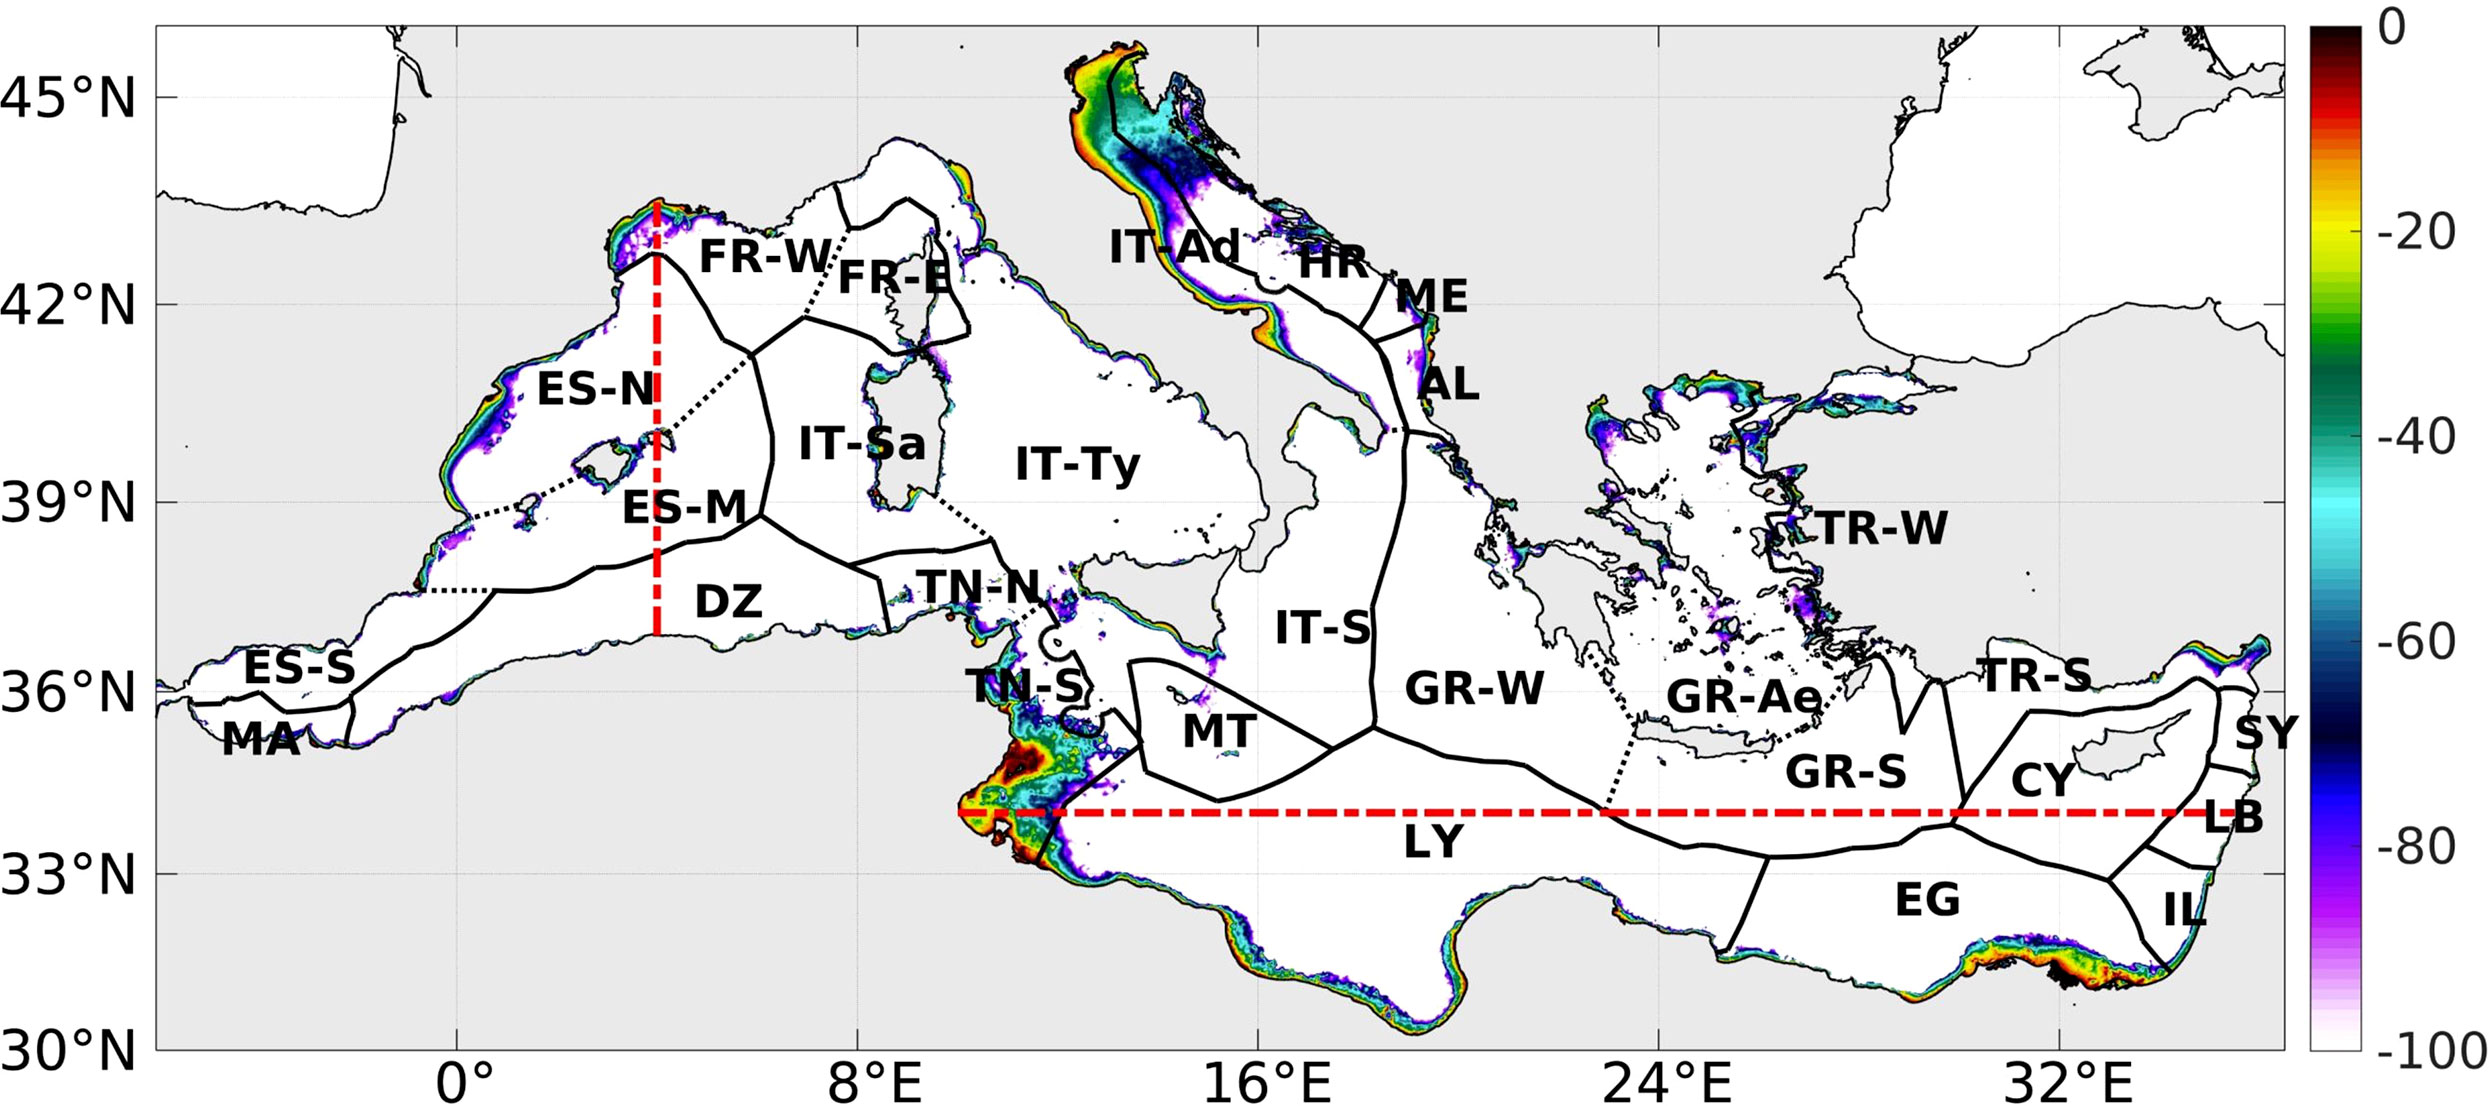
Figure 1 EEZ areas (solid lines) and sub-areas (dashed lines) in the Mediterranean Sea as defined by Flanders Marine Institute (2019). The two sections at [37-43°N; 4°E] and [34°N; 10-36°E] (red lines) will be used in Section 3. Bathymetry shallower than 100 m (in m) is indicated (in color).
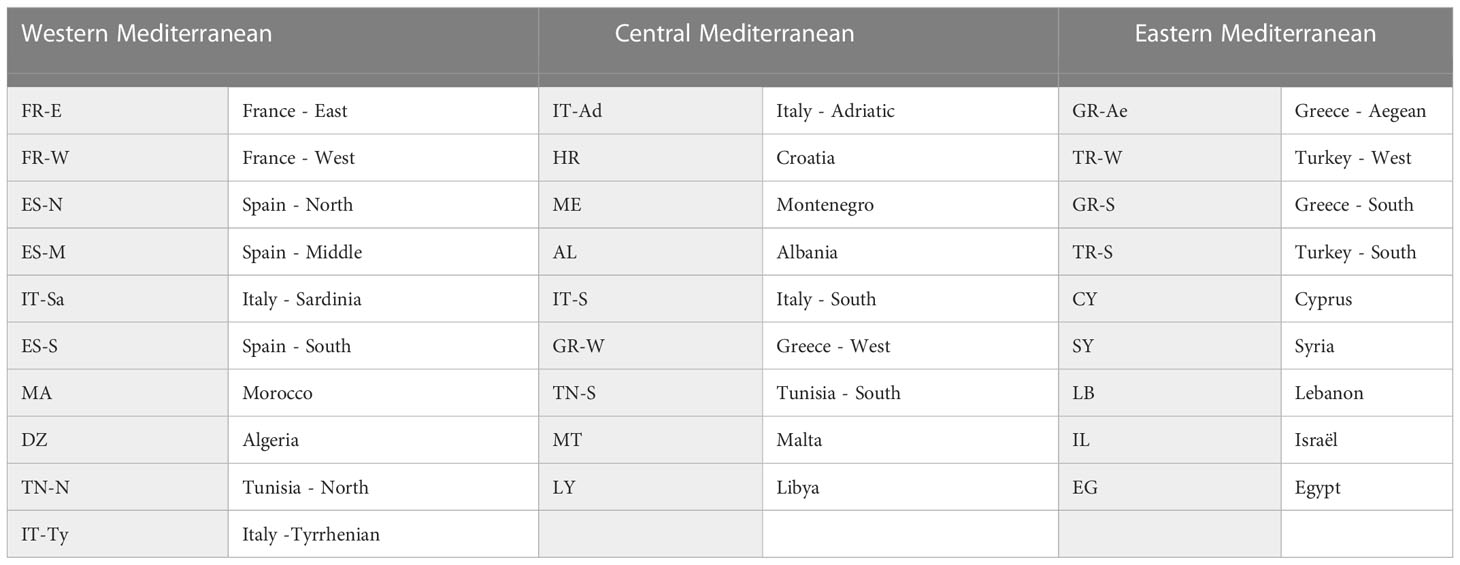
Table 1 EEZ areas and sub-areas in the Mediterranean Sea (as displayed in Figure 1).
The spatial variability of ocean dynamics is such that even adjacent EEZs may experience very different average conditions and long-term trends. A simple analysis of SST (from REP and MEDREA) and OHC trends demonstrates this point well (Figure 2). For example, LB and IL EEZs are small areas adjacent to each other in the Levantine Basin but have experienced very different warming trends over the past few decades. Moreover, although basin-scale patterns of trend are similar between SST and OHC (i.e. the peak warming occurs in the eastern part of the basin), there are EEZ-scale differences to consider. In GR-S, there is a mesoscale area of relatively low warming in the SST (Figures 2A, B); this same feature is manifested as a much larger area of negligible negative cooling in OHC integrated within 0-100 m (Figures 2C–E). Therefore, we argue that it is not sufficient for national-level stakeholders to receive basin-scale information; a local viewpoint of ocean processes and changes is necessary.
Figure 2 Linear trends over the period 1987-2019 of SST (in °C/year) from REP (A) and MEDREA (B), and of OHC within the layers [0-20 m] (C), [0-40 m] (D) and [0-100 m] (E) from MEDREA (in GJ/m2/year). Not significant values at the 95% confidence level based on a Mann-Kendall trend test are dashed.
3 Results
From a spatial perspective, both at the sub-regional scale and at the EEZ-scale, we first present the results from (1) REP in subsection 3.1.1, (2) the comparison of the means of MHW characteristics at the surface between REP and MEDREA, as well as Pearson Correlation Coefficients as a mean of quantifying the agreement in interannual variability, in subsection 3.1.2, and then, (3) MEDREA in the subsurface, in subsection 3.2. Finally, subsection 3.3 describes the surface and subsurface MHW signatures from a temporal and EEZ-scale perspective.
3.1 Spatial MHW signatures at the surface: comparing observations and reanalysis
3.1.1 REP
Based on REP over the period 1987-2019, MHW frequency, total days, maximum intensity and cumulative intensity at the surface show a strong north-south and west-east spatial variability (Figures 3A, E, G, I), while duration displays a more uniform mean, with higher values in the eastern basin and some disparities in the Alboran Sea, in the Libyan Sea, in the Ionian Sea, and close to the eastern coastal area of the Aegean Sea (TR-W and eastern GR-Ae) (Figure 3C). More precisely, there is a lower number of events per year, total days and cumulative intensities in the southeastern Mediterranean Sea and slightly more in the western Mediterranean Sea, especially in the northwestern area (ES-N, FR-W and northern IT-SA), as well as the Adriatic Sea (IT-Ad, HR, ME and AL) (Figures 3A, E, I), while maximum intensity reach its maxima in the Gulf of Lion (FR-W), the Ligurian Sea (FR-E, northern IT-Ty), the northern Adriatic Sea (northern IT-Ad and HR), and to a lesser extent the Aegean Sea (TR-W and GR-Ae) (Figure 3G).
Figure 3 Means (left panels, A, C, E, G, I) and linear trends (right panels, B, D, F, H, J) from REP over the period 1987-2019 of annual MHW frequency (A, B, in count), duration (C, D, in days), total days (E, F, in days), maximum intensity (G, H, in °C) and cumulative intensity (I, J, °C*days). The black hatches indicate where trend values are not significant at the 95% confidence level based on a Mann-Kendall trend test.
From 1987 to 2019, MHWs frequency (total days) at the surface has been increasing significantly across the basin between about 1 event (10-15 days) in the western basin and about 2 events (20-30 days) in the eastern basin per decade (Figures 3B, F). Duration and cumulative intensity show higher and more significant positive trends in the eastern (GR-W, GR-Ae, FR-S, CY, EG, IL, LB, SY) (Figures 3D, J). Maximum intensity trends are significantly stronger in the western Mediterranean Sea (MA, DZ, ES-M, IT-Sa, TN-N) (Figure 3H).
3.1.2 Differences between MEDREA and REP
The MHW metrics detected at the surface over the period 1987-2019 show a high spatial variability in the difference in means between MEDREA and REP (Figure 4). Here, it is to be reminded that MEDREA displays a positive SST bias which decreases across the coverage period (see subsection 2.2.2). However, in this study both products use their own climatology to detect MHW events, so that the bias in MEDREA may be statistically mitigated. This section aims to highlight the extent to which results are consistent, or not, between MEDREA and REP. Below is a brief description of the spatial differences between MEDREA and REP at the basin scale.
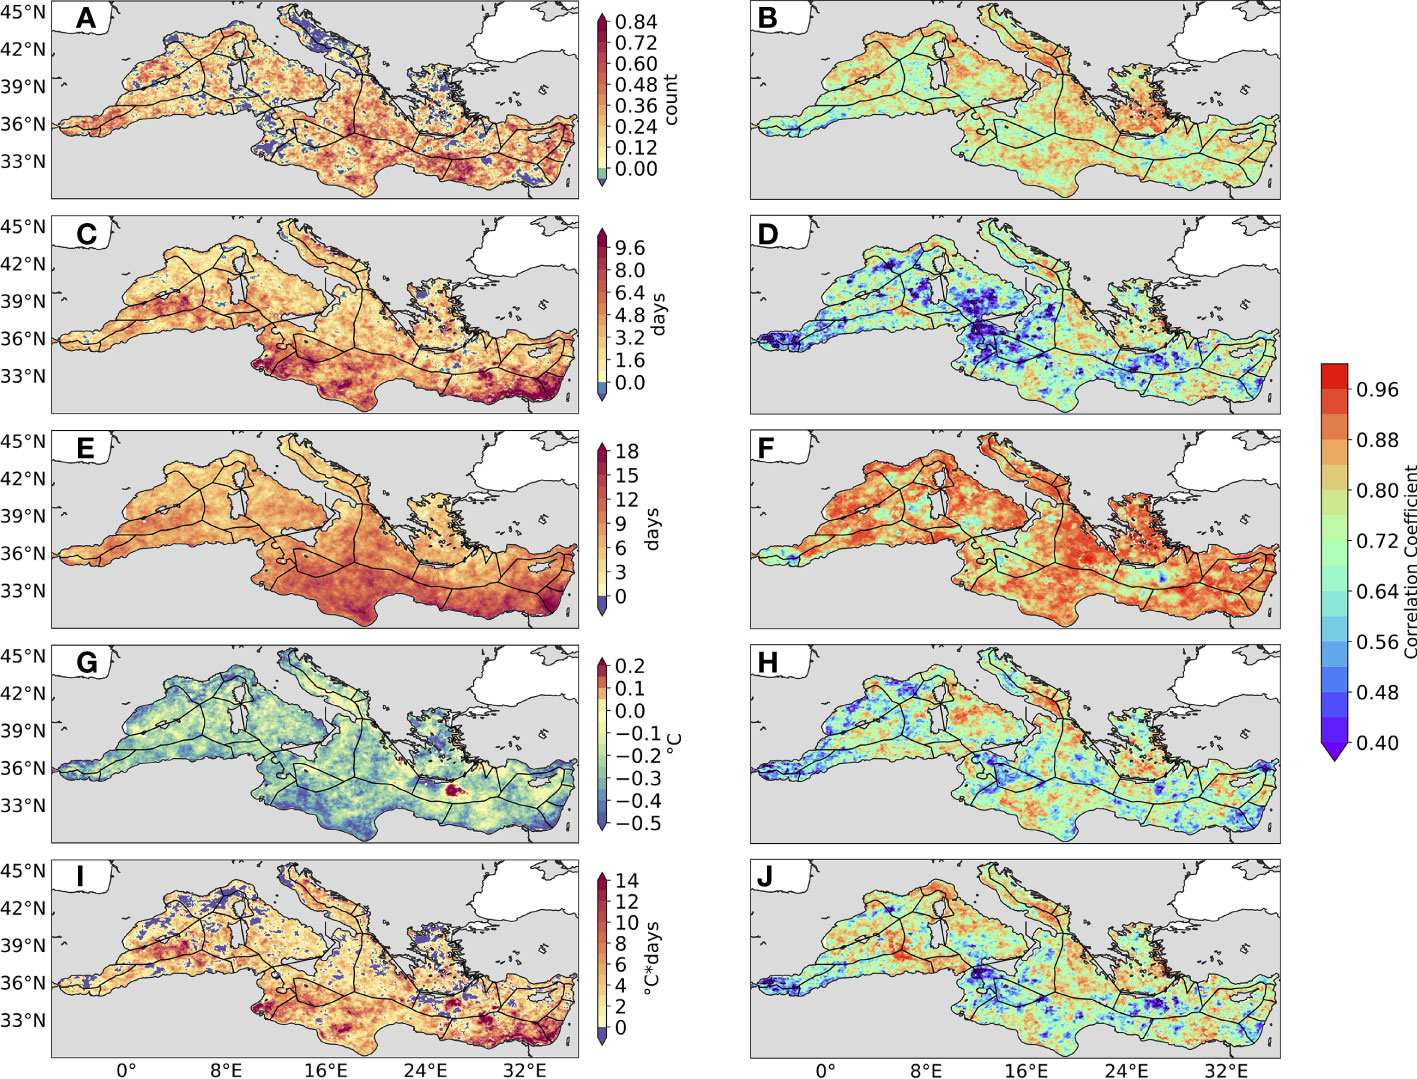
Figure 4 (Left panels, A, C, E, G, I) Difference of the means of surface MHW metrics detected in MEDREA and the one computed from REP over the period 1987-2019 of annual MHW frequency (A, in count), duration (C, in days), total days (E, in days), maximum intensity (G, in °C) and cumulative intensity (I, in °C*days). (Right panels, B, D, F, H, J) Pearson Correlation Coefficients between surface MHW metrics detected in MEDREA and the one computed from REP over the period 1987-2019 of annual MHW frequency (B), duration (D), total days (F), maximum intensity (H) and cumulative intensity (J). The black hatches indicate where trend values are not significant at the 95% confidence level based on a Student’s t-test.
The differences in MHW frequency at the surface are between 0 and 1 MHWs per year in the entire basin, with overestimations of MEDREA generally stronger in the east (Figure 4A). These differences are negligible in the Adriatic Sea, the Aegean Sea, the Gulf of Lion, the Gulf of Gabes and off the Suez Canal (overestimations of MEDREA around 0 per year; Figure 4A), while they are greater (comparatively to the number of MHWs in these regions; Figure 4A) in the Alboran Sea, the Balearic Sea, the Ionian Sea and the Levantine Sea (overestimation of MEDREA up to 1 per year; Figure 4A). The differences in duration, total days and cumulative intensity are largely stronger in the south-west and the south-east sub-regions, in particular in the Balearic Sea, the south of the Ionian basin, the Gulf of Gabes, the Gulf of Sidra, off the Libyan coast and in the south of the Levantine basin (Figures 4C, E, I). Finally, MEDREA tends to slightly underestimate maximum intensity of MHWs at the surface in the entire basin (up to 0.5°C; Figure 4G).
Besides measuring the biases in MHW characteristics, we also quantify the ability of MEDREA to capture their interannual variability. Correlations between annual average or total MHW characteristics in MEDREA and REP are shown to be statistically significant across the vast majority of the basin (Figures 4B, D, F, H, J). Skill scores are particularly high for number (Figure 4B) and total days of events (Figure 4F). The only noticeable disagreements (statistically insignificant correlations) between MEDREA and REP are found in the vicinity of the Strait of Sicily and the Alboran Sea for duration and, as a result, cumulative intensity. Overall, MEDREA is able to capture the year-to-year changes in MHW characteristics detected by satellite observations.
To conclude, MEDREA tends to: (1) slightly overestimate MHW frequency and maximum intensity at the surface, more in the eastern than in the western of the Mediterranean Sea, and (2) substantially overestimate MHW duration, total days and cumulative intensity at the surface in the south-western and south-eastern sub-basins (3) capture interannual variability of MHW activity. While it is not possible to verify the consistency of MEDREA below the subsurface, this surface comparison effort partly justifies its use in analyzing subsurface MHWs.
3.2 Spatial subsurface MHW signatures from MEDREA
In this subsection, we first explore the subsurface MHW signatures from the temperature in the upper 300 meters - in which most of the thermosteric sea level component is confined (Tsimplis et al., 2013; Mohamed and Skliris, 2022) - of two vertical sections crossing through several EEZs: one East-West section in the eastern Mediterranean basin [37°N-43°N; 4°E] (Figure 1), and one North-South section in the western Mediterranean basin [10°E-36°E; 34°N] (Figure 1). To illustrate the difference between the surface and the subsurface MHW signatures, two vertical sections are displayed in the upper 300 m which cross dynamically different regions, and whose influence on MHW characteristics is captured. These two sections - one in the south-north direction from the Algerian basin to the Gulf of Lion (Figure 5), the other in the west-east direction from Gulf of Gabes to the eastern Levantine basin (Figure 6) - cross regions with important vertical dynamics, such as deep convection (Gulf of Lion, Rhode Gyre, Pinardi et al., 2019) or downwelling process (north-eastern corner of the Cretan Island, Bakun and Agostini, 2001). Figure 5 and Figure 6 highlight the higher MHW duration in the subsurface than at the surface in these two sections - explained by a weaker variability of temperature at depth than at the surface - and the regions of convection which contribute to the propagation of the signal from the surface to the subsurface. Then, we use the OHC in the upper 100 m to better display the spatial variability of MHWs in the high biological activity subsurface, and compare it with MHWs at the surface. The OHC integrated within the upper 20 and 40 m are shown in Supplementary Material, as the same qualitative conclusions emerge from these two shallower integrated depths.
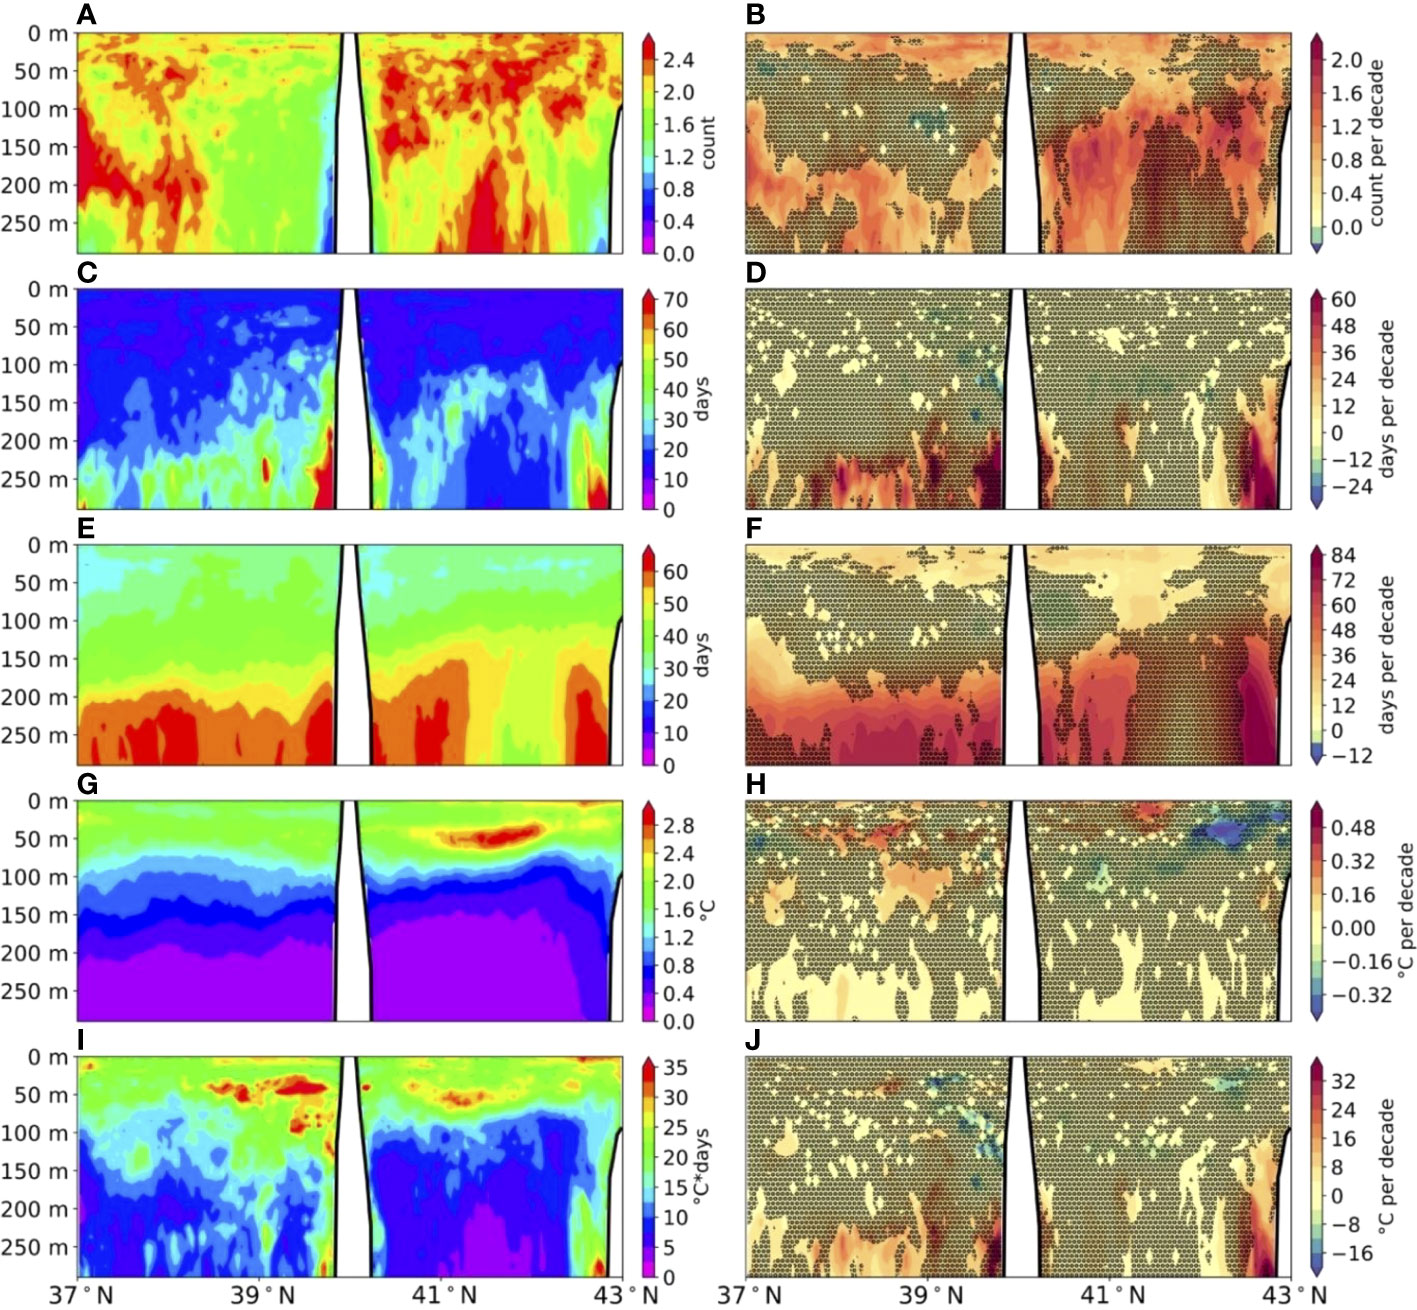
Figure 5 Vertical sections of means (left panels, A, C, E, G, I) and linear trends (right panels, B, D, F, H, J) over the period 1987-2019 of annual MHW frequency (A, B, in count), duration (C, D, in days), total days (E, F, in days), maximum intensity (G, H, in °C) and cumulative intensity (I, J, in °C*days), as detected from MEDREA temperature in the upper 300 m, along the western longitudinal section (as displayed in Figure 1). The black line indicates the bathymetry. Black hatches indicate where trend values are not significant at the 95% confidence level based on a Mann-Kendall trend test.
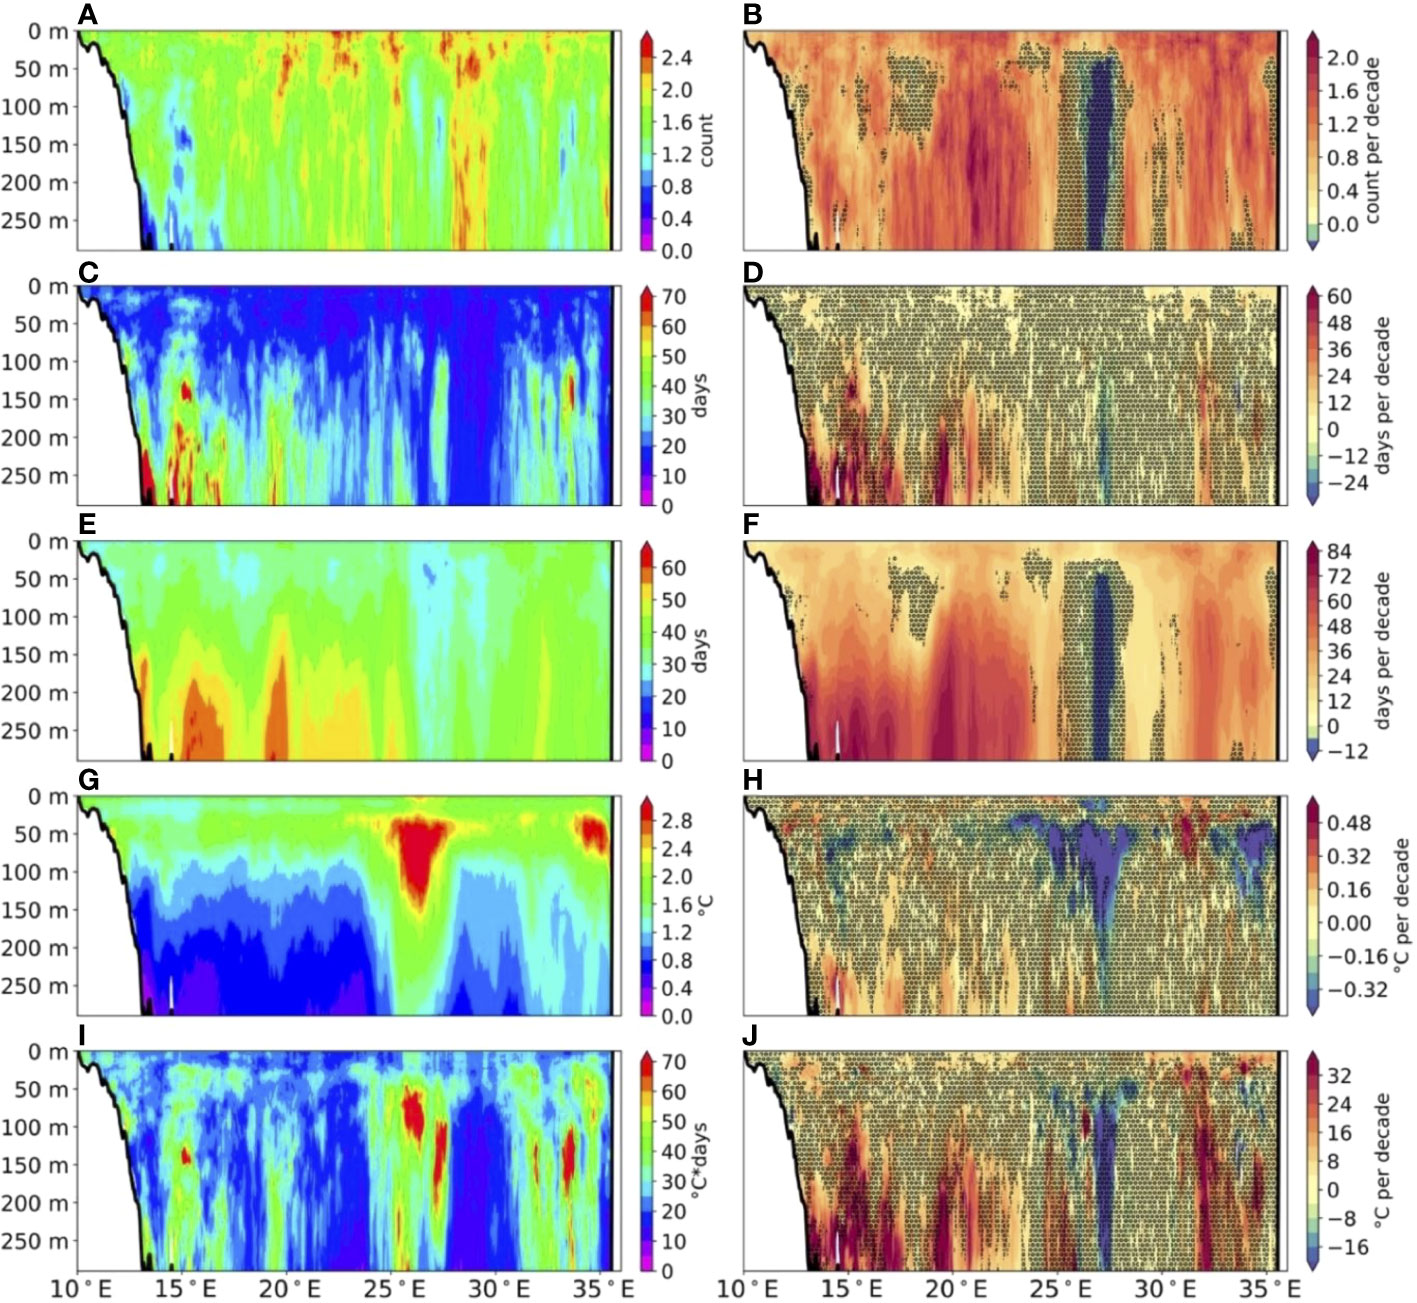
Figure 6 Vertical sections of means (left panels, A, C, E, G, I) and linear trends (right panels, B, D, F, H, J) over the period 1987-2019 of annual MHW frequency (A, B, in count), duration (C, D, in days), total days (E, F, in days), maximum intensity (G, H, in °C) and cumulative intensity (I, J, in °C*days), as detected from MEDREA temperature in the upper 300 m, along the eastern latitudinal section (as displayed in Figure 1). The black line indicates the bathymetry. Black hatches indicate where trend values are not significant at the 95% confidence level based on a Mann-Kendall trend test.
3.2.1 Vertical sections of the upper ocean
Here, we show the extent to which subsurface MHWs are detected down to several hundred meters, with a strong signature in the upper 10 m and with a strong spatial variability both in longitude-latitude and in depth (Figure 5, 6). MHWs in the subsurface are on average more numerous in the western section (up to about 3 counts per year near the coasts of the Algerian basin and in the Gulf of Lion) than in the eastern section (up to 2.5 counts per year along the entire depth, in particular in the Levantine basin). The evolution of MHW frequency shows a significant increase at the 95% confidence level at all depths (up to about 2.5 counts per decade), but not necessarily for all the sub-regions. In particular, trend values are not significant in the subsurface between 25°E and 30°E, in GR-S (Figure 6B), where deep convection occurs (Pinardi et al., 2015).
Regarding duration, it is longer at depth than at the surface - up to about 70 days between 150 and 300 m around the Balearic Islands (at the border between ES-M and ES-N) (Figure 5C), in the Gulf of Gabes (LY) and the far east of the Levantine basin (LB) (Figure 6C). This tendency for MHWs to persist more at depth than at the surface can be explained by a weaker variability of temperature at depth than at the surface. At depth, the heat storage and retention is larger as the heat exchange with the atmosphere is limited, suggesting that in the Mediterranean Sea the trend in the heat accumulation in the upper ocean is important8. The trends of MHW duration display a significant increase at the 95% confidence level between 150 and 300 m - up to more than 60 days per decade around the Balearic Islands (ES-M and ES-N), in the Algerian Basin (DZ), the Gulf of Lion (FR-W) (Figure 5D), and the Gulf of Gabes up to the Ionian Basin (LY) (Figure 6D). In general, means and trends in total days of MHWs show the same qualitative results as in duration - as it results from a combination of frequency and duration - but with lower maximums in each vertical section (Figures 5E, F. 6E, F).
The average maximum intensity and cumulative intensity of MHW are generally stronger in the upper 100 m (up to about 3°C and 35°C*days, respectively, around 50 m), and decreases with depth (Figures 5G, I, 6G, I). However, some subregions show a strong intensity signature that appears to extend from the surface to very deep layers - in the Levantine Basin (GR-S and LB), up to 300 m around 26°E, and about 160 m around 35°E (Figures 6G, I). This suggests that MHWs are able to spread in depth while maintaining intensity through vertical dynamical processes, such as deep convection (in particular around 26°E, in GR-S; Pinardi et al., 2015) or downwelling process (Bakun and Agostini, 2001). The evolution of MHWs maximum intensity and cumulative intensity over 1987-2019 shows a stronger significant signature in the subsurface than at the surface (Figures 5H, J, 6H, J). Two spots of significant negative trends are detected around 26°E (GR-S) and 35°E (LB), between 50 and 160 m (Figure 6H), where MHWs propagate deeper into the subsurface (Figure 6H).
3.2.2 OHC: an integrated subsurface MHW indicator
The spatial patterns of the MHW mean characteristics show substantial differences between the surface (Figure 7) and the 100 m integrated upper layer (discussed here below Figure 8), and the upper 20 and 40 m (Supplementary Material; Figures 1S, 2S; not discussed here as the same qualitative conclusions emerge from these two shallower integrated depths). At the basin scale, the number of MHWs is generally higher at the surface than in the 100 m integrated subsurface (Figures 7A, 8A). Duration and total days are substantially higher in the 100 m integrated subsurface; on average it is almost twice as long as at the surface, except in the Alboran Sea (ES, MA and DZ) (Figures 7C, E, 8C, E). Regarding intensities, it is not possible to directly compare surface events (in °C) and subsurface events (J/m2). We note that the relative minima in intensity occur where bathymetry is less than 100 m (e.g., Northern Adriatic, Gulf of Gabes and off-shore of the Nile delta; Figure 1), and thus the OHC actually represents a shallower depth than 100 m. Elsewhere, intensity values are higher in the eastern part than in the western part of the Mediterranean Sea, in particular in the Levantine Basin (Figures 8G, I).
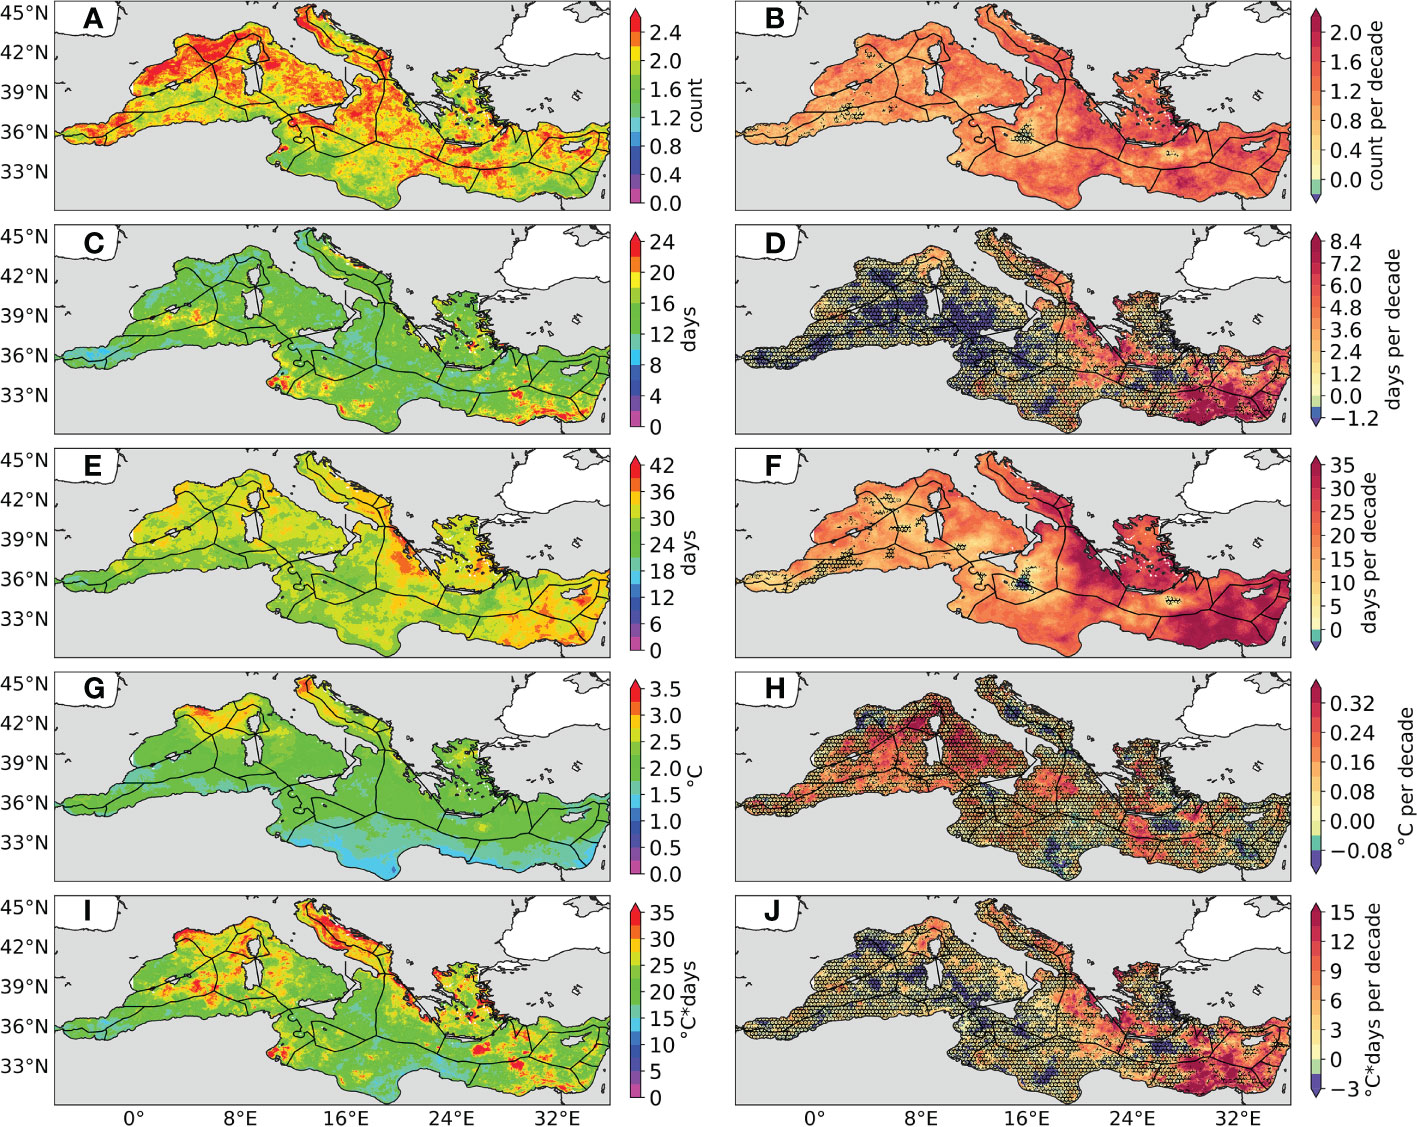
Figure 7 Means (Left panels, A, C, E, G, I) and linear trends (Right panels, B, D, F, H, J) from SST provided by MEDREA over the period 1987-2019 of annual MHW frequency (A, B, in count), duration (C, D, in days), total days (E, F, in days), maximum intensity (G, H, in °C) and cumulative intensity (I, J, in °C*days). The black line indicates the bathymetry. Black hatches indicate where trend values are not significant at the 95% confidence level based on a Mann-Kendall trend test.
Figure 8 Means (Left panels, A, C, E, G, I) and linear trends (Right panels, B, D, F, H, J) from the OHC in the upper 100 m provided by MEDREA over the period 1987-2019 of annual MHW frequency (A, B, in count), duration (C, D, in days), total days (E, F, in days), maximum intensity (G, H, in GJ/m2) and cumulative intensity (I, J, in GJ/m2*days). The black line indicates the bathymetry. Black hatches indicate where trend values are not significant at the 95% confidence level based on a Mann-Kendall trend test. Results from the OHC in the upper 20 and 40 m are shown in the Supplementary Material (Figure 1S and Figure 2S).
The spatial patterns of the frequency and total days trend of MHWs in the 100 m integrated subsurface and at the surface are very similar (significant positive values everywhere), even if fewer areas are significant in the subsurface (Figures 7B, F, 8B, F). Duration, maximum intensity and cumulative intensity show much less significant trend values in the subsurface than at the surface (Figures 7D, H, J, 8D, H, J). Duration displays higher and more significant trends in the eastern Mediterranean Sea, both at the surface and subsurface (GR-W, GR-Ae, EG, CY, IL, LB, SY) (Figures 7D, 8D). Unlike the surface, the subsurface shows significant positive duration trends in the Libyan Sea (LY) (Figures 7D, 8D). While there are significant positive values throughout the basin, there are mesoscale-sized significant negative trends in subsurface intensity, in particular in the Levantine Sea (GR-S, IL, LB, SY and EG) and in the Gulf of Lion (FR-W) (Figures 8H, J).
We find that there are both basin-scale and EEZ-scale differences between surface and OHC-based subsurface MHW event characteristics, which motivates the assessment of MHWs from the surface to the first 100 meters.
3.3 Spatio-temporal MHW signatures at the EEZ-scale from MEDREA
Using subsurface definitions of MHWs provides a different and complementary record of MHW activity in the EEZs (Figures 9 and 10). MHW detection based on subsurface heat returns more years in which no MHW days are detected, compared to using surface temperature from MEDREA. Generally, there are more surface-defined than subsurface-defined events when comparing MEDREA surface and subsurface (Figures 9A–D), and they are shorter in duration at the surface (Figures 9E–H). Overall, therefore, there is a greater number of surface MHWs, and these do not always leave a signal on the depth-integrated indicators. In 2003 for example, we detected several weeks of surface MHWs in all but one EEZ (TR-W), yet subsurface events were detected in only 21 EEZs using the OHC integrated over 20 m, 7 EEZs using the OHC integrated over 40 m and in 2 EEZs (FR-W and FR-E) using the OHC integrated over 100 m. Depth propagation on the scales used here (20, 40 and 100 m), it seems, is not common. There are some instances in which MHW activity is absent at the surface but present in the subsurface (e.g., LB in 2014).
Figure 9 Annual means of MHW frequency (in count, A–D), duration (in days; E–H) and total days (in days; I–L) over the period 1987–2019 in the different EEZs, computed from MEDREA SST (A, E, I), OHC within [0-20 m] (B, F, J), OHC within [0-40 m] (C, G, K) and OHC within [0-100 m] (D, H, L).
Figure 10 Annual means of MHW maximum (A–D) and cumulative (E–H) intensities (in °C for A, E and in GJ/m2 for B–D, F–H) over the period 1987–2019 in the different EEZs, computed from MEDREA SST (A, E), OHC within [0-20 m] (B, F, J), OHC within [0-40 m] (C, G) and OHC within [0-100 m] (D, H).
We now highlight two case studies in which the surface and subsurface MHW indicators reported drastically different viewpoints of MHW activity. In the summer of 2003, ES-M experienced three months of MHW conditions at the surface from June to September, and reached 2° intensity (Figure 11A). The OHC 0-100 m, on the other hand, remained at near-climatological values for the majority of the year (Figure 11B). Figure 9 tells us that only the French EEZ experienced MHWs defined by OHC 0-100 m, while several others in the whole basin experienced MHWs defined by OHC 0-20 m, and in the western Mediterranean Sea, IT-Sa, TN-N, DZ, MA and ES-M experienced MHWs defined by OHC 0-40 m. For ES-M and much else of the basin, the event of 2003 can be considered a relatively shallow one.
Figure 11 Time series of daily SST and OHC[0-100 m] anomalies. (A, B) show the 2003 time series for the Spain-Middle (ES-M) EEZ, while (C, D) show the 2016 time series for the Egypt (EG) EEZ. The 90th percentile threshold is shown by the red line. Shading indicates when MHWs were detected, colored according to their categories as defined by Hobday et al. (2018): red (dark red) shading indicates when the MHW is moderate (strong).
EG in 2016 provides an example in which MHW activity was much greater in the subsurface than at the surface. The number of MHW days was approximately 3 times higher in the OHC 0-100 m definition than in the SST definition (Figures 11C, D). MHW activity began in mid-April and peaked before the end of the month, according to all definitions. In the OHC indicators, the MHW weakened but persisted until mid-July. Meanwhile, the surface fluctuated in and out of a MHW state, leading to far fewer MHW days recorded for the surface indicator. In the subsurface, 2016 had the longest number of MHW days for EG, while for the surface the peak was recorded in 2015 (Figures 9, 10).
An important task is to identify which EEZs have experienced the most MHW activity. Here, we provide ‘‘Top Ten’’ lists of the EEZs with the largest mean values for number, duration, total days, maximum intensity and cumulative intensity at the surface and subsurface using the OHC integrated over 100 m (Tables 2, 3; Data for all EEZs and each integrated depth of the OHC can be seen in Supplementary Tables 1S, 2S, 3S, 4S). First, we note that the ‘‘Top Ten’’ for the surface varies between variables. For example, FR-W experiences the most frequent and most intense surface MHWs (Table 2), but does not feature in the longest-lasting events. On the contrary, IL experiences the longest lasting surface event but they are relatively less common and less intense. ME displays the most consistent highest average across the variables (2nd in number, 6th in duration and 3rd in maximum intensity) and is one of the few to display a significant positive trend in duration, highlighting it as a zone which has been most impacted.
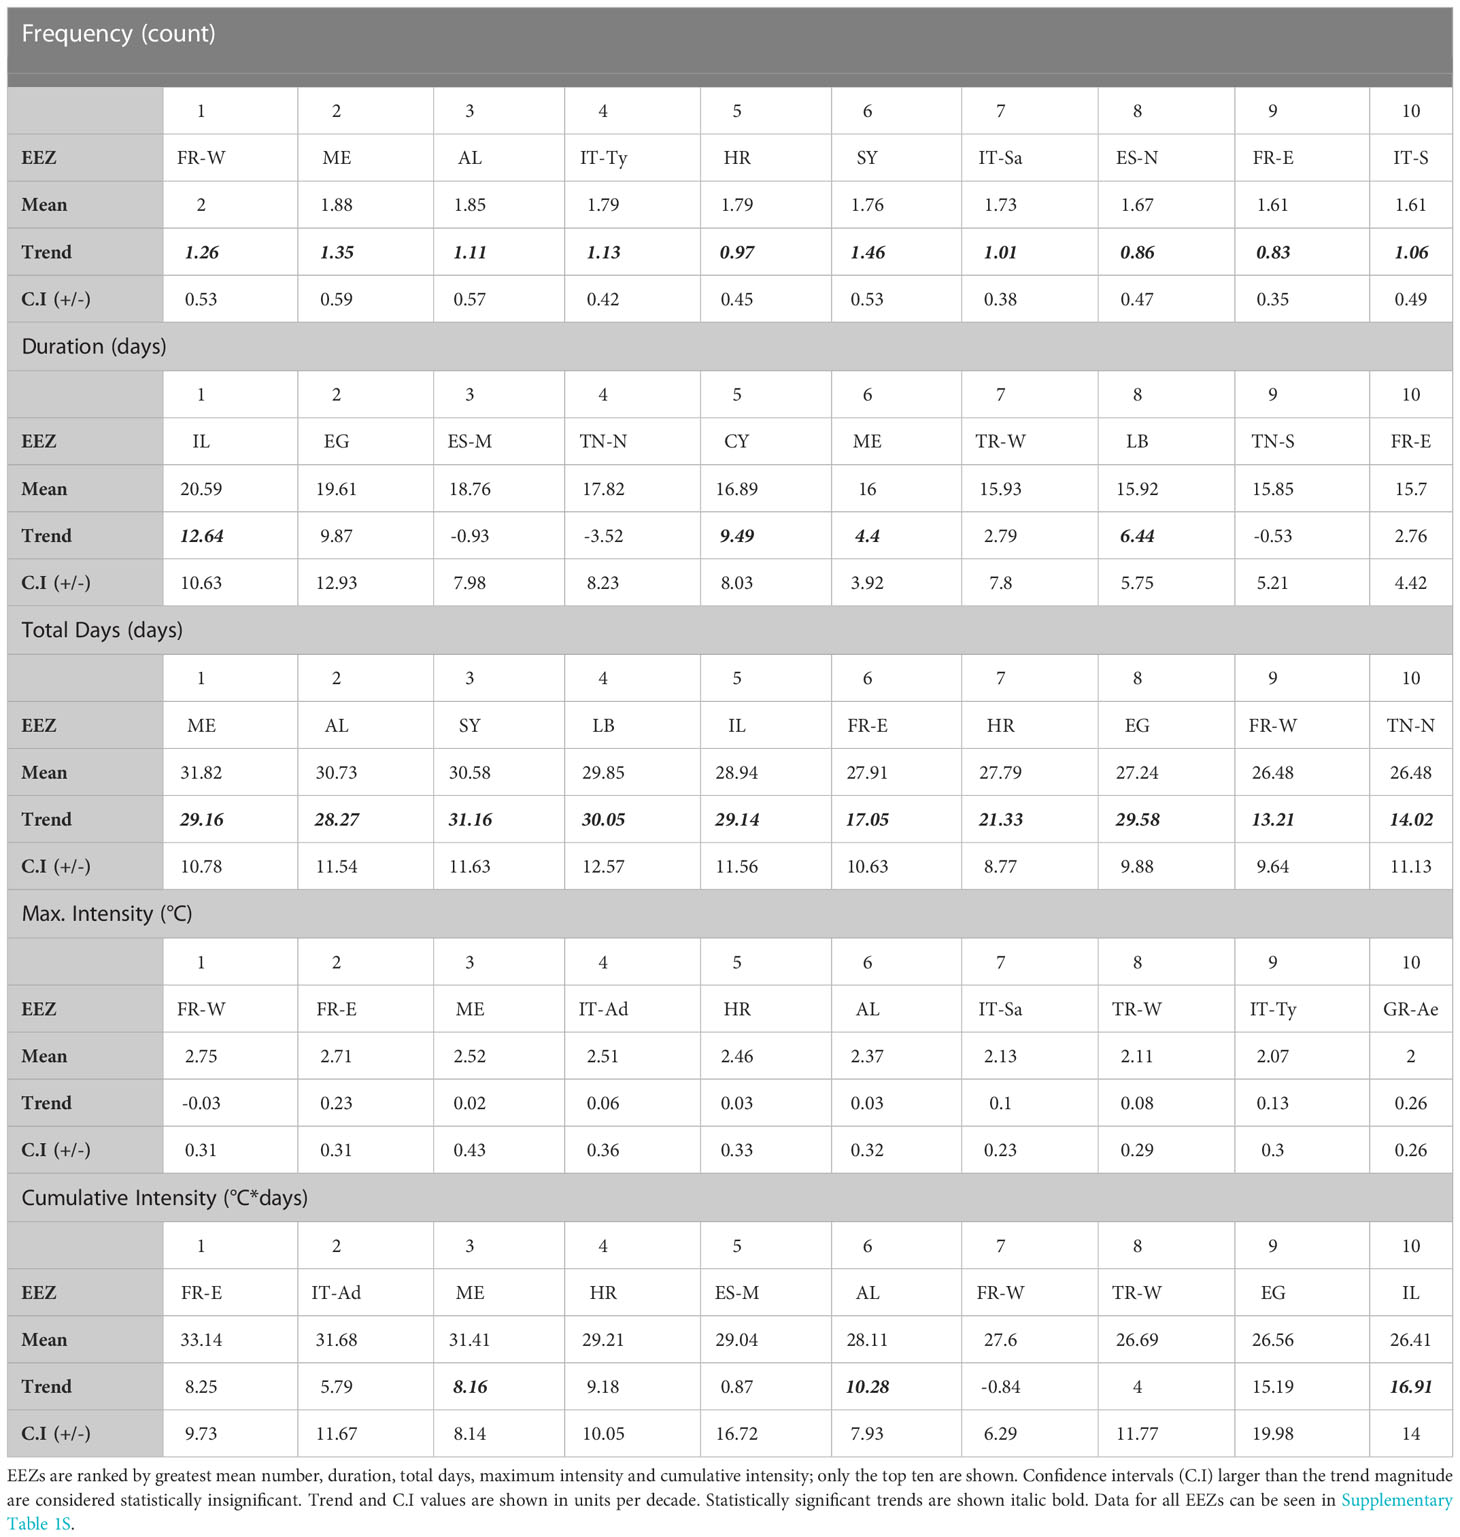
Table 2 Mean and trend for surface (SST) MHW characteristics in EEZ areas (as displayed in Figure 1).
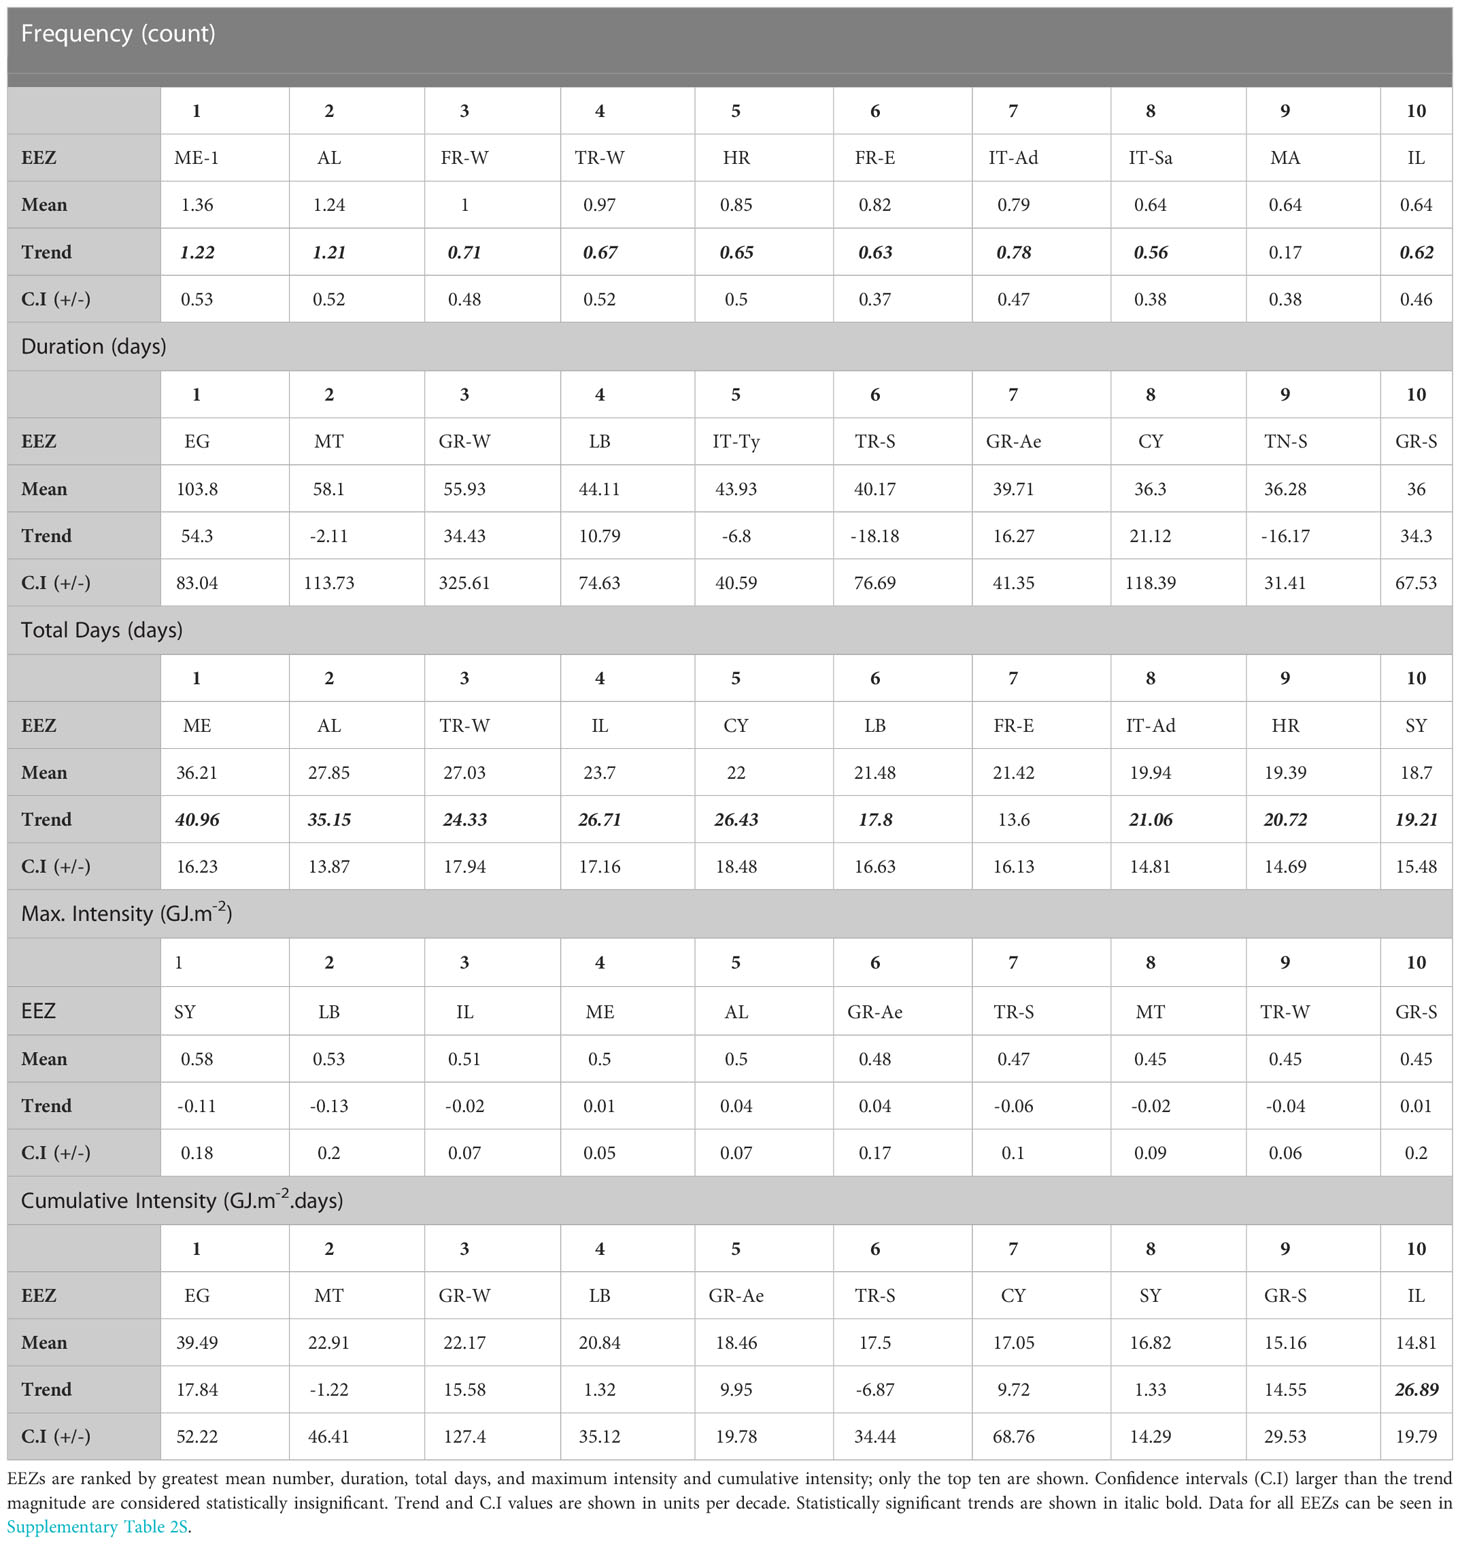
Table 3 Mean and trend for subsurface (OHC 0-100 m) MHW characteristics in EEZ areas (as displayed in Figure 1).
The view of the most-impacted EEZs varies also when including subsurface events. Lists of number, duration, total days, maximum intensity and cumulative intensity display important differences between surface and subsurface events (Table 3). Not only are the orders for each variable different, but there are new additions to the “Top-Ten” lists. MT and GR-W respectively experienced the second and third longest subsurface MHWs on average, while not making it onto the “Top Ten” for surface event duration. ME appears also in the top-three for number (1st) and intensity (3rd) of subsurface events, further highlighting it as a highly-impacted zone. SY experienced the most intense subsurface event but did not feature in the most intense surface records. The choice of a “Top-Ten” list is quite arbitrary but highlights the need to consider all MHW characteristics and to avoid focusing solely on the surface.
4 Discussion
4.1 Summary of findings
Combining high-resolution satellite observations (REP) and a regional reanalysis (MEDREA) over their common period 1987-2019, we used the statistical approach from Hobday et al. (2016) to detect MHWs at the surface, using the widely used SST variable, and in the subsurface, using OHC as an original subsurface MHW indicator. We chose to split the Mediterranean Sea into EEZ areas to better understand how much each Mediterranean country’s territorial sea and adjacent waters may be affected by MHW changes over the period 1987-2019. Overall, results show strong north-south and east-west spatial gradients in the MHW characteristics both at the surface and in the subsurface, with a good agreement between REP and MEDREA in means and interannual variability of MHW characteristics. There is a clear MHW signature in the subsurface. We found a strong spatial variability with depth, but not necessarily in all the sub-regions. There are both basin-scale and EEZ-scale differences between surface and subsurface MHW event characteristics. Both surface and subsurface MHW indicators, therefore, are necessary to provide a truly representative view of MHWs, and, as a result, of the environmental, social and economic impacts of the past and of those to come in the future.
Below are the main conclusions for each metric, at both the basin scale and the EEZ-scale.
4.1.1 Frequency
Overall, we found that the number of MHWs at the surface is greater than in the subsurface, based on the depth-integrated OHC indicator. We showed that MHWs which manifest at the surface do not always leave a signal on the depth-integrated indicators, as illustrated in the year 2003, suggesting that depth propagation on the scales used here (20, 40 and 100 m) is not common. Finally, since 1987, there has been a substantial and significant (at the 95% level of confidence) increase in MHW frequency across the basin at the surface and in the subsurface (in both by about 1-1.5 events per decade).
4.1.2 Duration
Vertical cross-sections and depth-integrated OHC (integrated within the upper 20, 40 and 100 m) indicators show that the MHW duration and total days values in the subsurface are substantially higher than at the surface, with significantly higher positive trends in the eastern part of the basin than in the western part both at the surface and in the subsurface (GR-W, GR-Ae, EG, CY, IL, LB, SY). Unlike the surface, the subsurface shows significant positive duration trends in the Libyan Sea (LY).
The longer duration and higher total days values in the subsurface are likely due to the weaker variability of temperature at depth (than at the surface) and the greater absorption and storage of heat. The EEZ-scale analysis also shows that subsurface activity is generally of longer duration. For example, in the Egypt EEZ (EG) during 2016, the subsurface MHW persisted three times as long as the surface MHW (Figure 11). In such a scenario, the usage of a surface-only indicator may underestimate the true duration of extreme marine conditions. The opposite is true in the case of the Spanish EEZ (ES-M) in 2003, in which there was a long (3 months) MHW at the surface, while no signal appeared in the OHC 0-100 m (Figure 10). A single MHW indicator, therefore, may not capture the full timespan of a MHW.
4.1.3 Intensity
The evolution of MHW maximum intensity shows significant positive trends with stronger values in the western Mediterranean Sea (MA, DZ, ES-M, IT-Sa, TN-N) at the surface, while, in the subsurface, it reached its extreme values in the Levantine Basin EEZs and its increase is more disparate throughout the basin. In contrast to the maximum intensity, the evolution of MHW cumulative intensity shows significant positive trends with stronger values in the eastern Mediterranean Sea (GR-W, GR-S, EG, GR-Ae, Cy, TR-S, CY, SY, LB & IL) at the surface and in the subsurface. Some negative intensity trends were detected in the 0-100 m integrated indicator in the Levantine Sea (GR-S, IL, LB, SY and EG) and in the Gulf of Lion (FR-W).
Both vertical cross-sections and depth-integrated OHC (within 20, 40 and 100 m) agree on the general statement that MHW intensities decrease with depth. There are local exceptions, presumably linked to specific processes; the analysis of vertical cross-sections shows that some subregions show a strong intensity signature that appears to extend from the surface to very deep layers, such as in the Levantine Basin (GR-S and LB), suggesting that MHWs at the surface are able to spread downwards through vertical dynamical processes (e.g., deep convection, downwelling).
All these results highlight the importance of assessing subsurface MHWs from a regional to a local scale, rather than just at the surface, and better understanding the multiple mechanisms involved in the propagation of MHWs from the surface to the subsurface. Further assessment of past and present variability of MHWs is essential to better understand how global warming has led to changes in these events to date and to predict the increased local socio-economic risk they entail. These findings put the spotlight on the potential risks and the need for more context-specific studies.
4.2 Limitations and recommendations
In this subsection, we draw on the experience of this study to identify limitations of and provide recommendations for future studies of MHWs from regional to local approaches. Although some of these limitations and recommendations are described in Oliver et al., 2021, we reiterate and supplement them by highlighting the challenges of studying MHWs, both at the surface and in the subsurface, to then assess their ecological and economic impacts, as well as their drivers, and to meet context-specific user needs.
4.2.1 Detection of MHWs: baseline and threshold
4.2.1.1 Baseline period
The standard statistical definition of MHWs proposed by Hobday et al. (2016) consists of calculating a threshold from a climatology - a baseline covering a specific period. While there is a consensus on this method, as it is used by most of the recent studies addressing MHWs, it has its disadvantages. In this statistical approach, the baseline period plays a key role because it is the one that triggers the detection of the occurrence or not of an event. One of its main advantages is the ability to define a context-specific threshold for each grid point, at any depth and in any oceanic (sub)-region. Thus, the assessments of MHWs from one (sub)-region to another may be potentially fully comparable. However, this reference period is not always the same from one study to another. Even if the general qualitative message remains the same over any period covering the last two or three decades, it is difficult to compare results from different studies quantitatively as different detection methods may affect some characteristics (e.g., number of events and duration) more than others (e.g., intensity). Indeed, all the recent studies on MHWs in the Mediterranean Sea use different time periods. As a result, we see how characteristics of MHWs are sensitive to both the baseline-period and to the chosen percentile used from the statistical-based approach of Hobday et al. (2016). The findings of this study are qualitatively consistent with those from Dayan et al. (2022), which uses the same datasets over the 1993-2019 period using 1993-2014 as the baseline-period, those from Juza et al. (2022), which studies the 1982-2020 period using the 1982–2015 baseline-period, as well as those from Simon et al. (2022), which assess MHWs over 1982-2021 using the 1982-2021 baseline-period. Results here differ from Darmaraki et al. (2019a), most likely because they focused only on summer events over 1982-2017 using the 1982-2012 baseline-period, and used the 99th instead of the 90th percentile as a threshold.
In addition, the baseline period for detecting MHWs is currently defined as a fixed reference period rather than a moving reference period, even if some very recent studies used both to assess to what extent ocean warming trend is responsible of the increase in MHW (e.g., Izquierdo et al., 2022). There are limitations and advantages of using a fixed reference period over a moving period. While a fixed-baseline is more suitable for studying ecosystems with a slow or non-existent capacity to adapt, or for putting the spotlight on long-term changes, a moving-baseline will be more appropriate for considering ecosystems with a faster ability to adapt or to move to new habitats, or shorter-term variability (Oliver et al., 2021).
4.2.1.2 Threshold
There are doubts over whether a statistical definition such as the one from Hobday et al. (2016) is useful for specific stakeholders, such as aquaculture farmers or fisheries organizations who need to assess direct impacts of MHWs on their economic activities. To comment about the impacts on specific species would require the use of an absolute temperature threshold relevant to that species (e.g., Galli et al., 2017). Thresholds would need to be available for all types of species, and achieving this is a crucial step for current and future MHW studies. However, while we consider OHC as more relevant than SST to marine wildlife which travel between various depths, it is perhaps more difficult to provide species-specific OHC thresholds. Finally, Hobday et al. (2016) propose to use 5 days as a minimum MHW duration, but there is no strict universal biological basis behind this number. Moreover, the ability to recover from extreme events, such as brief thermal stress, is different from one species to another. This further increases the complexity of assessing the initial biological parameters which define MWHs, characterize them, and identify their ecological impacts.
4.2.2 OHC as an original indicator for subsurface MHWs
We have analyzed subsurface events in two ways: (1) by studying vertical cross-sections and (2) by using a depth-integrated ocean heat content indicator. Cross-sections display clearly the vertical variability of MHW characteristics for all levels in a target depth, at the expense the computational expense required to detect MHWs at all depth levels. On the other hand, subsurface indicators based on OHC tend to blur the differing variability over a target depth but may be more practically useful for applications involving marine species which rapidly and frequently cycle through various depths. To highlight this point, we note that the OHC-based indicators suggest subsurface events are less frequent than surface events in the reanalysis product. The vertical sections display a more complex variability of MHW number on local scales in few specific locations. Both indicators agree on the general statement that intensity decreases and duration increases with depth. We believe both types of indicator will play a role in future MHW studies and risk assessments.
We note that, in this study, we have provided specific definitions for the “subsurface” which may not be compatible with other studies or interests of stakeholders. Indeed, we highlight that MHWs display interesting and locally-complex characteristics well below 100 m. While the use of 20, 40 and 100 m has justifications, our main focus here is to demonstrate the benefits of using OHC as an indicator of MHWs. It can complement, rather than replace, definitions based on surface temperature. Interactions with marine stakeholders will determine the depth ranges of interest, while current and future ocean reanalyses will be able to provide flexibility in subsurface MHW indicator definitions.
Lastly, regarding MHW intensity, we note that temperature is represented by a familiar unit (°C) while the unit for OHC (J/m2) may be less intuitive to the non-scientist. Moreover, the different units restrict a direct comparison between the surface and proposed subsurface indicators (Section 3.2.2). A possible solution is to use the category system for labeling MHWs (Hobday et al., 2018), which normalizes MHW intensity and provides a clear way of communicating the exceptionality of events. OHC is becoming an important indicator for climate change and ocean state monitoring (e.g. Von Schuckmann et al., 2020), and will hopefully, in the future, be embraced by more stakeholders.
4.2.3 Multiple sub-regional approaches to meet end-user needs
There are many potential types of end-users of MHW indicators, such as marine ecosystem managers, fisheries organizations, MPA managers and aquaculture farmers. Within each type, there may be a need for location-specific and species-specific monitoring and indicators. We cannot tackle each of them simultaneously, and instead must first choose demonstrator examples. As an initial approach, this study focused on EEZ areas. Rather than responding individually to many end-users, taking a national-scale approach can first provide an overview of local conditions. Then, one can “zoom in” to specific stakeholders, armed with the knowledge of characteristics and trends for the national waters in which they find themselves. Moreover, an EEZ-scale approach creates a more direct narrative to capture attention at a national authority or governmental scale.
As highlighted in Dayan et al. (2022), Juza et al. (2022) and this manuscript, the high spatial variability of ocean response to global warming and extreme events in the Mediterranean makes it necessary to further subdivide the largest EEZs for scientific relevance in relation to this variability. This is the reason why we have partitioned the largest EEZs (i.e., Italian, Spain, French and Greek). The regionalization of Mediterranean MHWs at the EEZ level provides a tool for countries to build MHW alert thresholds and risk assessments, not only for the EEZ but also at smaller regional or local levels, as all EEZ MHW metrics consist of gridded maps at the resolution of the original dataset or modeled field. Furthermore, the strengthening of the observing systems required to improve the accuracy of MHW detection and risk assessments in national waters will be encouraged by the need of countries to develop national adaptation strategies. An exciting possibility is to provide an interactive tool so that a wider range of users and stakeholders can choose individually the area of interest for a specific indicator. This could include splitting geographical regions into a range of ‘eco-regions’ and ‘sub-ecoregions’. The analysis shown here provides sufficient motivation for this to begin, taking into account surface and subsurface indicators.
4.2.4 Reliability of reanalyses for MHW detection
Lower resolution ocean simulations have been found to detect fewer, longer and less intense events than observations globally (Pilo et al., 2019), and the same has been found for reanalyses in the Mediterranean Sea (Dayan et al., 2022), presumably due to their reduced ability to capture smaller-scale variability. Biases in MEDREA SST were found to be quite homogeneous across the basin and across seasons9, unlike the patterns in bias of MHW characteristics seen in Figure 4. Here, on average, MEDREA overestimates duration and underestimates number and intensity, despite being of higher resolution than the observations. The reasons for model and reanalysis differences are clearly more complex than resolution alone. For example, biases/errors are not consistent throughout the record but instead are reduced with the (typically recent) increases in the amount of data assimilated in the reanalysis (Escudier et al., 2021). To truly understand accuracy in MHW reconstruction, there would need to be a comparison of MHW indicators in a range of reanalysis configurations (e.g. with assimilation turned off, different forcings and resolutions).
4.2.5 Needs for high resolution reanalysis and deployment of context-specific observing systems
The high resolution of the datasets, both reanalysis and observations, used in this kind of study is crucial to assess MHW impacts from surface to subsurface (Dayan et al., 2022; Garrabou et al., 2022), especially to detect their role in mortality events (Garrabou et al., 2019; Garrabou et al., 2022) or to meet the needs of very local stakeholders, such as aquaculture farms. Depending on the grid resolution, mesoscale and sub-mesoscale drivers of MHWs, such as mixing and downwelling caused by eddies or waves, are more or less well incorporated in reanalysis. Moreover, some Mediterranean countries have a very small EEZ area which cannot be properly represented by an insufficient model grid resolution. This raises the question of which model and reanalysis are best to assess MHWs and define indicators, and whether they can be trusted to accurately depict events. There is no clear best practice in this case, but by using a sub-regional approach based on the nationally well-defined EEZ areas, this study highlights the need to develop high resolution reanalysis products as consistent as possible with the observations and to expand an - existing but weak - context-specific observing system not only at the surface but also in the subsurface (the first 100 m), from sub-regional scales to more local scales.
4.2.6 Needs for evaluating the physical mechanisms involved in the formation of MHWs
The main purpose of this study was to evaluate the oceanic signal related to MHWs detected from the surface to the 100 m of depth and to highlight the need to deploy more extensive monitoring systems, to enable the development of robust adaptation strategies and better address the impacts of MHWs. To better understand the mechanisms of formation and propagation of MHWs would require extending significatively the present investigation to address the local and remote factors affecting MHW development. The importance of the role of atmospheric and oceanic factors - both local and remote - in understanding, describing and/or forecasting MHWs is undeniable, in particular the quantification of the role of the different drivers at local and sub-regional scales.
4.2.7 Showcases of applications
Indicators are used for many purposes, including the assessment of the environmental or ecological status of the marine environment, e.g., required by the EU Marine Strategy Framework Directive (MSFD) and Water Framework Directive (WFD). MHW occurrence is one such indicator which is increasing in importance and use. While the literature on MHW studies (essentially focusing on basin-scale events) amplifies rapidly as well as the number reports of recent and more intense MHWs, so does the demand for event detection and risk assessments at regional and local scales from the specific end users groups we have been discussing in this manuscript. Within the EuroSea H2020 EU project we have been developing a direct dialogue with exponents of these end-user groups in various regions of European seas (Ireland, Baltic and Mediterranean seas). The conclusions to the various discussions has been the implementation of test cases for different users groups. These have shown that the deployment of in situ observations (moorings or vertical profiles achieved with Argo profiling floats, for example) provide direct robust information on the development of MHWs and this at the depth of interest of the user group which is general 10 m or deeper (Deliverables 6.1 and 2.4 from https://eurosea.eu/deliverables/). Also within the EuroSea project an extended deployment of observations in the Baltic EEZs has shown to provide greater improvements on MHW detection and predictions, at scales smaller than EEZs (Deliverables 6.2 from https://eurosea.eu/deliverables/), which showcase the large benefit of our approach to end users of MHW information.
Data availability statement
The original contributions presented in the study are included in the article/Supplementary Material. Further inquiries can be directed to the corresponding author.
Author contributions
HD, RM, MJ, SM and SS contributed to conception and design of the study. HD, RM and MJ performed the statistical analysis and the design of the figures. HD wrote the first draft of the manuscript. HD, RM and MJ, SS and SM wrote sections of the manuscript. All authors contributed to the article and approved the submitted version.
Funding
This project has received funding from the European Union’s Horizon 2020 research and innovation programme under grant agreement N° 862626
Acknowledgments
We acknowledge the H2020 EuroSea project which made this study possible. The EuroSea project aims to improve the European ocean observing system as an integrated entity within a global context, delivering ocean observations and forecasts to advance scientific knowledge about ocean climate, marine ecosystems, and their vulnerability to human impacts and to demonstrate the importance of the ocean to an economically viable and healthy society. We also acknowledge the authors of Hobday et al. (2016) who have made available online their numerical codes (https://github.com/ecjoliver/marineHeatWaves) to compute the set of MHW metrics. This study has been conducted using E.U. Copernicus Marine Service Information (10.25423/CMCC/MEDSEA_MULTIYEAR_PHY_006_004_E3R1; 10.48670/moi-00173). This study was fully funded by the European Union’s Horizon 2020 research and innovation programme under grant agreement No 862626, as part of the EuroSea project.
Conflict of interest
The authors declare that the research was conducted in the absence of any commercial or financial relationships that could be construed as a potential conflict of interest.
Publisher’s note
All claims expressed in this article are solely those of the authors and do not necessarily represent those of their affiliated organizations, or those of the publisher, the editors and the reviewers. Any product that may be evaluated in this article, or claim that may be made by its manufacturer, is not guaranteed or endorsed by the publisher.
Supplementary material
The Supplementary Material for this article can be found online at: https://www.frontiersin.org/articles/10.3389/fmars.2023.1045138/full#supplementary-material
Footnotes
- ^ https://www.unep.org/unepmap/resources/factsheets/biological-diversity (accessed on 23 November, 2022).
- ^ https://planettuna.com/en/ask-a-scientist/ (accessed on 22 November, 2022).
- ^ https://github.com/ecjoliver/marineHeatWaves
- ^ https://doi.org/10.48670/moi-00173.
- ^ 10.25423/CMCC/MEDSEA_MULTIYEAR_PHY_006_004_E3R1
- ^ https://catalogue.marine.copernicus.eu/documents/QUID/CMEMS-MED-QUID-006-004.pdf
- ^ www.marineregions.org
- ^ https://catalogue.marine.copernicus.eu/documents/QUID/CMEMS-MED-QUID-006-004.pdf
- ^ https://catalogue.marine.copernicus.eu/documents/QUID/CMEMS-MED-QUID-006-004.pdf
References
Alvarez-Berastegui D., Ingram G. W., Reglero P., Ferra P., Alemany F. (2018). Changes of bluefin tuna (Thunnus thynnus) larvae fishing methods over time in the western Mediterranean, calibration and larval indices updating. Col Vol Sci. Pap ICCAT 74 (6), 2772–2783.
Androulidakis Y. S., Krestenitis Y. N. (2022). Sea Surface temperature variability and marine heat waves over the Aegean, Ionian, and Cretan seas from 2008–2021. J. Mar. Sci. Eng. 10 (1), 42. doi: 10.3390/jmse10010042
Arias-Ortiz A., Serrano O., Masqué P., Lavery P. S., Mueller U., Kendrick G. A., et al. (2018). A marine heatwave drives massive losses from the world’s largest seagrass carbon stocks. Nat. Climate Change 8 (4), 338–344. doi: 10.1038/s41558-018-0096-y
Asner G. P., Vaughn N. R., Martin R. E., Foo S. A., Heckler J., Neilson B. J., et al (2022). Mapped coral mortality and refugia in an archipelago-scale marine heat wave. Proc. Natl. Acad. Sci. 119 (19), e2123331119. doi: 10.1073/pnas.2123331119
Bakun A., Agostini V. N. (2001). Seasonal patterns of wind-induced upwelling/downwelling in the Mediterranean Sea. Scientia Marina 65 (3), 243–257. doi: 10.3989/scimar.2001.65n3243
Benoit G., Comeau A. (2005). A sustainable future for the Mediterranean: the blue plan’s environment and development outlook (London: Routledge). doi: 10.4324/9781849770323
Bensoussan N., Chiggiato J., Buongiorno Nardelli B., Pisano A., Garrabou,. J. (2019). Insights on 2017 marine heat waves in the Mediterranean sea. in: Copernicus marine service ocean state report, issue 3. J. Operational Oceanography 12 (1), s26–s30. doi: 10.1080/1755876X.2019.1633075
Bianchi C., Morri C. (2000). Marine biodiversity of the Mediterranean Sea: Situation, problems and prospects for future research. Mar. Pollut. Bull. 40 (5), 367–376. doi: 10.1016/S0025-326X(00)00027-8
Bianchi C. N., Morri C., Chiantore M., Montefalcone M., Parravicini V., Rovere A. (2012). “Mediterranean Sea Biodiversity between the legacy from the past and a future of change,” in Life in the Mediterranean Sea: a look at habitat changes. Ed. Stambler N. (New York, NY: Nova Science Publishers), 1–60.
Cerrano C., Bavestrello G., Bianchi C. N., Cattaneo‐Vietti R., Bava S., Morganti C., et al. (2000). A catastrophic mass-mortality episode of gorgonians and other organisms in the ligurian Sea (northwestern Mediterranean). Ecol. Lett. 3 (4), 284–293. doi: 10.1046/j.1461-0248.2000.00152.x
Cheng L., Trenberth K., Fasullo J., Abraham J., Boyer T., Von Schuckmann K., et al. (2018a). Taking the pulse of the planet. Eos 99, 14–16. doi: 10.1029/2017EO081839
Cheng L., Wang G., Abraham J., Huang G. (2018b). Decadal ocean heat redistribution since the late 1990s and its association with key climate modes. Climate 6 (4), 91. doi: 10.3390/cli6040091
Coll M., Piroddi C., Steenbeek J., Kaschner K., Ben Rais Lasram F., Aguzzi J., et al. (2010). The biodiversity of the Mediterranean Sea: Estimates, patterns, and threats. PloS One 5 (8), e11842. doi: 10.1371/journal.pone.0011842
Cramer W., Guiot J., Fader M., Garrabou J., Gattuso J. P., Iglesias A., et al. (2018). Climate change and interconnected risks to sustainable development in the Mediterranean. Nat. Climate Change 8 (11), 972–980. doi: 10.1038/s41558-018-0299-2
Danovaro R. (2003). Pollution threats in the Mediterranean Sea: An overview. Chem. Ecol. 19 (1), 15–32. doi: 10.1080/0275754031000081467
Darmaraki S., Somot S., Sevault F., Nabat P., Cabos Narvaez W. D., Cavicchia L., et al. (2019b). Future evolution of marine heatwaves in the Mediterranean Sea. Climate Dynamics 53 (3), 1371–1392. doi: 10.1007/s00382-019-04661-z
Darmaraki S., Somot S., Sevault F., Nabat P. (2019a). Past variability of Mediterranean Sea marine heatwaves. Geophysical Res. Lett. 46 (16), 9813–9823. doi: 10.1029/2019GL082933
Dayan H., McAdam R., Speich S., Masina S. (2022). Diversity of marine heatwave trends across the Mediterranean Sea over the last decades. in: Copernicus ocean state report, issue 6. J. Operational Oceanography 15 (1), 1–220. doi: 10.1080/1755876X.2022.2095169
Diaz-Almela E., Marba N., Duarte C. M. (2007). Consequences of Mediterranean warming events in seagrass (posidonia oceanica) flowering records. Global Change Biol. 13 (1), 224–235. doi: 10.1111/j.1365-2486.2006.01260.x
Diffenbaugh N. S., Pal J. S., Giorgi F., Gao X. (2007). Heat stress intensification in the Mediterranean climate change hotspot. Geophys. Res. Lett. 34 (11), L11706. doi: 10.11029/12007GL030000
Dobricic S., Pinardi N. (2008). An oceanographic three-dimensional variational data assimilation scheme. Ocean Model. 22 (3-4), 89–105. doi: 10.1016/j.ocemod.2008.01.004
Elmqvist T., Redman C. L., Barthel S., Costanza R. (2013). “History of urbanization and the missing ecology,” in Urbanization, biodiversity and ecosystem services: Challenges and opportunities. Eds. Elmqvist T., Fragkias M., Goodness J., Güneralp B., Marcotullio P. J., McDonald R. I., Parnell S., Schewenius M., Sendstad M., Seto K. C., Wilkinson C. (Netherlands: Springer), 13–30. doi: 10.1007/978-94-007-7088-1
Elzahaby Y., Schaeffer A. (2019). Observational insight into the subsurface anomalies of marine heatwaves. Front. Mar. Sci. 6. doi: 10.3389/fmars.2019.00745
Escudier R., Clementi E., Cipollone A., Pistoia J., Drudi M., Grandi A., et al. (2021). A high resolution reanalysis for the Mediterranean Sea. Front. Earth Sci. 9, 1060. doi: 10.3389/feart.2021.702285
Escudier R., Clementi E., Omar M., Cipollone A., Pistoia J., Aydogdu A., et al. (2020). Mediterranean Sea Physical reanalysis (CMEMS MED-currents) (Version 1) set (Copernicus Marine Service: Copernicus Monitoring Environment Marine Service (CMEMS). doi: 10.25423/CMCC/MEDSEA_MULTIYEAR_PHY_006_004_E3R1
Flanders Marine Institute (2019) Maritime boundaries geodatabase: Maritime boundaries and exclusive economic zones (200NM), version 11. Available at: https://www.marineregions.org/.
Frölicher T. L., Fischer E. M., Gruber N. (2018). Marine heatwaves under global warming. Nature 560 (7718), 360–364. doi: 10.1038/s41586-018-0383-9
Galli G., Solidoro C., Lovato T. (2017). Marine heat waves hazard 3D maps and the risk for low motility organisms in a warming Mediterranean Sea. Front. Mar. Sci. 4. doi: 10.3389/fmars.2017.00136
Gambaiani D. D., Mayol P., Isaac S. J., Simmonds M. P. (2009). Potential impacts of climate change and greenhouse gas emissions on Mediterranean marine ecosystems and cetaceans. J. Mar. Biol. Assoc. U. K. 89 (1), 179–201. doi: 10.1017/S0025315408002476
Garrabou J., Coma R., Bensoussan N., Bally M., Chevaldonné P., Cigliano M., et al. (2009). Mass mortality in northwestern Mediterranean rocky benthic communities: effects of the 2003 heat wave. Global Change Biol. 15 (5), 1090–1103. doi: 10.1111/j.1365-2486.2008.01823.x
Garrabou J., Gómez-Gras D., Ledoux J.-B., Linares C., Bensoussan N., López-Sendino P., et al. (2019). Collaborative database to track mass mortality events in the Mediterranean Sea. Front. Mar. Sci. 6. doi: 10.3389/fmars.2019.00707
Garrabou J., Gómez-Gras D., Medrano A., Cerrano C., Ponti M., Schlegel R., et al. (2022). Marine heatwaves drive recurrent mass mortalities in the Mediterranean Sea. Global Change Biol. 28 (19), 5708–5725. doi: 10.1111/gcb.16301
Garrabou J., Perez T., Sartoretto S., Harmelin J. G. (2001). Mass mortality event in red coral corallium rubrum populations in Provence region (France, NW Mediterranean). Mar. Ecol. Prog. Ser. 217, 263–272. doi: 10.3354/meps217263
Giorgi F. (2006). Climate change hot-spots. Geophys. Res. Lett. 33 (8), L08707. doi: 10.1029/2006GL025734
Giorgi F., Lionello P. (2008). Climate change projections for the Mediterranean region. Global planetary Change 63 (2-3), 90–104. doi: 10.1016/j.gloplacha.2007.09.005
Guiot J., Cramer W. (2016). Climate change: the 2015 Paris agreement thresholds and Mediterranean basin ecosystems. Science 354 (6311), 465–468. doi: 10.1126/science.aah5015
Hamed K. H., Ramachandra Rao A. (1998). A modified Mann-Kendall trend test for autocorrelated data. J. Hydrology 204 (1-4), 182–196. doi: 10.1016/S0022-1694(97)00125-X
Hansen J., Sato M., Kharecha P., Von Schuckmann K. (2011). Earth’s energy imbalance and implications. Atmospheric Chem. Phys. 11 (24), 13421–13449. doi: 10.5194/acp-11-13421-2011
Hersbach H., Bell B., Berrisford P., Hirahara S., Horányi A., Muñoz-Sabater J., et al. (2020). The ERA5 global reanalysis. Q. J. R. Meteorological Soc. 146 (730), 1999–2049. doi: 10.1002/qj.3803
Hobday A. J., Alexander L. V., Perkins S. E., Smale D. A., Straub S. C., Oliver E. C. J., et al. (2016). A hierarchical approach to defining marine heatwaves. Prog. Oceanography 141, 227–238. doi: 10.1016/j.pocean.2015.12.014
Hobday A. J., Oliver E. C., Gupta A. S., Benthuysen J. A., Burrows M. T., Donat M. G., et al. (2018). Categorizing and naming marine heatwaves. Oceanography 31 (2), 162–173. doi: 10.5670/oceanog.2018.205
Holbrook N. J., Gupta A. S., Oliver E. C., Hobday A. J., Benthuysen J. A., Scannell H. A., et al. (2020). Keeping pace with marine heatwaves. Nat. Rev. Earth Environ. 1 (9), 482–493. doi: 10.1038/s43017-020-0068-4
Hughes T. P., Kerry J. T., Baird A. H., Connolly S. R., Dietzel A., Eakin C. M., et al. (2018). Global warming transforms coral reef assemblages. Nature 556 (7702), 492–496. doi: 10.1038/s41586-018-0041-2
Ibrahim O., Mohamed B., Nagy H. (2021). Spatial variability and trends of marine heat waves in the Eastern Mediterranean Sea over 39 years. J. Mar. Sci. Eng. 9 (6), 643. doi: 10.3390/jmse9060643
IPCC (2014). Climate change 2014: Mitigation of climate change. contribution of working group III to the fifth assessment report of the intergovernmental panel on climate change. Eds. Edenhofer O., Pichs-Madruga R., Sokona Y., Farahani E., Kadner S., Seyboth K., Adler A., Baum I., Brunner S., Eickemeier P., Kriemann B., Savolainen J., Schlömer S., Stechow C.v., Zwickel T., Minx J. C. (Cambridge, United Kingdom and New York, NY, USA: Cambridge University Press). doi: 10.1017/cbo9781107415416
IPCC (2021). Climate change 2021: The physical science basis. contribution of working group I to the sixth assessment report of the intergovernmental panel on climate change. Eds. Masson-Delmotte V., Zhai P., Pirani A., Connors S. L., Péan C., Berger S., Caud N., Chen Y., Goldfarb L., Gomis M. I., Huang M., Leitzell K., Lonnoy E., Matthews J. B. R., Maycock T. K., Waterfield T., Yelekçi O., Yu R., Zhou B. (Cambridge, United Kingdom and New York, NY, USA: Cambridge University Press). doi: 10.1017/9781009157896
IPCC (2022). Climate change 2022: Impacts, adaptation and vulnerability. contribution of working group II to the sixth assessment report of the intergovernmental panel on climate change. Eds. Pörtner H.-O., Roberts D. C., Tignor M., Poloczanska E. S., Mintenbeck K., Alegría A., Craig M., Langsdorf S., Löschke S., Möller V., Okem A., Rama B. (Cambridge University Press, Cambridge, UK and New York, NY, USA: Cambridge University Press), 3056. doi: 10.1017/9781009325844
Izquierdo P., Taboada F. G., González-Gil R., Arrontes J., Rico J. M. (2022). Alongshore upwelling modulates the intensity of marine heatwaves in a temperate coastal sea. Sci. Total Environ. 835, 155478. doi: 10.1016/j.scitotenv.2022.155478
Juza M., Fernández-Mora A., Tintoré J. (2022). Sub-Regional marine heat waves in the Mediterranean Sea from observations: long-term surface changes, subsurface and coastal responses. Front. Mar. Sci. 9, 785771. doi: 10.3389/fmars.2022.785771
Juza M., Tintoré J. (2021). Multivariate Sub-regional ocean indicators in the Mediterranean Sea: From event detection to climate change estimations. Front. Mar. Sci. 8. doi: 10.3389/fmars.2021.610589
Kubin E., Menna M., Mauri E., Notarstefano G., Poulain P.-M. (2022). Heat content and temperature trends in the Mediterranean Sea as derived by argo float data, (2005– 2020) (Vienna, Austria: EGU General Assembly 2022), EGU22–E4899. doi: 10.5194/egusphere-egu22-4899
Lavigne H., D’ortenzio F., Ribera D., Alcalà M., Claustre H., Sauzède R., et al. (2015). On the vertical distribution of the chlorophyll a concentration in the Mediterranean sea: a basin-scale and seasonal approach. Biogeosciences 12 (16), 5021–5039. doi: 10.5194/bg-12-5021-2015
Linares C., Coma R., Diaz D., Zabala M., Hereu B., Dantart L. (2005). Immediate and delayed effects of a mass mortality event on gorgonian population dynamics and benthic community structure in the NW Mediterranean Sea. Mar. Ecol. Prog. Ser. 305, 127–137. doi: 10.3354/meps305127
Lionello P. (2012). The climate of the Mediterranean region: From the past to the future (Elsevier). doi: 10.1016/b978-0-12-416042-2.00011-2
Liquete C., Piroddi C., Macías D., Druon J. N., Zulian G. (2016). Ecosystem services sustainability in the Mediterranean Sea: assessment of status and trends using multiple modelling approaches. Sci. Rep. 6 (1), 1–14. doi: 10.1038/srep34162
Mariotti A., Zeng N., Yoon J.-H., Artale V., Navarra A., Alpert P., et al. (2008). Mediterranean Water cycle changes: transition to drier 21st century conditions in observations and CMIP3 simulations. Environ. Res. Lett. 3 (4), 44001. doi: 10.1088/1748-9326/3/4/044001
Martín-López B., Oteros-Rozas E., Cohen-Shacham E., Santos-Martín F., Nieto-Romero M., Carvalho-Santos C., et al. (2016). “Ecosystem services supplied by mediterranean basin ecosystems,” in Routledge handbook of ecosystem services. Eds. Potschin M., Haines-Young R., Fish R., Turner R. K. (London: Routledge), 405–414.
Merchant C. J., Embury O., Bulgin C. E., Block T., Corlett G. K., Fiedler E., et al. (2019). Satellite-based time-series of sea-surface temperature since 1981 for climate applications. Sci. Data 6 (1), 1–18. doi: 10.1038/s41597-019-0236-x
Mills K. E., Pershing A. J., Brown C. J., Chen Y., Chiang F. S., Holland D. S., et al. (2013). Fisheries management in a changing climate: lessons from the 2012 ocean heat wave in the Northwest Atlantic. Oceanography 26 (2), 191–195. doi: 10.5670/oceanog.2013.27
Mohamed B., Nagy H., Ibrahim O. (2021). Spatiotemporal variability and trends of marine heat waves in the red Sea over 38 years. J. Mar. Sci. Eng. 9 (8), 842. doi: 10.3390/jmse9080842
Mohamed B., Skliris N. (2022). Steric and atmospheric contributions to interannual sea level variability in the eastern mediterranean sea over 1993–2019. Oceanologia 64 (1), 5062. doi: 10.1016/j.oceano.2021.09.001
Munari C. (2011). Effects of the 2003 European heatwave on the benthic community of a severe transitional ecosystem (Comacchio saltworks, Italy). Mar. pollut. Bull. 62 (12), 2761–2770. doi: 10.1016/j.marpolbul.2011.09.011
Navarra A., Tubiana L. (2013). Regional assessment of climate change in the Mediterranean (Dordrecht: Springer), 217–220. doi: 10.1007/978-94-007-5772-1
Oliver E. C., Benthuysen J. A., Darmaraki S., Donat M. G., Hobday A. J., Holbrook N. J., et al. (2021). Marine heatwaves. Annu. Rev. Mar. Sci. 13, 313–342. doi: 10.1146/annurev-marine-032720-095144
Oliver E. C. J., Donat M. G., Burrows M. T., Moore P. J., Smale D. A., Alexander L. V., et al. (2018). Longer and more frequent marine heatwaves over the past century. Nat. Commun. 9 (1), 1–12. doi: 10.1038/s41467-018-03732-9
Pastor F., Khodayar S. (2022). Marine heat waves: Characterizing a major climate impact in the Mediterranean. Sci. Total Environ. 861, 160621. doi: 10.1016/j.scitotenv.2022.160621
Perez T., Garrabou J., Sartoretto S., Harmelin J. G., Francour P., Vacelet J. (2000). Mortalité massive d’invertébrés marins: un événement sans précédent en méditerranée nord-occidentale. Comptes Rendus l'Académie Des. Sciences-Series III-Sciences la Vie 323 (10), 853–865. doi: 10.1016/S0764-4469(00)01237-3
Pilo G. S., Holbrook N. J., Kiss A. E., Hogg A. M. (2019). Sensitivity of marine heatwave metrics to ocean model resolution. Geophysical Res. Lett. 46 (24), 14604–14612. doi: 10.1029/2019GL084928
Pinardi N., Cessi P., Borile F., Wolfe C. L. (2019). The Mediterranean sea overturning circulation. J. Phys. Oceanography 49 (7), 1699–1721. doi: 10.1175/JPO-D-18-0254.1
Pinardi N., Zavatarelli M., Adani M., Coppini G., Fratianni C., Oddo P., et al. (2015). Mediterranean Sea Large-scale, low-frequency ocean variability and water mass formation rates from 1987 to 2007: a retrospective analysis. Prog. Oceanography 132, 318–332. doi: 10.1016/j.pocean.2013.11.003
Pisano A., Buongiorno Nardelli B., Tronconi C., Santoleri R. (2016). The new Mediterranean optimally interpolated pathfinder AVHRR SST dataset, (1982–2012). Remote Sens. Environ. 176, 107–116. doi: 10.1016/j.rse.2016.01.019
Pisano A., Marullo S., Artale V., Falcini F., Yang C., Leonelli F. E., et al. (2020). New evidence of mediterranean climate change and variability from sea surface temperature observations. Remote Sens. 12 (1), 132. doi: 10.3390/rs12010132
Sacchi J. (2011). Analysis of economic activities in the Mediterranean: Fishery and aquaculture sectors (Plan Bleu: Valbonne).
Saha K., Zhao X., Zhang H. M., Casey K. S., Zhang D., Baker-Yeboah S., et al. (2018). AVHRR pathfinder version 5.3 level 3 collated (L3C) global 4km sea surface temperature for 1981-present (Asheville, NC, USA: NOAA National Centers for Environmental Information). doi: 10.7289/v52j68xx
Santora J. A., Mantua N. J., Schroeder I. D., Field J. C., Hazen E. L., Bograd S. J., et al. (2020). Habitat compression and ecosystem shifts as potential links between marine heatwave and record whale entanglements. Nat. Commun. 11 (1), 1–12. doi: 10.1038/s41467-019-14215-w
Schaeffer A., Roughan M. (2017). Subsurface intensification of marine heatwaves off southeastern Australia: the role of stratification and local winds. Geophysical Res. Lett. 44 (10), 5025–5033. doi: 10.1002/2017gl073714
Schiaparelli S., Castellano M., Povero P., Sartoni G., Cattaneo-Vietti R. (2007). A benthic mucilage event in north-Western Mediterranean Sea and its possible relationships with the summer 2003 European heatwave: short term effects on littoral rocky assemblages. Mar. Ecol. 28 (3), 341–353. doi: 10.1111/j.1439-0485.2007.00155.x
Simon A., Plecha S. M., Russo A., Teles-Machado A., Donat M. G., Auger P.-A., et al. (2022). Hot and cold marine extreme events in the Mediterranean over the period 1982-2021. Front. Mar. Sci. 9. doi: 10.3389/fmars.2022.892201
Siokou-Frangou I., Christaki U., Mazzocchi M. G., Montresor M., Ribera d'Alcalá M., Vaqué D., et al. (2010). Plankton in the open Mediterranean Sea: a review. Biogeosciences 7 (5), 1543–1586. doi: 10.5194/bg-7-1543-2010
Smale D. A., Wernberg T., Oliver E. C., Thomsen M., Harvey B. P., Straub S. C., et al. (2019). Marine heatwaves threaten global biodiversity and the provision of ecosystem services. Nat. Climate Change 9 (4), 306–312. doi: 10.1038/s41558-019-0412-1
Smith K. E., Burrows M. T., Hobday A. J., King N. G., Moore P. J., Sen Gupta A., et al. (2022). Biological impacts of marine heatwaves. Annu. Rev. Mar. Sci. 15, 12.1–12.27. doi: 10.1146/annurev-marine-032122-121437
Thomson R. E., Emery W. J. (2014). Data analysis methods in physical oceanography. 3rd ed (Amsterdam, The Netherlands: Elsevier Inc).
Trenberth K. E., Cheng L., Jacobs P., Zhang Y., Fasullo J. (2018). Hurricane Harvey links to ocean heat content and climate change adaptation. Earth's Future 6 (5), 730–744. doi: 10.1029/2018EF000825
Tsikliras A. C., Dinouli A., Tsalkou E. (2013). Exploitation trends of the Mediterranean and black Sea fisheries. Acta Adriatica 54 (2), 273–282.
Tsimplis M. N., Calafat F. M., Marcos M., Jordà G., Gomis D., Fenoglio-Marc L., et al. (2013). The effect of the NAO on sea level and on mass changes in the Mediterranean Sea. J. Geophysical Research: Oceans 118 (2), 944–952. doi: 10.1002/jgrc.20078
Turner M. ,. G., Calder W. J., Cumming G. S., Hughes T. P., Jentsch A., LaDeau S. L., et al. (2020). Climate change, ecosystems and abrupt change: Science priorities. Philos. Trans. R. Soc. B 375 (1794), 20190105. doi: 10.1098/rstb.2019.0105
Vasilakopoulos P., Maravelias C. D., Tserpes G. (2014). The alarming decline of Mediterranean fish stocks. Curr. Biol. 24 (14), 1643–1648. doi: 10.1016/j.cub.2014.05.070
Von Schuckmann K., Palmer M. D., Trenberth K. E., Cazenave A., Chambers D., Champollion N., et al. (2016). An imperative to monitor earth’s energy imbalance. Nat. Climate Change 6 (2), 138–144. doi: 10.1038/nclimate2876
Von Schuckmann K., Traon P.-Y. L., Smith N., Pascual A., Djavidnia S., Gattuso J.-P., et al. (2020). Copernicus Marine service ocean state report, issue 4. J. Operational Oceanography 13, s1–s172. doi: 10.1080/1755876X.2020.1785097
Wang F., Shao W., Yu H., Kan G., He X., Zhang D., et al. (2020). Re-evaluation of the power of the Mann-Kendall test for detecting monotonic trends in hydrometeorological time series. Front. Earth Sci. 8. doi: 10.3389/feart.2020.00014
Wernberg T. (2021). “Marine heatwave drives collapse of kelp forests in Western Australia,” in Ecosystem collapse and climate change (Cham: Springer), 325–343. doi: 10.1016/j.cub.2020.01.051
Wijffels S., Roemmich D., Monselesan D., Church J., Gilson J. (2016). Ocean temperatures chronicle the ongoing warming of earth. Nat. Climate Change 6 (2), 116–118. doi: 10.1038/nclimate2924
Wilks D. S. (2011). Statistical methods in the atmospheric sciences (New York, NY, USA: Academic Press).
Keywords: marine heat waves, Mediterraenan sea, national stakeholders, Exclusive Economic Zone, long-term changes, ocean heat content
Citation: Dayan H, McAdam R, Juza M, Masina S and Speich S (2023) Marine heat waves in the Mediterranean Sea: An assessment from the surface to the subsurface to meet national needs. Front. Mar. Sci. 10:1045138. doi: 10.3389/fmars.2023.1045138
Received: 15 September 2022; Accepted: 16 January 2023;
Published: 30 January 2023.
Edited by:
David Lee VanderZwaag, Dalhousie University, CanadaCopyright © 2023 Dayan, McAdam, Juza, Masina and Speich. This is an open-access article distributed under the terms of the Creative Commons Attribution License (CC BY). The use, distribution or reproduction in other forums is permitted, provided the original author(s) and the copyright owner(s) are credited and that the original publication in this journal is cited, in accordance with accepted academic practice. No use, distribution or reproduction is permitted which does not comply with these terms.
*Correspondence: Sabrina Speich, c2FicmluYS5zcGVpY2hAbG1kLmVucy5mcg==
†ORCID: Hugo Dayan, orcid.org/0000-0002-8705-8154