 Jørgen Bendtsen
 Clara R. Vives
 Katherine Richardson
- 1Section for Geobiology, Globe Institute, University of Copenhagen, Copenhagen, Denmark
- 2Institute for Marine and Antarctic Studies, University of Tasmania, Hobart, TAS, Australia
- 3Australian Research Council Centre of Excellence for Climate Extremes, University of Tasmania, Hobart, TAS, Australia
- 4Center for Macroecology, Evolution and Climate, Globe Institute, University of Copenhagen, Copenhagen, Denmark
Combining information on the vertical distribution of nutrients and remote sensing can potentially improve estimates of ocean primary production (PP). Here, we employ in situ observations of chlorophyll a and nitrate from biogeochemical Argo floats deployed in the North Atlantic together with remote sensing to estimate PP and compare these results to estimates based on model approaches not including vertically resolved nutrient distributions. Analysis of the float data shows chlorophyll a distribution relates closely to both nutricline depth and latitude, and these relationships can be explained by nutrient and light availability. PP estimates based on satellite and Argo-observations also relate to both latitude and nutrient distributions. An analysis of these float-based PP estimates shows that large-scale patterns of total water column PP and associated variability are consistent with expected photosynthetic responses to different combinations of light and nutrient availability. When PP-estimates based solely on surface observations were plotted against light and nutrient fields, significant structural differences emerged compared with estimates that included subsurface observations, in particular in oligotrophic areas and areas with a shallow nutricline. The combination of in situ water column observations with remote sensing potentially opens a new phase in the estimation of ocean primary production.
1 Introduction
A weakness in estimating ocean primary production (PP) from remotely sensed surface data is that assumptions regarding the vertical distribution of PP are by necessity based on patterns derived from archived water column profiles, usually of chlorophyll distribution. Richardson and Bendtsen (2019) showed that the percentage of water column PP occurring below 10 m exhibits large geographic variability, i.e. ~10-90%, and that this variability can be related to vertical nutrient distributions. In an ocean changing in response to climate change, the vertical structure of the water column and, as a result, vertical distributions of nutrients are also changing. Thus, the assumption that current vertical distributions of PP are similar to the historical ones becomes a potential source of error in PP estimates based only on the remote sensing of surface ocean characteristics. Here, we employ in situ nutrient distributions recorded using BGC-Argo floats in the North Atlantic to estimate PP and compare the results obtained to estimates based on more traditional methods using surface optical characteristics obtained through remote sensing. We find that the estimates based on float data are more consistent with expected photosynthetic response to varying light and nutrient combinations than estimates where in situ vertical nutrient distributions are not included.
Current estimates of global ocean primary production (PP) range between 36–67 Pg C yr-1 in data-driven models based on satellite observations (Sathyendranath et al., 2020) and between 23-56 Pg C yr-1 in mechanistic models implemented in ocean circulation models (Tagliabue et al., 2021). A global oceanic PP of 47 Pg C yr-1 was proposed as a representative global value in the latest IPCC report (Gulev et al., 2021), however, this estimate was associated with a low confidence. The relatively large spread between estimates derived using different PP-models reflects conceptual differences in model-architecture as well as different parameterizations of critical parameters for calculating PP (Kulk et al., 2020). Thus, improvement of the global PP-estimate requires both development of the conceptual model design and a better understanding of critical parameters of photosynthetic response to light and nutrients. Bottlenecks for further improvement of these models include the relative paucity of observational data used for estimating PP and a lack of knowledge concerning the distribution of the most important variables for determining PP, i.e., chlorophyll concentration, light/nutrient availability, and photosynthetic response characteristics. Satellite observation of surface optical characteristics cannot provide the information regarding subsurface distributions of chlorophyll and nutrients that is required for validating and improving existing models.
The distribution of chlorophyll is driven by the interplay between photosynthetic growth limited by light and nutrients, mortality due to grazing and microbial loss, and mixing and advection by ocean currents (e.g., Beckmann and Hense, 2007). Nevertheless, the subsurface chlorophyll distribution can, in many cases, be explained by phytoplankton growth and hydrography (Cullen, 1982). Nutrients in the open ocean are supplied to the productive surface waters through mixing with nutrient rich water from deeper in the water column. The degree of mixing varies with local dynamics due to actions from air-sea exchange and mixing by currents. This subsurface supply of nutrients often results in a nutrient depleted surface layer during the growth season and a steep nutricline towards nutrient-rich deeper water at the base of the productive layer. High concentrations of chlorophyll are therefore often associated with the depth of the nutricline where optimal conditions for phytoplankton growth in terms of nutrient availability and light are found (Herbland and Voituriez, 1979; Cullen, 2015).
The close relationship between chlorophyll and nutrient distributions led to the early suggestion that production might simply be estimated from vertical profiles of nutrients (Herbland and Voituriez, 1979). Vertical distributions of nutrients are, however, not routinely included in models estimating marine PP despite it being recognized that only about 25% of global ocean PP takes place in the upper 10 m and that the fraction of subsurface PP increases towards areas with a deep nutricline (Richardson and Bendtsen, 2019). Although general relationships between PP and subsurface nutrient distribution have been known for some time, the temporal and spatial variability in light and nutrient conditions between high and low latitudes, combined with limited in situ data for estimation of PP, have made it difficult to discern large-scale geographic patterns in PP based on local relationships between nutrients, light and PP.
The comprehensive data archive with measurements from Biogeochemical (BGC)-Argo floats constitutes a new and continuously updated data source that can supply information on parameters relevant for PP from below the immediate surface in that they collect measurements of biogeochemical variables, e.g., oxygen, chlorophyll a and nitrate, from the upper few kilometers of the global ocean (Argo, 2021). Combining these data with optical characteristics of the surface ocean determined by satellite mounted sensors provides a new opportunity for evaluating and optimizing large-scale PP-models against both satellite observations and in situ subsurface observations by floats.
In this study, we use subsurface nitrate and chlorophyll a fields obtained from the North Atlantic BGC-Argo archive to analyze the relationship between chlorophyll a and nutricline depth, and surface light observed from satellites. We apply a depth-resolved PP-model to quantify and analyze the distribution of PP in a diagram spanned by nutricline depth and surface light. We apply the PP-diagram to assess two simple PP-models driven only by surface fields. Finally, we discuss the potential of applying the same approach for evaluating other PP-models driven by observations or implemented in ocean circulation models, and the potential for estimating large-scale distributions of PP.
2 Methods
2.1 BGC-Argo data
For the study, we used data from biogeochemical Argo profiles for the period 2011-2022 in the North Atlantic, including the Mediterranean and subpolar areas, i.e., 0-80°N (Argo, 2000; Bittig et al., 2022). All profiles included nitrate observations were selected via the Argo data selection tool (Figure 1). The data set contained pressure, temperature, salinity, chlorophyll a (referred to as chlorophyll) and nitrate. A set of quality requirements was defined for each profile such that location and time of transmissions were well defined (i.e., a QC flag of 1 or 8) and the data coverage of pressure, temperature and salinity was at least 75% (i.e., a QC flag of either A or B) of all profile levels with good data (Argo, 2021). Individual quality checks were applied to all measurements (i.e., a QC flag of 1 or 2) and accepted chlorophyll measurements also included adjusted data due to non-photochemical quenching (i.e., a QC flag of 5). An additional set of criteria was applied for removing profiles with insufficient data coverage: the first pressure measurement should be in the upper 10 m and the upper 200 m of each profile should contain a minimum of 20 observations of all the variables applied in the analysis.
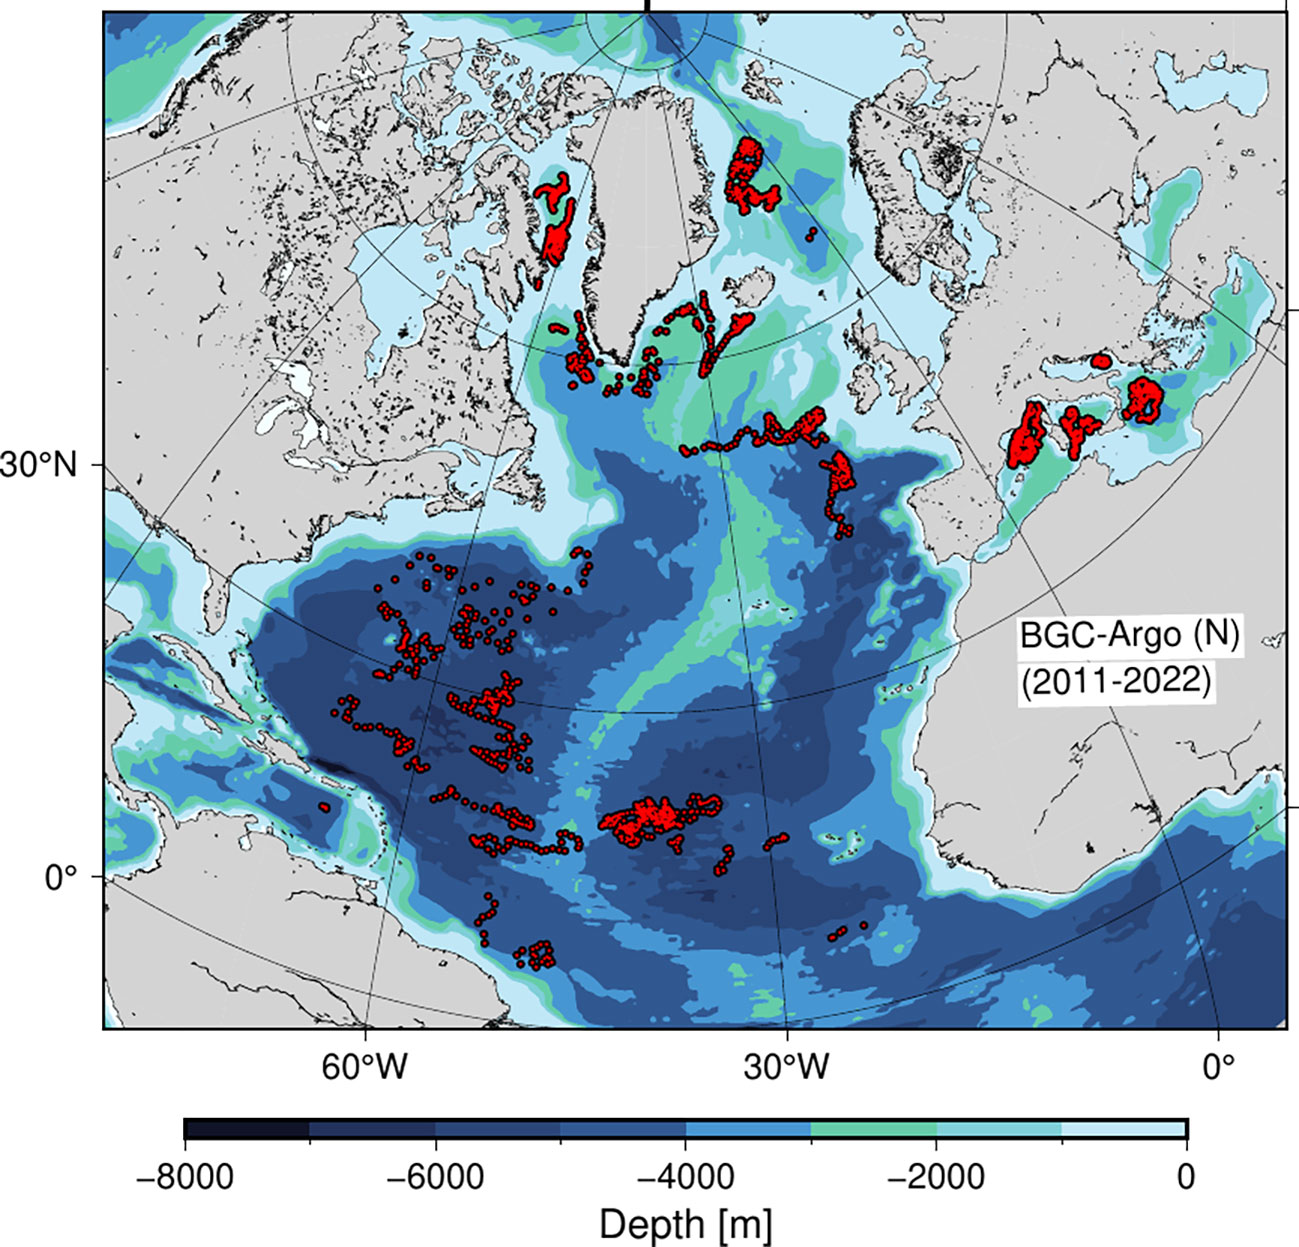
Figure 1 BGC-Argo profiles (red bullets) in the North Atlantic containing nitrate profiles (N) between 2011-2022.
In total, 4108 profiles were included in the data set of which 3680 were used for calculating PP and with a seasonal coverage between 707 - 1356 (Table 1). The data had a broad latitudinal distribution with more than 1000 profiles in each of the 20-degree latitude bands between 20-80°N and with a minimum coverage (n=190) in the tropical area between 0-20°N. Each three month period during the year included between 56 - 825 profiles in each 20-degree latitude band except for the tropical region (0-20°N), where the number of profiles ranged between 40-54. In total, 1395 profiles of the entire data set were obtained from the Mediterranean Sea between 35.2 - 43.8°N, and given the general oligotrophic nature of the area (e.g., Siokou-Frangou et al., 2010), these profiles were considered as representative for mid-latitude conditions and included in the analysis. Thus, all seasons and latitude bands were well represented by the data set.
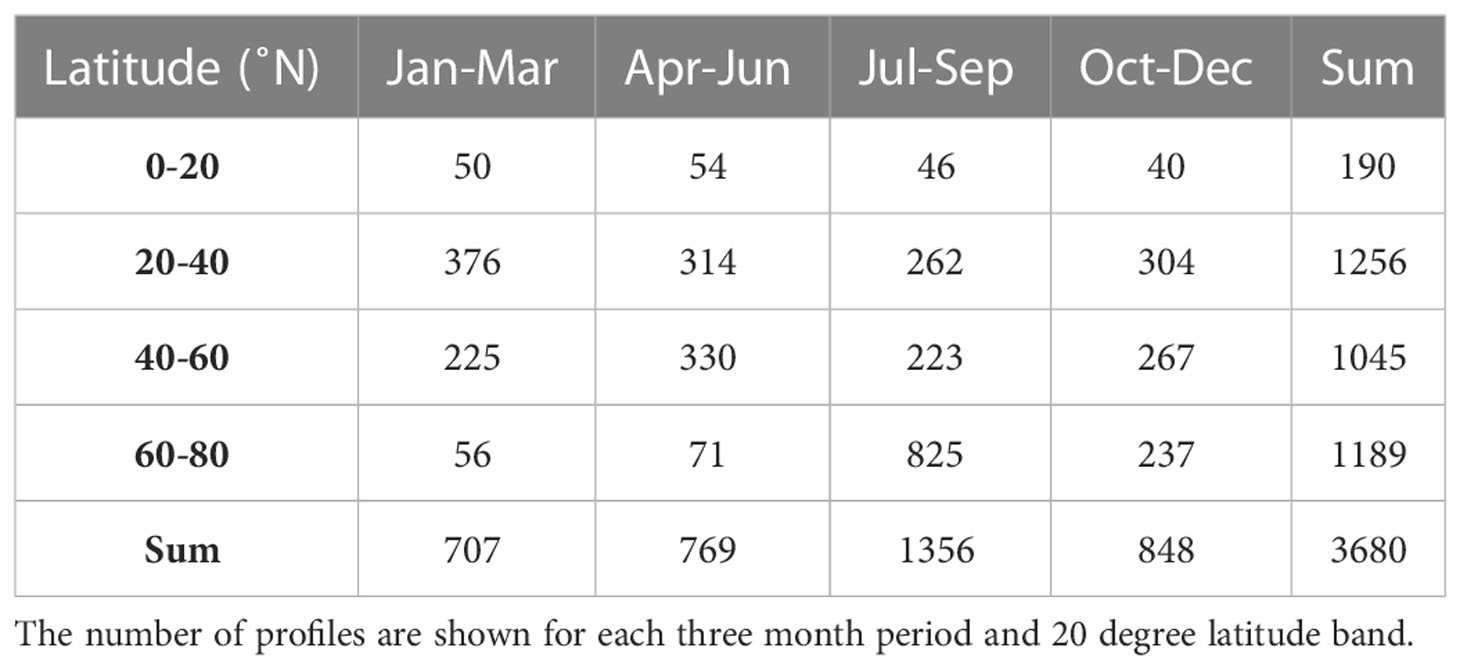
Table 1 Temporal and spatial coverage of the BGC-Argo data set used for calculating PP including profiles with nitrate and chlorophyll measurements and associated satellite observations of surface PAR from the North Atlantic, Mediterranean and subpolar seas in the period 2011-2022.
2.2 Satellite data
Surface PAR (SPAR) was extracted from MODIS-satellite data binned in 8-day intervals and in 9x9 km resolution (Frouin et al., 1989; NASA Ocean Biology Processing Group, 2017). SPAR for each float was extracted from the corresponding 8-day period in the binned satellite data set that included the date of the profile transmission. Satellite values were extracted from the four center values in the geographical grid surrounding the location of the Argo float and their average value was assumed to represent the conditions at the location of the float. Missing values were disregarded and if all four nearest neighbors to the float were missing, then the SPAR value for the float was not defined. Similarly, sea surface temperature (SST) and surface chlorophyll a (Hu et al., 2012) were extracted from the MODIS data for calculating PP-parameters based on satellite derived surface values.
2.3 Analysis of BGC-Argo profiles
Four characteristic depth scales were applied in the analysis of the float profiles: the mixed layer depth (DMl), the depth of the euphotic zone (DEup), the nutricline depth (DNut) and the depth of the deep chlorophyll maximum (DCM).
The DMl was defined from a temperature difference of 0.2 °C between 10 m depth and the bottom of the mixed layer (de Boyer Montégut et al., 2004). The mixed layer depth characterizes the upper well mixed surface layer where properties of temperature and salinity are relatively constant.
A constant light attenuation (kd) for photosynthetic available radiation (PAR) was parameterized from the average chlorophyll concentration in the mixed layer (Morel and Maritorena, 2001; Morel et al., 2007) and the PAR-profile was calculated according to Beer’s law: PAR(z) = SPAR exp(kd z), where z is the vertical coordinate (i.e., positive upwards, z ≤ 0). The euphotic depth (DEup), i.e., the depth range where photosynthesis is assumed to take place, was defined by the depth level where PAR was 0.1% of the surface value (Laws et al., 2014).
The depth of the nutricline (DNut) characterizes the vertical nutrient profile in relation to the euphotic zone. The nutricline depth was estimated from the nitrate distribution below the surface layer. When nitrate is the limiting nutrient for PP, the nitracline (DNO3) will define DNut. However, conditions may exist where other nutrients, e.g., silicate (Hátún et al., 2017), iron (Nielsdóttir et al., 2009; Ryan-Keogh et al., 2013), etc., limit PP. Under these circumstances, the nutricline is not related to the nitrate concentration but nitrate will still be consumed in the nitrate-replete surface layer. Therefore, the nitracline below the nitrate-rich surface layer may indicate the depth extent of whatever nutrient(s) is limiting. This appeared possibly to be the case especially with respect to profiles collected at high latitudes, e.g., in the Baffin Bay, where profiles with high nitrate concentrations at the surface exhibited a DCM. In most of these profiles, the depth of the DCM was closely related to a gradient in the nitrate profile. Thus, DNut was calculated from two criteria: (1) if the surface concentration of nitrate was less than 1 μmole kg-1 the nutricline depth was found at the most shallow depth where the nitrate concentration was greater than 1 μmole kg-1, or (2) the vertical gradient of DNut was a maximum. DNut was only calculated from profiles with nitrate data above 15 m. The concentration was determined by applying a linear interpolation and the vertical gradient was obtained from the slope of a linear regression of 10 m segments of nitrate.
The DCM was determined by the maximum value of the low-pass filtered (i.e., a 10 m running mean) chlorophyll fluorescence profile. In some areas, the DCM was centered around the depth interval with a significantly elevated chlorophyll concentration and, in those cases, the increased biomass was well-represented by the DCM. However, in some profiles, the DCM was found from a weakly stratified chlorophyll profile in relatively homogeneous mixed layers and, in these profiles, the DCM was not associated with a significant maximum of chlorophyll. This was particularly the case during the fall and winter seasons where chlorophyll variations in the deep mixed layers were relatively small. This was taken into account in the analysis. Here, the DCM is used for expressing the depth of the “deep” chlorophyll maximum. However, in many cases the maximum is located near or at the surface, in particular outside the growth season or in well mixed areas. Thus, we refer to the DCM also in such profiles, as a general term expressing the maximum chlorophyll concentration.
Profiles were also analyzed with respect to the vertically integrated chlorophyll (ΣChl, in units of mg chl m-2) integrated from DEup to the surface. The Argo profiles were analyzed in four latitudinal bands, i.e., 0-20, 20-40, 40-60 and 60-80°N, which are referred to as the tropical, subtropical, mid-latitude and high-latitude areas, respectively. In general, R (R Core Team, 2021) was applied for the statistical analyses.
2.4 Primary production estimates from Argo floats
The total daily primary production in the water column (PP, in units of mg C m-2 d-1) was estimated from the vertical distributions of satellite derived PAR and in situ observations of chlorophyll (chl) from the Argo-profiles, i.e., PPProf (Webb et al., 1974; Jassby and Platt, 1976):
where t is time and the time integral is integrated during a 24 hour period accounting for the daily solar insolation curve, and vertically from DEup to the surface.
The photosynthetic parameters describe the maximum photosynthetic rate ( ) and the initial slope (αB) of the chlorophyll-normalized PP versus PAR, respectively. The maximum photosynthetic rate was parameterized in terms of SST as originally formulated for the parameter in the VGPM-model (Behrenfeld and Falkowski, 1997). This parameterization has been shown to represent the general variation of in different oceanic regions although they have been obtained by different incubation methods, i.e., in situ with natural insolation versus incubations in the laboratory (Bouman et al., 2005). Photosynthetic parameters obtained more recently from a global data set showed relatively large variation of in comparison with the VGPM-parameterization (Richardson et al., 2016) and similarly, relatively large variation was found for values in the subpolar North Atlantic (Richardson and Bendtsen, 2021). Despite these concerns, the VGPM-parameterization is applied here as being representative of .
The VGPM-parameterization of implies that increases from 1.3 to 6.6 mg C (mg chl)-1 h-1 between 0 °C and 20 °C and gradually decreases towards higher temperatures (Behrenfeld and Falkowski, 1997). It should be noted that this temperature dependence implicitly covers a wide range of hydrographic regions and, therefore, also to some extent accounts for variability in other factors influencing , e.g., phytoplankton community composition.
The parameterization of αB applied is based on an analysis of surface and DCM values of αB in different DNO3 intervals from the global ocean (Richardson and Bendtsen, 2019) and ranges between 1.6 and 4.6·10-2 μg C (μg chl h μE m-2 s-1)-1. The largest values are associated with the DCM, thus indicating a more efficient use of photons for photosynthesis under the dim light conditions below the surface than at higher light intensities. However, variations of photosynthetic parameters may depend on local nutrient and light conditions (Babin et al., 1996) and co-variation between αB and are to some extent already considered in the VGPM-parameterization of (Behrenfeld and Falkowski, 1997; Bouman et al., 2005). Therefore, we apply a constant value of αB of 3.1·10-2 μg C (μg chl h μE m-2 s-1)-1, corresponding to the mid-point between the largest and smallest value in the study of Richardson and Bendtsen (2019), as a representative value. In general, total PP estimates are about twice as sensitive to the value of than the value of αB (Morel et al., 1996). Thus, the applied parameterization of is a critical component in the analysis of the large-scale distribution of PP.
2.5 Primary production estimates using surface fields
The general relationship between PP, light and nutrients estimated from Argo-profiles was compared with similar relationships obtained from two different PP-models based on surface observations, i.e. the VGPM-model (PPVGPM; Behrenfeld and Falkowski, 1997), and the VPP-model (PPVPP; Richardson and Bendtsen, 2019).
PP in the VGPM-model is calculated as: PPVGPM = chl(surf) f(SPAR) D’eu, and depends on derived from surface observations of SST, surface chlorophyll (chl(surf)), a light function depending on SPAR (f(SPAR)) and the euphotic depth ( ). This model was analyzed in two cases where surface fields were extrapolated from Argo-measurements of SST and chlorophyll near the surface and the estimated DEup or from satellite observations of SST and chlorophyll and a parameterization of D’eu that was representative for case 1 waters (Morel et al., 2007). The general distribution of the two cases was similar and only results of the PPVGPM based on Argo-profiles are shown.
PP in the VPP-model is calculated as: PPVPP = PP10m/γ. This model estimates PP from primary production calculated from Eq. (1) but only in the upper 10 m, i.e. PP10m. The ratio between total PP and PP10m was calculated from a global data set of PP and analyzed in three nutricline depth intervals: Dnut< 20 m, 20-90 m and > 90 m, and the corresponding values of γ were 0.31, 0.19 and 0.11, respectively, e.g., 31% of total PP on average occurs in the upper 10 m in areas where the nutricline depth is less than 20 m. Here, we apply the same photosynthetic parameters of and α as for calculating PPprof and PPVGPM.
PPVGPM and PPVPP are thus used here as two examples of a family of models estimating PP on the basis of surface optical characteristics observed by satellites against which PP-model estimates employing vertical distribution data for light, nutrients and chlorophyll could be compared.
3 Results
3.1 Nutricline depth and chlorophyll
The DCM was generally located below the DNut except in areas with a shallow nutricline (<30 m) or in profiles obtained during winter time (Figure 2). Relatively shallow DCMs associated with deep nutriclines (DNut>90m) were also mainly found during the winter period (Figure 2, triangles). The average depth of all DCMs in areas with a DNut less than 20 m was 32 m and it increased to 88 m in areas where DNut was larger than 90 m (Table 2). During the growth season from April-November the average DCM, binned in 20 m depth intervals, was generally located below DNut, except for areas with a shallow nutricline, i.e., less than 20 m (Figure 2, black circles). The latitudinal distribution of the DCM depth (colors, Figure 2) also showed a gradual increase from high latitudes (~35 m, Table 2) towards the tropics (~112 m). This increase in the depth of the DCM with latitude was associated with the deepening of the DNut towards subtropical and tropical areas.
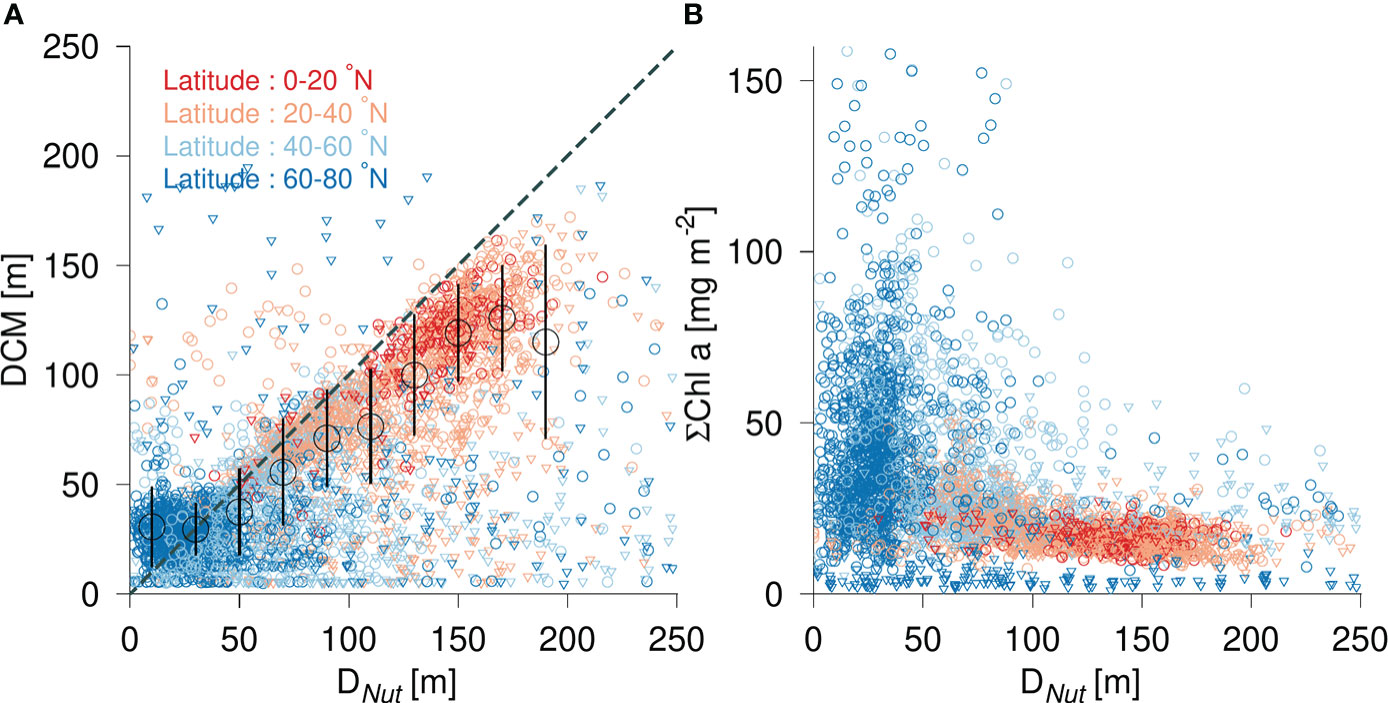
Figure 2 (A) Depth of the deep chlorophyll a maximum (DCM) versus nutricline depth (DNut) and binned average values during the growth season (April-October, black circles ± std. dev.). (B) Vertically integrated chlorophyll (ΣChl) versus DNut. Color shading shows the latitude of the corresponding profile. Observations are shown during the growth season (April-October, circles) and during winter time (November-March, triangles).
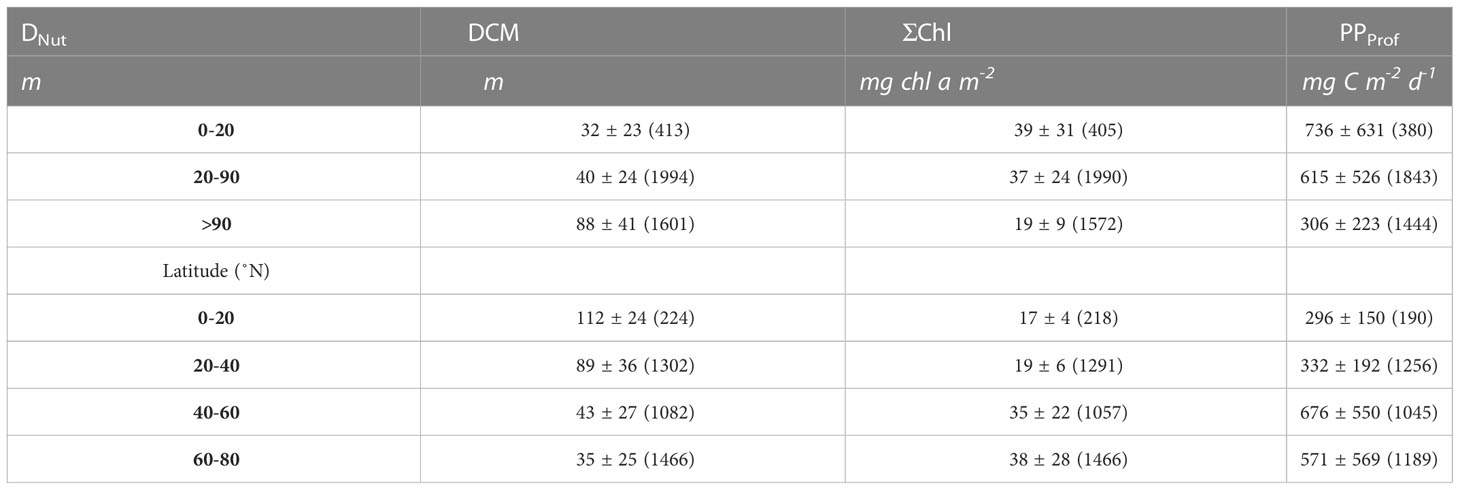
Table 2 Average values of all profiles (average ± std.dev, number of profiles in parenthesis) of the depth of the deep chlorophyll a maximum (DCM), vertically integrated chlorophyll a (ΣChl) and primary production calculated from Argo profiles (PPProf).
Phytoplankton biomass was approximated by vertically integrating chlorophyll (ΣChl) in the water column. The greatest biomass was found at high latitudes (60-80 °N) where ΣChl typically varied between 20 - 100 mg chl a m-2 (Figure 2, blue circles) with an average of 38 mg chl a m-2 (Table 2). Values lower than 20 mg chl a m-2 were associated with profiles made during periods of low light intensities during the winter season (Figure 2, triangles) while the highest values (>50 mg chl a m-2) were associated with phytoplankton blooms in the growth season at high- and midlatitudes. Mid-latitude areas exhibited a relatively large range of biomass (10-100 mg chl a m-2) with an average value of 35 mg chl a m-2, i.e., comparable to that found at high latitudes. Significantly lower phytoplankton biomass was found in subtropical and tropical areas with an average ΣChl of 19 and 17 mg chl a m-2, respectively.
The distribution of DCM and ΣChl in relation to nutricline depth and latitude motivated an analysis of the combined influence of light (represented by SPAR) and nutricline depth, i.e., representing the availability of nutrients. The distribution of DCM in a diagram spanned by DNut and SPAR showed a characteristic large-scale pattern, where a shallow DCM (<20 m) was associated with a relatively shallow DNut, whereas the deepest DCMs were found in oligotrophic areas with a deep DNut and a high SPAR (Figure 3). The vertically integrated chlorophyll distribution also showed a characteristic pattern with a well-defined maximum in areas of a relatively shallow DNut (<50 m) and modest insolation (SPAR ~ 40 E m-2 d-1), and a gradual decrease of ΣChl with deeper DNut (Figure 3).
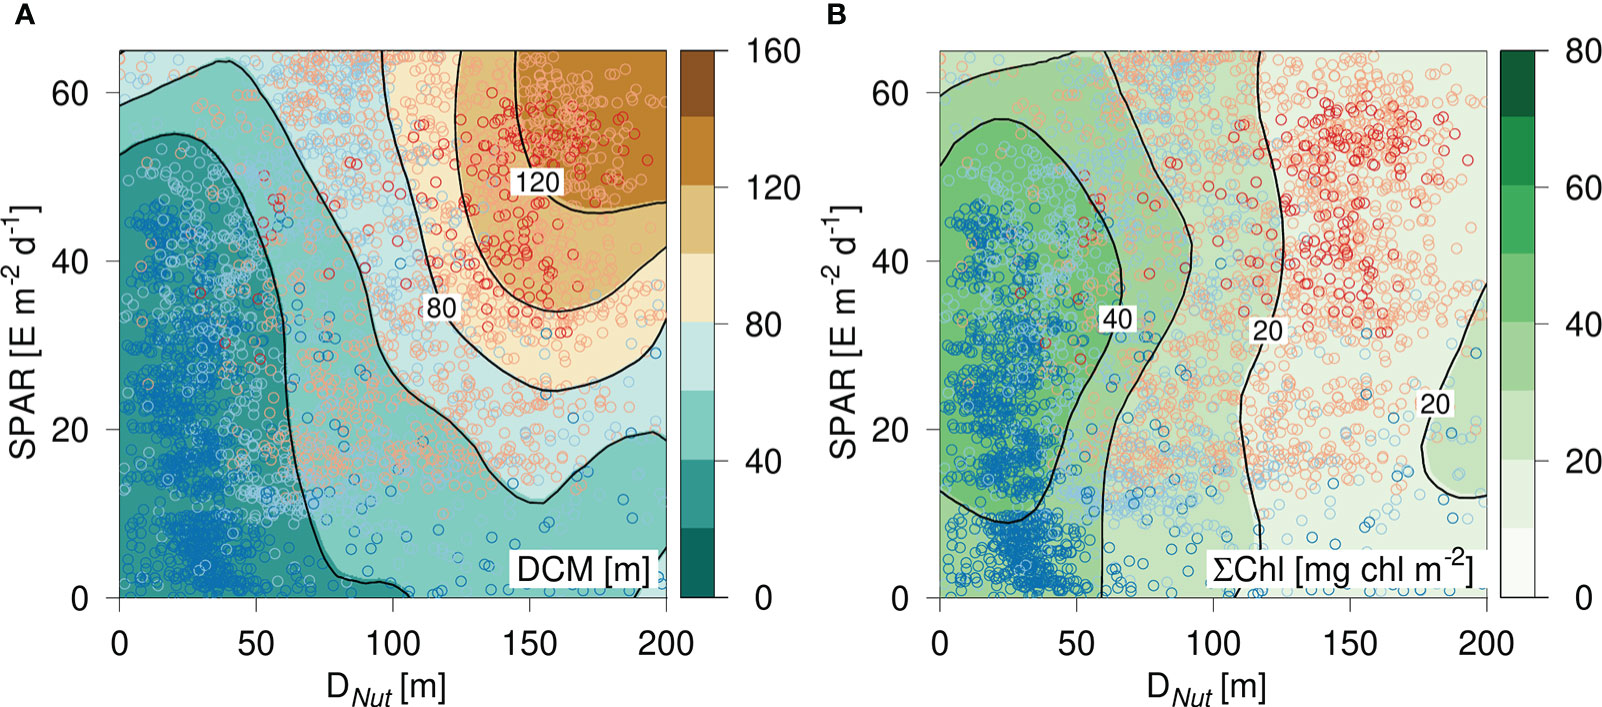
Figure 3 Diagram of (A) DCM and (B) vertically integrated chlorophyll (ΣChl) versus the corresponding nutricline depth (DNut) calculated from Argo-profiles and daily averaged Photosynthetic Available Radiation at the surface (SPAR) obtained from satellite observations. Color shading of the circles shows the latitude of the corresponding profile (see Figure 2).
3.2 Nutricline depth and primary production
The distribution of PPProf in relation to DNut had some similarity to that found for ΣChl (Figure 4). The greatest PPProf was found at high latitudes and in subpolar areas with average values of 571 and 676 mg C m-2 d-1, respectively (Table 2). The observed range (0 to >2 g C m-2 d-1) at high and mid-latitudes (Figure 4, blue circles) was associated with low PPProf during the dark winter months and relatively high PPProf during the growth season. PPProf showed a gradual decrease towards subtropical and tropical areas where PPProf in general ranged between 50-500 mg C m-2 d-1 with average values of 332 and 296 mg C m-2 d-1, respectively.
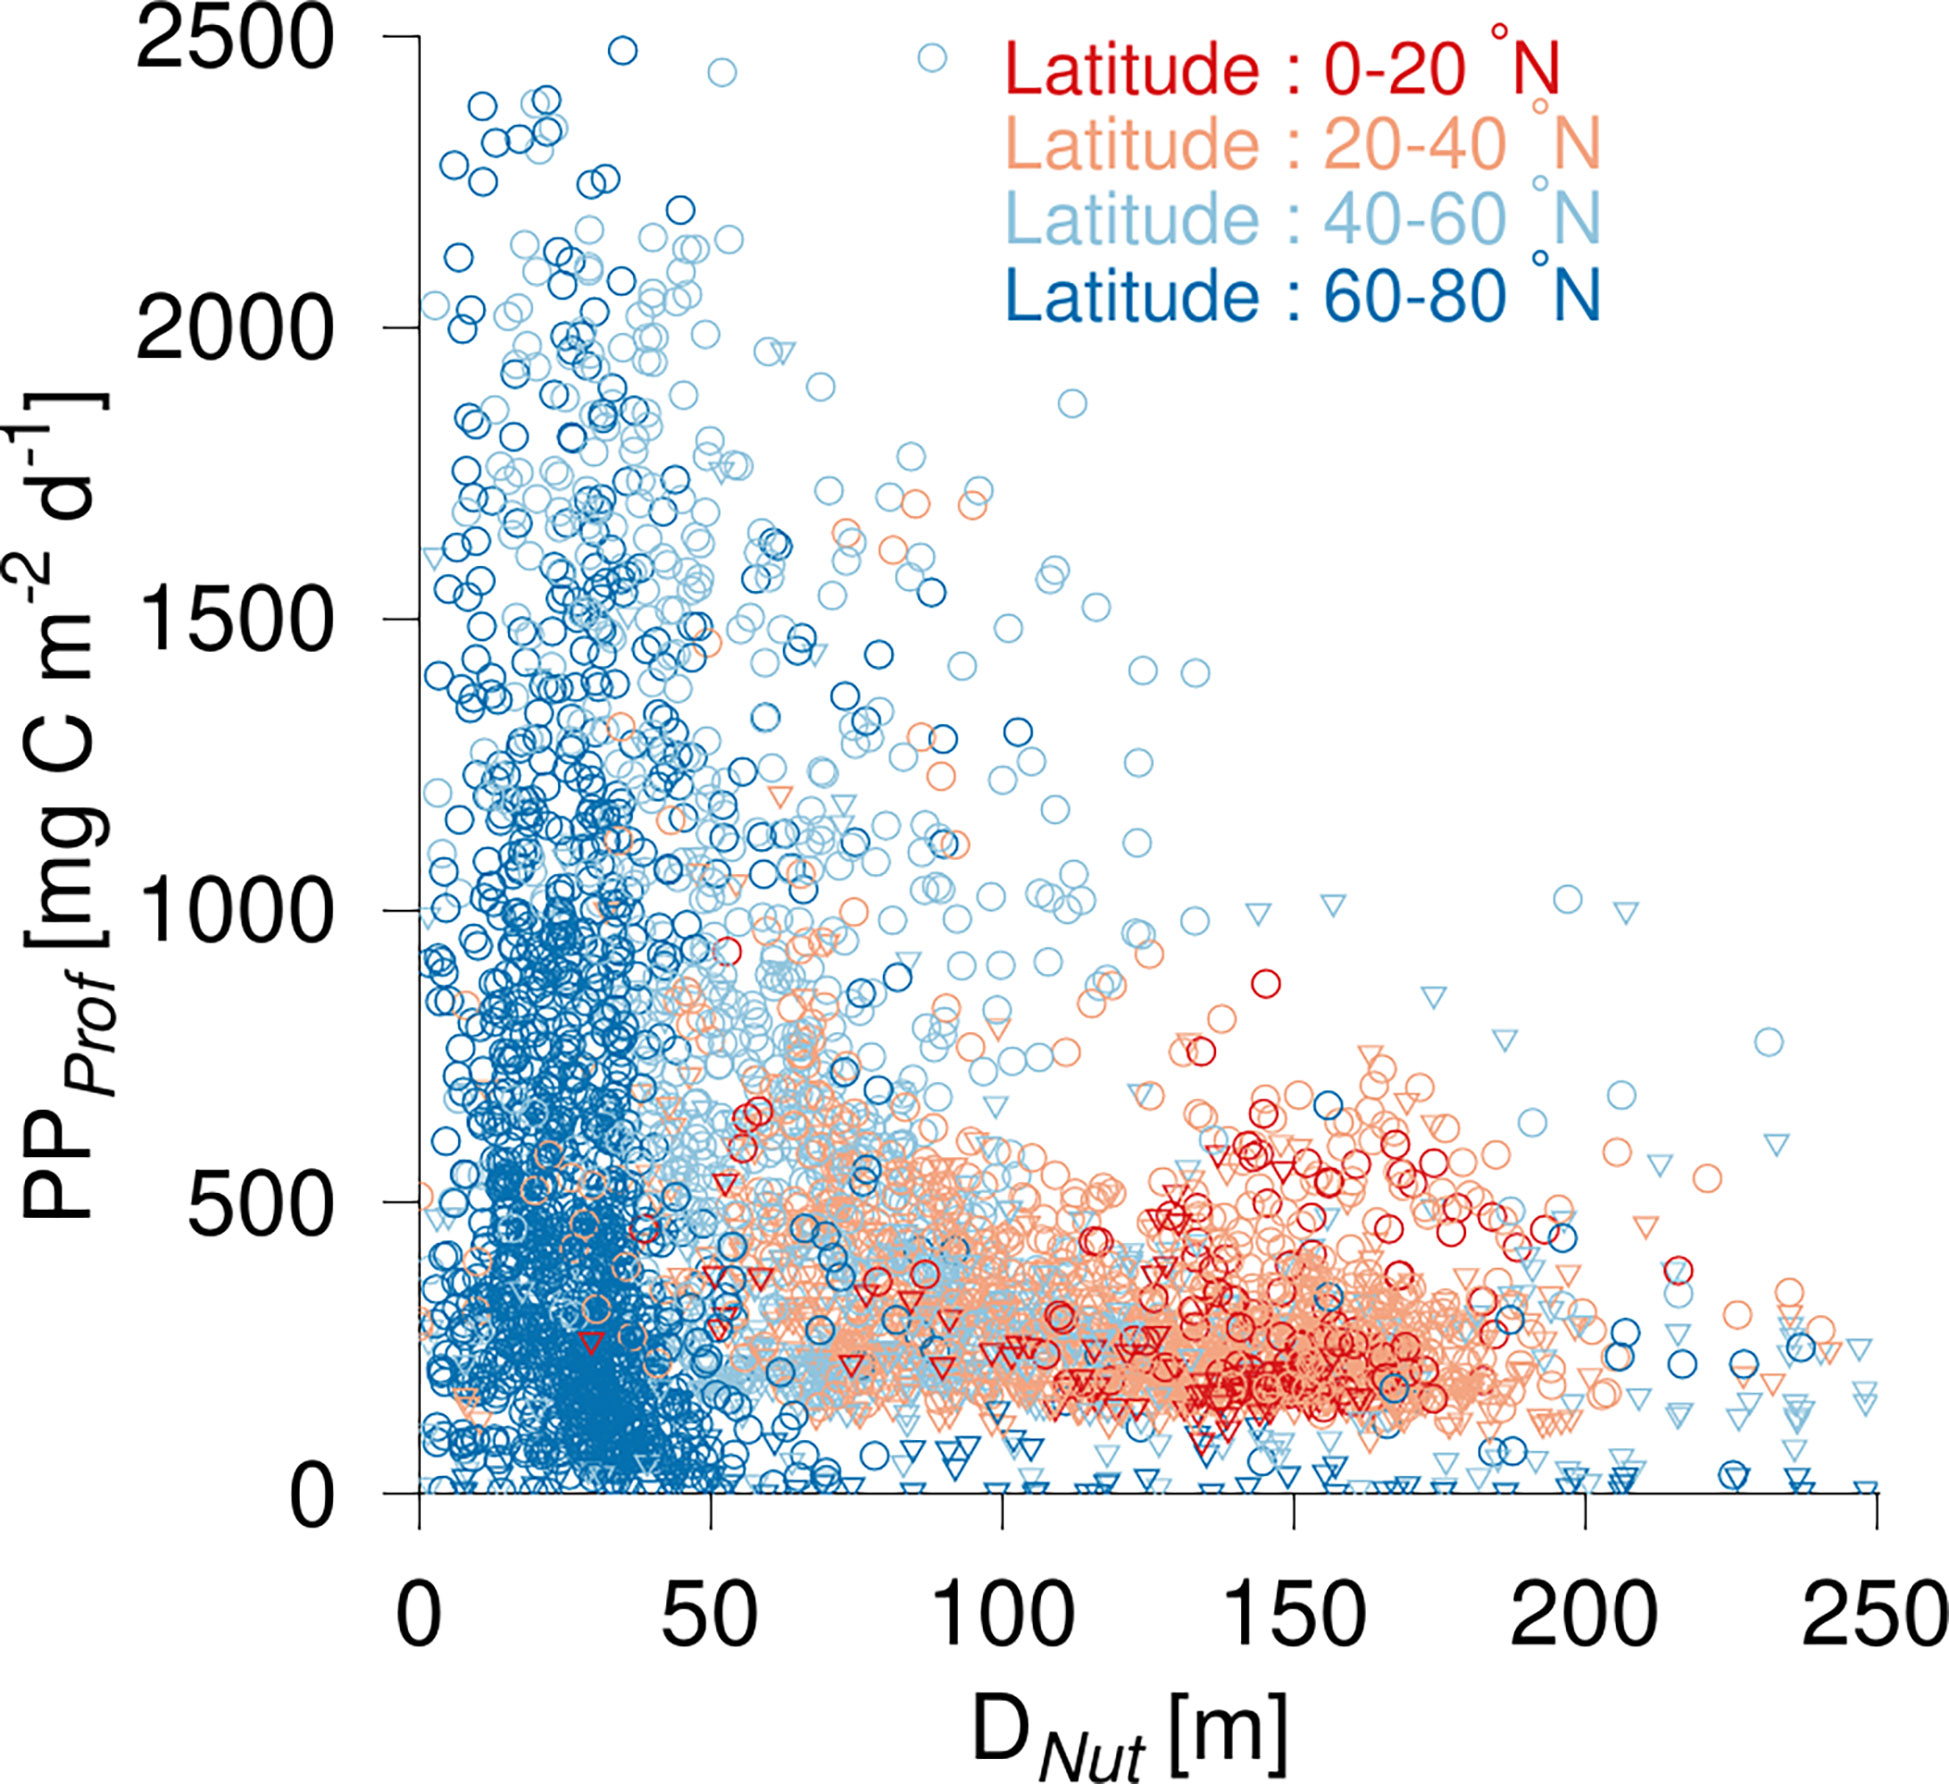
Figure 4 Primary production (PPProf) versus nutricline depth (DNut). Color shading shows the latitude of the corresponding profile. Observations are shown during the growth season (April-October, circles) and during winter time (November-March, triangles).
3.3 PP-diagram with light and nutrient
The entire PPprof data set was analyzed in a manner similar to the approach used for chlorophyll in a diagram spanned by light and nutricline depth (Figure 5). PPProf had a maximum of ~1.4 g C m-2 d-1 for SPAR ~58 E m-2 d-1 and DNut ~10 m depth (Figure 5). Only a few profiles had a DNut less than ~10 m. Thus PPprof generally decreased with increasing DNut for all light levels. PPProf at low light levels (<10 E m-2 d-1) was less than 400 mg C m-2 d-1 and decreased below 200 mg C m-2 d-1 in areas with a Dnut deeper than ~90 m depth. In general, the lowest PPProf-values were seen in areas with a deep Dnut and low light levels, i.e., in areas with the deepest DCM (Figure 3). The majority of profiles with Dnut< 50 m were located at high- and mid-latitudes, whereas deep nutriclines and high light levels were mainly occupied with profiles from the subtropical and tropical areas. The lowest light levels (SPAR< 10 E m-2 d-1) were recorded at high latitudes and represented conditions from the dark winter season. The tilted shape of the highest PP-values were shifted upward towards higher SPAR compared with the corresponding tilted distribution of ΣChl (Figure 3), showing the influence of light on the PP-estimate. Thus, the data suggest a general pattern that would be expected, i.e., water column PPProf decreasing gradually with increasing nutricline depth and increasing with increasing SPAR.
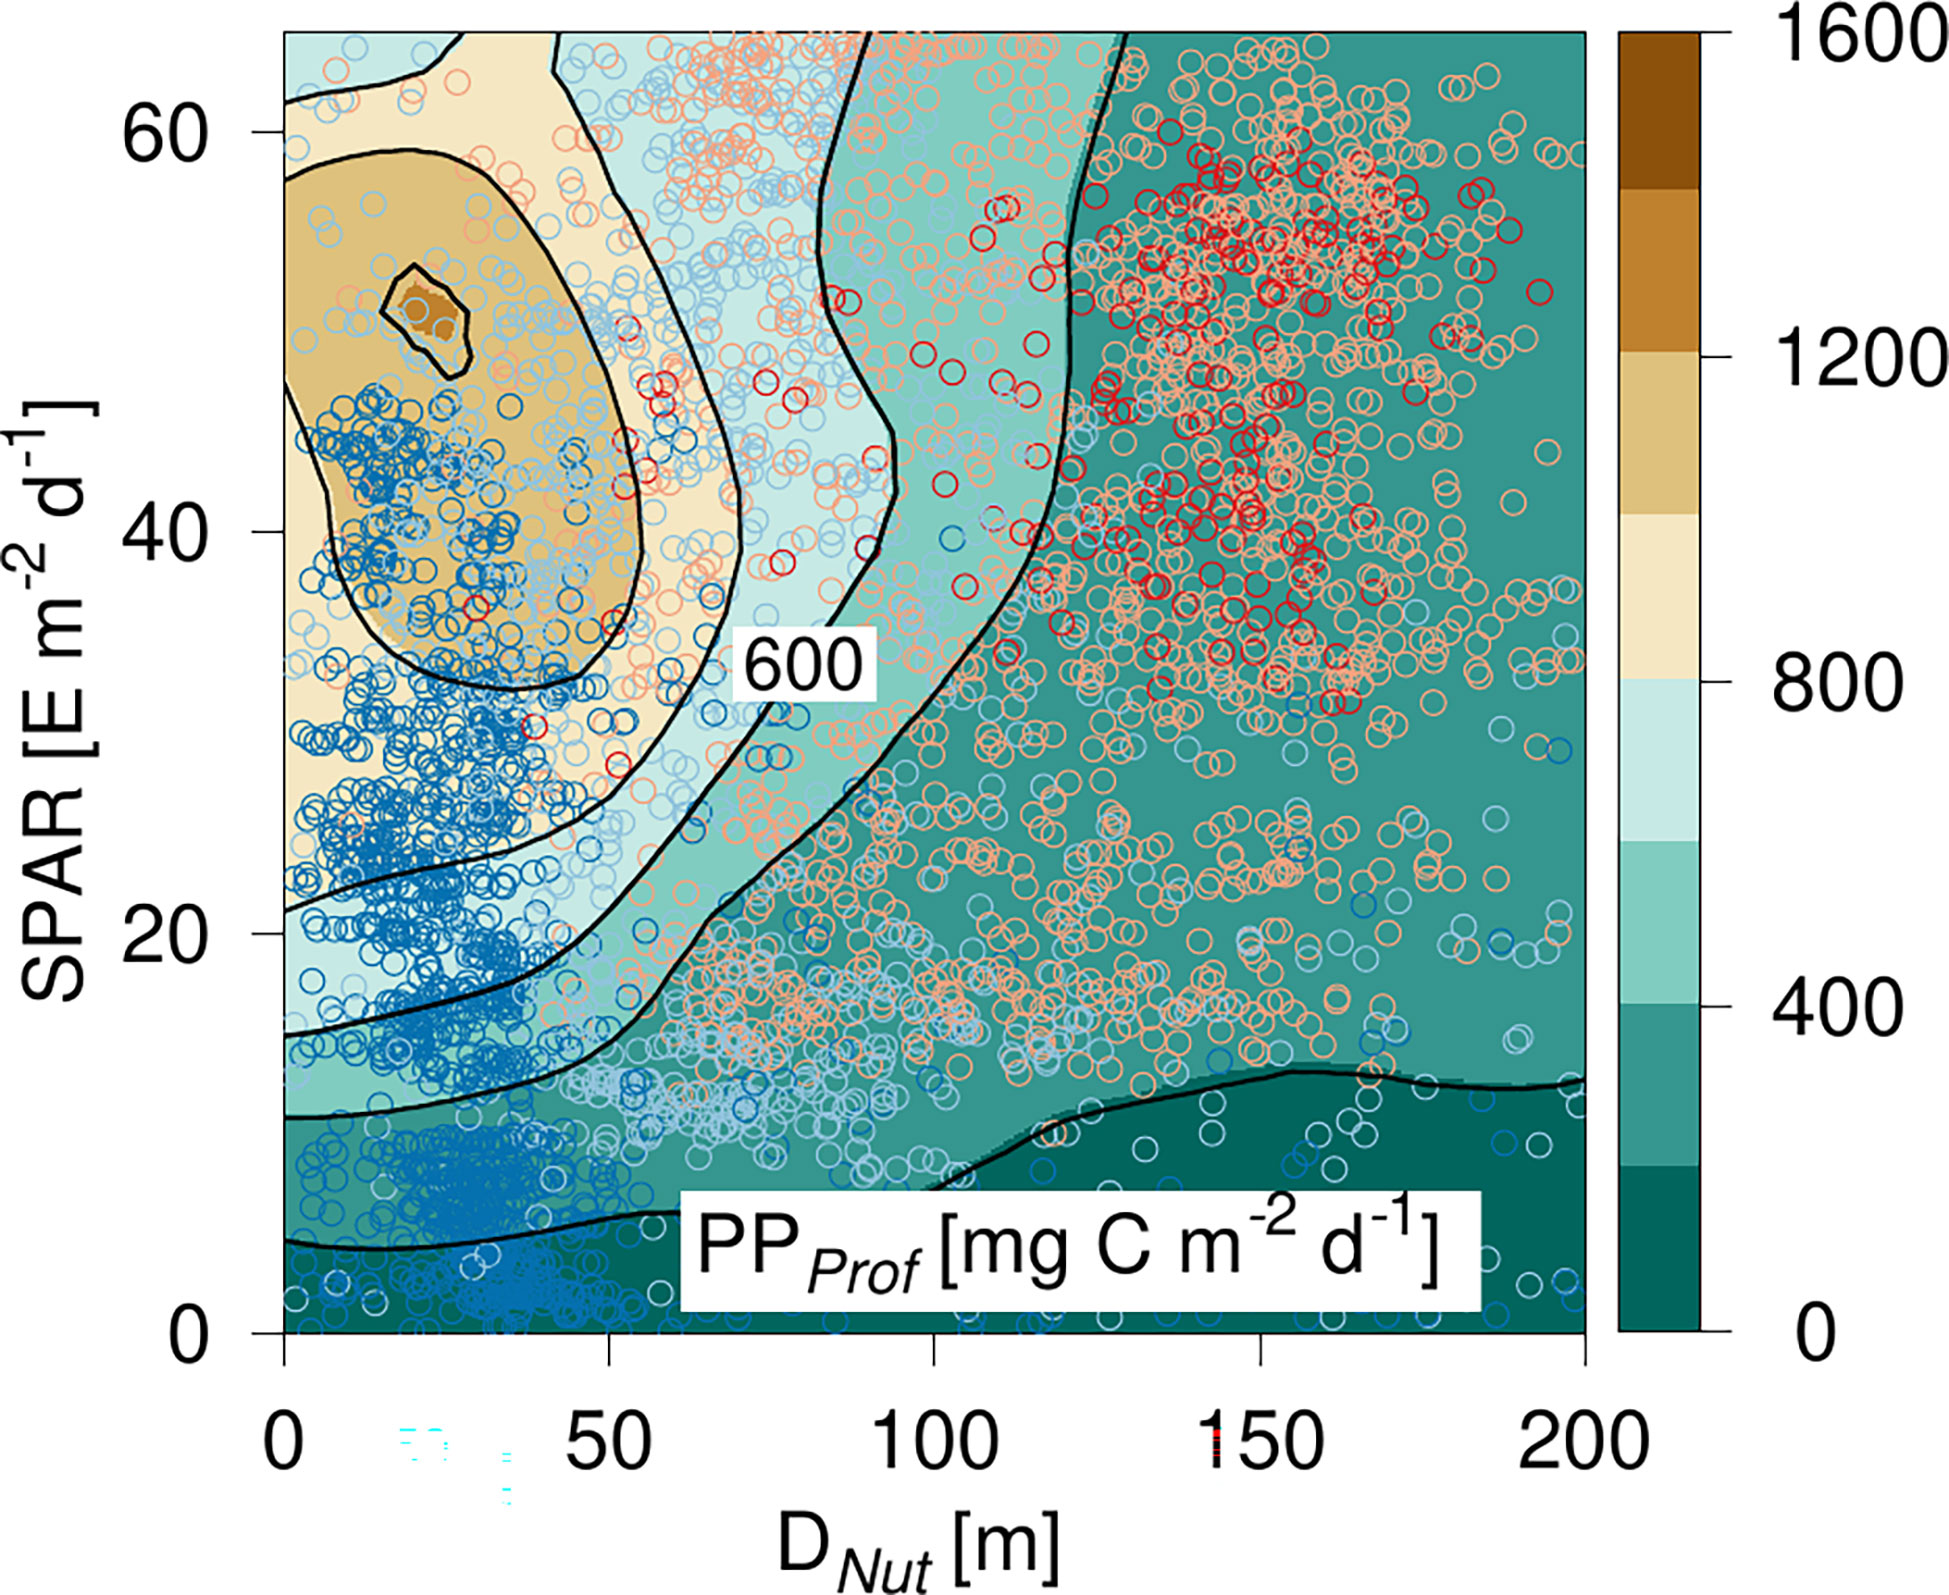
Figure 5 PP-diagram of primary production (PP) calculated from PPProf based on Argo-profiles. PP is shown versus the corresponding nutricline depth (DNut) calculated from Argo-profiles and daily averaged Photosynthetic Available Radiation at the surface (SPAR) obtained from satellite observations. Color shading of the circles shows the location of the corresponding profile (see Figure 2).
The general PP-distribution was analyzed further by considering the statistical variation of PP in the diagram spanned by SPAR and Dnut (Figure 6). The diagram was divided into equidistant intervals of SPAR of 5 E m-2 d-1 and Dnut of 20 m depth, and the corresponding values of the mean and standard deviation of PP were calculated. On average, there were 29 PP-values in each cell and cells with less than 5 PP-values were not considered. The PP-diagram based on the gridded average distribution of PP (Figure 6) was in accordance with the diagram based on all data (e.g., Figure 5). The diagram showed a similar peak value in areas with a shallow nutricline and high light levels, a general decrease towards deeper nutricline depths, and a general increase with increasing light levels. The relative error within each cell was defined from the ratio between the standard deviation of PP and the mean of the total PP (Figure 6) and was in general less than 60%. Areas with a shallow nutricline were in general associated with a relative error above 50%, whereas the relative error was less in areas with a deep nutricline. However, the largest variability of 50 - 80% was found in areas with nutricline depths between ~80 - 120 m depth and with relative high light levels between ~35 - 50 E m-2 d-1.
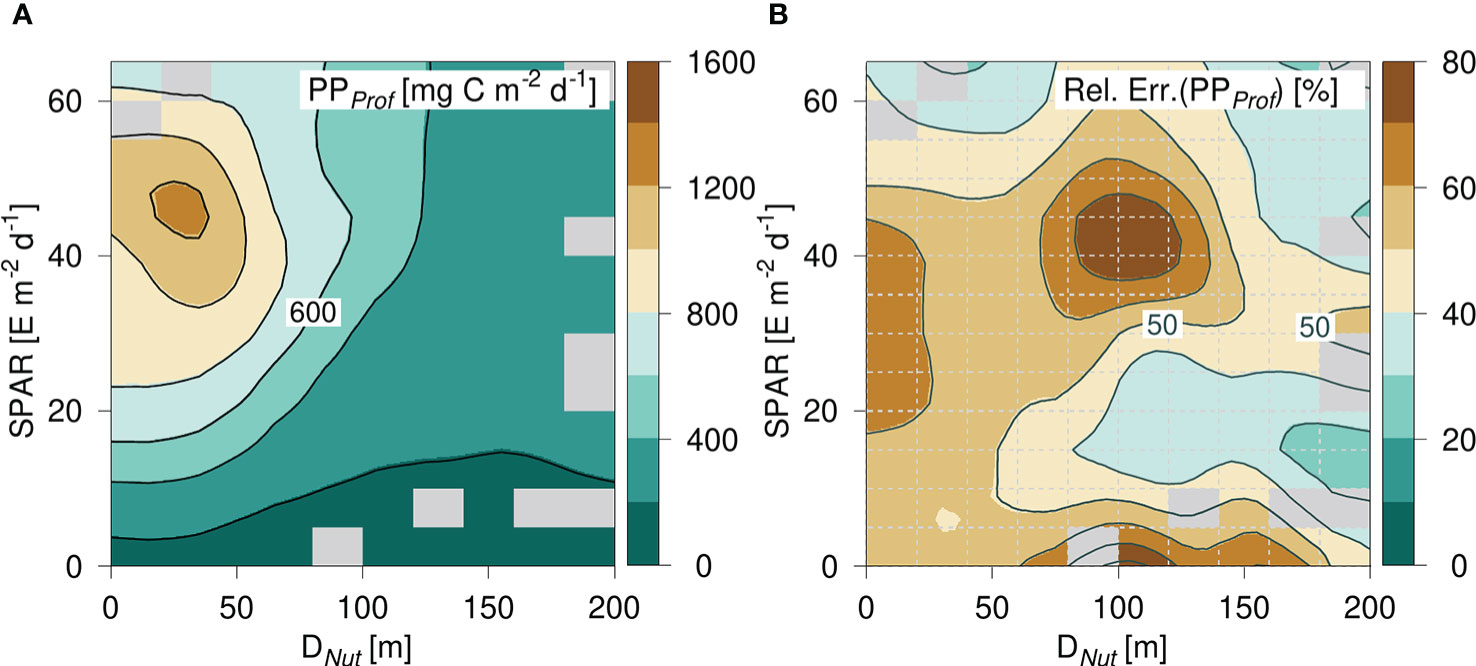
Figure 6 (A) PP-diagram of average primary production (PP) calculated from PPProf and (B) the relative error defined by σ(PP)/PP in each cell (cells are shown with gray dashed lines). Grid cells with less than 5 data points are filled (gray).
3.4 Comparison of two surface-based PP-models
In the shallow nutricline interval (<50 m), the PPVGPM and PPVPP also showed a maximum at ~58 E m-2 d-1. The minimum PP in the two models were seen in areas with a deep nutricline (>120 m) and relatively high light levels (>40 E m-2 d-1). Thus, the two PP-models yielded significantly different estimates in regions characterized by a deep nutricline: PPProf showed an increase in PP with increasing light-levels while the two surface-based models showed a significant decrease. The structure of the two models was also different in areas with a shallow nutricline and low light levels, where a more gradual increase of PP with increasing light was seen in the PPProf than in the VGPM estimate.
4 Discussion
Analysis of the Argos data examined here shows a clear relationship between chlorophyll distribution and nutricline depth. PP estimated using the Argos data also showed a clear relationship to nutricline depth.
4.1 Chlorophyll distributions and nutricline depth
The general relationship between the depth of the DCM and DNut showed that some DCMs tended to be located deeper than DNut at high latitudes. These profiles were generally made during winter (Figure 2, triangles). Otherwise, DCMs tended to be located deeper than DNut, where DCMs from the growth season were more closely related to DNut than during winter time. During the growth season, the depth levels of the DCM and DNut in the intermediate depth range between 20 - 90 m were in general accordance. Thus, this distribution from the entire North Atlantic of DCM and Dnut is in good accordance with previous findings (Herbland and Voituriez, 1979; Cullen, 1982; Cullen, 2015) and supports the hypothesis that the chlorophyll maximum is closely related to the nutrient distribution. In areas with a nutricline deeper than ~90 m, DCMs were generally located above DNut. This general pattern is also in accordance with previous studies and can be explained by light limitation when DNut becomes too deep to support growth (Richardson and Bendtsen, 2019).
Some profiles at high and mid-latitudes showed that the DCM was deeper than Dnut in areas with Dnut less than 50 m also during the growth season (Figure 2). The binned average DCMs during the growth season was only deeper than Dnut in the depth range between 0 - 20 m. The relation between DCM and Dnut was thus weaker in these areas, suggesting that processes other than nutrient limitation could be important here. Fluorescence, and the ratios between fluorescence and chlorophyll, and carbon and chlorophyll can be affected by nutrient and light conditions (Westberry et al., 2016). The effects of light on phytoplankton are considered when estimating chlorophyll from fluorescence and chlorophyll concentrations are corrected in the adjusted BGC-Argo data (Roesler et al., 2017). Iron stress also causes increases in fluorescence (Behrenfeld and Milligan, 2013; Schallenberg et al., 2022) and decreases in the carbon to chlorophyll ratio (Westberry et al., 2016), which would ultimately appear as high chlorophyll from the floats. While iron limitation is not well-studied in the North Atlantic, it is possible that the reduction in chlorophyll at high latitudes during high SPAR (Figure 3) may be a result of growth limitation by micronutrients (e.g., Westberry et al., 2016) or due to photoinhibition (Yang et al., 2022). The photoprotective strategy in phytoplankton has been seen in Arctic phytoplankton species (Lacour et al., 2018) and is a prominent feature in polar waters (Kauko et al., 2017). A response from phytoplankton to iron limitation or excessive light could explain the relatively few profiles with a weak relation between DCM and DNut during the growth season at high latitudes. In summary, the location of the DCM, as well as the vertically integrated chlorophyll, generally showed a strong relationship to DNut.
4.2 Primary production versus light and nutricline depth
The relationships between PPProf, nutricline and latitude (Figure 4) suggested that DNut could be associated with nutrient availability in large areas of the ocean, and the latitudinal distribution indicated that part of the PPProf variation could be described by light conditions. This motivated the combined analysis in a diagram showing PPprof versus Dnut calculated from Argo-profiles and PAR obtained from satellite observations (Figure 5). These two variables are only proxies for the in situ drivers of phytoplankton growth: PAR in the water column is modified by local attenuation and this is not accounted for by SPAR, and DNut only indirectly represents nutrient supply by mixing to the euphotic zone. However, both variables are closely related to light and nutrient supply for primary production and this is supported by the corresponding distributions of chlorophyll (Figure 3).
PPProf increases relatively quickly as SPAR increases in areas with a shallow nutricline, generally at high latitudes (Figure 6). In these areas, light is expected to be the primary limiting factor for PP, given availability of all other limiting micro-nutrients. Thus, light availability could explain the steady increase of PPProf with increasing light levels up to ~58 E m-2 d-1. PPProf decreases at higher light levels (>60 E m-2 d-1) in areas with a relatively shallow Dnut (<50 m). The reduced PPProf at the highest PAR may be explained by reduced photosynthesis due to photoinhibition (Falkowski and LaRoche, 1991; MacIntyre et al., 2002; van de Poll et al., 2011), or the limitation by another micro-nutrient such as iron (Behrenfeld and Milligan, 2013; Westberry et al., 2016). However, more profiles in high light and shallow nutricline conditions are required for analyzing this further. Areas characterized by low light levels and a deep DNut (i.e., SPAR<10 E m-2 d-1 and DNut>40 m) were only covered by few PPProf-data. indicating that DNut was in general less than ~40 m at high latitudes during winter.
The highest PPProf estimates (>1 g C m-2 d-1) were seen in areas with a relatively shallow nutricline (<50 m) and were mainly located at mid- and high latitudes. This can be explained by the combination of high nutrient concentrations where DNut was shallow, and high light levels during the growth season. Low PPProf estimates in areas with a shallow Dnut can be explained by low light levels during the winter season. PP in the intermediate nutricline depth range (50-90 m) was generally below 1 g C m-2 d-1 and was mainly associated with profiles from mid-latitudes and the subtropical areas. Subtropical and tropical profiles were mainly available for areas where DNut was below 90 m.
The PPProf distribution was in good accordance with the expected variation with light and nutrient availability. In areas with a deep DNut (>100 m), PPProf increased steadily with light. Similarly, areas with a shallow DNut, i.e., mainly located at mid- and high-latitudes, showed an expected but also stronger increase of PP with increasing light at light levels below ~50 E m-2 d-1. PPProf is proportional to the chlorophyll concentration (Eq. 1) and some similarity is also seen between PPProf and ΣChl (Figure 3). However, the consistent increase of PP with SPAR for any DNut depth level suggests a general relationship between PPProf, SPAR and nutrients in oligotrophic areas. PPProf was also found to gradually decrease with increasing DNut at all light levels.
The associated error-distributions showed that PP could be estimated with a relative error of less than 50% in large parts of the PP-diagram, in particular in areas with a deep nutricline depth. PP in these areas appears to be well constrained by light and nutricline depth. In areas with a shallow nutricline (<50 m), the relative error was between 50 - 60% and the largest variability was seen with modest to high light levels (20 - 40 E m-2 d-1). These profiles were generally encountered at high latitudes (Figure 5), suggesting that the estimation of PP is more variable in the PP-diagram during spring and/or fall whereas the relative error decreases towards higher (summer) and lower (winter) light levels. The maximum variability is seen in the intermediate range of nutricline depths (~80 - 120 m) and light levels (~35 - 50 E m-2 d-1), and this shows that PP estimated from this part of the PP-diagram is less well determined by light and nutricline depth. Profiles from this part of the diagram are mainly from the subtropical and tropical areas of the ocean, and the variability indicates that PP is also influenced by other processes.
Some of this variability could be explained by short-term variability in PP due to vertical mixing by mesoscale eddies (Johnson et al., 2010). Increased nutrient inputs from ocean eddies will tend to increase the PP-rate for a relatively long period, whereas nutricline depth levels tend to increase relatively quickly after a mixing event (e.g., Richardson and Bendtsen, 2017). Thus, profiles obtained from these areas may include measurements made both before and after such mixing events. This might explain some of the variability in this part of the PP-diagram. In addition, while PP is calculated from float-based chlorophyll, it is important to take into account other factors that influence chlorophyll and fluorescence measures. Part of the variability in PP could be attributed to a sum of factors from iron limitation, to a change in community structure and species composition (Roesler et al., 2017). However, while the influence of these factors varies with area, the same chlorophyll measures were used to model PP, which would remove variability between profiles, leaving the relative variance the same.
There is only an indirect relationship between PPProf and DNut, however, the PP-diagram indicates that PPProf can be directly related to nutrient availability for a given level of SPAR. This is in line with earlier local studies showing relationships between PP and nutrient distributions (e.g., Herbland and Voituriez, 1979). The general distribution of PPProf shows a well-defined maximum in areas with a shallow nutricline (< 60 m) and SPAR-levels between ~40 - 50 E m-2 d-1 where PPProf reaches an average value of ~1 g C m-2 d-1, and a general decrease of PPProf towards deeper nutriclines with typical PP values between 200 - 400 mg C m-2 d-1. PP estimated from the averaged PP-diagram (Figure 6) has a relative error of about 50% compared with PPProf.
4.3 Comparing models in a PP-diagram
The PP-diagram provides a method for comparing estimates of the large-scale distributions of PP from different models in relation to light and nutricline depth. The VGPM-model (Behrenfeld and Falkowski, 1997) was parameterized from a large data set of in situ PP-measurements and has been applied in several studies and its strengths and shortcomings have been evaluated in previous studies (e.g., Carr et al., 2006). The VPP-model also depends on surface observations alone and was based on a simple relationship between PP and nutricline depths in a global data set (Richardson and Bendtsen, 2019). Therefore, we apply these two models as examples of a comparison in the PP-diagram of different surface-based PP-models with PPProf, i.e., PP estimated explicitly from in situ observations in the entire euphotic zone. The two models can be driven by observed satellite fields alone. However, in order to make a direct comparisons between PPProf, PPVGPM and PPVPP, all are here calculated from surface chlorophyll and surface temperature extrapolated from the uppermost measurement in the Argo-profile.
The PPVGPM and PPVPP-distributions showed a maximum at shallow nutricline depths and light levels between 30 - 60 E m-2 d-1. The decrease in PP noted with increasing nutricline depth was in general accordance with PPProf (Figure 7). However, the maximum values in the PPProf distribution were ~1200 mg C m-2 d-1 whereas the corresponding maxima were ~1400 and 2000 mg C m-2 d-1 for the PPVGPM and PPVPP, respectively. Thus, both models resulted in a significantly higher peak value than PPProf. Both the PPVGPM- and the PPVPP-distributions decreased steadily with increasing SPAR-levels above ~20 E m-2 d-1 in areas with a deep nutricline (>130 m). This is not in accordance with the expected photosynthetic response for an increase in PAR and indicates that these models may underestimate PP in this part of the PP-diagram.
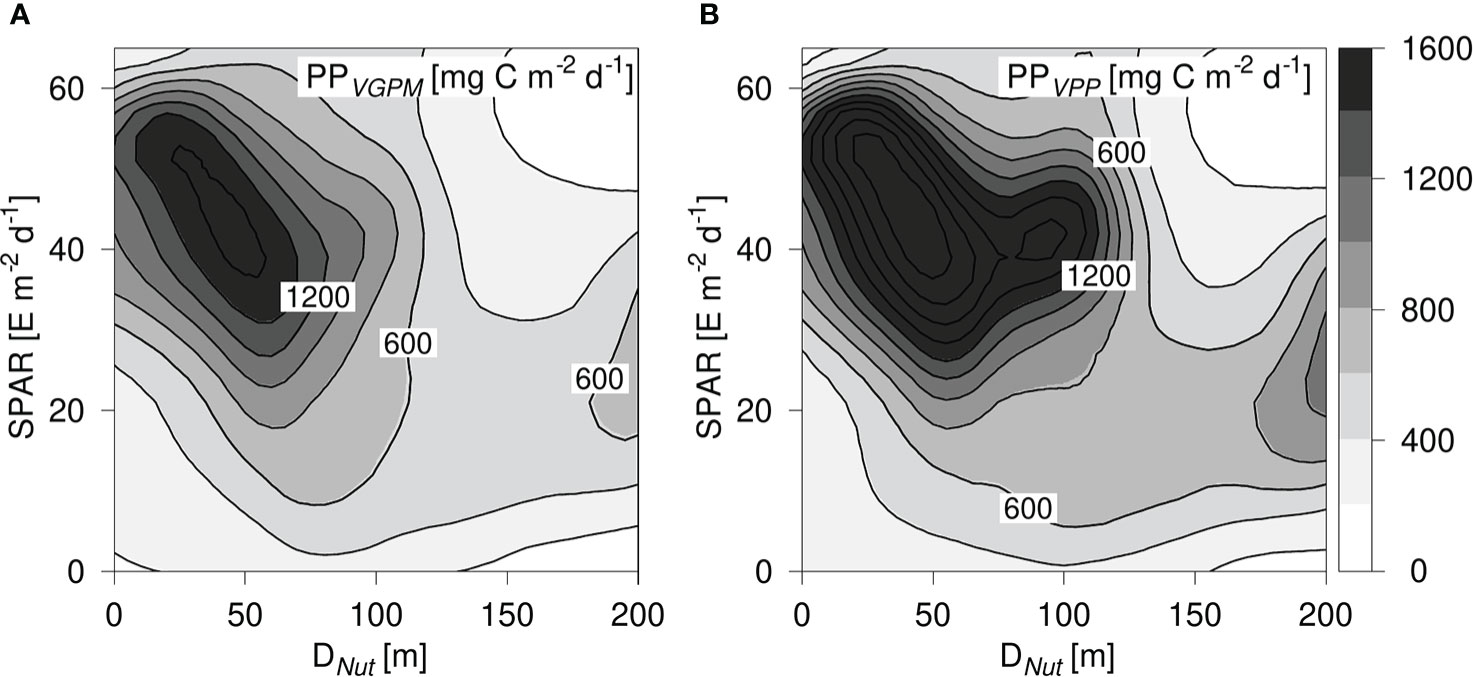
Figure 7 (A) PP-diagram of primary production calculated from PPVGPM and, (B) PPVPP. PP is shown versus the corresponding nutricline depth (DNut) calculated from Argo-profiles and daily averaged Photosynthetic Available Radiation at the surface (SPAR) obtained from satellite observations. Contours are shown in intervals of 200 mg C m-2 d-1.
Previous analyses of PP estimated from the VGPM-model indicated that it underestimates PP in oligotrophic areas when compared to other PP-models (Westberry et al., 2008; Emerson, 2014) and the distributions in Figure 7 suggest that this could be an issue relevant for both surface-based PP-models due to a general underestimation of PP in tropical and subtropical areas with a deep nutricline. Oligotrophic areas with a deep nutricline are generally characterized by low surface concentrations of chlorophyll a (e.g., Richardson and Bendtsen, 2017), and these low chlorophyll values can explain the low estimates in this part of the PP-diagram.
Thus, we find a general structural difference between the two surface-based models and PPProf, where PPProf shows a more gradual increase with Dnut< 50 m and an expected increase with light in areas with a deep nutricline. It should be noted that both models show the same tilted structure as seen in the vertically integrated chlorophyll distributions for DNut less than ~90 m (Figure 3). This comparison demonstrates the applicability of the PP-diagram for identifying structural differences between PP-models in relation to observed fields of nutrients and light.
4.4 Applying nutrient observations in global PP-estimates
The comprehensive BGC-Argo data archive with high-resolution vertical nitrate profiles provides a new opportunity to include nitrate or, more generally, nutrients in the evaluation of PP-estimates from different models. Using this data archive, PP-estimates can be analyzed in relation to in situ observations of nutrient availability and satellite observations of SPAR, i.e., the two most critical factors for photosynthesis and biological production. The distribution of PPProf in relation to light and nutrient availability suggest that universal relations exist between large-scale PP, light and nutricline depth, and these relations may then be applied in the analysis of different PP-models and, more generally, for estimating large-scale patterns of PP from information about light and nutrients alone.
The general distribution of the PP-estimate versus light and nutrient availability showed that a PP-diagram can be applied for evaluating different PP-models. The differences between the two surface-based PP-models and PPProf examined in this study showed the potential of using nutrient information in the evaluation of global PP-patterns. At high latitudes characterized by shallow nutriclines, it is important to acknowledge the interchanging effects of light and nutrients between the seasons: where light is the dominant limiting factor in the winter and nutrients become limiting in the summer, when light is sufficient. Future work should include a distinction for high nutrient, low chlorophyll (HNLC) areas like the Southern Ocean, where iron and light primarily limit phytoplankton growth and primary production (Martin et al., 1990; Boyd et al., 2007).
Light and nutrient-based estimates of PP may also elucidate large-scale distributions of new production (NP), i.e., the fraction of PP based on newly available nitrate or nitrite (Dugdale and Goering, 1967). NP balances the export of organic matter on longer timescales (> month - years) and the fraction of PP exported out of the euphotic zone (i.e., the f-ratio; Eppley and Peterson, 1979) has been found to increase with PP and decrease with SST (Laws et al., 2011). Thus, the PP-diagram indicates that the corresponding NP-distribution would tend to have an even more steep gradient between areas with a shallow and a deep nutricline.
The models applied in this study represent examples among a suite of PP-models (e.g., Carr et al., 2006). PP-models may be solely driven by satellite observations (Westberry et al., 2008; Uitz et al., 2010; Silsbe et al., 2016), derived from ocean circulation models (Kwiatkowski et al., 2020) or by data-assimilation by combining observations and circulation models (Gregg and Rousseaux, 2019). However, the access to information about location, light and in situ nutrient conditions makes evaluations in a PP-diagram possible with these other model-products.
5 Conclusion
The influence of nutrient and light availability on primary production (PP) was analyzed from profiles of chlorophyll a and nitrate observed by BGC-Argo floats in the North Atlantic, including the Mediterranean and subpolar seas, during 2011-2022, and surface insolation of photosynthetically available radiation (SPAR) observed by satellite. The distributions of chlorophyll a and PP were analyzed in a diagram with respect to both surface light and nutricline depth. The large-scale distributions of chlorophyll a showed characteristic patterns with high concentrations of total chlorophyll a in areas with a relatively high daily insolation, i.e., a surface PAR of ~40 E m-2 d-1, and nutricline depths of 40-50 m, and also a gradual increase of DCM with increasing nutricline depth and surface insolation. These patterns could be explained by nutrient and light availability and motivated a similar analysis of PP.
The PP-diagram obtained from the entire BGC-Argo data set showed a consistent decrease with increasing nutricline depth and, in general, an increase with increasing light. This general pattern of nutrient and light availability on PP reflects the strong influence from light in nutrient replete areas and the interaction with nutrients and light in areas with a deeper nutricline. These large-scale patterns suggest that a general relationship between PP, light, and nutrients may be applied for evaluating large-scale distributions of PP from various PP-models. This was demonstrated by comparing two different surface-based PP-models where structural differences between the Argos data based and surface data only approaches to estimating PP were identified in results generated at high latitudes during the summer season and for the oligotrophic North Atlantic. A PP-diagram can thus support the development of PP-models and reduce the current uncertainty regarding the magnitude of global ocean PP.
The PP-diagram indicates that the large-scale distribution of PP may follow a universal pattern determined from surface insolation and nutricline depth that potentially can be applied for estimating the total PP in the North Atlantic basin. Analysis of similar relationships for high-nutrient low-chlorophyll areas such as the Southern Ocean may thus provide basis for a new method for estimating PP at the global scale.
Data availability statement
The original contributions presented in the study are included in the article/supplementary material. Further inquiries can be directed to the corresponding author.
Author contributions
All authors listed have made a substantial, direct, and intellectual contribution to the work, and approved it for publication.
Funding
This study was supported by a grant from the Carlsberg Foundation (H.M. Queen Margrethe’s and Vigdís Finnbogadóttir´s Interdisciplinary Research Centre on Ocean, Climate, and Society, CF-20-0071). CV was funded by the Australian Research Council Centre of Excellence for Climate Extremes (CLEX; CE170100023).
Acknowledgments
The Argo data were collected and made freely available by the International Argo Program and the national programs that contribute to it (https://argo.ucsd.edu; https://www.ocean-ops.org). The Argo Program is part of the Global Ocean Observing System. This study has also been possible thanks to the publicly available satellite data from the Ocean Color website in the National Aeronautics and Space Administration (NASA; https://oceancolor.gsfc.nasa.gov/l3/). We acknowledge comments from a reviewer which improved the manuscript.
Conflict of interest
The authors declare that the research was conducted in the absence of any commercial or financial relationships that could be construed as a potential conflict of interest.
Publisher’s note
All claims expressed in this article are solely those of the authors and do not necessarily represent those of their affiliated organizations, or those of the publisher, the editors and the reviewers. Any product that may be evaluated in this article, or claim that may be made by its manufacturer, is not guaranteed or endorsed by the publisher.
References
Argo (2000). Argo float data and metadata from global data assembly centre (Argo GDAC) (France: SEANOE, IFREMER). doi: 10.17882/42182
Babin M., Morel A., Claustre H., Bricaud A., Kolber Z., Falkowski P. G. (1996). Nitrogen- and irradiance-dependent variations of the maximum quantum yield of carbon fixation in eutrophic, mesotrophic and oligotrophic marine systems. Deep-Sea Res. 43, 1241–1272. doi: 10.1016/0967-0637(96)00058-1
Beckmann A., Hense I. (2007). Beneath the surface: Characteristics of oceanic ecosystems under weak mixing conditions — a theoretical investigation. Prog. Oceanogr. 75, 771–796. doi: 10.1016/j.pocean.2007.09.002
Behrenfeld M. J., Falkowski P. G. (1997). Photosynthetic rates derived from satellite-based chlorophyll concentration. Limnol. Oceanogr. 42, 1–20. doi: 10.4319/lo.1997.42.1.0001
Behrenfeld M. J., Milligan A. J. (2013). Photophysiological expressions of iron stress in phytoplankton. Ann. Rev. Mar. Sci. 5, 217–246. doi: 10.1146/annurev-marine-121211-172356
Bittig H., Wong A., Plant J., the Coriolis Argo data management team (2022). BGC-argo synthetic profile file processing and format on Coriolis GDAC, v1.3. (France: IFREMER) doi: 10.13155/55637
Bouman H., Platt T., Sathyendranath S., Stuart V. (2005). Dependence of light-saturated photosynthesis on temperature and community structure. Deep-Sea Res. 52, 1284–1299. doi: 10.1016/j.dsr.2005.01.008
Boyd P. W., Jickells T., Law C. S., Blain S., Boyle E. A., Buesseler K. O., et al. (2007). Mesoscale iron enrichment experiments 1993-2005: synthesis and future directions. Science 315, 612–617. doi: 10.1126/science.1131669
Carr M.-E., Friedrichs M. A. M., Schmeltz M., Aita M. N., Antoine D., Arrigo K. R., et al. (2006). A comparison of global estimates of marine primary production from ocean color. Deep-Sea Res. II 53, 741–770. doi: 10.1016/j.dsr2.2006.01.028
Cullen J. J. (1982). The deep chlorophyll maximum: Comparing vertical profiles of chlorophyll a. Can. J. Fish. Aquat. Sci. 39, 791–803. doi: 10.1139/f82-108
Cullen J. J. (2015). Subsurface chlorophyll maximum layers: Enduring enigma or mystery solved? Annu. Rev. Mar. Sci. 7, 207–239. doi: 10.1146/annurev-marine-010213-135111
de Boyer Montégut C., Madec G., Fischer A. S., Lazar A., Iudicone D. (2004). Mixed layer depth over the global ocean: An examination of profile data and a profile-based climatology. J. Geophys. Res. 109, C12003. doi: 10.1029/2004JC002378
Dugdale R. C., Goering J. J. (1967). Uptake of new and regenerated forms of nitrogen in primary productivity. Limnol. Oceanogr. 12, 196–206. doi: 10.4319/lo.1967.12.2.0196
Emerson S. (2014). Annual net community production and the biological carbon flux in the ocean. Global Biogeochem. Cycles 28, 14–28. doi: 10.1002/2013GB004680
Eppley R. W., Peterson B. J. (1979). Particulate organic matter flux and planktonic new production in the deep ocean. Nature 282, 677–680. doi: 10.1038/282677a0
Falkowski P. G., LaRoche J. (1991). Acclimation to spectral irradiance in algae. J. Phycology 27, 8–14. doi: 10.1111/j.0022-3646.1991.00008.x
Frouin R., Ligner D. W., Gautier C. (1989). A simple analytical formula to compute clear sky total and photosynthetically available solar irradiance at the ocean surface. J. Geophys. Res. 94, 9731–9742. doi: 10.1029/JC094iC07p09731
Gregg W., Rousseaux C. S. (2019). Global ocean primary production trends in the modern ocean color satellite record, (1998–2015). Environ. Res. Lett. 14, 124011. doi: 10.1088/1748-9326/ab4667
Gulev S. K., Thorne P. W., Ahn J., Dentener F. J., Domingues C. M., Gerland S., et al. (2021). “Changing state of the climate system,” in Climate change 2021: The physical science basis. contribution of working group I to the sixth assessment report of the intergovernmental panel on climate change. Eds. Masson-Delmotte V, et al. 287–422. (Cambridge, United Kingdom and New York, NY, USA: Cambridge University Press).
Hátún H., Azetsu-Scott K., Somavilla R., Rey F., Johnson C., Mathis M., et al. (2017). The subpolar gyre regulates silicate concentrations in the north Atlantic. Sci. Rep. 7, 14576. doi: 10.1038/s41598-017-14837-4
Herbland A., Voituriez B. (1979). Hydrological structure analysis for estimating the primary production in the tropical Atlantic ocean. J. Mar. Res. 37, 87–101.
Hu C., Lee Z., Franz B. A. (2012). Chlorophyll-a algorithms for oligotrophic oceans: A novel approach based on three-band reflectance difference. J. Geophys. Res. 117, C01011. doi: 10.1029/2011JC007395
Jassby A. D., Platt T. (1976). Mathematical formulation of the relationship between photosynthesis and light for phytoplankton. Limnol. Oceanogr. 21540–547. doi: 10.4319/lo.1976.21.4.0540
Johnson K. S., Riser S. C., Karl D. M. (2010). Nitrate supply from deep to near-surface waters of the north pacific subtropical gyre. Nature 465, 1062–1065. doi: 10.1038/nature09170
Kauko H. M., Taskjelle T., Assmy P., Pavlov A. K., Mundy C. J., Duarte P., et al. (2017). Windows in Arctic sea ice: Light transmission and ice algae in a refrozen lead. J. Geophys. Res. Biogeosci. 122, 1486–1505. doi: 10.1002/2016JG003626
Kulk G., Platt T., Dingle J., Jackson T., Jönsson B. F., Bouman H. A., et al. (2020). Primary production, an index of climate change in the ocean: Satellite-based estimates over two decades. Remote Sens. 12, 826. doi: 10.3390/rs12050826
Kwiatkowski L., Torres O., Bopp L., Aumont O., Chamberlain M., Christian J. R., et al. (2020). Twenty-first century ocean warming, acidification, deoxygenation, and upper-ocean nutrient and primary production decline from CMIP6 model projections. Biogeosciences 17, 3439–3470. doi: 10.5194/bg-17-3439-2020
Lacour T., Lariviere J., Ferland J., Bruyant F., Lavaud J., Babin M. (2018). The role of sustained photoprotective non-photochemical quenching in low temperature and high light acclimation in the bloom-forming arctic diatom thalassiosira gravida. Front. Mar. Sci. 5. doi: 10.3389/fmars.2018.00354
Laws E. A., D'Sa E., Naik P. (2011). Simple equations to estimate ratios of new or export production to total production from satellite-derived estimates of sea surface temperature and primary production. Limnol. Oceanogr. Methods 9, 593–601. doi: 10.4319/lom.2011.9.593
Laws E. A., Letelier R. M., Karl D. M. (2014). Estimating the compensation irradiance in the ocean: The importance of accounting for non-photosynthetic uptake of inorganic carbon. Deep Sea Res. 93, 35–40. doi: 10.1016/j.dsr.2014.07.011
MacIntyre H. L., Kana T. M., Anning T., Geider R. J. (2002). Photoacclimation of photosynthesis irradiance response curves and photosynthetic pigments in microalgae and cyanobacteria. J. phycol. 38, 17–38. doi: 10.1046/j.1529-8817.2002.00094.x
Martin J. H., Fitzwater S. E., Gordon R. M. (1990). Iron deficiency limits phytoplankton growth in Antarctic waters. Glob. Biogeochem. Cycles 4, 5–12. doi: 10.1029/GB004i001p00005
Morel A., Antoine D., Babin M., Dandonneau Y. (1996). Measured and modeled primary production in the northeast Atlantic (EUMELI JGOFS program): the impact of natural variations in photosynthetic parameters on model predictive skill. Deep-Sea Res. I 43, 1273–1304. doi: 10.1016/0967-0637(96)00059-3
Morel A., Huot Y., Gentili B., Werdell P. J., Hooker S. B., Franz B. A. (2007). Examining the consistency of products derived from various ocean color sensors in open ocean (Case 1) waters in the perspective of a multi-sensor approach. Remote Sens. Env. 111, 69–88. doi: 10.1016/j.rse.2007.03.012
Morel A., Maritorena S. (2001). Bio-optical properties of oceanic waters: A reappraisal. J. Geophys. Res. 106C4, 7163–7180. doi: 10.1029/2000JC000319
NASA Ocean Biology Processing Group (2017). MODIS-Aqua Level 3 Mapped Photosynthetically Available Radiation Data Version R2018.0 (NASA Ocean Biology DAAC). doi: 10.5067/AQUA/MODIS/L3M/PAR/2018
Nielsdóttir M. C., Moore C. M., Sanders R., Hinz D. J., Achterberg E. P. (2009). Iron limitation of the postbloom phytoplankton communities in the Iceland basin. Glob. Biogeochem Cycles 23, GB3001. doi: 10.1029/2008gb003410
R Core Team (2021). R: A language and environment for statistical computing (Vienna, Austria: R Foundation for Statistical Computing). Available at: https://www.R-project.org/.
Richardson K., Bendtsen J. (2017). Photosynthetic oxygen production in a warmer ocean: the Sargasso Sea as a case study. Phil. Trans. R. Soc A, 375, 20160329. doi: 10.1098/rsta.2016.0329
Richardson K., Bendtsen J. (2019). Vertical distribution of phytoplankton and primary production in relation to nutricline depth in the open ocean. Mar. Ecol. Prog. Ser. 620, 33–46. doi: 10.3354/meps12960
Richardson K., Bendtsen J. (2021). Distinct seasonal primary production patterns in the Sub-polar gyre and surrounding seas. Front. Mar. Sci. 8. doi: 10.3389/fmars.2021.785685
Richardson K., Bendtsen J., Kragh T., Mousing E. A. (2016). Constraining the distribution of photosynthetic parameters in the global ocean. Front. Mar. Sci. 3. doi: 10.3389/fmars.2016.00269
Roesler C., Uitz J., Claustre H., Boss E., Xing X., Organelli E., et al. (2017). Recommendations for obtaining unbiased chlorophyll estimates from in situ chlorophyll fluorometers: A global analysis of WET labs ECO sensors. Limnol. Oceanogr.: Methods 15, 572–585. doi: 10.1002/lom3.10185
Ryan-Keogh T. J., Macey A. I., Nielsdóttir M. C., Lucas M. I., Steigenberger S. S., Stinchcombe M. C., et al. (2013). Spatial and temporal development of phytoplankton iron stress in relation to bloom dynamics in the high-latitude north Atlantic ocean. Limnol. Oceanogr. 58, 533–545. doi: 10.4319/LO.2013.58.2.0533
Sathyendranath S., Platt T., Žarko K., Dingle J., Jackson T., Brewin R. J. W., et al. (2020). Reconciling models of primary production and photoacclimation. Appl. Opt. 59, c100–c114. doi: 10.1364/AO.386252
Schallenberg C., Strzepek R. F., Bestley S., Wojtasiewicz B., Trull T. W. (2022). Iron limitation drives the globally extreme fluorescence/chlorophyll ratios of the southern ocean. Geophys. Res. Lett. 49, e2021GL097616. doi: 10.1029/2021GL097616
Silsbe G. M., Behrenfeld M. J., Halsey K. H., Milligan A. J., Westberry T. K. (2016). The CAFE model: A net production model for global ocean phytoplankton. Global Biogeochem. Cycles 30, 1756–1777. doi: 10.1002/2016GB005521
Siokou-Frangou I., Christaki U., Mazzocchi M. G., Montresor M., Ribera d'Alcalá M., Vaqué D., et al. (2010). Plankton in the open Mediterranean Sea: A review. Biogeosci. 7, 1543–1586. doi: 10.5194/bg-7-1543-2010
Tagliabue A., Kwiatkowski L., Bopp L., Butenschön M., Cheung W., Lengaigne M., et al. (2021). Persistent uncertainties in ocean net primary production climate change projections at regional scales raise challenges for assessing impacts on ecosystem services. Front. Clim. 3. doi: 10.3389/fclim.2021.738224
Uitz J., Claustre H., Gentili B., Stramski D. (2010). Phytoplankton class-specific primary production in the world’s oceans: Seasonal and interannual variability from satellite observations. Global Biogeochem. Cycles 24, GB3016. doi: 10.1029/2009GB003680
van de Poll W. H., Lagunas M., de Vries T., Visser R. J., Buma A. G. (2011). Non-photochemical quenching of chlorophyll fluorescence and xanthophyll cycle responses after excess PAR and UVR in chaetoceros brevis, phaeocystis antarctica and coastal Antarctic phytoplankton. Mar. Ecol. Progr. Ser. 426, 119–131. doi: 10.3354/meps09000
Webb W. L., Newton M., Starr D. (1974). Carbon dioxide exchange of alnus rubra. a mathematical model. Oecologia 17, 281–291. doi: 10.1007/BF00345747
Westberry T. K., Behrenfeld M. J., Siegel D. A., Boss E. (2008). Carbon-based primary production modeling with vertically resolved photoaccumulation. Glob. Biogeochem. Cycles 22, GB2024. doi: 10.1029/2007GB003078
Westberry T. K., Schultz P., Behrenfeld M. J., Dunne J. P., Hiscock M. R., Maritorena S. (2016). Annual cycles of phytoplankton biomass in the subarctic Atlantic and pacific ocean. Global Biogeochem. Cycles 30, 175–190. doi: 10.1002/2015GB005276
Keywords: primary production, nutrient availability, light availability, nutricline, BGC-Argo floats
Citation: Bendtsen J, Vives CR and Richardson K (2023) Primary production in the North Atlantic estimated from in situ water column data observed by Argo floats and remote sensing. Front. Mar. Sci. 10:1062413. doi: 10.3389/fmars.2023.1062413
Received: 05 October 2022; Accepted: 13 January 2023;
Published: 30 January 2023.
Edited by:
Astrid Bracher, Alfred Wegener Institute Helmholtz Centre for Polar and Marine Research (AWI), GermanyReviewed by:
Heather Bouman, University of Oxford, United KingdomMichael William Lomas, Bigelow Laboratory for Ocean Sciences, United States
Copyright © 2023 Bendtsen, Vives and Richardson. This is an open-access article distributed under the terms of the Creative Commons Attribution License (CC BY). The use, distribution or reproduction in other forums is permitted, provided the original author(s) and the copyright owner(s) are credited and that the original publication in this journal is cited, in accordance with accepted academic practice. No use, distribution or reproduction is permitted which does not comply with these terms.
*Correspondence: Jørgen Bendtsen, am9yZ2VuLmJlbmR0c2VuQHN1bmQua3UuZGs=