 Susana Carvalho
 Zahra Alsaffar1†
 Joanne Ellis
 Hamed Alghamdi
 João Cúrdia
- 1Division of Biological and Environmental Science and Engineering, Red Sea Research Center, King Abdullah University of Science and Technology (Kaust), Thuwal, Saudi Arabia
- 2Environmental Protection Department, Saudi Aramco, Dhahran, Saudi Arabia
In sub-tropical and tropical regions, the diversity patterns of soft-sediment macrobenthic communities are still poorly understood, particularly when compared to temperate shelf environments. The present study investigates spatial patterns of variability in macrobenthic distribution along the eastern Red Sea margin, and the role of sediment composition and other explanatory variables in determining such patterns. This study has two main objectives: (i) to produce a baseline characterization of the Saudi Arabian Red Sea macrobenthic infauna, particularly along the central and southern regions, (ii) to assess the relative contribution of two major processes driving macrobenthic communities (i.e., dispersal-based and environmental filtering), based on changes on beta-diversity components (turnover and nestedness) across multiple scales (up to ~600km), using relevant modeling methodologies. Shallow soft-sediment macrobenthic communities in the Red Sea showed extremely high small-scale variability, highlighted by the percentage of rare species (44% of species present at a single sample) and the dominance of turnover (species replacement) over nestedness. Our results also suggest a strong influence of broad- over fine-scale variation in the species composition. However, sedimentary characteristics, particularly grain-size, played a critical role governing the distribution patterns of soft-sediment macrobenthic communities in the Red Sea. Our findings highlight the importance of regional factors in shaping the macrofaunal community composition whilst also highlighting the role of high species diversity at local scales. The current results suggest the need for conservation measures from regional levels (to maintain genetic diversity) to local levels (to preserve the high occurrence of rare species). To our knowledge, no other study investigated the distribution of Red Sea marine species over large spatial scales combining modeling methods and the partitioning of beta-diversity. The current approach applied to soft-sediment macroinvertebrates can be extended to other marine communities since conservation strategies can be more effective when mechanisms governing species distribution are considered.
Introduction
Oceans cover about 70% of the earth, with soft-sediment habitats spanning most of the bottom of the world’s oceans (Snelgrove, 1999). Of all the biological components found in ocean sediments, the macrobenthos is probably the best studied worldwide. Macrobenthic communities play a crucial role in the functioning of marine ecosystems (Snelgrove, 1998), contributing to the recycling of organic material, nutrients, and other chemical elements (Weisberg et al., 1997; Levin, 2000; Rosenberg, 2001; Lu et al., 2008), as well as increasing oxygen levels in the sediment through bioturbation (Snelgrove, 1997; Gaston et al., 1998; Callier et al., 2013). Overall, macrofauna affects nitrogen, carbon, and sulfur cycling at a global scale. Hence it is a critical component of global carbon budgets and atmospheric CO2 regulation while contributing to nitrogen availability for marine primary productivity (Lohrer et al., 2004; Webb and Eyre, 2004).
In general, the diversity patterns of soft-sediment benthic communities are well-known in temperate shelf environments with a long history of research (e.g., Sanders, 1968; Abele and Walters, 1979; Grassle, 1991; Gray, 1997; Grémare et al., 1998). In sub-tropical and tropical areas, likely due to the prominence of coral reefs, comparatively less research has been dedicated to soft-sediment systems. Hence, there is still a considerable lack of information on soft-sediment biodiversity patterns. Further, factors shaping species composition, abundance, biomass, and diversity of macrofauna are particularly poorly understood in those regions (Warwick, 1987; DeFelice and Parrish, 2001). One of the examples is the Red Sea basin, which knowledge even for the prominent coral reefs is very limited compared with other systems (Berumen et al., 2013). Despite the relevance of the Red Sea in the context of a global warming scenario, the studies available for macrobenthic soft-sediment shallow water communities are scarce and spatially limited (Fishelson, 1971; Basaham et al., 2009; Al-Farraj et al., 2012; Belal et al., 2016; Pearman et al., 2016; Ellis et al., 2017; Alsaffar et al., 2019; Joydas et al., 2019; Alsaffar et al., 2020a; Alsaffar et al., 2020b), especially considering the extent of the Red Sea basin. The scarcity of solid baseline information is of concern considering macrobenthic communities are often used as bioindicators of environmental quality and used in monitoring programs (e.g., Dauvin et al., 2017; Aylagas et al., 2021). Over the last few years, the Saudi Arabian Red Sea has been facing intense coastal development fostered by Vision 2030 (Chalastani et al., 2020; Kleinhaus et al., 2020), a unique transformative economic and social strategic reform aiming to reach a more diverse and sustainable economy (https://www.vision2030.gov.sa/v2030/overview/). Scientists and managers are aware that the future of the Red Sea ecosystems and the success of tourism-related projects under Vision 2030 depends on proper governance, adaptive management, and investment in natural capital solutions (Chalastani et al., 2020; Cziesielski et al., 2021). However, urban and coastal development will pressure local marine ecosystems that are not cohesively protected due to uncoordinated conservation efforts across the region and lack of enforcement (Gajdzik et al., 2021a). Also, information available over large spatial scales is predominantly on reef fish, while connectivity data is overall scarce but critical to promote cross-boundary marine conservation efforts (Gajdzik et al., 2021a; Gajdzik et al., 2021b). Effective conservation of Red Sea ecosystems is urgent. Still, a better understanding of the structuring mechanisms governing the spatial distribution patterns of diverse biological components in relation to environmental conditions is needed to support the design of MPAs or the application of other Marine Spatial Planning (MSP) tools.
Processes operating across multiple spatial scales are known to shape the dynamics of shallow water macrobenthic infaunal communities (Thrush et al., 2005; Ellis and Schneider, 2008). For example, major large-scale processes (e.g., oceanographic processes) can influence the species pool, which will then affect the patterns at a local level (Thrush et al., 2000; Wootton, 2001). Biological interactions at small spatial scales will further influence the final arrangement of species (Shin and Ellingsen, 2004). Indeed, and according to the niche-based theory, the species present at a certain regional pool must pass through three filters before successful colonization, i.e., dispersal, environmental, and biotic (Chase, 2003; HilleRisLambers et al., 2012). Patterns will most likely change according to the scale at which they are investigated. Investigating the relative contribution of biological interactions and regional processes to marine biodiversity patterns has challenged ecologists (Schneider, 1994; Schneider, 2001; Ricklefs, 2004). Most studies conducted regarding the biodiversity changes in marine shallow water soft-sediment macrobenthic communities are limited concerning the scales of variability (but see Thrush et al., 2005; Hewitt et al., 2007; Ellis & Schneider, 2008; Puri et al., 2017). Only a few studies are available encompassing changes over several degrees of latitude (Ellingsen, 2001; Ellingsen, 2002; Thrush et al., 2010; Hernandez-Avila et al., 2020), and even more limited are those exploring how different abiotic factors interact to determine local species assemblages, i.e., investigating hierarchical environmental filtering (but see Hummel et al., 2017; Menegotto et al., 2019; Brustolin et al., 2021). Investigating changes in community similarity across geographic and environmental distances allows disentangling the relative contribution of stochastic (i.e., distribution of species without directional trends and will not be different from a random pattern) and deterministic processes (e.g., environmental filtering) at multiple scales (Soininen et al., 2007a). When combined with connectivity dimensions (e.g., through ocean models), a better understanding of the processes behind community structure at different spatial scales can be achieved (Moritz et al., 2013). Nevertheless, those are not always available.
Considering that post-larval dispersal is common in coastal systems, investigating the relative contribution of dispersal capacity and environmental conditions at the metacommunity scale will help understand regional biodiversity patterns and its different components: i) the total diversity of species in a given region (gamma-diversity); ii) alpha-diversity usually estimated by the number of species or diversity indices (e.g., Shannon-Wiener) at a given site; iii) beta-diversity that provides an estimate of the variability in species composition between sites based on measures of dissimilarity (e.g., Jaccard, Bray-Curtis) and can be estimated by species richness or diversity indices (Crist et al., 2003). Over the last decade, beta-diversity attracted growing interest from the scientific community. Particularly when partitioned into turnover (i.e., species replacement) and nestedness (related to species richness, i.e, sites present a subset of species from a richer species pool) (sensu Baselga, 2010), beta-diversity can be useful to guide conservation measures (Angeler, 2013; Moraitis and Karakassis, 2020). Communities governed by nestedness usually result from the dominance of generalist species throughout existing environmental gradients, whereas communities governed by turnover are dominated by species that are constrained by environmental filtering (Medeiros et al., 2016). Therefore, while in the first case, priority should be given to the conservation of sites with higher diversity, in the latter, a network of sites should be protected to maximize the conservation of varied species (Baselga, 2010).
The present study aims to improve our understanding of the biodiversity of shallow water benthic communities of subtropical areas across multiple spatial scales, providing a baseline characterization of the Saudi Arabian Red Sea macrobenthic infauna, particularly along the central and southern regions, where soft sediment ecosystems are more extensive. The Red Sea has natural gradients of temperature and salinity in a general oligotrophic system with limited rainfall and no riverine discharges. Primary productivity can be of relevance in the Red Sea, where waters are mainly oligotrophic. Productivity is usually low, particularly in its central region (Al-Aidaroos et al., 2017; Kheireddine et al., 2017; Pearman et al., 2017). The southern Red Sea is the warmest and the most productive region receiving regular inputs of nutrients from the Gulf of Aden, hence presenting higher concentrations of chlorophyll a throughout the year (Pearman et al., 2016). Therefore, patterns change with latitude, driven by oceanographic and atmospheric processes. From the far more extensive literature on coral reef ecosystems, the Red Sea is known to support a very rich fauna (DeVantier et al., 2000; Carvalho et al., 2019a) with high levels of endemism (DiBattista et al., 2016) and high variability over short spatial scales (Pearman et al., 2018). Coral reefs thrive in oligotrophic waters due to the mutualistic association of some species with endosymbiotic photosynthetic algae (zooxanthellae), which fosters both the uptake and recycling of nutrients. This has been linked to the paradox of high productivity of coral reef habitats in nutrient-poor regions (Wild et al., 2004; De Goeij et al., 2013). However, mutualistic symbiotic associations do not drive soft-sediment macrobenthic communities, and they heavily rely on the available organic matter sources (Pearson and Rosenberg, 1978; Snelgrove, 1999; Kon et al., 2009). Considering the existing natural gradients in salinity, temperature, nutrients, and productivity in the Red Sea basin and small-scale sediment dissimilarity, we also aim to investigate the relative contribution of two major regional processes driving macrobenthic communities (i.e., dispersal-based, and environmental filtering). Combining ecological modeling approaches with the partitioning of beta-diversity (nestedness and turnover), we analyze for the first-time key drivers shaping the distribution of Red Sea marine macrobenthic soft-sediment communities across multiple scales (up to ~600 km) and environmental dissimilarity. Despite the increasing interest in the partitioning of beta-diversity to investigate patterns of change in macrobenthic communities (e.g., Medeiros et al., 2016; Alsaffar et al., 2019), large-scale studies combining beta-diversity measures and modeling approaches are still limited (Moraitis and Karakassis, 2020).
Material and methods
Study area and sampling strategy
The Red Sea is approximately 2100 km long and 280 km wide, with approximately 1800 km of the eastern coast belonging to Saudi Arabia. The average depth is about 500 m, but in some places, it is deeper than 2000 m. It is a semi-enclosed sea connected to the Mediterranean Sea through the Suez Canal and to the Indian Ocean through the Strait of Bab el Mandab. The Red Sea is surrounded by deserts without permanent river discharges, which along with the high evaporation rates, makes it one of the most saline of the world’s oceans (Sofianos et al., 2002). Water temperature ranges from 21-28°C in the North and 26-32°C in the South. The average salinity in the south of the Red Sea is about 37 and can reach 42 in the North (Edwards, 2013).
Sediment samples were collected along the Saudi Arabia Red Sea coast at different areas spanning two of the main regions (sensu Pearman et al., 2019): i) Center – Rabigh (RAB), Thuwal (THU), Jeddah (JED); and ii) South - Farasan Banks (FB), Jazan Economic City (JEC), Jazan JAZ), and Farasan Islands (FI). The two regions represent different scenarios of temperature and productivity that are summarized in Table 1. In total, 120 Van Veen (0.1m2) samples were collected (Figure 1). Except for Rabigh, where the samples were collected in February-March 2016, all samples were collected in the winter of 2014 (January-March). The Red Sea, unlike temperate regions, has two marked seasons (November-April; May-October) (Ellis et al., 2019; Alsaffar et al., 2020b); therefore, despite the temporal gap, all samples were collected within the same season. The distribution of the samples in the central (37%) and south (63%) regions was not balanced, mainly as a result of an extensive sedimentary shelf in the southern Red Sea that allows the collection of samples across nearshore to offshore gradients. Samples were collected from 4 to 138m depth and in sedimentary environments ranging from mud to coarse sand.
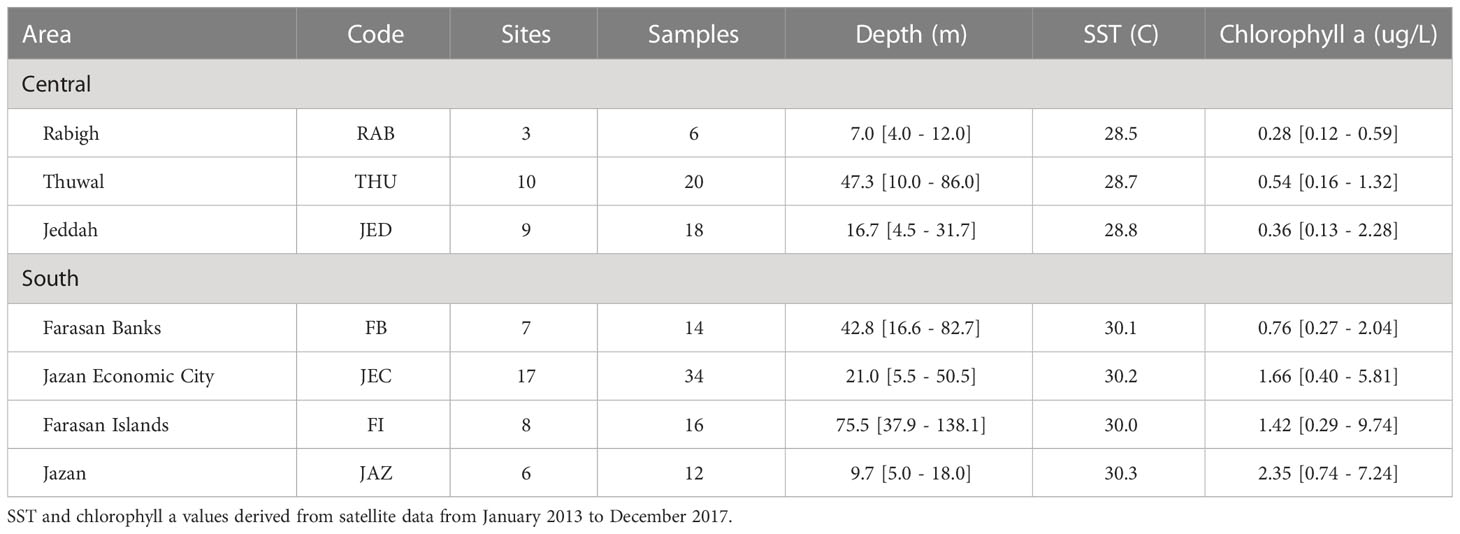
Table 1 Number of samples and sites per region (Central, South) and location (Rabigh, Thuwal, Jeddah, Farasan Banks, Jazan Economic City, Farasan Islands, Jazan), mean depth, mean annual sea surface temperature (SST), and chlorophyll a.
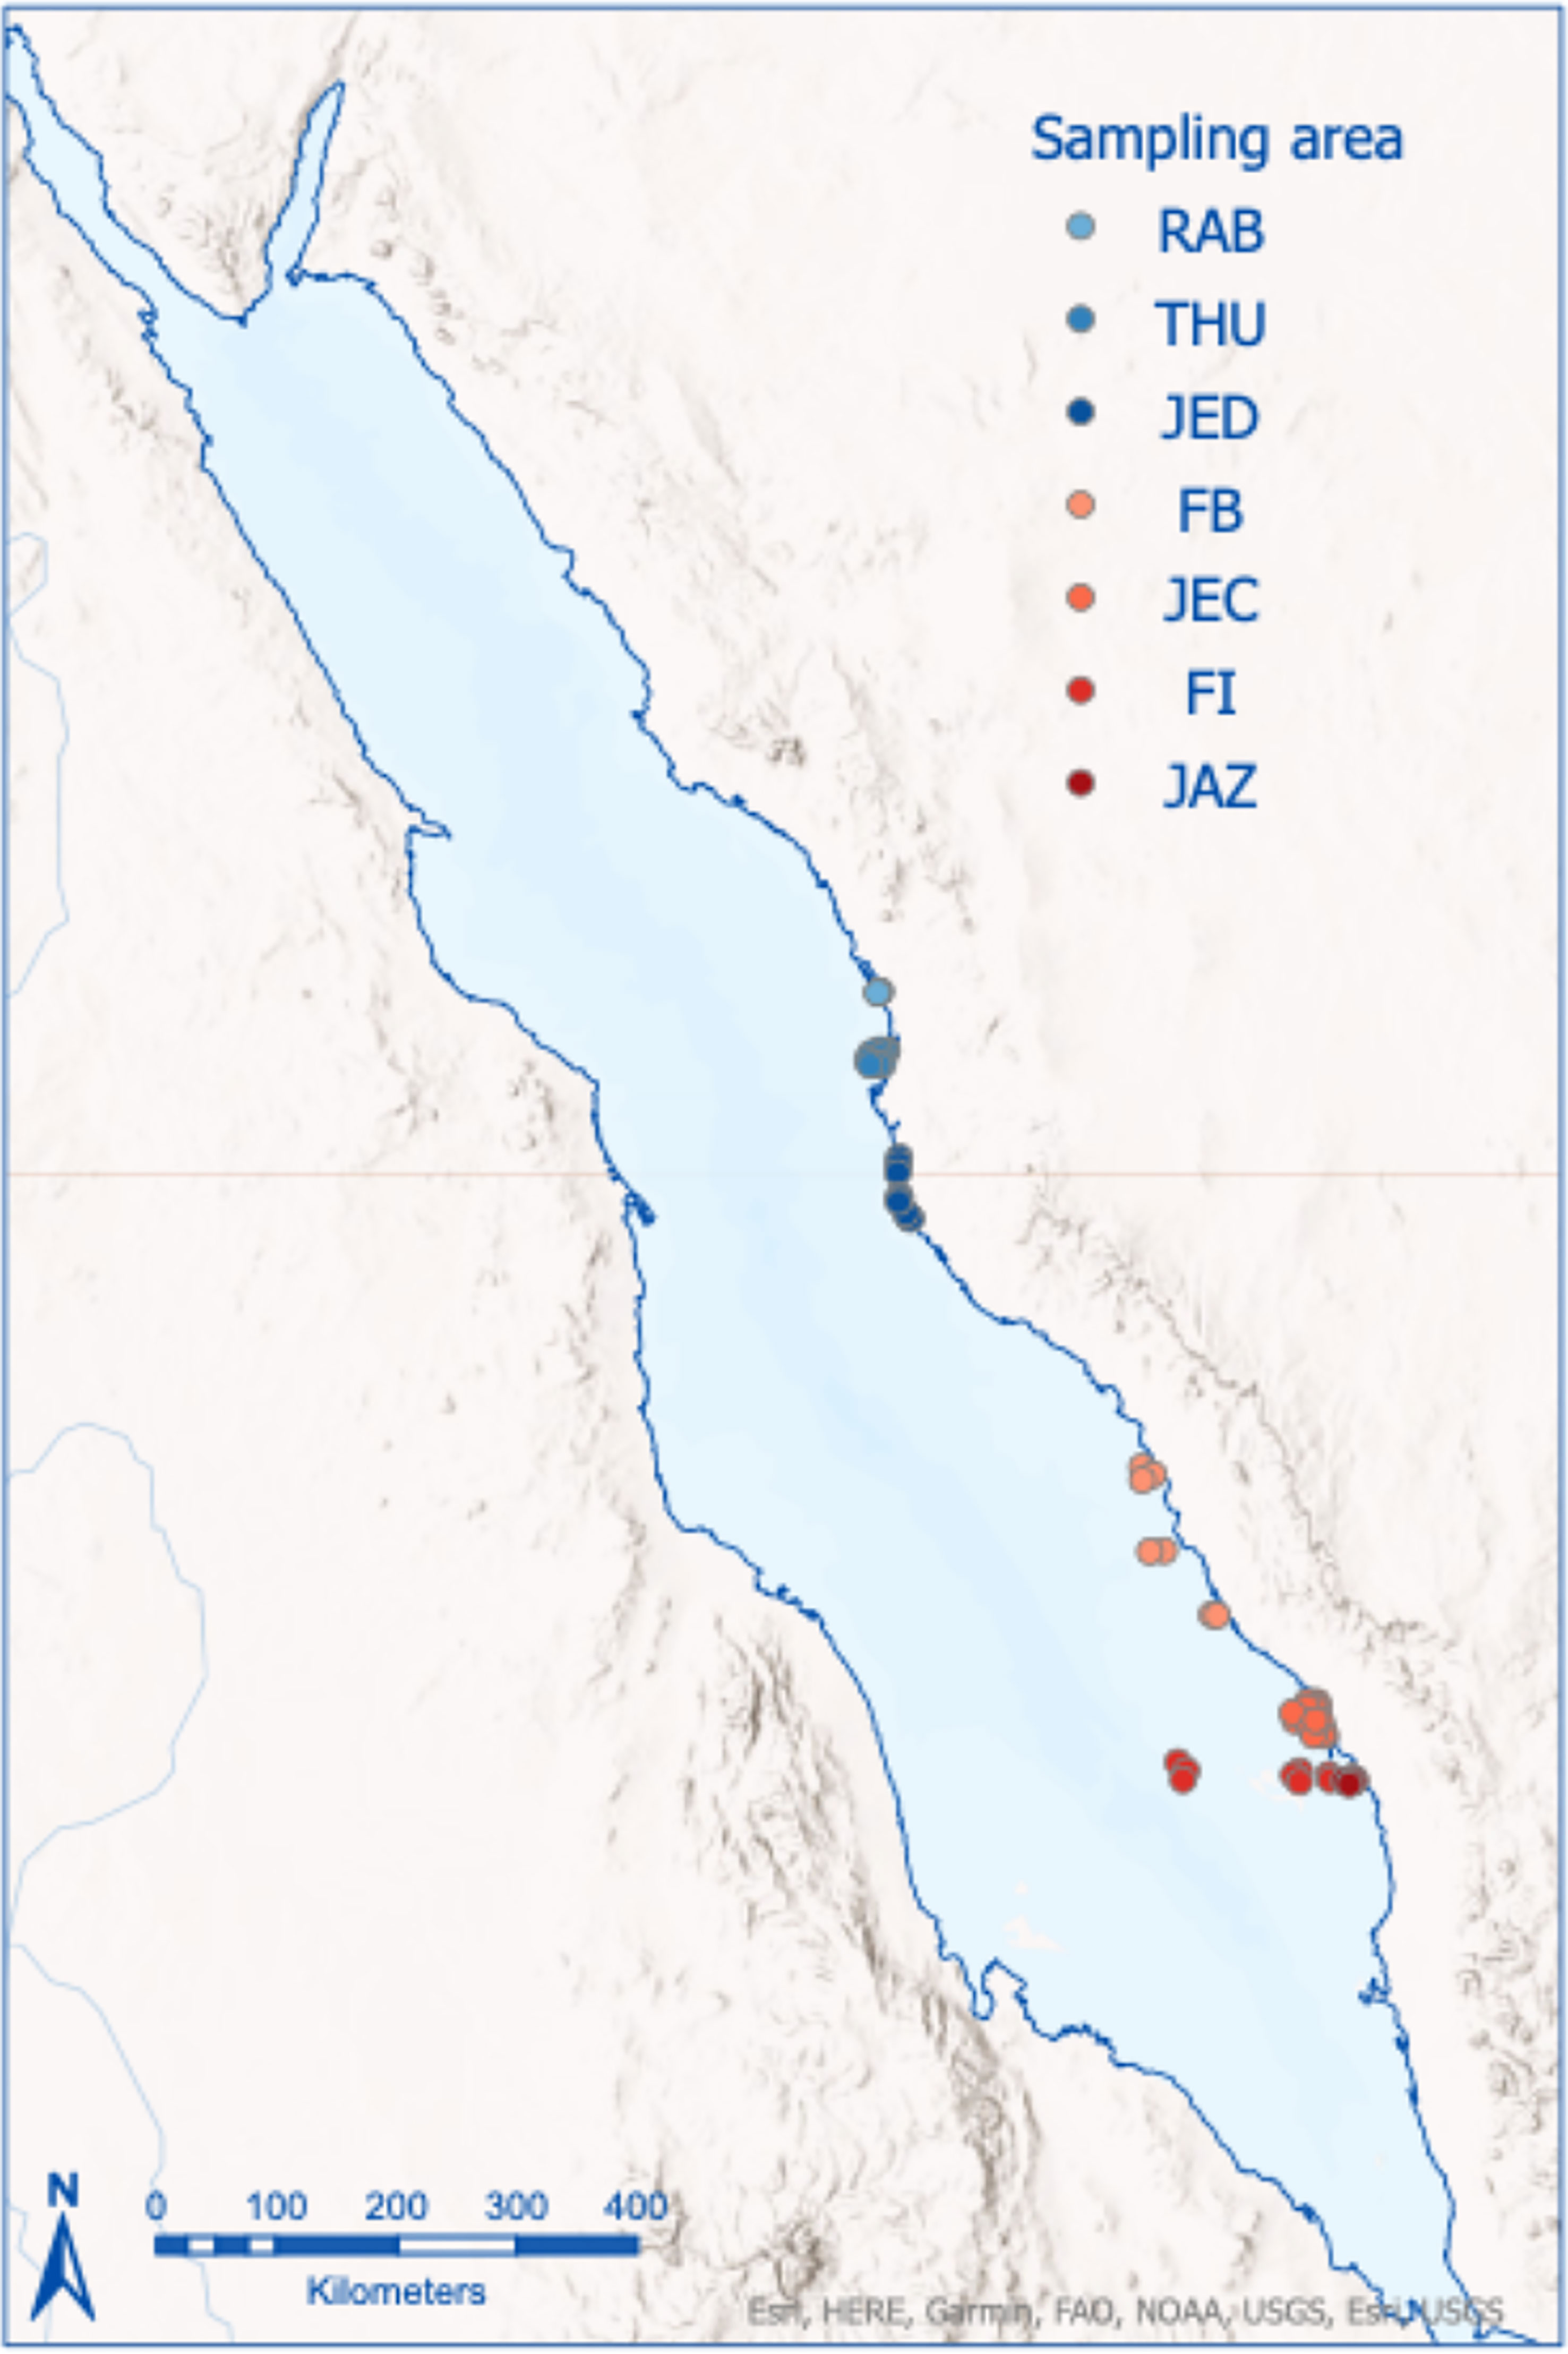
Figure 1 Map showing the position of samples in seven locations along the central-southern Red Sea, Ra=AB, Rabigh; THU, Thuwal; JED, Jeddha; FB, Farasan Banks; JEC, Jazan Economic City; FI, Farasan Islands; JAZ, Jazan.
Water samples were taken for nutrients (phosphate, nitrate, nitrite, and silicates), at least from the surface and the bottom layers. Two replicates were collected at each site for the study of macrobenthic assemblages. Samples were sieved through a 1 mm mesh screen, and the retained material was preserved in 96% ethanol. Samples were also collected for grain-size analysis and organic matter content.
Laboratory analysis
Approximately 50 mL water was filtered through 0.22 µm membrane filters for nutrient samples, which were then frozen at -20 ˚C until analysis. The samples were analyzed using a Segmented Flow Analyzer from SEAL ANALYTICAL. Grain particle-size analysis was performed in two steps. First, the fine particles (silt and clays, <63 μm) were wet separated from the sand and gravel fractions with a 63 μm sieve. The silt/clay fraction was recovered by sequential decantation of percolated material, dried and weighed. The sand and gravel fractions were separated after drying the retained material in the 63 μm at 80°C until reaching a constant weight. Afterward, the dried sediment was separated by mechanical shaking using a column of sieves (63, 125, 250, 500, 1000, 2000 μm). Gravel constitutes the above 2000 μm fraction, while sand comprises the sum of all the remaining fractions. Organic matter content quantified by loss on ignition (LOI) was measured by dry sediment loss (24-48h) after combustion at 450°C (for 4h). The LOI was then calculated using the following equation: LOI = (Wi – Wf)/Wi * 100, where: LOI = organic matter content (%), Wi = initial weight of the sediment subsample; Wf = final weight after ignition.
Each biological sample was hand-sorted, and the organisms were identified using a stereomicroscope. Organisms were identified to the lowest practical taxonomic level. The lack of taxonomic knowledge for most of the soft-sediment invertebrates in the region and the preservation method (i.e., ethanol) precluded the identification of organisms to the same taxonomic level.
Satellite data
Sea surface temperature (SST) and Chlorophyll a (Chl a) satellite data were obtained from NOAA Coral Reef Watch’s CoralTemp (Liu et al., 2014) and Moderate-resolution Imaging Spectroradiometer MODIS (NASA Goddard Space Flight Center, Ocean Ecology Lab), respectively. The NOAA Coral Reef Watch Version 3.1 Monthly Composites of 5km Satellite Coral Bleaching Heat Stress Product was used to extract SST data between 2013 and 2017 for each sampling location. Regarding Chl a, between 2013 and 2017, the monthly data of level-3 products (DOI data/10.5067/AQUA/MODIS/L3M/CHL/2018) were obtained using a passive ocean color MODerate resolution Imaging Spectroradiometer (Aqua sensor; MODIS-Aqua) with a spatial resolution of 4 km. When data for the location-specific grid point was unavailable, the average value for the 3x3 grid around the sampling point was used. The average monthly Chl a was calculated for a period of 4 years (2013-2017). Regarding SST, both the average and the range (maximum–minimum) of the monthly means was calculated for each sampling point and, similarly to Chl a, for a period of 4 years (2013-2017). Chl a was used as a proxy of primary productivity.
Data analysis
Data was analyzed using a combination of multivariate and univariate methods. Macrobenthic community structure was characterized by density (N), number of species (S), and beta-diversity partitioned into two separate components, “turnover” and “nestedness” (sensu Baselga, 2010). The number of singletons (i.e., the number of species collected only once) was quantified and used to define rare species. We have also investigated the effects of key environmental drivers on total beta-diversity (Jaccard) and on its components, i.e., turnover and nestedness (Baselga, 2010).
To investigate the importance of environmental filtering on the distribution of macrobenthic species in the Red Sea, we started analyzing the changes in macrobenthic assemblages to sediment grain size variables known to be good predictors of composition (Freitas et al., 2011; Carvalho et al., 2012). We tested the percentage of silt/clay, fine sand and coarse sand particles as predictors of the number of species using linear regression. Given the complex nature of the responses of the macrobenthic communities to sediment composition and structure, we analyzed the responses to a sedimentary gradient. A Principal Component Analysis (PCA) was used to reduce the variation into a single dimension (Figure SM1 and Tables SM1, SM2). Except for silt/clay, data was not normally distributed, and a Box-Cox transformation was used to normalize the data. The fractions of the sediment grain size (gravel, coarse sand, medium sand, fine sand and silt/clay) showed high correlations between them. Silt/clay particles (< 63 μm) showed a high negative correlation to all the other grain size variables (Pearson’s r: -0.55 to -0.87). Coarse sand was also highly correlated to gravel (r = 0.75) and medium sand (r = 0.64). Fine sand was less correlated to other sand fractions and gravel (Pearson’s r: -0.04 to 0.24). The PCA based on the grain size variables (Figure SM1) reflected these correlations, with the first principal component explaining 72.4% of the total variation. All variables correlate highly to this principal axis (0.61 to 0.95, absolute values; Table SM2). The fine sand fraction is the least correlated to the first principal component (0.61) and the only one that has a higher correlation (-0.73; Table SM2) to the second principal component. The values of the first principal component of the PCA (Figure SM1) integrate the information regarding the grain size of all samples, and, therefore, the term “sedimentary gradient” will be used henceforth.
A second PCA was conducted to detect patterns between samples regarding explanatory variables. After checking for correlations between variables and normality of the data, the following variables were used: depth, mean Chl a (2013-2016; Chl a), range of monthly average SST (2013-2016; SSTr), sedimentary gradient (SedG), LOI and nitrate (NO3). The average monthly mean SST was highly correlated to the average monthly Chl a, and therefore was not included in the analysis. Instead, we calculated the range between maximum and minimum annual temperature, as it provided complementary information to the set of variables in the analysis. The analyzed nutrients presented high positive correlations among them (Pearson’s r: 0.45 – 0.68) following a linear trend (data not presented). Nitrate is used as a proxy of nitrite, phosphate, and silicate.
To disentangle the relative contribution of the effects of environmental drivers from processes that can cause spatial autocorrelation (e.g., random colonization, local extinction), we investigated the association between sedimentary environmental variables (i.e., sedimentary grain size gradient, LOI), oceanographic variables (i.e., depth, nitrate - NO3 -, Chl a, range of monthly average SST) and the relative geographic position of the samples, following the approach used by Menegotto et al. (2019). A connection network was defined as a neighborhood by distance, with 22.2km (0.2 decimal degrees) as the maximum distance between any two neighbors. A set of maps of decreasing spatial grain to detect spatial autocorrelation, Moran Eigenvector Maps (MEMs) were created (a total of 58). The spatial autocorrelation for each explanatory variable was tested using Moran’s I and MEMs were separated into broad-spatial scale (positive; MEMs 1 to 14; a total of 14 MEMs) and small spatial scale (negative; MEMs 15 to 58; a total of 44 MEMs) (e.g., Dray, 2011). Groups of sequential MEMs (7) were used to further explore at what level of spatial grain the autocorrelation with environmental variables is detected and to inform on the selection of MEMs that can be used to partition variability (Dray et al., 2012).
The association between macrobenthic composition and the relative effects of environmental variables was analyzed through a redundancy analysis (RDA) using a Jaccard similarity matrix based on presence/absence. Spatial autocorrelation in the two main ordination axes was analyzed using correlograms of groups of MEMs and significance tests (Dray et al., 2012). A Partial Residual Analysis (PRA) was performed on the RDA residuals to observe any patterns concerning the variability in community structure that cannot be explained by the environmental variables. The two main axes of the PRA were checked for spatial autocorrelation using groups of MEMs, as explained above. When spatial autocorrelation was detected, a set of MEMs that can be used as explanatory variables in the constrained analysis was selected by a stepwise forward procedure (Blanchet et al., 2008; Bauman et al., 2018) both for the RDA and the PRA. Variation partitioning of the Jaccard similarity was then performed using sets of explanatory variables: sedimentary environmental variables (i.e., sedimentary grain size gradient, LOI), oceanographic variables (i.e., depth, nitrate, mean Chl a, mean range of SST), and broad- and small-scale spatially related patterns. The variation partitioning was visualized using Euler diagrams. Significance tests for individual fractions of the variation partitioning analysis were conducted using partial RDA (Legendre, 2008). Significance tests for individual fractions of the variation partitioning analysis were conducted using partial RDA (Legendre, 2008). The shared variability between geographic space-environment, i.e., between broad-scale spatial gradients and the set of variables (oceanographic and sedimentary), was tested using Moran spectral randomizations (MSR; Monte Carlo tests with 999 permutations; Bauman et al., 2019).
To fully evaluate the association between beta-diversity and the environmental drivers across spatial scales, we developed generalized additive models (GAM) to allow for nonlinear adjustment. To prevent over-parameterization, the model was built to estimate beta-diversity based on sediment variables (sedimentary grain size gradient and LOI) and mean Chl a (also acting as a proxy of mean SST as both are highly correlated) that reflects the general latitudinal gradient in the Red Sea. The selection of these main predictors was based on the results of the PCA, but also on the literature (Carvalho et al., 2006; Freitas et al., 2011; Carvalho et al., 2012). The conceptual model also included the geographic distance between samples (km). The interaction between distance and sedimentary gradient and between distance and Chl a were included in the model to account for strong latitudinal shifts in sediment composition and productivity.
All statistical analyses were done in R (R Core Team, 2021) using different libraries. Spatial autocorrelation and Moran spectral randomizations were conducted using the adespatial library (Dray et al., 2021). Constrained multivariate analyses (RDA, PRA) were conducted using ade4 library (Thioulouse et al., 2018). For the partition of multivariate variation, we used vegan library (Oksanen et al., 2020). Partitioning of beta-diversity was conducted using betapart library (Baselga et al., 2021). Finally, the generalized additive models were developed with the mgcv library (Wood, 2017).
Results
General biodiversity patterns
A total of 6588 individuals belonging to 557 taxa were retrieved. Overall, Annelida (Polychaeta 249 taxa), Mollusca (Bivalvia, 52 taxa; Gastropoda, 47 taxa), Arthropoda (153 taxa), and Echinodermata (26 taxa) were the dominant groups in terms of the number of taxa. Polychaeta contributed to 46.3% of total abundance, whereas Arthropoda and Mollusca contributed to 23.0% and 16.7%, respectively.
Overall, the dominance levels of macrobenthic communities were very low. The most abundant taxon, the bivalve Arcuatula variegata, contributed 10.4% of the total abundance. Apart from this species, only another 12 taxa contributed more than 1% to the total abundance, specifically the polychaetes Eunice indica (7.1%), Lumbrineris sp. (2.6%), Linopherus sp. (2.6%), Scyphoproctus cf. pullielloides (2.2%), Magelona sp. (2.1%) and cf. Capitellethus sp. (1.4%), the crustacean Ampelisca spp. (7.9%), the sipunculids Golfingiidae n.id. (1.9%), Aspidosiphon muelleri muelleri (1.3%) and Phascolion (Phascolium) strombus strombus (1.3%), Nemertea (1.3%) and the echinoderm Amphioplus (Lymanella) laevis (1.2%). Altogether, they contributed to 43.3% of the total abundance. Thuwal, Jeddah, and Farasan Islands were the areas showing the lowest levels of dominance, i.e., more taxa were needed to reach a similar abundance.
Overall, 44% of the taxa were rare, being present in a single sample (i.e., singletons), with 95% of taxa being present in 10 samples or fewer. Only Nemertea n.i., Lumbrineris spp., Ampelisca spp. and Magelona spp. were surveyed in more than 30 locations (Figure 2).

Figure 2 Frequency of occurrence of taxa per sample in the study area highlighting the percentage of taxa found in up to four samples and the 95% threshold. Taxa with the highest frequency of occurrence are also indicated.
Individual environmental variables as predictors of macrobenthic species richness
We observed an increase in the number of species with the increasing percentage of fine sand and coarse sand (R2 = 0.249, P<0.001; R2 = 0.267, P<0.001, respectively), whereas the number of species decreased with increasing percentage of silt/clay (R2 = 0.465, P<0.001) (Figure 3).
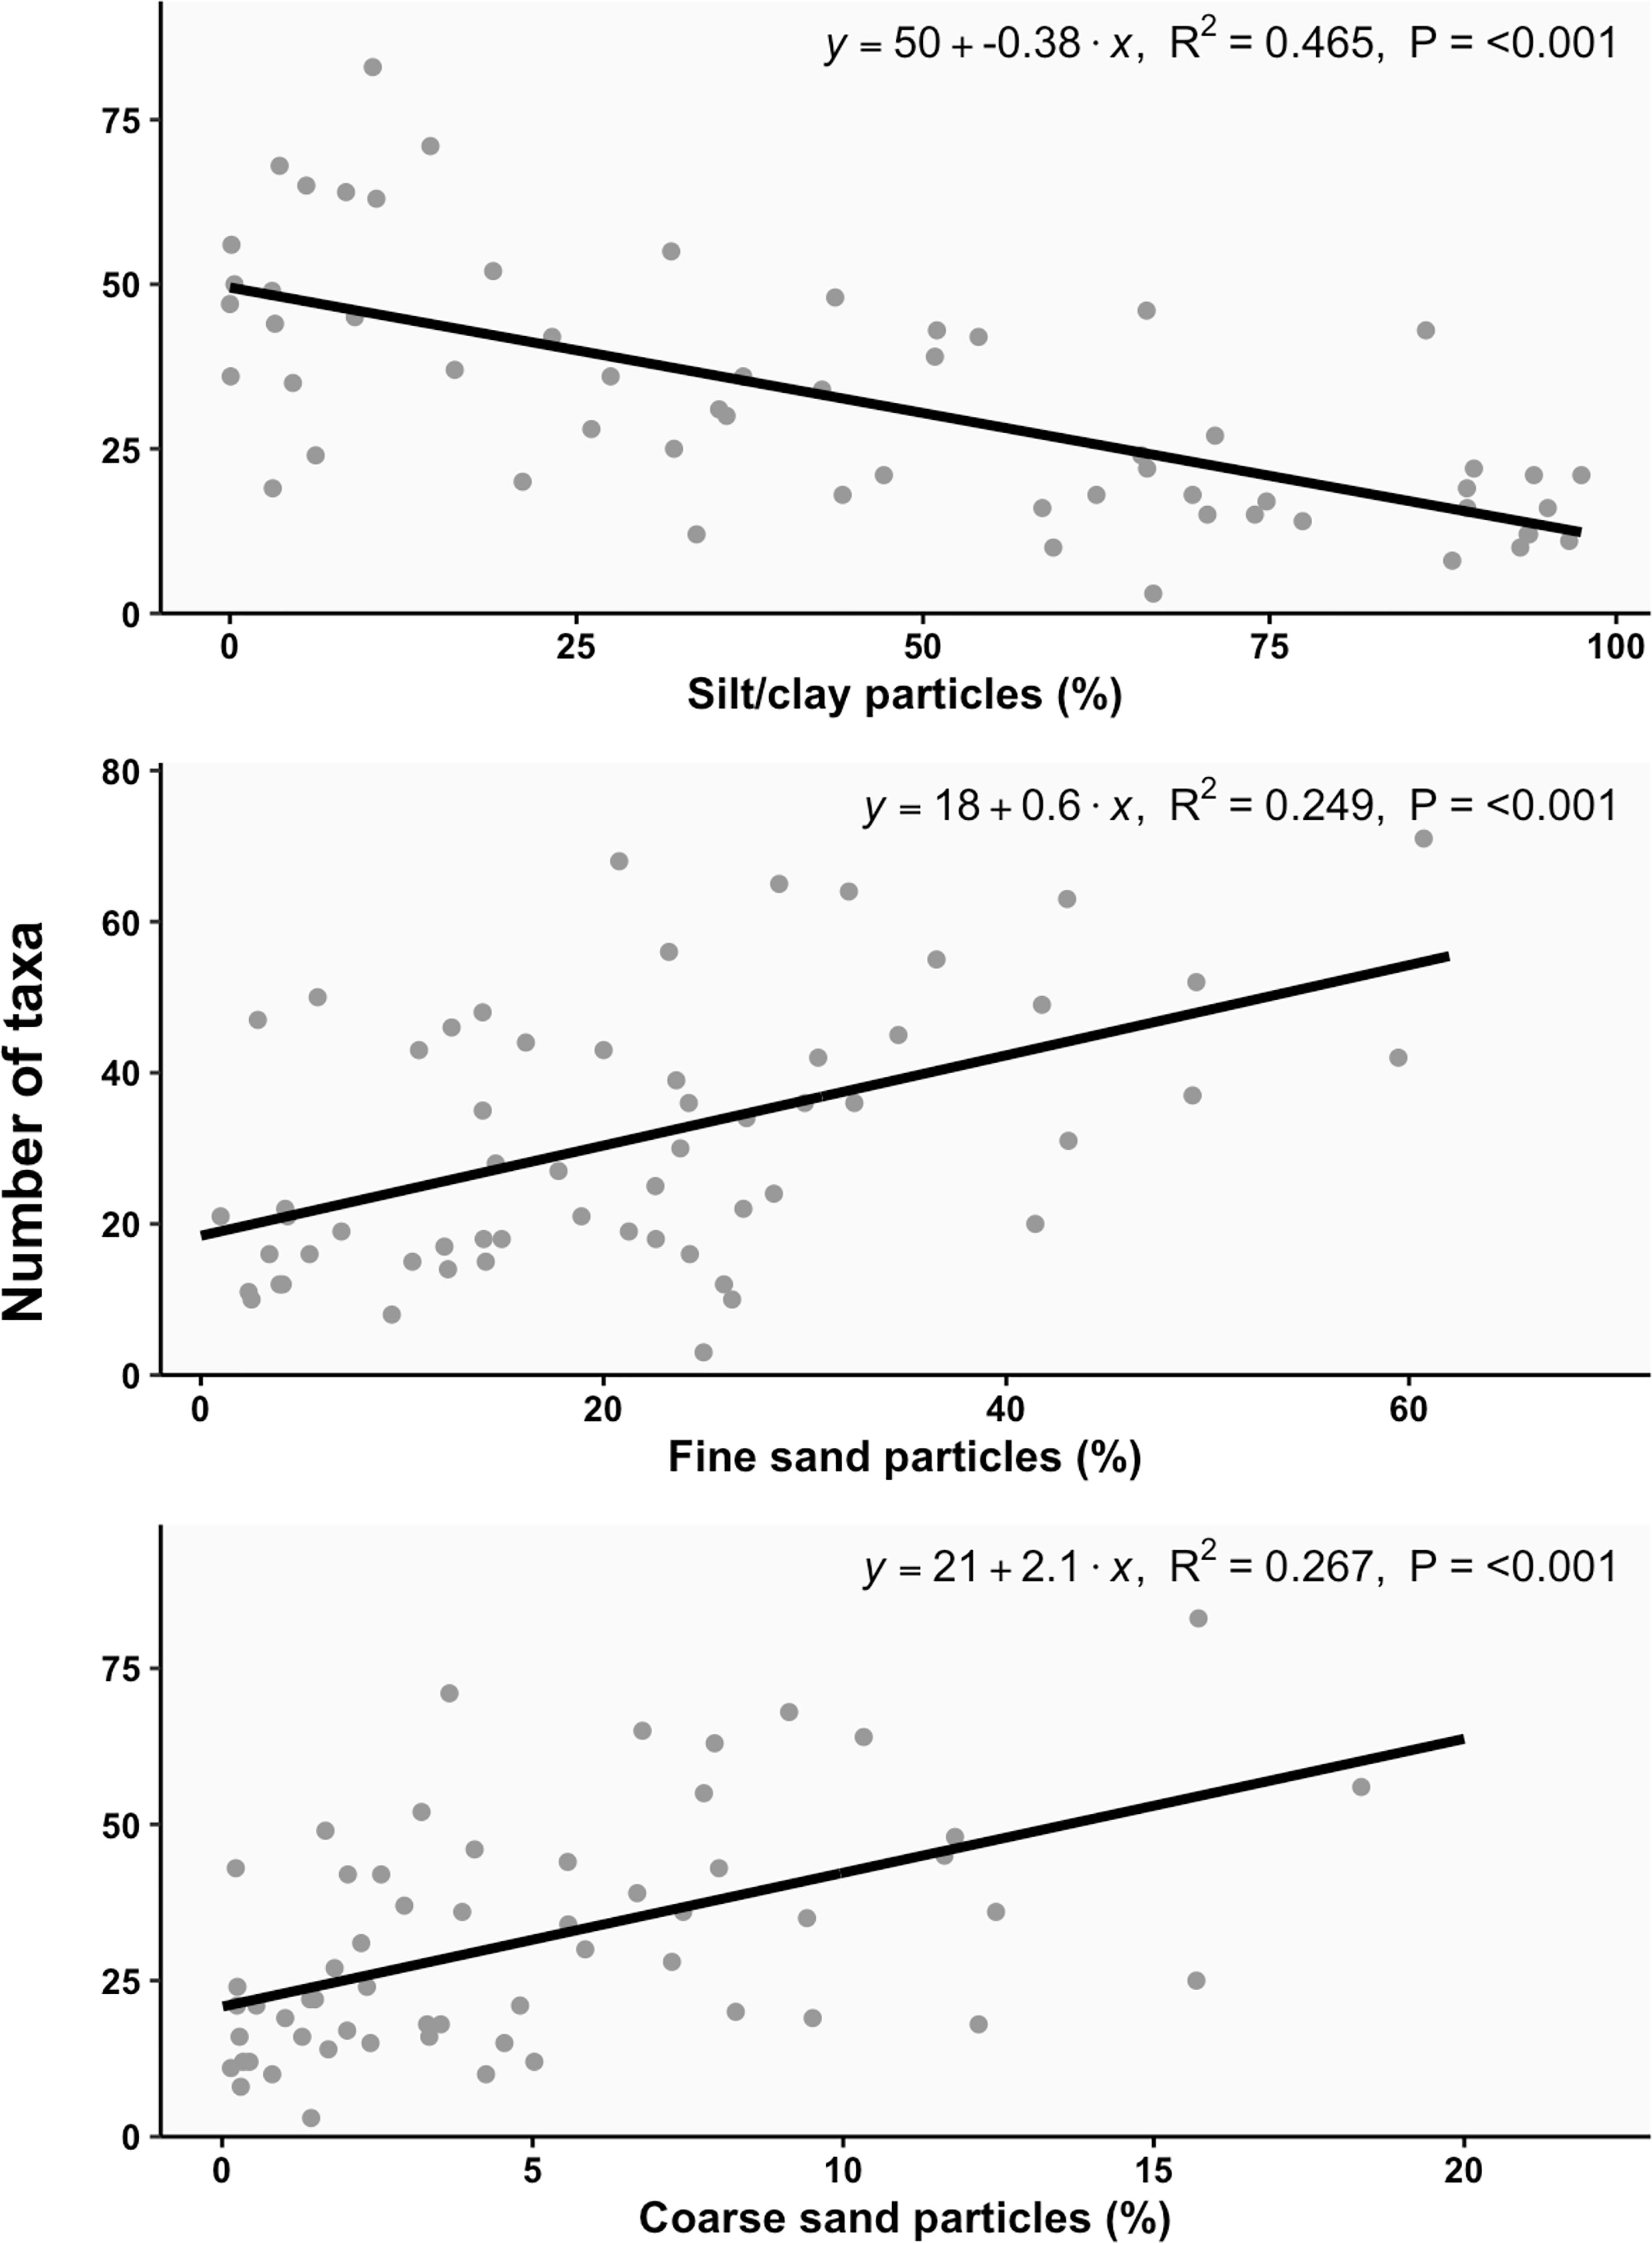
Figure 3 Linear relationship between major sediment fractions (%; silt/clay, fine sand, coarse sand) and the total number of taxa per site.
Sedimentary changes along the geographic gradient
The PCA (Figure 4A) of the selection of environmental variables (sedimentary grain size gradient, LOI, nitrate, depth, mean Chl a, and SST range) discriminates the samples along the latitudinal gradient (second PCA dimension) with Chl a (and implicitly SST) as the main driver of that separation (r=-0.72). The sedimentary grain size gradient is strongly correlated to the main axis of the PCA (r=-0.88) and separates samples within each area. The multivariate analysis did not show a clear separation between central and southern Red Sea sedimentary environments (Figure 4A). Variability in the central Red Sea (Rab, Thu, Jed) was smaller than that found in the south (FB, JEC, FI, JAZ) (Figure 4A). Along the first axis, some samples collected in central and south regions group together, responding to increasing depth and/or LOI (Figure 4A), showing similar sedimentary conditions across the whole latitudinal gradient.
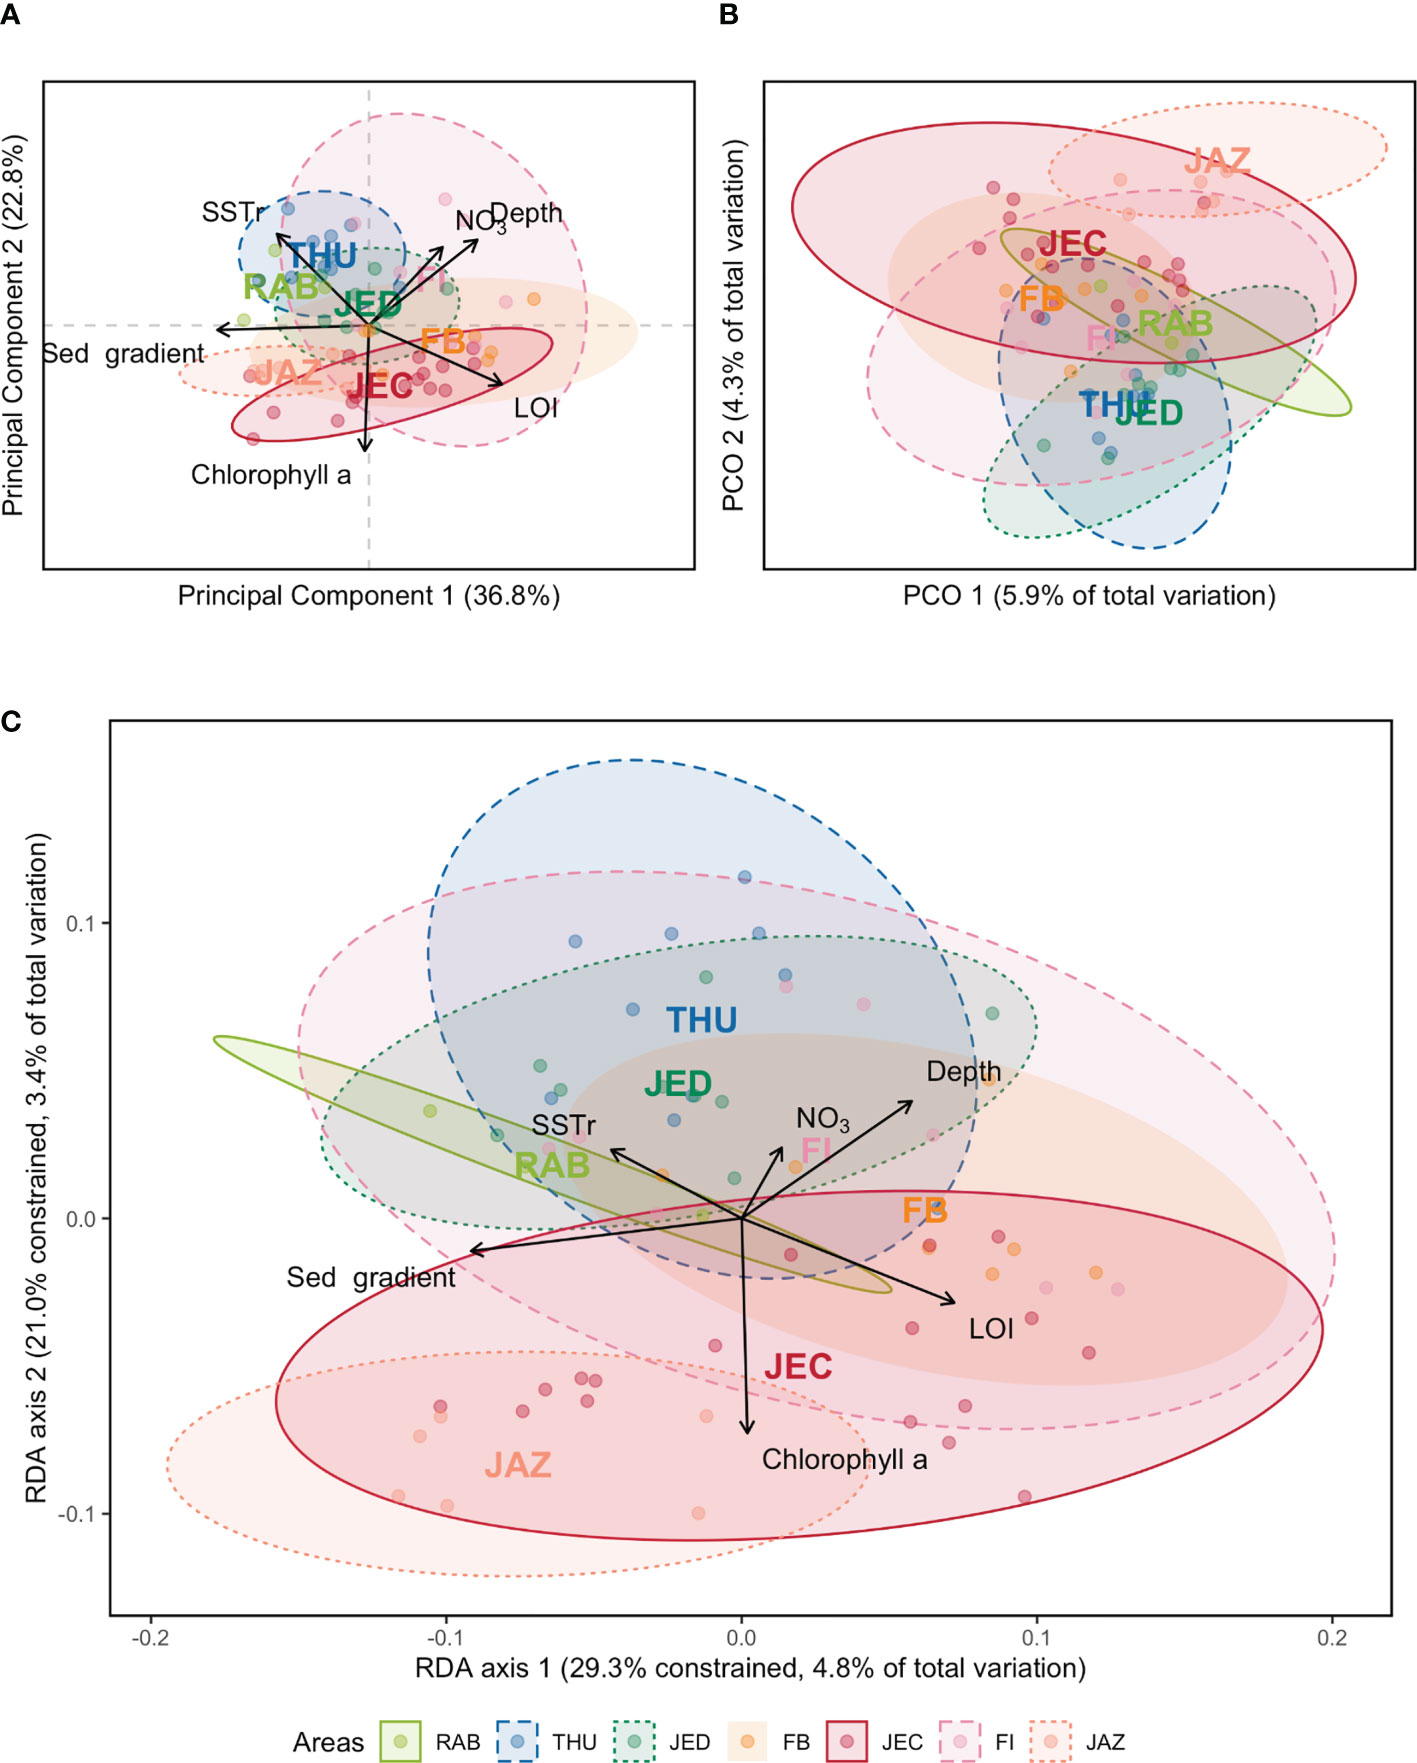
Figure 4 (A) Principal components analysis (PCA) of the reduced set of environmental data, namely nitrate (NO3), depth, chlorophyll a, organic matter content (LOI), sea surface temperature range (SSTr) and sedimentary grain size gradient (sed gradient). (B) Principal coordinates analysis ordination based on presence/absence data and using Jaccard dissimilarity. (C) Species-environment relationship using redundancy discriminant analysis (RDA). Different colors represent the Red Sea areas sampled in the study. Central region: RAB (Rabigh), THU (Thuwal), JED (Jeddah); South region: FB (Farasan Banks), JEC (Jazan Economic City), JAZ (Jazan), FI (Farasan Islands).
Depth, mean Chl a, SST range, nitrate, and LOI show significant spatial autocorrelation, indicating that changes between samples are closely related to geographic distance (Table SM3). The data also shows that the spatial correlation of the environmental variables occurs at the broader scales (1-7 MEMs) and is particularly strong regarding mean Chl a and SST range (R2 = 0.91, P=0.001; R2 = 0.79, P=0.001, respectively, Table SM4). No spatial auto-correlation is observed for the sedimentary grain size gradient (Table SM3).
Changes in community composition along the geographic and environmental gradients
The multivariate analysis of the Jaccard dissimilarity shows the distribution of the samples according to their geographic areas along the second axis (Figure 4B). The 20 first dimensions of the PCO (Figure 4B), account for 57% of the total composition variability and therefore reflect most of the compositional change for the samples. The central areas, JED, THU, and RAB, cluster at the bottom of the ordination plot, whereas the southern areas, JAZ, JEC, and FI, cluster in the upper part. The samples from the Farasan Islands (FI) scatter between these two main groups (Figure 4B).
The scalograms of the initial PCO (community only; Figure SM3) show for both axes a significant broad-scale nonrandom spatial pattern, more pronounced for the second axis (1-7 MEMs; R2 = 0.642, P=0.001), when compared to the first one (8-13 MEMs; R2 = 0.218, P=0.030).
The redundancy discriminant analysis (RDA, Figure 4C), based on the Jaccard dissimilarity, showed that beta-diversity patterns are poorly explained by the set of explanatory variables tested with only 16.3% of total inertia explained (first two axes accounting for 8.2%). The ordination patterns, however, are similar to both the PCA (Figure 4A) and PCO (Figure 4B), showing some areas segregated along the latitudinal gradient (second dimension of the RDA) and high variability within the areas (mostly along the first dimension of the Figure 4C). The first two axes explain 29.3% and 21.0% of the explained variance, with the first axis being correlated mainly to the sedimentary grain size gradient (r=0.94) and LOI (r=-0.74) and the second axis to mean Chl a (r=-0.89). When analyzing the variability not explained by the selected variables, the Partial Residual Analysis (PRA; Figure SM4) shows that the latitudinal gradient is no longer evident, suggesting that the variables not measured are not strongly related to those changes but may resolve the variability within each area.
The relationship between environmental variability and species composition (Jaccard dissimilarity) assessed by the RDA showed nonrandom positive spatial autocorrelation for both axes of the RDA (Figure SM5). Spatial autocorrelation is high at the broadest scales (1-7 MEMs) for the second ordination axis but also noticeable at more intermediate scales (8-13 MEMs) in the main ordination axis (Figure SM5). This was corroborated by the forward selection procedure that resulted in a set of 9 MEMs that reflect nonrandom not measured spatially related processes that are relevant to explain the community patterns (Table SM5). The selected MEMs regarding the constrained variance (RDA) are 1-7, 10 and 12 (Table SM5), all within the broad-spatial scale range (1-14; see methods).
The variability of the community patterns that cannot be explained by the set of environmental variables used (the residuals, PRA) also shows nonrandom spatial autocorrelation but at intermediate and smaller spatial scales (Figure SM6). The forward selection procedure selected 4 MEMs: 20, 22, 33 and 43 (Table SM5), confirming the importance of variables or processes not considered at the fine regional/local spatial scale spectrum.
Partitioning the variation of the community composition
The bulk of the variance in the community data (57%, the first 20 dimensions of the PCO), partitioned by oceanographical variables (depth, nitrate, mean Chl a and SST range), sedimentary variables (sedimentary grain size gradient and LOI), and broad- and fine-scale non-measured variables showed that the total variability explained is small (22%) (Figure 5). Oceanographic variables and the sedimentary variables explain a small but significant part of that variability in species composition (12.0% and 12.5%, respectively; partial RDA: F=1.369, P=0.022; partial RDA: F=1.733, P=0.002, respectively, Table 2). However, broad-scale and fine-scale patterns alone (that were not measured or taken into consideration) are responsible for most of the explained variability (44.9% and 23.3%, respectively; partial RDA: F=1.683, P=0.001; partial RDA: F=1.717, P=0.002, respectively, Table 2). The shared variability of the geographic space-environment fractions related to broad-scale spatial patterns did not show evidence of spatially structured habitat filtering both with regards to oceanographic variables (MSR, P=0.612, MC test 999 permutations; Table 2) or to sedimentary variables (MSR, P=0.178, MC test 999 permutations; Table 2).
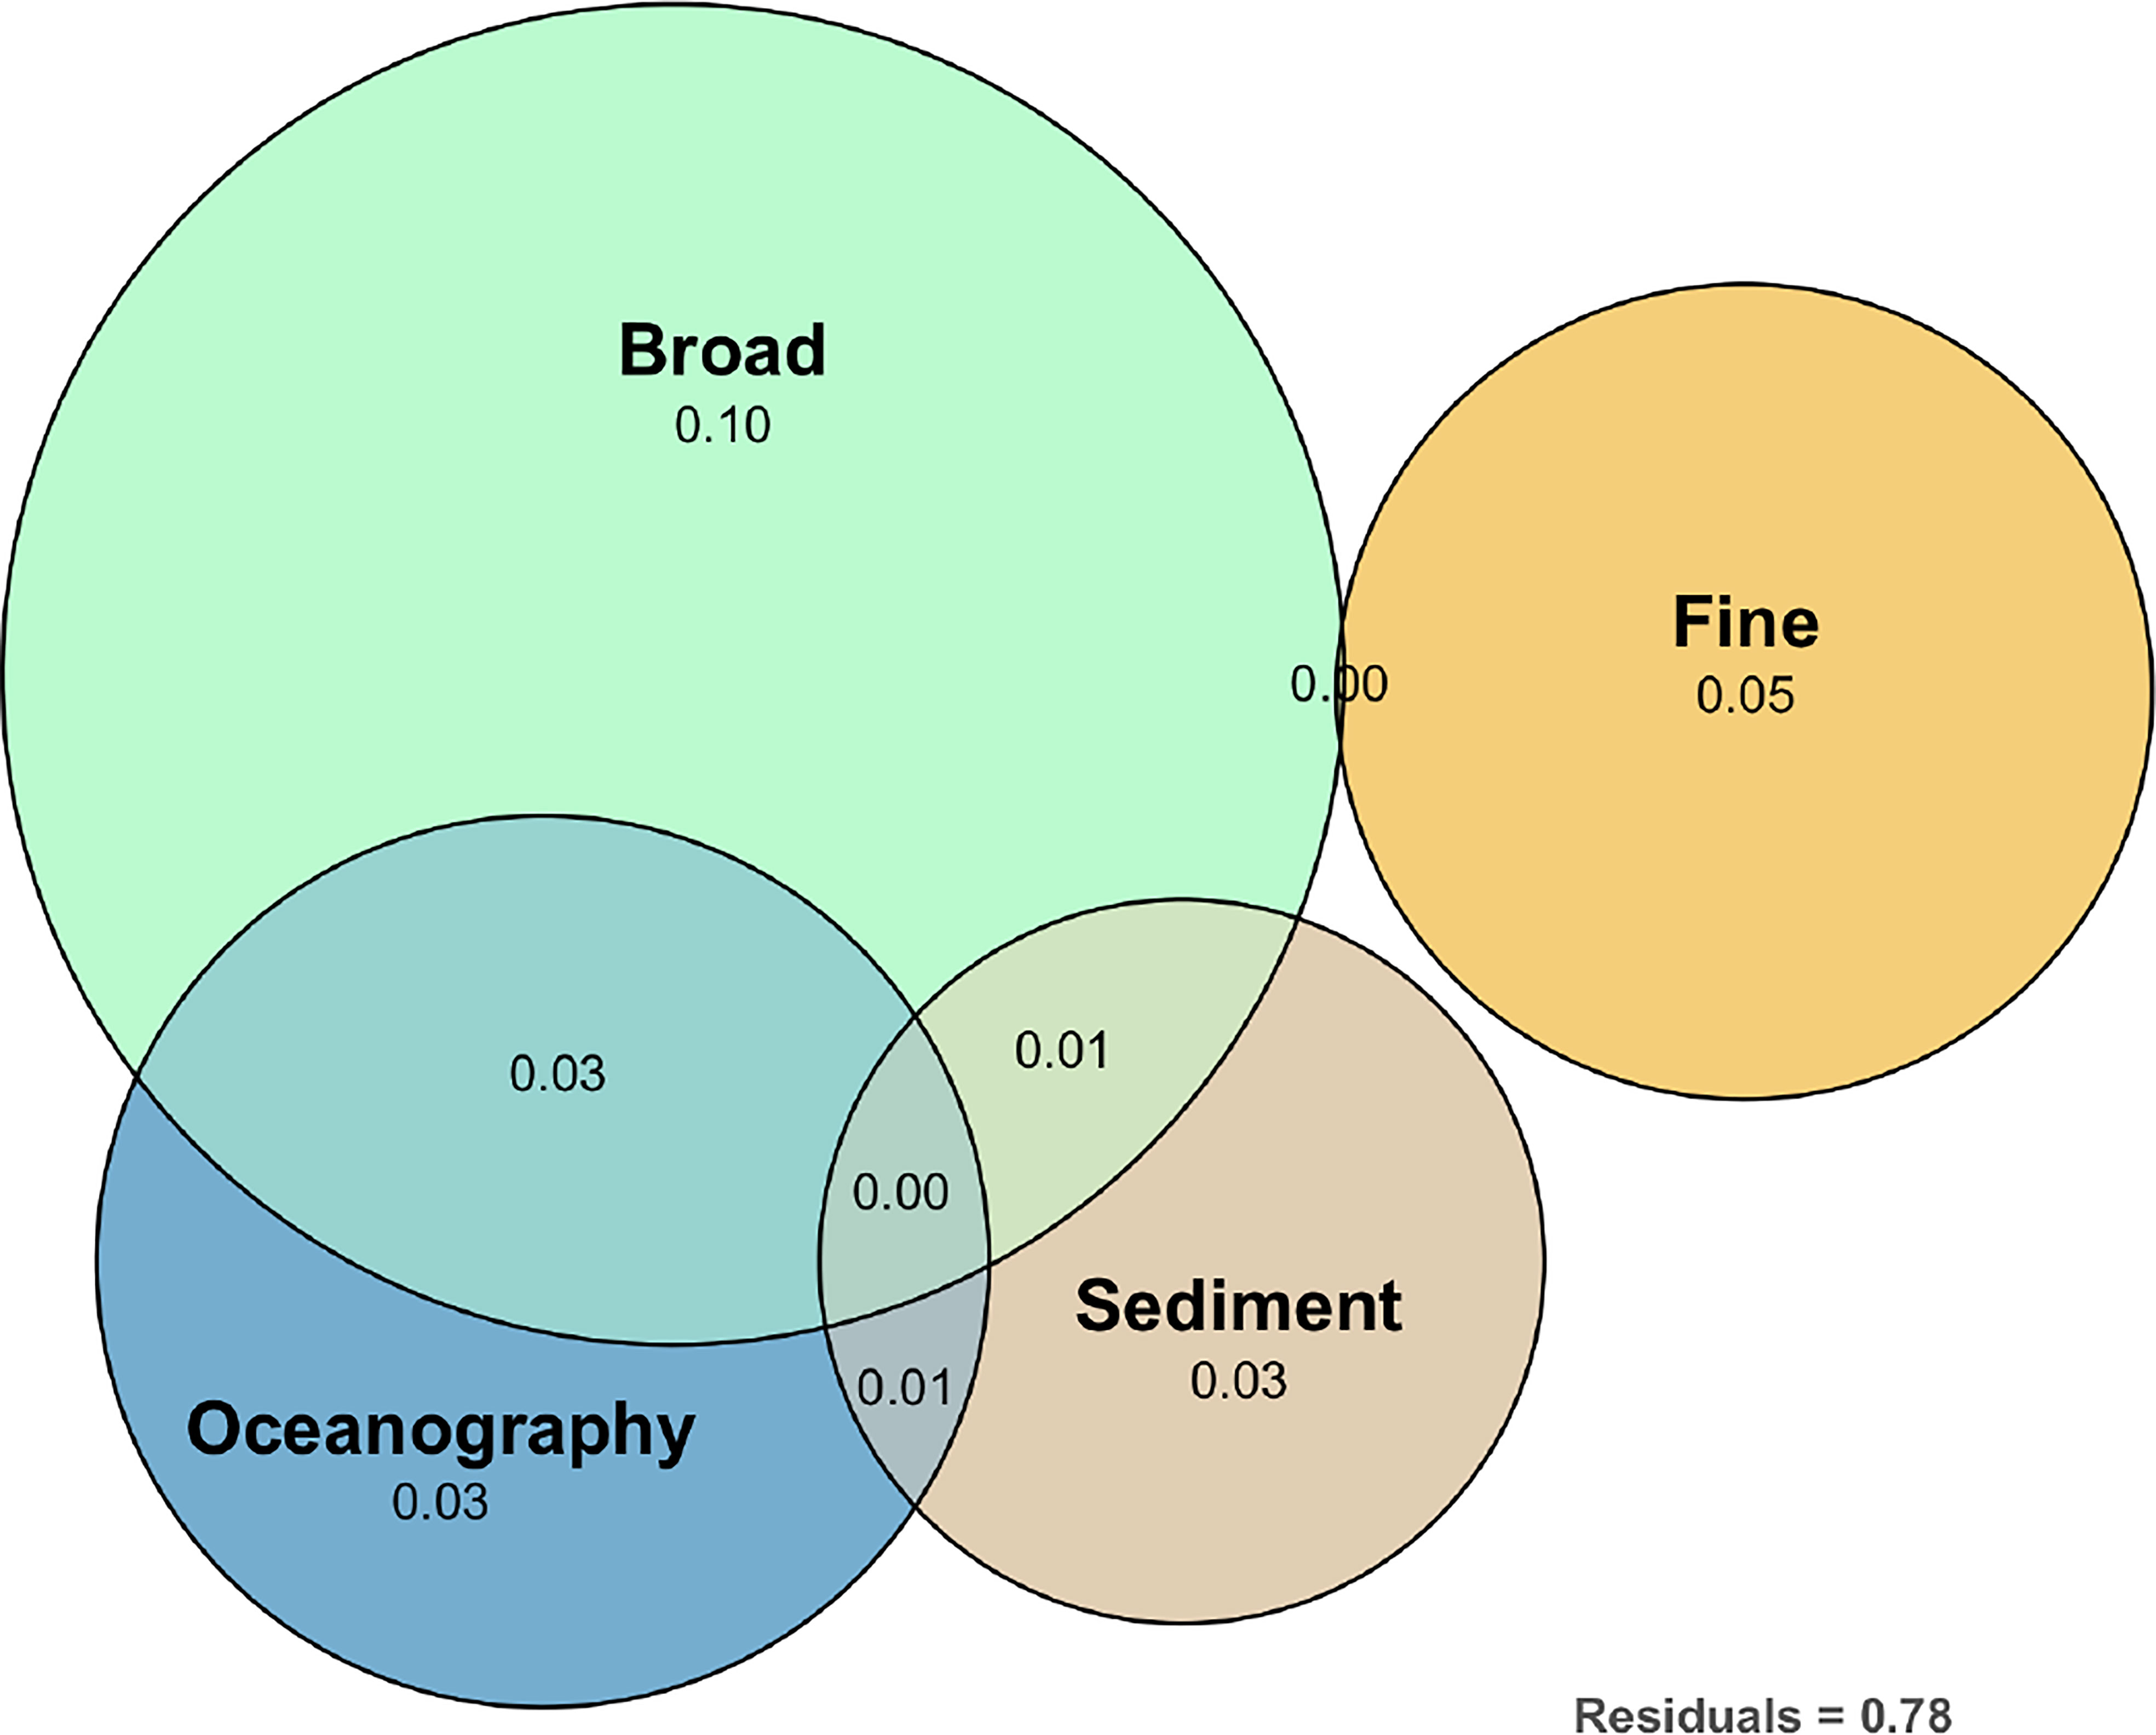
Figure 5 Euler diagram showing the results of the variation partitioning analysis on the composition of macrobenthic communities showing the relative contribution explained by the environmental components or by other broad- or fine-scale processes (Moran eigenvector maps, not measured) and the shared space-environment components. The R2Adj. is the adjusted explained variation (Peres-Neto et al., 2006) for sets of predictors in the variation partitioning analysis.
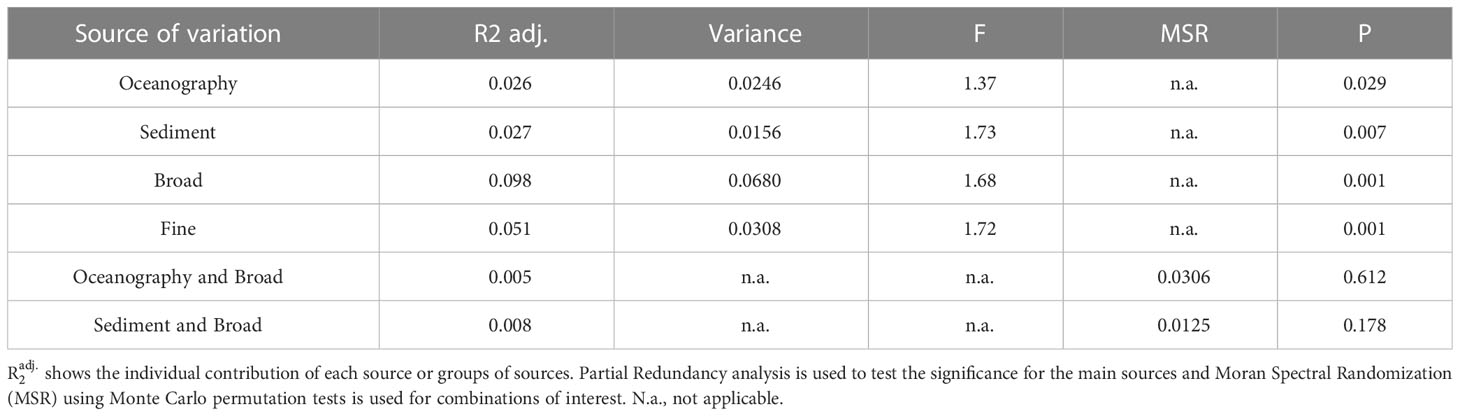
Table 2 Variation partition table for different sources of variability: oceanography, sedimentary properties (sediment) and broad- and fine-spatial scales.
Environmental and spatial effects on the partitioning of beta-diversity
Species turnover (J turnover) between samples is always high across all the spatial scales analyzed with median values increasing with distance (Figure 6). Jaccard nestedness is consistently low, with a small increase for samples separated by 20-100 km (Figure 6). and asymmetrically distributed towards lower values. Considering the clear dominance of turnover in beta-diversity patterns, we will focus on this component hereafter.
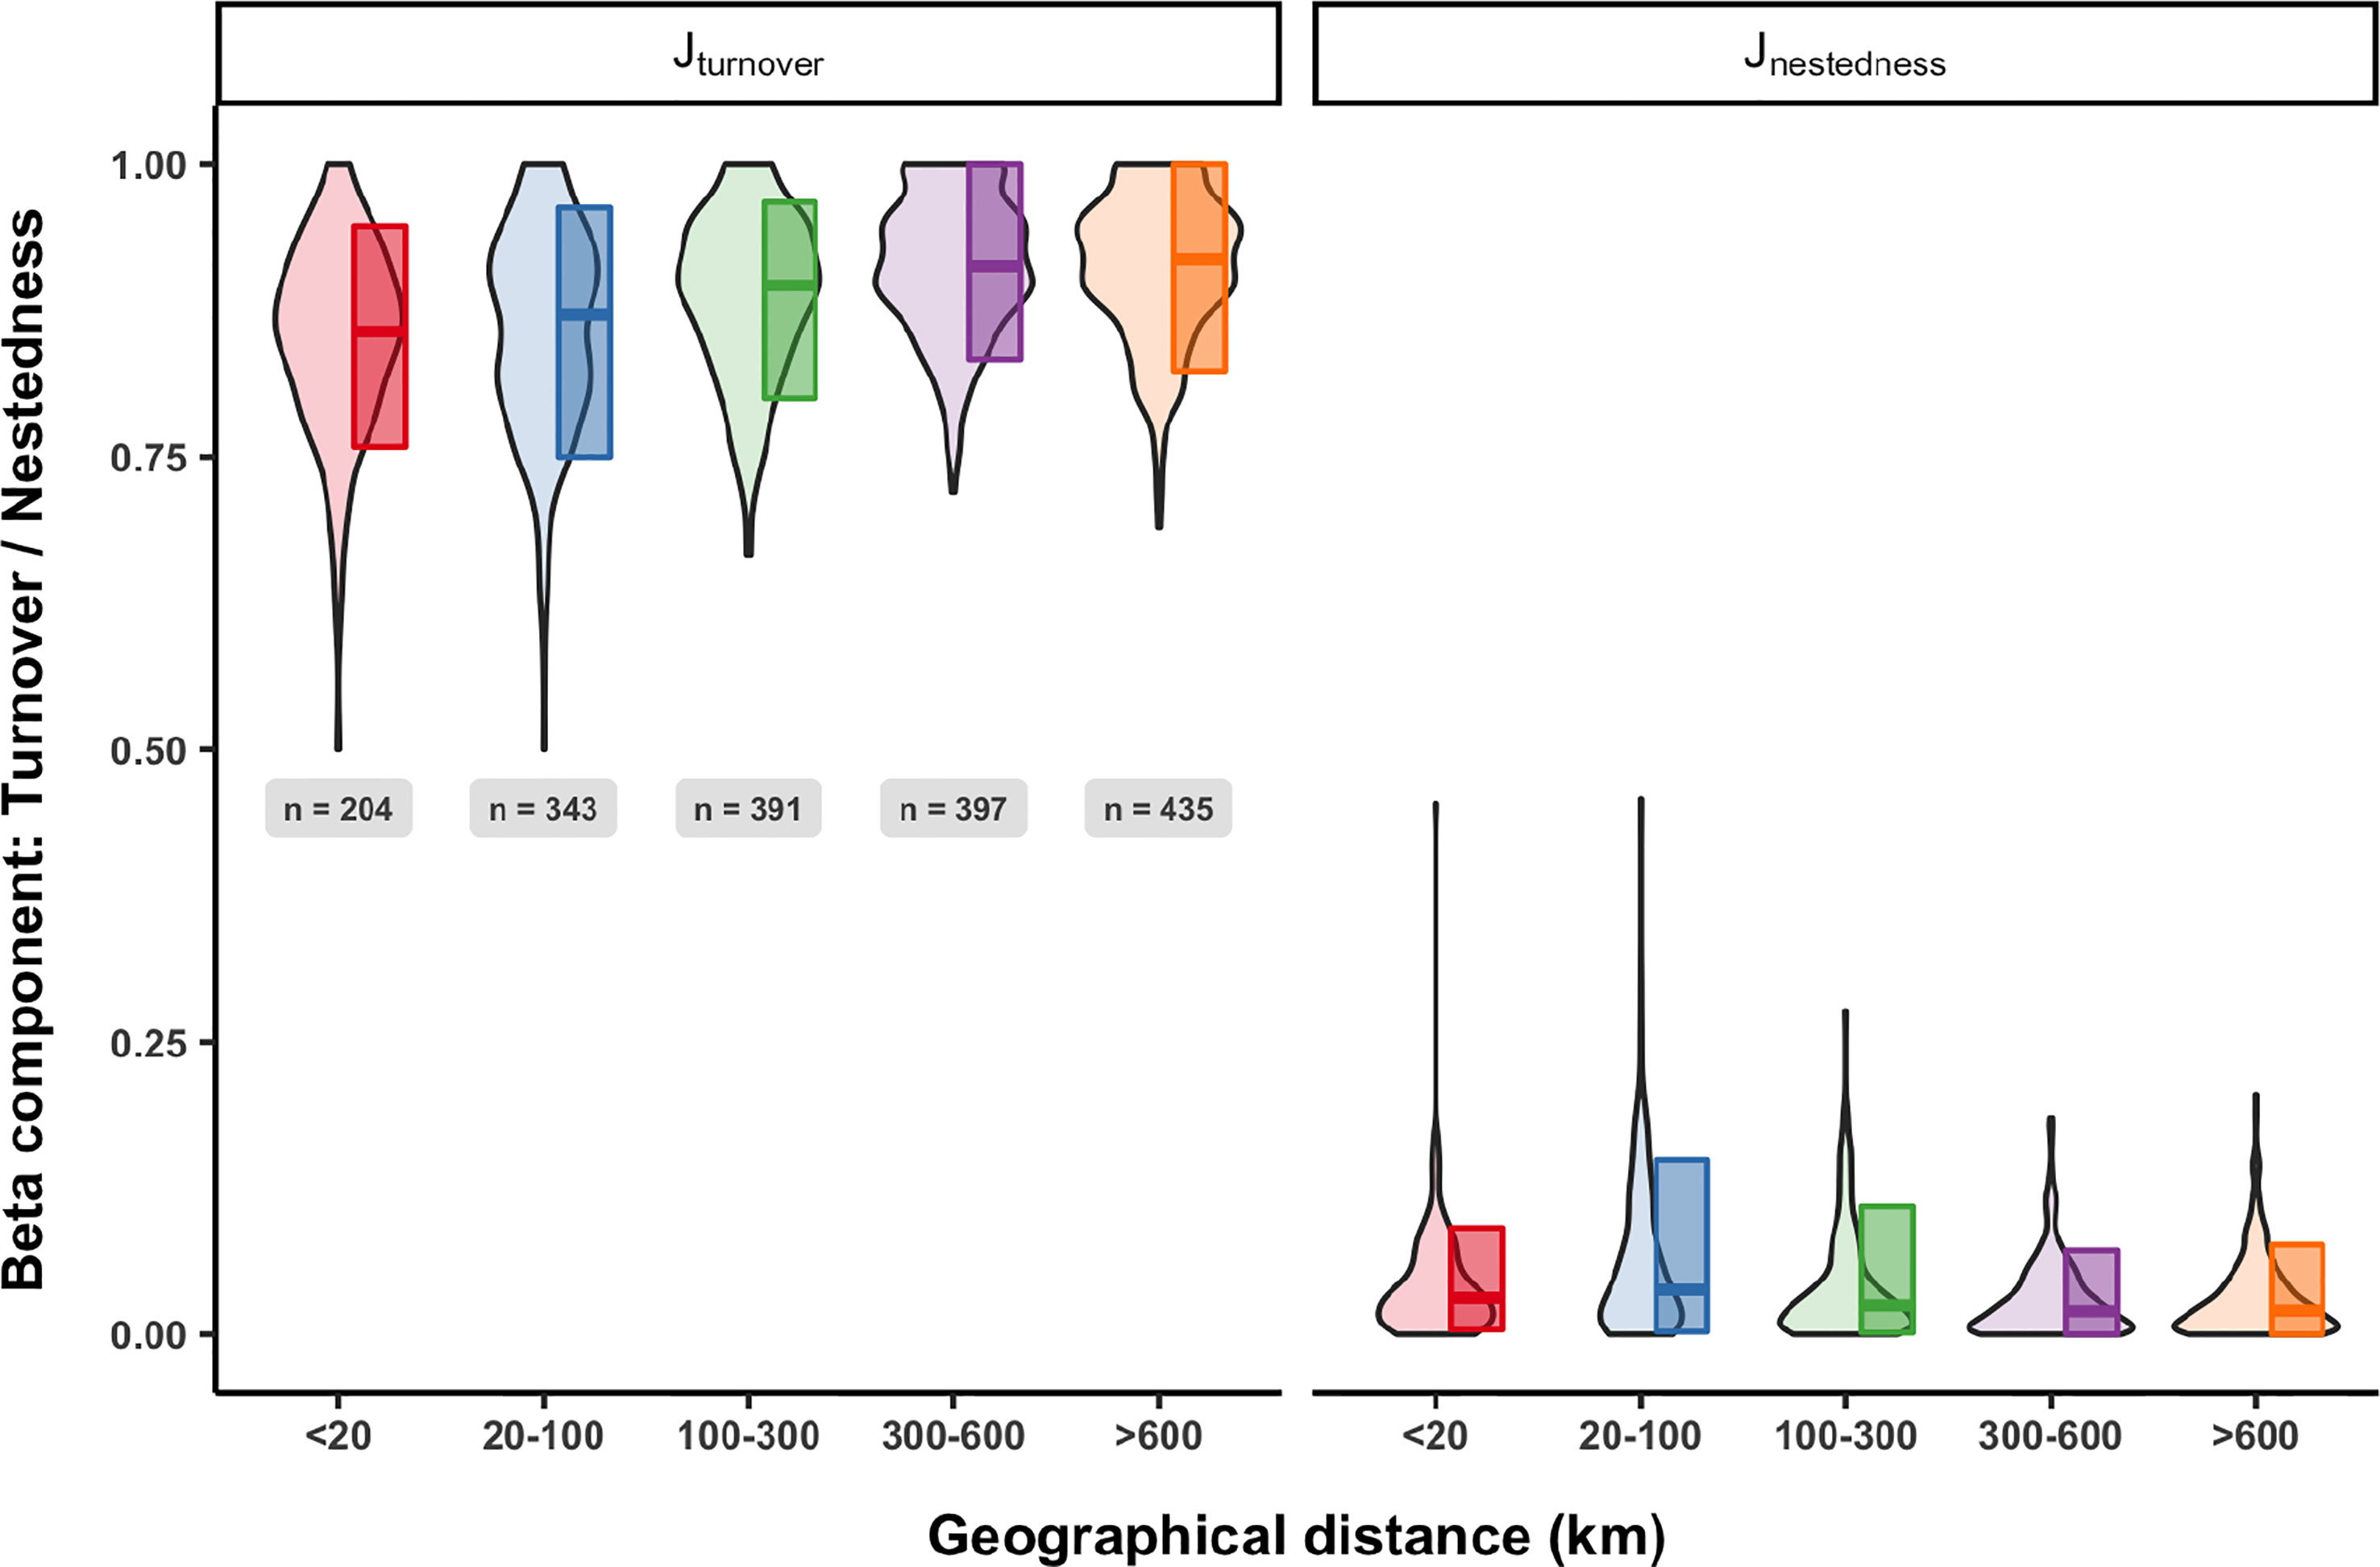
Figure 6 Variability in beta-diversity partitioning of turnover (Jturnover) and nestedness (Jnestedness) components across spatial scales (from <20km to >600km) based on the Jaccard presence-absence biological matrix. The violin plot provides information about the distribution of values and the boxes represent the quantile 10, median, and quantile 90.
The selected general additive model used to predict Jaccard similarity explains 31.4% of the deviance (R2 adj. = 0.3) in the data. Community similarity drops when the differences in sedimentary grain size gradient increase (Figure 7C Jaccard similarity; F = 14.448; P <0.001). The associated error is low except for the larger sedimentary grain size differences (lower number of comparisons; not shown in the figures). Distance between samples shows a non-linear effect (F = 1.408; P <0.001) with higher community similarity between samples geographically close (Figure 7A), decreasing with larger differences. However, the wide confidence band along the gradient suggests a large variation in community similarity across the distance gradient. Similarity slightly decreased with increased differences in LOI, but the associated error is large along most of the gradient, and therefore, caution is needed in interpreting the trend (Figure 7E). The response of community similarity to differences in Chl a (Figure 7G) also shows a non-linear pattern with very limited explanatory power due to the high associated error along the gradient, especially when Chl a differences are larger. At small spatial scales (small differences in the geographic distance), samples with similar sediment characteristics have higher similarity, whereas if presenting very different sediment characteristics, the similarity is lower (Figure SM7). On the contrary, when sediments from distanced sites present similar grain sizes, the effect on similarity predicted by the model is negligible (Figure SM7). There is some interaction between Chl a differences and distance between samples (Figure SM8), namely at the regional scale (100-400 Km) when differences in Chl a are low, similarity decreases, and at the local scale (0-20Km) where marked Chl a differences are observed they result in a marked negative effect on similarity.
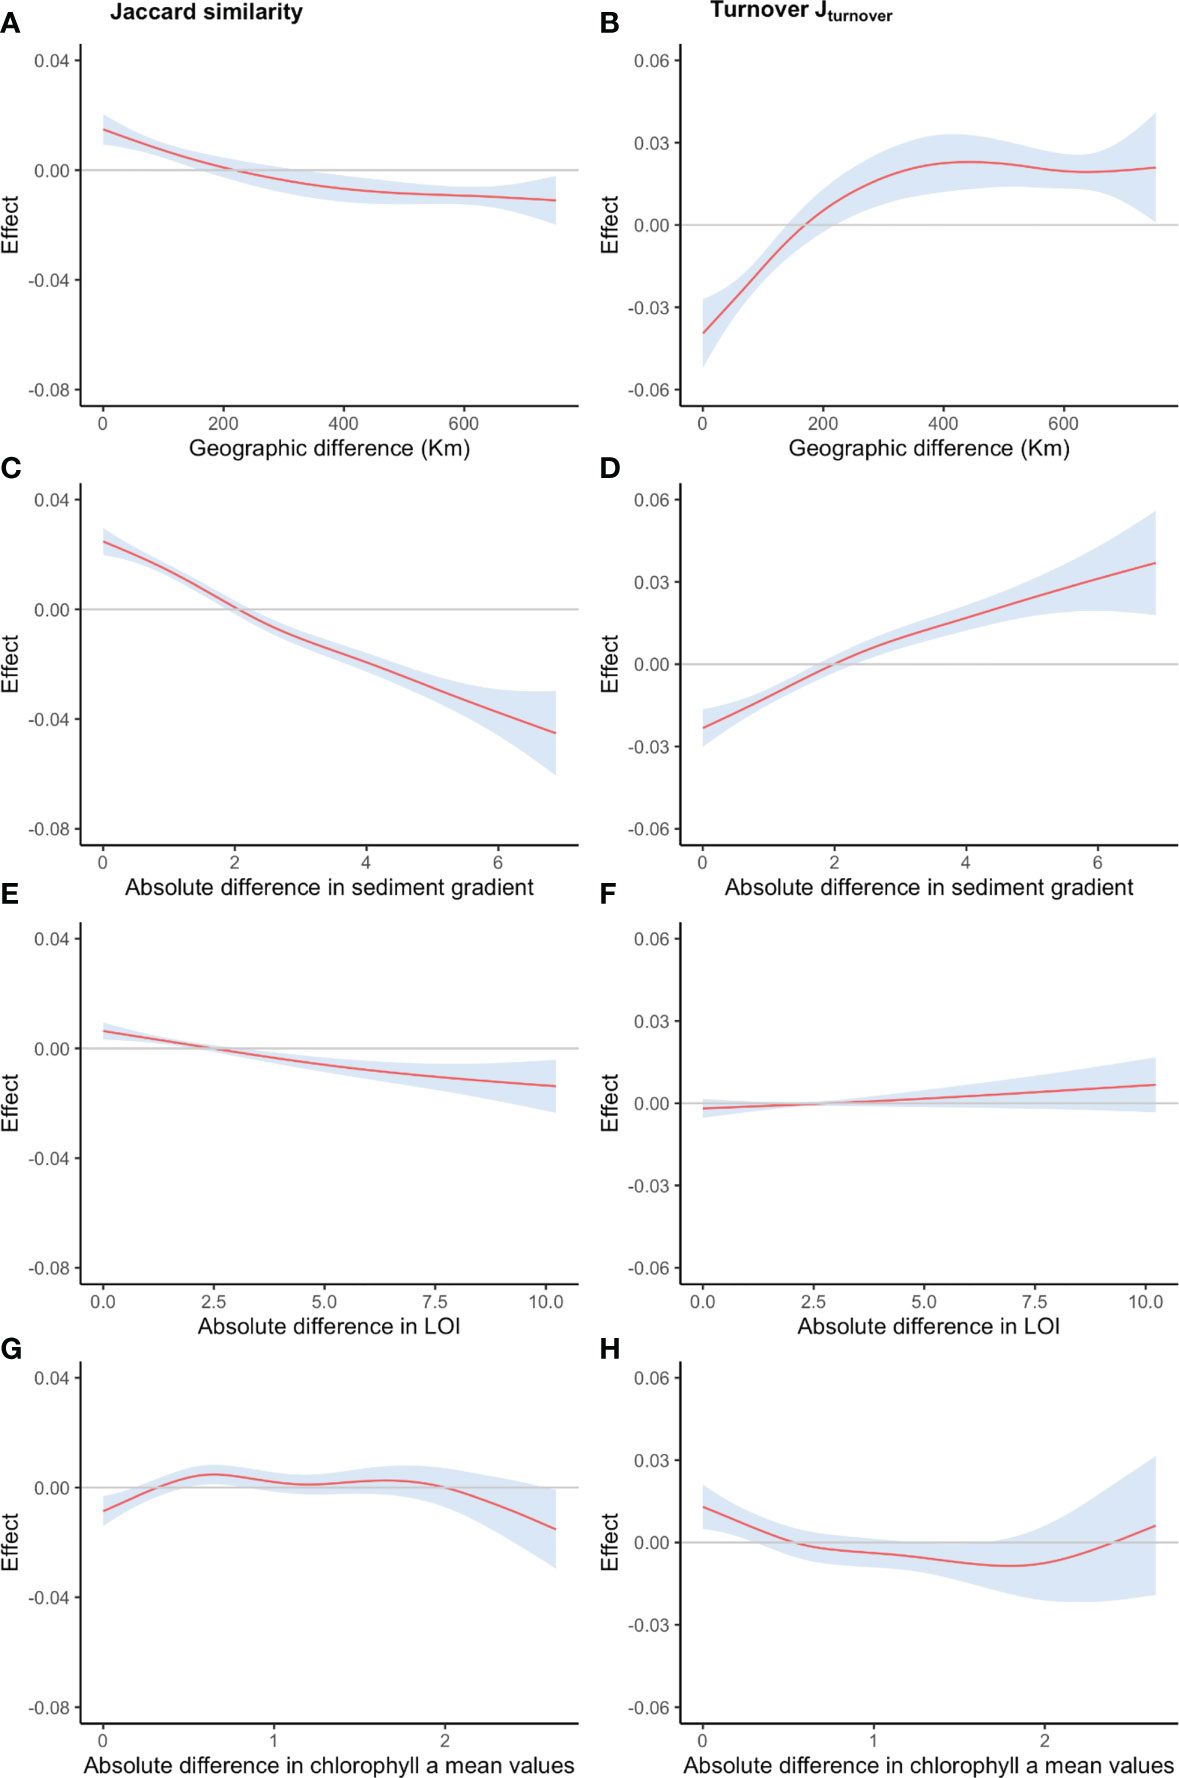
Figure 7 Changes in similarity (Jaccard) and species turnover (1-BetaJaccard) along gradients of differences in (A, B) geographic distance (km), (C, D) sedimentary grain size gradient, (E, F) LOI and (G, H) Chlorophyll a The smooth functions, modeled fitting a generalized additive model, are presented for each variable (solid lines; 95% confidence interval as colored area).
The same set of predictors was used to estimate species turnover (JTU), the prevalent beta-diversity component for the dataset (Figure 6). The model explains only a fraction of the deviance (20.9%; R2 adj. = 0.197). The model showed a clear increasing trend in turnover with increasing differences in the sedimentary grain size gradient (Figure 7D). Geographic distance has a non-linear effect on estimating turnover (Figure 7B), with an increasing trend in species replacement, from negative values for samples that are geographically close (i.e., turnover is lower than average) to a peak at approximately 400Km differences stabilizing thereafter (Figure 7B). However, the error associated with the smooth is high along most of the gradient, especially for distances higher than 200 Km. The sharp increase in turnover with distance at the regional scale seems to be exclusively due to distance as interaction with large differences in chlorophyll a have low effect on turnover (Figure SM10). The partial effects of the differences in LOI on turnover are not significant (F=0.198, p=0.0999; Figure 7F), whereas differences in Chl a show a non-linear pattern with low predictive power of turnover changes along the range (i.e, the no effect horizontal line, at zero, is never outside the confidence limits) (Figure 7H). The interaction effects of geographic distance and sedimentary grain size differences on Jaccard turnover (Figure SM9) are numerically very small (maximum decrease or increase of 2%). Turnover (species replacement) increases when comparing samples geographically close that differ in their sediment composition (~2%) (Figure SM9). Similarly, it also increases for samples with similar sediment composition from moderately separated sites (~1%; 200 km).
Discussion
Shallow soft-sediment macrobenthic communities in the Red Sea showed extremely high small-scale variability, highlighted by the percentage of rare species and high beta-diversity, with a clear dominance of turnover (species replacement) over nestedness. Our results, however, also suggest a strong influence of broad- over fine-scale variation in the species composition of soft-sediment macrobenthic communities in the Red Sea. The selected general additive model showed a clear response of the community composition similarity to changes in the sedimentary grain size gradient, with decreasing similarity with increasing grain size differences. The opposite pattern was observed for turnover, further suggesting that differences in species composition are mainly due to species replacement (turnover) and not to nestedness. Turnover can be more constrained by species’ niche requirements than by dispersal capability (Harrison et al., 1992), suggesting that distribution patterns are more related to deterministic rather than stochastic processes (Soininen et al., 2007b). The number of taxa seems to be positively influenced by fine and coarse sands, whereas the presence of silt/clay may constrain species colonization. Effects on community composition and species replacement, on the other hand, were not strongly related to Chl a or organic matter content in sediments, suggesting sediment composition as a major driver of Red Sea shallow water macrobenthic communities. Therefore, current findings suggest that conservation efforts should include a network of sites across different regions in order to protect most of the biodiversity. Areas dominated by both fine and coarse sand are of particular conservation interest. The role of both sedimentary gradients and geographic or oceanographic distance is discussed in turn.
Macrobenthic responses to environmental descriptors
Previous studies have highlighted the dependency of soft-sediment macrobenthos in sediment texture and sorting (Jayaraj et al., 2008; Carvalho et al., 2012; Ellis et al., 2017), also in what concerns the potential for recovery after disturbance (Carvalho et al., 2013). We observed a significant relationship between the number of observed taxa and different sediment particle sizes when analyzed separately. The number of taxa increased with the percentage of fine and coarse sand; conversely, silt/clay particles resulted in a significant decrease in species richness. When sediment particle composition was integrated based on a PCA analysis and used as a predictor of community change, generalized additive models (GAM) also highlighted a strong and significant response of Red Sea macrobenthos to the sedimentary grain size gradient. Community similarity decreased with increasing differences in the sedimentary grain size gradient, whereas the opposite trend was detected for species replacement (turnover). These results reinforce the role of turnover in shaping spatial distribution patterns and the relevance of sediment grain size as an environmental filter. Changes in the sedimentary composition may result from anthropogenic activities, like dredging or sea farming. Considering the ongoing coastal development in the Red Sea and the expansion of the blue economy (Cziesielski et al., 2021), managers should evaluate the potential impacts on local macrobenthic communities. The lack of baseline studies in the Red Sea may hamper assessing potential studies, as national monitoring programs are still non-existent. Unlike sedimentary composition, the influence of Chl a and LOI was negligible in explaining small to large patterns in spatial variability. The negligible effect of Chl a suggests that productivity – higher in the south - is not a major predictor of the changes in beta-diversity, which agrees with previous findings in the Red Sea (Ellis et al., 2017) and elsewhere (e.g., Levin et al., 2001; Worm et al., 2002). A previous study looking at small-scale variability patterns in the Red Sea also showed that changes in species richness were not related to organic matter (Alsaffar et al., 2019). These results suggest that mechanisms at the sediment level (e.g., species interactions, heterogeneity in food resources distribution) in association with dispersal capacity contribute more to the patterns observed in the region. Disentangling the specific contribution of the organic particulate material to the benthos from other mechanisms potentially regulating biodiversity is, however, difficult and indicates that multiple mechanisms can contribute to diversity patterns. The settlement of organic particulate material can contribute to creating heterogeneity in the seafloor, promoting biodiversity (Cunha et al., 2011). Among the main sources of organic material to nearshore coastal communities are terrestrial runoff and riverine flow (Frigstad et al., 2020). Rivers do not exist across the Red Sea basin, and rain is very scarce, but runoff is frequent in the south (Ellis et al., 2017). Dust, however, has been indicated as a source of organic matter (Rasul et al., 2015) but eddies have also been reported as fundamental events enhancing primary production in the Red Sea (Kheireddine et al., 2017; Kürten et al., 2019). Both dust and eddies may dilute the effect of known point sources of human-driven anthropogenic organic enrichment by circulating nutrients over medium to large spatial scales. Further research is necessary to identify levels above which changes will occur, especially relevant if macrobenthic communities are used as ecological indicators in future monitoring efforts.
Changes in community similarity and turnover over geographic distance
Community similarity and beta-diversity (species turnover) were mainly influenced by geographic distance. Community composition is expected to change with geographical distance as a result of multiple factors. Firstly, spatial patterns will be affected by the dispersal limitation of organisms as a function of their auto-ecology, regardless of the environmental differences (Hubbell, 2001). Faster declines in similarity with distance are expected for organisms with lower dispersal capacity (Soininen et al., 2007a). Here we observed a much stronger effect of geographic distance in promoting turnover (species replacement), especially up to 400 km, than the anticipated decrease in community similarity. The results suggest that the same species may colonize areas across the geographic range tested, but a large percentage of the species present in one sample differ from samples either geographically close or far apart. Therefore, it seems that communities are not strongly affected by dispersal, and, unlike what was observed for Red Sea reef cryptobenthic communities (Carvalho et al., 2019a), clear latitudinal gradients were not apparent. It also reinforces the role of sedimentary grain size composition observed, suggesting species-sorting or environmental filtering and the existence of niche-based processes (Leibold et al., 2004). Dispersal can promote the possibility of species finding suitable environmental conditions at the regional scale (Cottenie and De Meester, 2004; Leibold et al., 2004), fostering species replacement. As observed before for reef communities, it is difficult to disentangle the relative contribution of both dispersal limitation and environmental filtering (Pearman et al., 2021). This might be particularly challenging in regions like the Red Sea basin, where major oceanographic events, such as mesoscale eddies, can facilitate the transport of organisms to places they otherwise could not reach, promoting the homogenization of the communities. Consequently, less pronounced effects on the expected decrease in community similarity over the geographic gradient may occur, as observed in the present study.
One of the striking results observed was the high small-scale variability across the geographical gradients. The spatial configuration and the nature of the landscape can also impose barriers to connectivity (Soininen et al., 2007a), and the existence of extensive coral reef clusters in the Red Sea can contribute to the observed patterns at the local scale. In heterogeneous landscapes, community similarity is expected to decrease, which can result in the predominance of species replacement (turnover) over the nestedness component of beta-diversity. Indeed, soft-sediment macrobenthic communities in tropical seascapes will likely have higher beta-diversity because habitats are often embedded within larger complex landscapes, where mangroves, seagrasses and coral reefs are spread-out, and their relative location, characteristics and size may differentially affect the environmental conditions in nearby soft-bottoms (Navarro-Barranco and Guerra-García, 2015). Previous studies showed that community composition will be influenced by nearby habitats and the associated beta-diversity will likely increase with the increase in habitat types (i.e., habitat heterogeneity) (Nekola and White, 1999; Valentine, 2009). The existence, or not, of reef systems nearby can influence the local hydrodynamics, which most likely affect the colonization and succession patterns of macrobenthic communities (Cleary et al., 2005). Particularly in the central and southern Red Sea, there is a high habitat heterogeneity that can contribute to the high dissimilarity observed at local and regional scales. Dedicated research is needed to better understand the influence of benthic habitats shaping the biodiversity patterns not only of soft-sediments but also those associated with coral reefs. Information is relevant to the design of conservation plans, as the conservation of terrestrial vegetation, for example, can improve the coral reef condition (Klein et al., 2014). Mangroves in the Red Sea are the most important vegetated habitats (Carvalho et al., 2019b). Mangrove stands typically form narrow forests along the mainland and offshore islands (Mohamed, 1984) with the largest stands occurring in the southern Red Sea, where Avicennia marina and Rhizophora mucronata co-dominate (Bruckner et al., 2011). Similarly, whilst seagrasses have the highest diversity in the central Red Sea (Jones et al., 1987), the greatest extent and abundance also occur in the southern Red Sea. Organic matter exchanges from vegetated habitats have been shown to affect the functioning of nearby habitats with implications for energy transfer and nutrient sources (Signa et al., 2017). Similarly, connectivity between seascapes can influence cross-ecosystem fluxes (waves, sediments, nutrients) (Gillis et al., 2017). The spatial connectivity between tropical seascapes (mangrove forests, seagrass beds, coral reefs) is, therefore, likely to influence sediment benthic biodiversity requiring further research for the Red Sea (Alsaffar et al., 2020b).
Rarity and low dominance characterize Red Sea shallow soft-sediments
Shallow water soft-sediment benthic communities in the Red Sea are characterized by a high percentage of rare species and high beta-diversity (species replacement) even within short geographic distances. This pattern is consistent with what has been reported for temperate (Ellingsen and Gray, 2002), polar (Thrush et al., 2010), and tropical and sub-tropical areas (Shin and Ellingsen, 2004; Alsaffar et al., 2019). However, the percentage of rare species (44% of species restricted to one sample) is higher than commonly reported for other continental shelves (Ellingsen and Gray, 2002; Shin and Ellingsen, 2004). In low-density populations like those observed in the present study, the number of immigrants is expected to surpass the number of births occurring at a certain location (Volkov et al., 2003). Relatively small species distribution ranges and the dominance of species having one or a few individuals per sampling unit, i.e., high patchiness, are characteristic of benthic assemblages (Gray, 2002), both in temperate and tropical regions (Morrisey et al., 1992). How small populations in a community can disperse for the latter to maintain high species richness over time is still to be fully understood (Gray, 2002). It has also been reported that soft-sediment shallow macrobenthic communities are numerically dominated by a few taxa (Ellingsen and Gray, 2002). Even though shallow soft-sediment macrobenthic communities along the Red Sea continental shelf generally conform to the pattern of rarity, high dominance levels were not observed. A particular characteristic of shallow soft-sediment biotopes in the Red Sea is the low density of organisms. This feature has been attributed to low nutrient availability in deep sea ecosystems (Basso et al., 2004; Danovaro et al., 2010) and is supported by the overall oligotrophic nature of the Red Sea basin (Manasrah et al., 2019). In the shallow water benthic biotopes along the Saudi Arabian Red Sea, diversity patterns seem to better conform to those described for the deep sea, with ratios between the number of species and densities being high, indicating a fast accumulation of species per number of individuals (Thrush et al., 2010). The low levels of productivity have been identified as a driving factor for the high diversity observed, probably due to attenuating rates of interactions (Van Valen, 1976), which seems to conform to the mainly oligotrophic nature of the Red Sea. Yet, some deviations were detected in the southern Red Sea, known as mesotrophic, and where the densities of some species (bivalves and opportunistic polychaetes) responded to the localized nutrient enrichment (Ellis et al., 2017).
Conclusions
The present study shows a prevalent role of sedimentary characteristics, particularly those related to grain size governing the distribution patterns of soft-sediment macrobenthic communities in the Red Sea. Connectivity, on the other hand, seems to have a secondary role, as locals within the same region showed high beta-diversity (low ecological connectivity), as reported before for other regions (Thrush et al., 2010). In the context of marine metacommunity organization, it seems that they are regulated by the combination of both species sorting and oceanographic mass events, which ascendency will depend on autecology traits of individual organisms (e.g., life-history, dispersal) of the communities (Grantham et al., 2003; Heino et al., 2015), but also existing landscape barriers and habitat heterogeneity. One caveat associated with our and other studies investigating small to large spatial scale variability patterns is the lack of detailed information on both environmental (abiotic variables) and biotic characteristics (e.g., predation, the dispersal ability of species) across the spatial gradient. As in many other studies, we did not incorporate the temporal component of dynamics of biological communities that may also be a relevant driver of biodiversity patterns (Soininen et al., 2007b). Nevertheless, investigating patterns of variability across space and time over a sea basin is very challenging. Considering that turnover (species replacement) is the major component of beta-diversity patterns in the Red Sea not only for soft-sediments (this study; Alsaffar et al., 2019) but for reef-associated fauna (Pearman et al., 2018), further studies focused on delimited regions should be conducted to understand better the combined influence of both space and time in the dynamics of benthic communities. It is important to collect detailed information at the appropriate scales of variability. Particularly in regions like the Red Sea, measures of habitat heterogeneity and distance to reefs or other major ecosystems (mangroves, seagrasses) should also be considered to better understand the drivers of community change.
Our findings have relevant implications in terms of conservation and management, such as the design of marine protected areas. Indeed, the prevalence of turnover highlights high complementarity between sites across the whole geographic gradient. Therefore, conservation efforts should focus on creating a network of marine reserves across the seascape at both local and regional scales to preserve biodiversity through sustaining genetic connectivity patterns. The positive response of species richness to fine and coarse sand, in opposition to the decreasing trend observed for silt/clay, also suggests that areas of high sedimentary heterogeneity, particularly if not muddy, are of important conservation value. Nevertheless, changes in the sedimentary composition due to anthropogenic activities may be of concern, as they may cause shifts in macrobenthic distribution patterns. Special attention should be paid when activities may increase the percentage of silt/clay, as expected because of sea farming, as this can have a detrimental effect on species richness.
Data availability statement
The raw data supporting the conclusions of this article will be made available by the authors, without undue reservation.
Author contributions
SC led the conception and design of the study. ZA and JC organized the database. SC, ZA, JE, and HA were responsible for the field and lab work. JC performed the statistical analysis. SC wrote the first draft of the manuscript. All authors contributed to the article and approved the submitted version.
Funding
Research conducted under the research program sponsored by Saudi Aramco under the framework of Saudi Aramco/KAUST Center for Marine Environmental Observations (SAKMEO).
Acknowledgments
This research has been developed under the scope of the Saudi Aramco/KAUST Center for Marine Environmental Observations (SAKMEO). This paper has been reviewed and approved by Saudi Aramco Corporate Communications Department (Tracking number 22-Q4-0322). We wish to thank the crew of the R.V. Thuwal for their assistance in collecting the field samples and many colleagues from the Red Sea Research Center for assistance in collecting and processing samples. We are especially grateful to Richard Payumo, Saskia Kuerten, and Miguel Viegas for sorting the samples. We also thank Ute Langer for creating the map. We would like to thank the editor and three reviewers for providing constructive feedback that improved the manuscript.
Conflict of interest
The authors declare that the research was conducted in the absence of any commercial or financial relationships that could be construed as a potential conflict of interest.
Publisher’s note
All claims expressed in this article are solely those of the authors and do not necessarily represent those of their affiliated organizations, or those of the publisher, the editors and the reviewers. Any product that may be evaluated in this article, or claim that may be made by its manufacturer, is not guaranteed or endorsed by the publisher.
Supplementary material
The Supplementary Material for this article can be found online at: https://www.frontiersin.org/articles/10.3389/fmars.2023.1072342/full#supplementary-material
References
Abele L. G., Walters K. (1979). The stability-time hypothesis: reevaluation of the data. Am. Nat. 114, 559–568. doi: 10.1086/283502
Al-Aidaroos A. M., Karati K. K., El-Sherbiny M. M., Devassy R. P., Kürten B. (2017). Latitudinal environmental gradients and diel variability influence abundance and community structure of Chaetognatha in Red Sea coral reefs. Systematics Biodiversity 15, 35–48. doi: 10.1080/14772000.2016.1211200
Al-Farraj S., El-Gendy A., Al Kahtani S., El-Hedeny M. (2012). The impact of sewage pollution on polychaetes of Al khumrah, south of Jeddah, Saudi Arabia. Res. J. Environ. Sci. 6, 77. doi: 10.3923/rjes.2012.77.87
Alsaffar Z., Cúrdia J., Borja A., Irigoien X., Carvalho S. (2019). Consistent variability in beta-diversity patterns contrasts with changes in alpha-diversity along an onshore to offshore environmental gradient: the case of Red Sea soft-bottom macrobenthos. Mar. Biodiversity 49, 247–262. doi: 10.1007/s12526-017-0791-3
Alsaffar Z., Cúrdia J., Irigoien X., Carvalho S. (2020b). Composition, uniqueness and connectivity across tropical coastal lagoon habitats in the Red Sea. BMC Ecol. 20, 61. doi: 10.1186/s12898-020-00329-z
Alsaffar Z., Pearman J. K., Curdia J., Ellis J., Calleja M. L., Ruiz-Compean P., et al. (2020a). The role of seagrass vegetation and local environmental conditions in shaping benthic bacterial and macroinvertebrate communities in a tropical coastal lagoon. Sci. Rep. 10, 1–17. doi: 10.1038/s41598-020-70318-1
Angeler D. G. (2013). Revealing a conservation challenge through partitioned long-term beta diversity: increasing turnover and decreasing nestedness of boreal lake metacommunities. Diversity Distributions 19, 772–781. doi: 10.1111/ddi.12029
Aylagas E., Atalah J., Sánchez-Jerez P., Pearman J. K., Casado N., Asensi J., et al. (2021). A step towards the validation of bacteria biotic indices using DNA metabarcoding for benthic monitoring. Mol. Ecol. Resour. 21, 1889–1903. doi: 10.1111/1755-0998.13395
Basaham A. S., Rifaat A. E., El-Mamoney M. H., El-Sayed M. A. (2009). Re-evaluation of the impact of sewage disposal on coastal sediments of the southern corniche, Jeddah, Saudi Arabia. J. King Abdulaziz Univ. Mar. Sci. 20, 109–126. doi: 10.4197/Mar.20-1.8
Baselga A. (2010). Partitioning the turnover and nestedness components of beta diversity. Global Ecol. Biogeogr. 19, 134–143. doi: 10.1111/j.1466-8238.2009.00490.x
Baselga A., Orme D., Villeger S., De Bortoli J., Leprieur F., Logez M. (2021) Betapart: partitioning beta diversity into turnover and nestedness components. Available at: https://CRAN.R-project.org/package=betapart.
Basso D., Thomson J., Corselli C. (2004). Indications of low macrobenthic activity in the deep sediments of the Eastern Mediterranean Sea. Scimar 68, 53–62. doi: 10.3989/scimar.2004.68s353
Bauman D., Drouet T., Dray S., Vleminckx J. (2018). Disentangling good from bad practices in the selection of spatial or phylogenetic eigenvectors. Ecography 41, 1638–1649. doi: 10.1111/ecog.03380
Bauman D., Vleminckx J., Hardy O. J., Drouet T. (2019). Testing and interpreting the shared space-environment fraction in variation partitioning analyses of ecological data. Oikos 128, 274–285. doi: 10.1111/oik.05496
Belal A. A. M., El-Sawy M. A., Dar M. A. (2016). The effect of water quality on the distribution of macro-benthic fauna in Western lagoon and timsah lake, Egypt. I. Egyptian J. Aquat. Res. 42, 437–448. doi: 10.1016/j.ejar.2016.12.003
Berumen M. L., Hoey A. S., Bass W. H., Bouwmeester J., Catania D., Cochran J. E. M., et al. (2013). The status of coral reef ecology research in the Red Sea. Coral Reefs 32, 737–748. doi: 10.1007/s00338-013-1055-8
Blanchet F. G., Legendre P., Borcard D. (2008). Forward selection of explanatory variables. Ecology 89, 2623–2632. doi: 10.1890/07-0986.1
Bruckner A. W., Riegl B., Purkis S., Williams A., Renaud P. (2011). Khaled bin sultan living oceans foundation atlas of Saudi Arabian red Sea marine habitats (Pheonix: Panoramic Press).
Brustolin M. C., Gladstone-Gallagher R. V., Kraan C., Hewitt J., Thrush S. F. (2021). Coupled effects of environment, space and ecological engineering on seafloor beta-diversity. Ecogeography 44, 966–974. doi: 10.1111/ecog.05440
Callier M. D., Lefebvre S., Dunagan M. K., Bataille M. P., Coughlan J., Crowe T. P. (2013). Shift in benthic assemblages and organisms’ diet at salmon farms: community structure and stable isotope analyses. Mar. Ecol. Prog. Ser. 483, 153–167. doi: 10.3354/meps10251
Carvalho S., Aylagas E., Villalobos R., Kattan Y., Berumen M., Pearman J. K. (2019a). Beyond the visual: introducing the hidden reef cryptobiome. Proc. R. Soc. B 286, 20182697. doi: 10.1098/rspb.2018.2697
Carvalho S., Constantino R., Cerqueira M., Pereira F., Subida M. D., Drake P., et al. (2013). Short-term impact of bait digging on intertidal macrobenthic assemblages of two south Iberian Atlantic systems. Estuarine Coast. Shelf Sci. 132, 65–76. doi: 10.1016/j.ecss.2011.06.017
Carvalho S., Cunha M. R., Pereira F., Pousao-Ferreira P., Santos M. N., Gaspar M. B. (2012). The effect of depth and sediment type on the spatial distribution of shallow soft-bottom amphipods along the southern Portuguese coast. Helgoland Mar. Res. 66, 489–501. doi: 10.1007/s10152-011-0285-9
Carvalho S., Gaspar M. B., Moura A., Vale C., Antunes P., Gil O., et al. (2006). The use of the marine biotic index AMBI in the assessment of the ecological status of the Óbidos lagoon (Portugal). Mar. pollut. Bull. 52, 1414–1424. doi: 10.1016/j.marpolbul.2006.04.004
Carvalho S., Kürten B., Krokos G., Hoteit I., Ellis J. (2019b). “The red Sea,” in World seas: an environmental evaluation, 2nd edition, vol. Volume II . Ed. Sheppard C. (London: Academic Press), 49–74.
Chalastani V. I., Manetos P., Al-Suwailem A. M., Hale J. A., Vijayan A. P., Pagano J., et al. (2020). Reconciling tourism development and conservation outcomes through marine spatial planning for a Saudi giga-project in the Red Sea (The red Sea project, vision 2030). Front. Mar. Sci. 7. doi: 10.3389/fmars.2020.00168
Chase J. M. (2003). Community assembly: when should history matter? Oecologia 136, 489–498. doi: 10.1007/s00442-003-1311-7
Cleary D. F., Becking L. E., de Voogd N. J., Renema W., de Beer M., van Soest R. W., et al. (2005). Variation in the diversity and composition of benthic taxa as a function of distance offshore, depth and exposure in the spermonde archipelago, Indonesia. Estuarine Coast. Shelf Sci. 65, 557–570. doi: 10.1016/j.ecss.2005.06.025
Cottenie K., De Meester L. (2004). Metacommunity structure: synergy of biotic interactions as selective agents and dispersal as fuel. Ecology 85, 114–119. doi: 10.1890/03-3004
Crist T. O., Veech J. A., Gering J. C., Summerville K. S. (2003). Partitioning species diversity across landscapes and regions: a hierarchical analysis of α, β, and γ diversity. Am. Nat. 162, 734–743. doi: 10.1086/378901
Cunha M. R., Paterson G. L. J., Amaro T., Blackbird S., de Stigter H. C., Ferreira C., et al. (2011). Biodiversity of macrofaunal assemblages from three Portuguese submarine canyons (NE Atlantic). Deep Sea Res. Part II: Topical Stud. Oceanogr. 58, 2433–2447. doi: 10.1016/j.dsr2.2011.04.007
Cziesielski M. J., Duarte C. M., Aalismail N., Al-Hafedh Y., Anton A., Baalkhuyur F.,, et al. (2021). Investing in blue natural capital to secure a future for the Red Sea ecosystems. Front. Mar. Sci. 7. doi: 10.3389/fmars.2020.603722
Danovaro R., Company J. B., Corinaldesi C., D’Onghia G., Galil B., Gambi C., et al. (2010). Deep-Sea biodiversity in the Mediterranean Sea: the known, the unknown, and the unknowable. PloS One 5, e11832. doi: 10.1371/journal.pone.0011832
Dauvin J. C., Bakalem A., Baffreau A., Delecrin C., Bellan G., Lardicci C., et al. (2017). The well sorted fine sand community from the western Mediterranean Sea: a resistant and resilient marine habitat under diverse human pressures. Environ. pollut. 224, 336–351. doi: 10.1016/j.envpol.2017.02.013
DeFelice R. C., Parrish J. D. (2001). Physical processes dominate in shaping invertebrate assemblages in reef-associated sediments of an exposed Hawaiian coast. Mar. Ecol. Prog. Ser. 215, 121–131. doi: 10.3354/meps215121
De Goeij J. M., Van Oevelen D., Vermeij M. J., Osinga R., Middelburg J. J., de Goeij A. F., et al. (2013). Surviving in a marine desert: the sponge loop retains resources within coral reefs. Science 342, 108–110. doi: 10.1126/science.1241981
DeVantier L., Turak E., Al-Shaikh K., De'ath G. (2000). Coral communities of the central-northern Saudi Arabian Red Sea. Fauna Arabia 18, 23–66.
DiBattista J. D., Roberts M. B., Bouwmeester J., Bowen B. W., Coker D. J., Lozano-Cortés D. F., et al. (2016). A review of contemporary patterns of endemism for shallow water reef fauna in the Red Sea. J. Biogeogr. 4, 423–439. doi: 10.1111/jbi.12649
Dray S. (2011). A new perspective about Moran's coefficient: spatial autocorrelation as a linear regression problem. Geographical Anal. 43, 127–141. doi: 10.1111/j.1538-4632.2011.00811.x
Dray S., Bauman D., Blanchet G., Borcard D., Clappe S., Guenard G., et al. (2021) Adespatial: multivariate multiscale spatial analysis. Available at: https://CRAN.R-project.org/package=adespatial.
Dray S., Pélissier R., Couteron P., Fortin M.-J., Legendre P., Peres-Neto P. R., et al. (2012). Community ecology in the age of multivariate multiscale spatial analysis. Ecol. Monogr. 82, 257–275. doi: 10.1890/11-1183.1
Ellingsen K. E. (2001). Biodiversity of a continental shelf soft-sediment macrobenthos community. Mar. Ecol. Prog. Ser. 218, 1–15. doi: 10.3354/meps218001
Ellingsen K. E. (2002). Soft-sediment benthic biodiversity on the continental shelf in relation to environmental variability. Mar. Ecol. Prog. Ser. 232, 15–27. doi: 10.3354/meps232015
Ellingsen K., Gray J. S. (2002). Spatial patterns of benthic diversity: is there a latitudinal gradient along the Norwegian continental shelf? J. Anim. Ecol. 71, 373–389. doi: 10.1046/j.1365-2656.2002.00606.x
Ellis J. I., Jamil T., Anlauf H., Coker D. J., Curdia J., et al (2019). Multiple stressor effects on coral reef ecosystems. Glob. Change. Biol. 25, 4131–4146. doi: 10.1111/gcb.14819
Ellis J., Anlauf H., Kürten S., Lozano-Cortés D., Alsaffar Z., Cúrdia J., et al. (2017). Cross shelf benthic biodiversity patterns in the southern Red Sea. Sci. Rep. 7, 437. doi: 10.1038/s41598-017-00507-y
Ellis J., Schneider D. C. (2008). Spatial and temporal scaling in benthic ecolog. J. Exp. Mar. Biol. Ecol. 366, 92–98. doi: 10.1016/j.jembe.2008.07.012
Fishelson L. (1971). Ecology and distribution of the benthic fauna in the shallow waters of the Red Sea. Mar. Biol. 10, 113–133. doi: 10.1007/BF00354828
Freitas R., Ricardo F., Pereira F., Sampaio L., Carvalho S., Gaspar M., et al. (2011). Benthic habitat mapping: concerns using a combined approach (acoustic, sediment and biological data). Estuarine Coast. Shelf Sci. 92, 598–606. doi: 10.1016/j.ecss.2011.02.022
Frigstad H., Kaste Ø., Deininger A., Kvalsund K., Christensen G., Bellerby R. G. J., et al. (2020). Influence of riverine input on Norwegian Coastal systems. Front. Mar. Sci. 7. doi: 10.3389/fmars.2020.00332
Gajdzik L., DeCarlo T. M., Aylagas E., Coker D., Green A. L., Majoris J. E., et al. (2021a). A portfolio of climate-tailored approaches to advance the design of marine protected areas in the Red Sea. Global Change Biol. 27, 3956–3968. doi: 10.1111/gcb.15719
Gajdzik L., Green A. L., Cochran J. E. M., Hardenstine R. S., Tanabe L. K., Berumen M. L. (2021b). Using species connectivity to achieve coordinated large-scale marine conservation efforts in the Red Sea. Mar. pollut. Bull. 166, 112244. doi: 10.1016/j.marpolbul.2021.112244
Gaston G. R., Rakocinski C. F., Brown S. S., Cleveland C. M. (1998). Trophic function in estuaries: response of macrobenthos to natural and contaminant gradients. Mar. Freshw. Res. 49, 833–846. doi: 10.1071/MF97089
Gillis L. G., Jones C. G., Ziegler A. D., van der Wal D., Breckwoldt A., Bouma T. J. (2017). Opportunities for protecting and restoring tropical coastal ecosystems by utilizing a physical connectivity approach. Front. Mar. Sci. 4. doi: 10.3389/fmars.2017.00374
Grantham B. A., Eckert G. L., Shanks A. L. (2003). Dispersal potential of marine invertebrates in diverse habitats. Ecol. Appl. 13, S108–S116. doi: 10.1890/1051-0761(2003)013[0108:DPOMII]2.0.CO;2
Gray J. S. (1997). Marine biodiversity: patterns, threats and conservation needs. Biodiversity Conserv. 6, 153–175. doi: 10.1023/A:1018335901847
Gray J. S. (2002). Species richness of marine soft sediments. Mar. Ecol. Prog. Ser. 244, 285–297. doi: 10.3354/meps244285
Grémare A., Amouroux J. M., Vétion G. (1998). Long-term comparison of macrobenthos within the soft bottoms of the bay of banyuls-sur-mer (northwestern Mediterranean Sea). J. Sea Res. 40, 281–302. doi: 10.1016/S1385-1101(98)00032-X
Harrison S., Ross S. J., Lawton J. H. (1992). Beta diversity on geographic gradients in Britain. J. Anim. Ecol. 61, 151–158. doi: 10.2307/5518
Heino J., Melo A. S., Siqueira T., Soininen J., Valanko S., Bini L. M. (2015). Metacommunity organisation, spatial extent and dispersal in aquatic systems: patterns, processes and prospects. Freshw. Biol. 60, 845–869. doi: 10.1111/fwb.12533
Hernandez-Avila I., Ocaña F. A., Pech D. (2020). Testing marine regional-scale hypotheses along the Yucatan continental shelf using soft-bottom macrofauna. PeerJ 8, e8227. doi: 10.7717/peerj.8227
Hewitt J., Thrush S., Dayton P., Bonsdorff E. (2007). The effect of spatial and temporal heterogeneity on the design and analysis of empirical studies of scale-dependent systems. Am. Nat. 169, 398–408. doi: 10.1086/510925
HilleRisLambers J., Adler P. B., Harpole W. S., Levine J. M., Mayfield M. M. (2012). Rethinking community assembly through the lens of coexistence theory. Annu. Rev. Ecology Evolution Systematics 43, 227–248. doi: 10.1146/annurev-ecolsys-110411-160411
Hubbell S. P. (2001). The unified neutral theory of biodiversity and biogeography (Princeton: Princeton Univ. Press).
Hummel H., Van Avesaath P., Wijnhoven S., Kleine-Schaars L., Degraer S., Kerckhof F., et al. (2017). Geographic patterns of biodiversity in European coastal marine benthos. J. Mar. Biol. Assoc. United Kingdom 97, 507–523. doi: 10.1017/S0025315416001119
Jayaraj K. A., Sheeba P., Jacob J., Revichandran C., Arun P. K., Praseeda K. S., et al. (2008). Response of infaunal macrobenthos to the sediment granulometry in a tropical continental margin–southwest coast of India. Estuarine Coast. Shelf Sci. 77, 743–754. doi: 10.1016/j.ecss.2007.11.016
Jones D. A., Ghamrawy M., Wahbeh M. I. (1987). “Littoral and shallow subtidal environments,” in Key environments: the red Sea. Ed. Edwards A. (Oxford: Pergamon Press), 169–193.
Joydas T. V., Qurban M. A. B., Karuppasamy M., Rabaoui L., Krishnakumar P. K. (2019). “Spatial patterns of standing stock and diversity of macrobenthic communities in the Red Sea,” in Oceanographic and biological aspects of the Red Sea. Eds. Rasul N., Stewar I. (Cham: Springer).
Klein C. J., Jupiter S. D., Watts M., Possingham, H. P. 2014. Evaluating the influence candidate terrestrial protected areas on coral reef condition in Fiji. Mar. Policy 44, 360-365. doi: 10.1016/j.marpol.2013.10.001
Kleinhaus K, Al-Sawalmih A, Barshis D. J., Genin A, Grace L. N., Hoegh-Guldberg O, et al. Science, diplomacy, and the Red Sea’s uniquecoral reef: it’s time for action. Front. Mar. Sci. 7, 90. doi: 10.3389/fmars.2020.00090
Kheireddine M., Ouhssain M., Claustre H., Uitz J., Gentili B., Jones B. H. (2017). Assessing pigment-based phytoplankton community distributions in the Red Sea. Front. Mar. Sci. 4, 191. doi: 10.3389/fmars.2017.00132
Kon K., Kawakubo N., Aoki J. I., Tongnunui P., Hayashizaki K. I., Kurokura H. (2009). Effect of shrimp farming organic waste on food availability for deposit feeder crabs in a mangrove estuary, based on stable isotope analysis. Fisheries Sci. 75, 715–722. doi: 10.1007/s12562-009-0060-x
Kürten B., Zarokanellos N. D., Devassy R. P., El-Sherbiny M. M., Struck U., Capone D. G., et al. (2019). Seasonal modulation of mesoscale processes alters nutrient availability and plankton communities in the Red Sea. Prog. Oceanogr. 173, 238–255. doi: 10.1016/j.pocean.2019.02.007
Legendre P, (2008) Studying beta diversity: ecological variation partitioning by multiple regression and canonical analysis. Journal of Plant Ecology 1, 3-8.
Leibold M. A., Holyoak M., Mouquet N., Amarasekare P., Chase J. M., Hoopes M. F., et al. (2004). The metacommunity concept: a framework for multi-scale community ecology. Ecol. Lett. 7, 601–613. doi: 10.1111/j.1461-0248.2004.00608.x
Levin L. A. (2000). Polychaetes as environmental indicators: response to low oxygen and organic enrichment. Bull. Mar. Sci. 67, 668.
Levin L. A., Etter R. J., Rex M. A., Gooday A. J., Smith C. R., Pineda J., et al. (2001). Environmental influences on regional deep-sea species diversity. Annu. Rev. Ecol. Systematics 32, 51–93. doi: 10.1146/annurev.ecolsys.32.081501.114002
Liu G., Heron S., Eakin C., Muller-Karger F., Vega-Rodriguez M., Guild L., et al. (2014). Reef-scale thermal stress monitoring of coral ecosystems: new 5-km global products from NOAA coral reef watch. Remote Sens. 6, 11579–11606. doi: 10.3390/rs61111579
Lohrer A. M., Thrush S. F., Gibbs M. M. (2004). Bioturbators enhance ecosystem function through complex biogeochemical interactions. Nature 431, 1092–1095. doi: 10.1038/nature03042
Lu L., Grant J., Barrell J. (2008). Macrofaunal spatial patterns in relationship to environmental variables in the richibucto estuary, new Brunswick, Canada. Estuaries Coasts 31, 994–1005. doi: 10.1007/s12237-008-9097-9
Manasrah R., Abu-Hilal A., Rasheed M. (2019). “Physical and chemical properties of seawater in the gulf of Aqaba and Red Sea,” in Oceanographic and biological aspects of the Red Sea. Eds. Rasul N., Stewart I. C. F. (Cham: Springer International Publishing), 41–73.
Medeiros C. R., Hepp L. U., Patrício J., Molozzi J. (2016). Tropical estuarine macrobenthic communities are structured by turnover rather than nestedness. PloS One 11 (9), e0161082. doi: 10.1371/journal.pone.0161082
Menegotto A., Dambros C. S., Netto S. A. (2019). The scale-dependent effect of environmental filters on species turnover and nestedness in an estuarine benthic community. Ecology 100, e02721. doi: 10.1002/ecy.2721
Mohamed B. F. (1984). Ecological observations on the mangroves of the Red Sea shores of the Sudan. Hydrobiologia 110, 109–111. doi: 10.1007/BF00025782
Moraitis M. L., Karakassis I. (2020). Assessing large-scale macrobenthic community shifts in the Aegean Sea using novel beta diversity modelling methods. ramifications on environmental assessment. Sci. Total Environ. 734, 139504. doi: 10.1016/j.scitotenv.2020.139504
Moritz C., Meynard C. N., Devictor V., Guizien K., Labrune C., Guarini J.-M., et al. (2013). Disentangling the role of connectivity, environmental filtering, and spatial structure on metacommunity dynamics. Oikos 122, 1401–1410. doi: 10.1111/j.1600-0706.2013.00377.x
Morrisey D. J., Howitt L., Underwood A. J., Stark J. S. (1992). Spatial variation in soft-sediment benthos. Mar. Ecol. Prog. Ser. 81, 197–204. doi: 10.3354/meps081197
Navarro-Barranco C., Guerra-García J. M. (2015). Spatial distribution of crustaceans associated with shallow soft-bottom habitats in a coral reef lagoon. Mar. Ecol. 37, 77–87. doi: 10.1111/maec.12251
Nekola J. C., White P. S. (1999). The distance decay of similarity in biogeography and ecology. J. Biogeogr. 26, 867–878. doi: 10.1046/j.1365-2699.1999.00305.x
Oksanen J., Blanchet F. G., Friendly M., Kindt R., Legendre P., McGlinn D., et al. (2020) Vegan: community ecology package. Available at: https://CRAN.R-project.org/package=vegan.
Pearman J. K., Aylagas E., Voolstra C., Anlauf H., Villalobos R., Carvalho S. (2019). Disentangling the complex microbiological network within vulnerable coral reef ecosystems. Mol. Ecol. 28, 3496–3507. doi: 10.1111/mec.15167
Pearman J. K., Chust G., Aylagas E., Villarino E., Watson J. R., Chenuil A., et al. (2021). Pan-regional marine benthic cryptobiome biodiversity patterns revealed by metabarcoding autonomous reef monitoring structures. Mol. Ecol. 29, 4882–4897. doi: 10.1111/mec.15692
Pearman J. K., Ellis J., Sarma Y. V. B., Jones B. H., Carvalho S. (2017). Microbial planktonic communities in the red Sea: high levels of spatial and temporal variability shaped by nutrient availability and turbulence. Sci. Rep. 7, article 6611. doi: 10.1038/s41598-017-06928-z
Pearman J. K., Irigoien X., Carvalho S. (2016). Extracellular DNA amplicon sequencing reveals high levels of benthic eukaryotic diversity in the central Red Sea. Mar. Genomics 26, 29–39. doi: 10.1016/j.margen.2015.10.008
Pearman J. K., Leray M., Villalobos R., Machida R. J., Berumen M. L., Knowlton N., et al. (2018). Cross-shelf investigation of coral reef cryptic benthic organisms reveals diversity patterns of the hidden majority. Sci. Rep. 8, 8090. doi: 10.1038/s41598-018-26332-5
Pearson T. H., Rosenberg R. (1978). Macrobenthic succession in relation to organic enrichment and pollution of the marine environment. Oceanogr. Mar. Biol.: an Annu. Rev. 16, 229–311.
Peres-Neto P. R., Legendre P., Dray S., Borcard D. (2006). Variation partitioning of species data matrices: estimation and comparison of fractions. Ecology 87, 2614–2625. doi: 10.1890/0012-9658(2006)87[2614:VPOSDM]2.0.CO;2
Puri V., Redondo W., Sousa-Pinto I., Rubal M. (2017). Relationship between structure of macrobenthic assemblages and environmental variables in shallow sublittoral soft bottoms. Mar. Environ. Res. 129, 396–407. doi: 10.1016/j.marenvres.2017.07.002
Rasul N. M. A., Stewart I. C. F., Nawab Z. A. (2015). “Introduction to the red Sea: its origin, structure, and environment,” in The red Sea: the formation, morphology, oceanography and environment of a young ocean basin. Eds. Rasul N. M. A., Stewart I. C. F. (Berlin, Heidelberg: Springer), 1–28.
R Core Team (2021). R: a language and environment for statistical computing (Vienna, Austria: R Foundation for Statistical Computing). Available at: https://www.R-project.org/.
Ricklefs R. E. (2004). A comprehensive framework for global patterns in biodiversity. Ecol. Lett. 7, 1–15. doi: 10.1046/j.1461-0248.2003.00554.x
Rosenberg R. (2001). Marine benthic faunal successional stages and related sedimentary activity. Scientia Marina 65, 107–119. doi: 10.3989/scimar.2001.65s2107
Sanders H. L. (1968). Marine benthic diversity: a comparative study. Am. Nat. 102, 243–282. doi: 10.1086/282541
Schneider D. (1994). Quantitative ecology: spatial and temporal scaling (San Diego, CA: Academic Press).
Schneider D. (2001). The rise of the concept of scale in ecology. Bioscience 51, 545–553. doi: 10.1641/0006-3568(2001)051[0545:TROTCO]2.0.CO;2
Shin P. K., Ellingsen K. E. (2004). Spatial patterns of soft-sediment benthic diversity in subtropical Hong Kong waters. Mar. Ecol. Prog. Ser. 276, 25–35. doi: 10.3354/meps276025
Signa G., Mazzola A., Kairo J., Vizzini S. (2017). Small-scale variability in geomorphological settings influences mangrove-derived organic matter export in a tropical bay. Biogeosciences 14, 617–629. doi: 10.5194/bg-14-617-2017
Snelgrove P. V. (1997). The importance of marine sediment biodiversity in ecosystem processes. Ambio 26, 578–583.
Snelgrove P. V. (1998). The biodiversity of macrofaunal organisms in marine sediments. Biodiversity Conserv. 7, 1123–1132. doi: 10.1023/A:1008867313340
Snelgrove P. V. (1999). Getting to the bottom of marine biodiversity: sedimentary habitats: ocean bottoms are the most widespread habitat on earth and support high biodiversity and key ecosystem services. BioScience 49, 129–138. doi: 10.2307/1313538
Sofianos S. S., Johns W. E., Murray S. P. (2002). Heat and freshwater budgets in the Red Sea from direct observations at Bab el Mandeb. Deep Sea Res. Part II: Topical Stud. Oceanogr. 49, 1323–1340.
Soininen J., Lennon J. J., Hillebrand H. (2007b). A multivariate analysis of beta diversity across organisms and environments. Ecology 88, 2830–2838. doi: 10.1890/06-1730.1
Soininen J., McDonald R., Hillebrand H. (2007a). The distance decay of similarity in ecological communities. Ecography 30, 3–12. doi: 10.1111/j.0906-7590.2007.04817.x
Thioulouse J., Dray S., Dufour A., Siberchicot A., Jombart T., Pavoine S. (2018). Multivariate analysis of ecological data with ade4 (New York: Springer).
Thrush S., Hewitt J., Cummings V., Green M., Funnell G., Wilkinson M. (2000). The generality of field experiments: interactions between local and broad-scale processes. Ecology 81, 399–415. doi: 10.1890/0012-9658(2000)081[0399:TGOFEI]2.0.CO;2
Thrush S. F., Hewitt J. E., Cummings V. J., Norkko A., Chiantore M. (2010). B-diversity and species accumulation in Antarctic coastal benthos: influence of habitat, distance and productivity on ecological connectivity. PloS One 5, e11899. doi: 10.1371/journal.pone.0011899
Thrush S., Hewitt J., Herman P., Ysebaert T. (2005). Multi-scale analysis of species environment relationships. Mar. Ecol. Prog. Ser. 302, 13–26. doi: 10.3354/meps302013
Valentine J. W., (2009) Overview of marine biodiversity. Journal of Plant Ecology 1, 3-8. 3– 28. In: Witman, J. D. and Roy K. (eds). Marine macroecology. (Chicago: University of Chicago Press), 424 pp.
Van Valen L. (1976). Ecological species, multispecies, and oaks. Taxon 25, 233–239. doi: 10.2307/1219444
Volkov I., Banavar J. R., Hubbell S. P., Maritan A. (2003). Neutral theory and relative species abundance in ecology. Nature 42, 1035–1037. doi: 10.1038/nature01883
Warwick R. M. (1987). Comparative study of the structure of some tropical and temperate marine soft-bottom macrobenthic communities. Mar. Biol. 95, 641–649. doi: 10.1007/BF00393108
Webb A. P., Eyre B. D. (2004). The effect of natural populations of the burrowing and grazing soldier crab (Mictyris longicarpus) on sediment irrigation, benthic metabolism and nitrogen fluxes. J. Exp. Mar. Biol. Ecol. 309, 1–19. doi: 10.1016/j.jembe.2004.05.003
Weisberg S. B., Ranasinghe J. A., Dauer D. M., Schaffner L. C., Diaz R. J., Frithsen J. B. (1997). An estuarine benthic index of biotic integrity (B-IBI) for Chesapeake bay. Estuaries 20, 149–158. doi: 10.2307/1352728
Wild C., Huettel M., Klueter A., Kremb S. G., Rasheed M. Y. M., Jørgensen B. B. (2004). Coral mucus functions as an energy carrier and particle trap in the reef ecosystem. Nature 428, 66–70. doi: 10.1038/nature02344
Wood S. N. (2017). Generalized additive models: an introduction with r. 2nd ed (New York: Chapman and Hall/CRC).
Wootton J. T. (2001). Local interactions predict large-scale pattern in empirically derived cellular automata. Nature 413, 841–844. doi: 10.1038/35101595
Keywords: habitat heterogeneity, geographical distance, environmental distance, subtropics, macrofauna assemblages, beta-diveristy, distribution patterns
Citation: Carvalho S, Alsaffar Z, Ellis J, Alghamdi H and Cúrdia J (2023) Broad-scale spatial distribution patterns of soft-sediment macrobenthic communities in the Red Sea. Front. Mar. Sci. 10:1072342. doi: 10.3389/fmars.2023.1072342
Received: 17 October 2022; Accepted: 12 April 2023;
Published: 19 May 2023.
Edited by:
Heliana Teixeira, University of Aveiro, PortugalReviewed by:
Thanos Dailianis, Hellenic Centre for Marine Research, GreeceEmily Douglas, National Institute of Water and Atmospheric Research (NIWA), New Zealand
Copyright © 2023 Carvalho, Alsaffar, Ellis, Alghamdi and Cúrdia. This is an open-access article distributed under the terms of the Creative Commons Attribution License (CC BY). The use, distribution or reproduction in other forums is permitted, provided the original author(s) and the copyright owner(s) are credited and that the original publication in this journal is cited, in accordance with accepted academic practice. No use, distribution or reproduction is permitted which does not comply with these terms.
*Correspondence: Susana Carvalho, U3VzYW5hLmNhcnZhbGhvQEtBVVNULmVkdS5zYQ==
†Present address: Zahra AlsaffarEnvironment Department, NEOM, Tabuk, Saudi ArabiaJoanne EllisSchool of Science, The University of Waikato, Tauranga, New Zealand