 Susannah V. Calderan1,2*
 Russell Leaper1,3
 Virginia Andrews-Goff1
 Brian S. Miller1
 Paula A. Olson1,4
 M. V. Reyes Reyes1,5,6
 Elanor Bell1Michael C. Double1
- 1Australian Antarctic Division, Department of Climate Change, Energy, the Environment and Water, Kingston, TAS, Australia
- 2Scottish Association for Marine Science (SAMS), Argyll, Scotland, United Kingdom
- 3International Fund for Animal Welfare, London, United Kingdom
- 4Southwest Fisheries Science Center, National Marine Fisheries Service, National Oceanic and Atmospheric Administration, La Jolla, CA, United States
- 5Whale and Dolphin Conservation, Wiltshire, United Kingdom
- 6Fundación Cethus, Buenos Aires, Argentina
During three surveys in the austral summers of 2013, 2015, 2019, data on Antarctic blue whale blow rates, dive times, swim speeds, and broadscale movements were collected using video photogrammetric tracking and intra-voyage photo-identification. A total of 24.4 hours of video observations were suitable for blow interval or movement analysis. Similar to other blue whale populations, Antarctic blue whale dive behaviour comprised a sequence of short dives followed by a long dive with a mean dive time for short dives of 17.6 s, and a mean long dive time of 189.3 s. Two separate methods were used to estimate the average blow rate for Antarctic blue whales, giving estimates of 59.7 and 63.2 blows per hour. The overall mean swim speed over the course of all suitable video track segments was 1.59 ms-1, but there were significant differences between years in the mean of the overall movement rate for each track; average movement rates were lower in 2015 compared to 2013 and 2019 (0.90 ms-1, 1.84 and 1.55 ms-1 respectively), with higher rates of turning in 2015. In 2019, there was faster overall movement through the study area in a consistent direction. The total number of photo-identified blue whales re-sighted intra-season in 2013 was nine (out of 50 identified individuals); in 2015 it was seven (out of 46); in 2019 two (out of 25). Whales remained for several days with little overall movement within the 2015 study area, whereas they were moving through the study area in 2019, which would explain the low number of intra-season resights. The predominant heading in 2019 was towards the area of Antarctic blue whale concentrations at the entrance to the Ross Sea observed in previous years. The photo-identification data also show a high proportion of resighted whales with coherent movements. This suggests that Antarctic blue whales might travel together, at least over periods of several days or sometimes up to a month. The differences between behaviours in 2015 and 2019 in particular may be related to differences in the characteristics of krill swarms between the study areas.
1 Introduction
Following heavy depletion by 20th century industrial whaling, Antarctic blue whales Balaenoptera musculus intermedia remain critically endangered (Cooke, 2018). Their small population size and distribution over areas which are often difficult to access means they are challenging to study, and their ecology, movements and behaviour are poorly understood. Some data from satellite telemetry are available (Andrews-Goff et al, 2022), but otherwise little is known about their surfacing behaviours or movement, particularly over fine spatial and temporal scales.
Knowledge of Antarctic blue whale fine-scale movements and behaviour is important for informing studies which involve approaching and/or surveying whales, and also for a variety of long-term or multidisciplinary studies. Metrics of Antarctic blue whale behavioural parameters may assist in the interpretation of a range of datasets. Blow (cue) rates are important in visual survey data analysis for estimating g(0) (the probability of detecting an animal directly on the survey trackline) for single platform surveys, or if cue counting methods are used (Hiby, 1992). For example Leaper et al. (2015) used a simulation approach to estimate g(0) based on previous work which classified blue whale dives as either short or long dives (Lagerquist et al., 2000; de Vos et al., 2013). Information on movements and surfacing behaviour can potentially add value to passive acoustic studies when behaviours can be linked to vocalisations (Oleson et al., 2007; Schall et al., 2020). Movements and vocalisations have also been hypothesised to be related to behavioural state, and thus may be indicative of prey availability and characteristics (Miller et al., 2019). Additionally, this information may be useful when investigating hypotheses on the role of whales in the ecosystem, for which overall movements through an area might be compared with phytoplankton, bacteria, and biogeochemistry e.g. iron concentrations (Smith et al., 2021). Natural behaviours and movements may also inform assessment of anthropogenic impacts, for example, by providing baseline data against which impacts can be evaluated (Lomac-MacNair and Smultea, 2016). Similarly, this information provides direct parameters which are required by individual-based energetic models for investigating population consequences of disturbance (Pirotta et al., 2022). Fine-scale movement data may also help to improve interpretation of longer-term telemetry studies where potentially large positional errors and small sample sizes in terms of both locations and tracks can limit understanding of behavioural states. For example, measurements of short-term swim speeds over minutes will inevitably be higher than longer-term movement rates over hours, making it difficult to compare fine-scale tracking with longer-term movement data. In such cases, relationships between measured speed and interval time may facilitate comparisons between different studies.
Information on whale movements comes from a small number of highly-specialised methods including large-scale and long-term satellite-telemetry tags (Andrews-Goff et al, 2022); mark-recapture during whaling (Branch et al., 2007), and visual and acoustic focal follows (Leaper and Gordon, 2001; Miller et al., 2014). These methods operate over temporal scales from decades to seconds, and over spatial scales from global to fine-scale. Information on Antarctic blue whale movements can also be obtained from photographic mark-recapture studies, particularly from the Antarctic Blue Whale Catalogue. The Catalogue was established in 2007 and currently holds 562 identified whales (represented by 421 left side and 413 right side photographs) from the years 1980-2022 (unpub. data). Over a dozen research organisations and independent scientists have contributed photographs to the Catalogue (Olson et al., 2020). Whilst most prior photographic mark-recapture studies have focused on large-scale movements between years, photographic identification (photo-ID) can also provide information on intra-seasonal movements for whales which are photographically captured more than once each year (e.g. recaptured later during the same voyage). These intra-seasonal recaptures can potentially help to relate the overall direction of travel throughout a voyage to other measures of movement e.g. obtained via satellite tags (described above), or focal follows (described below). Recently, inter-seasonal data have also been examined for movement patterns of Antarctic blue whales (Olson et al., 2022).
Focal follows of animals typically involve following groups of whales to record behaviours, understand behavioural contexts, including interactions and responses, and describe sequences of events (Oleson et al., 2007; Quick et al., 2008; Crance et al., 2017). This type of study is often conducted from a small boat, or from shore with instruments such as theodolites and hydrophone arrays (Dunlop et al., 2016). Video photogrammetric systems may also be used from research vessels in order to carry out and obtain a series of locations (Leaper and Gordon, 2001). Like theodolites, video photogrammetric systems enable the measurement of distances and bearings to provide locations with high precision and accuracy (Williams et al., 2007; Leaper et al., 2010), as well as recording sequences of behaviours as whales surface (Leaper and Gordon, 2001). Video photogrammetric tracking can provide information on blow (cue) rates and swimming speeds. However, estimation of swim speeds this way can be sensitive to errors in location. For example, locations for more distant groups are less accurate than those closer to the ship due to measurement error (Leaper and Gordon, 2001).
This study describes blow rates, movements, and swim speeds of Antarctic blue whales on their Antarctic feeding grounds using a combination of intra-voyage photographic recaptures, and photogrammetric analysis of video recordings (video range tracking). Comparisons between these swim speeds and those observed in the Antarctic using other methods and different spatial scales are made, as well as between these observations and those observed from other blue whale populations/sub-species.
2 Materials and methods
2.1 Data collection
Antarctic blue whales were studied on three Antarctic voyages during the austral summers of 2013, 2015 and 2019 on the 65 m FV Amaltal Explorer, the 70 m RV Tangaroa, and the 94 m RV Investigator respectively (Double et al., 2013; Double et al., 2015; Double et al., 2021). Whales were detected acoustically using directional frequency analysis and recording (DIFAR) sonobuoys (which enable the detection of both whale vocalisations and the bearings to those vocalisations). Then individuals or groups of whales (referred to hereafter as ‘groups’) were tracked and approached using acoustic bearings, until they had been sighted by visual observers (see Miller et al. (2015) for description of acoustic methodology). Once a group was visually detected, the survey vessel slowed down or stood off, allowing focal follows using video photogrammetric tracking to take place whilst the group was largely undisturbed (Calderan et al., 2014; Calderan et al., 2017; Calderan et al., 2022). Following photogrammetric video tracking, the research team would then guide the ship for a closer approach to the group for photo-ID (if video-tracking was not undertaken, the ship would move directly to approach for photo-ID). Both sides of each whale were photographed whenever possible. Typically two photographers worked from the bow of the ship. In 2013, during optimal weather conditions, a RHIB was launched and one photographer worked on each vessel. DSLR cameras with image-stabilized zoom lenses were used to gather images for photo-ID.
Movement data were collected using the photogrammetric methods described in Leaper and Gordon (2001). Whale locations were measured at each surfacing, enabling focal follows of Antarctic blue whales as they were observed from the survey vessel. Groups which were first seen at distances of several km were observed and video tracked before the vessel moved to close-approach mode for photo-ID, allowing behavioural data to be gathered when the whales were first sighted, and before the research vessel was so close that behaviour was likely to be substantially affected. The aim was to gain as much understanding as possible about the behaviour of the group before making a close approach. Photogrammetric and photo-ID data were collected between sunrise and sunset (much of the study area remained almost-continuously in daylight due to the high latitude and time of year).
The video tracking system comprised a front-facing Panasonic HCV700 camcorder with a calibrated lens of known focal length, downward-facing Canon A40 stills camera (reference marks were made on the deck to enable angle measurement), and binoculars. These were mounted on a single frame and monopod. The observation platform heights were 10.2 m, 14.4 m and 16.9 m respectively on the 2013, 2015 and 2019 voyages. The system enabled a combination of locations and behavioural observations, including surfacing locations, blow rates, swimming speeds and changes in heading to be measured by a tracking observer. The tracker was assisted by another observer to ensure the consistent resighting and tracking of the focal animal if there was more than one whale in the group. The tracker also recorded a concurrent audio commentary to assist with disambiguating the video during post-processing and analysis. At the conclusion of video tracking, the vessel moved towards the whale group to allow photo-ID. The video and stills data were post-processed using the Video Range module in PAMGuard (www.pamguard.org ) to derive distances and bearings, following methods in Leaper and Gordon (2001). Once a series of whale times and positions had been compiled into a track, these were analysed to estimate blow rates and movement parameters.
2.2 Data analysis
In order to analyse photogrammetric and photo-ID data, three types of velocity measurements (speed in ms-1 and heading in degrees) were used, representing different temporal scales:
(a) Swim speed: over the shortest period between surfacings that allowed for measurement of speed to meet the criteria for accuracy discussed in 2.2.1.3; close to actual speed through the water (not accounting for vertical movement);
(b) Movement rate: measured from the start to end of a track, representing an overall speed of travel in a particular direction over 10 minutes or longer;
(c) Broadscale movement rate: measured from the distance between locations over a day or longer apart.
2.2.1 Photogrammetry
2.2.1.1 Combining locations into tracks
The data used in analysis were selected to avoid some of the major sources of bias which can be associated with photogrammetric tracking data, resulting in only a proportion of tracks being included. These potential sources of bias are that individual blows or sequences of blows might be missed, resulting in potentially biased blow rates. Furthermore, in groups where there is more than one whale, the focal animal may be confused with another individual, which will bias surfacing and movement parameters. Measurement error will also cause bias in swim speeds measured over short time periods because apparent movement may in fact be the result of measurement error. Whales may also react to the approaching vessel. Therefore the tracks which were included in analysis were those where the group comprised a single animal, several animals surfacing and moving together, or where there was confidence that the focal animal in the group was followed throughout. In 2013 a small RHIB was sometimes deployed during approaches. All periods when the RHIB was in the water were excluded from the analysis because of the potential for disturbance. The use of hidden Markov models to characterise whale movements and diving behaviour (DeRuiter et al., 2017) was investigated, but the tracks were too short to reliably fit such models.
2.2.1.2 Overall movement across tracks (movement rate and heading)
To investigate any patterns in overall movements from the start to the end of a track, measurements to whales up to 6 km from the ship were included. In addition, a minimum tracking time of 600 s was applied. The end of the track was defined as the last observation before a group was lost, potentially confused with a different group, or came within 500 m of the vessel during a close approach. Distance travelled and heading were calculated using the ‘traipse’ package (Sumner, 2021), and the distribution of headings was analysed using the ‘circular’ package in R (Agostinelli and Lund, 2017); the Rayleigh test was used to determine whether the headings in each year showed any pattern in headings that was significantly different from a uniform distribution (R Core Team, 2021).
2.2.1.3 Fine-scale movement within track (swim speed and heading)
A maximum radial distance from the research vessel of 2 km was chosen for measurements of locations used to derive swim speeds, as a compromise between discarding data and an acceptable level of measurement error. The expected measurement error was based on estimates from Leaper and Gordon (2001), who found that from a platform height of 18 m, the RMS error in measured distances was around 3.5 % of the radial distance. RMS errors in bearing were 1.21° (angle errors were greater for situations where the ship turned frequently but improvements in GPS heading sensors probably mean this is less of an issue than when the calibration tests were conducted). Whilst video camera technology has also improved, with considerably higher resolution images than used for the estimates of accuracy in Leaper and Gordon (2001), the factor that most limited photogrammetric accuracy was swell, which not only introduced errors in the bearing and angle of dip from the horizon, but also errors in platform height, none of which would be fully resolved by improvement in image-resolution.
At 2 km, a 3.5 % error in distance corresponds to a location error of 70 m, and a 1.2° error in angle corresponds to a location error of 40 m. A simple simulation where radial distance error was drawn from a distribution with mean 0 and standard deviation of 70 m, and angle error was drawn from a distribution with mean 0 and standard deviation of 1.2° indicated that the combined effect of these errors for a whale initially at a radial distance of 2 km would be expected to introduce an RMS error in the estimated distance between two observations of 113 m. A minimum interval time of 150 s was then selected as approximately the minimum duration of a full sequence of a few short dives (submersions between breaths) and a long dive (submersion between a bout of breathing surfacings). For a typical swimming speed of 2 ms-1, speed estimates at maximum range and minimum interval time would be subject to an RMS error of around 38%. Locations that were closer than 500 m to the vessel were also rejected because of the possibility of responsive movement. This distance was chosen based on qualitative observations during the voyages, on the analysis of Lesage et al. (2017), who noted behavioural changes in blue whales in the St. Lawrence estuary Canada when vessels were within 400 m, and research by Szesciorka et al. (2019) who reported a change in surfacing behaviour as a ship approached within 300m.
Whale locations for swim speed and heading measurements were therefore selected on the criterion that the radial distance was between 500 m and 2000 m. For each track, the first location which met this criterion was determined to be the start point for speed and heading measurements. Speed and heading were then measured along the segment of whale track to the next surfacing location that met the criterion and was >150 s later. This process was repeated until the end of the track (as defined in 2.2.1.2). The change in heading in degrees between each track segment was also calculated.
2.2.1.4 Blow rates
For this study, a bimodal distribution of short and long dives was assumed (but with potentially some overlap between the two), such that the observed frequency of intervals could be modelled as the sum of two distributions. These distributions would not be expected to be normally distributed because longer intervals occur less frequently in the same time period (e.g. there is potential for 10 intervals of 10s in a 100s time period, but only 5 intervals of 20 s). Thus data transformations were investigated, including fitting distribution functions to log(interval). The mixR package in R (Yu, 2022) was used to fit a two-component mixture model using maximum likelihood estimation (R Core Team, 2021).
In the dataset from tracks which were confidently assessed as including just a single individual, the minimum observed blow interval was 5 s. Thus any intervals less than this were excluded from the full data set on the assumption that they were probably a result of blows from different whales which were misidentified when more than one individual was present. Surfacing intervals of more than 900 s were also removed on the assumption that these represented situations where a surfacing had occurred, but had not been detected. The value of 900 s was taken from the maximum observed dive duration from telemetry studies by Croll et al. (2001), although longer dive times have also been observed on a few occasions (e.g. Lagerquist et al., 2000; Owen et al., 2016).
Where a log transformation was used, the mean blow interval for the untransformed data to compare with other studies was assumed to be
where µ and σ are the mean and standard deviation respectively of the transformed data.
In addition to estimating the mean blow interval of short and long dives, the ratio of the number of short intervals to each long interval (b) was also estimated, in order to model the overall blow rate.
2.2.2 Intra-season photo-ID recaptures (broadscale movement rate and heading)
Photographs of Antarctic blue whales were judged to meet minimum quality criteria based on distance to the subject (whale), focus, angle and lighting (Olson et al., 2021). Photographs meeting these criteria were considered suitable for identifying individual blue whales and were compared within each season and to the Antarctic Blue Whale Catalogue following methods outlined in Sears et al. (1990) and in Gendron and Ugalde de la Cruz (2012). Distances between intra-seasonal recapture locations were calculated using great circle estimates from the traipse package in R (Sumner, 2021; R Core Team, 2021).
3 Results
The voyage tracks of the three research vessels are shown in Figure 1, as well as the heading direction in the overall movements of whales across video tracks in each of the voyages (Table 1). A total of 24.4 hours of video observations were suitable for blow interval or movement analysis. This resulted in 577 surfacing locations at intervals of greater than 5 s. These were divided into 181 segments of track between locations which were more than 150 s apart and suitable for measurement of whale swim speeds and headings. The total track length of these segments was 137 km.
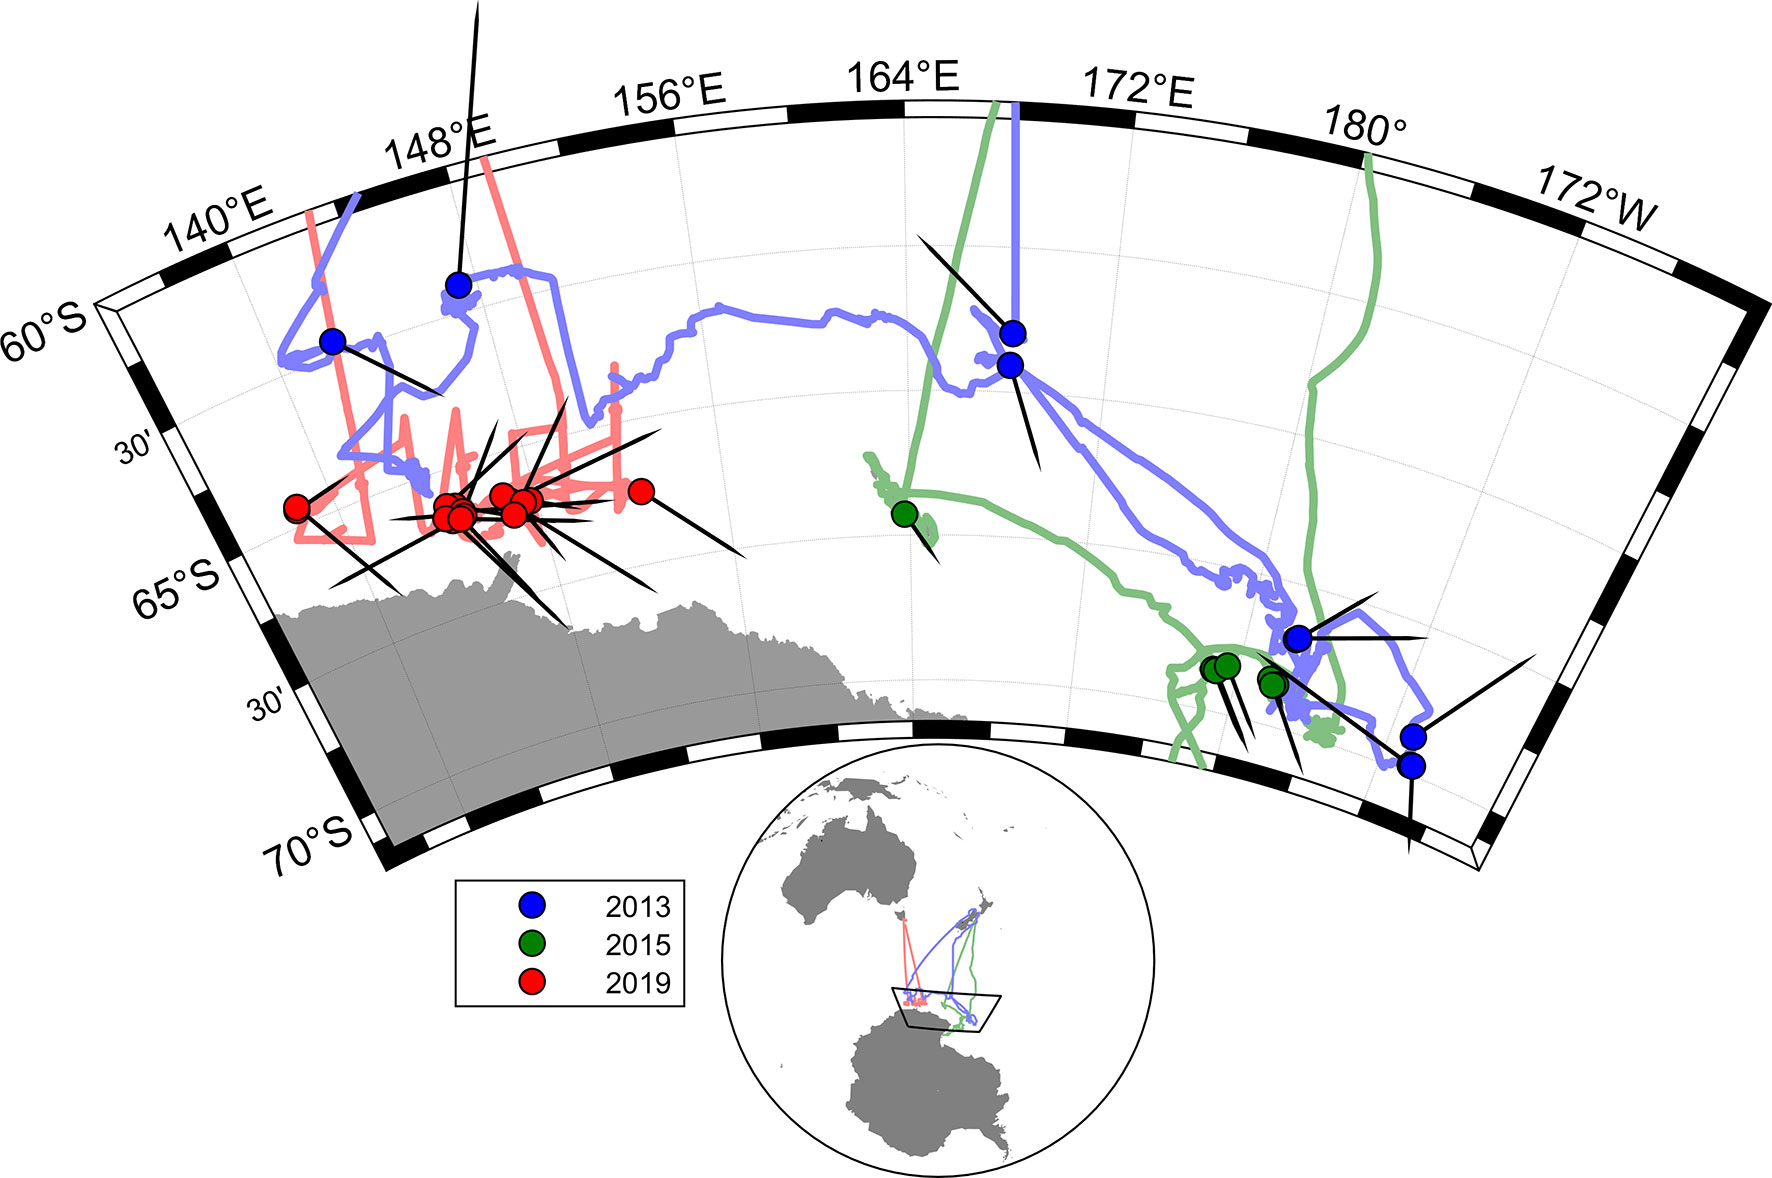
Figure 1 Map showing whole voyage tracks for all three voyages, with dots for positions of the video tracks used, and directions of overall whale movement in each video track (black pointers).
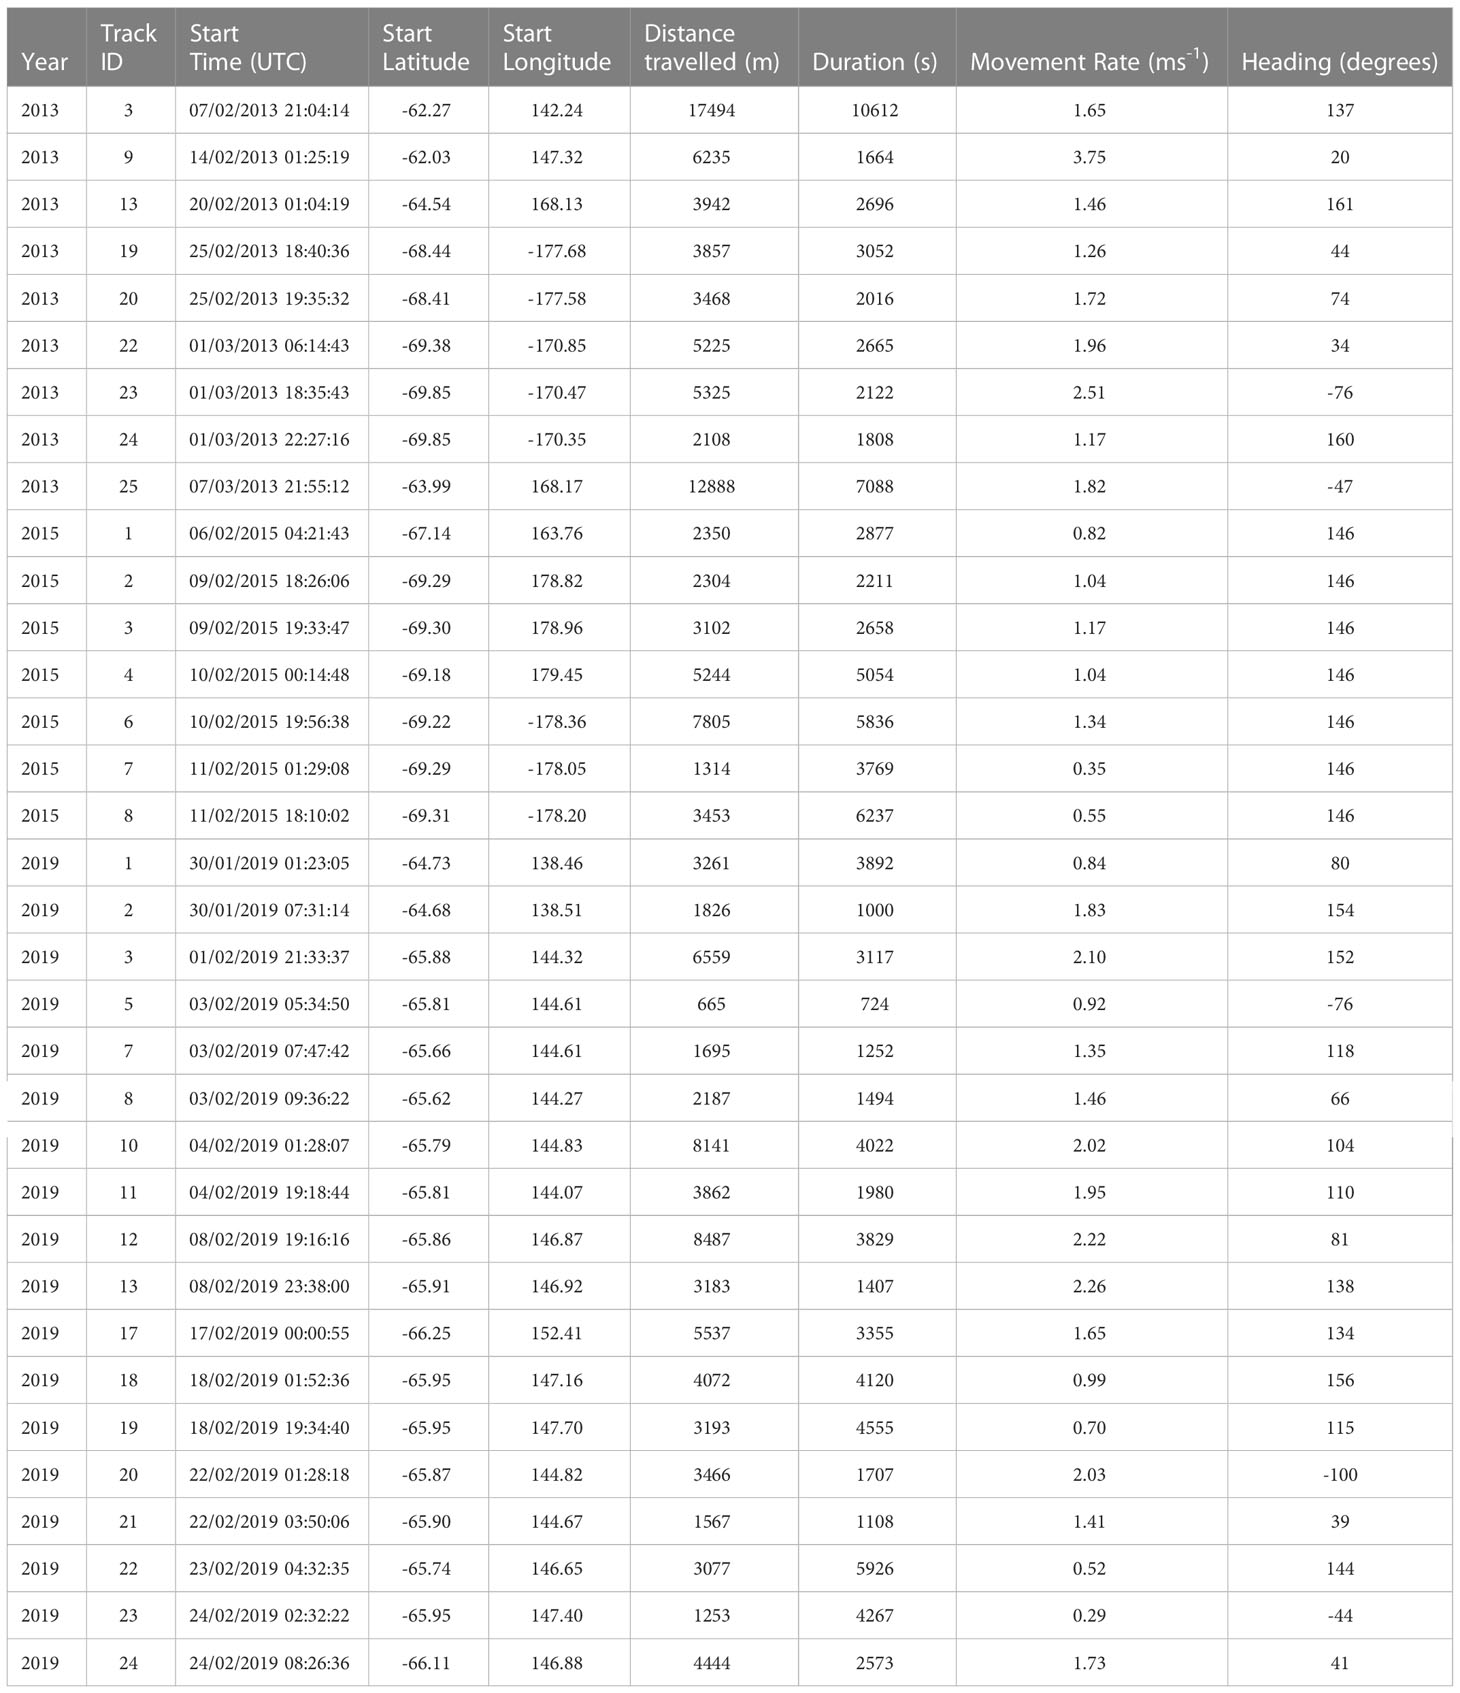
Table 1 Video tracks and measurements of movement rate and heading across each track.
3.1 Photogrammetry
3.1.1 Overall movement across tracks (movement rate and heading)
In 2013 and 2015, headings showed no overall significant difference from a uniform distribution (Figures 2A, B), but in 2019 (Figure 2C), there was a significant departure from uniform headings, with a bias towards an east-southeast heading (Table 2).
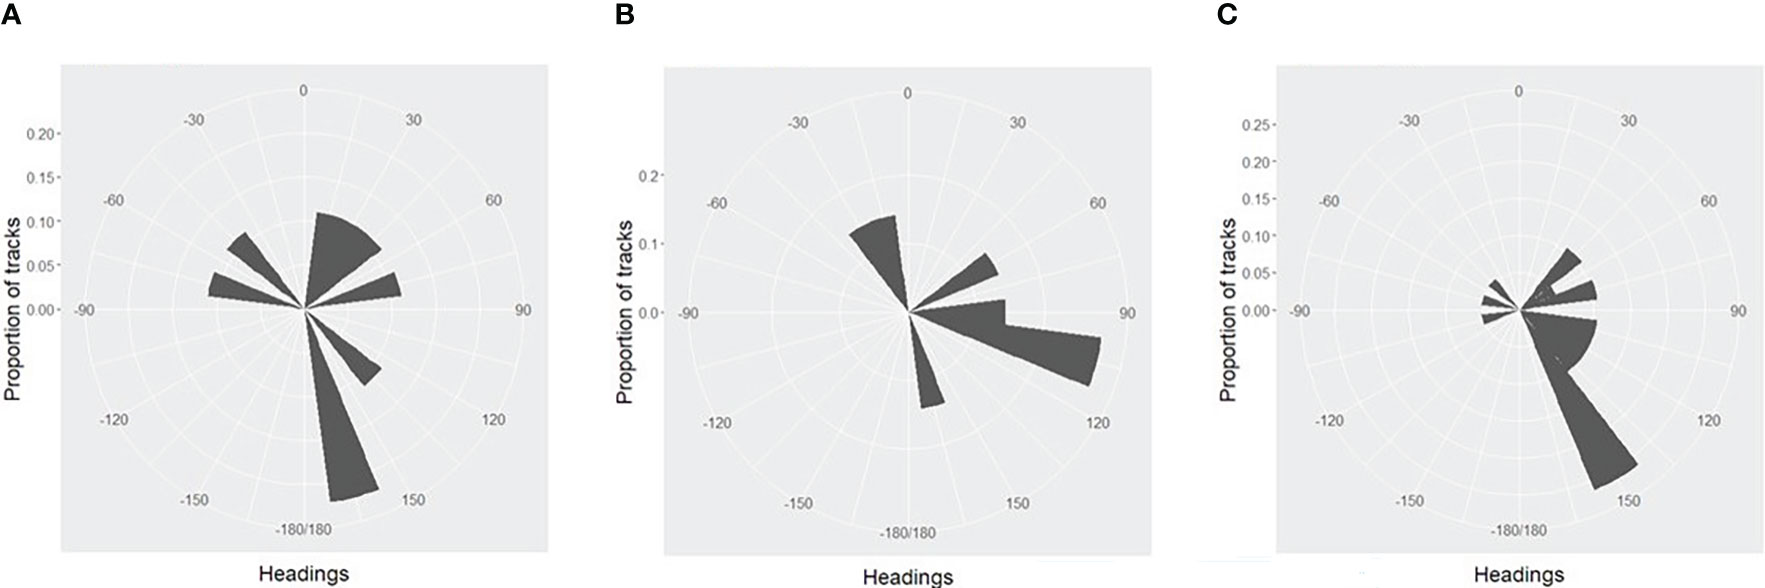
Figure 2 (A). Distribution of whale headings from video tracks, 2013 (B). Distribution of whale headings from video tracks, 2015 (C). Distribution of whale headings from video tracks, 2019.
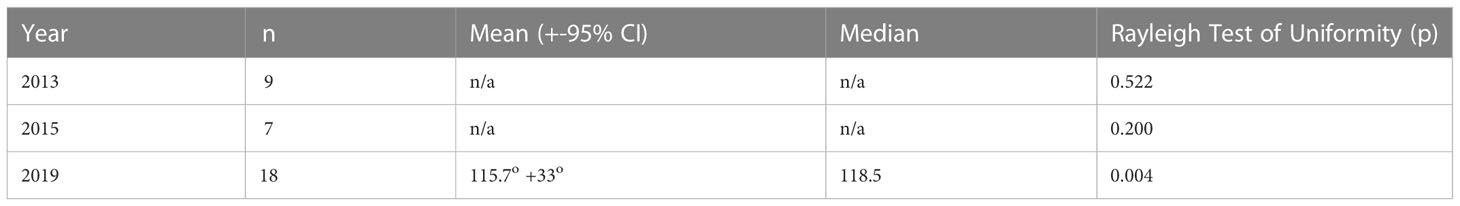
Table 2 Tracks used to test for patterns in whale headings.
The overall mean component of movement for all whales in 2019 along the median heading was 0.88 ms-1. Two of the tracks in 2013 were also in the 2019 study area, and both had an easterly component (mean 78o).
3.1.2 Swim speeds
The mean distance between locations used to estimate speed was 1035 m with a mean interval of 480 s. For these mean values and a swim speed of 1 ms-1, the RMS error in speed due to measurement error would be expected to be around 15 %.
The overall mean swim speed over the course of all suitable track segments (total combined distance/total combined time) was 1.59 ms-1, with the average duration of a track being 3924 s (65.4 minutes). For the tracks which also met the criteria for movement rate measurements, the mean swim speed and movement rate from the start to the end of the track are given in Table 3. Linear regression indicated mean movement rate was 83 % of mean swim speed (R2 = 0.73). Tracks with slower swim speeds tended to be longer and have more speed measurements. Thus the mean of the swim speeds for each track was used in the regression analysis rather than the separate individual swim speed measurements. On average, movement rates measured over the course of around an hour were about 83 % of swim speeds measured over the course of 6-minute intervals.
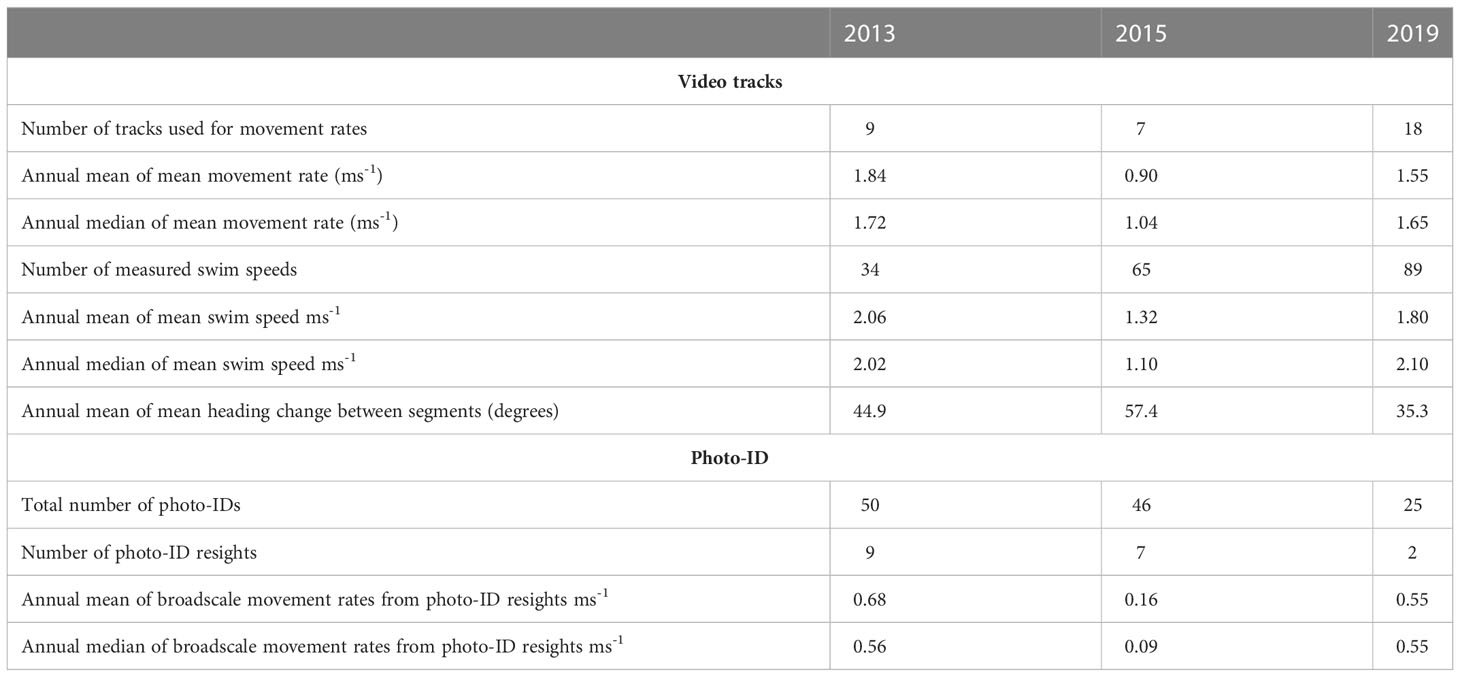
Table 3 Summary of information from video tracking and photo-ID.
There were significant differences between years in the mean of the movement rates for each track (Anova, p=0.01) and the mean heading change between segments for each track (Anova, p=0.007). The differences between the mean swim speeds followed a similar pattern but were not significantly different between years (Anova, p=0.06). The larger differences seen between years for the movement rates compared to the swim speeds could be explained by relatively consistent swim speeds through the water, but higher rates of turning when movement rates were lower. Swim speeds varied between 0.01 and 4.15 ms-1. 2015 stands out for low movement rates and high rates of turning.
3.1.3 Blow rates
Excluding dives of longer than 900 s from the analysis (on the basis that they were likely due to a missed bout of surfacings) resulted in the removal of 11 dives (0.6% of the total).
Based on the fitted distributions to the log(interval) data (Figure 3), the mean short dive was 17.6 s (95% CI 7-42 s) and mean long dive was 189.3 s (95% CI 43-674s). The median for short dives was 18 s. The ratio from the fitted normal distributions gave b=3.37 short dives to each long dive. Thus an average of 4.37 dives would occur over an average time period of 248.6 s (3.37x17.6 + 189.3). Therefore mean dive time for all the observations would be 56.9 s (63.2 blows per hour) based on the fitted distributions. The minimum of the combined distributions of short and long blow intervals (Figure 3) occurred at an interval of 58.9 s. This was so close to one minute that an interval of greater than 60 s was chosen to define a long dive (which also matches the definition of Lagerquist et al. (2000)).
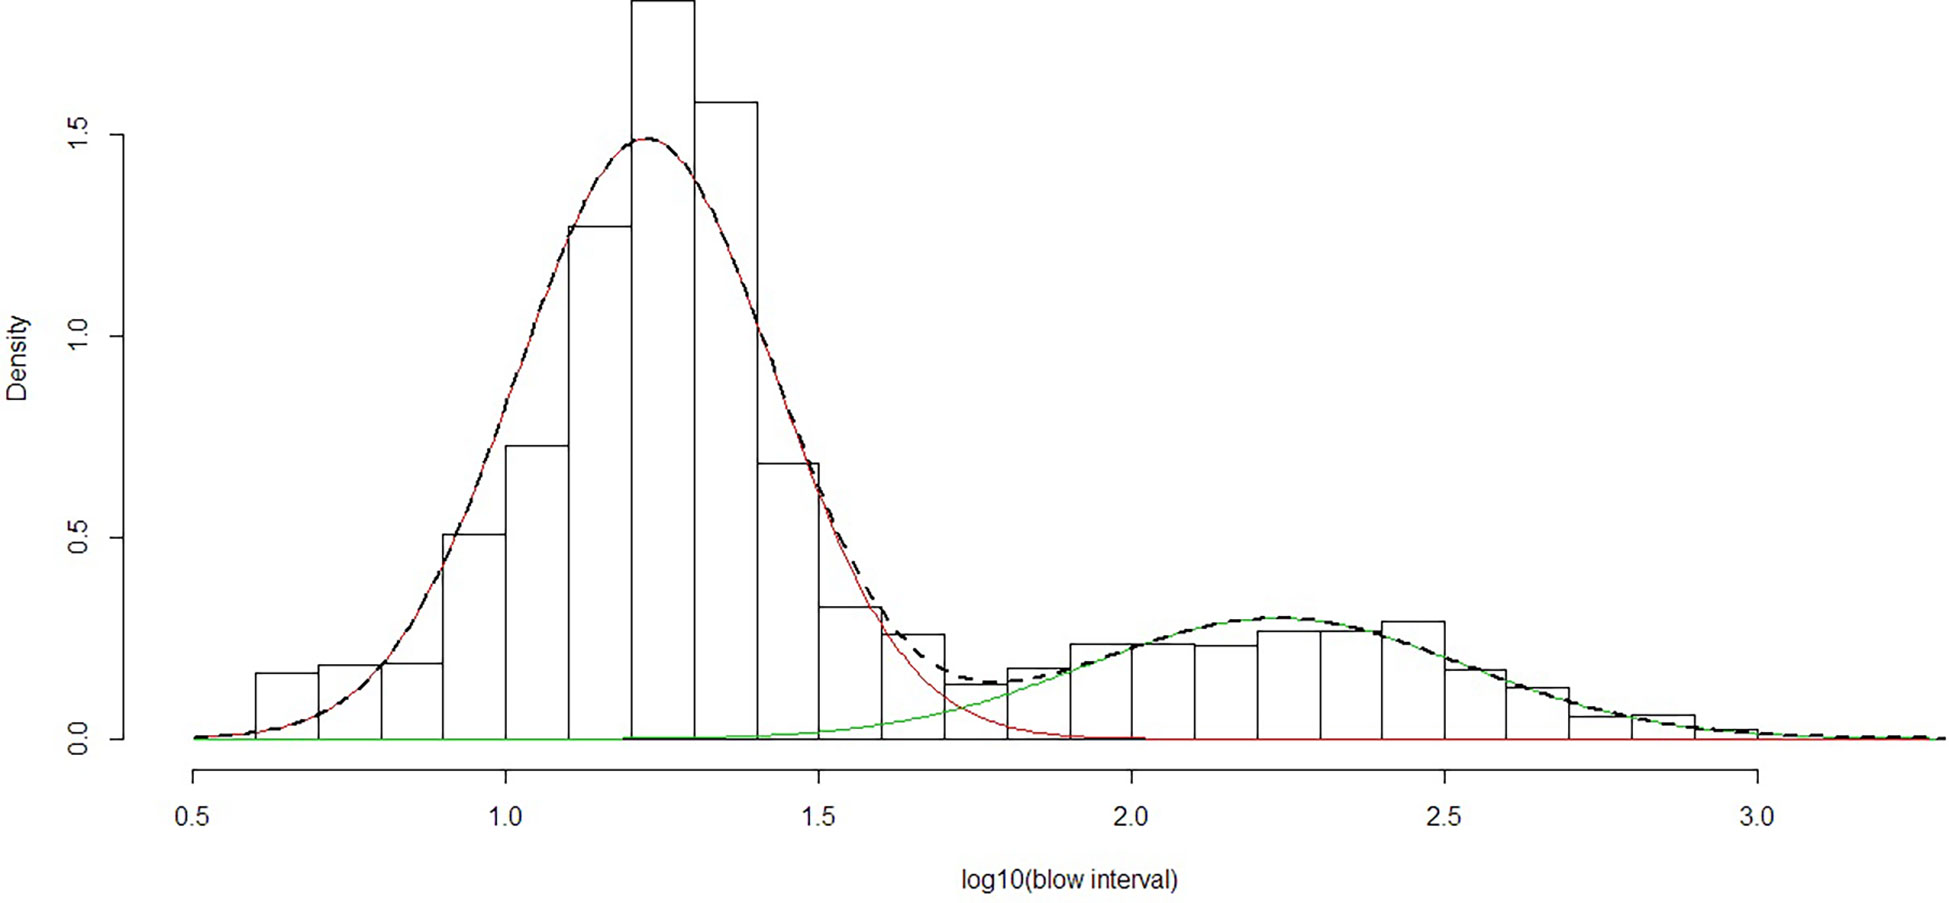
Figure 3 Mixed fit of normal distributions to log(10) of observed blow intervals using data from 2013, 2015 and 2019. The line indicates the fitted combination of two normal distributions representing ‘short’ (red) and ‘long’ (green) dives.
If a long dive is defined as more than 60 s, then for groups comprising only one animal in 2019, there were 64 occasions when, in a bout of short dives followed by a long dive, all the blows could be accurately counted. The number of blows between long dives ranged from 1-13 (mean = 4.3, sd = 2.59). This mean number of blows for groups comprising one animal was very similar to the overall mean for all data from the fitted distributions of 4.37 blows per bout.
Long dives separated by a single surfacing were observed on several occasions. For example, out of 118 long dives by groups comprising only one animal, 22 (19%) were reported as separated by just a single blow, although it is possible that some blows were missed. For these successive pairs of long dives, the average total dive time for the two dives combined was 325 s (range of 123 – 714; sd = 84 s). Over the total period of time where groups comprising one animal were tracked (13 tracks, 5.86 hours), there were 350 blows, corresponding to a mean rate of 59.7 blows per hour. This resulted in an estimated mean blow interval of 60.3 s.
3.2 Movements based on intra-season photo-ID recaptures
The total number of photo-identified blue whales in 2013 was 50 individuals, in 2015 it was 46, and in 2019 it was 25. The potential for photo-ID recaptures within each voyage was dependent on the movements of the research vessel. There were nine individuals in intra-season matches in 2013, seven in 2015 and two in 2019 (Table 3). Of these, just one individual was sighted on more than two occasions, on three separate days (in 2015).
Based on the straight-line distances between capture and recapture locations, the fastest broadscale movement rate observed from photo-ID was 1.13 ms-1 over a distance of 77.4 km (Table 4). Amongst the 18 individuals resighted, three individuals (following similar trajectories) were seen at an average minimum distance of 1100 km from their first sightings and were recaptured together in the same group. These three individuals had a broadscale movement rate of 0.53 ms-1 (Figure 4) and all remained north of 65oS. In the recapture sighting, the three were part a group of five individuals. Another two individuals were resighted together three times over two days, eventually 78 km from their first sightings. Six further individuals remained within the same small area. This suggests that coherent movements of Antarctic blue whales on the feeding grounds may be common (i.e. 11 out of 18 individuals observed in this study showed coherent movements).
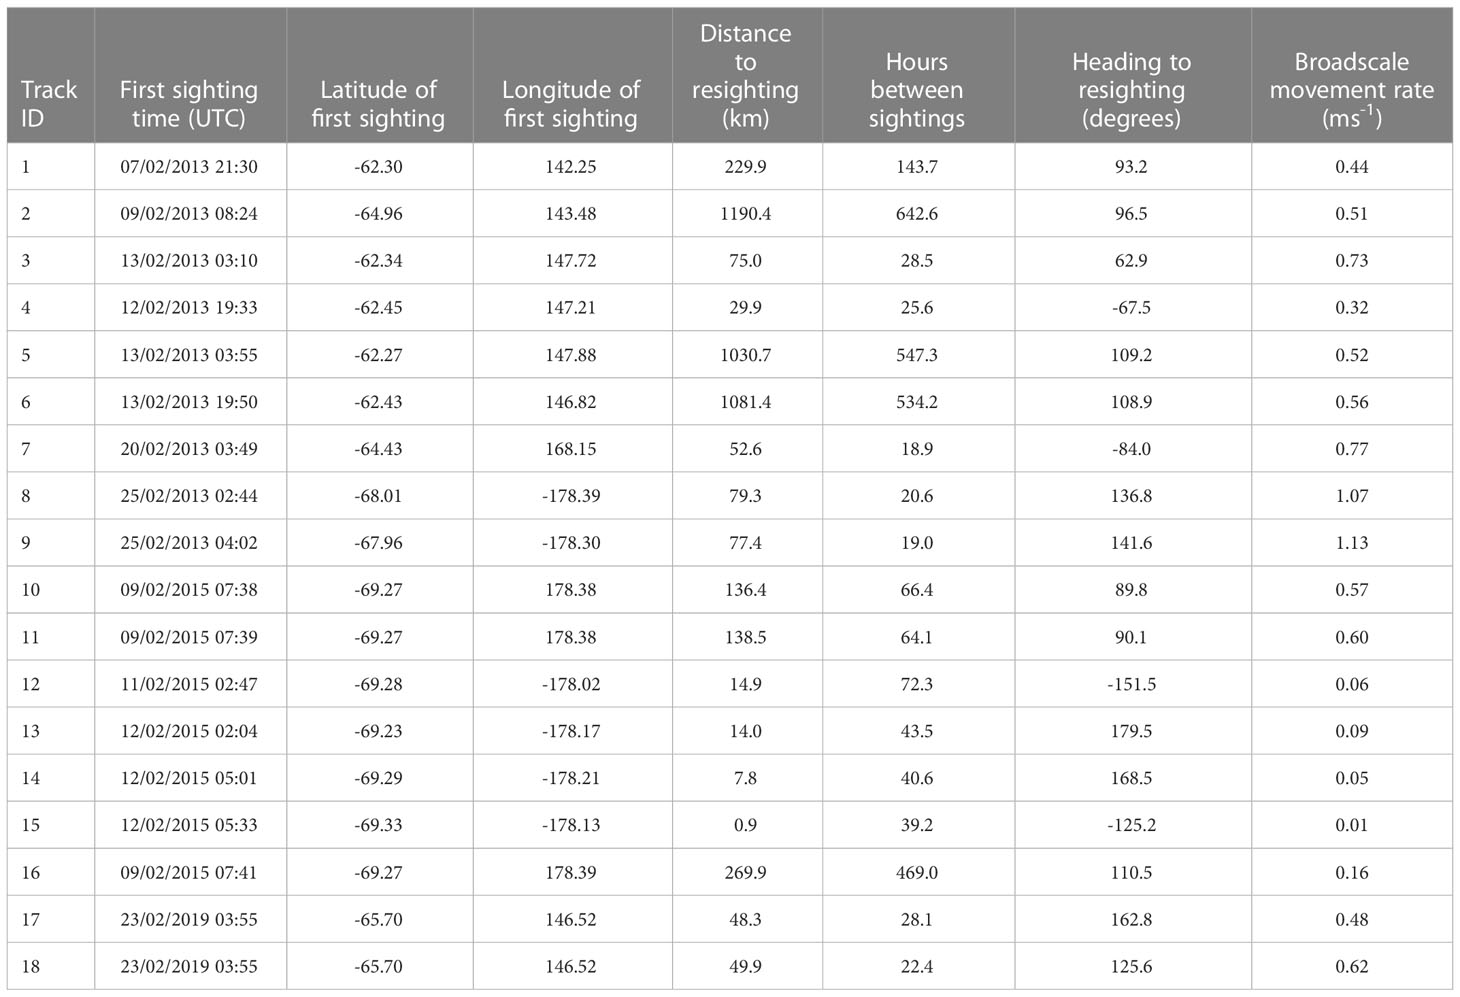
Table 4 Intra-season resights of known individuals from photo-ID.
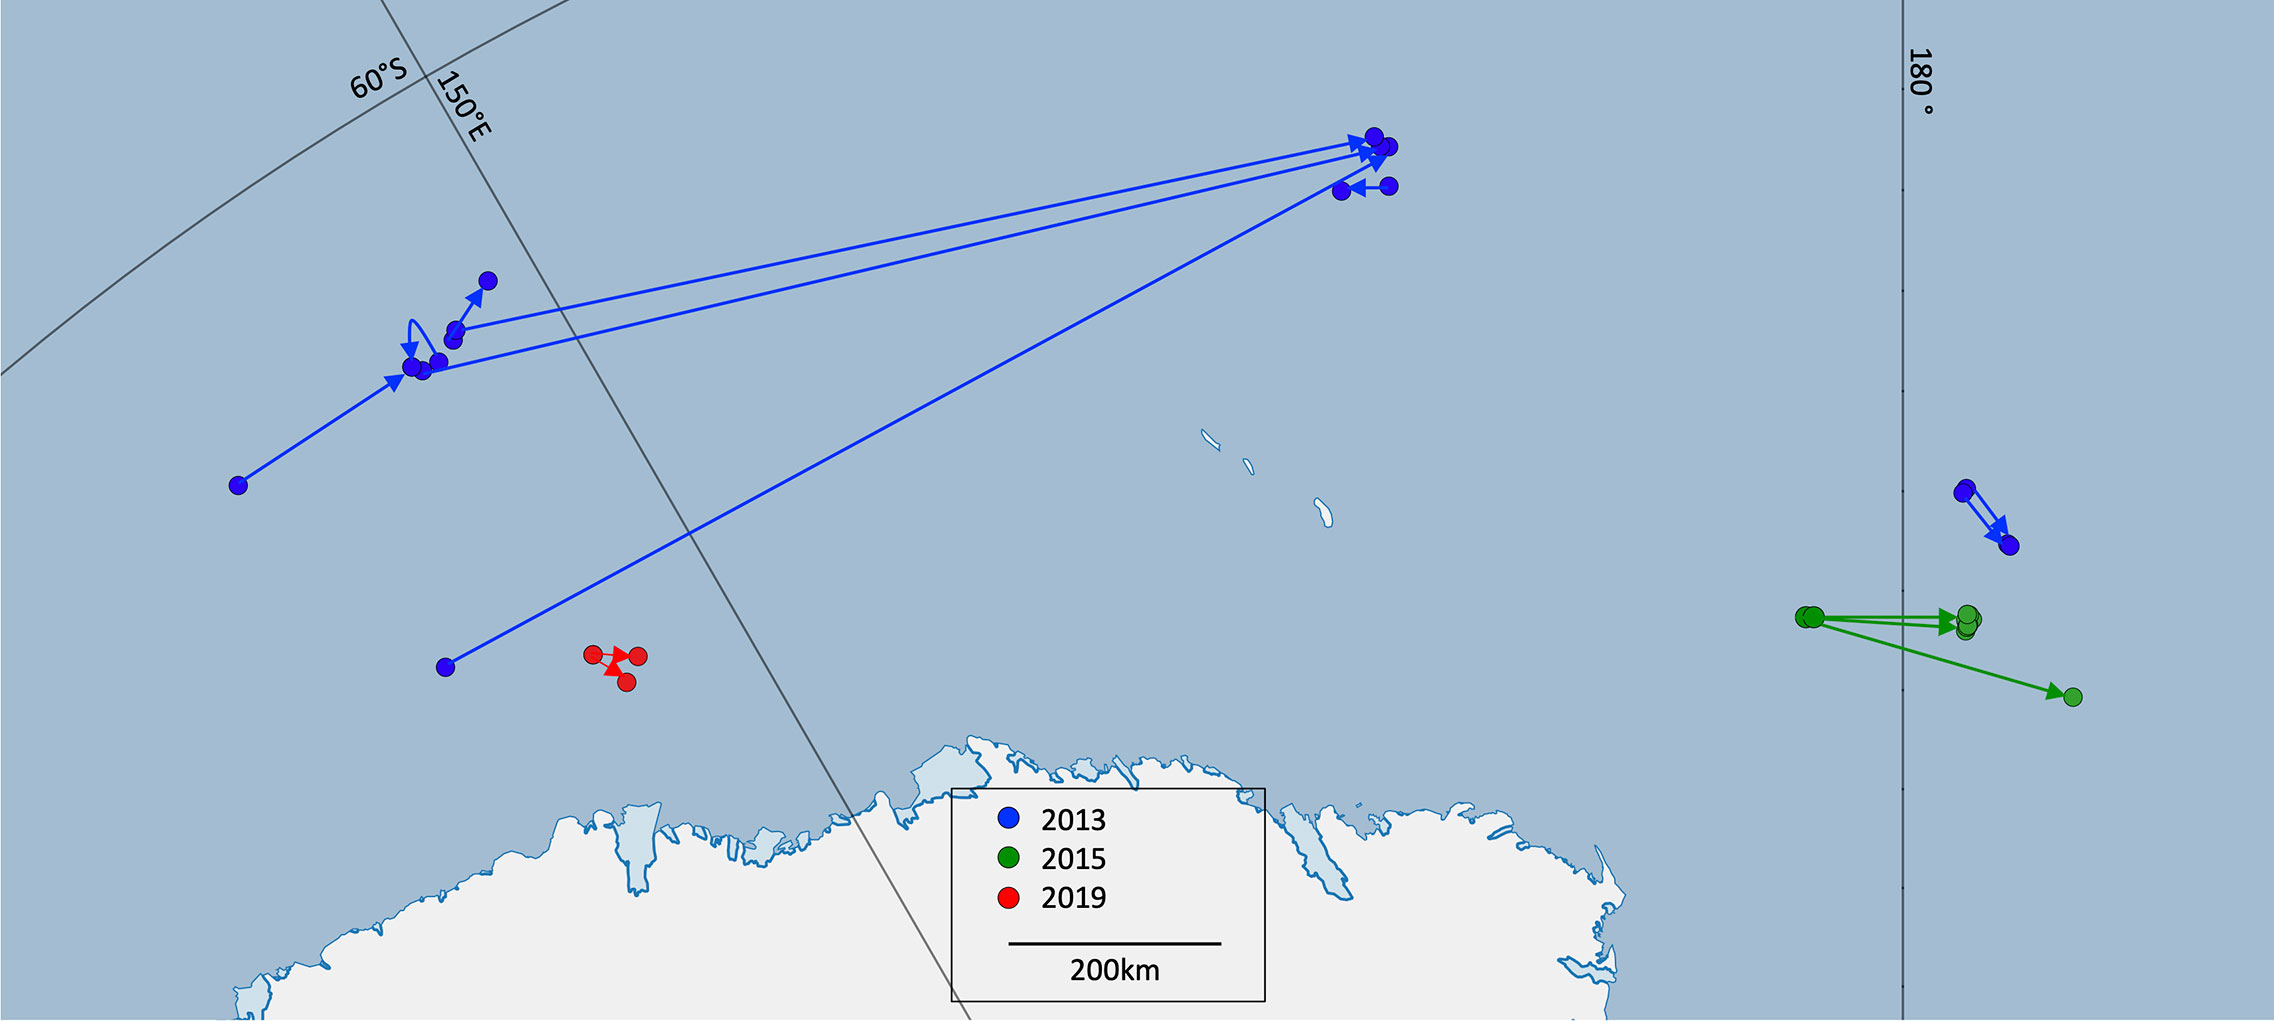
Figure 4 Capture and recapture locations of photo-identified whales in 2013 (blue), 2015 (green) and 2019 (red). In 2015 the capture and recapture locations of four whales appear clustered together due to the relatively short distances between locations. (Lines connect the locations and do not necessarily represent whale movement).
The same patterns of broadscale movement rates by year were apparent from the photo-ID resightings as from the movement rates from the video tracks. Four whales were resighted in 2015 within 15km of their original sighting locations between 39 and 72 hours later, with a broadscale movement rate of 0.05 ms-1.
4 Discussion
This study presents data on fine-scale movements of Antarctic blue whales, including swim speeds and blow rates, and broadscale movements of identified whales within a season. The overall pattern of all blue whale dives (not only of Antarctic blue whales) can be summarised by a sequence of short dives followed by a long dive. The length of short dives appears consistent over time and between areas, with a distinct peak in occurrence of intervals of around 18 s. For example, the observed values in this study for short dives are very similar to the equivalent dive times of blue whales observed off Sri Lanka (17.6 s) (de Vos et al., 2013). This may indicate a swimming gait associated with breathing that is common across blue whale subspecies and populations.
Long dives are much more variable and differ between activities and areas. For example, New Zealand blue whale long dives are relatively short (170s ± 16.2s SE) (Torres et al., 2020), compared to 640 s off Sri Lanka (de Vos et al., 2013). Studies of blue whale dives off California reported average long dives of 252 s to 432 s (Lagerquist et al., 2000). These differences are consistent with short dives being optimised for respiration and long dives being in response to the nature and location of prey, and support previous studies (Lagerquist et al., 2000) that a dive time of over 60 s is a useful definition of a long dive. That study found that 72% of blue whale dives off California were less than 60 s long. This is an equivalent ratio of 2.6 short dives to each long dive, which is a little lower than for Antarctic blue whales in this study (3.76). Unlike off Sri Lanka where long dives were never observed with just a single surfacing between them (de Vos et al., 2013), this was observed on several occasions in this study.
An estimate of average Antarctic blue whale surfacing rates has been calculated using two different methods (59.7 and 63.2 blows an hour). The model of patterns of short and long dives could be used with models to estimate g(0) for single platform or opportunistic visual surveys. The mean blow interval is rather lower than that estimated off Sri Lanka (84.7s sd 11.17) by de Vos et al. (2013), mainly due to the much shorter ‘long’ dives for Antarctic blue whales. de Vos et al (2013) used a Monte Carlo model-based method to adjust for the fact that most whales in their study were lost after a long dive (i.e. the last long dive of a sequence was not included). This was not the case for this study where the tracking usually ended when the vessel made a close approach for photo-ID, and it was likely that when a long dive occurred the whale would usually be resighted.
If blows were missed, particularly the first blow after a long dive, then the estimate of number of blows per hour would be negatively biased. This certainly did happen, but during focal follows there were usually several observers monitoring the full 360° around the vessel, so this was likely a rare occurrence for the tracks included in the analysis. For observational studies there may be occasions when a full bout of surfacings between long dives is missed. Thus the longest observed intervals may be due to observational error.
Estimates of blue whale swimming speeds from the video tracking dataset were highly variable. The maximum reliable video track-derived swimming speed estimate was 4.15 ms-1 over a period of 217 s, but blue whales are known to be capable of much faster speeds, upwards of 10 ms-1 (Sears and Perrin, 2009). In comparison, satellite tagged Antarctic blue whales swam at an overall movement rate of 1.2 ± 0.8 ms-1 (median speed: 1.0 ms-1), with faster rates for transit-like movement (1.4 ± 0.9 ms-1; median: 1.2 ms-1) and slower rates during area restricted search (ARS)-like movement (0.8 ± 0.6 ms-1; median: 0.7 ms-1, which is often considered as a proxy for foraging, but also resting and nursing (Andrews-Goff et al, 2022). The maximum movement rate derived from the satellite tracking data was 5.1 ms-1. Estimates of mean Antarctic blue whale swimming speeds and movement rates derived from both the video tracking dataset and satellite tag derived data are distinctly faster than comparable estimates for other blue whale populations (Table 5).
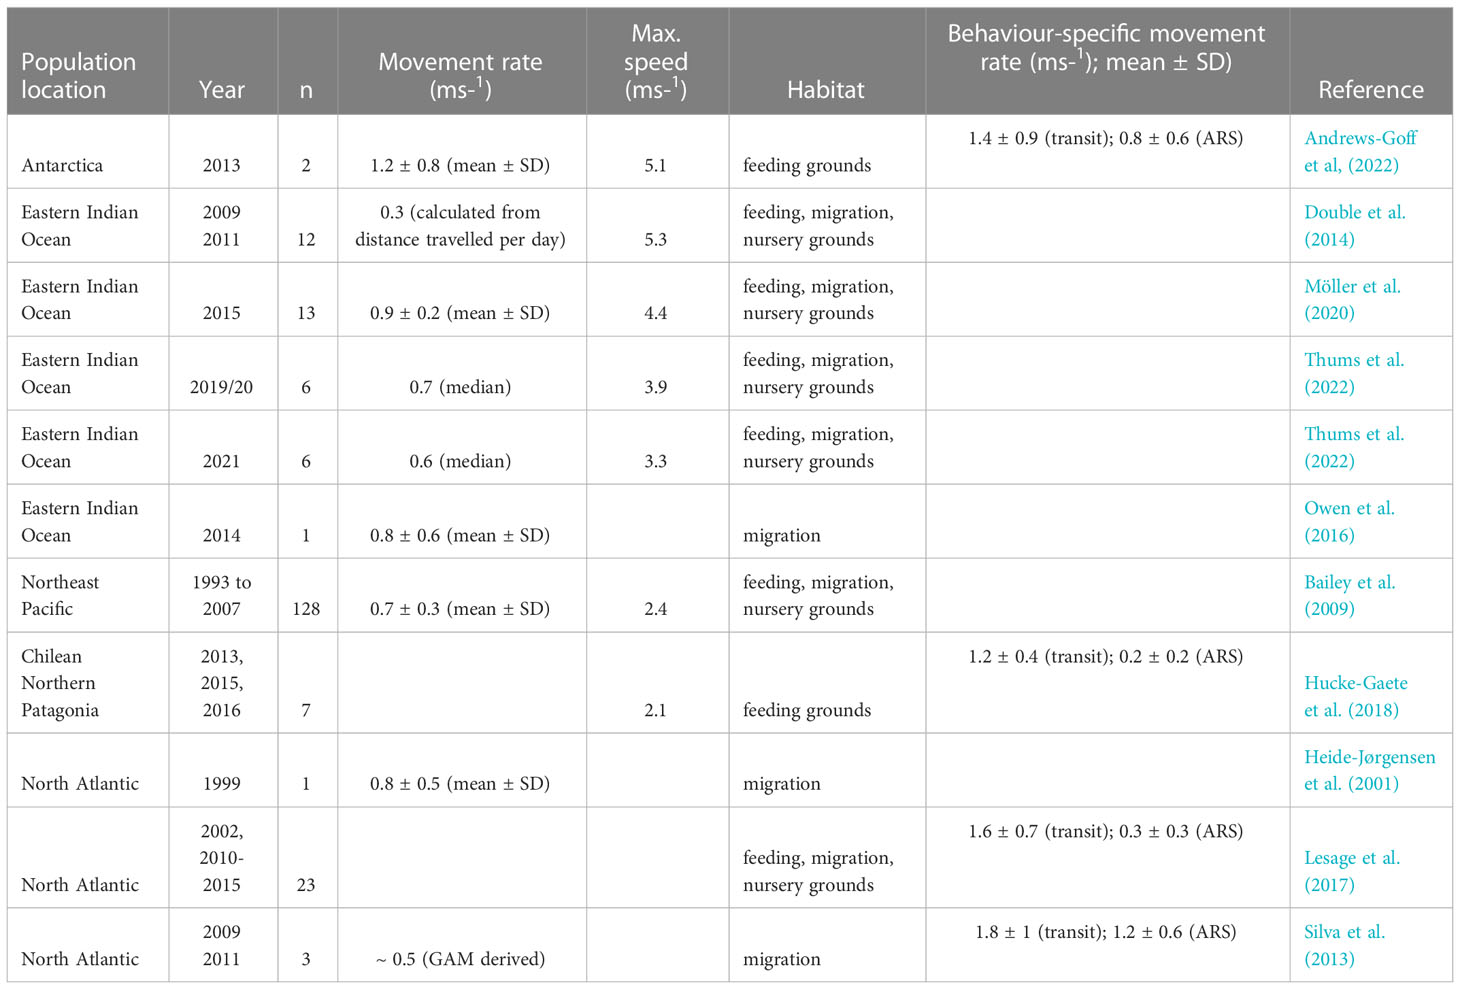
Table 5 Blue whale swim speeds and movement rates from satellite telemetry.
Whilst large-scale movements of Antarctic blue whales are not well-documented, there is assumed to be some annual migratory movement between austral summer Antarctic feeding grounds and mid-latitude locations in winter (Branch et al., 2007). To date, satellite tags have been deployed on just two Antarctic blue whales, in a study by Andrews-Goff et al (2022). These tag data demonstrate that it is possible for Antarctic blue whales to travel large distances when on their feeding grounds – 96 ± 43 km daily (mean ± SD) – a scale of movement greater than has been measured in other blue whale populations. The large tagging datasets of Eastern Indian Ocean stock (EIO) pygmy blue whales [n = 22; (Thums et al., 2022)] and the Northeast Pacific (NP) blue whale population (n = 128; (Bailey et al., 2009)), including movement on feeding and calving grounds, indicate movement rates of approximately 70 km per day for EIO pygmy blue whales and approximately 65 km per day for NP blue whales (Table 5).
Large-scale movements were also recorded in the intra-seasonal recaptures of the Discovery marking program which was conducted during Antarctic whaling operations in the early part of the 20th century (Branch et al., 2007). Marked metal tubes were fired into whales, and sometimes recovered by whaling operations. 54 marks were recovered in the same season in which the individual blue whales had been marked. Distances and time intervals between mark and recapture varied widely, from 32-3516 km and from 1-114 days (Appendix 4, Branch et al., 2007).
Satellite tag derived datasets are often analysed to distinguish transit-like movement, which may include travel between foraging patches or migratory pathways, and is associated with relatively straight movement paths and faster travel speeds, from ARS-like movement, where travel speed has slowed and turning angles have increased (Kareiva and Odell, 1987; Bailey et al., 2009; Möller et al., 2020; Thums et al., 2022). For the Antarctic blue whale satellite tracking data, mean transit and ARS movement rates fall within the range of transit and ARS movement rates seen across blue whale populations (Table 5). Video tracking data may provide additional insight into ARS movement detected via analysis of satellite tracking datasets. The video tracking data analysed here revealed that slower movement rates appeared to be related to tracks with more turns, suggesting that swim speed through the water is more consistent than overall travel rate, i.e. slower travel is a result of turning more frequently rather than swimming slower. Additionally, speeds measured over the course of around an hour were, on average, 83 % of speeds measured over the course of 6 minutes, suggesting that measures of speed over shorter intervals may be biased towards faster speeds. This can help inform comparisons of horizontal speed measurements from studies with different intervals between observation locations, such as telemetry studies which rely on satellite passes to generate an irregular time series.
The general movement or ‘flux’ of whales through an area is relevant to studies of prey consumption and other ecological impacts such as iron fertilisation. In addition, it can have a large influence on the resighting probability of individuals from photo-ID. The overall mean movement for all whales in 2019 of 0.88 ms-1 suggests a high net ‘flux’ of whales through the study area. In comparison the higher rate of heading changes observed in 2015, resulting in lower movement rates suggests a low net ‘flux’ of whales through the area. There are no concurrent krill data available for the 2013 voyage, but in 2015 and 2019 the core study areas differed from each other in the characteristics of the krill swarms (Miller et al., 2019; Double et al., 2021). The concentrated area of Antarctic blue whale distribution encountered at the entrance to the Ross Sea in 2013 (and also on the 2017 Antarctic Circumnavigation Expedition (Miller et al., 2017), for which there are neither krill nor photogrammetric data) may have had krill characteristics similar to those favoured by blue whales in that same area in 2015. Slower swim speeds and greater headings changes were observed in 2015 (e.g. ARS) compared to faster speeds and an overall movement through the 2019 study area. Photo-ID also showed whales remaining for several days with little overall movement within the 2015 study area. The direction of travel of the overall movement in 2019 was directly towards the area of Antarctic blue whale concentrations at the entrance to the Ross Sea observed in previous years. The bearing to these concentrations was 120o at a distance of 1600km compared to a median observed heading of 118.5o. The mean speed of 1.55 ms-1 from 2019 is at the top end of mean movement rates observed from satellite telemetry. Even allowing for higher speeds due to being averaged over a shorter time, the speeds of whales through the area would appear to be comparable to those assumed to in transit. The results from the video tracks show that the simple behavioural observations during this study can help understand blue whale movements and feeding ecology. The movement through the area rather than persistent concentrations of whales would be consistent with the lack of spatial relationship between whale presence and surface ocean iron concentrations observed in the 2019 survey area (Smith et al., 2021).
Although any inferences of movement from photo-ID matches are influenced by the track of the research vessel (i.e. the opportunities to resight whales only occur where the vessel is), the data do also indicate the same qualitative patterns, with slow overall movement speeds in 2015 compared to 2019. The movement of whales through the 2019 study area explains the low number of intra-season photo-ID matches. Most of the 2019 study area, and the western portion of the 2013 study area are located south of the eastern Indian Ocean (the eastern Indian Ocean defined by the longitudinal meridians of 70 °E and 146.49°E). When examining inter-seasonal recapture data, Olson et al. (2022) found that only 20 % of the whales marked in the eastern Indian Ocean sector were recaptured there, as opposed to the three other ocean basin sectors with recapture rates of 50-79 %. This suggests that the eastern Indian Ocean sector may be a region through which blue whales generally transit rather swiftly. In addition to the differences in overall movement between years demonstrated by both the photogrammetric and photo-ID data, with whales in 2019 heading directly towards the area of Antarctic blue whale concentrations at the entrance to the Ross Sea observed in previous years, data also show a high proportion of resighted whales with coherent movements. This suggests that Antarctic blue whales might travel together, at least over periods of several days or sometimes up to a month, with possible implications for group behaviour dynamics which are currently poorly understood.
5 Conclusions
This study estimated surfacing rates, swim speeds, and movement rates of Antarctic blue whales from photogrammetric and photo-ID measurements made over the course of three Antarctic voyages.
Estimates of surfacing intervals of short dives of Antarctic blue whales were consistent across all voyages and were similar to those measured from other blue whale populations, whilst estimates of long dives yielded intervals which were shorter than those estimated from other populations. These estimates of mean overall surfacing intervals of Antarctic blue whales on their feeding grounds provide cue rates for studies which employ cue-counting for estimating abundance; patterns of short and long dives could be used to estimate g(0) for single platform visual surveys.
Estimates of movement rates on their high-latitude feeding grounds demonstrate that Antarctic blue whales have the highest movement rate of all blue whale populations measured to date. These are consistent with movement rates estimated from satellite telemetry of two individual Antarctic blue whales in 2013 (Andrews-Goff et al, 2022). The broadscale movements indicated by photographic re-sightings also suggest some coordinated movements across multiple individuals.
In this study, significantly different mean movement rates and directions of travel were observed across the three different voyages. These differences may be indicative of different behavioural states, namely transit vs. area restricted search. Further, we hypothesise that these differences were driven by differences in environmental conditions, namely distribution of prey, and that future studies should aim to test this hypothesis.
Our findings increase our understanding of Antarctic blue whale fine-scale movements and behaviour, and may assist with the interpretation of datasets such as visual surveys, acoustic studies, ecosystem research, and assessments of human impacts. They may also inform how the different behavioural states of Antarctic blue whales may be driven by distribution of prey, and thus their role in the Antarctic ecosystem.
Data availability statement
The datasets presented in this study can be found in online repositories. The names of the repository/repositories and accession number(s) can be found below: SC, RL, BM and MD (2014) Photogrammetric video tracks of Antarctic blue whale movements recorded during the 2013 Antarctic Blue Whale Voyage, Ver. 1, Australian Antarctic Data Centre - doi:10.4225/15/59d6fd7185a29 SC, RL, BM and MD (2017) Photogrammetric video tracks of Antarctic blue whale movements recorded during the 2015 NZ Australia Antarctic Ecosystems Voyage, Ver. 1, Australian Antarctic Data Centre - doi:10.4225/15/59d2d94589980 SC, RL and BM (2022) Photogrammetric video tracks of whale movements recorded during the 2019 ENRICH Voyage, Ver. 1, Australian Antarctic Data Centre - doi:10.26179/tcbe-4h63.
Ethics statement
The animal study was reviewed and approved by the Australian Antarctic Ethics Committee (under Australian Antarctic Science Project 4102) and complied with all relevant permits including the Australian Government Environment Protection and Biodiversity Conservation Act Cetacean Permit (C12-0006, 2017-004).
Author contributions
All authors contributed to conception and design of the study. SC, RL, BM, VA-G, PO wrote specific sections of the manusript. SC, RL collected the photogrammetric data. SC, RL, BM, PO, MR performed the analysis. All authors contributed to the article and approved the submitted version.
Acknowledgments
It is a pleasure to acknowledge the input and assistance of the voyage leaders, scientists, support staff, vessel crew and management on the three voyages during which our data were collected: Amaltal Explorer (2013), Tangaroa (2015), and RV Investigator (2019; (IN2019_V01)). We thank the Australian Antarctic Division, CSIRO Marine National Facility, New Zealand’s National Institute of Water & Atmospheric Research, Antarctica New Zealand, the New Zealand Ministry for Business, Innovation and Employment, and the International Whaling Commission Southern Ocean Research Partnership for funding and logistical support. Thank you to all those who have contributed photographs to the Antarctic Blue Whale Catalogue. We are grateful to Simon Wotherspoon for analytical advice. Thank you to Trevor Joyce and to the reviewers for their constructive comments.
Conflict of interest
The authors declare that the research was conducted in the absence of any commercial or financial relationships that could be construed as a potential conflict of interest.
Publisher’s note
All claims expressed in this article are solely those of the authors and do not necessarily represent those of their affiliated organizations, or those of the publisher, the editors and the reviewers. Any product that may be evaluated in this article, or claim that may be made by its manufacturer, is not guaranteed or endorsed by the publisher.
References
Agostinelli C., Lund U. (2017) R package 'circular': Circular statistics. Available at: https://r-forge.r-project.org/projects/circular/.
Andrews-Goff V., Bell E. M., Miller B. S., Wotherspoon S. J., Double M. C. (2022). Satellite tag derived data from two Antarctic blue whales (Balaenoptera musculus intermedia) tagged in the east Antarctic sector of the southern ocean. Biodiversity Data J 10, e94228. doi: 10.3897/BDJ.10.e94228
Bailey H., Mate B. R., Palacios D. M., Irvine L., Bograd S. J., Costa D. P. (2009). Behavioural estimation of blue whale movements in the northeast pacific from state-space model analysis of satellite tracks. Endangered Species Res. 10, 93–106. doi: 10.3354/esr00239
Branch T. A., Stafford K. M., Palacios D. M., Allison C., Bannister J. L., Burton C. L. K., et al. (2007). Past and present distribution, densities and movements of blue whales in the southern hemisphere and northern Indian ocean. Mammal Rev. 37 (2), 116–175. doi: 10.1111/j.1365-2907.2007.00106.x
Calderan S., Leaper R. C., Miller B. S. (2022). Photogrammetric video tracks of whale movements recorded during the 2019 ENRICH voyage (AADC: Australian Antarctic Data Centre). doi: 10.26179/tcbe-4h63
Calderan S., Leaper R. C., Miller B. S., Double M. (2014). Photogrammetric video tracks of Antarctic blue whale movements recorded during the 2013 Antarctic blue whale voyage (Australian Antarctic Data Centre). Available at: https://researchdata.edu.au/photogrammetric-video-tracks-whale-voyage. doi: 10.4225/15/59d6fd7185a29
Calderan S., Leaper R. C., Miller B. S., Double M. (2017). Photogrammetric video tracks of Antarctic blue whale movements recorded during the 2015 NZ Australia Antarctic ecosystems voyage (Australian Antarctic Data Centre). Available at: https://researchdata.edu.au/photogrammetric-video-tracks-ecosystems-voyage. doi: 10.4225/15/59d2d94589980
Cooke J. G. (2018). “Balaenoptera musculus ssp. intermedia,” in The IUCN red list of threatened species 2018. Available at: https://www.iucnredlist.org/species/41713/50226962.
Crance J. L., Berchok C. L., Keating J. L. (2017). Gunshot call production by the north pacific right whale eubalaena japonica in the southeastern Bering Sea. Endangered Species Res. 34, 251–267. doi: 10.3354/esr00848
Croll D. A., Acevedo-Gutierrez A., Tershy B. R., Urban-Ramýrez J. (2001). The diving behavior of blue and fin whales: is dive duration shorter than expected based on oxygen stores? Comp. Biochem. Physiol. Part A 129, 797–809. doi: 10.1016/S1095-6433(01)00348-8
DeRuiter S. L., Langrock R., Skirbutas T., Goldbogen J. A., Calambokidis J., Friedlaender A. S., et al. (2017). A multivariate mixed hidden Markov model for blue whale behaviour and responses to sound exposure. Ann. Appl. Stat 11 (1), 362–392. doi: 10.1214/16-AOAS1008
de Vos A., Christiansen F., Harcourt R. G., Pattiaratchi C. B. (2013). Surfacing characteristics and diving behaviour of blue whales in Sri Lankan waters. J. Exp. Mar. Biol. Ecol. 449, 149–153. doi: 10.1016/j.jembe.2013.09.010
Double M. C., Andrews-Goff V., Jenner K. C. S., Jenner M. N., Laverick S. M. (2014). Migratory movements of pygmy blue whales (Balaenoptera musculus brevicauda) between Australia and Indonesia as revealed by satellite telemetry. PloS One 9 (4), e93578. doi: 10.1371/journal.pone.0093578
Double M. C., Barlow J., Miller B. S., Olson P., Andrews-Goff V., Leaper R., et al. (2013). Cruise report of the 2013 Antarctic blue whale voyage of the southern ocean research partnership. In Paper SC/65a/SH/21 presented to IWC Scientific Committee. Available from the International Whaling Commission (http://iwc.int).
Double M. C., Bell E., Miller B., Kelly N., Kawaguchi S., Lawrence J., et al. (2021). “ENRICH voyage report, IN2019_V01: The availability of Antarctic krill to large predators and their role in biogeochemical recycling in the southern ocean,” in Paper SC/68c/SH19 presented to IWC Scientific Committee. Available from the International Whaling Commission (http://iwc.int).
Double M. C., Miller B. S., Leaper R., Olson P., Cox M. J., Miller E., et al. (2015). “Cruise report on blue whale research from the NZ/Aus Antarctic ecosystems voyage 2015 of the southern ocean research partnership,” in Paper SC/66a/SH07 presented to the IWC Scientific Committee, San Diego, California. Available from the International Whaling Commission (http://iwc.int).
Dunlop R. A., Noad M. J., McCauley R. D., Kniest E., Slade R., Paton D., et al. (2016). Response of humpback whales (Megaptera novaeangliae) to ramp-up of a small experimental air gun array. Mar. pollut. Bull. 103 (1), 72–83. doi: 10.1016/j.marpolbul.2015.12.044
Gendron D., Ugalde de la Cruz A. (2012). A new classification method to simplify blue whale photo-identification technique. J. Cetacean Res. Manage 12 (1), 79–84.
Heide-Jørgensen M. P., Kleivane L., Øien N., Laidre K. L., Jensen M. V. (2001). A new technique for deploying satellite transmitters on baleen whales: Tracking a blue whale (Balaenoptera musculus) in the north Atlantic. Mar. Mammal Sci. 17 (4), 949–954. doi: 10.1111/j.1748-7692.2001.tb01309.x
Hiby A. R. (1992). Fin whale surfacing rate as a calibration factor for cue-counting abundance estimates Vol. 42 (Cambridge, UK: Reports of the International Whaling Commission), 707–709.
Hucke-Gaete R., Bedriñana-Romano L., Viddi F. A., Ruiz J. E., Torres-Florez J. P., Zerbini A. N. (2018). From Chilean Patagonia to Galapagos, Ecuador: novel insights on blue whale migratory pathways along the Eastern south pacific. PeerJ 6, e4695. doi: 10.7717/peerj.4695
Kareiva P., Odell G. (1987). Swarms of predators exhibit `prey taxis' if individual predators use area-restricted search. Am. Nat. 130 (2), 233–270. doi: 10.1086/284707
Lagerquist B. A., Stafford K. M., Mate B. R. (2000). Dive characteristics of satellite-monitored blue whales ({IBalaenoptera musculus}) off the central California coast. Mar. Mammal Sci. 16 (2), 375–391. doi: 10.1111/j.1748-7692.2000.tb00931.x
Leaper R., Burt L., Gillespie D., MacLeod K. (2010). Comparisons of measured and estimated distances and angles from sighting surveys. J. Cetacean Res. Manage. 11 (3), 229–238.
Leaper R., Calderan S., Cooke J. (2015). A simulation framework to evaluate the efficiency of using visual observers to reduce the risk of injury from loud sound sources. Aquat. Mammals 41, 375–387. doi: 10.1578/AM.41.4.2015.375
Leaper R., Gordon J. (2001). Application of photogrammetric methods for locating and tracking cetacean movements at sea. J. Cetacean Res. Manage. 3 (2), 131–141.
Lesage V., Gavrilchuk K., Andrews R. D., Sears R. (2017). Foraging areas, migratory movements and winter destinations of blue whales from the western north Atlantic. Endangered Species Res. 34, 27–43. doi: 10.3354/esr00838
Lomac-MacNair K., Smultea M. A. (2016). Blue whale (Balaenoptera musculus) behavior and group dynamics as observed from an aircraft off southern California. Anim. Behav. Cogn. 3 (1), 1–21. doi: 10.12966/abc.02.01.2016
Möller L. M., Attard C. R. M., Bilgmann K., Andrews-Goff V., Jonsen I. D., Paton D. A., et al. (2020). Movements and behaviour of blue whales satellite tagged in an Australian upwelling system. Sci. Rep. 10(1), 1–19. doi: 10.1038/s41598-020-78143-2
Miller B. S., Barlow J., Calderan S., Collins K., Leaper R., Olson P., et al. (2015). Validating the reliability of passive acoustic localisation: a novel method for encountering rare and remote Antarctic blue whales. Endangered Species Res. 26 (3), 257–269. doi: 10.3354/esr00642
Miller B. S., Leaper R., Calderan S., Gedamke J. (2014). Red shift, blue shift: Investigating doppler shifts, blubber thickness, and migration as explanations of seasonal variation in the tonality of Antarctic blue whale song. PloS One 9 (9), e107740. doi: 10.1371/journal.pone.0107740
Miller B. S., Miller E., Calderan S., Leaper R., Stafford K., Širović A., et al. (2017). “Circumpolar acoustic mapping of endangered southern ocean whales: Voyage report and preliminary results for the 2016/17 Antarctic circumnavigation expedition,” in Paper SC/67a/SH/03 presented to the IWC Scientific Committee, Bled, Slovenia. Available from the International Whaling Commission (http://iwc.int).
Miller E. J., Potts J. M., Cox M. J., Miller B. S., Calderan S., Leaper R., et al. (2019). The characteristics of krill swarms in relation to aggregating Antarctic blue whales. Sci. Rep. 9 (1), 16487. doi: 10.1038/s41598-019-52792-4
Oleson E. M., Calambokidis J., Burgess W. C., McDonald M. A., LeDuc C. A., Hildebrand J. A. (2007). Behavioural context of call production by eastern north pacific blue whales. Mar. Ecol. Prog. Ser. 330, 269–284. doi: 10.3354/meps330269
Olson P. A., Andrews-Goff V., Double M., Matsuoka K., Pastene L. A. (2022). “Movements of Antarctic blue whales derived from discovery tag, photo-ID, and satellite tag data,” in Paper SC/68D/SH/09 presented to IWC Scientific Committee. Available from the International Whaling Commission (http://iwc.int).
Olson P. A., Double M., Matsuoka K., Pastene L. A., Findlay K. (2020). “The Antarctic blue whale catalogue: new data from 2015-2019,” in Paper SC/68b/PH04 presented to IWC Scientific Committee. Available from the International Whaling Commission (http://iwc.int).
Olson P. A., Galletti Vernazzani B., Torres Florez J. P. (2021). “Southern hemisphere blue whale catalogue photo quality coding guide,” in Paper SC/68C/PH02 presented to IWC Scientific Committee. Available from the International Whaling Commission (http://iwc.int).
Owen K., Jenner C. S., Jenner M.-N. M., Andrews R. D. (2016). A week in the life of a pygmy blue whale: migratory dive depth overlaps with large vessel drafts. Anim. Biotelemetry 4 (1), 17. doi: 10.1186/s40317-016-0109-4
Pirotta E., Booth C. G., Calambokidis J., Costa D. P., Fahlbusch J. A., Friedlaender A. S., et al. (2022). From individual responses to population effects: Integrating a decade of multidisciplinary research on blue whales and sonar. Anim. Conserv 25 (6), 796–810. doi: 10.1111/acv.12785
Quick N. J., Rendell L. E., Janik V. M. (2008). Note: A mobile acoustic localization system for the study of free-ranging dolphins during focal follows. Mar. Mammal Sci. 24 (4), 979–989. doi: 10.1111/j.1748-7692.2008.00231.x
R Core Team (2021). R: A language and environment for statistical computing (Vienna, Austria: R Foundation for Statistical Computing). Available at: https://www.R-project.org/.
Schall E., Thomisch K., Boebel O., Gerlach G., Spiesecke S., Van Opzeeland I. (2020). Large-Scale spatial variabilities in the humpback whale acoustic presence in the Atlantic sector of the southern ocean. R. Soc. Open Sci. 7 (12), 201347. doi: 10.1098/rsos.201347
Sears R., Perrin W. F. (2009) “Blue whale (Balaenoptera musculus),” in Encyclopedia of marine mammals, 2nd ed.Eds. Perrin W. F., Wursig B., Thewissen G. M. (New York, US: Academic Press), 120–124.
Sears R., Williamson J. M., Wenzel F. W., Bérubé M., Gendron D., Jones P. (1990). Photographic identification of the blue whale (Balaenoptera musculus) in the gulf of st. Lawrence, Canada Vol. 12 (New York, US: Reports of the International Whaling Commission), 335–342.
Silva M. A., Prieto R., Jonsen I., Baumgartner M. F., Santos R. S. (2013). North Atlantic blue and fin whales suspend their spring migration to forage in middle latitudes: Building up energy reserves for the journey? PloS One 8 (10), e76507. doi: 10.1371/journal.pone.0076507
Smith A. J. R., Ratnarajah L., Holmes T. M., Wuttig K., Townsend A. T., Westwood K., et al. (2021). Circumpolar deep water and shelf sediments support late summer microbial iron remineralization. Global Biogeochemical Cycles 35 (11), e2020GB006921. doi: 10.1029/2020GB006921
Sumner M. (2021) Traipse: Shared tools for tracking data. Available at: https://CRAN.R-project.org/package=traipse.
Szesciorka A. R., Allen A. N., Calambokidis J., Fahlbusch J., McKenna M. F., Southall B. (2019). A case study of a near vessel strike of a blue whale: Perceptual cues and fine-scale aspects of behavioral avoidance. Front. Mar. Sci. 6. doi: 10.3389/fmars.2019.00761
Thums M., Ferreira L. C., Jenner C., Jenner M., Harris D., Davenport A., et al. (2022). Pygmy blue whale movement, distribution and important areas in the Eastern Indian ocean. Global Ecol. Conserv. 35, e02054. doi: 10.1016/j.gecco.2022.e02054
Torres L. G., Barlow D. R., Chandler T. E., Burnett J. D. (2020). Insight into the kinematics of blue whale surface foraging through drone observations and prey data. PeerJ 8, e8906. doi: 10.7717/peerj.8906
Williams R., Leaper R., Zerbini A., Hammond P. S. (2007). Methods for investigating measurement error in cetacean line-transect surveys. J. Mar. Biol. Assoc. U.K. 87, 313–320. doi: 10.1017/S0025315407055154
Keywords: blue whales, Antarctic, photogrammetry, photo-identification, behaviour
Citation: Calderan SV, Leaper R, Andrews-Goff V, Miller BS, Olson PA, Reyes MVR, Bell E and Double MC (2023) Surfacing rates, swim speeds, and patterns of movement of Antarctic blue whales. Front. Mar. Sci. 10:1087967. doi: 10.3389/fmars.2023.1087967
Received: 02 November 2022; Accepted: 11 January 2023;
Published: 26 January 2023.
Edited by:
Stefano Aliani, National Research Council (CNR), ItalyReviewed by:
Russel D. Andrews, Marine Ecology and Telemetry Research (MarEcoTel), United StatesSalvatore Siciliano, Fundação Oswaldo Cruz (Fiocruz), Brazil
Holly Crystal Raudino, Department of Biodiversity, Conservation and Attractions (DBCA), Australia
Copyright © 2023 Calderan, Leaper, Andrews-Goff, Miller, Olson, Reyes, Bell and Double. This is an open-access article distributed under the terms of the Creative Commons Attribution License (CC BY). The use, distribution or reproduction in other forums is permitted, provided the original author(s) and the copyright owner(s) are credited and that the original publication in this journal is cited, in accordance with accepted academic practice. No use, distribution or reproduction is permitted which does not comply with these terms.
*Correspondence: Susannah V. Calderan, c3VzYW5uYWguY2FsZGVyYW5Ac2Ftcy5hYy51aw==