 Casey P. Saenger1*
 Paul McElhany2
 Emily L. Norton3
 D. Shallin Busch2
 Samantha A. Siedlecki4
 Simone R. Alin5
 Richard A. Feely5
 Albert J. Hermann3,5
 Nina Bednaršek6,7
- 1Department of Geology and Program in Marine and Coastal Science, Western Washington University, Bellingham, WA, United States
- 2Conservation Biology Division, Northwest Fisheries Science Center, National Marine Fisheries Service, National Oceanic and Atmospheric Administration, Seattle, WA, United States
- 3The Cooperative Institute for Climate, Ocean and Ecosystem Studies, University of Washington, Seattle, WA, United States
- 4Department of Marine Sciences, University of Connecticut Groton, Groton, CT, United States
- 5Pacific Marine Environmental Laboratory, National Oceanic and Atmospheric Administration, Seattle, WA, United States
- 6Cooperative Institute for Marine Resources Studies, Oregon State University, Newport, OR, United States
- 7National Institute of Biology, Marine Biological Station, Piran, Slovenia
Dungeness crab (Metacarcinus magister) have significant socioeconomic value, but are threatened by ocean acidification (OA) and other environmental stressors that are driven by climate change. Despite evidence that adult harvests are sensitive to the abundance of larval populations, relatively little is known about how Dungeness megalopae will respond to these stressors. Here we evaluate the ability to use micro-computed tomography (μCT) to detect variations in megalope exoskeleton density and how these measurements reflect environmental variables and calcification mechanisms. We use a combination of field data, culture experiments, and model simulations to suggest resolvable differences in density are best explained by minimum pH at the time zoeae molt into megalopae. We suggest that this occurs because more energy must be expended on active ion pumping to reach a given degree of calcite supersaturation at lower pH. Energy availability may also be reduced due to its diversion to other coping mechanisms. Alternate models based on minimum temperature at the time of the zoea-megalope molt are nearly as strong and complicate the ability to conclusively disentangle pH and temperature influences. Despite this, our results suggest that carryover effects between life stages and short-lived extreme events may be particularly important controls on exoskeleton integrity. μCT-based estimates of exoskeleton density are a promising tool for evaluating the health of Dungeness crab populations that will likely provide more nuanced information than presence-absence observations, but future in situ field sampling and culture experiments are needed to refine and validate our results.
1 Introduction
Dungeness crab (Metacarcinus magister) support the most valuable single-species fishery on the US West Coast (Pacific States Marine Fisheries Commission, 2019) and are an important traditional food source for indigenous populations (Ban et al., 2017). Their habitat range spans cool oceans from Alaska to southern California (Rasmuson, 2013), which are vulnerable to anthropogenic ocean acidification (OA) due to naturally low seawater buffering capacity in portions of the region (Feely et al., 1988; Feely et al., 2016; Chavez et al., 2017). While the Dungeness crab fishery may currently be sustainable (Richerson et al., 2020), model projections suggest accelerating OA (Chan et al., 2017; Doney et al., 2020) will lead to future declines and considerable socioeconomic impacts, especially in Oregon and Washington (Marshall et al., 2017; Hodgson et al., 2018; Magel et al., 2020; Berger et al., 2021). However, these model projections are based on relatively limited physiological data with only modest agreement among studies (Busch and McElhany, 2016), indicating that additional work is necessary to robustly characterize the response of Dungeness crabs to OA and other stressors associated with anthropogenic climate change.
Of particular importance may be the response of larval stages. The life cycle of Dungeness crabs includes five zoeal stages (z1-z5) and a single megalopal stage during which active swimming and passive transport lead to migration from nearshore environments to the open ocean and back over the course of approximately four months (Rasmuson, 2013). In the northern California Current, these pelagic stages experience a range of environmental conditions, especially during the spring upwelling season when any onshore transport exposes them to lower pH, dissolved oxygen (DO), and temperature. The size of the adult commercial catch in a given year has been linked to the abundance of megalopae four years earlier (Shanks and Roegner, 2007; Park, 2012; Shanks, 2013) suggesting that understanding how megalopae respond to OA and other environmental stressors such as low DO and non-optimal temperature is critical for understanding potential impacts on the adult population.
Evidence from laboratory experiments suggests that the growth, survival, and physiology of megalopae are sensitive to temperature (Reed, 1969; Sulkin and McKeen, 1994; Sulkin et al., 2011, 1989; Wild, 1980), salinity (Reed, 1969; Brown and Terwilliger, 1999) and DO (Bancroft, 2015; Gossner, 2018; Trigg et al., 2019). These results are partially corroborated by field observations that suggest megalope abundance is sensitive to salinity (Lough, 1976) and the Pacific Decadal Oscillation (Hobbs and Botsford, 1992; Shanks and Roegner, 2007; Shanks, 2013). Experiments evaluating responses of Dungeness crab to OA indicate that low pH may reduce survival and slow development (Descôteaux, 2014; Miller et al., 2016), affect behavioral and cognitive abilities (Christmas, 2013; Imm, 2015), and reduce carapace size and respiration rate (McElhany et al., 2022). Similar experiments with larval stages of other crab species also suggest lower growth and survival (Walther et al., 2010; Giltz and Taylor, 2017; Gravinese et al., 2018), decreased metabolism (Long et al., 2016) and altered vertical migration (Gravinese et al., 2019). However, a long-term study on juvenile Dungeness crabs found increased survival under high pCO2 conditions, suggesting that the response may be life stage dependent (McElhany et al., 2022).
Relatively few field observations have investigated the response of Dungeness crab megalopae to carbonate chemistry conditions, perhaps because carbonate chemistry data are spatiotemporally sparse relative to other environmental variables. A notable exception is the recent work of Bednaršek et al. (2020) who used data from NOAA’s 2016 West Coast Ocean Acidification (WCOA) cruise to relate dissolution in the exoskeleton of Dungeness crab megalopae to in situ ocean variables that included carbonate chemistry metrics. Results found that the extent of external carapace dissolution, including damage to important mechanoreceptors, was highly correlated with the vertical gradient in calcite saturation over the upper 60 m of the water column (ΔΩ60). In addition to providing important evidence that OA is influencing megalopae under present-day conditions, Bednaršek et al. (2020) study is noteworthy for developing an OA vulnerability metric that is more nuanced than simple mortality rates or presence-absence observations (e.g. Miller et al., 2016; Gravinese et al., 2018). Such non-binary metrics allow the consequences of exposure to be evaluated across a spectrum, and may contribute to more detailed forecasts of Dungeness crab population response to future climate change (e.g. Berger et al., 2021). However, because the technique targets dissolution, it emphasizes damage between molts and may miss processes that affect initial megalope exoskeleton integrity at the time of molt from the fifth zoeal stage (z5). Furthermore, observed exoskeleton dissolution has not been linked to survival, growth or other parameters that can be directly related to changes in population dynamics.
Unlike the many marine organisms that secrete carbonate biominerals more continuously, crabs precipitate their exoskeleton in short, episodic molts with no new shell formed during intermolts (Luquet, 2012). While exoskeleton formation in larval crabs is poorly constrained, adult crabs shed their old shells and precipitate new ones in a matter of hours via a number of energetically-intensive active processes aimed at elevating mineral saturation states while maintaining charge and acid-base balance (Cameron, 1985, 1989; Cameron and Wood, 1985; Luquet and Marin, 2004). Thus, it is plausible that variations in carbonate chemistry, food availability and other environmental variables during the brief z5 to megalope transition could lead to initial variations in exoskeleton density. Subsequent dissolution between the time of initial exoskeleton precipitation and collection could then further modify density.
Micro-computed tomography (μCT) represents a complement to the work of Bednaršek et al. (2020) that may be able to provide additional information on how megalopae respond to OA and other stressors during molt and intermolt stages by measuring exoskeleton mineral density. The technique is relatively fast, nondestructive, and provides objective data that are well suited to high throughput and routine monitoring. While often used to evaluate three-dimensional structures in marine calcifiers (Saenger et al., 2009; Cantin et al., 2010; Enochs et al., 2016; Johnson et al., 2020; Mekkes et al., 2021) the degree of x-ray attenuation also allows μCT to measure the density of those structures. Applying such measurements to culture experiments in which carbonate chemistry is manipulated suggests that the shell densities of oysters (Meng et al., 2018), gastropods (Chatzinikolaou et al., 2021, 2017) and scallops (Alma et al., 2020) decrease under lower pH conditions or high pCO2, while the density of fish otoliths and bone increases at high pCO2 (Bignami et al., 2013; Di Santo, 2019). In situ field studies more realistically represent the true environment of marine calcifiers, but are often more difficult to interpret because of the potential for confounding variables. For example, the density of foraminifera (Iwasaki et al., 2019) and thickness of pteropod shells (Mekkes et al., 2021) in some regions show a decrease at lower carbonate ion concentrations, while in other regions the density of both organisms shows the opposite trend (Ofstad et al., 2021). This highlights the need to carefully consider as many realistic controls on exoskeleton density as possible when evaluating μCT -based density as a measure of the sensitivity of Dungeness crab megalopae to carbonate chemistry conditions.
Here, we develop a rapid-throughput μCT technique to measure exoskeleton density variations among Dungeness crab megalopae collected during the 2016 WCOA cruise and complementary cultured larval pea crabs. We evaluate the environmental variables that are most likely to control differences in exoskeleton density by comparing variations among megalopae to in situ ocean observations, exoskeleton dissolution estimates (Bednaršek et al., 2020), and corresponding simulated megalope exposure histories from the same time period (Norton et al., 2020). These analyses are used to develop plausible mechanisms linking exoskeleton formation to environmental variables, and to make an initial evaluation of how the responses at the individual level may translate to larger populations.
2 Methods
2.1 Megalopae and water sampling
Megalopae were collected during the NOAA WCOA cruise in May and June of 2016 (Figure 1; Table 1). Neuston and Bongo nets with a mesh size of 333 mm were deployed obliquely across a depth of ~60m, which spans the vertical habitat of larval Dungeness crabs (Hobbs and Botsford, 1992; Rasmuson, 2013) for a duration of approximately 20 minutes. Megalopae were sampled from tow samples and stored in 100% non-denatured ethanol for later analysis. The distance to shore for each station was estimated using the closest 0.04° gridbox from the NASA Ocean Biology Processing Group’s product (https://oceancolor.gsfc.nasa.gov/docs/distfromcoast/).
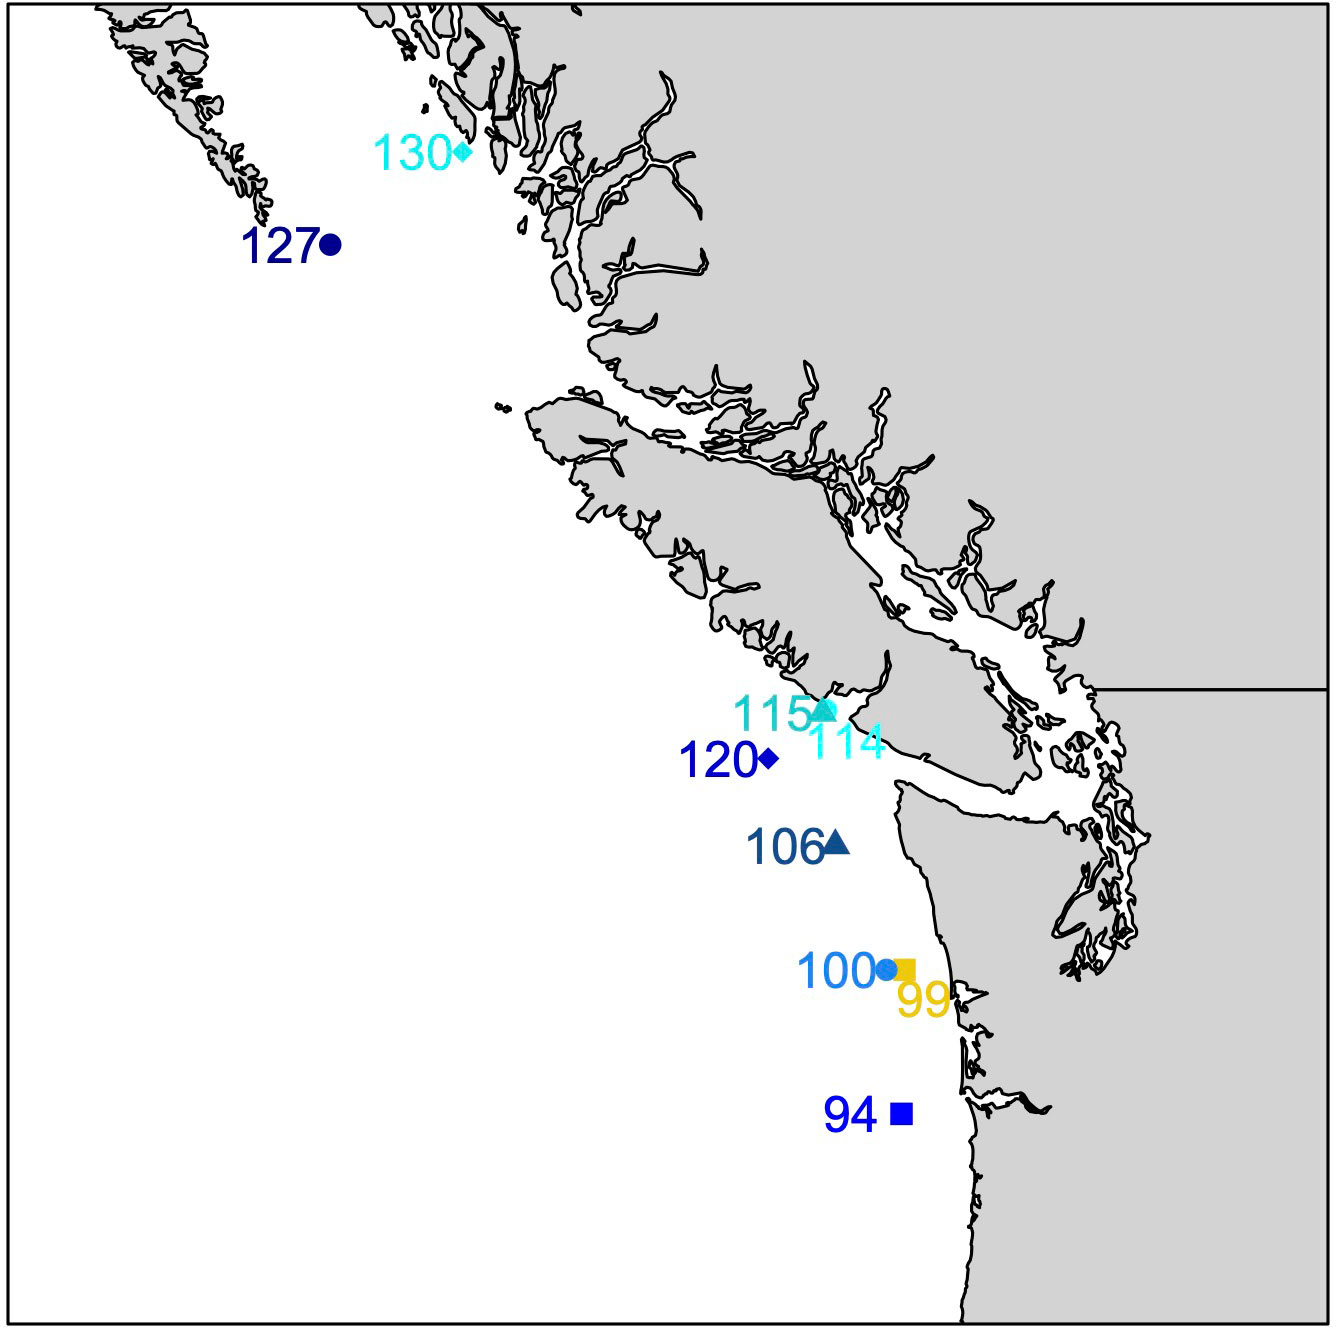
Figure 1 Locations of megalope sampling stations. Blue and cyan symbols identify offshore (>50 km from shore) and nearshore (<7 km) stations, respectively. Station 99 (yellow) is intermediate (33 km from shore).
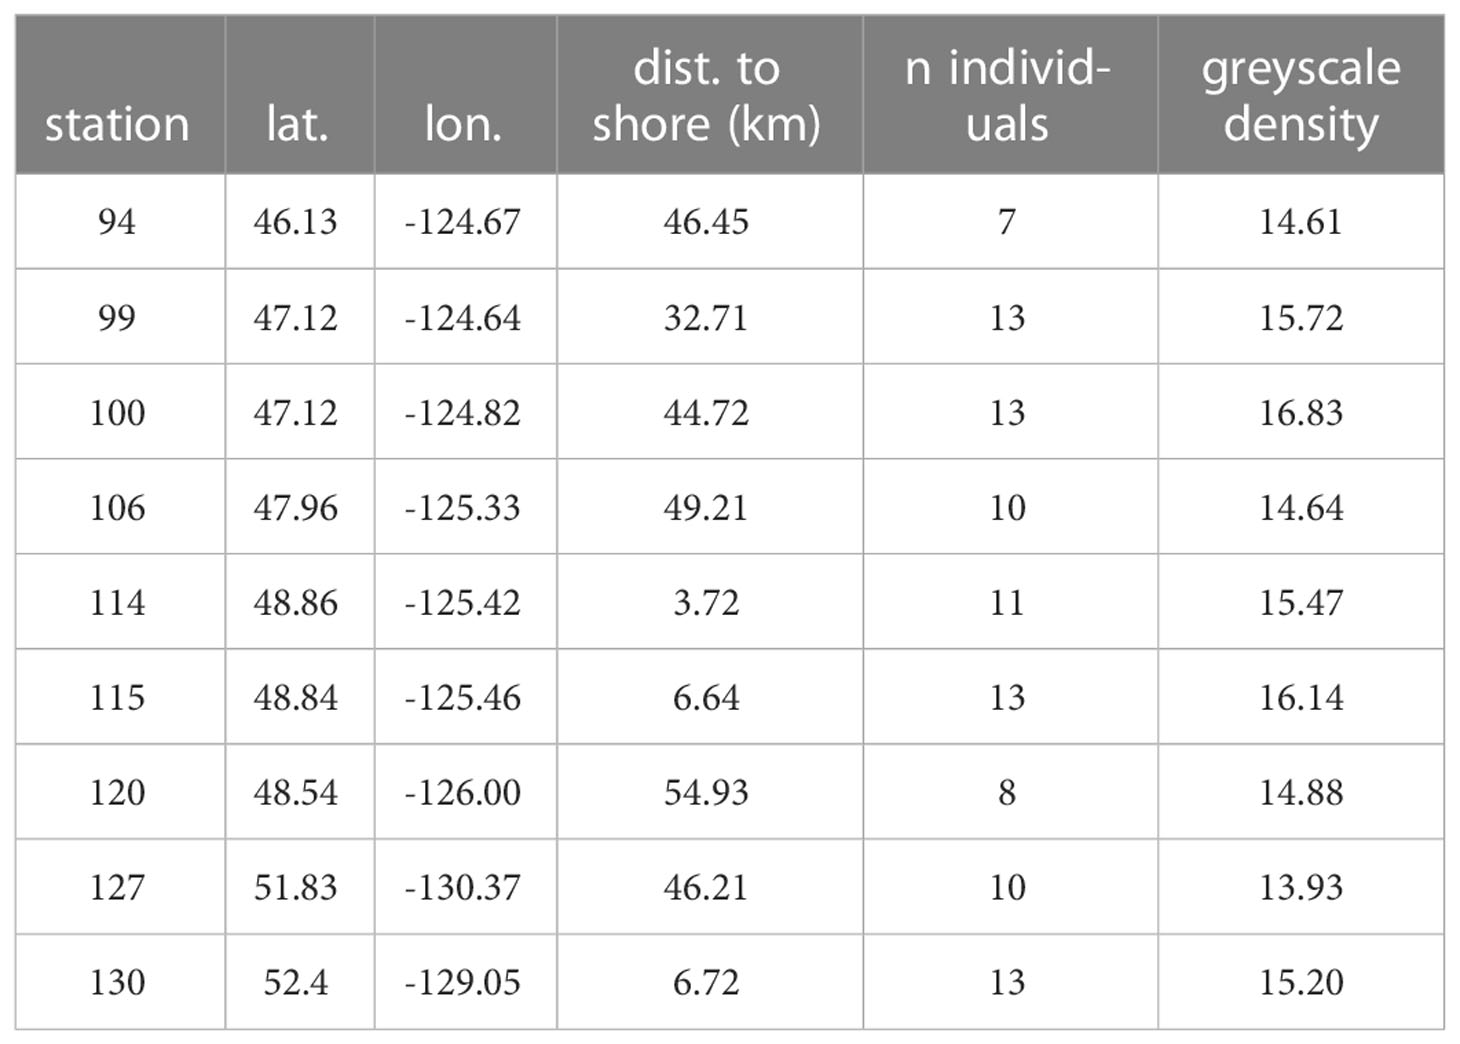
Table 1 Station locations and mean densities of megalopae.
Complementary water column variables were collected across vertical profiles at each site including: temperature (T), salinity (S), DO, nitrate () and phosphate () concentrations, total dissolved inorganic carbon (TC), alkalinity and pH (measured at 25°C - corrected to in situ temperature, and expressed on the total pH scale). Subsequently, seawater calcite saturation state (Ωc) was calculated using CO2SYS as described by Feely et al. (2016). At most stations, water data exist at approximately 10-m intervals over at least the upper 60 m approximating megalope habitat. However, the maximum water sampling depth at nearshore stations 114 and 130 was 35 and 41 m, respectively.
2.2 µCT analysis
Megalopae were scanned using a Bruker Skyscan 1173 within the Karel F. Liem Bioimaging Facility at the University of Washington’s Friday Harbor Laboratories. While μCT could be used to measure a variety of exoskeleton metrics (e.g. volume, shell thickness, etc.), our method was optimized for the high throughput analysis of exoskeleton density with the hope that such measures become a routine component of marine monitoring. Between 2 and 4 megalopae were loaded dry into a plastic 2 ml vial and scanned simultaneously in air without a filter at a voltage of 49 kV, current of 160 mA and 0.3° rotation steps. Total time for each scan was less than 30 minutes, or approximately 10 minutes per megalope. The raw output of each scan was a histogram of greyscale values from 0 (black) to 255 (white), for which higher values indicate greater density. Scans from the same station were aggregated into an average histogram for that site representing 7 to 13 specimens (Table 1).
The megalope greyscale signal in each histogram is convolved with the background signal of the plastic vial, which must be removed (Figure 2). To achieve this, we identified the first greyscale value whose proportion increases from the previous value as the lower limit of the megalope signal and the first subsequent grayscale value whose proportion is<0.1% of the total as the upper limit (Figure 2). We then integrated between these values to determine a final greyscale value for each site. Given that the exoskeleton of megalopae are likely a complex mixture of calcite, amorphous calcium carbonate, and chitin (Luquet and Marin, 2004; Boßelmann et al., 2007), with densities of 2.71 g/cm3, 1.62 g/cm3 (Bolze et al., 2002), and 1.4 g/cm3(Carlstrom, 1957), respectively, it is difficult to produce appropriate standards with which to convert greyscale values to absolute density. Furthermore, while higher greyscale values generally reflect denser material, the abundance of exoskeleton pores smaller than the ~20 mm resolution of our method (i.e., micropores) can complicate this relationship. To compute density from a μCT scan, it is necessary to identify a threshold value that separates mineral or exoskeleton from air (Meng et al., 2018; Fordyce et al., 2020). A high abundance of micropores increases the number of voxels that are not entirely exoskeleton or air; a phenomenon known as ‘partial voxel filling’ (Fordyce et al., 2020). The higher the frequency of partial voxel filling, the greater the likelihood that voxels of mostly air with a small proportion of high-density exoskeleton are identified as entirely low-density exoskeleton. Given these complications, we do not attempt to calibrate μCT data to absolute density, and instead present data in native greyscale units.
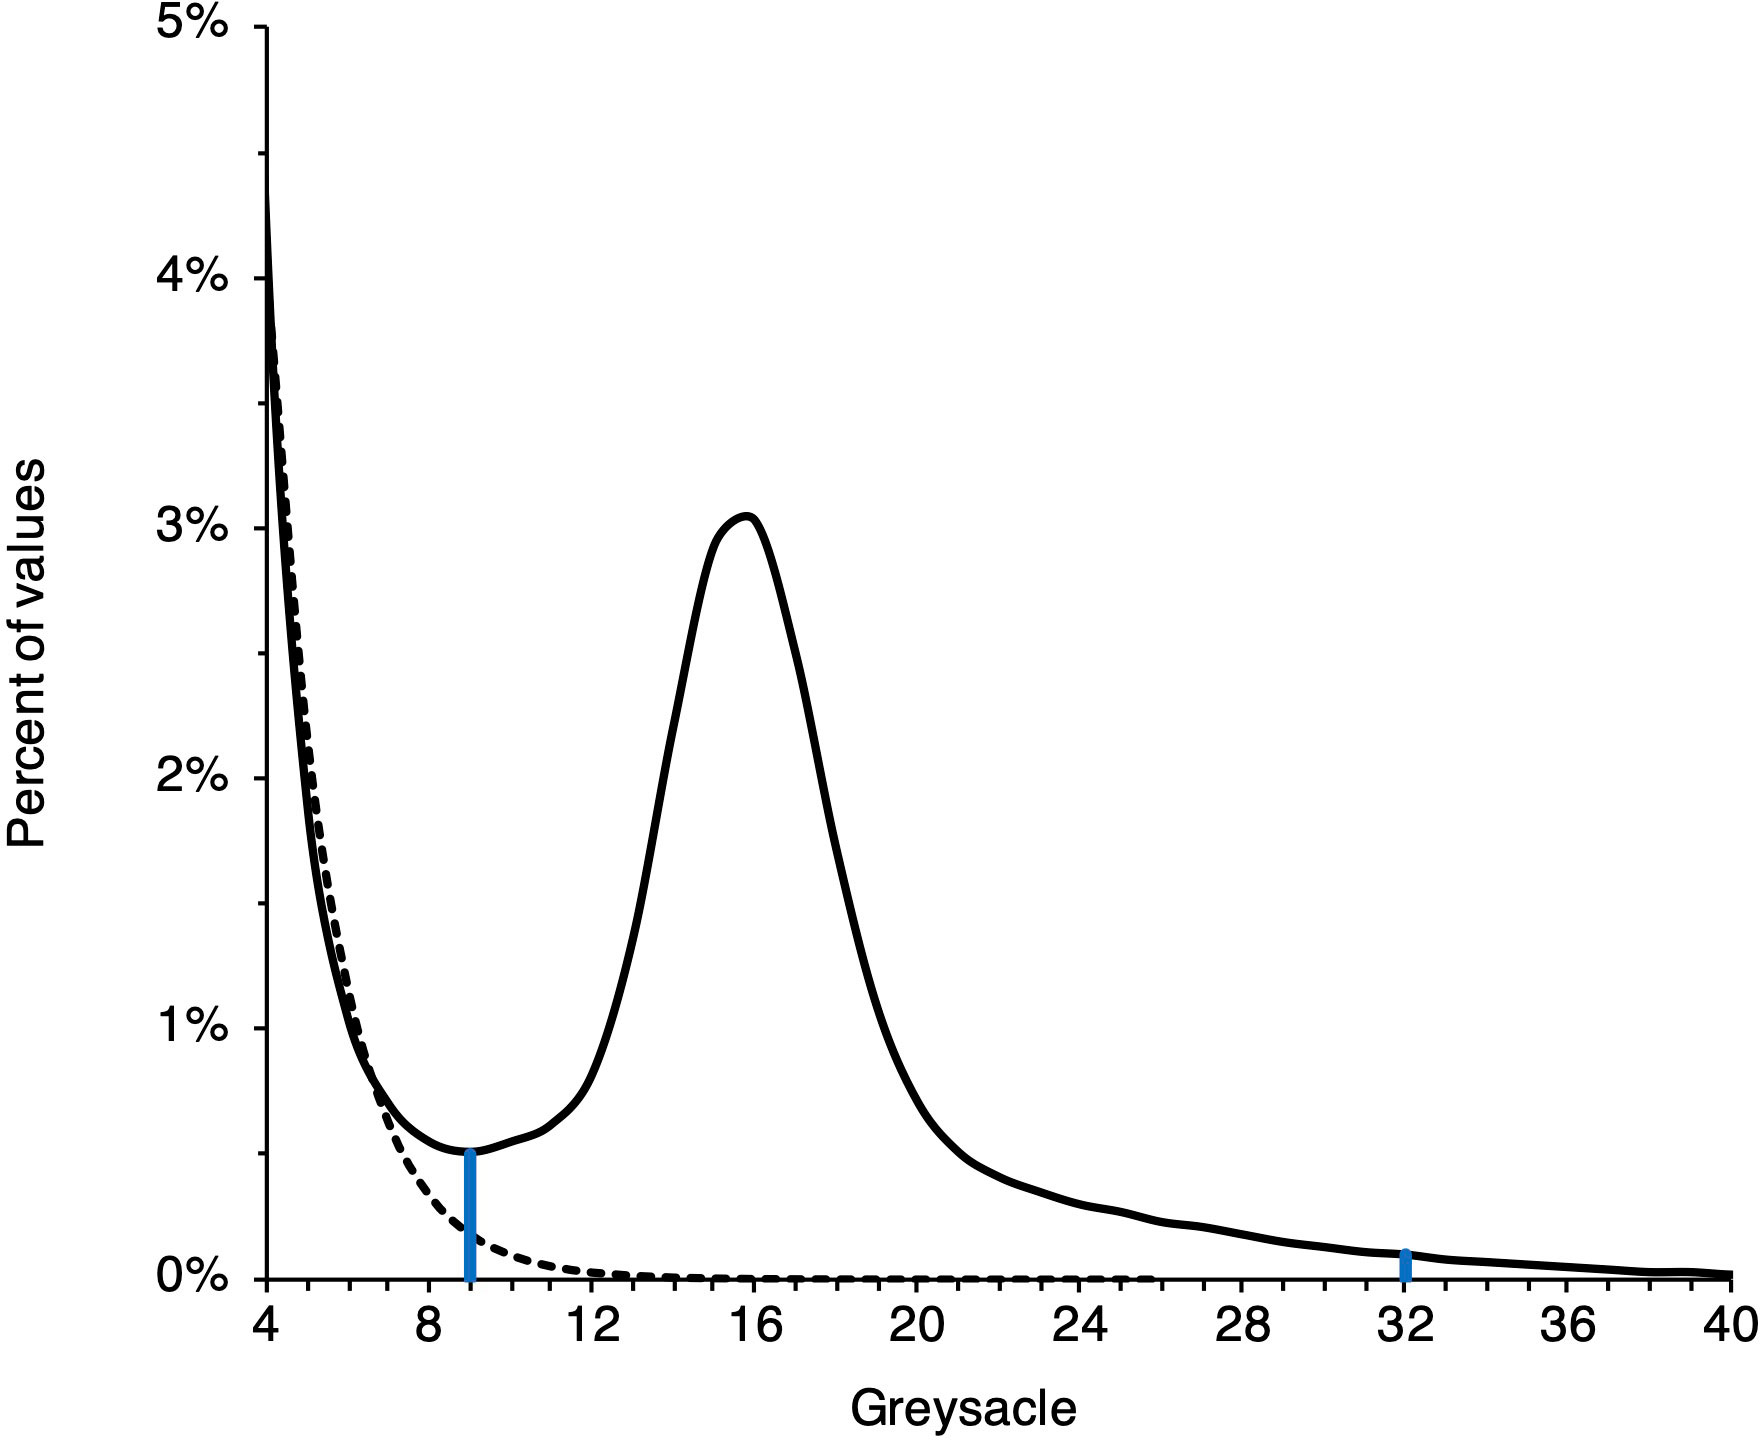
Figure 2 Example of μCT data processing. A blank signal (dashed line) associated with the megalope sample vial contributes to low greyscale values. The thresholds marked by vertical blue lines are determined as described in the main text. Integrating a sample’s signal (solid line) between these thresholds give a sample’s greyscale value.
2.3 Optimal predictors of megalope exoskeleton density
The environmental variables that may control differences in megalope exoskeleton density were evaluated by comparing density to a suite of plausible predictors that represent realistic megalope histories prior to collection. These scenarios are summarized in Table 2. In the simplest scenarios (int30 and int60), it was assumed that the recovered specimens molted from z5 zoeae near the point of collection such that the environmental conditions measured at the time of sampling were representative of their entire history as megalopae. In these scenarios we considered vertical migrations over either the upper 30 or 60 m, which is broadly consistent with field observations (Hobbs and Botsford, 1992; Rasmuson, 2013). The predictor pool for these scenarios included T, S, DO, , , TC, alkalinity, pH and Ωc averaged over depths of either 30 m or 60 m. For select instances where a station’s maximum depth was less than 60 m, data at the maximum available depth was used. To consider particular sensitivity to extreme values, we also considered the maximum and minimum of the variables over either the upper 30 or 60 m. Given recent work suggesting that megalope carapace dissolution is sensitive to vertical gradients in Ωc (Bednaršek et al., 2020), we also added such gradients for T, S and Ωc (ΔT, ΔS, ΔΩc), where the Δ-value is the difference between the parameter at the surface and 30 m or 60 m.

Table 2 Summary of scenarios considered.
In a second set of scenarios (DVM30xx and DVM60xx), we considered the possibility that megalopae molted from z5 zoeae up to 30 days prior to collection, and experienced environmental conditions different from in situ measurements as they migrated to the sampling site. Because megalopae are active swimmers, we considered diel vertical migrations over the upper 30 m in DVM30xx scenarios and over the upper 60 m in DVM60xx scenarios. The total time between z5-megalope molt and subsequent megalope-juvenile molt has been previously estimated at 30 days (Norton et al., 2020), but the exact time between z5-megalope molt and collection for the specimens we analyzed is unknown. Because of this uncertainty we performed sensitivity tests that assumed z5-megalope molt occurred 10, 20 or 30 days prior to collection. These scenarios are distinguished with a subscript, such that DVM3010 identifies the scenario where the z5-megalope molt occurred 10 days prior to collection, after which megalope migrate over the upper 30 m of the water column to the site of collection.
To evaluate these scenarios we leveraged a series of existing experiments that used JISAO’s Seasonal Coastal Ocean Prediction of the Ecosystem (J-SCOPE) model to explore how exposure histories influence the presence or absence of M. magister (Norton et al., 2020). J-SCOPE is a high-resolution biogeochemical model of Washington-Oregon shelf waters with demonstrable predictive skill on seasonal timescales (Siedlecki et al., 2016), which has been extensively evaluated against historical conditions (Malick et al., 2020; Norton et al., 2020). Running the model “in reverse” using hourly historical simulations allows a megalope’s trajectory to the site of collection to be estimated, and, in turn, record the ocean conditions that coincide with that trajectory (Norton et al., 2020). One hundred particles for each sampling station were considered and the mean of the environmental conditions experienced by the particles was taken as the best estimate for a site. Diel vertical migrations were incorporated into back-tracking experiments, assuming a maximum depth of 30 m (DVM30xx; Figure 3) or 60 m (DVM60xx; Figure 4). The back-tracked trajectories include both vertical and horizontal random walk terms based on diffusion. The vertical component is calculated using the time-variable, hourly stored 3D values of vertical diffusivity, while the horizontal component assumes a constant background diffusivity value of 1.0 m2/s. These terms ensure dispersion of particles released from a shared location. The following variables estimated by J-SCOPE were considered as predictors of greyscale density: T, S, DO, , pH, Ωc, phytoplankton concentration ([phyt]), and their maximum and minimum values, plus ΔT, ΔS and ΔΩc. Maximum and minimum values were defined as the average of the highest and lowest 5% of values for each variable. Following Norton et al. (2020), we also calculated severity indices (SI: Hauri et al., 2013; Bednaršek et al., 2017) for T, S, DO, pH and Ωc. Stations 127 and 130 fall outside of the J-SCOPE domain, so comparisons to DVM behaviors were limited to the remaining seven stations.
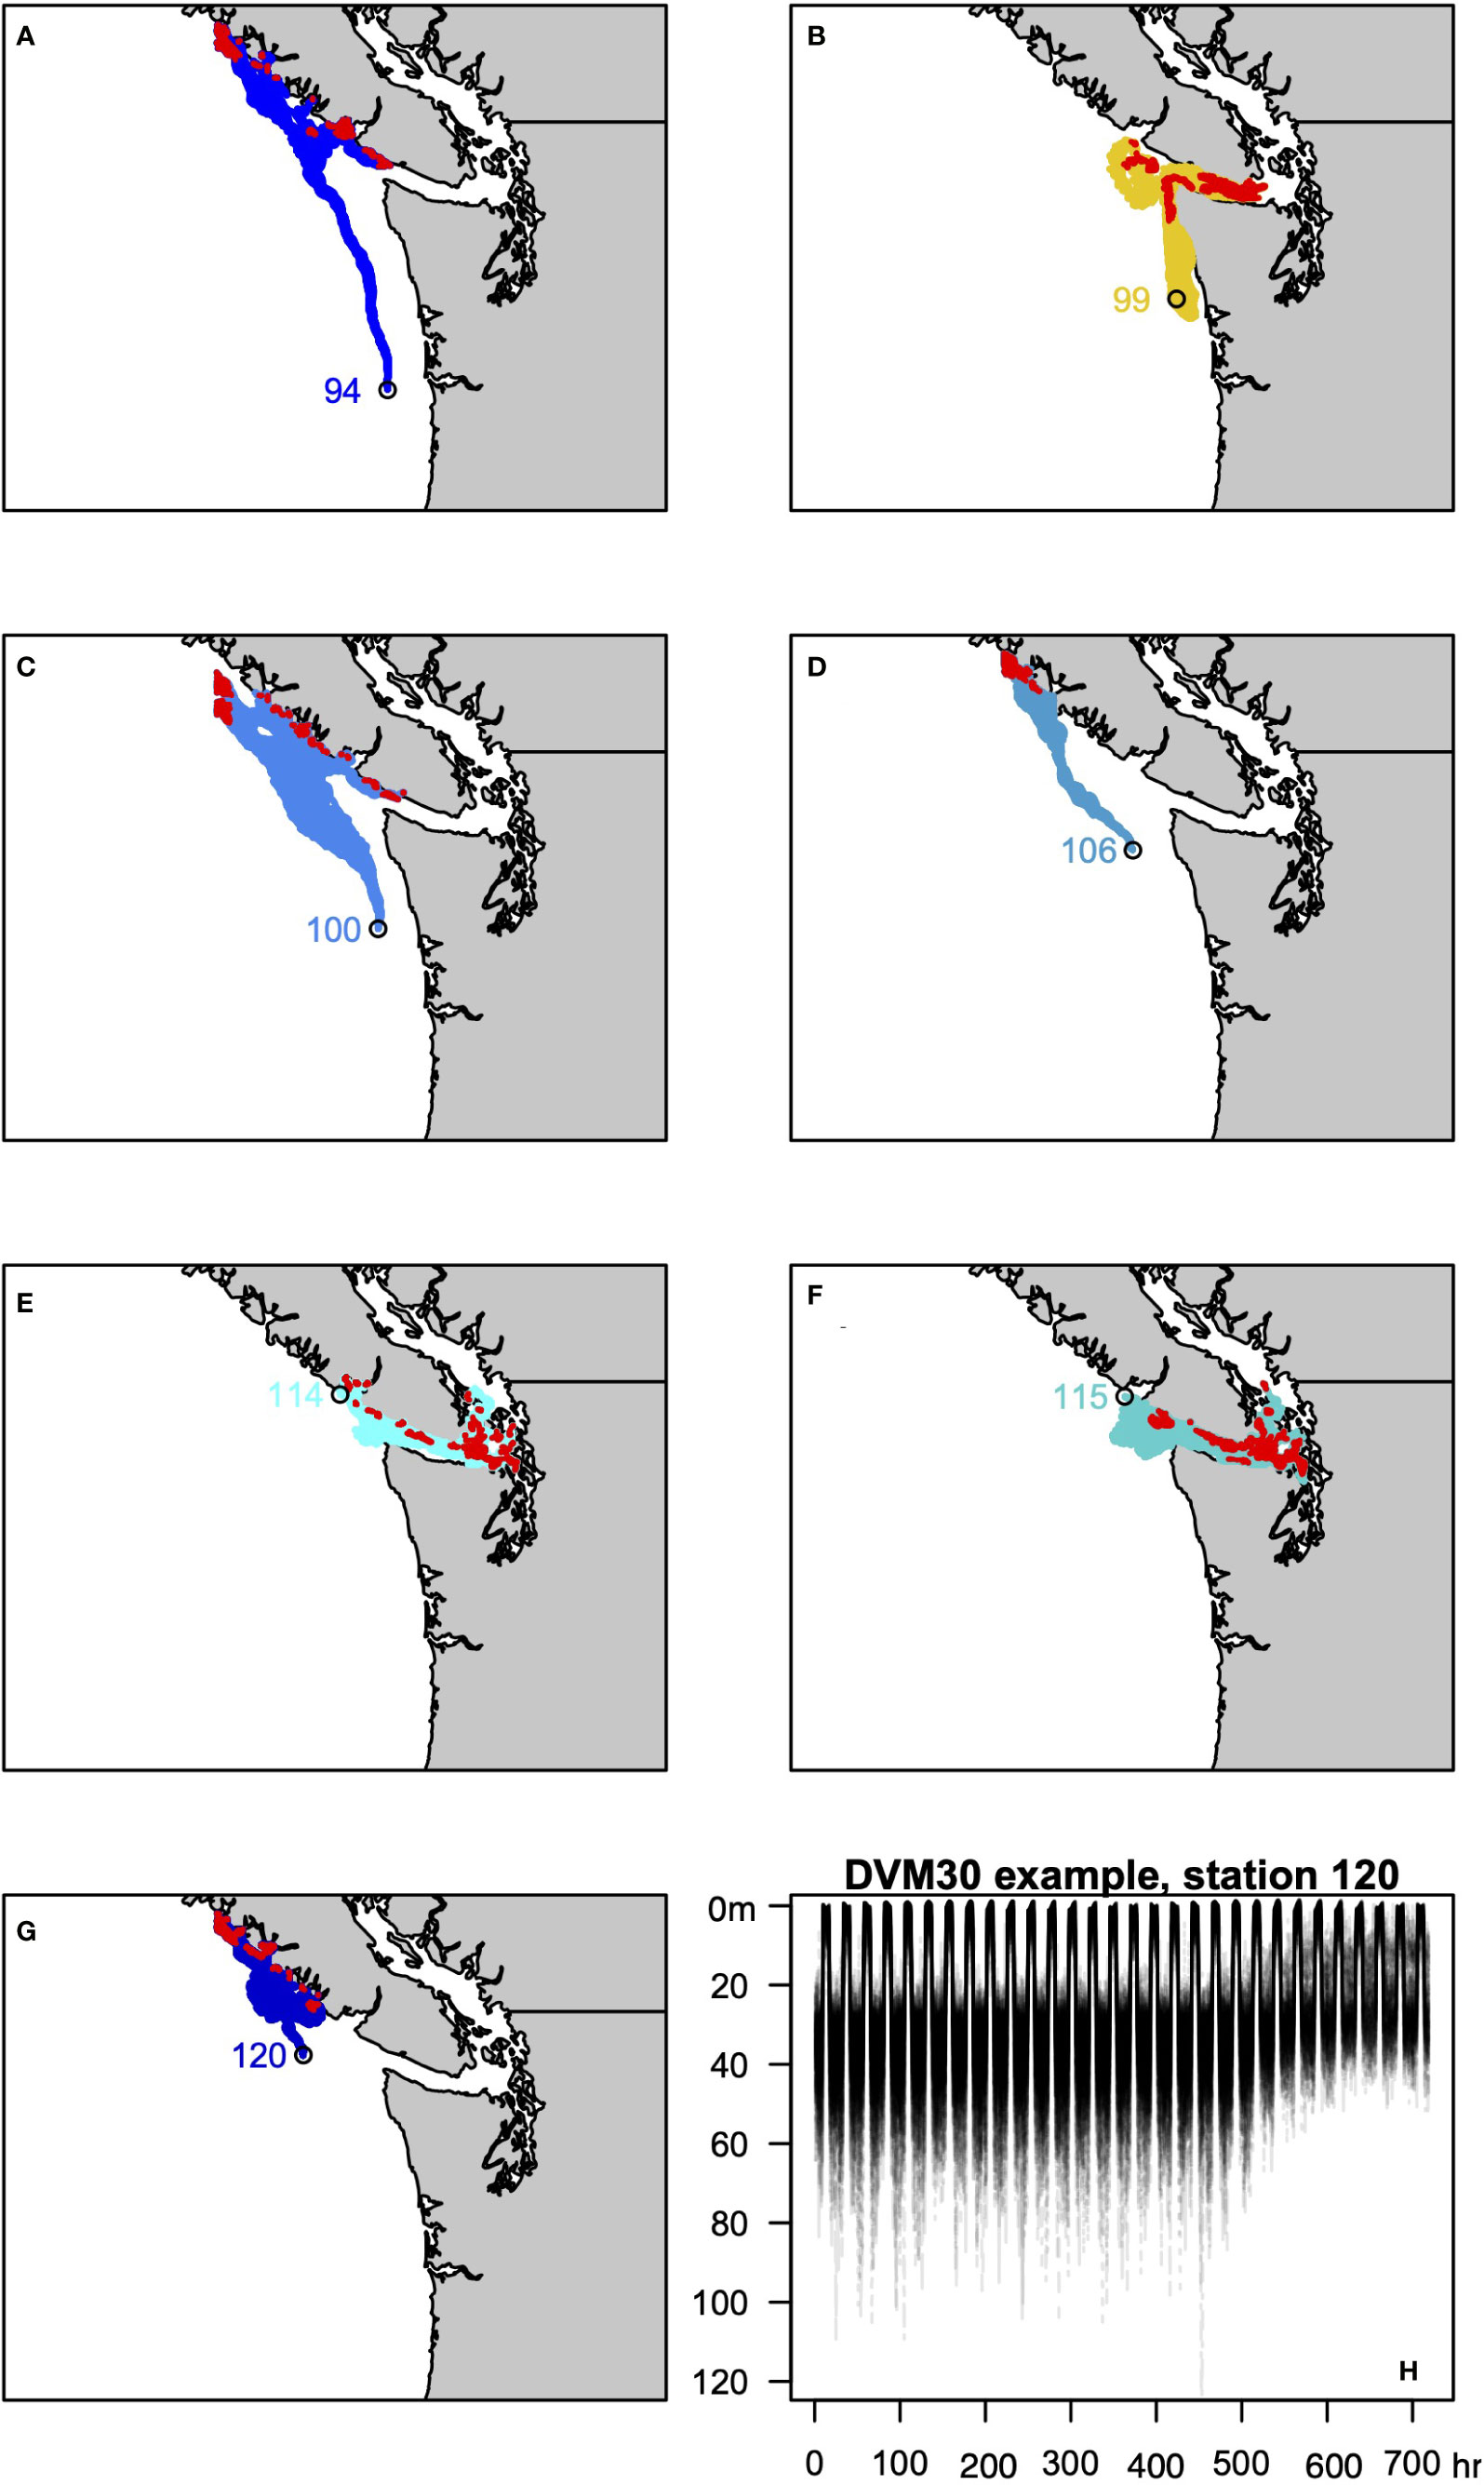
Figure 3 (A–G) Trajectories of the 100 backtracked particles at each site for the DVM3030 behavior. Red symbols identify the location in the last 24 hours used to approximate the site of z5-megalope molt 30 days prior to collection. (H) Example of DVM3030 behavior for station 120, showing the depth of all 100 particles over the course of the 720 hour simulation.
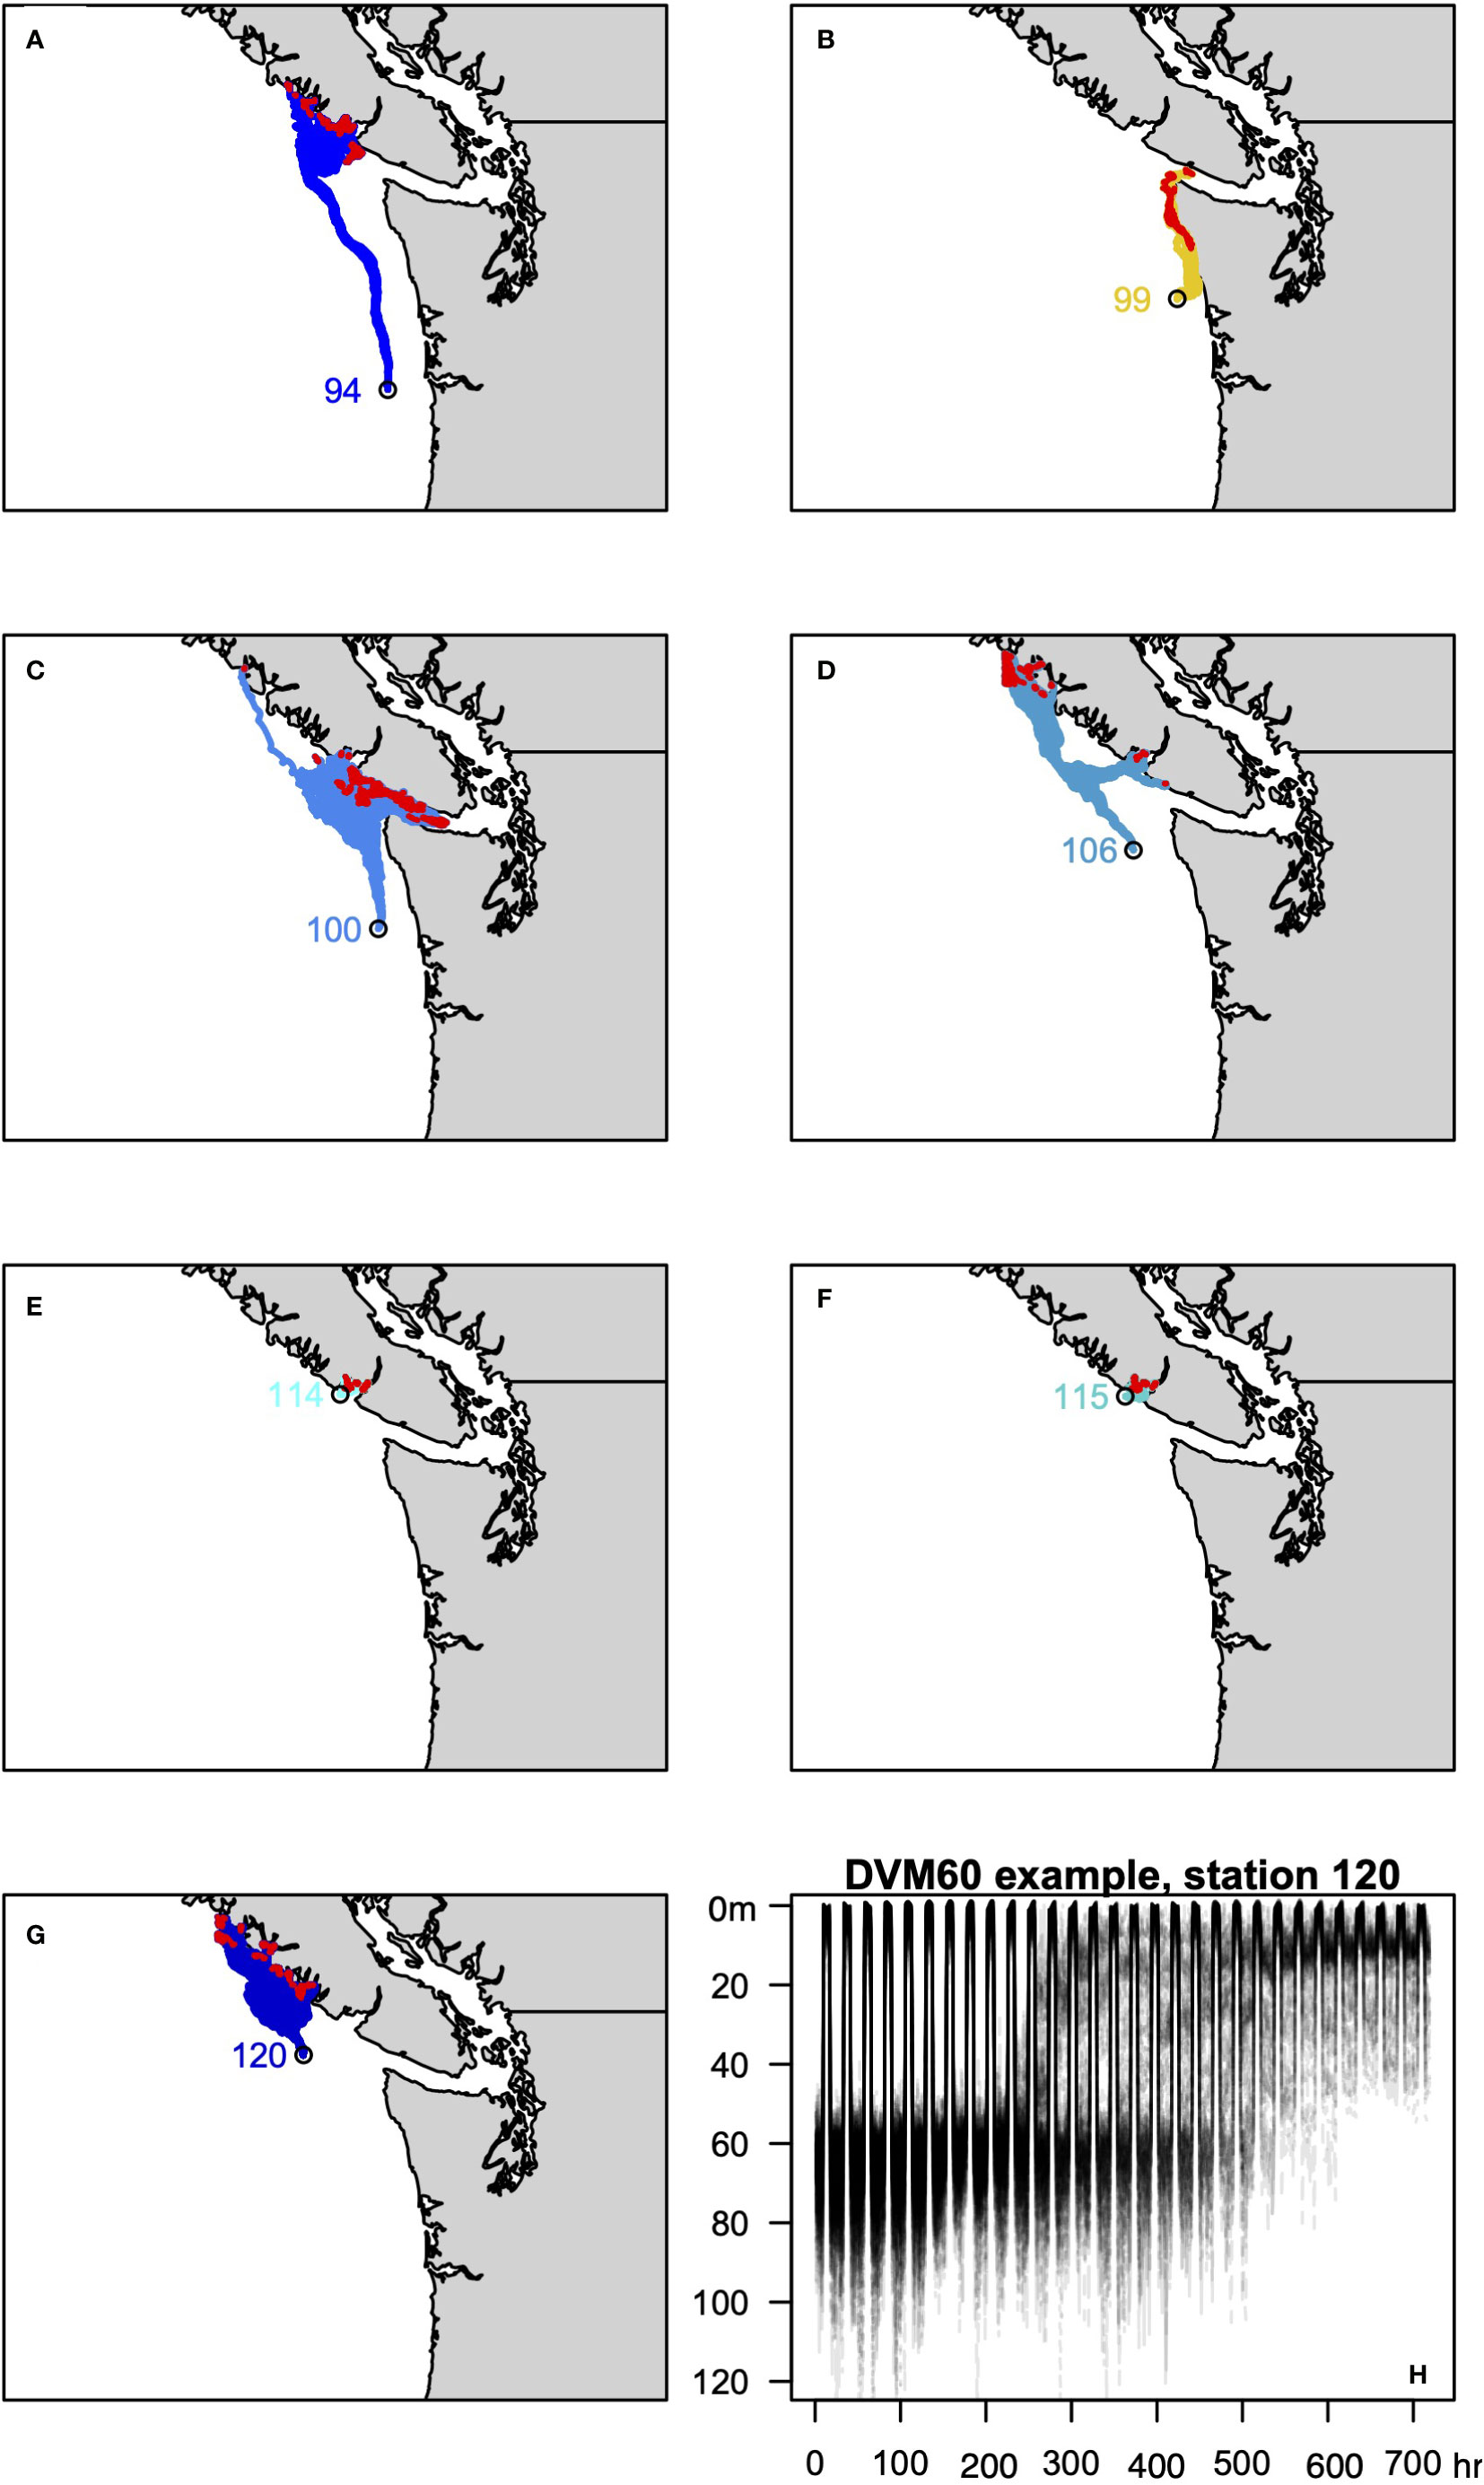
Figure 4 As in Figure 3 for the DVM6030 behavior.
In a third set of scenarios (molt30xx and molt60xx), we modeled the possibility that megalope exoskeleton density was determined only by environmental conditions during the short period surrounding the z5-megalope molt, 10, 20 or 30 days prior to collection. To do so, we considered only the final 24 hours of the DVM30xx and DVM60xx exposure history simulations described above. We considered all depths to be equally likely for the z5-megalope molt and calculated average values of T, S, DO, , pH, Ωc, [phyt], and their maximum and minimum values. We did not consider vertical gradients or severity indices in this set of scenarios. As above, these scenarios were limited to the seven stations within the J-SCOPE domain.
Our final scenarios (all30xx and all60xx) considered the possibility that the scenarios above are not mutually exclusive. For example, conditions at the time of z5-megalope molt and the exposure history between molt and collection could both influence density. Thus, we combined the predictors of the three other scenarios at each depth (e.g. int30, DVM30xx and molt30xx) for the seven stations within the J-SCOPE domain into a single pool.
For each scenario, we used a forward stepwise regression approach (Wilks, 2006; Saenger and Evans, 2019), in which the Akaike Information Criterion (Akaike, 1974) modified for small samples (AICc; Burnham and Anderson, 2010; Burnham et al., 2011), served as a stop criterion. Specifically, univariate regressions between μCT greyscale and all potential predictors were calculated, and the regression with the lowest AICc was retained. Subsequently, all bivariate regressions were calculated. If a bivariate model had a still lower AICc, the additional variable was retained, and the process continued. If no bivariate model had a lower AICc, the univariate model was considered to be optimal. Given the absence of data to the contrary, we assume a linear relationship between greyscale density and all potential predictors. Multicollinearity undoubtedly occurs within our pool of predictor variables and complicates the selection of a single regression with absolute certainty. As such, we present AICc values for all models (See Supplementary Material) and use the difference from the lowest AICc (ΔAICc) to calculate relative likelihoods following the approach of Burnham et al. (2011). We formally discuss models whose likelihoods are >0.5, which is equivalent to a ΔAICc of 1.4, and can be interpreted as the optimal model being at most twice as likely as an alternate model. Furthermore, we provide comprehensive correlation matrices for all variables in each scenario to evaluate the degree to which our stepwise regression selects unique predictors (See Supplementary Material).
Finally, we give special attention to the relationship between greyscale density and exoskeleton dissolution. In a prior study, a subset of the same field-collected samples analyzed here showed evidence for dissolution that likely occurred after the time of z5-megalope molt, but before field collection (Bednaršek et al., 2020). As mentioned above, more severe dissolution was found at sampling locations with steeper vertical gradients in calcite saturation state (ΔΩc-60), and was suggested to be a short-term OA coping mechanism. Given that dissolution has been shown to decrease μCT -based density estimates in other marine calcifyers (Iwasaki et al., 2019), it would not be unreasonable to expect a strong correlation between either the semi-quantitative dissolution estimates of Bednaršek et al. (2020) or ΔΩc-60 and our greyscale density data.
2.4 Experimental evaluation of pCO2
Given multicollinearity among potential environmental predictors, we also attempted to isolate the influence of pCO2 on megalope exoskeleton density through a controlled experiment with pea crabs (Pinnixa sp.). While Dungeness megalopae would have been preferable for this test, attempts to culture the species from the egg to the megalope stage were unsuccessful, at which point wild-caught zoeae were not present in the regional environment. Given that pea crabs and Dungeness crabs are both Eubrachyuran crustaceans and that the larvae can occur in similar habitats, it seems plausible that their biomineralization strategies might also be similar and these experiments still provide information on whether a high pCO2 environment affects the initial exoskeleton density of megalopae.
We μCT scanned a series pea crabs reared from zoeae to megalopae at ambient (400 μatm) and elevated (2800 μatm) pCO2. The zoeae were collected in light traps by Swinomish Tribal biologists at Coronet Bay in Puget Sound (48.398033, -122.628037) on June 3, 2019, then reared individually in well plates inside CO2-chambers at the NOAA Mukilteo Research Station. The CO2 chambers and crab well plate culture methods are described in McElhany et al. (2022). Initially, 192 zoeae were partitioned equally into four CO2 chambers (two replicate chambers per treatment). Chambers were maintained at 10°C with a 12 hour on/off light cycle. Zoeae were regularly fed Artermia salina at a target concentration of 1 nauplius per milliliter every 3 days. Those zoeae that survived and molted to the megalope stage were maintained in culture for 14 days, which we considered to be long enough for them to experience any potential dissolution, but before they molted to juveniles. Approximately 14 days after molting, megalopae were preserved in 100% ethanol. A subset of the megalopae were used for μCT analysis (400 μatm, n = 8; 2800 μatm n = 9). We note that the optimal instrument parameters for Pinnixa sp. specimens were subtly different (55kV, 160 mA) than those for M. magister specimens so raw greyscale values are not directly comparable between the two species. However, because analyses were internally consistent for a given species, relative differences in integrated greyscale could still detect the direction of any density change.
3 Results
3.1 Exoskeleton density and optimal predictors in field-collected megalopae
μCT greyscale values for field-collected megalopae are summarized in Table 1. Resolvable differences among the nine sites varied from a minimum of 13.93 at station 127 to a maximum of 16.83 at station 100. There was no obvious relationship between greyscale and latitude or distance from shore.
The best relationships between measured greyscale and environmental variables were always univariate, and are summarized in Table 3. Both int30 and int60 scenarios yielded modestly significant models (AICc = 26.70, r2 = 0.5, p = 0.03), in which maximum DO was identified as the optimal predictor. Because maximum DO occurred shallower than 30 m, the regression equations and statistics are identical for both assumed habitat depths. DVM30xx, molt3010 and molt3020 scenarios all produced weak models (AICc = 27.90-28.89, r2 = 0.17-0.28, p = 0.22-0.36) with inconsistent predictors. DVM60xx, molt6010 and molt6020 scenarios were stronger, but still only marginally significant (AIC = 23.33-25.28, r2 = 0.47-0.60, p = 0.04-0.09). A molt3030 model based on minimum pH at the time of molt was the strongest of any considered (AIC = 19.98, r2 = 0.77, p = 0.01; Figure 5A), but a second model from this scenario based on minimum T at the time of molt performed nearly as well (AIC = 20.04, r2 = 0.77, p = 0.01; Figure 5B). A molt6030 model with T at the time of molt as an optimal predictor also performed well (AICc = 20.70, r2 = 0.74, p = 0.01; Figure 5C).

Table 3 Best models of greyscale (gs) for each scenario.
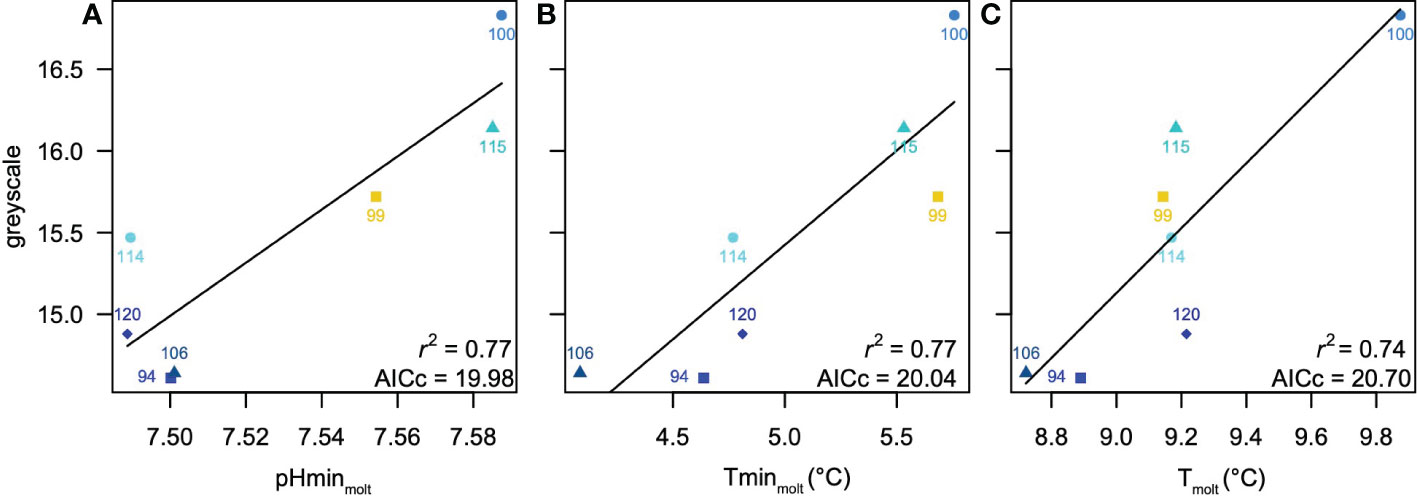
Figure 5 Summary of best models for the scenarios considered (Tables 2, 3) (A) greyscale density versus minimum pH at the time of z5-megalope molt identified as optimal for molt3030 and all3030 scenarios, which also has the overall lowest AICc. (B) greyscale density versus minimum T at the time of z5-megalope molt identified as nearly identical to the optimal model in molt3030 and all3030 scenarios (C) greyscale density versus temperature at the time of z5-megalope molt identified as optimal for molt6030 and all6030 scenarios. Symbol colors indicate nearshore (cyan), intermediate (yellow) and offshore (blue) stations.
Combining all possible predictors into a single pool in all30xx and all60xx scenarios selects minimum in-situ pCO2 at the site of collection as the optimal predictor (AICc = 22.27, r2 = 0.68, p = 0.02) for molt times of 10 and 20 days (Table 3). Because minimum in-situ pCO2 occurs shallower than 30 m, both assumed depth habitats yield the same result. However, in cases where molt was assumed to occur 30 days prior to collection (i.e. all3030 and all6030 scenarios), results were identical to molt3030 and molt6030 scenarios, respectively. That is, the all3030 scenario selected minimum pH at the time of molt, and the all6030 scenario selected T at the time of molt. The AICc for the all3030 model based on minimum T at the time of molt is only 0.06 higher than that for the optimal model based on minimum pH at the time of molt, suggesting it is only 3% less likely and worthy of consideration. In summary, minimum pH at the time of molt assuming vertical migrations over the upper 30 m is the strongest overall predictor of greyscale density, but two alternate models based on minimum T at the time of molt (assuming migrations over the upper 30 m) and average T at the time of molt (assuming migrations over the upper 60 m) are also strong.
3.2 Comparison of exoskeleton density and dissolution
We find an insignificant correlation between exoskeleton density and semi-quantitative dissolution (r2 = 0.27, p = 0.23), and only a marginal correlation with ΔΩc-60 (r2 = 0.50, p = 0.03). Consistent with this, the all6030 scenario model based on ΔΩc-60 has a ΔAICc of 3.70, suggesting that the model based on T at the time of molt is about 6 times more likely than one based on ΔΩc-60. Similarly, the all3030 scenario based on ΔΩc-30 has a ΔAICc of 6.02, implying that the model based on minimum pH at the time of molt is about 20 times more likely than one based on ΔΩc-30.
3.3 Exoskeleton density in culture experiments
The Pinnixa sp. crab were reared under controlled CO2 conditions for an average of 39 days (min = 23, max = 57), with an average time as zoeae of 26 days (min = 11, max = 46) and the average time as megalopae prior to sampling of 14 days (min = 11, max = 21). There was no statistical difference between the pCO2 treatments in the duration of zoea or megalope stage. However, three of the crabs in the low-pCO2 treatment went through a zoeal molt (z4 to z5) then the molt to megalope (z5 to megalope), whereas all other crabs entered the experiment at the z5 stage and experienced only the z5 to megalope molt. The temperature in all chambers was constant with an overall mean of 10.0°C (s.d. = 0.2°C). Spectrophotometric pH values were not statically different among the replicate chambers, with mean low-pCO2 treatment pH of 8.04 (s.d. = 0.05) and the mean high-pCO2 treatment pH of 7.24 (s.d. = 0.03). Ωc calculated with seacarb.R (Gattuso et al., 2021) using pH and alkalinity input parameters was 2.55 (s.d. = 0.24) and 0.45 (s.d. = 0.03) for the low and high pCO2 treatments, respectively, with alkalinity based on site-specific salinity relationship described in Trigg et al. (2019). The greyscale value of 22.4 for pea crab megalopae reared from zoeae at the 2800 matm pCO2 treatment was effectively identical to the 22.3 measured in specimens from the 400 matm treatment, implying no significant change in exoskeleton density between the two pCO2 treatments.
4 Discussion
4.1 Effect of minimum pH at the time of zoea-megalope molt
Our evaluation of environmental controls on exoskeleton density suggests that conditions at the time of z5-megalope molt, 30 days prior to collection may be especially important. In particular, minimum pH at the time of initial exoskeleton formation emerges as the single best predictor of exoskeleton density, and suggests that density increases by about 16 greyscale units per pH unit. The highest densities are associated with pH values that never fall below about 7.58 during the 24 hours assigned to z5-megalope molt using the DVM30 behavior, while stations where megalopae had lower-density exoskeletons (e.g. 94, 106, 114, and 120) typically exhibit minimum pH values of ~7.5. Hindcast trajectories suggest that low minimum-pH environments typically occur nearshore the western coast of Vancouver Island, but that there is no unique location for relatively high minimum pH values. For example, Figure 3 suggests that megalopae with denser exoskeletons collected at station 100 were more likely to molt from zoeae further offshore western Vancouver Island, while those at station 115 apparently molted mostly in the Salish Sea.
To our knowledge, no study has specifically investigated how environmental factors influence Dungeness crab megalope exoskeleton formation during the molt from zoea, but considerable work supports the plausibility of minimum pH being an important variable. Studies of larval crab survival and development at variable pH values often find higher mortality and slower progression through molt stages at lower pH or higher pCO2 conditions (Descôteaux, 2014; Schiffer et al., 2014; Miller et al., 2016; Giltz and Taylor, 2017; Gravinese et al., 2018; Reinhardt, 2020). Minimum values may be particularly important, and duration-dependent pH thresholds of 7.4 to 7.52 have been identified for larval decapods (Bednaršek et al., 2021), while a pH threshold of 7.43 has been suggested for the survival of blue crab zoea exposed to diel cycling (Tomasetti et al., 2021). A similar threshold response has been observed in juvenile blue king crab (Paralithodes platypus), which showed no change in growth or mortality at pH values of 7.8 and 8.1, but exhibited increased mortality and decreasesd growth at pH = 7.5 (Long et al., 2017). While we cannot be certain that exoskeleton density exhibits a threshold response to minimum pH, our lowest measured greyscale value of ~15 corresponds to a minimum pH at the time of z5-megalope molt of ~7.5 (Figure 5A) that is similar to previously identified thresholds, making it a plausible scenario. Regardless, it appears that the exoskeleton density of Dungeness megalopae are particularly sensitive to short-lived low pH extremes during the z5-megalope molt, and we suggest that greyscale density provides a metric for tracking the severity of those impacts.
The apparent link between minimum pH and exoskeleton density could reflect additional energetic costs at lower pH that may compromise a megalope’s ability to precipitate its exoskeleton. Assuming studies of adult crab are applicable, the molt from z5 to megalope can be broadly divided into a pre-molt stage that includes the preparation for and actual shedding of the old cuticle, and a post-molt stage that consists of new exoskeleton mineralization. The pre-molt stage is characterized by active uptake of monovalent cations (e.g. Na+, K+), which drive an osmotic flux of water into the crab, resulting in large weight gains (Cameron, 1989). Calcium is passively transported across the gills and is stored to be used later during mineralization (Wheatly, 1999; Luquet and Marin, 2004; Luquet, 2012). Immediately after molting, the activity of Ca-ATPase enzymatic pumps and bicarbonate transporter proteins increase to actively bring calcium and bicarbonate into the cuticle (Cameron, 1989; Abehsera et al., 2021). Simultaneous active removal of protons from the cuticle promotes the conversion of bicarbonate to carbonate ion, thereby boosting cuticle Ωc and facilitating rapid calcite precipitation into a complex chitin-protein matrix (Cameron, 1985, 1989; Cameron and Wood, 1985; Luquet, 2012; Figure 6). Protons produced as a calcification byproduct must also be actively pumped away into the ambient seawater to prevent hemolymph acidosis (Cameron, 1985, 1989; Cameron and Wood, 1985; Henry et al., 2012).
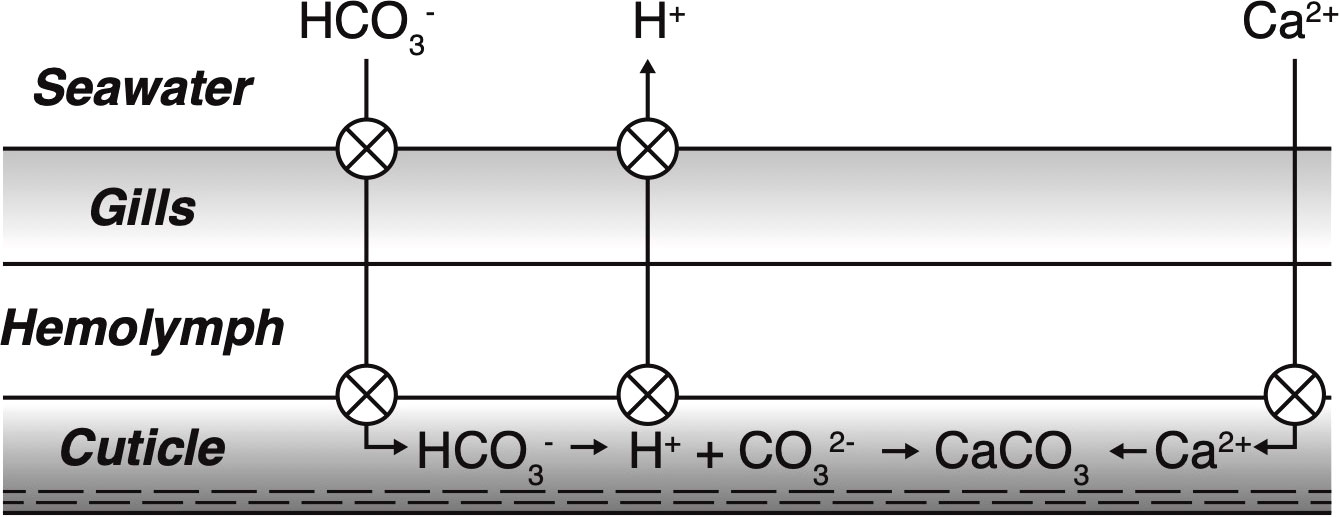
Figure 6 Illustration of post-molt calcification. Crossed circles indicate proposed locations of active transport requiring metabolic energy. Calcium is passively transported across the gills, but actively transported to the site of calcification in the cuticle. Bicarbonate is actively pumped both across the gills and to the site of calcification. Protons are actively pumped from the site of calcification to increase saturation state and remove protons produced during calcite precipitation. To maintain internal acid/base balance, protons are subsequently actively transported across the gills to ambient seawater. Adapted from Cameron, 1989.
The numerous instances of active transport involved in molting and reprecipitation of new exoskeleton (Figure 6) indicate it is an energy intensive process, and the energy required to reach a given cuticle Ωc would increases at lower ambient seawater pH values. For example, the presence of additional protons in ambient seawater at lower pH would mean more protons would need to be actively removed from the site of calcification to boost Ωc to the same degree of supersaturation, which would require additional energy. If this extra energy was not available, cuticle Ωc would decrease and may compromise exoskeleton formation. Considerable evidence suggests that coping with low pH conditions could require megalopae to divert energy to other functions thereby leaving less energy for active pumping and calcification and further compromising the ability to reach a given Ωc. While exposure to low pH or elevated pCO2 conditions has been shown to increase metabolism, oxygen consumption and ATP production in larval crabs (Schiffer et al., 2013; Trigg et al., 2019), this additional energy may disproportionately go to immune function (Niemisto et al., 2021). Similarly, juvenile isopods have been shown to reduce their carbonic anhydrase concentrations at high pCO2 conditions (Turner et al., 2016), which would decrease the efficiency of proton removal (Henry, 1984; Cameron and Wood, 1985) supporting the idea that exoskeleton formation is not a priority for energy expenditure at lower pH values.
When viewed collectively, a possible mechanism linking low pH to reduced exoskeleton density might be as follows: Energy limitations reduce the transport of calcium and bicarbonate to the site of exoskeleton precipitation, and reduce the removal of protons from it. Both contribute to a lower cuticle Ωc, which has been shown to decrease skeletal density and compromise crystal structures in other marine calcifiers (Cohen et al., 2009; Mollica et al., 2018). While additional work is required to confirm this specific hypothesis, it seems likely that an imbalance between the energy needed and the energy available for exoskeleton formation plays a prominent role in explaining the association between lower density exoskeleton and minimum pH at the time of z5-megalope molt.
4.2 Potential influence of temperature
Considerable evidence suggests that the net response of larval crabs to OA can vary due to interactions among other variables such as temperature, DO and food availability (e.g. Small et al., 2015; Gravinese et al., 2018; Trigg et al., 2019; Niemisto et al., 2021; Tomasetti et al., 2021). This is not surprising given that metabolism, respiration and other physiological processes are linked to energy balance, and thus the ability to cope with low pH conditions. While available evidence supports our selection of minimum pH at the time of z5-megalope molt as the most plausible single predictor of megalope exoskeleton density, models based on mean and minimum T at the time of z5-megalope molt also performed well and we further evaluate the importance of these variables.
Dungeness zoea appear to be adapted to temperatures between approximately 10-14°C, outside of which thermal stress can impact growth and development (Reed, 1969; Sulkin and McKeen, 1994, 1989), increase metabolism and carbohydrate consumption, and deplete lipid concentrations (Brown and Terwilliger, 1999; García-Guerrero et al., 2003; Green et al., 2014; Wittmann et al., 2018; Torres and Giménez, 2020). While most studies explore hyperthermal stress, hypothermal stress is also possible, and would generally leave less energy for exoskeleton formation, thereby potentially impacting exoskelton density in a way similar to the pH mechanism described above. Our hindcast experiments indicate that all field-collected megalopae likely molted at mean temperatures below the optimal 10-14°C range, and experienced diel minima of 4.1 to 5.8°C, potentially making them more sensitive to low pH conditions. In light of this, it may be premature to attribute changes in megalope exoskeleton density exclusively to minimum pH at the time of z5-megalope molt, and minimum temperature may also be important.
4.3 Comparison with culture experiments
The suggestion that M. magister megalopae are sensitive to minimum pH is somewhat at odds with our Pinnixa sp. culture experiments, which show no change in exoskeleton density between mean pH values of 7.24 and 8.04. While inter-species differences are a simple explanation for this apparent discrepancy, they are unsatisfying given the broad similarities between larval M. magister and Pinnixa sp. described above. Instead, we suggest the energy imbalance proposed to explain exoskeleton density variations among field-collected megalopae was minimized or eliminated by one or more experimental conditions, thereby allowing Pinnixa sp. exoskeleton formation to proceed relatively normally under both treatments.
A potential difference between field and cultured organisms was their access to food. Previous work suggests that unlimited access to prey can effectively eliminate thermal stress-induced mortality among zoeae and megalopae because it fuels compensatory responses that are too energetically costly under food limitation (Torres and Giménez, 2020). Cultured Pinnixa sp. were fed routinely, potentially providing sufficient energy for additional active pumping among zoeae in the high pCO2 treatment. This may have allowed these individuals to reach the same cuticle Ωc threshold during molt as the zoeae in the lower pCO2 treatment, thereby minimizing the influence of pH and allowing an exoskeleton of similar density to be precipitated. While the food available to field-collected M. magister at the time of z5-megalope molt is not known, it is plausible that they experienced greater food limitation and therefore a more significant response to pH.
Early life stage exposure history represents a variation on this idea that could also contribute to the apparent difference between Pinnixa sp. experiments and M. magister observations. In a study of pH carryover effects in Tanner crabs (Chionoecetes bairdi), Long et al. (2016) compared wild-brooded larvae to those derived from ovigerous females conditioned at pH values of 7.5, 7.8 and 8.1. Wild specimens transferred to low pH experimental conditions showed minimal effects, in much the same way as our Pinnixa sp. experiments. In contrast, larvae exposed to low pH since oogenesis had larger impacts on morphology, size, calcification and metabolic rate (Long et al., 2016). Based on this, it is possible that M. magister megalopae with lower density exoskeletons were not only exposed to suboptimal pH at the time of z5-megalope molt, but also prior to this time from oogenesis through zoeal stages. Such prolonged exposure may have depleted energy reserves, leaving little energy for the additional active pumping necessary to cope with low pH environments. On the other hand, if it is assumed that Pinnixa sp. were collected from an environment to which they were well adapted, their exposure to suboptimal pH in the experiments was brief and they may not have experienced such carryover effects. Pinnixa sp. may have entered experiments with energy reserves that facilitated additional active pumping and therefore no change in exoskeleton density. If correct, this possibility highlights the need for longer duration OA experiments that better capture carryover effects and will allow more realistic comparisons with field collected specimens.
Finally, minimum temperature is a noticeable difference between cultured Pinnixa sp. and field-collected M. magister. Mean temperatures inferred at the time of z5-megalope molt for field-collected M. magister varied from 8.6 to 10.2°C, and were similar to the nearly constant 10°C of culture experiments. However, inferred minimum temperatures for field-collected M. magister ranged from 4.1 to 5.8°C and were markedly cooler than any temperature experienced by Pinnixa sp. during the experiment. As discussed above, we cannot rule out the possibility that M. magister are sensitive to minimum temperature, and if this is the case, it may explain why field-collected specimens exhibit an apparent sensitivity to pH that was not observed among cultured Pinnixa sp. This possibility suggests that additional experiments exploring how larval M. magister exoskeleton formation responds to hypothermal conditions during diel cycling could provide important insight into their overall sensitivity to environmental stressors.
4.4 The relationship between exoskeleton density and dissolution
The weak correlation between exoskeleton greyscale density and dissolution, and the fact that ΔΩc was not selected as a top-performing predictor during our model selection suggests that the two processes are not intimately linked. Instead, we suggest that μCT -based exoskeleton density and SEM-based dissolution severity represent complementary techniques that record responses at different life stages: μCT -based exoskeleton density is set by the conditions at the time of initial megalope exoskeleton formation while SEM-based dissolution severity measures subsequent environmental exposure between the time of exoskeleton formation and collection. Furthermore, the weak relationship between these variables implies either that dissolution does not preferentially remove exoskeleton of a certain density, or that the fraction of exoskeleton lost to dissolution is small, such that the initial density set at the time of z5-megalope molt is not influenced appreciably by subsequent dissolution.
4.5 Comparison with population level data
The population-level response of M. magister megalope to environmental variables is ultimately most useful for informed management decisions. However, we cannot immediately assume that the individual megalope response to minimum pH at the time of z5-megalope molt translates to the population level. While constructing a robust relationship between individual- and population-level responses is not possible with our data set, we make a simple, initial evaluation. As discussed above, our lowest measured greyscale value of ~15 equates to a pH of ~7.5, which represents a plausible threshold below which megalopae may not survive to be observed. If this is correct, and the population-level response is similar to that at the individual level, one would expect the regional distribution of megalope populations predicted from this greyscale threshold to resemble observations. To test this possibility, we used exposure history hindcasts for all WCOA 2016 stations within the JSCOPE domain to determine the minimum pH at their inferred z5-megalope molt locations, which were then linearly transformed into greyscale estimates using the optimal model from the all3030 scenario (Table 3). Applying our proposed greyscale threshold value of ~15, we then predicted where megalopae would be present and absent.
Our predicted pattern of megalope distribution compares favorably to the observed distribution from 2009-2017 spring monitoring surveys (Morgan et al., 2019; Figure 7). While spatial domains do not perfectly overlap, both show megalopae are more likely to be present at more northerly and offshore sites, but are likely to be absent in more coastal and southern waters where pH at the time of z5 molt may fall below ~7.5. One exception is the Columbia River mouth where our simple threshold model erroneously predicts megalopae to be present. This may reflect additional controls on exoskeleton density or megalope presence-absence near low salinity terrestrial sources such as the Columbia River. Despite this shortcoming, the general similarity over much of the domain suggests that μCT based exoskeleton density has potential to inform population-level megalope responses, and therefore may be a valuable tool for making management decisions.
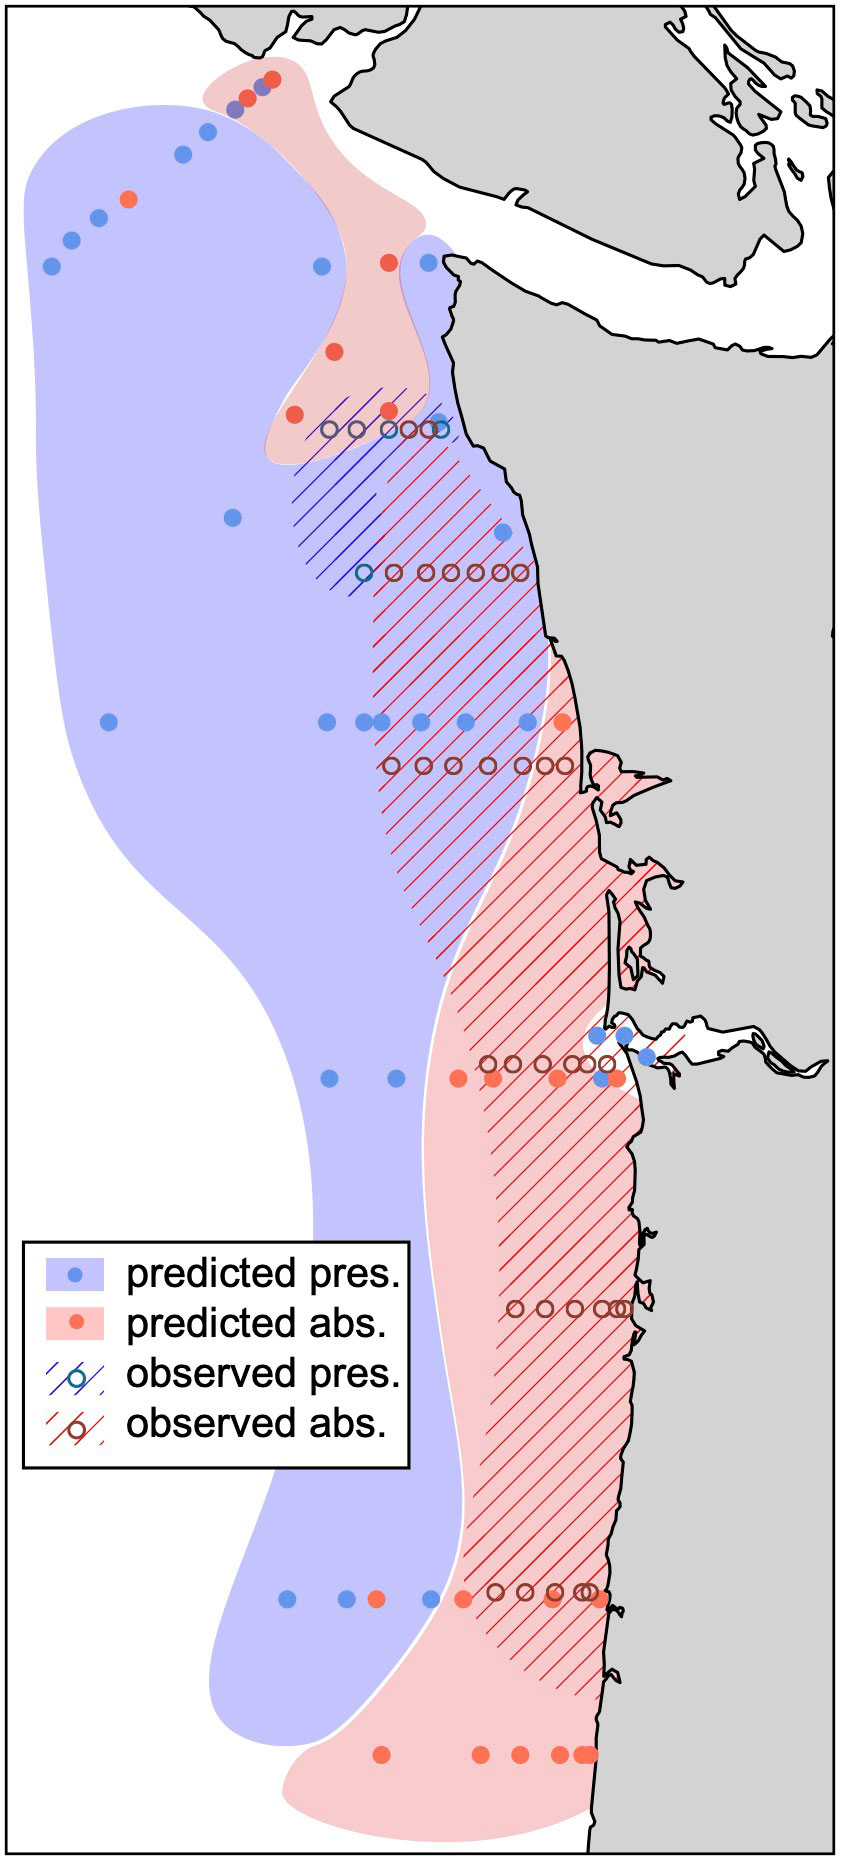
Figure 7 Observed distribution of M. magister megalope presence (blue hatch, open circle) and absence (red hatch, open circle) from Morgan et al. (2019) compared with predicted presence (filled blue) and absence (filled red) in this study. Predictions use 30-day J-SCOPE hindcast simulations (see Methods) to calculate minimum pH at the time of z5-megalope molt for all northern California Current stations sampled during the 2016 WCOA cruise. The mean greyscale values of hypothetical megalopae at each site are then calculated using our best model (Table 3; Figure 5A) and predicted to be present or absent based on a greyscale threshold of 15.
In addition, we suggest μCT-based exoskeleton density also has the potential to provide more nuanced information on M. magister populations impacted by environmental conditions including OA. For example, field surveys that find megalopae to be present, but with a greyscale density approaching our proposed threshold of 15, could suggest a severely impaired population. Conversely, a location where megalopae are present and have appreciably higher greyscale values could reflect a significantly healthier population. By combining such field data with hindcast trajectories, it may also be possible to identify at-risk habitats thereby supporting more informed management decisions. For example, hindcast trajectories for populations with greyscale values near our threshold could identify locations of z5-megalope molt that are most likely to experience minimum pH values near or below 7.5. These regions could then receive special consideration when designing habitat monitoring programs.
5 Conclusion
To our knowledge, this is the first study to demonstrate resolvable differences in exoskeleton density among field-collected Dungeness crab megalopae using μCT. Exoskeleton density changes are best explained by variations in the minimum pH at the time of z5-megalope molt with higher densities being associated with higher minimum pH. We suggest that this relationship arises for two reasons associated with the energetic costs of exoskeleton formation. First, the higher concentration of protons in seawater at lower pH requires additional active pumping to reach a given cuticle Ωc, which would require additional energy. At the same time, less energy is available as it is diverted to other processes aimed at coping with a higher acidity environment. Minimum temperature at the time of z5-megalope molt also explains much of the variability in exoskeleton density implying that other environmental variables may interact to produce the observed density variations, and additional work is necessary to evaluate their relative influences.
Despite remaining uncertainties, minimum conditions at the approximate time of z5-megalope molt are routinely selected as the best predictors of exoskeleton density. This is noteworthy for two reasons. First, it highlights the importance of carryover effects and suggests that prior environmental conditions could have a large influence on the vitality of megalope populations. Given the connection between megalopae and adult populations (Shanks and Roegner, 2007; Park, 2012; Shanks, 2013), our results support efforts to consider the entire life cycle of M. magister when evaluating environmental impacts (e.g. Berger et al., 2021). Second, our result supports the importance of extreme events that might surpass critical thresholds as potentially being more important than mean conditions. Both results provide support for conducting additional culture experiments that rear M. magister from egg through all life stages, especially those that include realistic cycling across plausible maxima and minima (e.g Tomasetti et al., 2021).
We establish μCT-based greyscale density as a promising metric of crab larvae condition that is more nuanced than simple presence-absence observations. While our conclusions are based on a relatively small sample size, available evidence generally supports their validity across the larger region. Additional analyses of field-collected specimens are still warranted however, especially considering the potentially anomalous conditions associated with the North Pacific marine heatwave of 2016 (Bond et al., 2015). Such analyses should be readily achievable given that the method we describe is relatively fast, economical, and well-suited to high throughput measurements. With further refinement, we anticipate that μCT analyses will be a valuable addition to the suite of tools used to monitor the health of Dungeness crab larvae, thereby facilitating more informed management decisions related to the Dungeness crab fishery and more accurate model projections.
Data availability statement
The original contributions presented in the study are included in the article/Supplementary Material. Further inquiries can be directed to the corresponding author.
Author contributions
CS was the principal author of the manuscript, conducted μCT scans, and performed statistical tests with input from PE, SB, SS and EN. NB, SA and RF collected and processed biological samples, seawater geochemical data and ocean condition observations. SS, EN and AH designed and conducted particle tracking simulations. CS, PE, EN, SB, SS, SA, RF, AH and NB contributed to the writing and editing of the manuscript. All authors contributed to the article and approved the submitted version.
Funding
We thank the NOAA Ocean Acidification Program for funding this work. Portions of this study were funded by the NOAA Northwest Fisheries Science Center. The contributions of SA and RF were supported by NOAA Pacific Marine Environmental Laboratory (PMEL) and the NOAA Ocean Acidification Program. This is PMEL contribution number 5314. NB acknowledges support from the Slovene Research Agency project # J12468.
Acknowledgments
We thank Adam Summers for valuable discussions of mCT methods, Ian Inochs for comments on the manuscript, the Swinomish Tribe for collection of pea crab zoeae, and Kate Rovinski, Mike Maher and Danielle Perez for assisting in pea crab culture experiments. This work would not have been possible without the support of NOAA’s Ocean Acidification Program, Pacific Marine Environmental Laboratory (PMEL) and Northwest Fisheries Science Center. This is PMEL contribution number 5314.
Conflict of interest
The authors declare that the research was conducted in the absence of any commercial or financial relationships that could be construed as a potential conflict of interest.
Publisher’s note
All claims expressed in this article are solely those of the authors and do not necessarily represent those of their affiliated organizations, or those of the publisher, the editors and the reviewers. Any product that may be evaluated in this article, or claim that may be made by its manufacturer, is not guaranteed or endorsed by the publisher.
Supplementary material
The Supplementary Material for this article can be found online at: https://www.frontiersin.org/articles/10.3389/fmars.2023.1095253/full#supplementary-material
References
Abehsera S., Bentov S., Li X., Weil S., Manor R., Sagi S., et al. (2021). Genes encoding putative bicarbonate transporters as a missing molecular link between molt and mineralization in crustaceans. Sci. Rep. 11, 11722. doi: 10.1038/s41598-021-91155-w
Akaike H. (1974). A new look at the statistical model identification. IEEE Trans. Autom. Control 19, 716–723. doi: 10.1109/TAC.1974.1100705
Alma L., Kram K. E., Holtgrieve G. W., Barbarino A., Fiamengo C. J., Padilla-Gamiño J. L. (2020). Ocean acidification and warming effects on the physiology, skeletal properties, and microbiome of the purple-hinge rock scallop. Comp. Biochem. Physiol. A. Mol. Integr. Physiol. 240, 110579. doi: 10.1016/j.cbpa.2019.110579
Bancroft M. P. (2015). An experimental investigation of the effects of temperature and dissolved oxygen on the growth of juvenile English sole and juvenile dungeness crab (Oregon State University). Available at: https://seagrant.oregonstate.edu/sgpubs/experimental-investigation-effects-temperature-and-dissolved-oxygen-growth-juvenile-english.
Ban N. C., Eckert L., McGreer M., Frid A. (2017). Indigenous knowledge as data for modern fishery management: a case study of dungeness crab in pacific Canada. Ecosyst. Health Sustain. 3, 1379887. doi: 10.1080/20964129.2017.1379887
Bednaršek N., Ambrose R., Calosi P., Childers R. K., Feely R. A., Litvin S. Y., et al. (2021). Synthesis of thresholds of ocean acidification impacts on decapods. Front. Mar. Sci. 8. doi: 10.3389/fmars.2021.651102
Bednaršek N., Feely R. A., Beck M. W., Alin S. R., Siedlecki S. A., Calosi P., et al. (2020). Exoskeleton dissolution with mechanoreceptor damage in larval dungeness crab related to severity of present-day ocean acidification vertical gradients. Sci. Total Environ. 716, 136610. doi: 10.1016/j.scitotenv.2020.136610
Bednaršek N., Feely R. A., Tolimieri N., Hermann A. J., Siedlecki S. A., Waldbusser G. G., et al. (2017). Exposure history determines pteropod vulnerability to ocean acidification along the US West coast. Sci. Rep. 7, 4526. doi: 10.1038/s41598-017-03934-z
Berger H. M., Siedlecki S. A., Matassa C. M., Alin S. R., Kaplan I. C., Hodgson E. E., et al. (2021). Seasonality and life history complexity determine vulnerability of dungeness crab to multiple climate stressors. AGU Adv. 2(4),19. doi: 10.1029/2021AV000456
Bignami S., Enochs I. C., Manzello D. P., Sponaugle S., Cowen R. K. (2013). Ocean acidification alters the otoliths of a pantropical fish species with implications for sensory function. Proc. Natl. Acad. Sci. 110, 7366–7370. doi: 10.1073/pnas.1301365110
Boßelmann F., Romano Triguero P., Fabritius H.-O., Raabe D., Epple M. (2007). The composition of the exoskeleton of two crustacea: The American lobster homarus americanus and the edible crab cancer pagurus. Thermochim. Acta 463, 65–68. doi: 10.1016/j.tca.2007.07.018
Bolze J., Peng B., Dingenouts N., Panine P., Narayanan T., Ballauff M. (2002). Formation and growth of amorphous colloidal CaCO3 precursor particles as detected by time-resolved SAXS. Langmuir 18, 8364–8369. doi: 10.1021/la025918d
Bond N. A., Cronin M. F., Freeland H., Mantua N. (2015). Causes and impacts of the 2014 warm anomaly in the NE pacific. Geophys. Res. Lett. 42, 3414–3420. doi: 10.1002/2015GL063306
Brown A. C., Terwilliger N. B. (1999). Developmental changes in oxygen uptake in cancer magister (Dana) in response to changes in salinity and temperature. J. Exp. Mar. Biol. Ecol. 241, 179–192. doi: 10.1016/S0022-0981(99)00071-4
Burnham K. P., Anderson D. R. (2010). Model selection and multimodel inference: a practical information-theoretic approach. 2. ed (New York, NY: Springer).
Burnham K. P., Anderson D. R., Huyvaert K. P. (2011). AIC model selection and multimodel inference in behavioral ecology: some background, observations, and comparisons. Behav. Ecol. Sociobiol. 65, 23–35. doi: 10.1007/s00265-010-1029-6
Busch D. S., McElhany P. (2016). Estimates of the direct effect of seawater pH on the survival rate of species groups in the California current ecosystem. PloS One 11, e0160669. doi: 10.1371/journal.pone.0160669
Cameron J. N. (1985). Post-moult calcification in the blue crab (Callinectes sapidus): Relationships between apparent net h+ excretion, calcium and bicarbonate. J. Exp. Mar. Biol. Ecol. 119, 275–285. doi: 10.1242/jeb.119.1.275
Cameron N. (1989). Post-moult calcification in the blue crab callinectes sapidus: timing and mechanisms. J. Exp. Mar. Biol. Ecol. 143, 285–304. doi: 10.1242/jeb.143.1.285
Cameron J. N., Wood C. M. (1985). Apparent h+ excretion and CO2 dynamics accompanying carapace mineralization in the blue crab (Callinectessapidus) following moulting. J. Exp. Mar. Biol. Ecol. 114, 181–196. doi: 10.1242/jeb.114.1.181
Cantin N. E., Cohen A. L., Karnauskas K. B., Tarrant A. M., McCorkle D. C. (2010). Ocean warming slows coral growth in the central red Sea. Science. 329 (5989), 322–325. doi: 10.1126/science.1190182
Carlstrom D. (1957). The crystal structure of alpha-chitin (poly-N-acetyl-D-glucosamine). J. Biophys. Biochem. Cytol. 3, 669–683. doi: 10.1083/jcb.3.5.669
Chan F., Barth J. A., Blanchette C. A., Byrne R. H., Chavez F., Cheriton O., et al. (2017). Persistent spatial structuring of coastal ocean acidification in the California current system. Sci. Rep. 7, 2526. doi: 10.1038/s41598-017-02777-y
Chatzinikolaou E., Grigoriou P., Keklikoglou K., Faulwetter S., Papageorgiou N. (2017). The combined effects of reduced pH and elevated temperature on the shell density of two gastropod species measured using micro-CT imaging. ICES J. Mar. Sci. 74, 1135–1149. doi: 10.1093/icesjms/fsw219
Chatzinikolaou E., Keklikoglou K., Grigoriou P. (2021). Morphological properties of gastropod shells in a warmer and more acidic future ocean using 3D micro-computed tomography. Front. Mar. Sci. 8. doi: 10.3389/fmars.2021.645660
Chavez F., Pennington J. T., Michisaki R., Blum M., Chavez G., Friederich J., et al. (2017). Climate variability and change: Response of a coastal ocean ecosystem. Oceanography 30, 128–145. doi: 10.5670/oceanog.2017.429
Christmas A.-M. F. (2013). Effects of ocean acidification on dispersal behavior in the larval stage of the dungeness crab and the pacific green shore crab (Western Washington University). Available at: https://cedar.wwu.edu/wwuet/306/.
Cohen A. L., McCorkle D. C., Putron S., Gaetani G. A., Rose K. A. (2009). Morphological and compositional changes in the skeletons of new coral recruits reared in acidified seawater: Insights into the biomineralization response to ocean acidification. Geochem. Geophys. Geosyst. 10(7), 12. doi: 10.1029/2009GC002411
Descôteaux R. (2014). Effects of ocean acidification on development of alaskan crab larvae (Thesis) (University of Alaska Fairbanks). Available at: https://scholarworks.alaska.edu/handle/11122/4532.
Di Santo V. (2019). Ocean acidification and warming affect skeletal mineralization in a marine fish. Proc. R. Soc B Biol. Sci. 286, 20182187. doi: 10.1098/rspb.2018.2187
Doney S. C., Busch D. S., Cooley S. R., Kroeker K. J. (2020). The impacts of ocean acidification on marine ecosystems and reliant human communities. Annu. Rev. Environ. Resour. 45, 83–112. doi: 10.1146/annurev-environ-012320-083019
Enochs I. C., Manzello D. P., Kolodziej G., Noonan S. H. C., Valentino L., Fabricius K. E. (2016). Enhanced macroboring and depressed calcification drive net dissolution at high-CO2 coral reefs. Proc. R. Soc B Biol. Sci. 283, 20161742. doi: 10.1098/rspb.2016.1742
Feely R. A., Alin S. R., Carter B., Bednaršek N., Hales B., Chan F., et al. (2016). Chemical and biological impacts of ocean acidification along the west coast of north America. Estuar. Coast. Shelf Sci. 183, 260–270. doi: 10.1016/j.ecss.2016.08.043
Feely R. A., Byrne R. H., Acker J. G., Betzer P. R., Chen C.-T. A., Gendron J. F., et al. (1988). Winter-summer variations of calcite and aragonite saturation in the northeast pacific. Mar. Chem. 25, 227–241. doi: 10.1016/0304-4203(88)90052-7
Fordyce A. J., Knuefing L., Ainsworth T. D., Beeching L., Turner M., Leggat W. (2020). Understanding decay in marine calcifiers: Micro-CT analysis of skeletal structures provides insight into the impacts of a changing climate in marine ecosystems. Methods Ecol. Evol. 11, 1021–1041. doi: 10.1111/2041-210X.13439
García-Guerrero M., Villarreal H., Racotta I. S. (2003). Effect of temperature on lipids, proteins, and carbohydrates levels during development from egg extrusion to juvenile stage of cherax quadricarinatus (Decapoda: Parastacidae). Comp. Biochem. Physiol. A. Mol. Integr. Physiol. 135, 147–154. doi: 10.1016/s1095-6433(02)00354-9
Gattuso J. P., Epitalon J. M., Lavigne H., Orr J. (2021). seacarb: Seawater carbonate chemistry. R package version 3.3.0. doi: 10.5281/zenodo.4600014
Giltz S. M., Taylor C. M. (2017). Reduced growth and survival in the larval blue crab callinectes sapidus under predicted ocean acidification. J. Shellfish Res. 36, 481–485. doi: 10.2983/035.036.0219
Gossner H. M. (2018). Quantifying sensitivity and adaptive capacity of shellfish in the northern California current ecosystem to increasing prevalence of ocean acidification and hypoxia (Oregon State University). Available at: https://seagrant.oregonstate.edu/sgpubs/quantifying-sensitivity-and-adaptive-capacity-shellfish-northern-california-current-ecosystem.
Gravinese P. M., Enochs I. C., Manzello D. P., van Woesik R. (2018). Warming and pCO2 effects on Florida stone crab larvae. Estuar. Coast. Shelf Sci. 204, 193–201. doi: 10.1016/j.ecss.2018.02.021
Gravinese P. M., Enochs I. C., Manzello D. P., van Woesik R. (2019). Ocean acidification changes the vertical movement of stone crab larvae. Biol. Lett. 15, 20190414. doi: 10.1098/rsbl.2019.0414
Green B. S., Gardner C., Hochmuth J. D., Linnane A. (2014). Environmental effects on fished lobsters and crabs. Rev. Fish Biol. Fish. 2, 613–638. doi: 10.1007/s11160-014-9350-1
Hauri C., Gruber N., McDonnell A. M. P., Vogt M. (2013). The intensity, duration, and severity of low aragonite saturation state events on the California continental shelf. Geophys. Res. Lett. 40, 3424–3428. doi: 10.1002/grl.50618
Henry R. P. (1984). The role of carbonic anhydrase in blood ion and acid-base regulation. Am. Zool. 24, 241–251. doi: 10.1093/icb/24.1.241
Henry R. P., Lucu Č., Onken H., Weihrauch D. (2012). Multiple functions of the crustacean gill: osmotic/ionic regulation, acid-base balance, ammonia excretion, and bioaccumulation of toxic metals. Front. Physiol. 3. doi: 10.3389/fphys.2012.00431
Hobbs R. C., Botsford L. W. (1992). Diel vertical migration and timing of metamorphosis of larvae of the dungeness crab cancer magister. Mar. Biol. 112, 417–428. doi: 10.1007/BF00356287
Hodgson E. E., Kaplan I. C., Marshall K. N., Leonard J., Essington T. E., Busch D. S., et al. (2018). Consequences of spatially variable ocean acidification in the California current: Lower pH drives strongest declines in benthic species in southern regions while greatest economic impacts occur in northern regions. Ecol. Model. 383, 106–117. doi: 10.1016/j.ecolmodel.2018.05.018
Imm J. (2015). “Effects of elevated CO2 and decreased dissolved oxygen on phototactic behaviors of juvenile dungeness crab (Cancer magister),” in 2015 AGU Fall Meeting. Available at: https://ui.adsabs.harvard.edu/abs/2016AGUOSAH54A0096I/abstract.
Iwasaki S., Kimoto K., Sasaki O., Kano H., Uchida H. (2019). Sensitivity of planktic foraminiferal test bulk density to ocean acidification. Sci. Rep. 9, 9803. doi: 10.1038/s41598-019-46041-x
Johnson R., Harianto J., Thomson M., Byrne M. (2020). The effects of long-term exposure to low pH on the skeletal microstructure of the sea urchin heliocidaris erythrogramma. J. Exp. Mar. Biol. Ecol. 523, 151250. doi: 10.1016/j.jembe.2019.151250
Long W. C., Swiney K. M., Foy R. J. (2016). Effects of high pCO2 on tanner crab reproduction and early life history, part II: carryover effects on larvae from oogenesis and embryogenesis are stronger than direct effects. ICES J. Mar. Sci. 73, 836–848. doi: 10.1093/icesjms/fsv251
Long W. C., Van Sant S. B., Swiney K. M., Foy R. J. (2017). Survival, growth, and morphology of blue king crabs: effect of ocean acidification decreases with exposure time. ICES J. Mar. Sci. 74, 1033–1041. doi: 10.1093/icesjms/fsw197
Lough G. (1976). Larval dynamics of the dungeness crab, cancer magister, off the central Oregon coast 1970-71. Fish. Bull. 74, 24.
Luquet G. (2012). Biomineralizations: insights and prospects from crustaceans. ZooKeys 176, 103–121. doi: 10.3897/zookeys.176.2318
Luquet G., Marin F. (2004). Biomineralisations in crustaceans: storage strategies. comptes rendus palevol. BIOMINERALISATION : DIVERSITE ET UNITE 3, 515–534. doi: 10.1016/j.crpv.2004.07.015
Magel C. L., Lee E. M. J., Strawn A. M., Swieca K., Jensen A. D. (2020). Connecting crabs, currents, and coastal communities: Examining the impacts of changing ocean conditions on the distribution of U.S. West coast dungeness crab commercial catch. Front. Mar. Sci. 7. doi: 10.3389/fmars.2020.00401
Malick M. J., Siedlecki S. A., Norton E. L., Kaplan I. C., Haltuch M. A., Hunsicker M. E., et al. (2020). Environmentally driven seasonal forecasts of pacific hake distribution. Front. Mar. Sci. 7. doi: 10.3389/fmars.2020.578490
Marshall K. N., Kaplan I. C., Hodgson E. E., Hermann A., Busch D. S., McElhany P., et al. (2017). Risks of ocean acidification in the California current food web and fisheries: ecosystem model projections. Glob. Change Biol. 23, 1525–1539. doi: 10.1111/gcb.13594
McElhany P., Busch D. S., Lawrence A., Maher M., Perez D., Reinhardt E. M., et al. (2022). Higher survival but smaller size of juvenile dungeness crab (Metacarcinus magister) in high CO2. J. Exp. Mar. Biol. Ecol. 555, 151781. doi: 10.1016/j.jembe.2022.151781
Mekkes L., Renema W., Bednaršek N., Alin S. R., Feely R. A., Huisman J., et al. (2021). Pteropods make thinner shells in the upwelling region of the California current ecosystem. Sci. Rep. 11, 1731. doi: 10.1038/s41598-021-81131-9
Meng Y., Guo Z., Fitzer S. C., Upadhyay A., Chan V. B. S., Li C., et al. (2018). Ocean acidification reduces hardness and stiffness of the Portuguese oyster shell with impaired microstructure: a hierarchical analysis. Biogeosciences 15, 6833–6846. doi: 10.5194/bg-15-6833-2018
Miller J. J., Maher M., Bohaboy E., Friedman C. S., McElhany P. (2016). Exposure to low pH reduces survival and delays development in early life stages of dungeness crab (Cancer magister). Mar. Biol. 163, 118. doi: 10.1007/s00227-016-2883-1
Mollica N. R., Guo W., Cohen A. L., Huang K.-F., Foster G. L., Donald H. K., et al. (2018). Ocean acidification affects coral growth by reducing skeletal density. Proc. Natl. Acad. Sci. 115, 1754–1759. doi: 10.1073/pnas.1712806115
Morgan C. A., Beckman B. R., Weitkamp L. A., Fresh K. L. (2019). Recent ecosystem disturbance in the northern California current. Fisheries 44, 465–474. doi: 10.1002/fsh.10273
Niemisto M., Fields D. M., Clark K. F., Waller J. D., Greenwood S. J., Wahle R. A. (2021). American Lobster postlarvae alter gene regulation in response to ocean warming and acidification. Ecol. Evol. 11, 806–819. doi: 10.1002/ece3.7083
Norton E. L., Siedlecki S., Kaplan I. C., Hermann A. J., Fisher J. L., Morgan C. A., et al. (2020). The importance of environmental exposure history in forecasting dungeness crab megalopae occurrence using J-SCOPE, a high-resolution model for the US pacific Northwest. Front. Mar. Sci. 7. doi: 10.3389/fmars.2020.00102
Ofstad S., Zamelczyk K., Kimoto K., Chierici M., Fransson A., Rasmussen T. L. (2021). Shell density of planktonic foraminifera and pteropod species limacina helicina in the barents Sea: Relation to ontogeny and water chemistry. PloS One 16, e0249178. doi: 10.1371/journal.pone.0249178
Pacific States Marine Fisheries Commission Fisher (2019). Species report: Commercial land catch: Metric-tons (mt), revenue, and price-per-pound (Price/Lbs) (Portland, OR: Pacific States Marine Fisheries Commission).
Park W.-G. (2012). Dynamics of adult and larval dungeness crabs: Larval abundance as an indicator of adult abundance in regional populations. J. Fish. Mar. Sci. Educ. 24, 9–17. doi: 10.13000/JFMSE.2012.24.1.009
Rasmuson L. K. (2013). The biology, ecology and fishery of the dungeness crab, cancer magister. Adv. Mar. Biol. 65, 95–148. doi: 10.1016/B978-0-12-410498-3.00003-3
Reed P. H. (1969). Culture methods and effects of temperature and salinity on survival and growth of dungeness crab (Cancer magister) larvae in the laboratory. J. Fish. Res. Board Can. 26, 389–397. doi: 10.1139/f69-037
Reinhardt E. (2020). The effects of ocean acidifcation on molt rate and carapace area in juvenile dungeness crabs (Cancer magister) (Georgia Institute of Technology). Available at: https://smartech.gatech.edu/handle/1853/64840.
Richerson K., Punt A. E., Holland D. S. (2020). Nearly a half century of high but sustainable exploitation in the dungeness crab (Cancer magister) fishery. Fish. Res. 226, 105528. doi: 10.1016/j.fishres.2020.105528
Saenger C., Cohen A. L., Oppo D. W., Halley R. B., Carilli J. E. (2009). Surface-temperature trends and variability in the low-latitude north Atlantic since 1552. Nat. Geosci. 2, 492–495. doi: 10.1038/ngeo552
Saenger C. P., Evans M. N. (2019). Calibration and validation of environmental controls on planktic foraminifera Mg/Ca using global core-top data. Paleoceanogr. Paleoclimatol. 34, 1249–1270. doi: 10.1029/2018PA003507
Schiffer M., Harms L., Pörtner H. O., Lucassen M., Mark F. C., Storch D. (2013). Tolerance of hyas araneus zoea I larvae to elevated seawater PCO2 despite elevated metabolic costs. Mar. Biol. 160, 1943–1953. doi: 10.1007/s00227-012-2036-0
Schiffer M., Harms L., Pörtner H., Mark F., Storch D. (2014). Pre-hatching seawater pCO2 affects development and survival of zoea stages of Arctic spider crab hyas araneus. Mar. Ecol. Prog. Ser. 501, 127–139. doi: 10.3354/meps10687
Shanks A. L. (2013). Atmospheric forcing drives recruitment variation in the dungeness crab (Cancer magister), revisited. Fish. Oceanogr. 22, 263–272. doi: 10.1111/fog.12020
Shanks A. L., Roegner G. C. (2007). Recruitment limitation in dungeness crab populations is driven by variation in atmospheric forcing. Ecology 88, 1726–1737. doi: 10.1890/06-1003.1
Siedlecki S. A., Kaplan I. C., Hermann A. J., Nguyen T. T., Bond N. A., Newton J. A., et al. (2016). Experiments with seasonal forecasts of ocean conditions for the northern region of the California current upwelling system. Sci. Rep. 6, 27203. doi: 10.1038/srep27203
Small D. P., Calosi P., Boothroyd D., Widdicombe S., Spicer J. I. (2015). Stage-specific changes in physiological and life-history responses to elevated temperature and p co2 during the larval development of the European lobster Homarus gammarus (L.). Physiol. Biochem. Zool. 88, 494–507. doi: 10.1086/682238
Sulkin S. D., McKeen G. L. (1989). Laboratory study of survival and duration of individual zoeal stages as a function of temperature in the brachyuran crab cancer magister. Mar. Biol. 103, 31–37. doi: 10.1007/BF00391062
Sulkin S. D., McKeen G. (1994). Influence of temperature on larval development of four co-occurring species of the brachyuran genus cancer. Mar. Biol. 118, 593–600. doi: 10.1007/BF00347506
Sulkin S., Mojica E., McKeen G. (2011). Elevated summer temperature effects on megalopal and early juvenile development in the dungeness crab, cancer magister. Can. J. Fish. Aquat. Sci. 53, 2076–2079. doi: 10.1139/cjfas-53-9-2076
Tomasetti S. J., Kraemer J. R., Gobler C. J. (2021). Brief episodes of nocturnal hypoxia and acidification reduce survival of economically important blue crab (Callinectes sapidus) larvae. Front. Mar. Sci. 8. doi: 10.3389/fmars.2021.720175
Torres G., Giménez L. (2020). Temperature modulates compensatory responses to food limitation at metamorphosis in a marine invertebrate. Funct. Ecol. 34, 1564–1576. doi: 10.1111/1365-2435.13607
Trigg S. A., McElhany P., Maher M., Perez D., Busch D. S., Nichols K. M. (2019). Uncovering mechanisms of global ocean change effects on the dungeness crab (Cancer magister) through metabolomics analysis. Sci. Rep. 9, 10717. doi: 10.1038/s41598-019-46947-6
Turner L. M., Ricevuto E., Massa Gallucci A., Lorenti M., Gambi M.-C., Calosi P. (2016). Metabolic responses to high pCO2 conditions at a CO2 vent site in juveniles of a marine isopod species assemblage. Mar. Biol. 163, 211. doi: 10.1007/s00227-016-2984-x
Walther K., Anger K., Pörtner H. O. (2010). Effects of ocean acidification and warming on the larval development of the spider crab hyas araneus from different latitudes (54° vs. 79°N). Mar. Ecol. Prog. Ser. 417, 159–170. doi: 10.3354/meps08807
Wheatly M. G. (1999). Calcium homeostasis in crustacea: The evolving role of branchial, renal, digestive and hypodermal epithelia. J. Exp. Zool. 283, 620–640. doi: 10.1002/(SICI)1097-010X(19990601)283:7<620::AID-JEZ2>3.0.CO;2-3
Wild P. W. (1980). Effects of seawater temperature on spawning, egg development, hatching success, and population fluctuations of the dungeness crab. Cancer magister 21, 115–120.
Wilks D. S. (2006). Statistical methods in the atmospheric sciences. 2nd ed (Amsterdam ; Boston: Academic Press).
Keywords: crab, megalopa larvae, zoea larva, computed tomography, exoskeleton density, ocean acidification
Citation: Saenger CP, McElhany P, Norton EL, Busch DS, Siedlecki SA, Alin SR, Feely RA, Hermann AJ and Bednaršek N (2023) Evaluating environmental controls on the exoskeleton density of larval Dungeness crab via micro computed tomography. Front. Mar. Sci. 10:1095253. doi: 10.3389/fmars.2023.1095253
Received: 10 November 2022; Accepted: 23 January 2023;
Published: 10 February 2023.
Edited by:
Jonathan Y.S. Leung, University of Adelaide, AustraliaReviewed by:
Eva Chatzinikolaou, Hellenic Centre for Marine Research, GreeceXinqing Zheng, State Oceanic Administration, China
Copyright © 2023 Saenger, McElhany, Norton, Busch, Siedlecki, Alin, Feely, Hermann and Bednaršek. This is an open-access article distributed under the terms of the Creative Commons Attribution License (CC BY). The use, distribution or reproduction in other forums is permitted, provided the original author(s) and the copyright owner(s) are credited and that the original publication in this journal is cited, in accordance with accepted academic practice. No use, distribution or reproduction is permitted which does not comply with these terms.
*Correspondence: Casey P. Saenger, c2FlbmdlY0B3d3UuZWR1