 Wenyun Guo
 Ding Yao1
 Jianzhong Ge
- 1College of Ocean Science and Engineering, Shanghai Maritime University, Shanghai, China
- 2State Key Laboratory of Estuarine and Coastal Research, East China Normal University, Shanghai, China
- 3Institute of Eco-Chongming (IEC), Chenjiazhen, Shanghai, China
Tropical cyclone (TC)-induced coastal flooding can lead to severe hazards in low-lying lands and is expected to be exacerbated by sea level rise and TC climatology changes related to the warming climate. Since the dense population in Xiamen Bay, Fujian, China, it is highly valuable in understanding coastal flooding of it, but little studies involved this topic. In this study, we establish a high-resolution numerical model covering all coastal low-lying land in Xiamen Bay based on FVCOM. This model is then used to assess the flood risk in Xiamen Bay under TCs with 10-, 100-, and 1000-year pressures by applying a multi-tracks blend method. The results show that 126 km2 of low-lying area can be flooded periodically by astronomical tides; and 388, 504, and 598 km2 of low-lying area can be flooded under TCs with 10-, 100-, and 1000-year pressures, accompanied by increased average flood depths of 2.3, 2.8, and 3.4 m, respectively. By 2100 under SSP5-8.5, the well-protected Xiamen Island becomes impacted by TCs with 10-year pressure, and flood areas under TCs with 100-year pressure are estimated to be nearly equivalent to that under TCs with 1000-year pressure at the current climate. The most increased exposure area by climate change are artificial surfaces and agricultural areas, showing the potential higher flood disasters in future.
1 Introduction
Coastal flood is among the most frequent and devastating natural hazards in coastal areas, resulting in severe building damages, property losses, and even mass casualties. On the basis of over 600 million people living in low-lying coastal areas (McGranahan et al., 2007) there are an estimated 0.8–1.1 million people on average per year who experience flooding globally (Hinkel et al., 2014). Nevertheless, the persistent coastal migration will increase population and property exposure, which is expected to exacerbate the flood risk of coastal areas (Zhang et al., 2018). Therefore, it is of great significance to quantify flood hazards at regional scales.
Coastal flood can be induced by river flooding, heavy rainfall, extreme astronomical high tide, storm surges, and wave setup related to tropical cyclones (TCs), and other extreme events (Gao et al., 2014; Ray and Foster, 2016; Chang et al., 2018; Shih et al., 2018; Yin et al., 2021b; Gori et al., 2022). Among them, TCs consistently act as one of the dominant drivers for coastal flood losses (Orton et al., 2020). The characteristics of TCs, such as intensity, size, and track, can significantly influence coastal floods. Due to the crucial importance of TC intensity on storm surge and flood disasters, an index named the Saffir-Simpson hurricane wind scale, which relies only on maximum sustained wind speed, has been used for nearly five decades by the US to estimate the potential damage of a TC. Moreover, it is reported that 20% errors in maximum wind speed can cause significant errors in storm surge prediction (Torres et al., 2019). For TCs with larger size, they are expected to induce stronger storm surges (Irish et al., 2008; Islam and Takagi, 2020), whereas a slower TC will impact the coastal waters longer and give rise to heavier rain and flood (Rego and Li, 2009; Wei et al., 2019). In addition, approach angle (Pandey and Rao, 2019), landfall location (Sun et al., 2015), and storm timing (Thomas et al., 2019) are all among the key factors influencing storm surge and coastal flood.
Statistics and numerical simulations show that modulations in TC intensity and movement under climate change will lead to changes in coastal flood (Mendelsohn et al., 2012; Knutson et al., 2020; Zhang et al., 2020). TCs reaching very intense levels (categories 4 and 5 on the Saffir-Simpson scale) are reported to occur more frequently in past five decades (Webster et al., 2005). A significant increase (12%–15%) in the intensity of landfalling TCs is also found since the 1970s (Mei and Xie, 2016) and will continue in the warmer future (Patricola and Wehner, 2018). The increasing intensity and growing frequency in very intense TCs are widely accepted trends in TC climatology (Knutson et al., 2019; Knutson et al., 2020). Freshening of the upper ocean caused by greater TC rainfall may be a mechanism contributing to the changes in intensity, as it can reduce the ability of TCs to cool the upper ocean (Balaguru et al., 2016).
Characterizing the trend of TC forward speed is also of great interest in many studies, but the detected results are controversial. Kossin (2018) showed that the forward speed of TCs has decreased globally by 10% from 1949 to 2016 based on recorded best-track datasets. The magnitude of the slowdown varies in basins, with the largest slowdown happening in the western North Pacific basin. However, Moon et al. (2019) and Lanzante (2019) cast doubts on this conclusion because the poor-quality records during the pre-satellite era before the 1970s may lead to spurious trends in TCs. The controversy still remains in recent model studies. Yamaguchi et al. (2020) showed that the forward speed increases in global mean in a warmer climate due to its dramatic increase in high latitudes and the higher relative frequency of TCs in high latitudes, despite the obvious decrease of TC forward speed at low latitudes. In contrast, Zhang et al. (2020) showed a robust slowing of TC motion using large-ensemble simulations, particularly in the midlatitudes.
It is reported that TC climatology can strongly exacerbate coastal flood risk. For example, model simulations show that the historical 100-year flood level would occur annually in New England and mid-Atlantic regions under a climate change of RCP 8.5, dominated by the effect of TC climatology change (Marsooli et al., 2019). TC climatology change is also believed to be the main factor responsible for a large predicted increase in the frequency of extreme events in US coastal areas by 2100 (Gori et al., 2022). In the Chesapeake Bay, the total flooded area is expected to expand by 26% in 2050 and 47%–62% in 2100 (Li et al., 2020). In New York City, storm surges will likely intensify and/or become more frequent, increasing the flood risk (Lin and Shullman, 2017).
The well-documented sea level rise (SLR) associated with global warming is another important factor augmenting flood risk, as it can raise baseline water levels for flooding (Fang et al., 2016). Moreover, SLR can also exacerbate flood risk in some coastal areas through modulating tidal amplitudes (Pickering et al., 2017; Li et al., 2021). Although the projected SLR range is only 0.3 to 2.0 m by 2100 (Kopp et al., 2014), this small amount can lead to a prominent increase in the frequency and severity of coastal flood (Kriebel et al., 2015; Little et al., 2015; Vitousek et al., 2017). For example, in Sydney, Australia, 80% of the observed coastal flood events during 1970–2015 are attributed to SLR, and the tide-only coastal flood events there will increase with SLR (Hague et al., 2020). At the global scale, an SLR of 10 to 20 cm will double the frequency of extreme water-level events in regions with limited water-level variability, which are mainly located in the tropics (Vitousek et al., 2017; Taherkhani et al., 2020).
Fujian coast is among the most frequently attacked coasts by TCs in China. The semi-enclosed geometry of Xiamen Bay is expected to enlarge the flood risk induced by TCs. The dense population and widespread low-lying coastal farms in the bay make it highly valuable to understanding the flood risk under current climate and in a warmer future. But this is not fully understood at current. In addition, as Neumann and Ahrendt (2013) and Kumbier et al. (2019) suggested, a numerical modeling method is suitable on such a local scale. While the limit studies involving flood risk of Xiamen Bay are mostly based on a bathtub method, which always overestimate the flood risk (for example, Xu et al., 2016; Shi et al., 2019).
The initial objective of this study is to evaluate the coastal flood risk in Xiamen Bay, Fujian, China under several different intensity levels of TCs. A high-resolution flooding numerical model covering low-lying land is established for this study. A multi-tracks blend method is implemented for the flood assessment. The influence of climate-change-induced SRL and TC climatology changes is also investigated for the flood estimation.
2 Materials and methods
2.1 Study area
Xiamen Bay, Fujian, China is located at the southeast coast of mainland China (Figure 1). It is a semi-closed bay connecting the Jiulong River Estuary with the Taiwan Strait. There are more than 30 islands distributed in Xiamen Bay, including Xiamen Island (158 km2), which is a main part of Xiamen city, Fujian province, and Dajinmen Island (151.65 km2). Due to the islands, caps, and small bays, Xiamen Bay is characterized by strongly irregular coastlines and extremely complicated topography. In this study, Xiamen Bay is divided into six parts for convenience of analysis: Tong’an Bay, the west Xiamen water, the Jiulong River Estuary, the south Xiamen water, the east Xiamen water, and the Dadeng water. The former three parts are grouped into the Inner Bay Area, and the others are the Outer Bay Area.
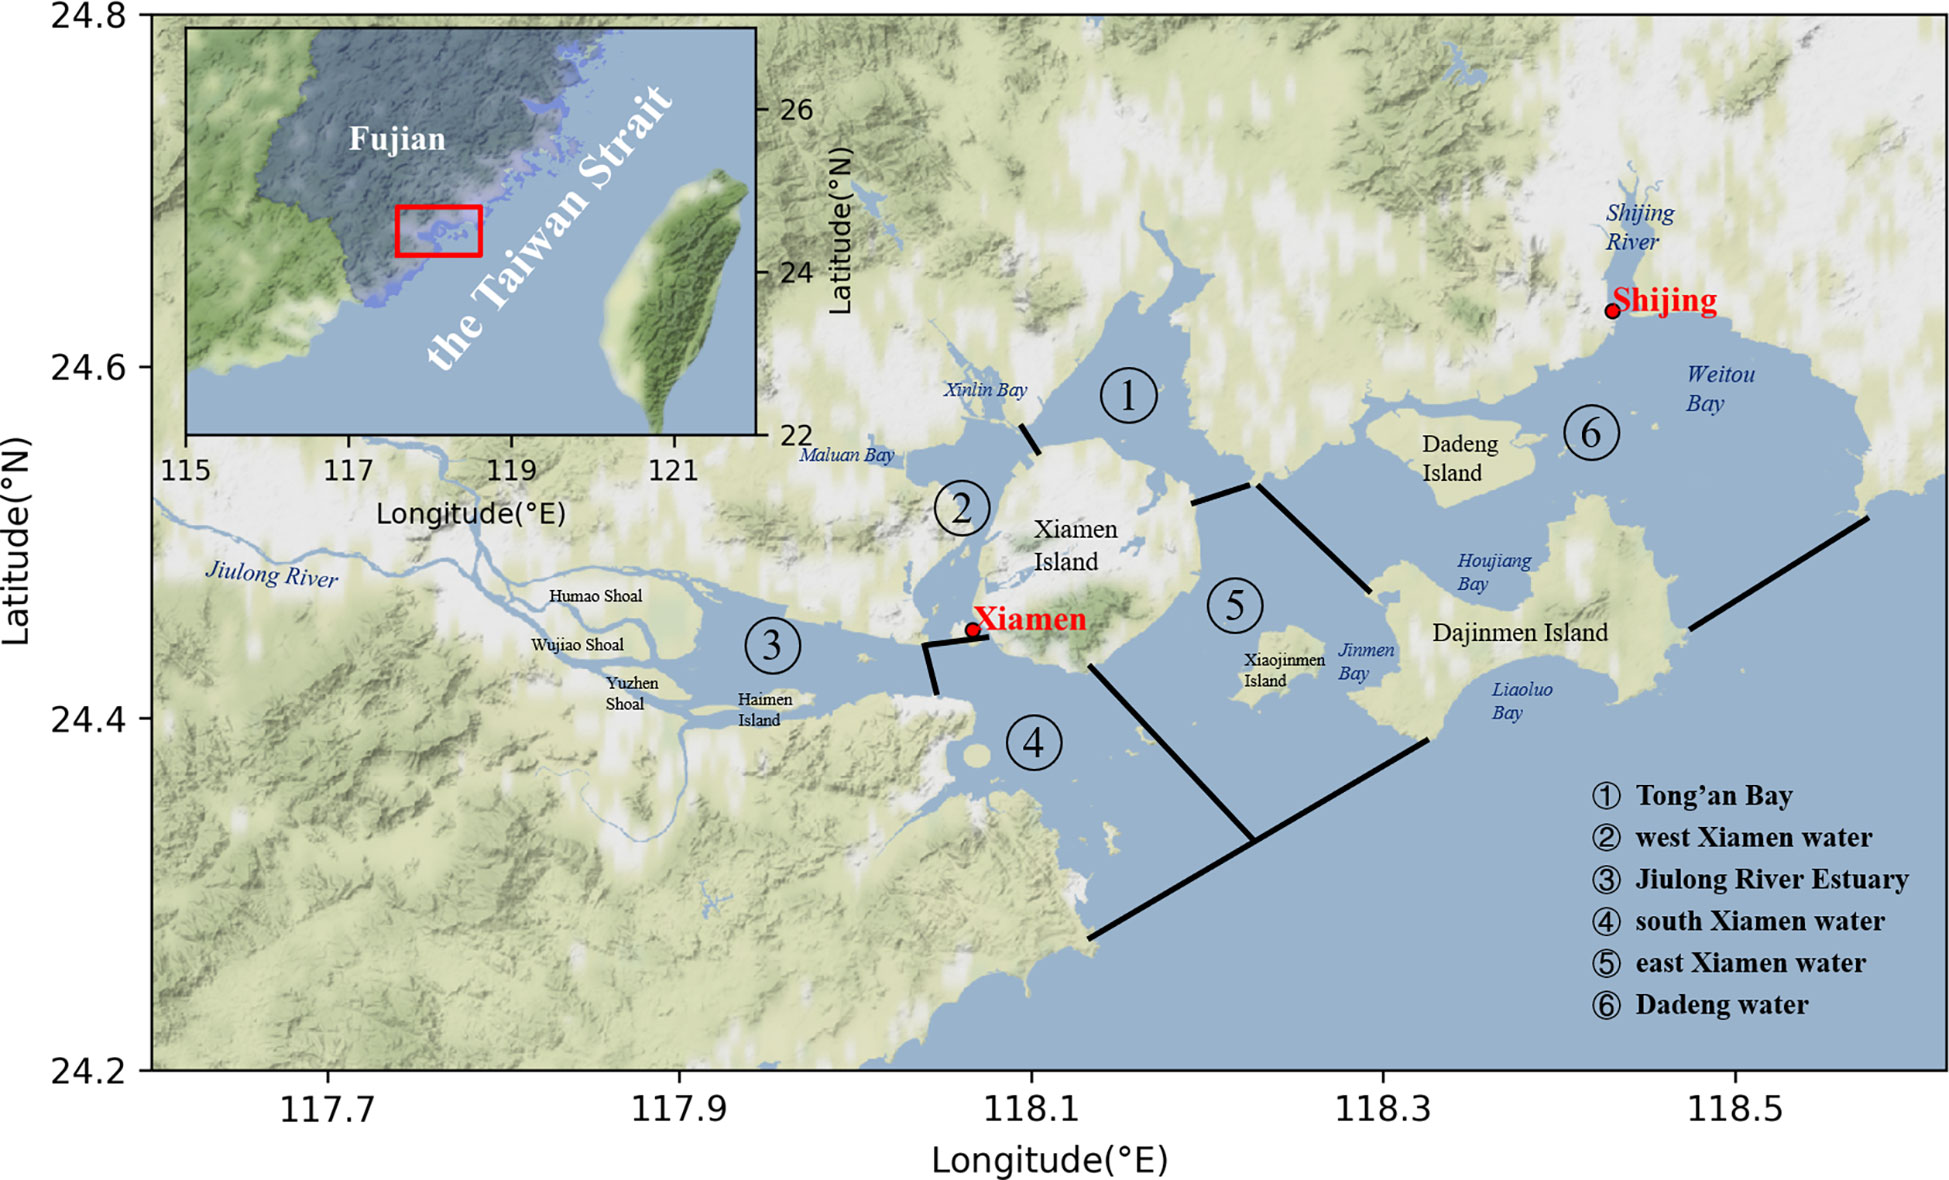
Figure 1 Location map of Xiamen Bay (based on Stamen Map, http://maps.stamen.com) and location of tidal gauge stations (red dots).
The Xiamen Bay is a macrotidal bay. The averaged tidal range at the Xiamen gauge station (Figure 1) is 4.0 m, and the recorded maximum tidal range is 6.92 m, which occurred on 22 October 1933 (Huang et al., 2018). The main four tidal constituents at the Xiamen gauge station are M2 tide (1.91 m), S2 tide (0.54 m), K1 tide (0.34 m), and O1 tide (0.27 m). Thus, Xiamen Bay also belongs to a semidiurnal tidal regime [F< 0.25, where F = (aK1+aO1)/(aM2+aS2) is the form number (National Ocean Service, 2000)].
Xiamen Bay is struck by TCs frequently from July to October. Statistics show that about 2.7 TCs can affect Xiamen Bay per year on average (Miao et al., 2022). TCs always raise coastal flooding in the low-lying land of Xiamen Bay. For example, the TCs Iris (5903) and Dan (9914) induced strong coastal flooding at Xiamen City, leading to 79 and 245 km2 of flooded agricultural areas, respectively (Li et al., 2000; Yuan et al., 2022). During 2016, although Xiamen Island is well protected by seawalls, the TC Meranti (1614) flooded over them and inundated over 10 km2 of low-lying land (Luo and Wu, 2022).
2.2 The design of numerical model
The Finite-Volume Community Ocean Model (FVCOM, version 4.1) (Chen et al., 2003; Chen et al., 2013) is employed to simulate the coastal inundation of Xiamen Bay. The unstructured triangular mesh that FVCOM employs can fit the irregular coastlines and islands, and be freely refined around large slope gradients. Moreover, FVCOM contains a widely used wet/dry scheme (Leendertse, 1970; Zheng et al., 2003). The computational domain covers the maximum flooding area, and the wet and dry points are distinguished by the local total water depth. Therefore, FVCOM is rather appropriate for this study.
The model domain covers all the coastlines and islands of Fujian province and the Taiwan Island of China, extending 1000-km seaward to the Pacific Ocean (Figure 2A). As TCs can move to a large extent during their lifetime, this large-scale model coverage can well capture the seawater movement in Xiamen Bay under the influence of TCs and also eliminate boundary effects associated with smaller regional meshes, thus improving the accuracy of flooding simulations (Thomas et al., 2022). In Xiamen Bay, the model domain extends landward and covers the coastal lowland to the 20 m topographic contour (Figure 2B). The mesh resolution is about 80 km at the open boundary and increases to a high resolution of 100 m in Xiamen Bay, which is maintained in all the coastal lowland domains. Thus, the model mesh has 241278 nodes and 473744 triangular elements.
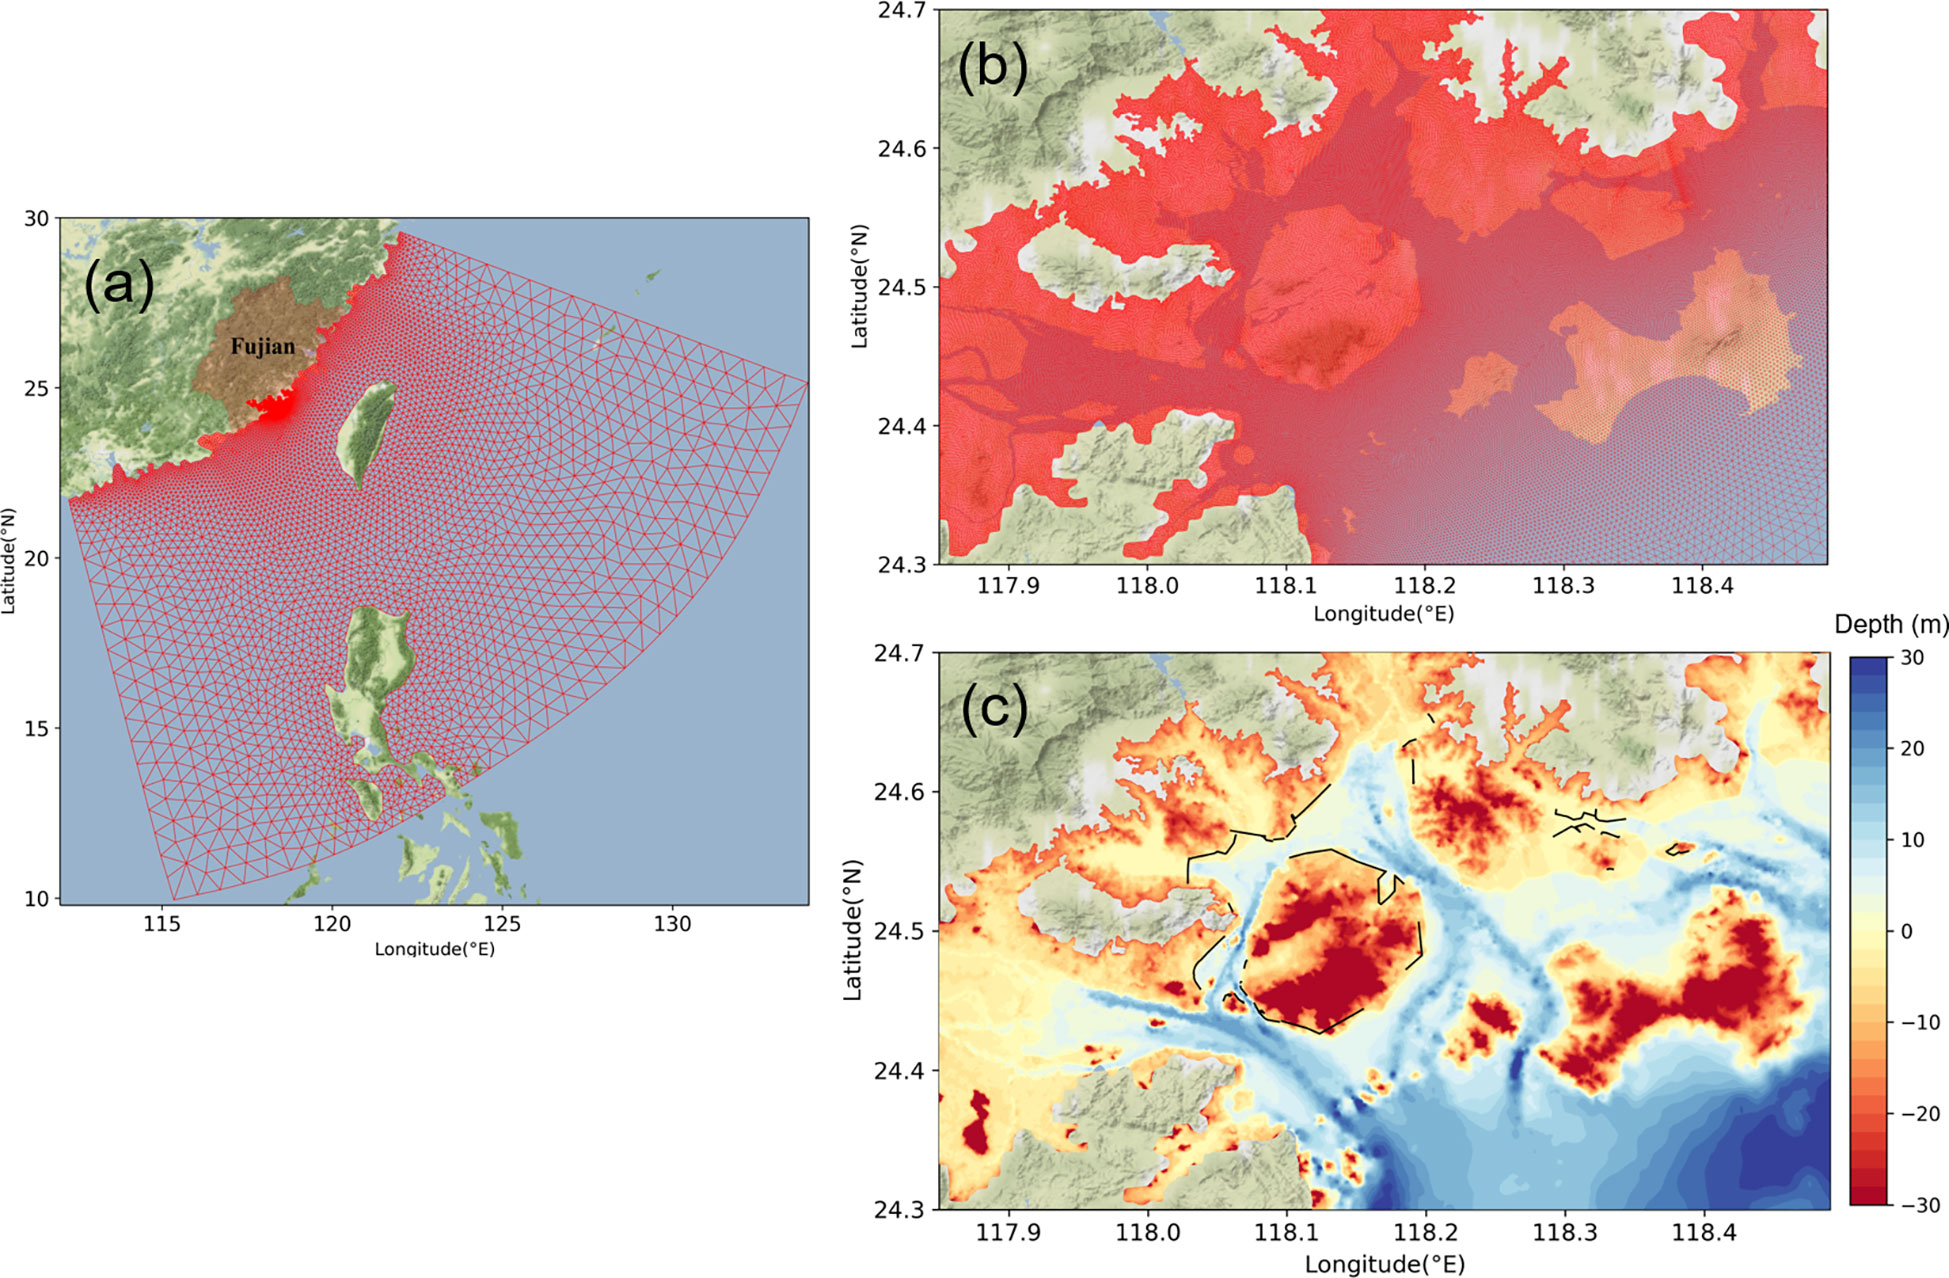
Figure 2 (A) The unstructured triangular mesh for the Xiamen Bay FVCOM model; (B) zoomed-in view over Xiamen Bay; (C) topography and seawalls (solid black lines) at Xiamen Bay in the numerical model.
The bathymetry data used in this model are primarily based on the ETOPO1 Global Relief Model (Amante and Eakins, 2009). Although the resolution of ETOPO1 is as high as 1 arc-minute, it cannot assess the extremely complex bathymetries in Xiamen Bay precisely. Therefore, we gather 64 naval electric nautical charts around Xiamen Bay to obtain the precise estimations of its underwater topography. The topography of coastal lowlands around Xiamen Bay are estimated by a 10-m-resolution DEM dataset offered by Fujian Provincial Department of Ocean and Fisheries (Figure 2C). The seawalls around Xiamen Bay offer a robust defense mechanism against coastal flooding; they are considered in the FVCOM model simply by elevating the depth of corresponding mesh nodes (Figure 2C). All the simulations run 15 days with a spin-up of 7 days.
The tidal levels of the open boundary condition are derived from the latest released satellite-assimilated tidal model TPXO9-atlas (Egbert and Erofeeva, 2002), with eight tidal constituents (M2, S2, N2, K2, K1, O1, P1, and Q1) specified. Four vertical sigma layers are used in the model. FVCOM calculates the bottom friction and wind stress using the quadratic drag law:
The drag coefficient for bottom friction is determined by matching a logarithmic bottom layer to the model at a height zab above the bottom, namely:
where κ = 0.4 is the von Karman constant, z is the distance from the seabed to the position of u and v, and z0 is the bottom roughness parameter. We set z0 to be a constant of 0.0002 in this study.
It is commonly recognized that the wind drag coefficient in high-wind conditions does not increase linearly with surface wind speed, but the specific relationship is still uncertain (Peng and Li, 2015; Donelan, 2018). In this study, we set the wind drag coefficient to be constant during low- and high-wind conditions following Yin et al. (2021a). The equation is expressed as follows:
where U10 is the wind speed (m·s-1) at a height of 10 m above the sea surface.
2.3 Meteorological forcing
A wind field combining a reanalysis background wind product and a parametric typhoon model is adopted to simulate the coastal flooding. The reanalysis background wind product is retrieved from the hourly ERA5 dataset (Hersbach et al., 2020) of the European Centre for Medium-Range Weather Forecasts. The ERA5 dataset has a high time resolution, but its spatial resolution is relatively coarse, which is not sufficient to precisely capture the structures of pressure and wind within a scope of hundreds of kilometers near the center of a TC. A parametric typhoon model is thus applied to reassess the wind structure surrounding a TC’s center. The best-track dataset from China Meteorological Administration (Ying et al., 2014) is employed to drive the parametric typhoon model.
The pressure profile is estimated by the equation proposed by Fujita (1952):
where Pc is the central pressure, Pe is the environmental pressure, Rmax is the radius of maximum wind, and r is the distance to the TC’s center.
The wind speed field is determined by the gradient wind model, in which the force of the pressure gradient force is balanced by the Coriolis force and centrifugal force (Schwerdt et al., 1979). The solution is expressed as follows:
where W1 is the gradient wind speed at radius r; f = 2ωsinφ is the Coriolis parameter, ω = 7.272 × 10⁻⁵ rad·s-1 is the Earth’s rotational angular speed; φ is the latitude; and ρa = 1.15 kg·m-3 is the air density.
Equation (5) produces a circular symmetric typhoon wind field. Actual observations indicate that the wind structures of TCs are not always symmetric, mainly relating to the translation of the TC, the blocking action from an adjacent anticyclone event, the meridional gradients of the Coriolis acceleration (β effect), the asymmetric convection of bottom boundary layer friction, and landfall (Olfateh et al., 2017). In this study, the asymmetry is considered only by superimposing a moving wind field on the circular symmetric wind field, which is a popular method in modeling surges (Li et al., 2022):
where W1 is the circular symmetric wind speed calculated by Equation (5); W2=eπr/500000(Vx,Vy) is the moving wind field (Miyazaki, 1962), ϕ is the angle between the vector from the TC’s center to the position and due east, β is the angle between the wind direction with the isobars, which can be specified as a constant (for example, 18° in this study); and c1 and c2 are correction coefficients, which are set as 0.8 and 1.0 here, respectively.
Thus, the wind field can be reconstructed by combining the asymmetric circular wind field assessed by Equation (6) and the ERA5 background wind field:
where e is a weight factor to ensure a smooth transition between the two wind fields (Carr and Elsberry, 1997):
2.4 TC scenarios construction
2.4.1 Construction of TCs with different intensities
It can be concluded that the central pressure, the maximum sustained wind speed, and the maximum wind radius are three predominant parameters for the estimation of storm surges; the latter two parameters are believed to highly relate to the central pressure. Herein, we design TCs with three strength levels primarily according to different return periods (1000, 100, and 10 years) of the annual minimal air pressure at Xiamen station. The annual minimum air pressures are estimated as the minimum central pressure of the 6-hourly TC tracks when their distance to Xiamen is less than 400 km. In the case of a year when no TCs pass through the 400 km scope, the annual minimum pressure is denoted as 1000 hPa. Then, an extreme value type I distribution is used to fit the annual minimum air pressures from 1949 to 2020 (Figure 3A) and calculate the minimal pressure of different return periods. The results show that the 1000-, 100-, and 10-year pressures are 887, 918, and 950 hPa, respectively (Table 1).
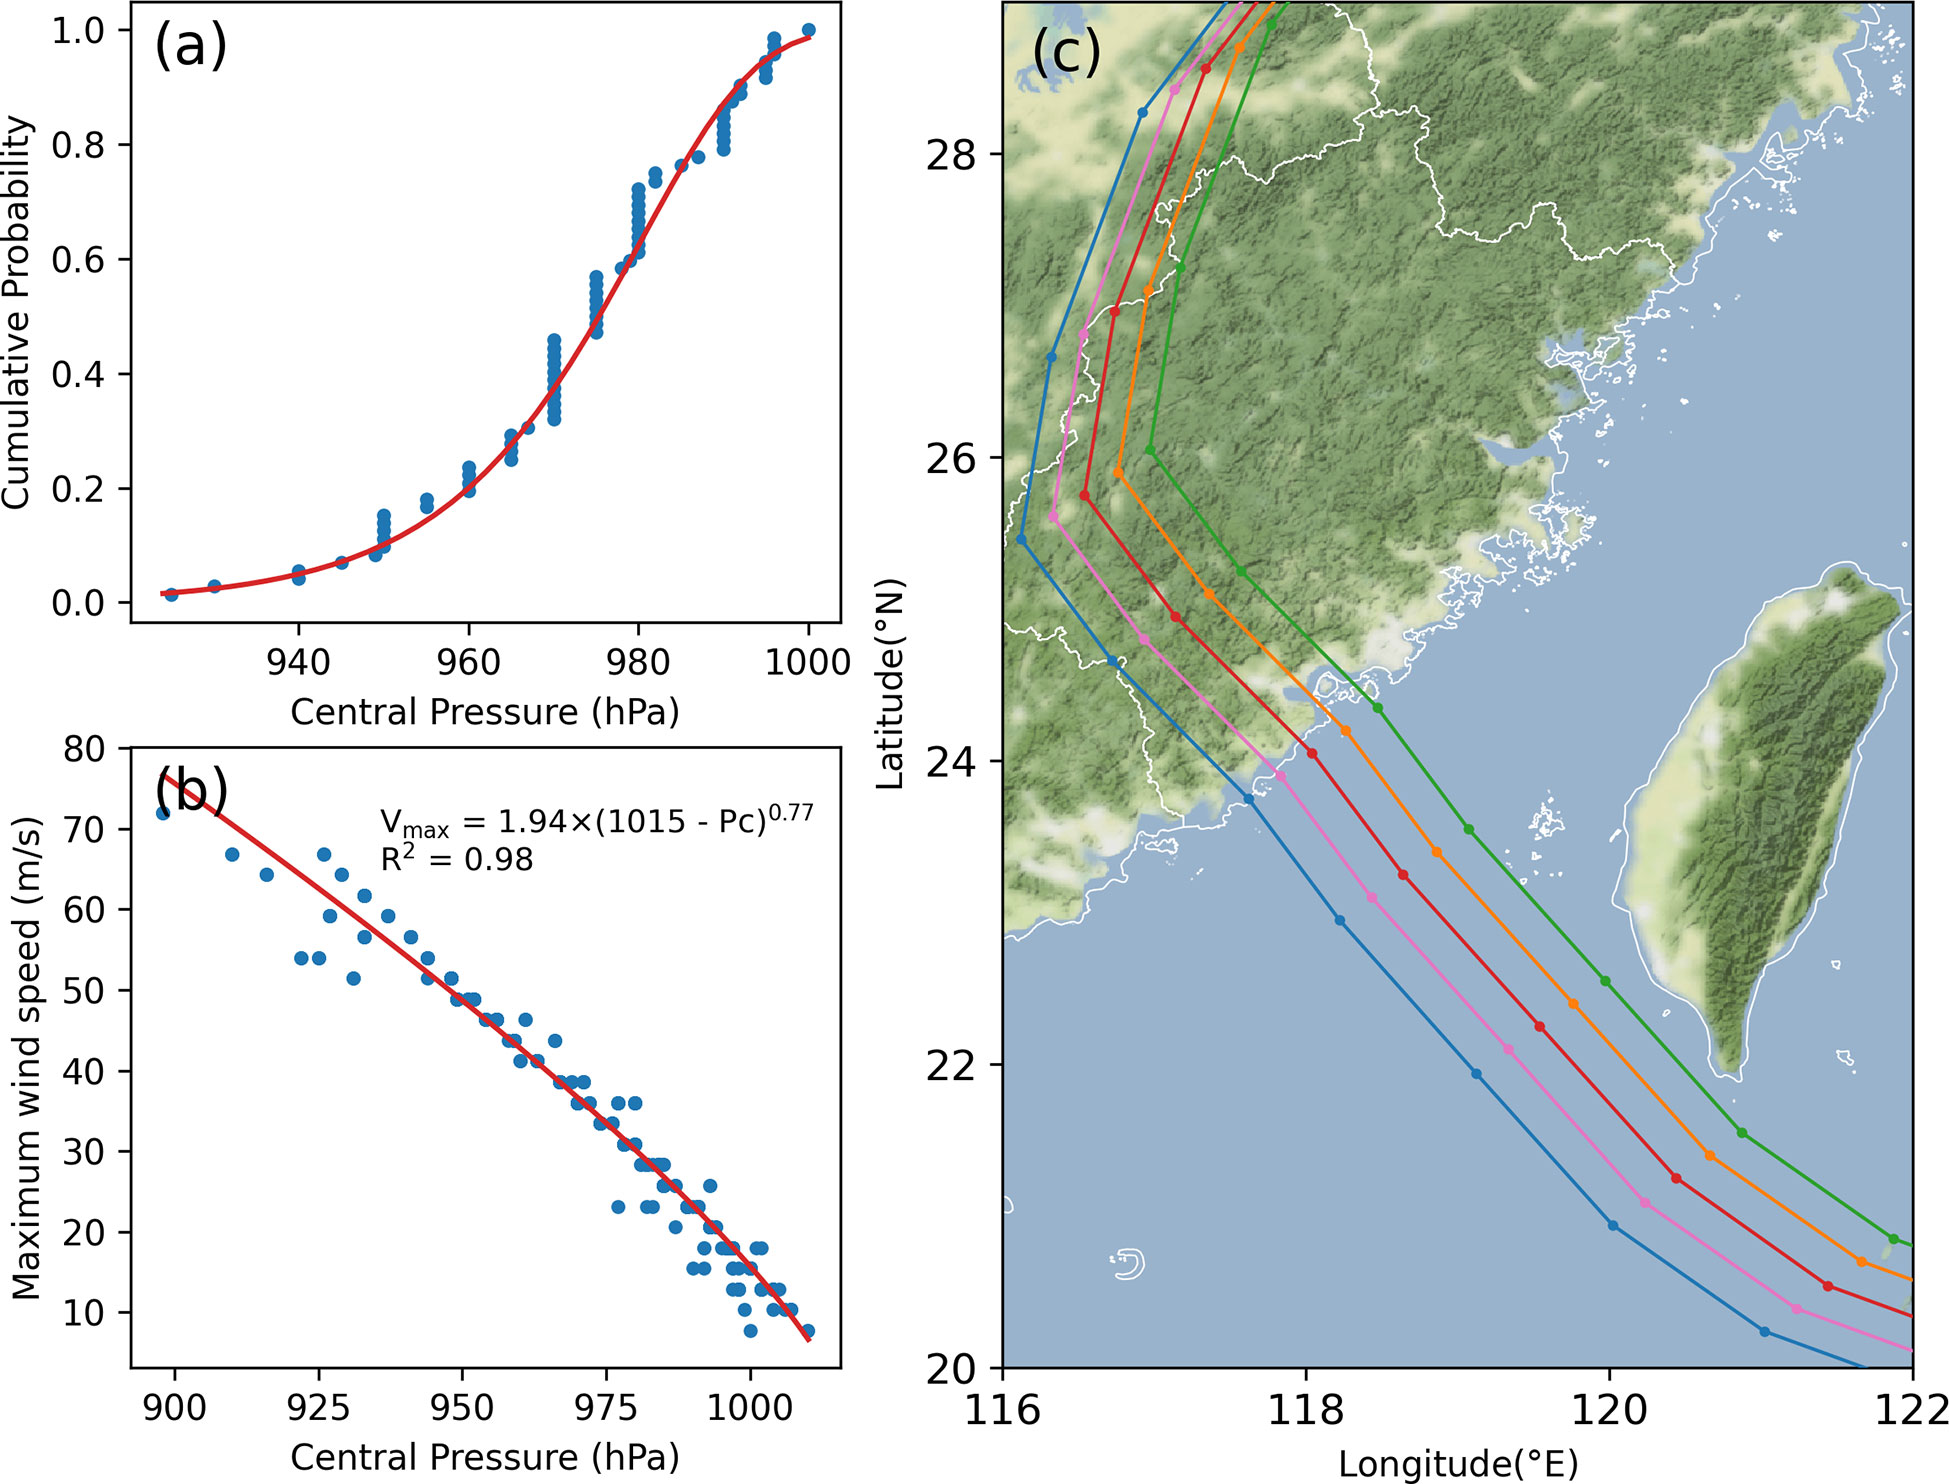
Figure 3 (A) Extreme value type I distribution of the yearly minimal air pressures at Xiamen Bay during 1949–2020. The R2 value is 0.98. (B) The wind-pressure relationship of a small scope covering Xiamen Bay. (C) The five parallel TC tracks used for simulations based on TC Meranti (1614).
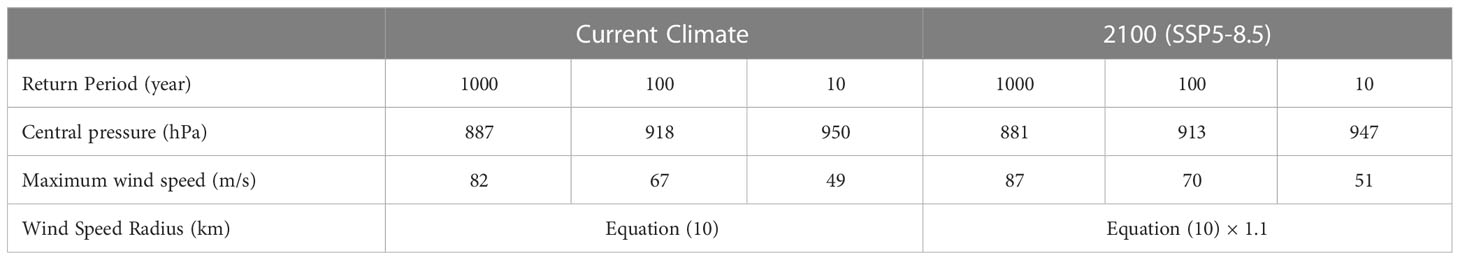
Table 1 Parameters of the constructed tropical cyclones under current climate and by 2100 under SSP5-8.5 projection.
Atkinson and Holliday (1977) obtained a statistical relationship between the minimum sea level pressure and maximum sustained wind based on 76 TCs that occurred in the western North Pacific during 1947–1974. This relationship is still widely used in operational TC programs (World Meteorological Organization, 2015). In addition, the wind-pressure relationship can shift across different regions, as summarized by Harper (2002). Thus, we reconstruct the wind-pressure relationship by only adopting TC records within a small scope (longitude in 116–123°E and latitude in 23–28°N) covering Xiamen Bay (Figure 3B). The resulting equation is
According to this equation, the maximum wind speed at current climates of 1000-, 100-, and 10-year pressures are determined to be 82, 67, and 49 m·s-1, respectively.
The maximum wind radius is expected to decrease logarithmically with the central pressure fall (Fujii, 1998). In this study, an empirical formulation proposed by Graham and Nunn (1959) is employed to estimate the initial maximum wind radius:
where φ stands for geographical latitude, Vt is the translation speed, and Rmax is in units of km.
2.4.2 Construction of TC tracks
For one TC track, it is hard to throw adequately strong influence on all parts of Xiamen Bay. This may lead to underestimation of maximum water levels, and thus the coastal flooding, in parts of Xiamen Bay. To avoid this drawback, we adopt a multi-tracks blend method to conduct our simulations. A representative TC track is firstly selected from the historical tracks according to their intensity and resulting disaster. Then multiple parallel tracks are derived by shifting this track left or right depending on the coverage of study area. The distance between adjacent two tracks is no more than the radius of maximum wind. For each node in the model mesh, its maximum water level is estimated by those at this node of all tracks. The surge level at a specific time is also estimated by the maximum of the surges at the specific time. The multi-tracks blend method used in this study can guarantee that each location in Xiamen Bay suffers adequate impact from the constructed TCs. Similar method has been used for assessment of flood risk in many regions (Shi et al., 2020; Wang et al., 2021; Yin et al., 2021a).
In this study, since TC Meranti (1614) is reported to be the most intense TC making landfall at Xiamen Bay, Fujian, China since 1959 (Xu and Cai, 2021). Therefore, we select its track to be the base track of our simulations. The track of TC Meranti (1614) is firstly translated to about 40 km south of Xiamen Bay (denoted as A0), and then we derive two tracks by translating left at distances of 30 km (the approximate radius of maximum wind) and 60 km (denoted as L1 and L2, respectively). Two additional mirror tracks are derived by translating right at distances of 30 km and 60 km (denoted as R1 and R2, respectively). Therefore, there are five parallel tracks for each TC intensity in our simulations (Figure 3C).
2.4.3 Selection of TC timing
Storm surges cause severe disasters especially when they are superimposed on an astronomical high tide. To have a sufficient estimation of the coastal flood, an extremely adverse scenario of storm timing is artificially specified with the maximum surge occurring approximately on the highest astronomical tide during the years of 2000–2020. The highest astronomical tide is deduced from rebuilt hourly tidal levels using tidal constants derived from the observed water levels of 2021. Results show that the maximal astronomical tide is 3.65 m, which occurred at 13:00, 17 October 2016.
Thus, the worst situations under the influence of TCs of 1000-, 100-, and 10-year pressures are considered in our simulations. This method can ensure that all possible flooded areas are considered to allow for full preparation for forthcoming possible flood disasters, which has been used to estimate the potential flooding hazard in many regions (Yu et al., 2019).
2.4.4 Climate change scenario
It is widely recognized that climate change will exacerbate coastal flood situations in many regions through raising sea levels and enhancing storminess. According to a recent IPCC AR6 (Sixth Assessment Report of the Intergovernmental Panel on Climate Change) report (IPCC, 2021), the global mean sea level will rise 0.77 m (0.63–1.01 m, likely range) by 2100 under the very-high greenhouse gas emissions scenario (SSP5-8.5). Thus, we elevate the mean sea level by 0.77 m on the open boundary in the numerical simulations.
Although there is uncertainty in the changes of TC activity, it is very likely that the proportion of very intense TCs will increase with climate change (IPCC, 2021). Knutson et al. (2020) summarized multi-study aggregated future TC projections under various future climate forcing scenarios. The average increase in projected global TC maximum wind speeds is about 5% for a global warming of 2°C. Although it is very likely that the air temperature will increase by 2.4–4.8°C under SSP5-8.5 (IPCC, 2021), we still expand the pressure decrease (assuming circumstance pressure of 1015 hP) and augment the maximum wind speeds in our constructed TCs by 5%. Thus, as listed in Table 1, the maximum wind speed under 1000-year pressure becomes 87 m/s, which nearly reaches the strongest TC in the western North Pacific (88 m/s) under warming conditions in 2074–2087 as modeled by Tsuboki et al. (2015). The projected TC size changes are highly variable between basins and studies. In this study, we consider a projected increase of 10% in TC size, as suggested by Yamada et al. (2017) resulting from a 14-km-grid global nonhydrostatic atmospheric model.
3 Results
3.1 Model validation
In addition to TC Meranti (1614), TCs Trami (1312) and Dujuan (1521) also induced prominent storm surges in Xiamen Bay. Observed tidal level data during the three TC events at Xiamen and Shijing (Figure 1) are obtained from Fujian Provincial Department of Ocean and Fisheries. The numerical model performance is evaluated by comparing total water levels with the observations. Root-mean-square error (RMSE), relative error (RE) to tidal range, and skill score (SS) are used to quantify the model’s performance:
where and are the model simulation and observed data at time i, respectively; N is the number of observed records used for the comparison; TRo is the observed tidal range, and is the average value of the observed data. When SS > 0.5, the model performance can be considered highly reliable.
The water level comparisons at stations Xiamen and Shijing are displayed in Figure 4, and the error skills are also labeled. The averaged RMSE at Xiamen and Shijing are only 0.25 m and 0.22 m, respectively, which are small enough comparing to the macro tidal range (4.0 m) at Xiamen Bay. The REs are all less than 5%, and the SSs are all larger than 0.95. All the skills show that our model can accurately reproduce the storm tides in Xiamen Bay during TC events.
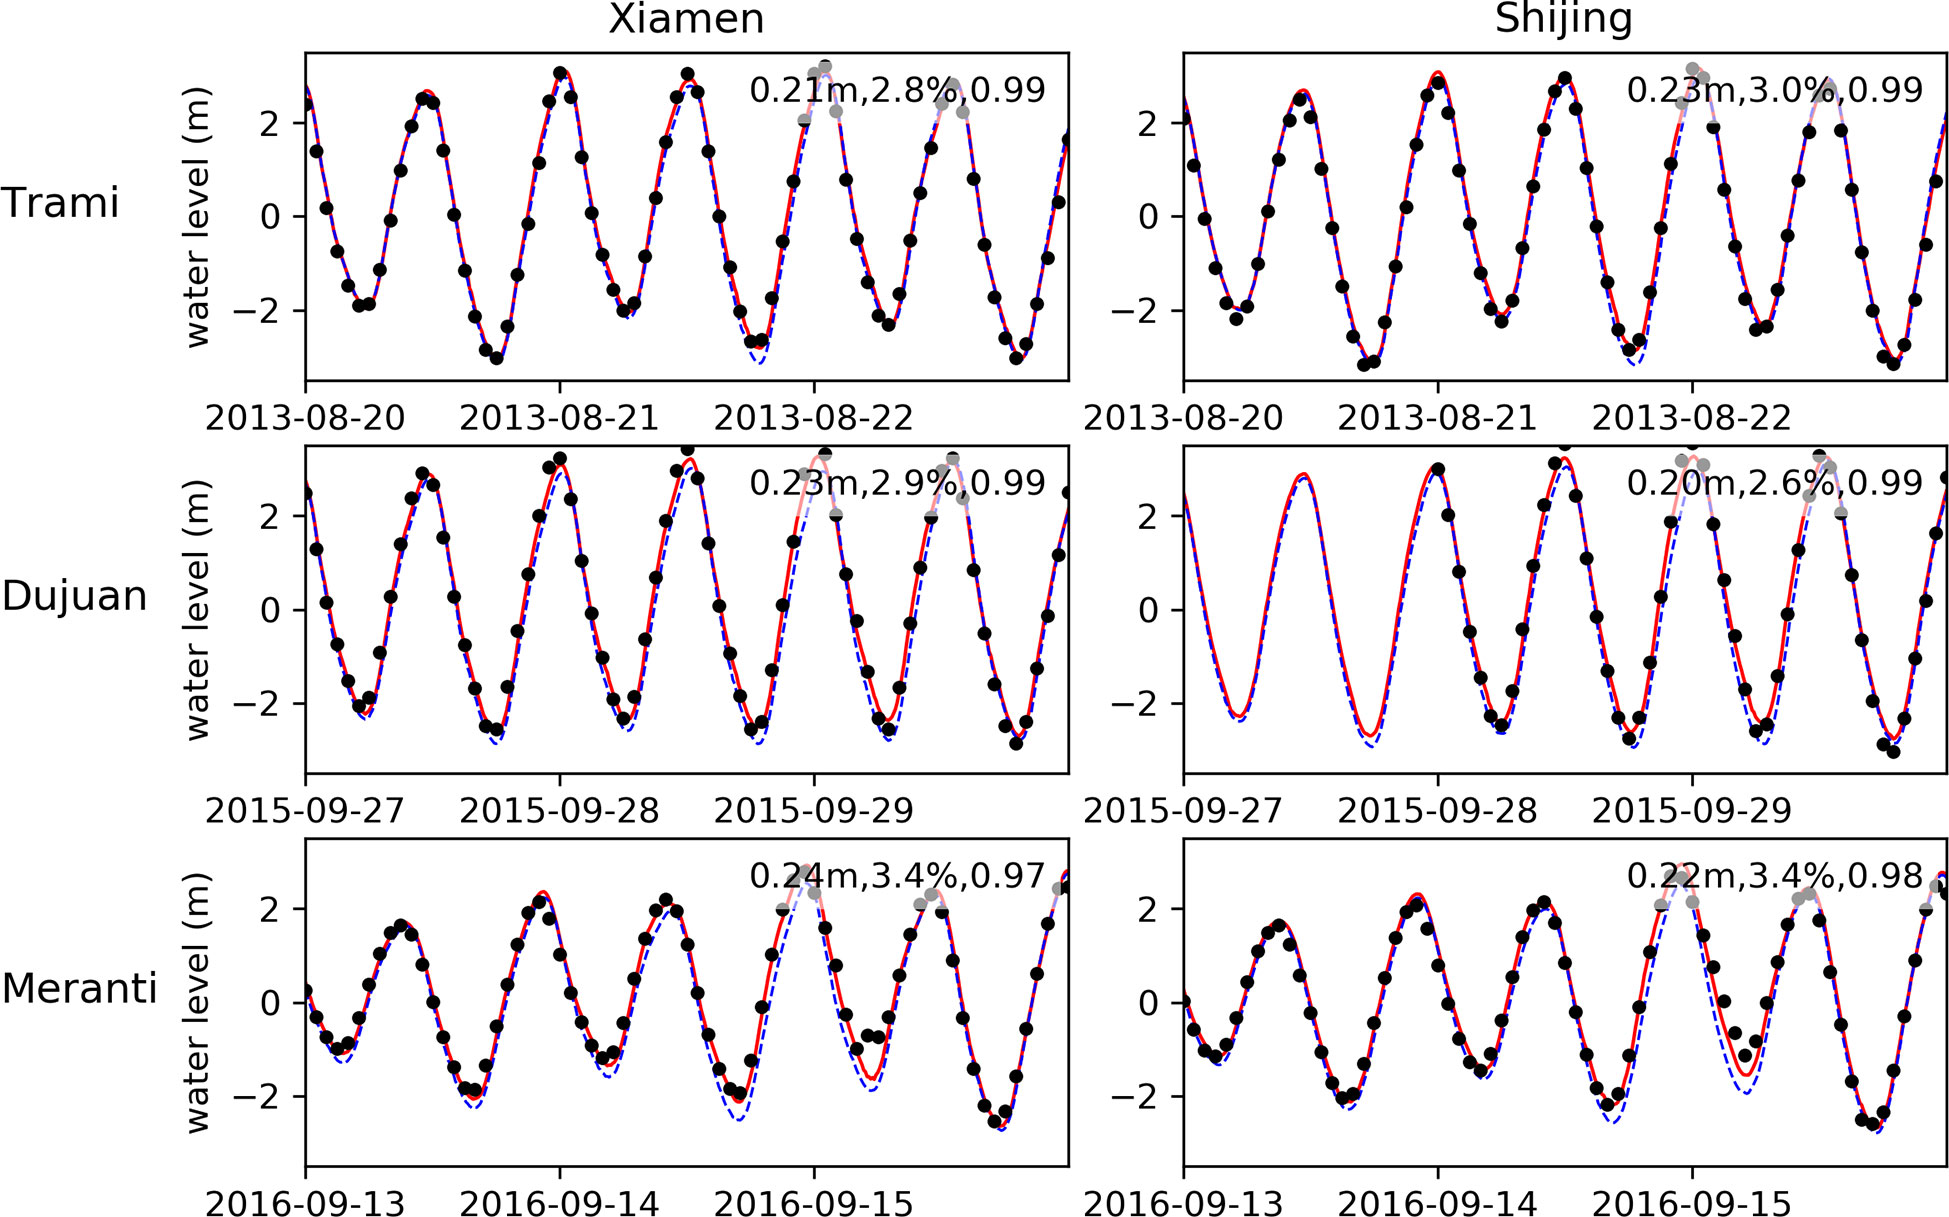
Figure 4 Comparison of total water levels between model results (red lines) and observations (black dots) at stations Xiamen and Shijing during TCs Trami (1312), Dujuan (1521), and Meranti (1614). Blue dashed lines represent modelled tidal level without wind forces. The RMSE, RE, and SS values are labeled.
3.2 Coastal floods of different TC intensities
Figure 5A displays the water level timeseries at station Xiamen induced by the five TC tracks of 1000-year pressure at the current climate. The results show that the water levels are highly dependent on the TC tracks, implying the necessity of multi-tracks blend method used in this study. Peak water level is highest on track L1, which is 70 km (or about 2.5 times the maximum wind radius) south of Xiamen Bay, but lowest on track R2. The maximum difference of peak water level between each track can be over 3.0 m. After removing tidal signals from the water level timeseries by subtracting the water levels from a tide-only run, the storm surges are achieved. As Figure 5B shows, track L1 obtains a maximal storm surge of 4.37 m, but the time that it occurs is 1.5 h later than that of the peak water level, which may relate to the well documented tide-surge interaction.
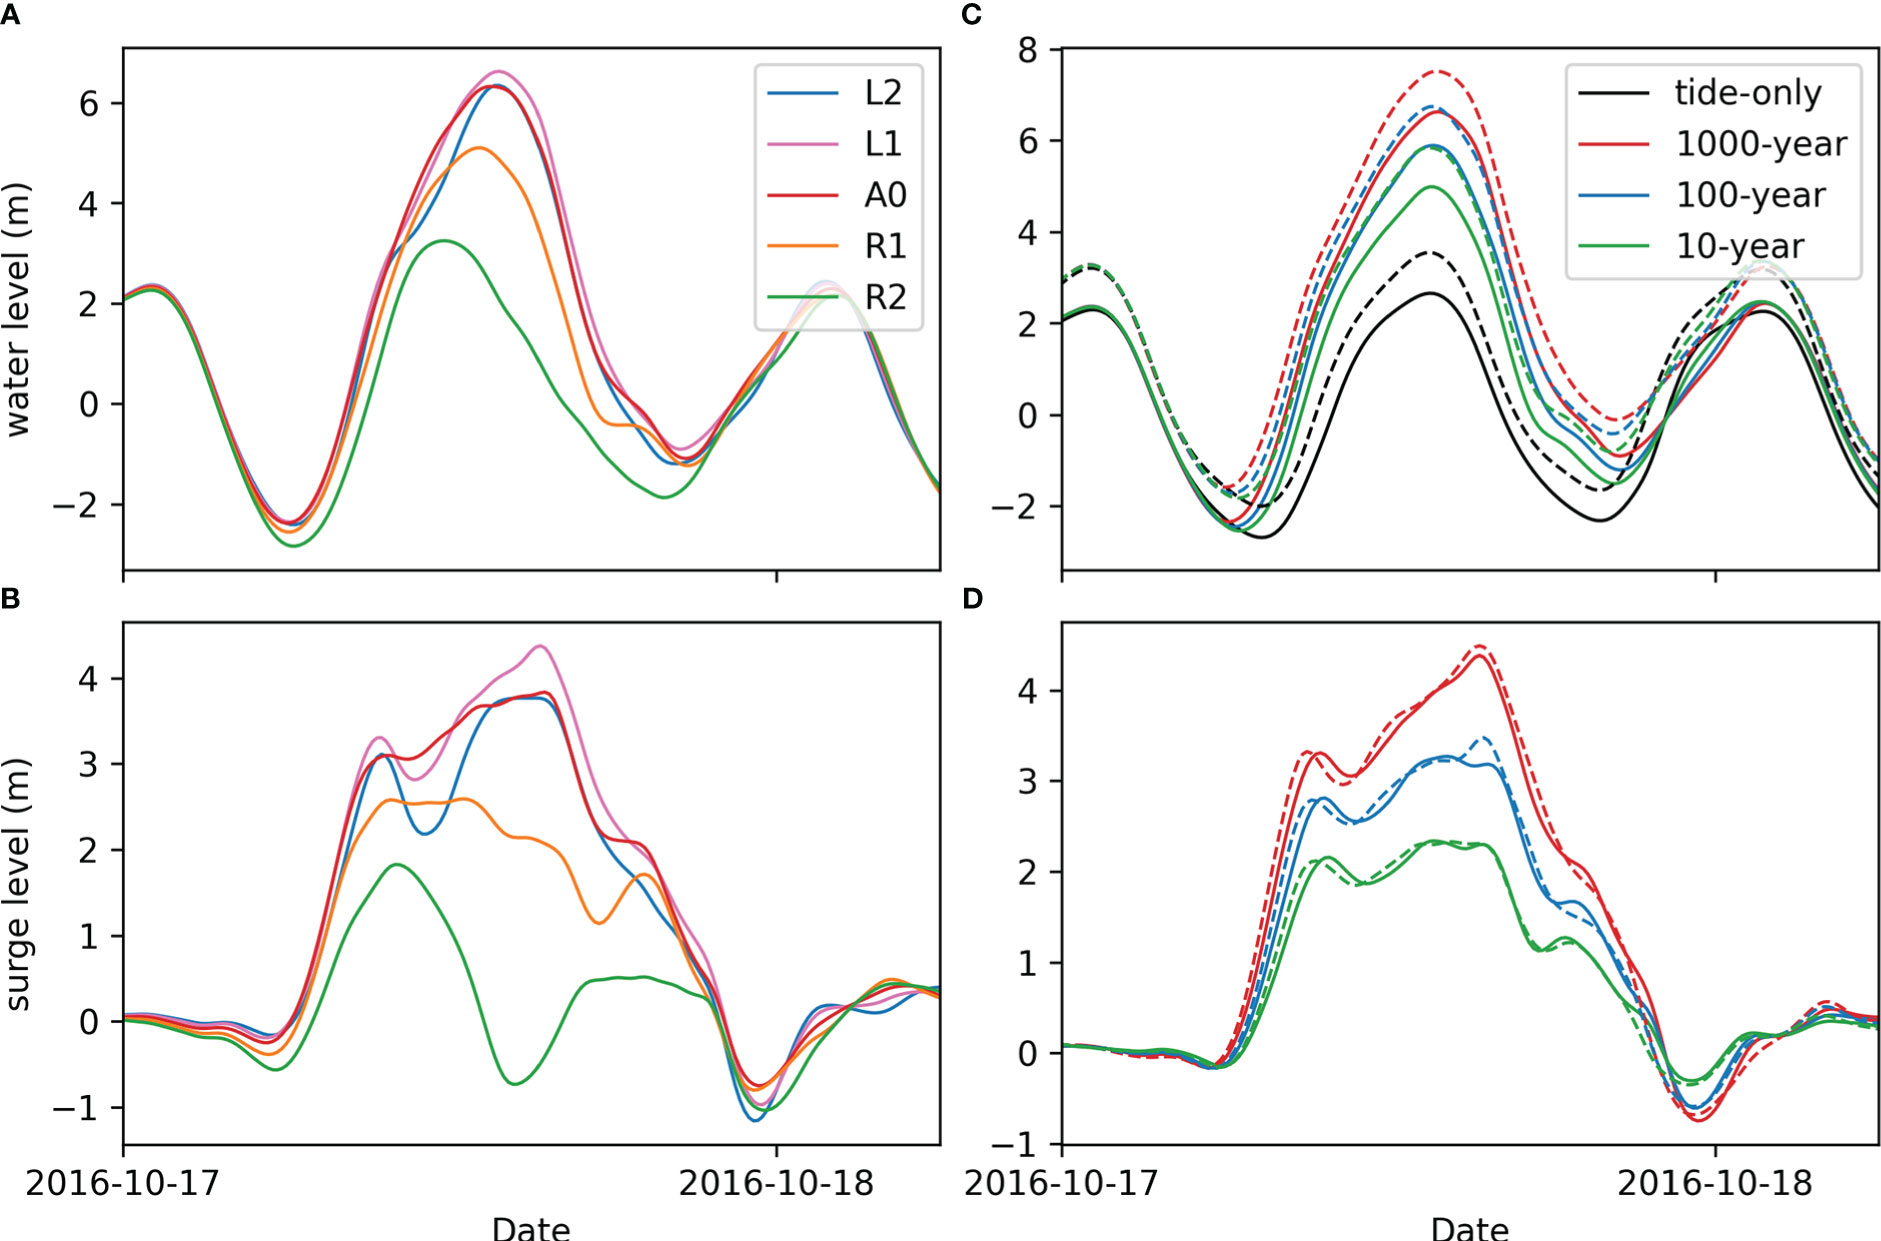
Figure 5 Time series of total water levels and storm surges at station Xiamen. (A) Total water levels and (B) storm surges of the five TC tracks under TCs with 1000-year pressure at current climate. L2 and L1 represent the left (or southern) two tracks; R2 and R1 represent the right (or northern) two tracks; and A0 denotes the middle track. (C) Tracks-blended water level timeseries and (D) tracks-blended storm surge timeseries under 10-, 100-, and 1000-year pressures at current climate (solid lines) and under SSP5-8.5 climate change by 2100 (dashed lines).
The tracks-blended results show that stronger storms induce higher water levels and storm surges (see solid lines in Figures 5C, D). The peak water levels of the 10-, 100-, and 1000-year pressures reach 4.99, 5.89, and 6.63 m, and the corresponding peak storm surges are 2.34, 3.27, and 4.38 m, respectively. The storm surge under the 1000-year pressure can reach 2.0 m higher than that of the 10-year pressure, but the corresponding peak water level is only 1.6 m higher. Nevertheless, the time differences between peak water levels and peak surges are 0.2, 0.5, and 1.5 hours under the 10-, 100-, and 1000-year pressures, respectively. These features imply a stronger tide-surge interaction in stronger storms.
Higher water levels lead to more extensive flood inundation around Xiamen Bay. Herein, we consider all wet nodes (or cells) with model depth< 0 to be flooded areas. Astronomical tides can periodically inundate the large intertidal zones in the Jiulong River Estuary and the widespread low-lying coastal farms and salt pans between Dadeng Island and the mainland (Figure 6A). Our statistics (Figure 7) show that 126.5 km2 of low-lying land can be flooded during high tides, with over 80% of this flooding occurring in the Jiulong River Estuary and the Dadeng water.
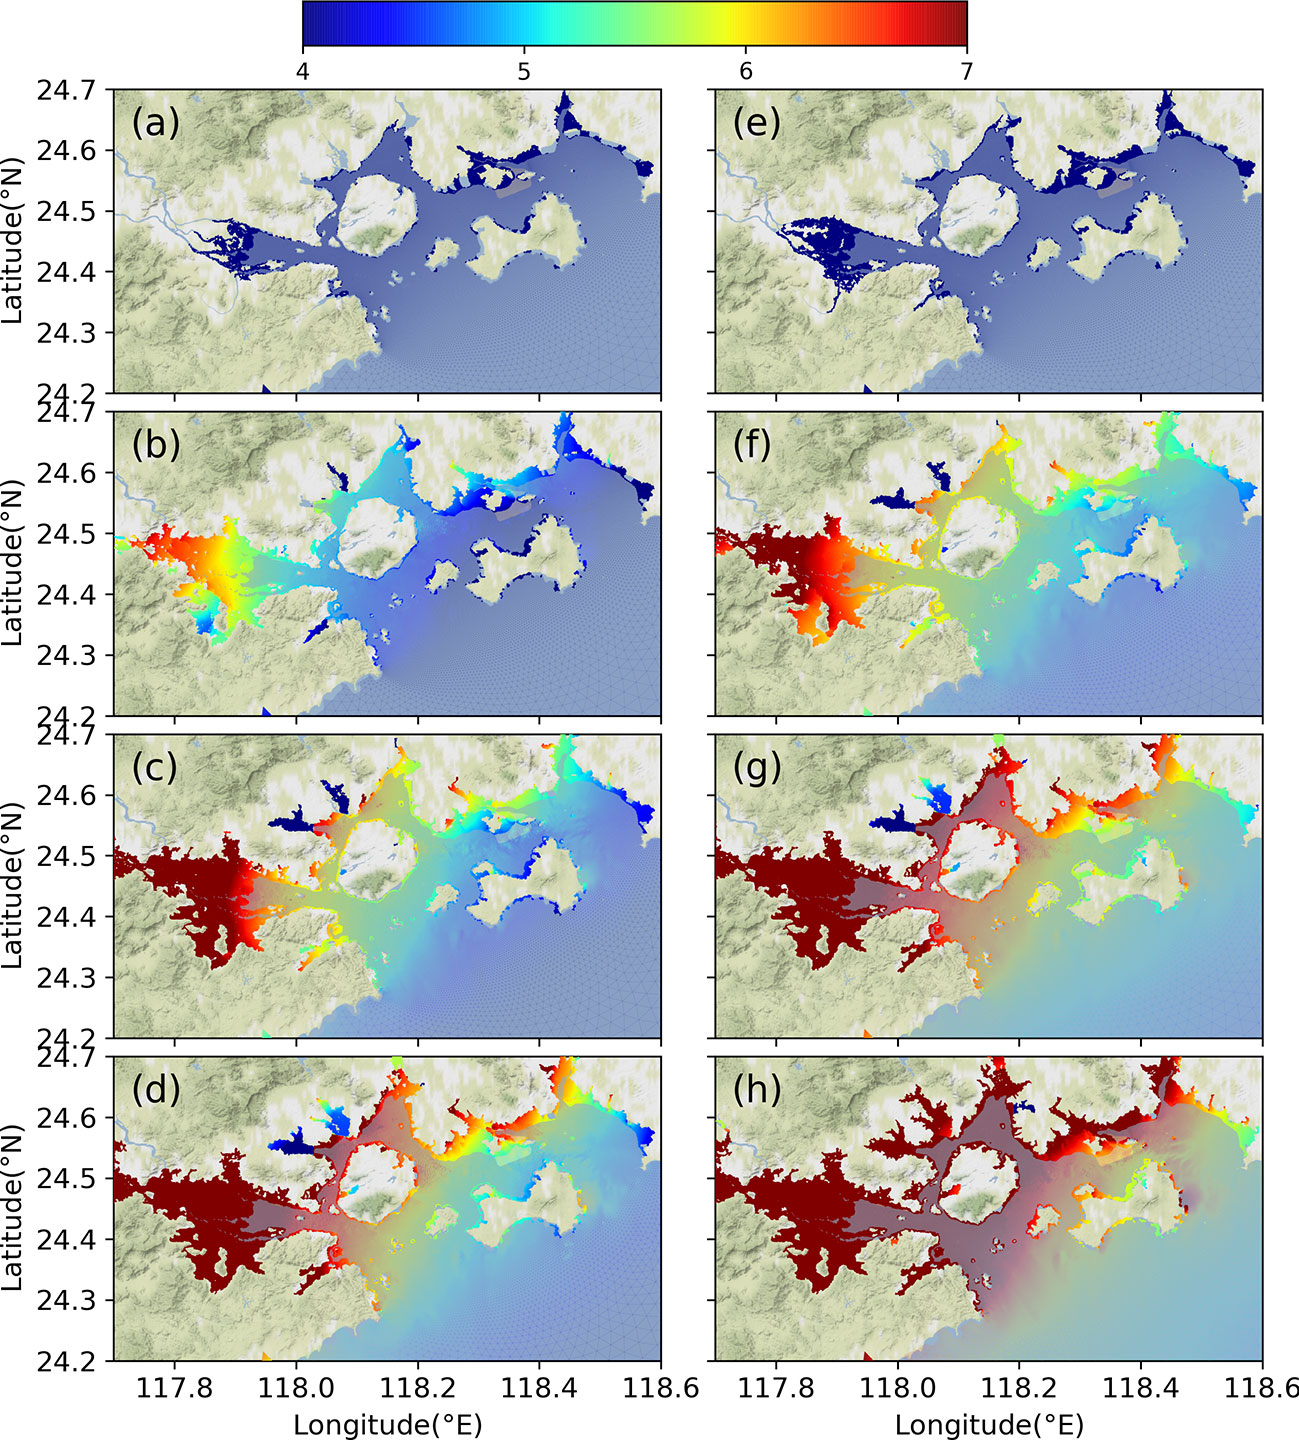
Figure 6 Maximum water levels (units of m) around Xiamen Bay at current climate (left column) and under SSP5-8.5 climate change (right column). (A, E) tide-only cases, (B, F) under TC with 10-year pressure; (C, G) under TC with 100-year pressure; (D, H) under TC with 1000-year pressure. Dark colors indicate that it is original land in simulations (depth< 0), signifying flood areas in this study.
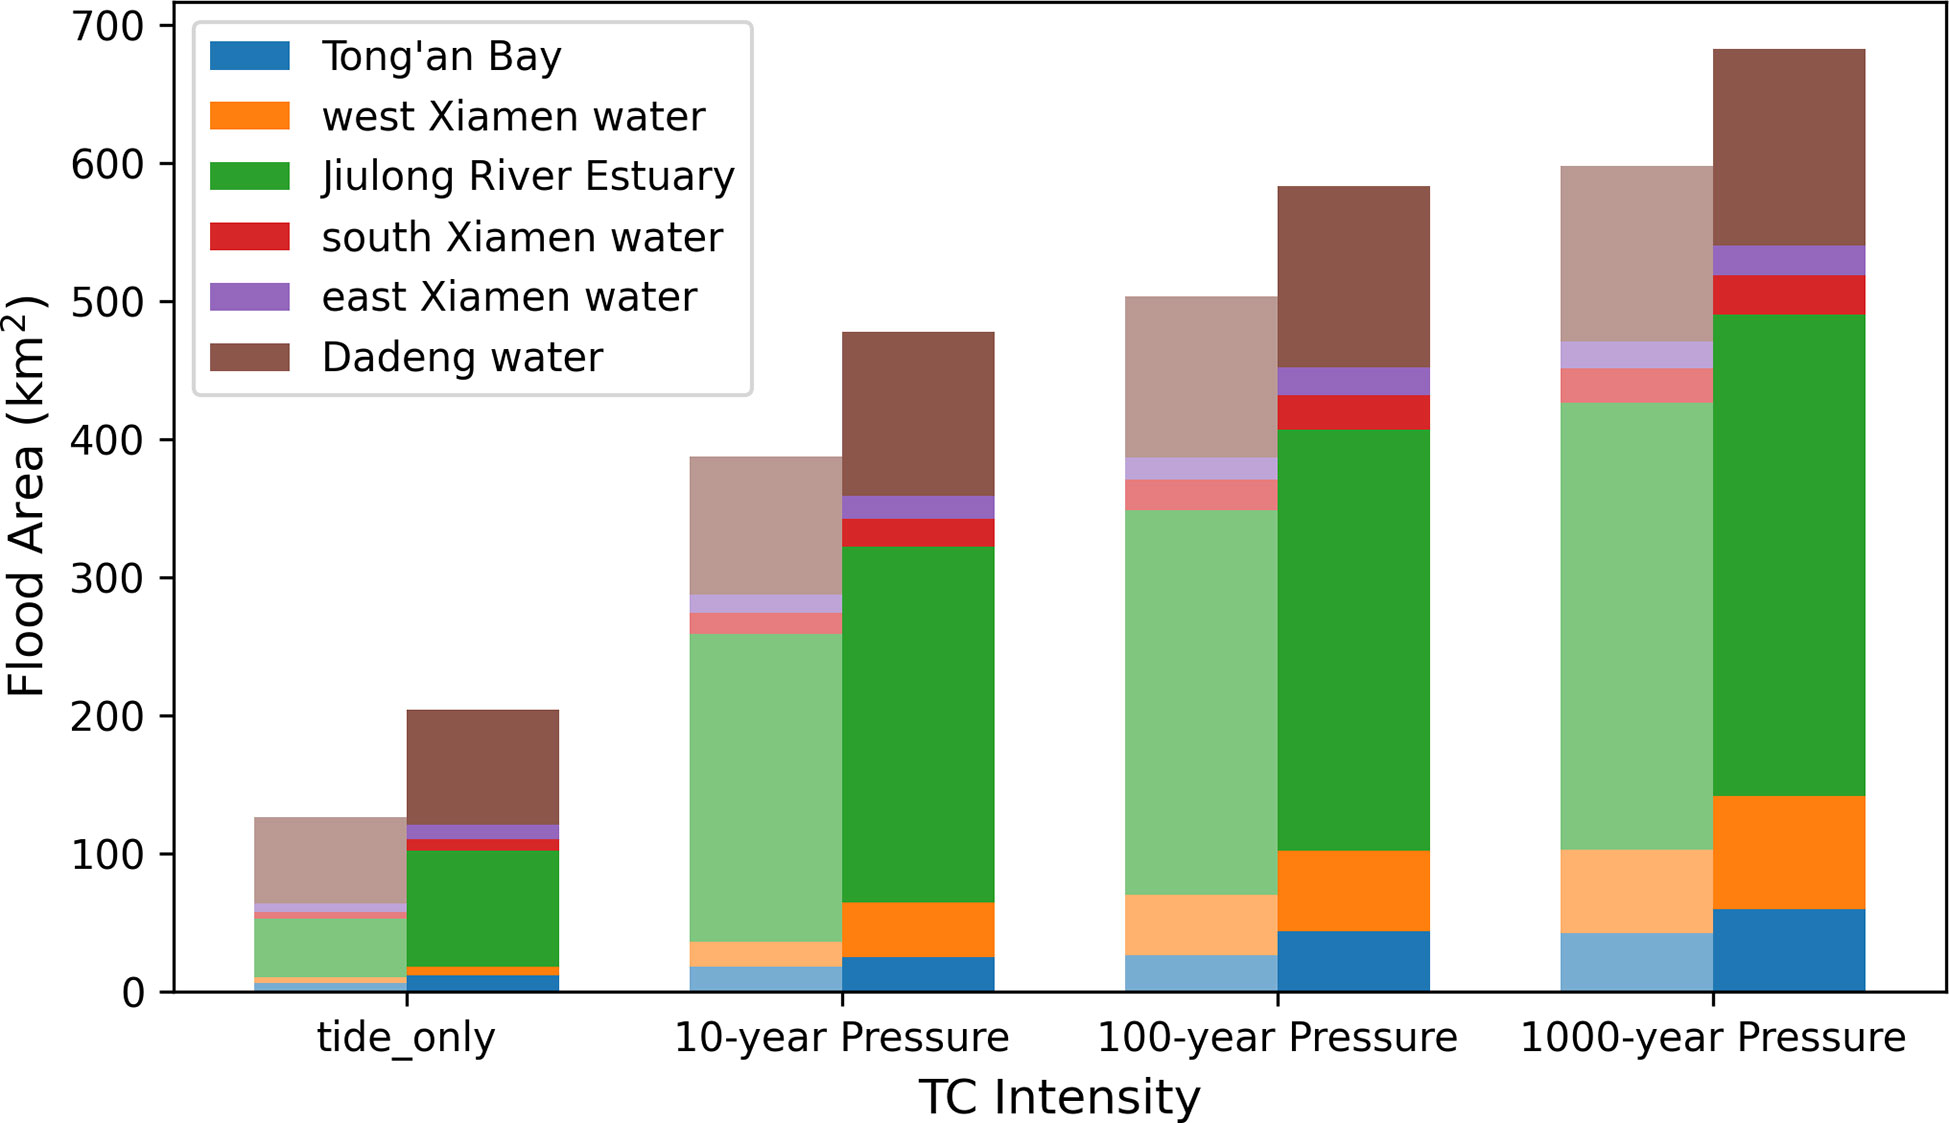
Figure 7 The flood areas in the six parts of Xiamen Bay under tide-only and TCs with 10-, 100-, and 1000-year pressures. The left bars with light colors are flood areas during current climate, and the right bars indicate flood areas under SSP5-8.5 conditions by 2100.
The flooded areas largely expand in Xiamen Bay under TC events—increasing 3.1-, 4.0-, and 4.7-fold during astronomical high tide under TCs of 10-, 100-, and 1000-year pressures, respectively (Figure 7). TCs impact the Inner Bay Area at a higher rate than the Outer Bay Area. The proportion of flooded area in the Inner Bay Area increases from 42% during tide-only situation to about 70% under TC events.
Under the influence of TCs with a 10-year pressure, all the low-lying shoals in the Jiulong River Estuary are expected to be potentially inundated (Figure 6B), leading to an extremely significant expansion of flooded area of about 180 km2 (Figure 7). In the west Xiamen water, the elevated water levels force seawater flood into Xinlin Bay, resulting in an increase of over 10 km2 of flooded area. The flooded area in Tong’an Bay can intrude inland for more than 5 km and lead to about 12 km2 of additional flooded area. Mainly due to the significant increase in flooded area in the Jiulong River Estuary, the Inner Bay Area results in 67% flooded area in Xiamen Bay, which is much more than the 42% under tide-only conditions. Significant flooded area expansion (nearly 40 km2) can also be seen in the Dadeng water of the Outer Bay Area. These additional floods mainly happens on the low-lying coasts opposite Dadeng Island. Despite the high expansion of flooded areas, Xiamen Island, which is protected by high-standard seawalls, is little impacted by TCs with 10-year pressure.
Under the influence of TCs with 100-year pressure, the flooded areas continue to expand in all six parts of Xiamen Bay under the influence of higher peak water levels. In the Jiulong River Estuary, the flooded areas intrude more inland and expand by about 55 km2 (Figure 6C). In the west Xiamen water, the Maluan Bay is also flooded, resulting in a significant expansion of flooded area of over 25 km2. We should note that part of the low-lying southwest Xiamen Island (about 4 km2), where a wetland park is located, can be flooded under this condition.
TCs with 1000-year pressure can result in extremely severe flood disaster in Xiamen Bay when meeting high tides. Nearly 600 km2 of low-lying land can be flooded, and over 50% of this occurs in the Jiulong River Estuary (Figure 7). Coastal flooding can extensively intrude into Xinlin Bay, Maluan Bay, and low-lying southwest Xiamen Island, leading to 60 km2 of flooded area in the west Xiamen water (Figure 6D). In Tong’an Bay, the extremely high water level generates expansive flooding along both coasts, leading to over 40 km2 of flooded area.
Flood damage typically increases disproportionately with flood depth (Scawthorn et al., 2006). The average flood depth is 1.3 m during astronomical high tide and increases to 2.3, 2.8, and 3.4 m with superpositions of TCs with 10-, 100-, and 1000-year pressures, respectively (Table 2). The flood depth is little area-varying under the sole influence of tide but strongly area-varying under the influence of TCs. The TCs with 10-year pressure can result in average flood depths of 2.4 m and 2.3 m in the Jiulong River Estuary and the Dadeng water, respectively, but that of the west Xiamen water and east Xiamen water reaches only 1.9 m. The average flood depth in the Jiulong River Estuary spread to 3.2 m under TCs with 100-year pressure, but it increased little in the west Xiamen water. Under the influence of TCs with 1000-year pressure, the averaged flood depth in the Jiulong River Estuary can dramatically spread to 4.0 m, whereas that in Tong’an Bay, west Xiamen water, and east Xiamen water are less than 3.0 m.
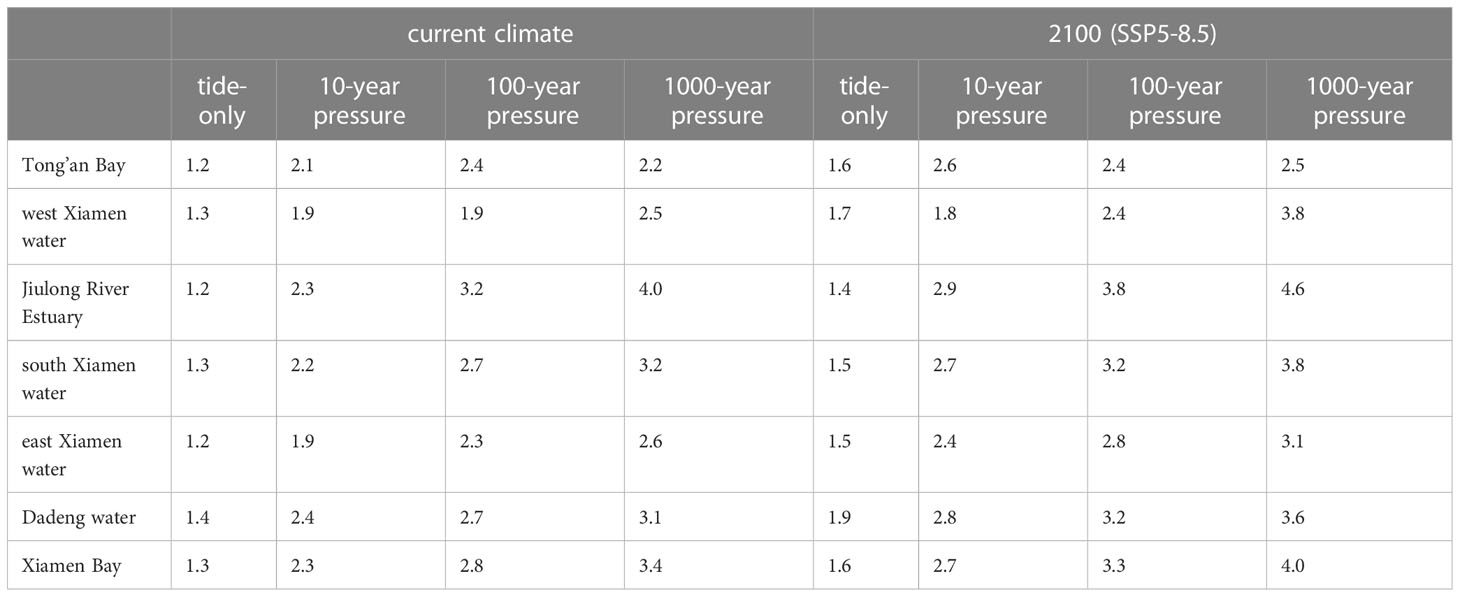
Table 2 Statistics of averaged flood depth in different parts of Xiamen Bay under TCs in current climate and by 2100 under SSP5-8.5 projection.
Flood duration is reported to be an additional critical parameter responsible for flood damage (Javelle et al., 2003; Wagnaar, 2012; Feng et al., 2017), since many infrastructures, such as the power system (Cruse and Kwasinski, 2021) and the transportation system (Pyatkova et al., 2019), are concerned with how long the facility will be offline. Figure 8 displays flood duration map under influence of tide-only and TCs of 10-, 100-, and 1000-year pressures. When TC is absent, long flood duration is found in the river channels of the Jiulong River Estuary and the low-lying coastal farms and salt pans in the Dadeng water (Figure 8A). TCs prolong flood durations in all flooded areas. The additional flooded area suffers relative short flood duration. The proportions of area suffering flood longer than 10 hours are 40%, 46%, 51%, and 53% under scenario of tide-only and TCs of 10-, 100-, and 1000-year pressures, respectively. Accordingly, the area-average flood durations of each scenario are longer than 10 h.
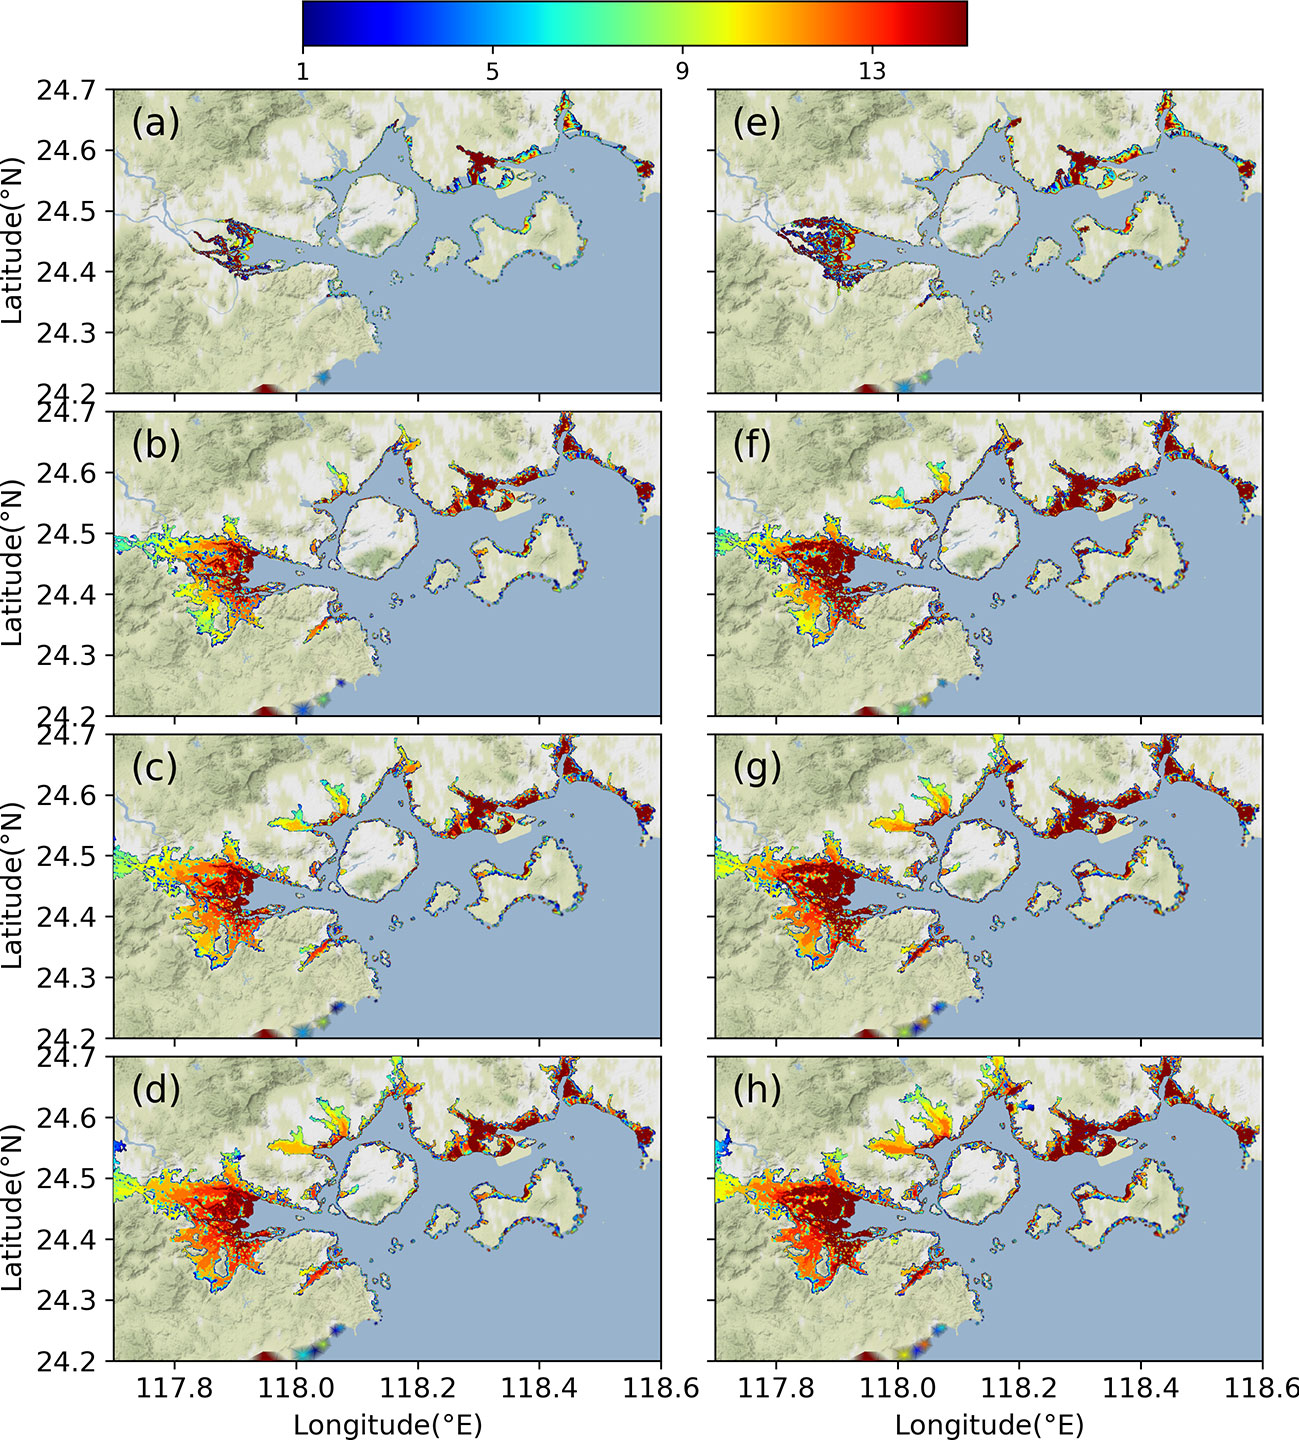
Figure 8 Flood duration (units of h) around Xiamen Bay at current climate (left column) and under SSP5-8.5 climate change (right column). (A, E) tide-only cases, (B, F) under TC with 10-year pressure; (C, G) under TC with 100-year pressure; (D, H) under TC with 1000-year pressure.
Integrated maps of flood areas, flood depth and flood duration, the most severe flooding caused by TCs always occurs in the Jiulong River Estuary due to the extent of low-lying shoals, followed by the Dadeng water, which is mainly due to the low-lying coastal farms and salt pans between the island and mainland. Relatively, the south and east Xiamen water is little flooded by TCs. We should note that although Xiamen Island is well protected by seawalls, its low-lying southwest portion can be flooded under TCs with 100-year pressure meeting high tide. Although the flooded area is limited, it should be strongly considered due to the extremely dense population and numerous buildings on the island.
3.3 Impacts of climate change on coastal flood
Global SLR can exacerbate coastal flood. With an SLR of 0.77 m on the open boundary, the peak water level at the Xiamen station can be elevated substantially by about 0.89 m (Figure 5). The bolstered rise in peak water level may be related to the amplified tides under SLR, which has been well documented by many studies (e.g., FitzGerald et al., 2008; Khojasteh et al., 2021). A simple example is that the succedent low tidal level is elevated by only 0.67 m. The 0.77 m SLR expands the flood areas during high tide by ~ 77 km2 in Xiamen Bay, over half of which occurs in the Jiulong River Estuary (Figures 6, 7). Moreover, the average flood depth increases to 1.6 m, with the largest increase occurring in the Dadeng water (Table 2).
Comparing the dashed and solid lines in Figure 5D, the surge levels change little under intensive 10-year pressure, whereas they increase by 0.20 m and 0.10 m under intensive 100-year and 1000-year pressures, respectively. This result illustrates that changes in TC climatology can increase the influence of SLR on peak water levels, although SLR may predominate the elevated peak water level in Xiamen Bay. This phenomenon is similar to results from New England, but it is very different compared to those from the Gulf of Mexico, where the effect of TC climatology change is likely to be larger than the effect of SLR (Marsooli et al., 2019). The combination of SLR and TC climatology change lead to TCs with 10-year pressure inducing a peak water level that is nearly equivalent to that induced by TCs with 100-year pressure under the current climate, and TCs with 100-year pressure will induce a peak water level nearly equivalent to that induced by TCs with 100-year pressure under the current climate (Figure 5C).
As a result of the substantial elevated peak water levels under the combination of SLR and TC climatology change, the flood area is expanded by about 90 (23%), 80 (16%), and 85 (14%) km2 under TCs with 10-, 100-, and 1000-year pressures, respectively (Figure 7). The main expansion happens in the Jiulong River Estuary, following by the west Xiamen water and the Dadeng water. The averaged flood depth and averaged flood duration will increase by ~ 0.5 m and ~ 1.0 h for each scenario by 2100 under SSP5-8.5 projection, respectively.
Comparing Figures 6B, F, under the condition of TCs with 10-year pressure, the SSP5-8.5 climate change projection can flood more area in the west Xiamen water, including Maluan Bay and some of the low-lying area in the southwest of Xiamen Island, although the flood depth and duration of these places is very small. This change results in a remarkable expansion (21 km2) in flood areas of the west Xiamen water and a slight decrease in the average flood depth (Figure 7; Table 2). In other parts of Xiamen Bay, the SSP5-8.5 projection leads to flood area expansion and longer flood duration accompanied by flood depth increase, especially in the Jiulong River Estuary, where the flood area is expanded by 35 km2, the average flood depth and duration increases from 2.3 m and 10.40 h in the current climate to 2.9 m and 11.91 h.
Under the condition of TCs with 100-year pressure, the SSP5-8.5 projection by 2100 leads to flood area expansion and increased average flood depth for all six parts of Xiamen Bay, except for some lagging in the average flood depth in Tong’an Bay, where significant flood area expansion occurs (comparing Figures 6C, G). The flooded area (583 km2) and flood depth (3.3 m) in the whole Xiamen Bay are nearly equivalent to that induced by TCs with 1000-year pressure under the current climate (598 km2 and 3.4 m). The low-lying land in the southwest of Xiamen Bay, which can only be entirely flooded under TCs with 1000-year pressure, will be flooded under TCs with 100-year pressure by 2100 (SSP5-8.5). The averaged flood duration increases significantly (from 10.72 h in the current climate to 11.78 h), mainly due to the notable longer flood duration in the Jiulong River Estuary.
TCs with 1000-year pressure can dramatically flood Xiamen Bay with an area of over 680 km2 by the year 2100 under climate change projection SSP5-8.5, over half of which occurs in the Jiulong River Estuary. Compared with the flood area of the current climate, a significant increase in flood areas (over 20 km2) is found in the Jiulong River Estuary and the west Xiamen water. The flood depth also increases substantially in all six parts of Xiamen Bay. Especially in the west Xiamen water, the flood depth increases by as much as 1.3 m compared to the current climate. This may due to there being nearly no low-lying land that can be flooded further, as an increase of flood area of only 6 km2 occurs compared with that induced by TCs with 100-year pressure. The limited low-lying areas lead to only 0.5 h increase in flood duration in the west Xiamen water, but in the Jiulong River Estuary with large-scale low-lying areas available for flooding, the flood duration experiences a significant increase of 1.2 h.
4 Discussion
4.1 Land and population exposure
Figure 9 shows the land exposure of different land use categories to flooding and the number of populations directly affected by each TC intensities. On the condition of current climate, over 80% of the area flooded periodically by astronomical tides are wetlands (57.5%) and water bodies (23.6%). No people is influenced by sole astronomical tides. With influence of TCs with a 10-year pressure, exposed artificial surface increases significantly from ~ 12 km2 to ~ 77 km2, and the flooded agricultural area expands by about 100 km2. There are over 300 K people will be affected by flooding under this condition. This result implies that the flood risk increases notably since the high value of artificial surface and agricultural areas. Under the influence of TCs with 100-year pressure, the flooded areas of each land use category increase progressively. Since most wetlands has been flooded by TCs with 10-year pressure, the area of flooded wetlands increases little. While, the highly urbanization around the Xiamen Bay leads to the flooded artificial surface continues to increase by 56.8 km2, which is the most significant category. And the affected population increases to 487 K at this condition. There are nearly 600 km2 of flooded low-lying land when a TC with 1000-year pressure meets astronomical high tide. Among them, 29% are artificial surface, 26% are agricultural areas, and 38% are water bodies and wetlands. The flooded artificial surface continues to increase by over 40 km2. The affected number of people grows to about 697 K.
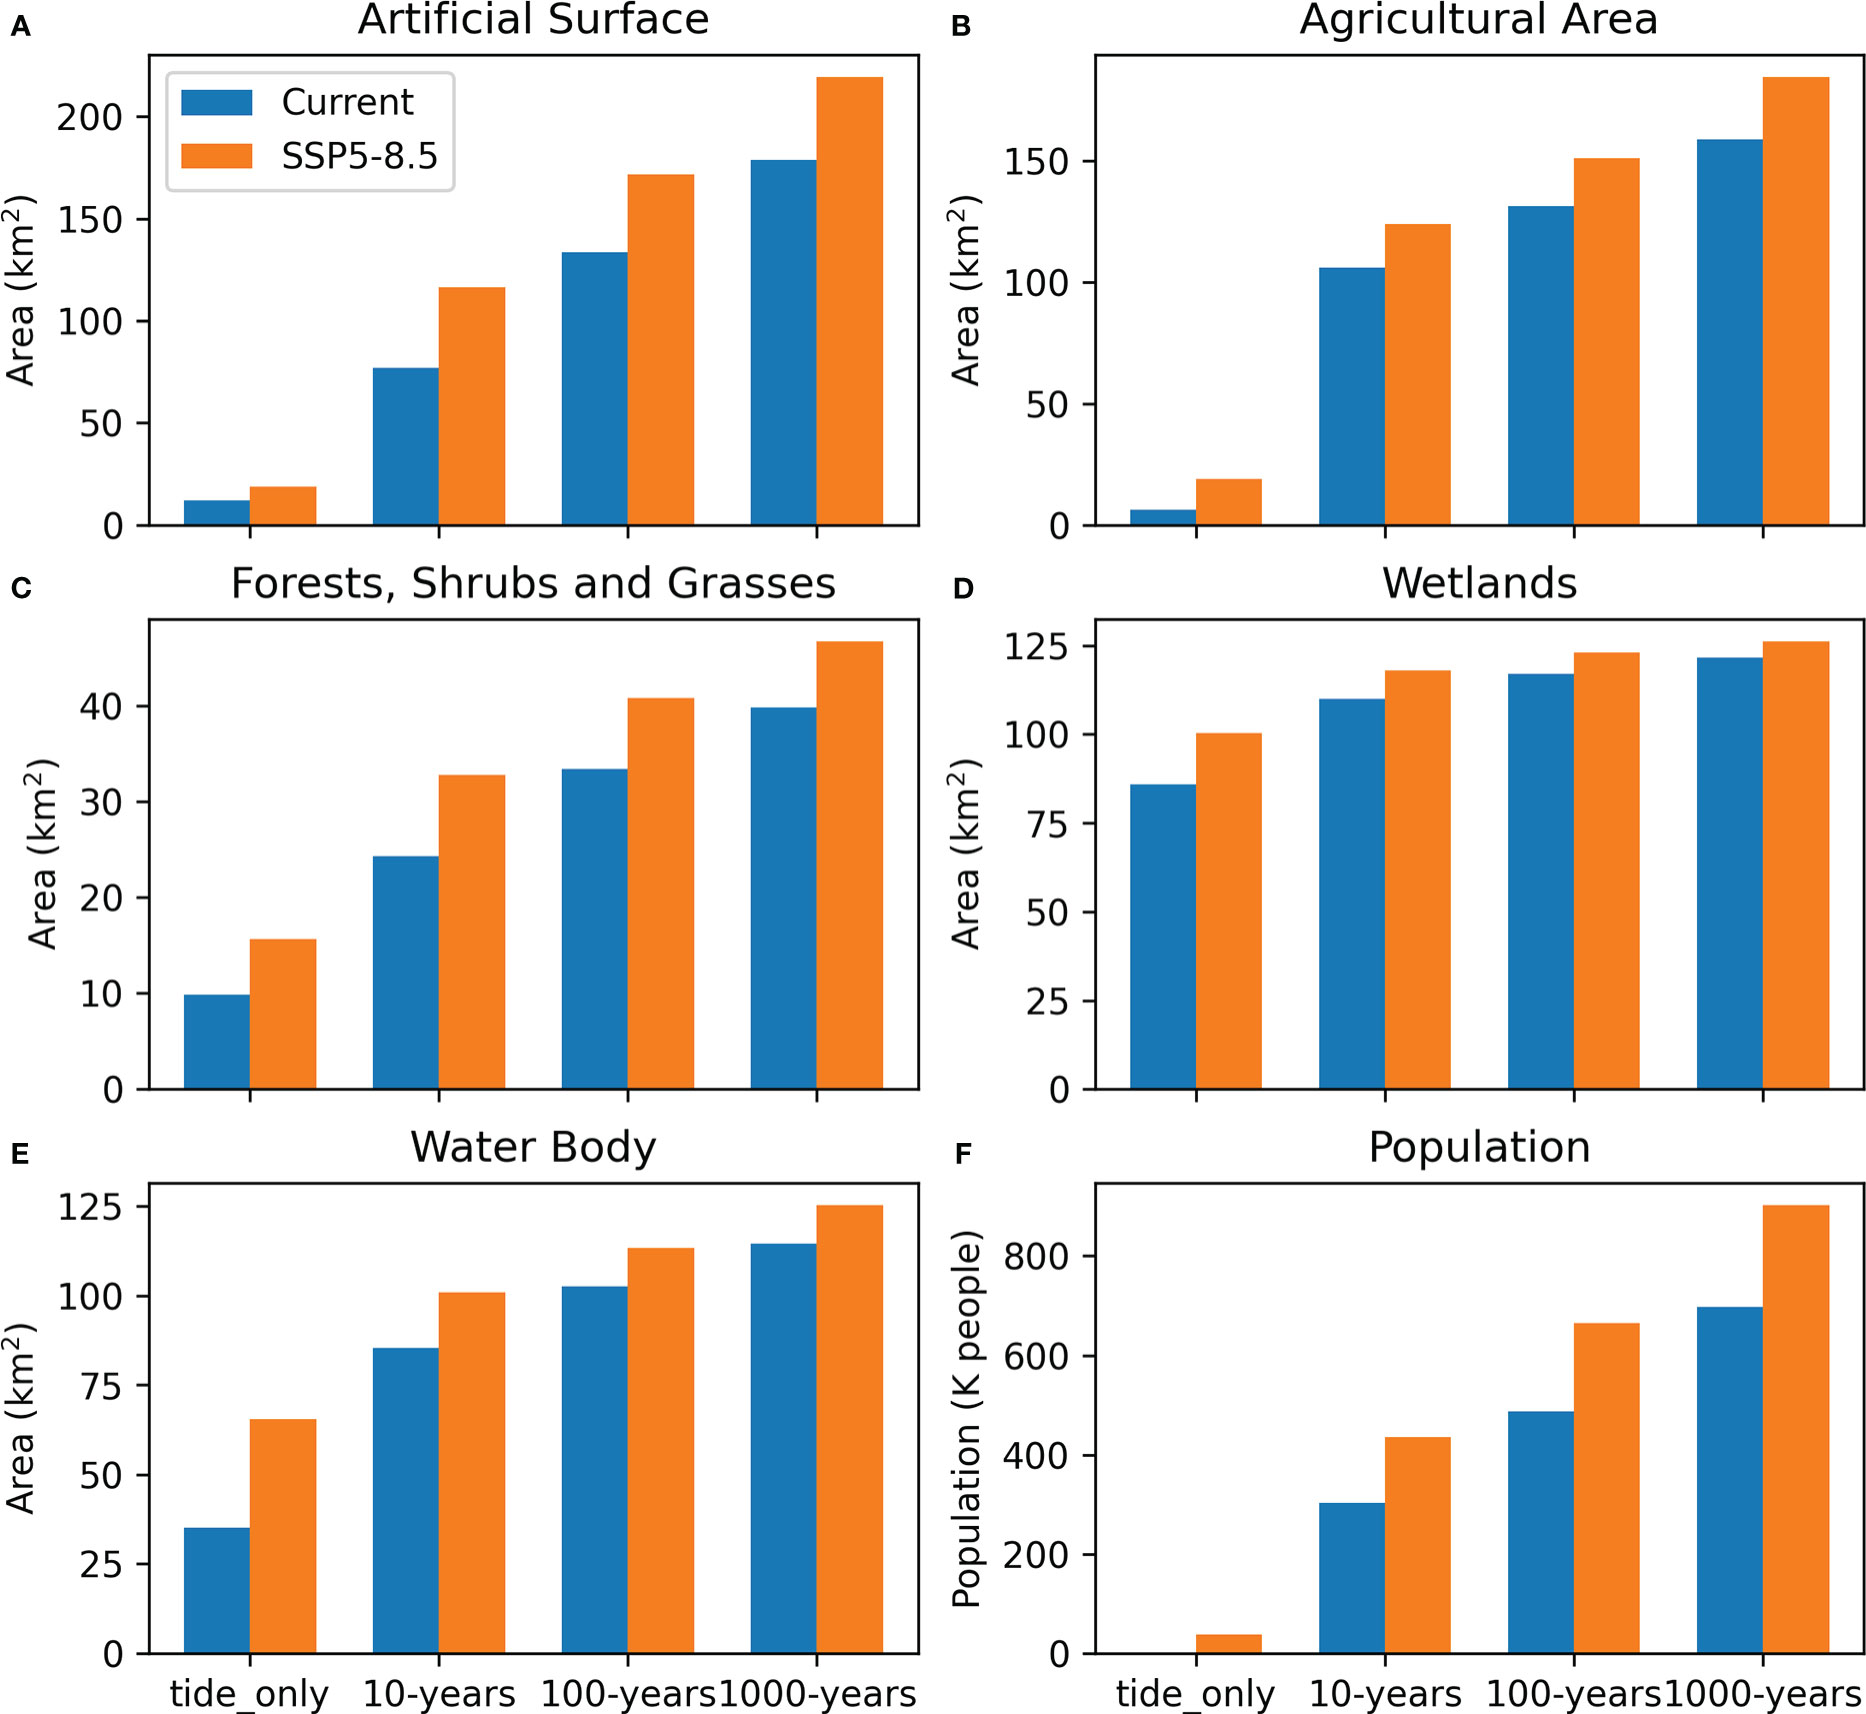
Figure 9 Flooded areas of different land uses: (A) Artificial surfaces; (B) Agricultural areas; (C) Forests, shrubs and grasses; (D) Wetlands, (E) Water body. (F) Number of Population directly affected by each flood event.
It is projected that climate change will lead to more area exposure of each land use category and also more population exposure to flooding (Figure 9). Under the SSP5-8.5 scenario by 2100, 38 K people will live below the high-tide line, implying tide-only coastal flooding event will occur frequently with SLR. Similar result is found in Sydney, Australia (Hague et al., 2020). Relative to current climate, there are 77 km2 more area will be inundated by high tide. 39% of them are water bodies, 19% are wetlands, and 16% are agricultural areas. Under influence of TCs of the three intensities, the most remarkable increase in exposed area are all found in the artificial surface category, following by the agricultural area category. About 70% of the increase in exposed area are in the two categories. The affected population increases to 436 K, 665 K, and 901 K under influence of TCs with a 10-, 100-, and 1000-years pressure, respectively. This result means that flood disaster in the Xiamen Bay will be much stronger in the warmer future.
4.2 Implication for coastal flood adaptation
In the context of dramatic increases in flooded area and exposed population in the warmer future, adaption and protection of coastal communities is a critical question. A traditional simple option is reinforcement and heightening of coastal seawalls and dikes. Meanwhile, it is expected that the required seawall heightening is much higher than the SLR values, mainly due to the expected increase of wave run-up (e.g., Zhang et al., 2021), the higher extreme tides relating to stronger storminess, the larger tidal ranges due to hard coastlines (e.g. Feng et al., 2019; Zhang and Li, 2019) and the accelerating land subsidence relating to rapid coastal urbanization (Syvitski et al., 2009). Seawalls and dikes are costly in construction and maintenance, but only provide protection from floods under a given hazard severity. If the flood exceeds such severity, serious disaster may occur. Typical examples are Hurricane Katrina flood in 2005 on the northern Gulf of Mexico (1392 casualties and 125 billion USD economic losses) and Storm Xynthia flood in 2010 over the Europe (64 reported casualties and 4.5 billion USD economic losses).
Alternative option is to build soft flood defenses based on natural ecosystems (Temmerman et al., 2013). Vegetated foreshores can substantially lower sea levels and reduce incoming wave energy (Mi et al., 2022), resulting in less constraining on seawall design, thus reduce initial construction costs and maintenance costs (Chaumillon et al., 2017). Such soft flood defenses for coastal protection is increasingly become a consensus for many countries and regions, such as the Netherlands and Mississippi River Delta in the United States.
Since the dense population and limited routes for crowed dispersal in Xiamen Island, it is necessary to reinforce and heighten the seawalls around Xiamen Island, especially that southwest of the island. In addition, current coastal wetlands and green space must be well protected, and restored as they act as key soft defenses, protecting population and property from exposure to flood hazards (Arkema et al., 2013), but are strongly reclaimed since 1950s (Wang et al., 2010). As a coastal city, there are also other solutions for adaptation to future stronger coastal flooding, including optimizing urban drainage systems to increase resilience to extreme flood events (Ferrans et al., 2022), and constructing flood-resistant buildings (Amini and Memari, 2020).
4.3 Comparison with other studies
This study gives a reasonable estimation of flooded area and affected population in Xiamen Bay under three TC intensities based on a high-resolution numerical model. the flood situations in warmer future are also projected. Climate change induced SLR and TC climatology changes substantially exacerbate the flood risk in Xiamen Bay. About 70% of the increased exposed area are artificial surfaces and agricultural areas. The affected population also increase significantly. Xu et al. (2016) adopted an approach based on bathtub method to have an assessment of the flooded risk of Xiamen City, which is located in Xiamen Bay. As a result, 116-171 km2 land and 440-720 K population will be flooded under 4.75-5.86 m extreme sea-level. The maximum water level at station Xiamen under influence of TCs with a 10- years pressure by 2100 is 5.84 m. In our estimation, there are only 101 km2 flooded land (exclude the flooded area in Jiulong River Estuary and Dadeng water) and less than 430 K affected people. The flooding in our estimation is obviously weaker than the assessment by Xu et al. (2016). Since the dynamical tide approach is more suitable for assessing coastal inundation (Neumann and Ahrendt, 2013; Hsiao et al., 2022), we are confident in our estimation.
We acknowledge that there are several limitations in this study. The most important is that the exclusion of fluvial flood. TCs always bring simultaneous heavy rainfall, and it is expected that TC rainfall is in an increasing trend of about 1.3% per year (Guzman and Jiang, 2021). The compound flooding can result in higher flood depths and larger flood extents along the river and coastlines compared to their individual occurrences (Svensson and Jones, 2004; Hsiao et al., 2021). That means flood risk in Xiamen Bay may be underestimated in this study. While, the annual mean river discharge of the Jiulong River is ~ 380 m3/s, and the recorded highest discharge is 15540 m3/s. Even under such high discharge condition, the fluvial flooding only raises water levels in the upper Jiulong River Estuary, but throw little influence on those in the lower Jiulong River Estuary and around Xiamen Island (Yang et al., 2017). Since we focus on the flooding in the whole Xiamen Bay, the influence extent of pluvial flood is small compared to the study area.
Moreover, we neglect the remarkable spatial variation in SLR, which is mainly related to vertical land movement, steric effects and mass redistribution (Brown et al., 2016; Qu et al., 2019). While, Feng et al. (2019) found that it is highly similar between tidal response to spatially-varying SLR and that to uniform SLR. And sea level at Xiamen is projected to rise 0.51-1.94 m by 2100 under RCP 8.5, and the spatial difference of SLR along the Fujian coasts is small (Qu et al., 2019). Although the 0.77 m SLR used in this study from IPCC (2021) may not be the exact value in Xiamen Bay, it is in the projected SLR range and can be acceptable. In addition, we only consider TC climatology changes by simply enlarging the pressure decrease, maximum wind speed, and the maximum wind radius according to previous studies. But studies show that all the TC features will be changed by a warming climate, including the tracks, translation speed, and also structures (IPCC, 2021). However, because this study captured the essence of the impact of climate change on sea level and TC climatology, these limitations do not undermine our conclusions.
5 Conclusions
In this study, a multi-tracks blend method is used to assess the flood risk in Xiamen Bay, Fujian, China under TCs with different intensities numerically. The influence of SLR and TC climatology change are also investigated. Stronger TCs induce larger flood area and deeper flood depth in general. The Jiulong River Estuary is the most easily flooded area due to its large-scale shoals. The low-lying coastal farms and salt pans in the Dadeng water are also easily flooded. The low-lying southwest part of the well-protected Xiamen Island can be partly flooded during TCs with 100-year pressure and entirely flooded during TCs with 1000-year pressure, but the flood depth is small.
Climate change can induce SLR and more intense and larger TCs. The combination of these substantially exacerbate the coastal flood situation in Xiamen Bay, with significant flood area expansion (over 10%) and flood depth spread (over 15%), although SLR may predominate this influence. By the year 2100 under SSP5-8.5 projection, TCs with 100-year pressure will lead to a flood situation that is nearly equivalent to that induced by TCs with 1000-year pressure under the current climate. The flood depth in the west Xiamen water will greatly spread by about 1.3 m under TCs with 1000-year pressure. About 70% of the increase in exposed area are in the artificial surface and agricultural area category, which implies that climate change will lead to significant higher flood risk in future.
Data availability statement
The datasets presented in this study can be found in online repositories. The names of the repository/repositories and accession number(s) can be found below: https://figshare.com/articles/dataset/Xiamen_Flooding/21901416.
Author contributions
WG, PD, and JG contributed to the conception and design of the study. DY organized the database. ZC generated the unstructured mesh for the simulations. WG, DY, and ZC conducted the simulations and wrote sections of the manuscript. WG wrote the first draft of the manuscript. All authors contributed to the article and approved the submitted version.
Funding
This work is supported by National Natural Science Foundation of China (Grant No. 41906143), National Key R&D Program of China (Grant No. 2022YFE0117500) and Shanghai Sailing Program (Grant No. 19YF1418500). The first author, WG, is also supported by Shanghai Frontiers Science Center of “Full Penetration” Far-Reaching Offshore Ocean Energy and Power.
Acknowledgments
The authors thank Fujian Provincial Department of Ocean and Fisheries very much for offering the datasets used in this study, including the land topography, seawall locations and heights, observed tidal levels during tropical cyclones, and so on. All the simulations are conducted on a high-performance supercomputer from State Key Laboratory of Estuarine and Coastal Research (SKLEC). The first author WG expresses his appreciation to SKLEC.
Conflict of interest
The authors declare that the research was conducted in the absence of any commercial or financial relationships that could be construed as a potential conflict of interest.
Publisher’s note
All claims expressed in this article are solely those of the authors and do not necessarily represent those of their affiliated organizations, or those of the publisher, the editors and the reviewers. Any product that may be evaluated in this article, or claim that may be made by its manufacturer, is not guaranteed or endorsed by the publisher.
References
Amante C., Eakins B. W. (2009). ETOPO1 arc-minute global relief model : Procedures, data sources and analysis.
Amini M., Memari A. M. (2020). Review of literature on performance of coastal residential buildings under hurricane conditions and lessons learned. J. Perform. constructed facilities 34 (6), 04020102. doi: 10.1061/(ASCE)CF.1943-5509.0001509
Arkema K. K., Guannel G., Verutes G., Wood S. A., Guerry A., Ruckelshaus M., et al. (2013). Coastal habitats shield people and property from sea-level rise and storms. Nat. Climate Change 3 (10), 913–918. doi: 10.1038/nclimate1944
Atkinson G. D., Holliday C. R. (1977). Tropical cyclone minimum Sea level Pressure/Maximum sustained wind relationship for the Western north pacific. Mon Weather Rev. 105 (4), 421–427. doi: 10.1175/1520-0493(1977)105<0421:TCMSLP>2.0.CO;2
Balaguru K., Foltz G. R., Leung L. R., Emanuel K. A. (2016). Global warming-induced upper-ocean freshening and the intensification of super typhoons. Nat. Commun. 7 (1), 1–8. doi: 10.1038/ncomms13670
Brown S., Nicholls R. J., Lowe J. A., Hinkel J. (2016). Spatial variations of sea-level rise and impacts: An application of DIVA. Climatic Change 134 (3), 403–416. doi: 10.1007/s10584-013-0925-y
Carr L. E., Elsberry R. L. (1997). Models of tropical cyclone wind distribution and beta-effect propagation for application to tropical cyclone track forecasting. Mon Weather Rev. 125 (12), 3190–3209. doi: 10.1175/1520-0493(1997)125<3190:MOTCWD>2.0.CO;2
Chang C., Shih H., Chen W., Su W., Lin L., Yu Y., et al. (2018). Hazard assessment of typhoon-driven storm waves in the nearshore waters of Taiwan. Water 10, 1–20. doi: 10.3390/w10070926
Chaumillon E., Bertin X., Fortunato A. B., Bajo M., Schneider J., Dezileau L., et al. (2017). Storm-induced marine flooding: Lessons from a multidisciplinary approach. Earth-Science Rev. 165, 151–184. doi: 10.1016/j.earscirev.2016.12.005
Chen C., Beardsley R. C., Cowles G. (2013). An unstructured grid, finite-volume coastal ocean model: FVCOM user manual. New Bedford.
Chen C., Liu H., Beardsley R. C. (2003). An unstructured grid, finite-volume, three-dimensional, primitive equations ocean model: Application to coastal ocean and estuaries. J. Atmos Ocean Tech 20 (1), 159–186. doi: 10.1175/1520-0426(2003)020<0159:augfvt>2.0.co;2
Cruse G., Kwasinski A. (2021). Statistical evaluation of flooding impact on power system restoration following a hurricane. 2021 Resilience Week (RWS), Salt Lake City, IEEE.
Donelan M. A. (2018). On the decrease of the oceanic drag coefficient in high winds. J. Geophys. Res.: Oceans 123 (2), 1485–1501. doi: 10.1002/2017JC013394
Egbert G. D., Erofeeva S. Y. (2002). Efficient inverse modeling of barotropic ocean tides. J. Atmos Ocean Tech 19 (2), 183–204. doi: 10.1175/1520-0426(2002)019<0183:EIMOBO>2.0.CO;2
Fang Y., Yin J., Wu B. (2016). Flooding risk assessment of coastal tourist attractions affected by sea level rise and storm surge: A case study in zhejiang province, China. Natural Hazards 84 (1), 611–624. doi: 10.1007/s11069-016-2444-4
Feng Y., Brubaker K. L., McCuen R. H. (2017). New view of flood frequency incorporating duration. J. Hydrologic Eng. 22 (11), 04017051. doi: 10.1061/(ASCE)HE.1943-5584.0001573
Feng X., Feng H., Li H., Zhang F., Feng W., Zhang W., et al. (2019). Tidal responses to future Sea level trends on the yellow Sea shelf. J. Geophys. Res.: Oceans 124 (11), 7285–7306. doi: 10.1029/2019JC015150
Ferrans P., Torres M. N., Temprano J., Rodríguez Sánchez J. P. (2022). Sustainable urban drainage system (SUDS) modeling supporting decision-making: A systematic quantitative review. Sci. Total Environ. 806, 150447. doi: 10.1016/j.scitotenv.2021.150447
FitzGerald D. M., Fenster M. S., Argow B. A., Buynevich I. V. (2008). Coastal impacts due to Sea-level rise. Annu. Rev. Earth Pl Sc 36 (1), 601–647. doi: 10.1146/annurev.earth.35.031306.140139
Fujii T. (1998). Statistical analysis of the characteristics of severe typhoons hitting the Japanese main islands. Mon Weather Rev. 126 (4), 1091–1097. doi: 10.1175/1520-0493(1998)126<1091:SAOTCO>2.0.CO;2
Gao Y., Wang H., Liu G. M., Sun X. Y., Fei X. Y., Wang P. T., et al. (2014). Risk assessment of tropical storm surges for coastal regions of China. J. Geophys. Res.: Atmospheres 119 (9), 5364–5374. doi: 10.1002/2013JD021268
Gori A., Lin N., Xi D., Emanuel K. (2022). Tropical cyclone climatology change greatly exacerbates US extreme rainfall–surge hazard. Nat. Clim Change 12 (2), 171–178. doi: 10.1038/s41558-021-01272-7
Graham H. E., Nunn D. E. (1959). Meteorological considerations pertinent to standard project hurricane, Atlantic and Gulf coasts of the United States. National Hurricane Research Project Report No. 33. Washington, D. C., U. S. Department of Commerce: 76.
Guzman O., Jiang H. (2021). Global increase in tropical cyclone rain rate. Nat. Commun. 12 (1), 5344–5344. doi: 10.1038/s41467-021-25685-2
Hague B. S., McGregor S., Murphy B. F., Reef R., Jones D. A. (2020). Sea Level rise driving increasingly predictable coastal inundation in Sydney, Australia. Earth's Future 8 (9), 1–17. doi: 10.1029/2020EF001607
Harper B. (2002). Tropical cyclone parameter estimation in the Australian region: Wind-pressure relationships and related issues for engineering planning and design - a discussion paper. Syst. Eng. Aust. Pty Ltd. 92. doi: 10.13140/RG.2.2.13057.04961
Hersbach H., Bell B., Berrisford P., Hirahara S., Horányi A., Muñoz Sabater J., et al. (2020). The ERA5 global reanalysis. Q J. Roy Meteor Soc. 146 (730), 1999–2049. doi: 10.1002/qj.3803
Hinkel J., Lincke D., Vafeidis A. T., Perrette M., Nicholls R. J., Tol R. S., et al. (2014). Coastal flood damage and adaptation costs under 21st century sea-level rise. P Natl. Acad. Sci. U.S.A. 111 (9), 3292–3297. doi: 10.1073/pnas.1222469111
Hsiao S., Chiang W., Jang J., Wu H., Lu W., Chen W., et al. (2021). Flood risk influenced by the compound effect of storm surge and rainfall under climate change for low-lying coastal areas. Sci. Total Environ. 764, 144439. doi: 10.1016/j.scitotenv.2020.144439
Hsiao S., Fu H., Chen W., Chang T., Wu H., Liang T. (2022). Assessment of future possible maximum flooding extent in the midwestern coastal region of Taiwan resulting from sea-level rise and land subsidence. Environ. Res. Commun. 4 (9), 095007. doi: 10.1088/2515-7620/ac8f15
Huang L. M., Wang J. Q., Li J., Zhang Y. Z., Chen R. B. (2018). Fishery resources and ecological environment in xiamen bay (Beijing: China Agriculture Press).
IPCC (2021). Climate change 2021: The physical science basis (United Kingdom and New York, NY, USA: Cambridge University Press, Cambridge).
Irish J. L., Resio D. T., Ratcliff J. J. (2008). The influence of storm size on hurricane surge. J. Phys. Oceanogr 38 (9), 2003–2013. doi: 10.1175/2008JPO3727.1
Islam M. R., Takagi H. (2020). Typhoon parameter sensitivity of storm surge in the semi-enclosed Tokyo bay. Front. Earth Sci-Prc 14 (3), 553–567. doi: 10.1007/s11707-020-0817-1
Javelle P., Ouarda T. B. M. J., Bobée B. (2003). Spring flood analysis using the flood-duration-frequency approach: Application to the provinces of Quebec and Ontario, Canada. Hydrological Processes 17 (18), 3717–3736. doi: 10.1002/hyp.1349
Khojasteh D., Glamore W., Heimhuber V., Felder S. (2021). Sea Level rise and estuarine tidal dynamics: A review. Earth-Sci Rev. 780, 146470. doi: 10.1016/j.scitotenv.2021.146470
Knutson T., Camargo S. J., Chan J. C. L., Emanuel K., Ho C., Kossin J., et al. (2019). Tropical cyclones and climate change assessment: Part I: Detection and attribution. B Am. Meteorol Soc. 100 (10), 1987–2007. doi: 10.1175/BAMS-D-18-0189.1
Knutson T., Camargo S. J., Chan J. C. L., Emanuel K., Ho C., Kossin J., et al. (2020). Tropical cyclones and climate change assessment: Part II: Projected response to anthropogenic warming. B Am. Meteorol Soc. 101 (3), E303–E322. doi: 10.1175/BAMS-D-18-0194.1
Kopp R. E., Horton R. M., Little C. M., Mitrovica J. X., Oppenheimer M., Rasmussen D. J., et al. (2014). Probabilistic 21st and 22nd century sea-level projections at a global network of tide-gauge sites. Earth's Future 2 (8), 383–406. doi: 10.1002/2014EF000239
Kossin J. P. (2018). A global slowdown of tropical-cyclone translation speed. Nature 558 (7708), 104–107. doi: 10.1038/s41586-018-0158-3
Kriebel D. L., Geiman J. D., Henderson G. R. (2015). Future flood frequency under Sea-level rise scenarios. J. Coast. Res. 31 (5), 1078–1083. doi: 10.2112/JCOASTRES-D-13-00190.1
Kumbier K., Carvalho R. C., Vafeidis A. T., Woodroffe C. D. (2019). Comparing static and dynamic flood models in estuarine environments: A case study from south-east Australia. Marine and Freshwater Research 70(6), 781–793. doi: 10.1071/MF18239
Lanzante J. R. (2019). Uncertainties in tropical-cyclone translation speed. Nature 570 (7759), E6–E15. doi: 10.1038/s41586-019-1223-2
Leendertse J. J. (1970). A water quality simulation model for well-mixed estuaries and coastal seas: Volume I, principles of computation (Santa Monica, CA: RAND Corporation).
Li X., Chen M., Lan H., Wu X. (2000). The analysis and forecast of storm surges and mountainous waves caused by typhoon 9914. Mar. Forecasts 17 (2), 25–33. (In Chinese)
Li L., Li Z., He Z., Yu Z., Ren Y. (2022). Investigation of storm tides induced by super typhoon in macro-tidal hangzhou bay. Front. Mar. Sci. 9. doi: 10.3389/fmars.2022.890285
Li S., Wahl T., Talke S. A., Jay D. A., Orton P. M., Liang X., et al. (2021). Evolving tides aggravate nuisance flooding along the U.S. coastline. Sci. Adv. 7 (10), e2412. doi: 10.1126/sciadv.abe2412
Li M., Zhang F., Barnes S., Wang X. (2020). Assessing storm surge impacts on coastal inundation due to climate change: Case studies of Baltimore and Dorchester county in Maryland. Nat. Hazards 103 (2), 2561–2588. doi: 10.1007/s11069-020-04096-4
Lin N., Shullman E. (2017). Dealing with hurricane surge flooding in a changing environment: Part i. risk assessment considering storm climatology change, sea level rise, and coastal development. Stochastic Environ. Res. Risk Assess. 31 (9), 2379–2400. doi: 10.1007/s00477-016-1377-5
Little C. M., Horton R. M., Kopp R. E., Oppenheimer M., Vecchi G. A., Villarini G. (2015). Joint projections of US East coast sea level and storm surge. Nat. Clim Change 5 (12), 1114–1120. doi: 10.1038/nclimate2801
Luo H., Wu J. (2022). Exploring the spatial pattern of damage caused by typhoon meranti on the urban green space on xiamen island. Nat. Environ. pollut. Technol. 21 (1), 315–319. doi: 10.46488/NEPT.2022.v21i01.038
Marsooli R., Lin N., Emanuel K., Feng K. (2019). Climate change exacerbates hurricane flood hazards along US Atlantic and gulf coasts in spatially varying patterns. Nat. Commun. 10 (1), 1–9. doi: 10.1038/s41467-019-11755-z
McGranahan G., Balk D., Anderson B. (2007). The rising tide: Assessing the risks of climate change and human settlements in low elevation coastal zones. Environ. Urban 19 (1), 17–37. doi: 10.1177/0956247807076960
Mei W., Xie S. (2016). Intensification of landfalling typhoons over the northwest pacific since the late 1970s. Nat. Geosci 9 (10), 753–757. doi: 10.1038/ngeo2792
Mendelsohn R., Emanuel K., Chonabayashi S., Bakkensen L. (2012). The impact of climate change on global tropical cyclone damage. Nat. Clim Change 2 (3), 205–209. doi: 10.1038/nclimate1357
Mi J., Zhang M., Zhu Z., Vuik V., Wen J., Gao H., et al. (2022). Morphological wave attenuation of the nature-based flood defense: A case study from chongming dongtan shoal, China. Sci. Total Environ. 831, 154813. doi: 10.1016/j.scitotenv.2022.154813
Miao Q., Yue X., Yang J., Wang Z., Xu S., Yang Y., et al. (2022). Characteristics analysis and risk assessment of extreme water levels based on 60-year observation data in xiamen, chin. J. Ocean U China 21 (2), 315–322. doi: 10.1007/s11802-022-4844-2
Miyazaki M. T. U. (1962). Theoretical investigations of typhoon surges along the Japanese coast (I). Oceanogr. Magazine 13 (3), 353–354.
Moon I., Kim S., Chan J. C. L. (2019). Climate change and tropical cyclone trend. Nature 570 (7759), E3–E5. doi: 10.1038/s41586-019-1222-3
Neumann T., Ahrendt K. (2013). Comparing the" bathtub method" with mike 21 HD flow model for modelling storm surge inundation (Berlin, Germany: Ecologic Institute).
Olfateh M., Callaghan D. P., Nielsen P., Baldock T. E. (2017). Tropical cyclone wind field asymmetry-development and evaluation of a new parametric model. J. Geophys. Res.: Oceans 122 (1), 458–469. doi: 10.1002/2016JC012237
Orton P. M., Conticello F. R., Cioffi F., Hall T. M., Georgas N., Lall U., et al. (2020). Flood hazard assessment from storm tides, rain and sea level rise for a tidal river estuary. Nat. Hazards 102 (2), 729–757. doi: 10.1007/s11069-018-3251-x
Pandey S., Rao A. D. (2019). Impact of approach angle of an impinging cyclone on generation of storm surges and its interaction with tides and wind waves. J. Geophys. Res.: Oceans. 124 (11), 7643–7660. doi: 10.1029/2019JC015433
Patricola C. M., Wehner M. F. (2018). Anthropogenic influences on major tropical cyclone events. Nature 563 (7731), 339–346. doi: 10.1038/s41586-018-0673-2
Peng S., Li Y. (2015). A parabolic model of drag coefficient for storm surge simulation in the south China Sea. Sci. Rep-Uk 5 (1), 1–6. doi: 10.1038/srep15496
Pickering M. D., Horsburgh K. J., Blundell J. R., Hirschi J. J. M., Nicholls R. J., Verlaan M., et al. (2017). The impact of future sea-level rise on the global tides. Cont Shelf Res. 142, 50–68. doi: 10.1016/j.csr.2017.02.004
Pyatkova K., Chen A. S., Butler D., Vojinović Z., Djordjević S. (2019). Assessing the knock-on effects of flooding on road transportation. J. Environ. Manage. 244, 48–60. doi: 10.1016/j.jenvman.2019.05.013
Qu Y., Jevrejeva S., Jackson L. P., Moore J. C. (2019). Coastal Sea level rise around the China seas. Global Planet Change 172, 454–463. doi: 10.1016/j.gloplacha.2018.11.005
Ray R. D., Foster G. (2016). Future nuisance flooding at Boston caused by astronomical tides alone. Earth's Future 4 (12), 578–587. doi: 10.1002/2016EF000423
Rego J. L., Li C. (2009). On the importance of the forward speed of hurricanes in storm surge forecasting: A numerical study. Geophys Res. Lett. 36 (7), 1–5. doi: 10.1029/2008GL036953
Scawthorn C., Flores P., Blais N., Seligson H., Tate E., Chang S., et al. (2006). HAZUS-MH flood loss estimation methodology. II. Damage and loss assessment. Nat. Hazards Rev. 7 (2), 72–81. doi: 10.1061/(ASCE)1527-6988(2006)7:2(72)
Schwerdt R. W., Ho F. P., Watkins R. R. (1979). Meteorological criteria for standard project hurricane and probable maximum hurricane windfields, gulf and east coasts of the United States. N. W. S. United States. Washington, D. C., U.S. Department of Commerce NOAA: 317.
Shi X., Jufei Q., Bingrui C., Xiaojie Z., Haoshuang G., Jun W., et al. (2020). Storm surge risk assessment method for a coastal county in China: Case study of jinshan district, shanghai. Stochastic Environ. Res. Risk Assess. 34 (5), 627–640. doi: 10.1007/s00477-020-01791-3
Shi Y., Zhai G., Zhou S., Lu Y., Chen W., Deng J. (2019). How can cities respond to flood disaster risks under multi-scenario simulation? a case study of xiamen, China. Int. J. Environ. Res. Public Health 16, 1–18. doi: 10.3390/ijerph16040618
Shih H., Chen H., Liang T., Fu H., Chang C., Chen W., et al. (2018). Generating potential risk maps for typhoon-induced waves along the coast of Taiwan. Ocean Eng. 163, 1–14. doi: 10.1016/j.oceaneng.2018.05.045
Sun Z., Huang S., Nie H., Jiao J., Huang S., Zhu L., et al. (2015). Risk analysis of seawall overflowed by storm surge during super typhoon. Ocean Eng. 107, 178–185. doi: 10.1016/j.oceaneng.2015.07.041
Svensson C., Jones D. A. (2004). Dependence between sea surge, river flow and precipitation in south and west Britain. Hydrol. Earth Syst. Sci. 8 (5), 973–992. doi: 10.5194/hess-8-973-2004
Syvitski J. P. M., Kettner A. J., Overeem I., Hutton E. W. H., Hannon M. T., Brakenridge G. R., et al. (2009). Sinking deltas due to human activities. Nat. Geosci. 2 (10), 681–686. doi: 10.1038/ngeo629
Taherkhani M., Vitousek S., Barnard P. L., Frazer N., Anderson T. R., Fletcher C. H. (2020). Sea-Level rise exponentially increases coastal flood frequency. Sci. Rep-Uk 10 (1), 1–17. doi: 10.1038/s41598-020-62188-4
Temmerman S., Meire P., Bouma T. J., Herman P. M. J., Ysebaert T., De Vriend H. J. (2013). Ecosystem-based coastal defence in the face of global change. Nat. 504 7478), 79–83. doi: 10.1038/nature12859
Thomas A., Dietrich J. C., Asher T. G., Bell M., Blanton B. O., Copeland J. H., et al. (2019). Influence of storm timing and forward speed on tides and storm surge during hurricane Matthew. Ocean Model. 137, 1–19. doi: 10.1016/j.ocemod.2019.03.004
Thomas A., Dietrich J. C., Dawson C. N., Luettich R. A. (2022). Effects of model resolution and coverage on storm-driven coastal flooding predictions. J. Waterway Port Coastal Ocean Eng. 148 (1), 4021046. doi: 10.1061/(ASCE)WW.1943-5460.0000687
Torres M. J., Reza H. M., Hayward S., Spaulding M., Ginis I., Grilli S. T. (2019). Role of hurricane wind models in accurate simulation of storm surge and waves. J. Waterway Port Coastal Ocean Eng. 145 (1), 4018039. doi: 10.1061/(ASCE)WW.1943-5460.0000496
Tsuboki K., Yoshioka M. K., Shinoda T., Kato M., Kanada S., Kitoh A. (2015). Future increase of supertyphoon intensity associated with climate change. Geophys Res. Lett. 42 (2), 646–652. doi: 10.1002/2014GL061793
Vitousek S., Barnard P. L., Fletcher C. H., Frazer N., Erikson L., Storlazzi C. D. (2017). Doubling of coastal flooding frequency within decades due to sea-level rise. Sci. Rep-Uk 7 (1), 1–9. doi: 10.1038/s41598-017-01362-7
Wagnaar D. (2012). The significance of flood duration for flood damage assessment (Delft: Delft University of Technology-Deltares. Master).
Wang X., Chen W., Zhang L., Jin D., Lu C. (2010). Estimating the ecosystem service losses from proposed land reclamation projects: A case study in xiamen. Ecol. Economics 69 (12), 2549–2556. doi: 10.1016/j.ecolecon.2010.07.031
Wang S., Mu L., Yao Z., Gao J., Zhao E., Wang L. (2021). Assessing and zoning of typhoon storm surge risk with a geographic information system (GIS) technique: A case study of the coastal area of huizhou. Natural Hazards Earth Syst. Sci. 21 (1), 439–462. doi: 10.5194/nhess-21-439-2021
Webster P. J., Holland G. J., Curry J. A., Chang H. R. (2005). Changes in tropical cyclone number, duration, and intensity in a warming environment. Science 309 (5742), 1844–1846. doi: 10.1126/science.1116448
Wei X., Brown J. M., Williams J., Thorne P. D., Williams M. E., Amoudry L. O. (2019). Impact of storm propagation speed on coastal flood hazard induced by offshore storms in the north Sea. Ocean Model. 143, 101472. doi: 10.1016/j.ocemod.2019.101472
World Meteorological Organization (2015). Tropical Cyclone Programme Report No. TCP-23: Typhoon Committee Operational Manual: Meteorological Component 2015 Edition. WMO/TD- No. 196. Geneva.
Xu W., Cai R. (2021). Impacts of sea level rise, strong typhoon and storm surge on extreme sea level in coastal waters of xiamen and hazards estimation. Haiyang Xuebao 43 (5), 14–26. doi: 10.12284/hyxb2021081
Xu L., Yuanrong H., Wei H., Shenghui C. (2016). A multi-dimensional integrated approach to assess flood risks on a coastal city, induced by sea-level rise and storm tides. Environ. Res. Lett. 11 (1), 14001. doi: 10.1088/1748-9326/11/1/014001
Yamada Y., Satoh M., Sugi M., Kodama C., Noda A. T., Nakano M., et al. (2017). Response of tropical cyclone activity and structure to global warming in a high-resolution global nonhydrostatic model. J. Climate 30 (23), 9703–9724. doi: 10.1175/JCLI-D-17-0068.1
Yamaguchi M., Chan J. C. L., Moon I., Yoshida K., Mizuta R. (2020). Global warming changes tropical cyclone translation speed. Nat. Commun. 11 (1), 1–7. doi: 10.1038/s41467-019-13902-y
Yang S. L., Lin L., Hu C. Y. (2017). Change of flow characteristics at jiulongjiang estuary under different runoff. Water Resour. Power 35 (7), 52–57. (In Chinese)
Yin J., Lin N., Yang Y., Pringle W. J., Tan J., Westerink J. J., et al. (2021b). Hazard assessment for typhoon-induced coastal flooding and inundation in shanghai, China. J. Geophys. Res.: Oceans 126 (7), 1–13. doi: 10.1029/2021JC017319
Yin C., Zhang W., Xiong M., Wang J., Zhou C., Dou X., et al. (2021a). Storm surge responses to the representative tracks and storm timing in the Yangtze estuary, China. Ocean Eng. 233, 109020. doi: 10.1016/j.oceaneng.2021.109020
Ying M., Zhang W., Yu H., Lu X., Feng J., Fan Y., et al. (2014). An overview of the China meteorological administration tropical cyclone database. J. Atmos Ocean Tech 31 (2), 287–301. doi: 10.1175/JTECH-D-12-00119.1
Yu Y., Chen H., Shih H., Chang C., Hsiao S., Chen W., et al. (2019). Assessing the potential highest storm tide hazard in Taiwan based on 40-year historical typhoon surge hindcasting. Atmosphere 10 (6), 346. doi: 10.3390/atmos10060346
Yuan F., Zhang W., Ye Y., Zhang S. (2022). The storm surge inundation risk warning system for xiamen. Mar. Dev. Manage. 4, 102–106. doi: 10.20016/j.cnki.hykfygl.20220330.017 (In Chinese)
Zhang M., Dai Z., Bouma T. J., Bricker J., Townend I., Wen J., et al. (2021). Tidal-flat reclamation aggravates potential risk from storm impacts. Coast. Eng. 166, 103868. doi: 10.1016/j.coastaleng.2021.103868
Zhang F., Li M. (2019). Impacts of ocean warming, Sea level rise, and coastline management on storm surge in a semienclosed bay. J. Geophys. Res.: Oceans 124 (9), 6498–6514. doi: 10.1029/2019JC015445
Zhang G., Murakami H., Knutson T. R., Mizuta R., Yoshida K. (2020). Tropical cyclone motion in a changing climate. Sci. Adv. 6 (17), z7610. doi: 10.1126/sciadv.aaz7610
Zhang W., Villarini G., Vecchi G. A., Smith J. A. (2018). Urbanization exacerbated the rainfall and flooding caused by hurricane Harvey in Houston. Nature 563 (7731), 384–388. doi: 10.1038/s41586-018-0676-z
Keywords: coastal flood, FVCOM, tropical cyclone climatology, Xiamen Bay, multi-tracks blend
Citation: Guo W, Yao D, Chen Z, Ding P and Ge J (2023) Assessment of future flood risk induced by sea level rise and tropical cyclones under global warming in the Xiamen Bay, Fujian, China. Front. Mar. Sci. 10:1103279. doi: 10.3389/fmars.2023.1103279
Received: 20 November 2022; Accepted: 13 February 2023;
Published: 01 March 2023.
Edited by:
Dehai Song, Ocean University of China, ChinaReviewed by:
Enjin Zhao, China University of Geosciences Wuhan, ChinaWei-Bo Chen, National Science and Technology Center for Disaster Reduction(NCDR), Taiwan
Huayang Cai, Sun Yat-sen University, China
Haidong Pan, Ministry of Natural Resources, China
Copyright © 2023 Guo, Yao, Chen, Ding and Ge. This is an open-access article distributed under the terms of the Creative Commons Attribution License (CC BY). The use, distribution or reproduction in other forums is permitted, provided the original author(s) and the copyright owner(s) are credited and that the original publication in this journal is cited, in accordance with accepted academic practice. No use, distribution or reproduction is permitted which does not comply with these terms.
*Correspondence: Jianzhong Ge, anpnZUBza2xlYy5lY251LmVkdS5jbg==