 Changqun Zhang1
 Haojie Zhou2,3†
 Fredrik Christiansen4
 Yujiang Hao2,5*
 Kexiong Wang2,5Zhangbing Kou2,5Ruipeng Chen6Jie Min7
 Randall Davis1
 Ding Wang2,5
- 1Department of Marine Biology, Texas A&M University at Galveston, Galveston, TX, United States
- 2Institute of Hydrobiology, Chinese Academy of Sciences, Wuhan, Hubei, China
- 3University of Chinese Academy of Sciences, Beijing, China
- 4Marine Mammal Research, Department of Ecoscience, Aarhus University, Roskilde, Denmark
- 5National Aquatic Biological Resource Center (NABRC), Wuhan, Hubei, China
- 6College of Life Science and Technology, Huazhong Agricultural University, Wuhan, Hubei, China
- 7School of Biodiversity, One Health & Veterinary Medicine, University of Glasgow, Glasgow, United Kingdom
Techniques of 3D modeling have earned increasing popularity in scientific studies as they offered unprecedented traits in representing objects. As with all mathematical models, the 3D model will be useful once its accuracy has been validated with direct measurements and the robustness of its predictive capability tested. Although measures of body mass and volume are essential to comprehend the life history of animals, such morphometrics, especially total volume, are challenging to obtain from marine mammals due to their elusive nature, aquatic lifestyle, and large size. In this study, accurate measurements of body volume were directly detected from fresh carcasses of eleven finless porpoises (Neophocaena asiaeorientalis sunameri) and used to validate 3D models recreated from the same animals using Blender 3D graphics. Published models using truncated cones or elliptical shapes, based on 3, 5, 8, or 19 measurements of girths or heights & widths along the body, were also applied to porpoises to verify their accuracy. The Blender-generated 3D model produced the most accurate estimates of body volume compared to conventional truncated models, with a mean error of only 2.5% to the direct volume measurements. When photogrammetric images are available, the model can predict the body volumes based on total length alone. Similar accuracy was possible with the elliptical model using 19 height & width measurements (5% increments in total length). However, significant (p < 0.001) inaccuracy resulted from truncated models with 3, 5, or 8 girth measurements and elliptical models with 3 or 5 height & width measurements, and the accuracy of these models also decreased significantly as the number of measurement sites was reduced. Moreover, Blender 3D models can be extrapolated to animals with images absent, and such predicted volumes were tested to be trustworthy (overall skill = 0.998, r = 0.998, p < 0.01). Therefore, we recommend that researchers use either digital 3D models or elliptical models with 5% increments sectioning the torso to obtain accurate estimates of the body volumes of free-ranging marine mammals.
Introduction
Body morphometry provides essential information in the study of animal behavior, physiology, ecology, evolution, and biomechanics (Le Boeuf and Laws, 1994; Woodward et al., 2006; Brose, 2010; Rabosky et al., 2013; Davis, 2019). Measurements of body volume and mass are critical to evaluate marine mammal health condition, energetic capacity, metabolic expenditure, thermoregulatory demands, diving response, onboard oxygen storage, and cost of swimming (Kleiber, 1961; Schmidt-Nielsen, 1972; Williams, 1999; Gillooly et al., 2001; Porter and Kearney, 2009). Total body mass and volume are highly correlated, and the conversion ratio between these two variables (mass per unit volume) is the average tissue density (Moya-Laraño et al., 2008). Although direct measurements are considered “gold standards” (Farriol et al., 1997; Hughes, 2005), such measures of total body mass and volume can be challenging to obtain, especially from fully aquatic mammals (Barratclough et al., 2014; Christiansen et al., 2019). Direct sampling methods are typically disruptive or even lethal, confining studies on many species of marine mammals that are rated threatened or endangered (Baker and Clapham, 2004; Nelms et al., 2021). The few existing measurements of cetacean body volume and mass come primarily from stranded individuals, fisheries by-catch, whaling, and captive animals (Norris, 1961; Adamczak et al., 2019). Lethal sampling, however, does not allow longitudinal studies of individuals (repeated sampling of the same individual over time), and is not viable for vulnerable populations (e.g., Vaquita, Phocoena sinus, and Yangtze finless porpoise, Neophocaena asiaeorientalis asiaeorientalis). Therefore, non-invasive, accurate, and practical approaches to estimating marine mammal morphometrics are desirable.
The truncated cone model has been widely used to estimate the body volume of marine mammals, which can be converted to mass with the calculated or assumed body density of the animals (Bell et al., 1997; Luque and Aurioles-Gamboa, 2001; Christiansen et al., 2018; 2020). This approach is useful when body girth and length measurements can be obtained, but the size of the species is too large to allow direct measurements of volume or mass (Castellini and Kooyman, 1990; Haley et al., 1991; Bell et al., 1997). Simple tools (e.g., tape measure only) and straightforward procedure make this method convenient, thus enhancing its popularity in fieldwork for researchers and stranding networks. This approach considers the body of the animal as a series of cones and/or cylinders, and the total volume is estimated as the sum of these geometric shapes (Ryg et al., 1988; Bell et al., 1997). However, viewing the body shape of marine mammals as rigid conical frustums oversimplifies the curvilinear profile of these highly streamlined swimmers (Adamczak et al., 2019; Irschick et al., 2022). Truncated cone models also do not account for the elliptical cross-sectional body shape of cetaceans and its fundamental assumptions of treating cross sections as circles tends to exaggerate the body size and shape (Lockyer et al., 1985; Adamczak et al., 2019; Christiansen et al., 2019). In response to this, an elliptical model was proposed by Christiansen et al. (2019) to mimic the curving contour of cetaceans to estimate the body volume, and such an elliptical model was also duplicated on our animal for performance review.
Computer-generated 3D models are capable of reconstructing objects with unparalleled precision and 3D models based on distinct techniques have been explored on marine mammals for their parts or whole body. Computed tomography (CT) and magnetic resonance imaging (MRI) have been used to create 3D geometry of cetacean anatomy including flukes (Fish et al., 2007; Fontanella et al., 2011), baleen (Jensen et al., 2017), craniums (Yuen et al., 2017; Kot et al., 2018), soft tissues (Marino et al., 2001; Alonso-Farré et al., 2014), and skeleton (Kot et al., 2020). However, hosting intact bodies of marine mammals into scanners, often existing in hospitals, is challenging. Surface scanning uses the reflection of structured light (e.g., laser) to construct 3D models and this technique has been explored with several species of stranded pinnipeds (Ciobanu et al., 2013; Beltran et al., 2018; Eder et al., 2022). Attempt applications of such technique to animals at sea is complex due to stronger noise signal from water surface than reflection patterns from target animals (Czepkowshi and Słówko, 1996; Heritage and Hetherington, 2007; Suchocki and Katzer, 2018). In contrast, photogrammetry-based 3D modeling extracts the metrics (e.g., digital elevation and frame) from images to scale the 3D geometry constructed from same images into realistic sizes (Hodgson et al., 2020). A multi-camera set or rotational photographic technique is commonly seen for image synchronization and improvement of modeling accuracy (Waite et al., 2007; de Bruyn et al., 2009; Cashman and Fitzgibbon, 2012; Falkingham, 2012; Beltran et al., 2018; Erolin, 2019; Del Pizzo et al., 2021). Initial studies on beached pinnipeds claimed the precision of image-based models, though little validation was done with directly measured body volumes (Waite et al., 2007; Beltran et al., 2018; Del Pizzo et al., 2021).
Digital 3D models recreated from images utilizing Blender 3D graphics are capable of accurately representing the morphological shape of animals, which can be scaled to realistic size with input morphometrics (Adamczak et al., 2019; Bot et al., 2019). Morphometric measurements obtained from aerial or underwater photogrammetry are particularly useful for estimating the body volume and mass of free-ranging cetaceans (Christiansen et al., 2018; Christiansen et al., 2019; Lewis et al., 2021; Christiansen et al., 2022). Although an initial study has explored Blender 3D and its possible improvement over truncated cone models (Adamczak et al., 2019), the accuracy of this novel modeling approach has not been validated with direct measurements. The aims of this study were twofold: 1, to validate the accuracy of the Blender 3D model and to verify the direction of significance against conventional models (improvement or deterioration); 2, to compare the modern modeling techniques against conventional approaches and to review the performance of previously published models. The small body size of the East Asian finless porpoise (hereafter EAFP), Neophocaena asiaeorientalis sunameri, provided an opportunity to accurately measure the body volume and mass of the animals directly, thus allowing the evaluation of the accuracy of digital 3D models and a comparative review over previously reported truncated cone and elliptical models.
Materials and methods
Animals
Carcasses of eleven EAFPs (six females and five males) were collected following death by accidental bycatch in legal fishing operations in the open water between southeast of the Bohai Sea and northwest of the Yellow Sea (on the side of China). We believe EAFPs landed met core protocols of simple random sampling and these individuals might serve as a small representative group of this endangered population (Andrew and Mapstone, 1987). After retrieval from the fishing net, carcasses were immediately stored in the onboard freezer and later transported by refrigerated truck to the Institute of Hydrobiology, Chinese Academy of Science (IHB, CAS) where they were preserved for later morphometric measurements, photogrammetry, and dissection. Carcasses were neither disfigured nor bloated upon visual inspection and later necropsy confirmed the freshness of these carcasses. Measurements and photographs for each EAFP were completed in one day once a carcass was slightly thawed (Table 1). Each above step was handled by professional or trained personnel and IHB, CAS possesses the authority to collect and process carcasses of finless porpoises for research purposes in the above area.
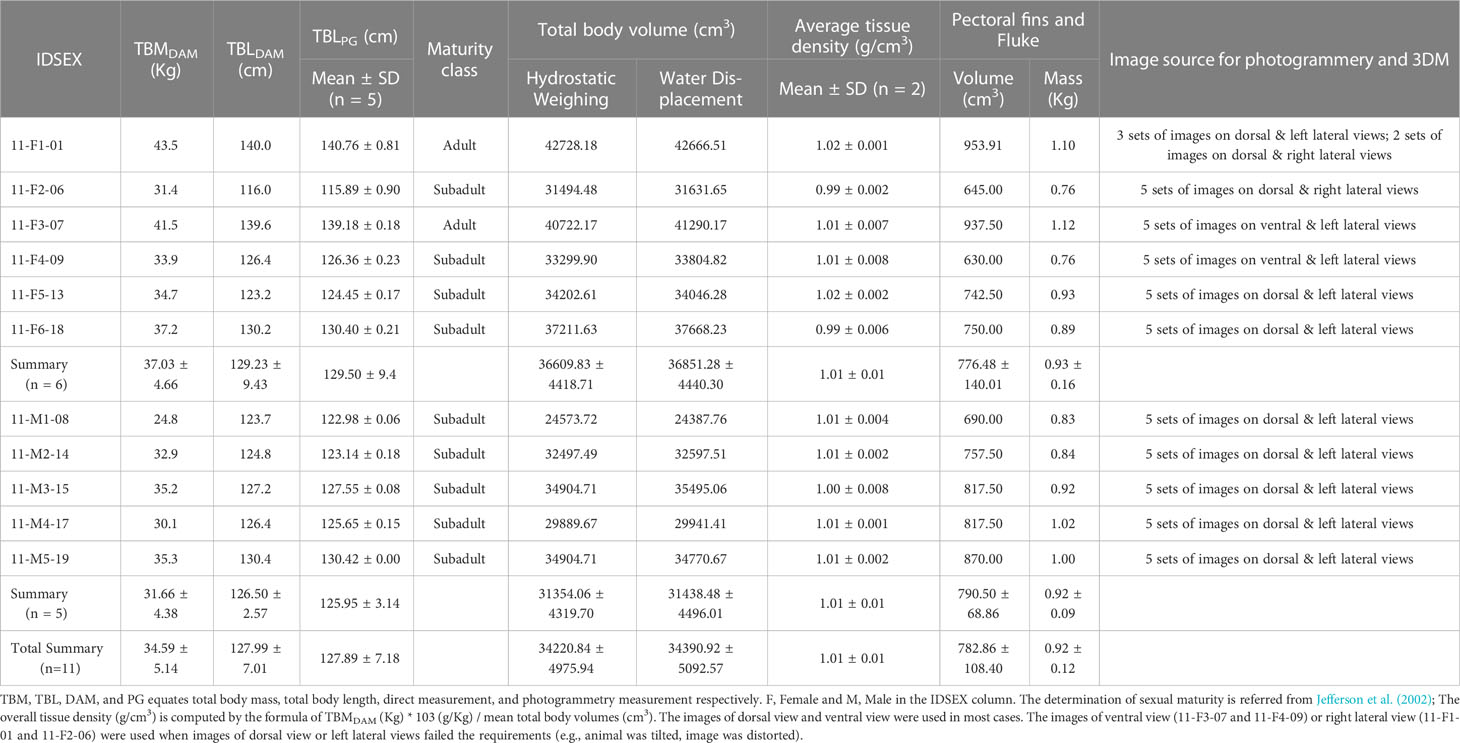
Table 1 Morphometric data of the eleven EAFPs.
Direct anatomical measurements (DAM)
Total body length (TBL) was measured as the Euclidean distance from tip of the rostrum to the fluke notch. Other Euclidean distances were recorded from tip of the rostrum to the sites of 1) blowhole, 2) anterior axillary, 3) 25% TBL, 4) maximum girth, 5) 50% TBL, 6) anal slit, 7) 75% TBL, and 8) caudal insertion and these distances were labeled as L1 - L8 respectively. Corresponding girth measurements at each above site were also obtained and marked as G1 - G8 respectively (Figure 1). Lengths and girths were measured with a tape measure and each reading was confirmed by two observers. After morphometric measurements and photographs of the complete body, the pectoral fins and fluke were removed to determine their mass and volume measures (water displacement method) in the laboratory (Hughes, 2005).
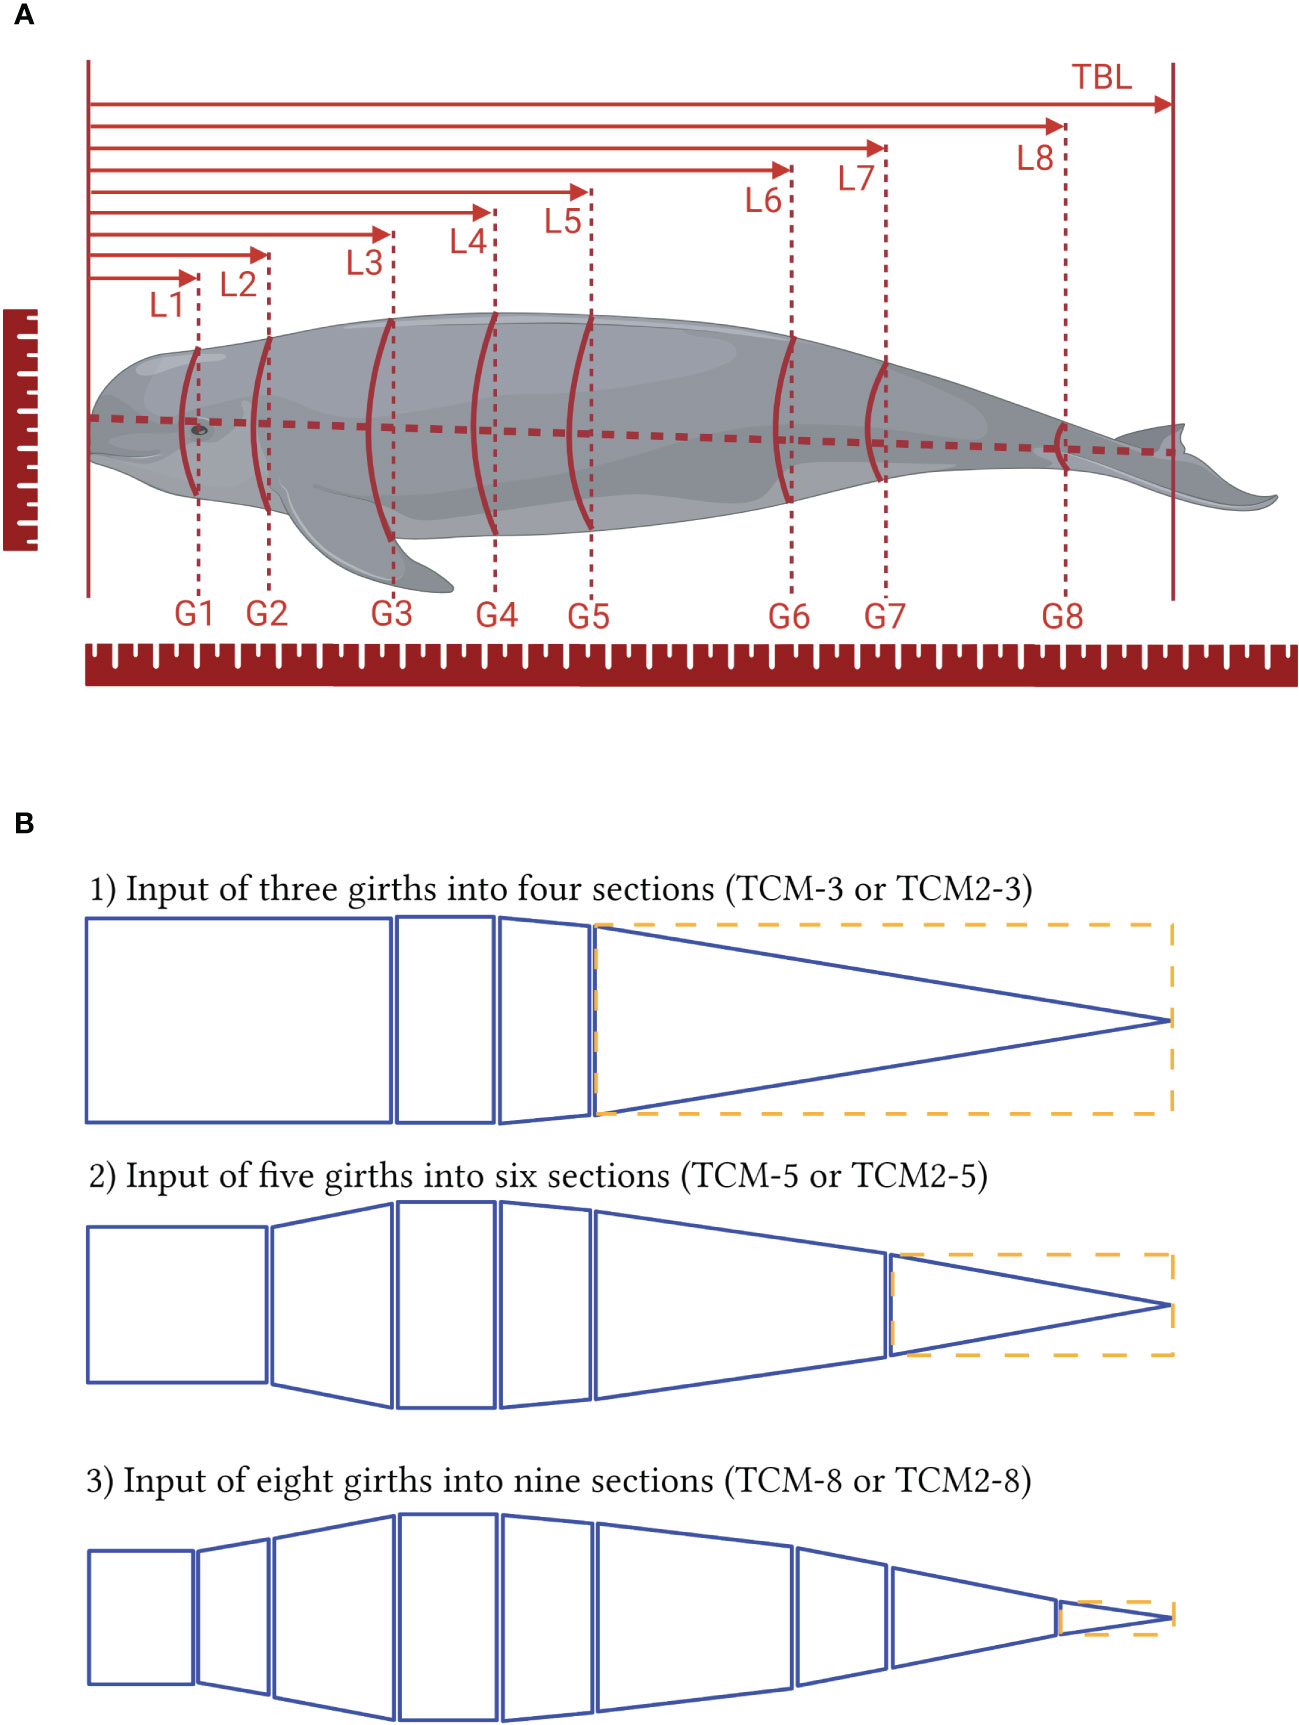
Figure 1 (A) Measurements of total body length (TBL), sectional lengths (from L1 to L8), and girths (from G1 to G8). The suffix numbers connote the sites where the measurements were taken. (B) illustration of the truncated cone models (TCM and TCM2). TCM showing as solid lines treat the first section as a cylinder, the last section as a cone, and all middle sections as truncated cones. TCM2 is similar to TCM except for last section that is treated as a cylinder outstanding in dashed lines.
Direct measurements of total body volume were conducted through both hydrostatic weighing and water displacement (Hughes, 2005; Hohl et al., 2007). Readings needed for both methods to calculate total body volume were available simultaneously using a custom-made apparatus bundle consisting of a giant cylinder (inner diameter = 78.4 cm, height = 250 cm), a small and graduated cylinder (inner diameter = 1.5 cm, height = 200 cm), a standing crane equipped with a fixed pulley, a hanging digital scale (300 Kg capacity and readability of 0.1 Kg; OCS-300kg, Baiying, Shanghai), and an electric lifting motor with cables. The giant and small cylinders were interconnected through a rubber joint and both cylinders were equipped with graduated marks (maximum length = 200 cm, accuracy = 0.1cm) along the wall to detect the water level.
For the water displacement method, changes in water level as the porpoise was fully immersed were read from both scales. Paired readings on water increment were cross-checked and averaged for total body volume calculation with the knowledge of the geometrics of cylinders (Hughes, 2005). For the hydrostatic weighing method, the carcass was first weighed in air, defined as total body mass (TBM), and then weighed when fully immersed in water. The mass difference implies the mass of the water displaced by EAFP (Hohl et al., 2007). We used tap water as the medium liquid and assumed its density to be 1.0 g/cm3 (~ 25°C).
Truncated cone model (TCM)
By its definition, the n (n ≥ 1) girth measurements partition the torso into n + 1 sections, with each section modelled as a perfect geometric shape that is either a cylinder, a cone, or a truncated cone (Ryg et al., 1988; Bell et al., 1997; Christiansen et al., 2018). Radii of the top and bottom circles correspond to girth measurements, and the distance between two circles is the sectional length. The volume of each conical frustum is calculated and added to give total body volumes (TBV). Few studies have included the fins and fluke of marine mammals when using TCM and we followed this protocol (Bell et al., 1997; Christiansen et al., 2018; Adamczak et al., 2019). TBV hereafter designates total body volume without volumes of pectoral fins and fluke for other models and measurements.
To evaluate the influence of the numbers of girth inputs to TCMs, three distinct levels of inputs of three girths (G3, G4, and G5), five girths (G2, G3, G4, G5, and G7), and eight girths (G1 to G8) were fed into TCMs to output corresponding TBVs which were grouped into TCM-3, TCM-5, and TCM-8 respectively (Figure 1). These three models were compared among each other for significance detection, and their performance was then validated against direct measurements. These TCMs treated the first and last sections as a cylinder and a cone respectively, and the rest middle sections as truncated cones (Figure 1), which is consistent with our previous work as we believed it fits the external morphology of finless porpoises. For better comparison with large whales, a modified model was constructed based on Adamczak et al. (2019) and labeled TCM2 in this study. Besides the head section, TCM2 also treats the last section as a cylinder that looks relatively stouter than the one on small cetaceans (e.g., finless porpoises). The same three levels of girths (three, five, and eight measurements) were input into this replicate model and labels of TCM2-3, TCM2-5, and TCM2-8 corresponded groups of estimated TBVs (Figure 1). Comparisons within TCM2 models and with three TCMs were performed and then validated with direct measurements.
Photogrammetry (PG) and elliptical model (EM)
A NIKON D800 camera with a 30 - 70 mm lens was used to obtain high-resolution digital photographs for photogrammetry and 3D modeling. Shutter speed and aperture were set to allow proper exposure of images and auto-focus function was used throughout the study. Each porpoise carcass was laid flat on a horizontal wooden plank equipped with a 10 cm by 10 cm grid backdrop (Figure 2) and bubble levels were used to assure the horizontal levels of relevant planes (e.g., plank, animal, and lens of the camera). Postures of each animal were adjusted manually for varied perspectives of photographing views. A 100 cm ruler was placed alongside the porpoise for calibration and calculation alongside background grides (Figure 2). The frame in the camera view, appearing when auto-focusing, was utilized to match the grid lines to confirm the orthogonal view and to reduce the angle of deviation (< 1 degree on both x and y plane) when combing with levels adjustment (Jaquet, 2006). Pixel dimensions were detected with Adobe Photoshop (RRID: SCR_014199, CS6 13.0) and then converted to actual dimensions with known variables of focal length and altitude of the lens to plank (Jaquet, 2006; Christiansen et al., 2018). Five sets of images were obtained for each EAFP, with each set composed of one dorsal view and one left lateral view (in most cases, see Table 1 for details and exceptions).
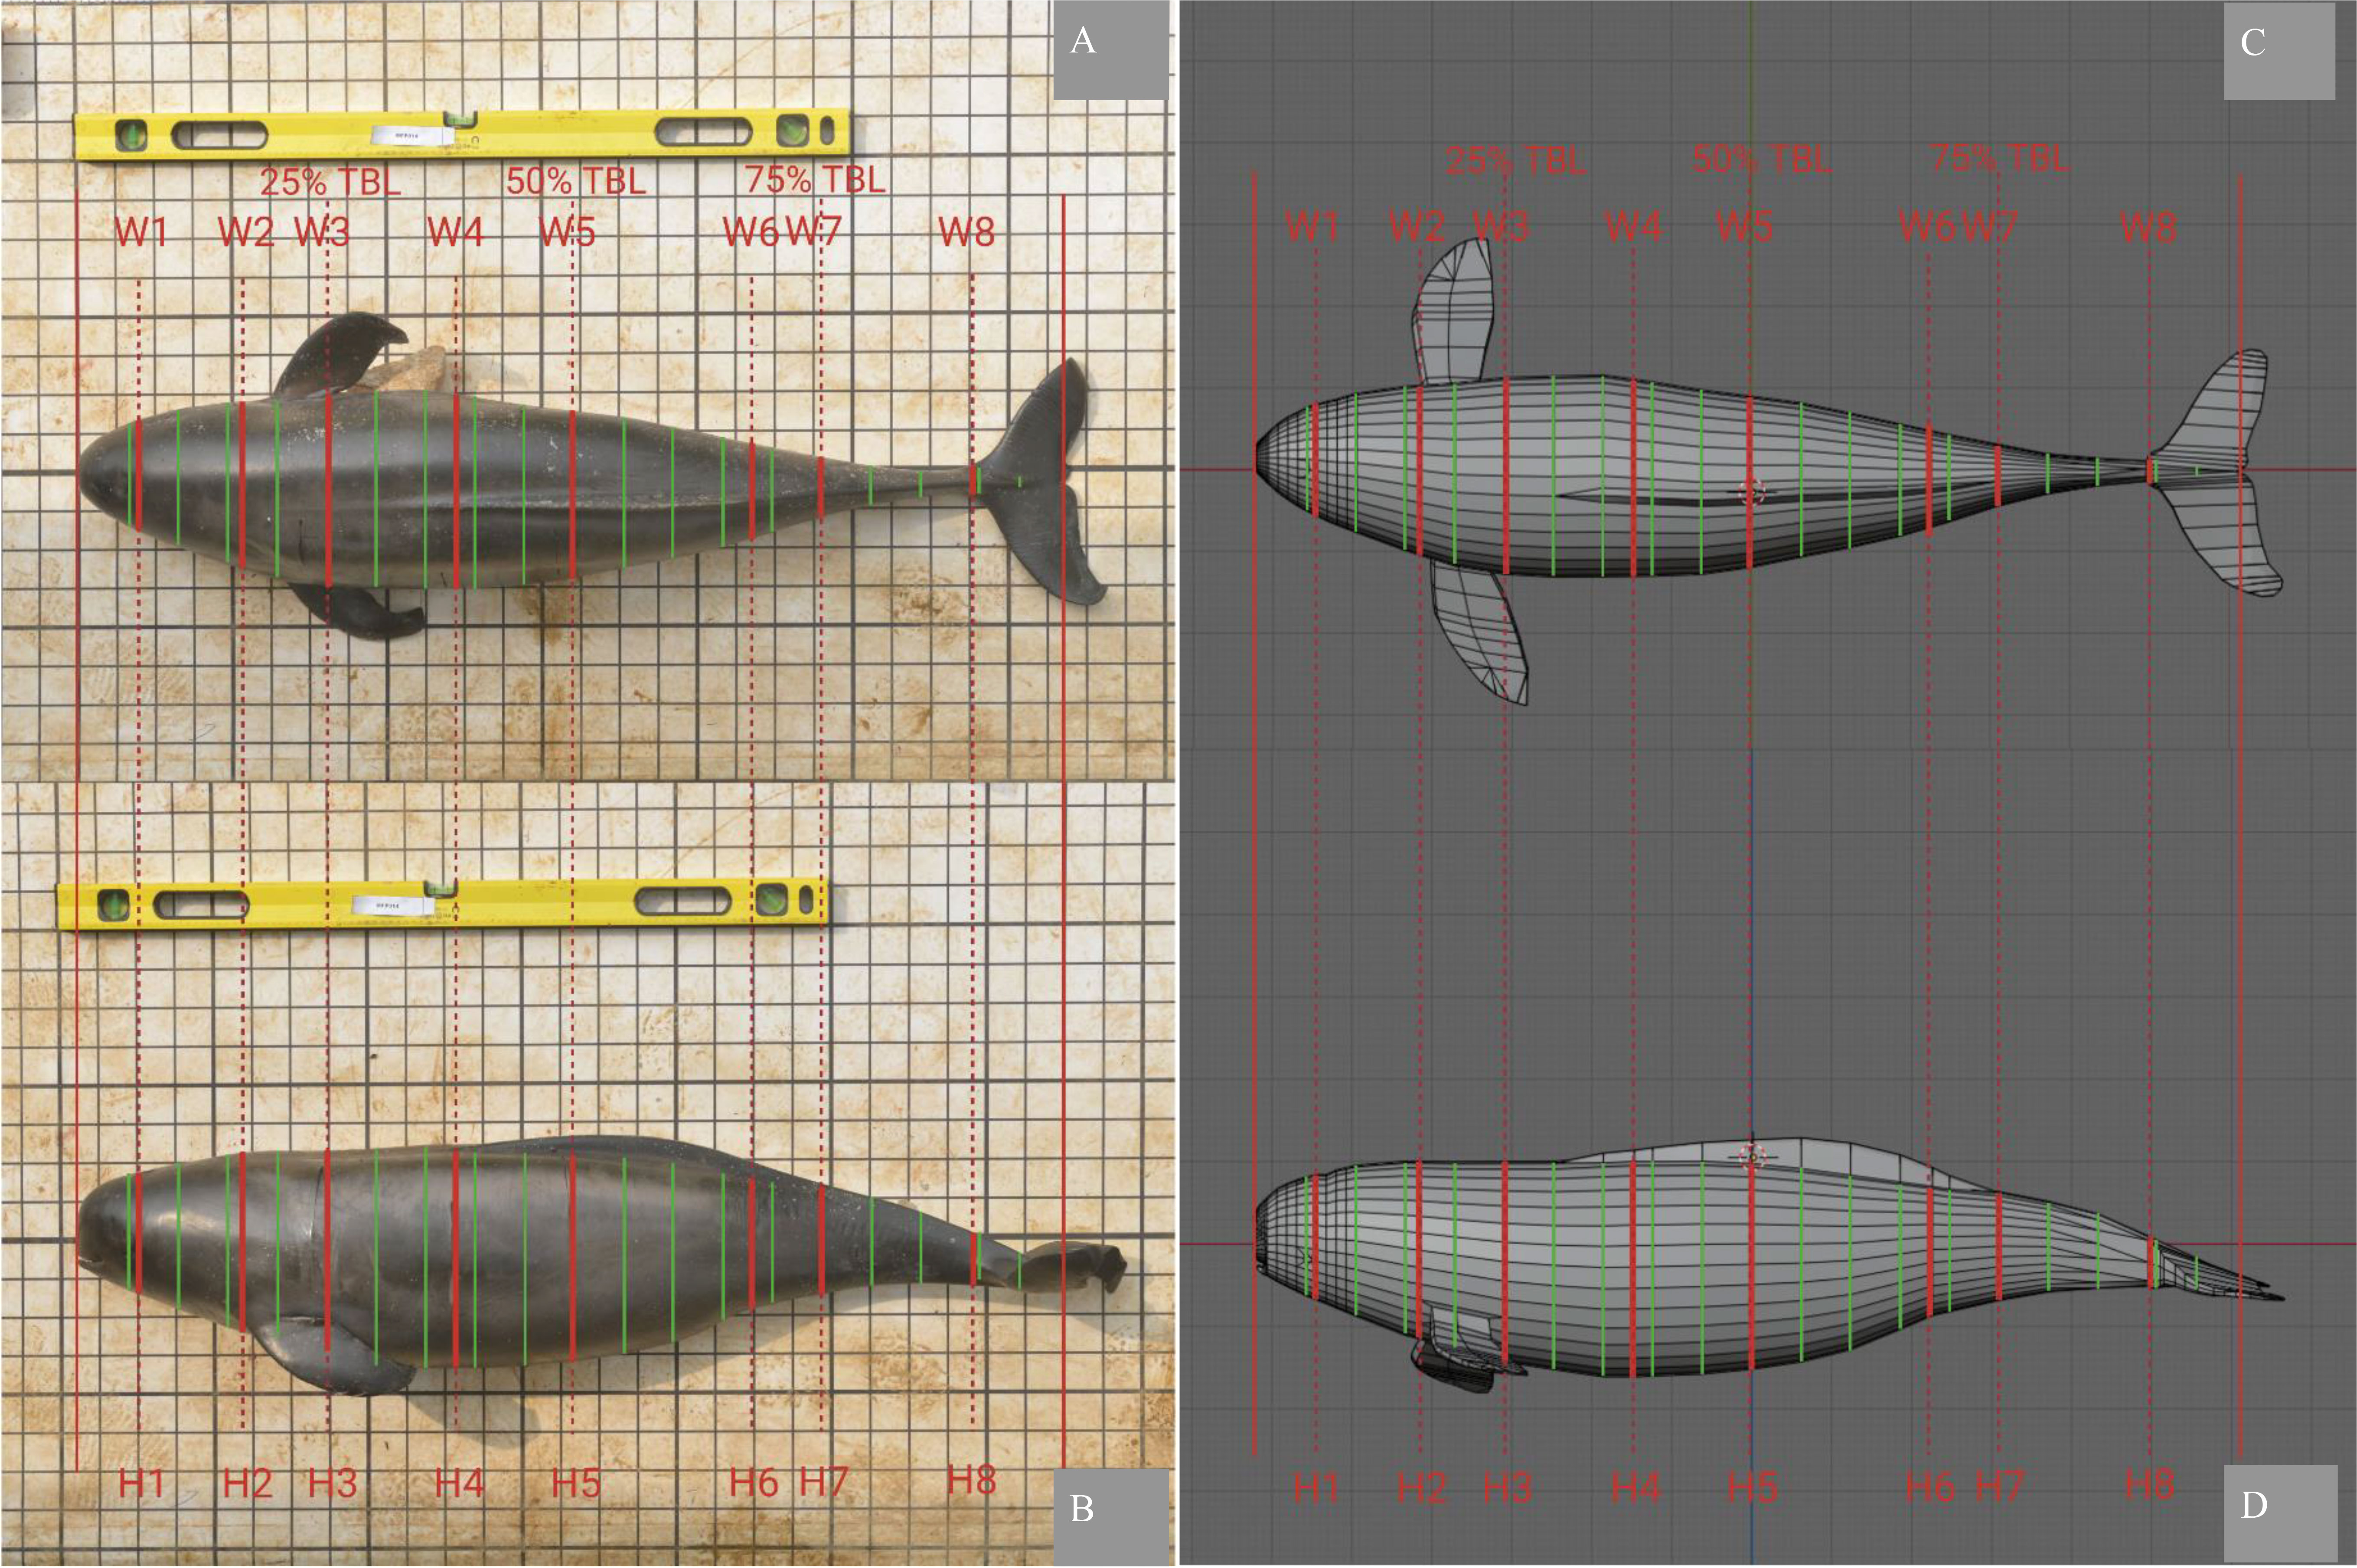
Figure 2 The photogrammetry and 3D models. (A) Dorsal view of an EAFP, showing the width (W) measurements at eight sites (W1 to W8, thick red line) and at the sites of 5% TBL increment (thin green line). (B) Left lateral view of the same EAFP, showing the corresponding height H measurement at eight sites (H1 to H8, thick red line) and at the sites of 5% TBL increment (thin green line). Note that sites of H3 (or W3), H5 (or W5), and H7 (or W7) equate sites of 25% TBL, 50% TBL, and 75% TBL respectively. (C, D) the 3D model of the same EAFP, showing the dorsal (C) and left lateral (D) views respectively. The pectoral fins and fluke were excluded when estimating the TBV.
Photogrammetric morphometrics of body length, height (H, dorso-ventral distance), and width (W, lateral distance) were extracted from the above five sets of images (Figure 2). Same definitions in DAM were applied when extracting digital TBL and photo-metrics of H & W pairs that were marked consecutively from H1 to H8 and W1 to W8 respectively (Figure 2). The five sets of photo-morphometrics of each porpoise were averaged and served as the inputs to elliptical models (EM), which treat the sections as elliptical frustums. The terms EM-3, EM-5, and EM-8 labeled the EM models with three (H3 & W3, H4 & W4, H5 & W5), five (H2 & W2, H3 & W3, H4 & W4, H5 & W5, H7 & W7), and eight (H1 to H8 & W1 to W8 respectively) pairs of H & W inputs that equate to the sites used in two truncated models. The three above EM models were compared for the influence of the number of sections on the accuracy of TBV estimation and the performances of each EM were then validated with DAM. The height/width (HW) ratio inferring the eccentricity of the ellipse was calculated for the above eight sites.
An elliptical model with sections of the TBL at 5% increments was constructed as described in Christiansen et al. (2019) and named EM-19 as it contains 19 pairs of H & W inputs. Besides existing H & W pairs at 25%, 50%, and 75% TBL as above, metrics of paired H & W at the rest 16 sites starting from 5% TBL to 95% TBL were obtained (Figure 2). The performances of EM-19 were compared with all previous models and then validated against the directly measured TBVs.
Blender 3D model (3DM)
The open-source software Blender (RRID: SCR_008606, v 2.80) was used to construct 3D models of EAFPs. The meshes of each 3DM were recreated from the same five sets of images used to determine photogrammetric morphometrics. The 3D modeling procedures have been well described in literatures (e.g., Bot et al., 2019; Christiansen et al., 2019) and detailed tutorials are also available online (e.g., https://sketchfab.com/). The procedures were slightly modified to suit our study and we found a reference frame containing the photogrammetric lengths, heights, and widths for scaling models was convenient and helpful, especially when scaling predictive models as described in the next section (Figure 3). The 5% TBL increment of mesh density was applied universally across the model (Christiansen et al., 2019) and an increment of 1% TBL was used to accurately mimic the head section that is defined as the first 10% TBL. Additional loop cuts on the site of H1 (or W1), H2 (or W2), H4 (or W4), H6 (or W6), and H8 (or W8) were made to manipulate the 3DM meshes when needed as they contained photogrammetric morphometrics. The modifier of Subdivision Surface (Simple, Viewport = 3) was applied to each 3DM, enabling denser meshes for rendering to generate TBVs.
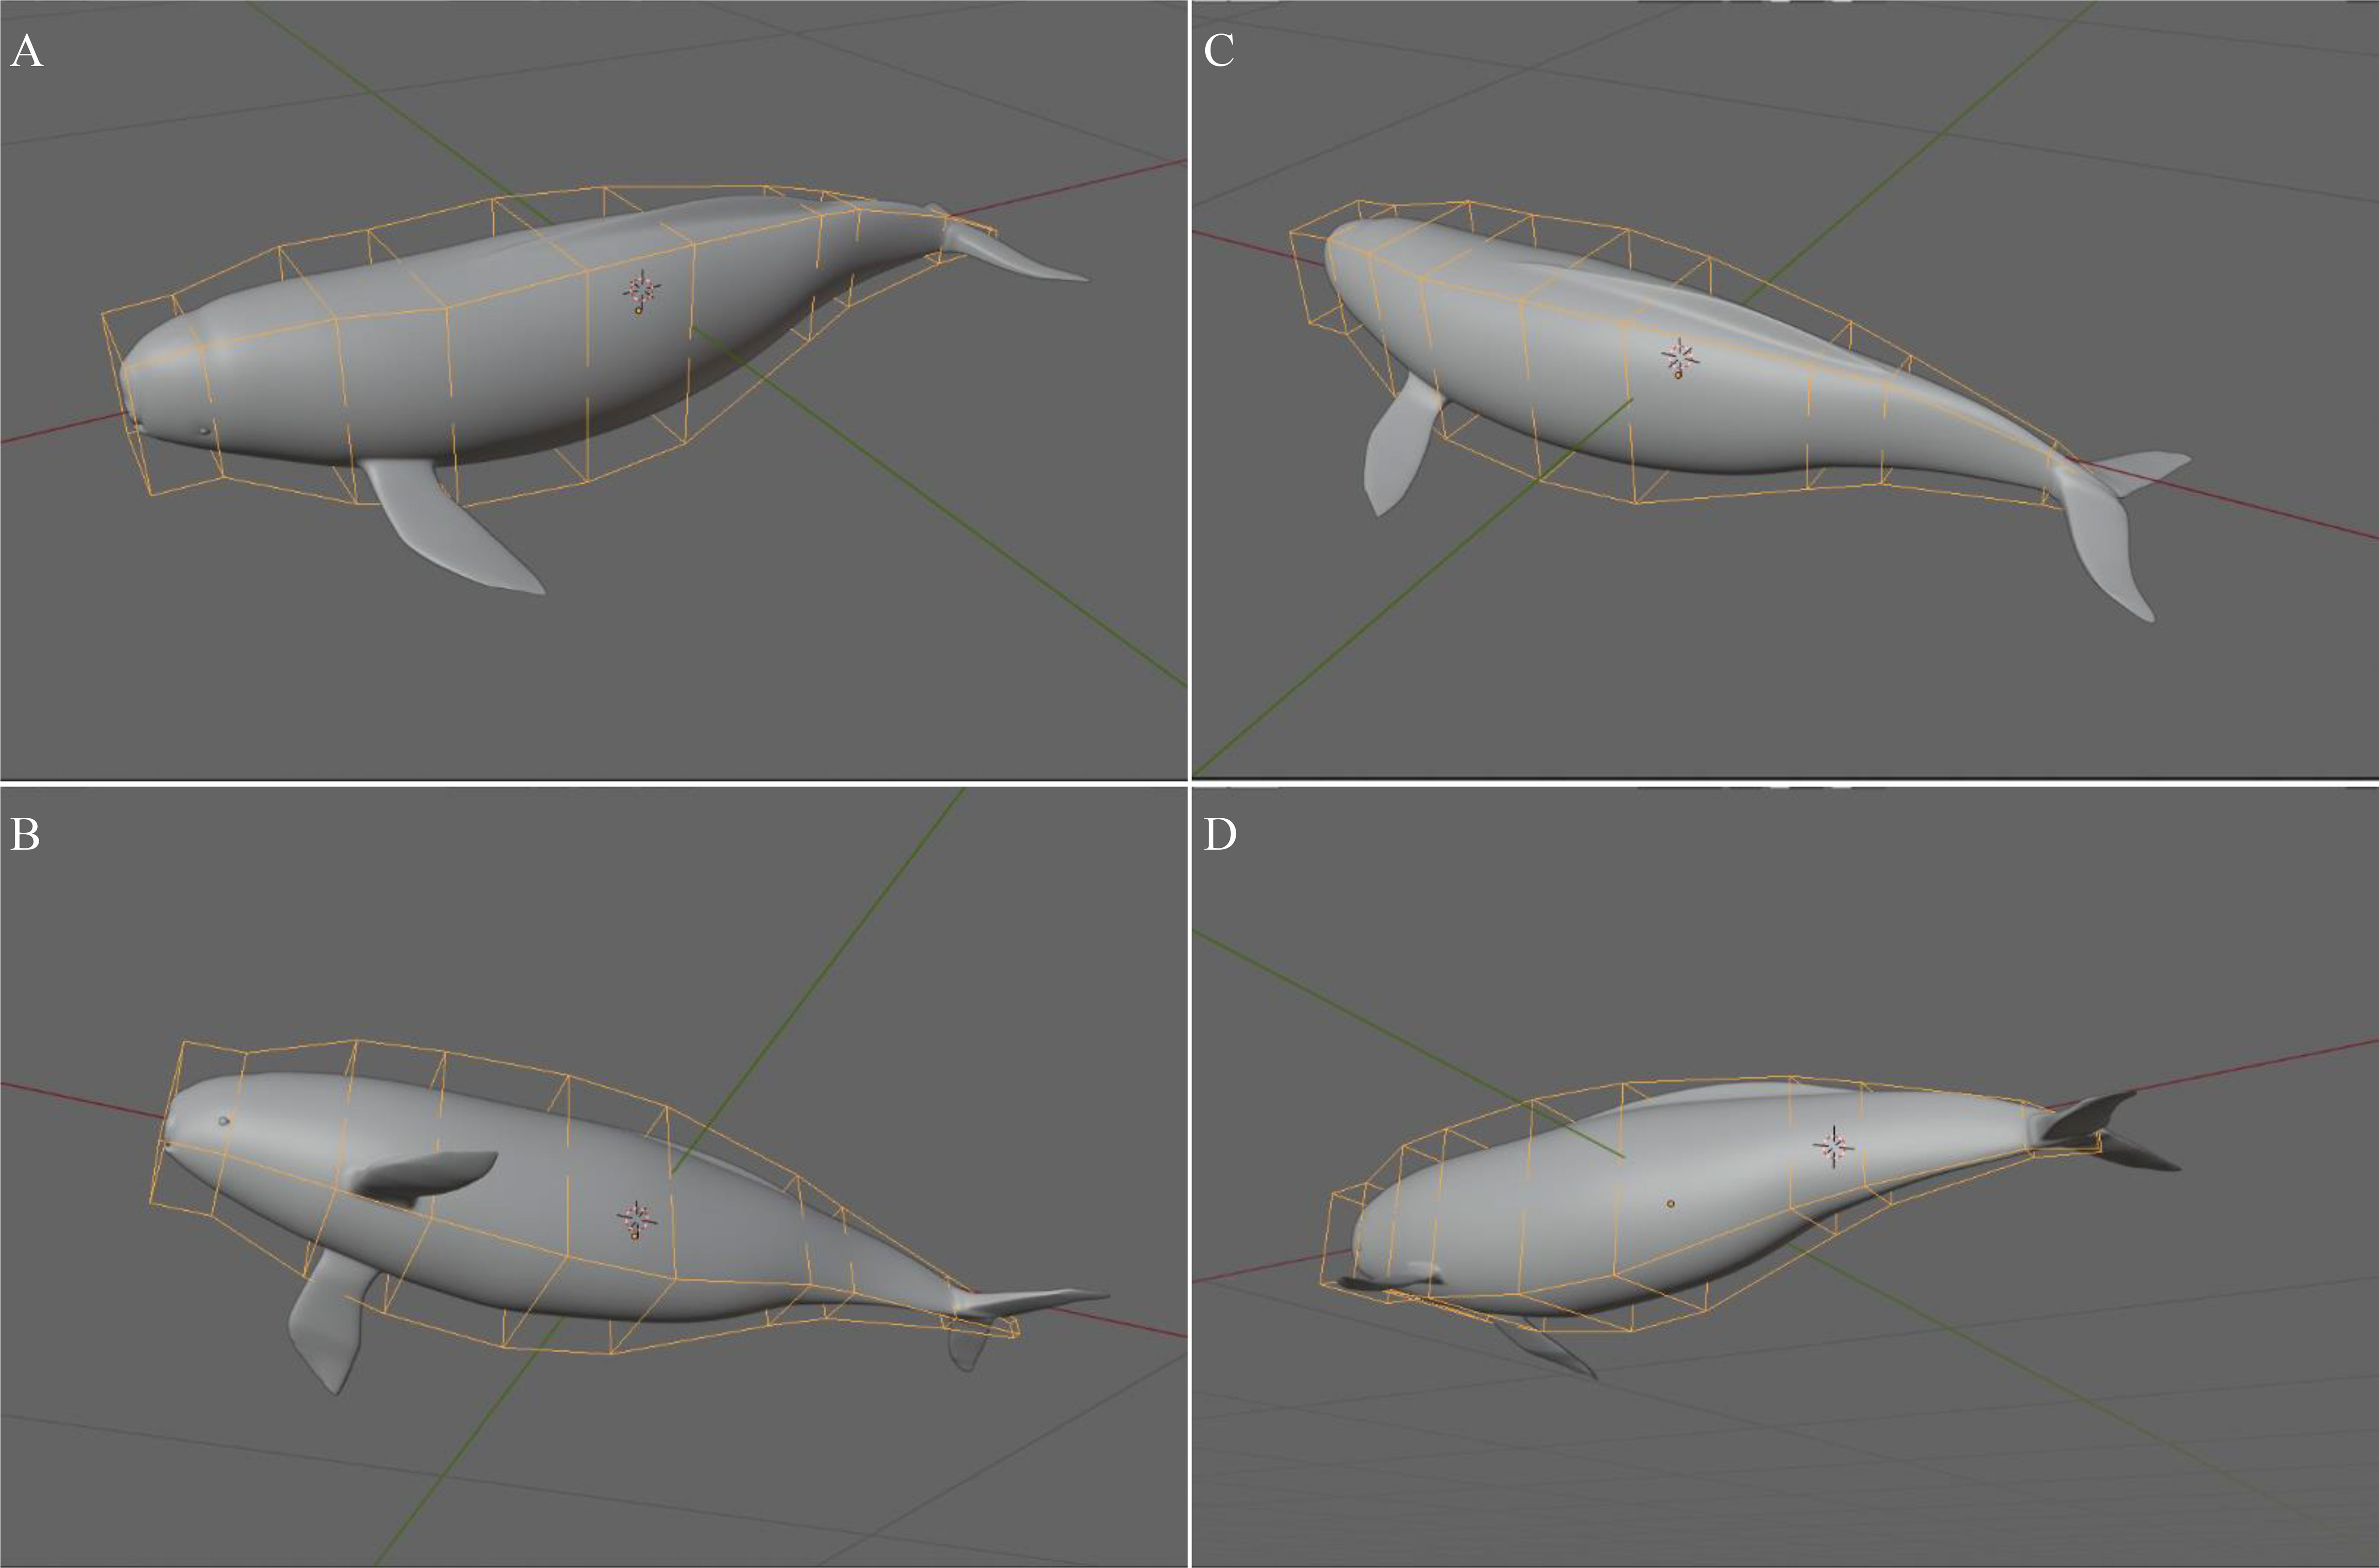
Figure 3 The example of predictivity test. The individual-specific 3DM of 11-M2-14 served as the testing model and scaled with the foreign input of H & W pairs of 11-F1-01. The amber frame was the reference frame containing morphometrics of eight heights (H1 to H8) and widths (W1 to W8). (A-D) are four different perspective views of head top, head bottom, fluke top, and fluke bottom.
When constructed from the same set of images used for morphometrics extraction, the 3DMs were scaled with one parameter of TBL only as proportional ratios (length & width and length & height) are innately preserved in each two-dimensional image. The additional loop cuts were used to manipulate the predictive models (Figure 3). Although Blender 3D can model the pectoral fins and flukes accurately, their volumes were excluded when generating TBV in accordance with previous models (Figure 2). As each set of images recreated one 3DM, five 3DMs were constructed for each EAFP and a total of 55 3DMs were created for the eleven EAFPs. The averaged morphometrics from the same five sets of images were used as input for scaling the above five corresponding models of each individual EAFP. The five estimated TBVs for each EAFP were recorded and averaged for later comparisons with other models generated and directly measured TBVs.
Testing the predictive power of the 3DM
With individual-specific 3DMs created above, we sought to test the predictive power of each individual model in estimating the TBV of the other individuals. The predictivity validation of a model defines the robustness of its application, and the test results will suggest the accuracy of 3DM of a delegate individual on extrapolating to others when their images cannot be obtained (Fernandez et al., 2005). Once successfully tested, the rich and archived morphometric data (e.g., from stranding networks) might serve as inputs for 3DMs of the same species for estimating TBVs that were missing then (e.g., Adamczak et al., 2019).
The 3DM meshes that produced the median TBV estimates among the five models of each EAFP were chosen as the delegate 3DM for that peculiar EAFP, and a total of eleven delegate 3DMs were tested for fitness when acting as predicting 3D models (P3D). The averaged morphometrics of the rest ten EAFPs were used as inputs to scale each P3D (Figure 3). Therefore, ten simulated TBVs were estimated and a total of 110 simulations were conducted corresponding to 110 simulated TBVs. Eight paired H & W metrics of target EAFP were used to manipulate the P3D for yielding the simulated TBVs. Each of ten simulated TBVs from one P3D was compared with the original ten TBVs serving as a universal baseline and their regression coefficients were determined.
Data analyses
We used standardized major axis estimation (SMA, or Model II regression) to detect the bias on two pairwise datasets that are directly measured TBL (TBLDAM) and photogrammetric TBL (TBLPG) and two total body volumes that were measured by hydrostatic weighing and water displacement. In contrast to regression models that evaluate the wellness of predicting Y from X, the SMA assumes neither measurement to be “true” values that are free of possible errors and focuses on summarizing the relationship between the two variables that are treated equally (Warton et al., 2012). The bias detection was aimed to test the fidelity of these two pairwise measures. TBL was used as a proxy parameter to evaluate the bias between measured morphometrics and photogrammetric morphometrics. Total body volumes for SMA bias detection were completed values including volumes of fins and fluke which were later subtracted for validation.
The performances of the 3DM, four EMs, and six TCMs were individually validated with direct measurements through paired samples t-test (two-tailed). The comparisons between each pair among the 12 models were also conducted using paired samples t-test (two-tailed). The mean absolute percentage errors (MAPE) were calculated between each two models and between the TBVDAM and the models generated TBVs to evaluate the degree of deviation. To assess the influence of the number of sections (partitioned by girths, or H & W pairs) on the accuracy of TBV estimates, the comparisons among four elliptical models of EM-3, EM-5, EM-8, and EM-19 were conducted using ANOVA and post hoc Tukey tests. Similar statistical analyses were also applied to group comparisons among TCM2-3, TCM2-5, and TCM2-8, and among TCM-3, TCM-5, and TCM-8 using ANOVA and post hoc Tukey tests. Linear Mixed-Effects Models were used in the ANOVA tests and the IDSEX indicating each EAFP (Table 1) was treated as the random effect (TBV values as the fixed factor). The p-values were adjusted under the “Westfall” and the multi-comparison graphs were made to illustrate significant differences among models.
The fitness of the eleven delegate P3Ds against the baseline model was tested with the Pearson correlation coefficient and the r-value, p-value, and skill value (index of agreement) were reported as the quantitative evaluation of each delegate P3D (Figure 4). The significance level and the confidence interval for all tests was set at 0.01 and 95% respectively. The statistical analyses were conducted exclusively in the open-source software of RStudio (RRID: SCR_000432, R version 4.2.1) (R Core Team, 2020).
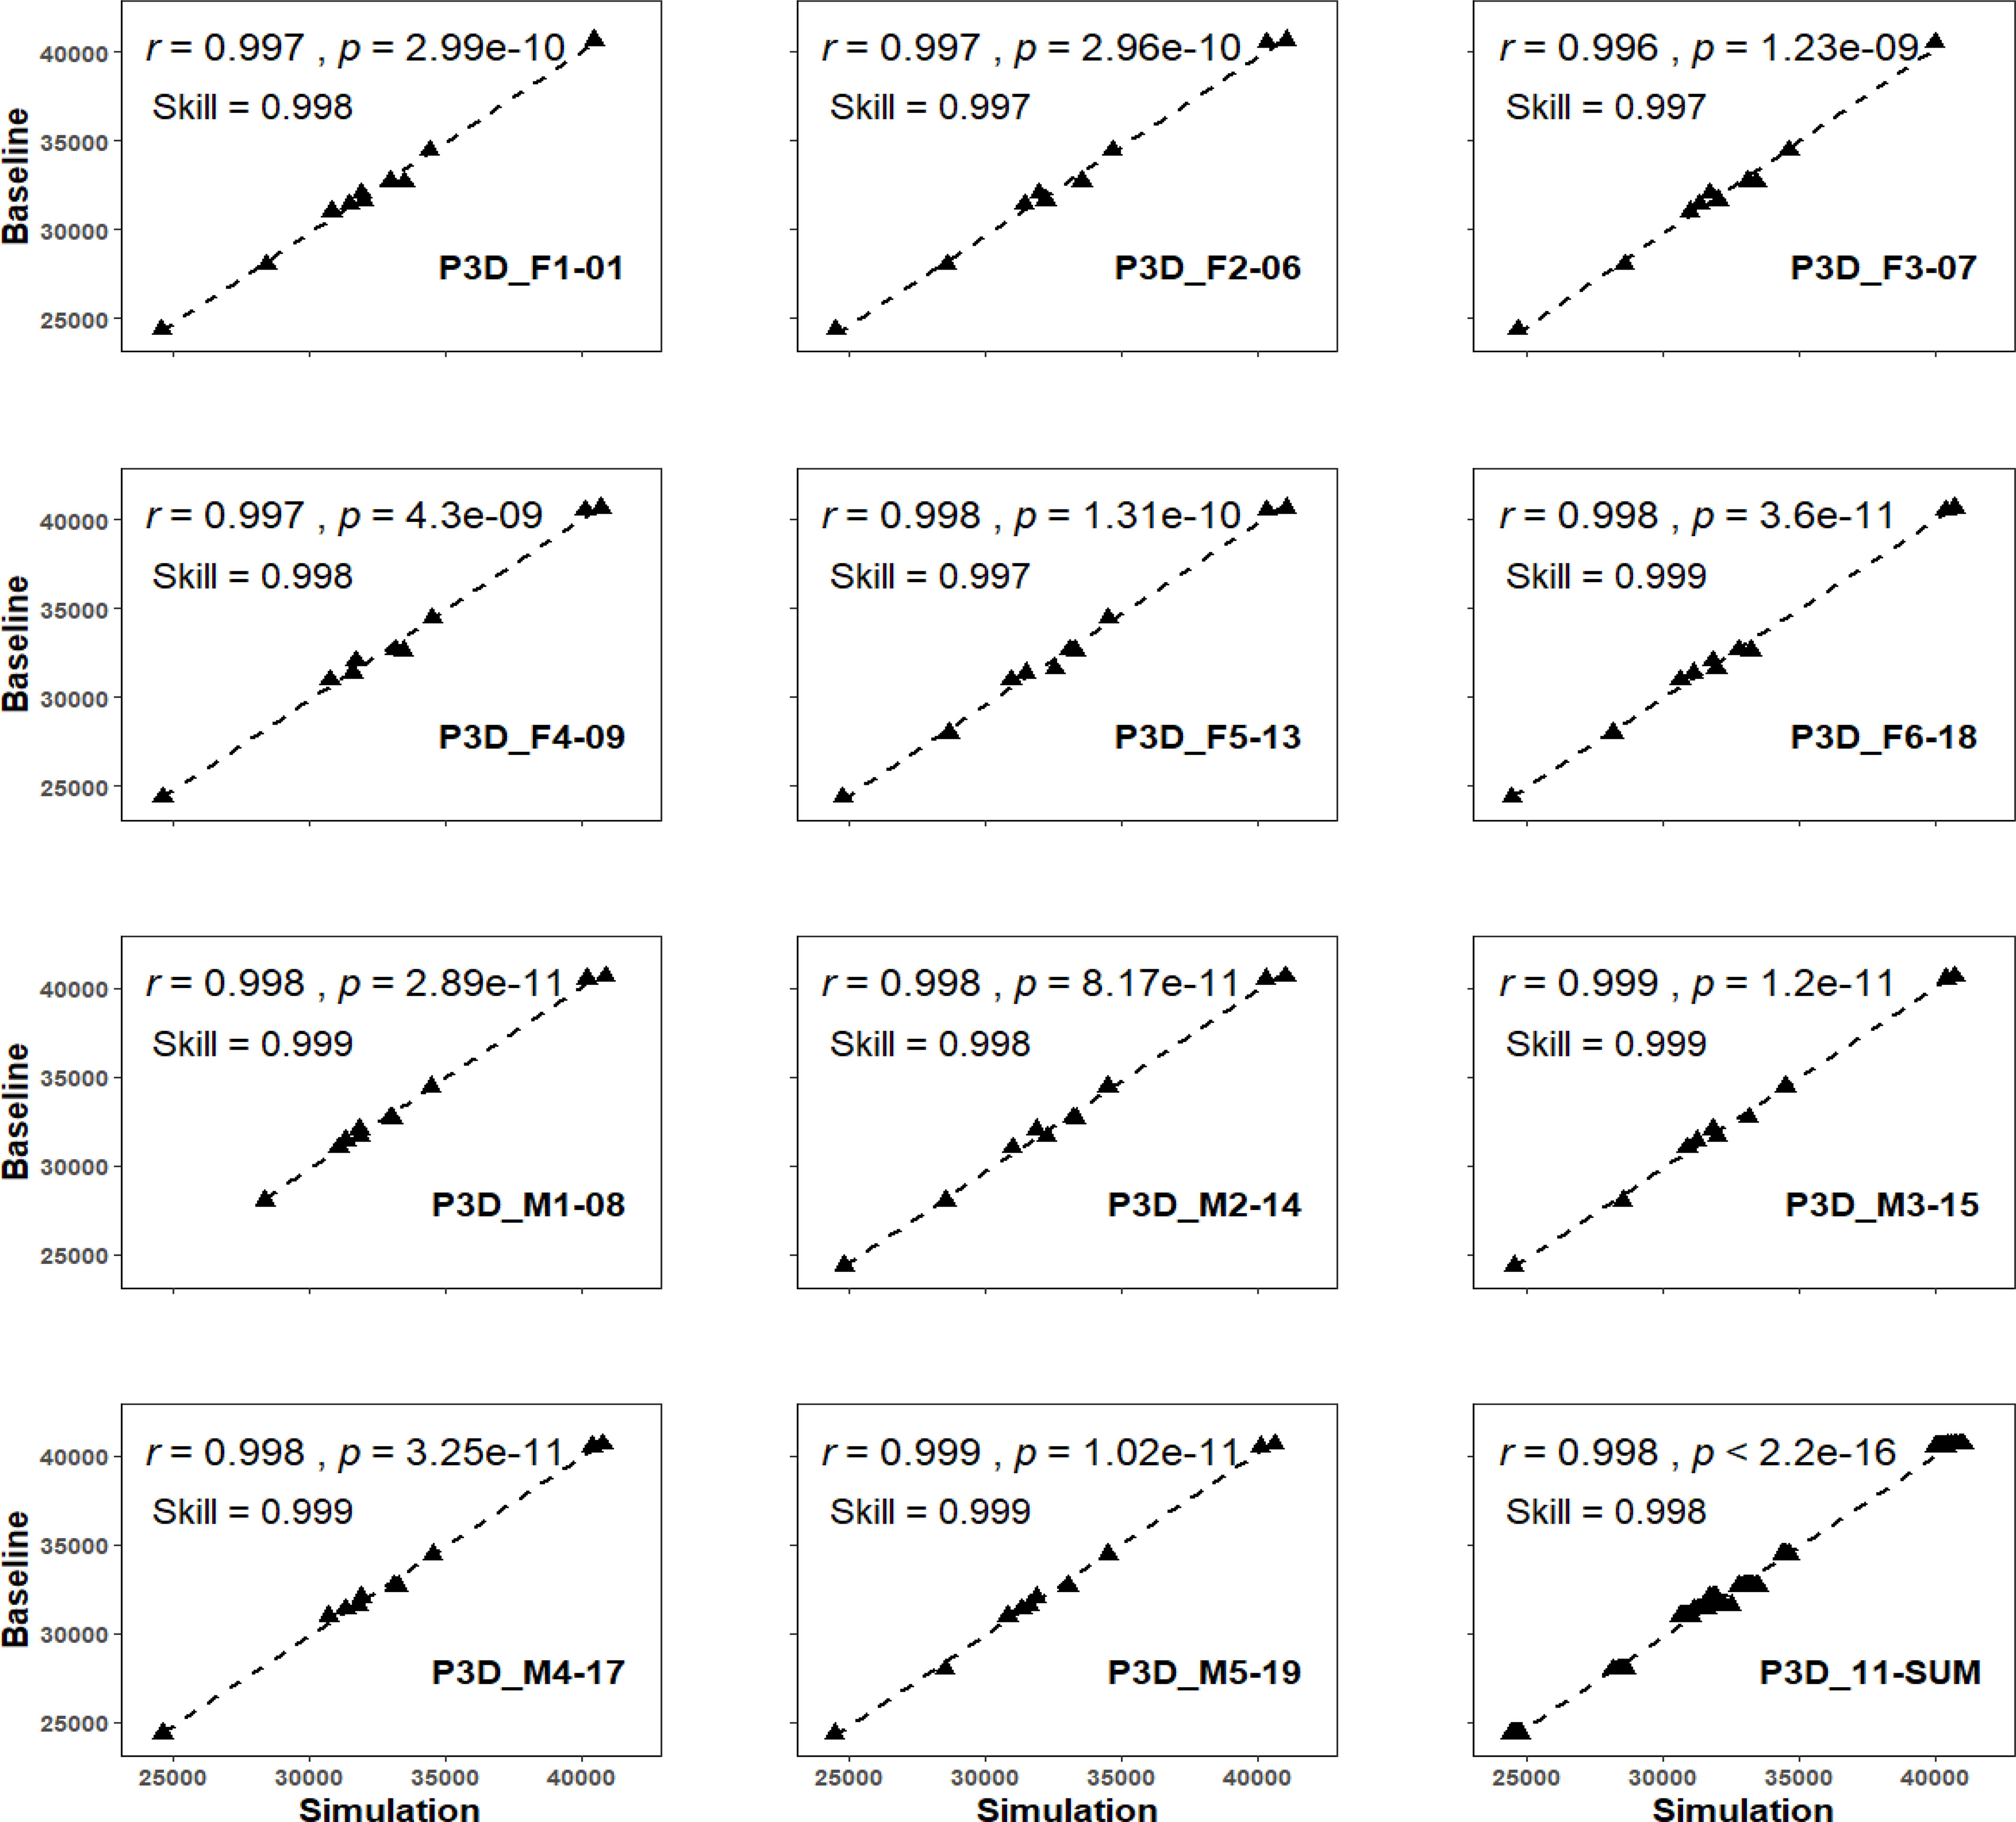
Figure 4 The predictivity test among all eleven 3DMs. The prefix of P3D indicates the hereafter model being chosen as the predictive model that was used for simulating the TBVs with foreign morphometrics input of rest others.
Results
SMA (Model II regression) revealed a significant positive and linear relationship between TBLDAM and TBLPG (R2 = 0.988; p < 0.01) with a regression coefficient of 0.98 (95% CI = 0.90 ~ 1.06) (Figure 5). A significant positive linear relationship of total body volume was also detected between hydrostatic weighing and water displacement (R2 = 0.997; p < 0.01) and the regression coefficient was 0.98 (95% CI = 0.94 ~ 1.02) (Figure 5). Neither regression coefficient differed significantly from the value of 1 indicating that the two measurements are isometric and hypostatized to be the “true” values. Once verified, total body volumes with volumes of fins and fluke subtracted were averaged and labeled as TBVDAM serving as a reference to evaluate the accuracy of estimated TBVs by 3DM and other models.
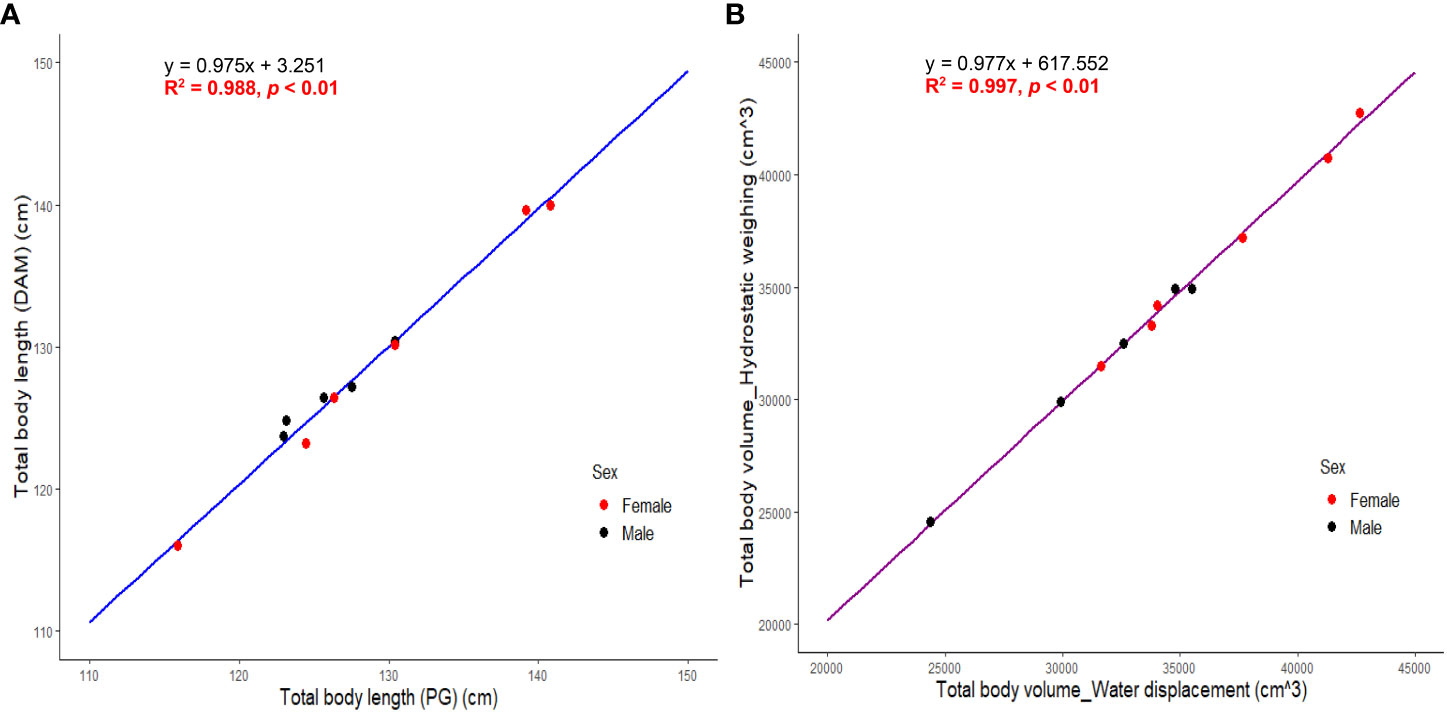
Figure 5 (A) SMA regression between directly measured total body length (TBLDAM) and photogrammetric total body length (TBLPG). (B) SMA regression between total body volume by hydrostatic weighing and water displacement. Total body volume here were values before adjustment of subtracting volumes of pectoral fins and fluke. .
The average tissue density for eleven EAFP was calculated to be 1.01 ± 0.01 g/cm3 with lungs volume excluded (dissection performed on the same day showing lungs all collapsed) and there was little difference between males and females (Table 1). The mean densities of the pectoral fins and the fluke (n = 11) were 1.33 ± 0.11 g/cm3 and 1.07 ± 0.02 g/cm3 respectively and their combined density was averaged as 1.18 ± 0.05 g/cm3. Mean ratios of the cross sections over eleven EAFPs were 1.1 ~ 1.2 (1.1 ± 0.05) at the first half of the body (≤ 50% TBL) and increased from 1.2 to 1.7 (1.4 ± 0.18) at the sites from 55% TBL to 75% TBL. The mean HW ratios were highest in the last quarter of the body (80% ~ 95% TBL) ranging from 2.1 to 2.8 (2.5 ± 0.32) (Figure 6). The mean HW ratio at eight sites was also plotted to outstand its values when viewing side with models and these values were 1.1 (H1/W1 to H4/W4), 1.2 (H5/W5), 1.4 (H6/W6), 1.7 (H7/W7), 2.2 (H8/W8) (Figure 6). HW ratio was not significantly different between males and females across the 19 sites (paired samples t-test, p = 0.10).
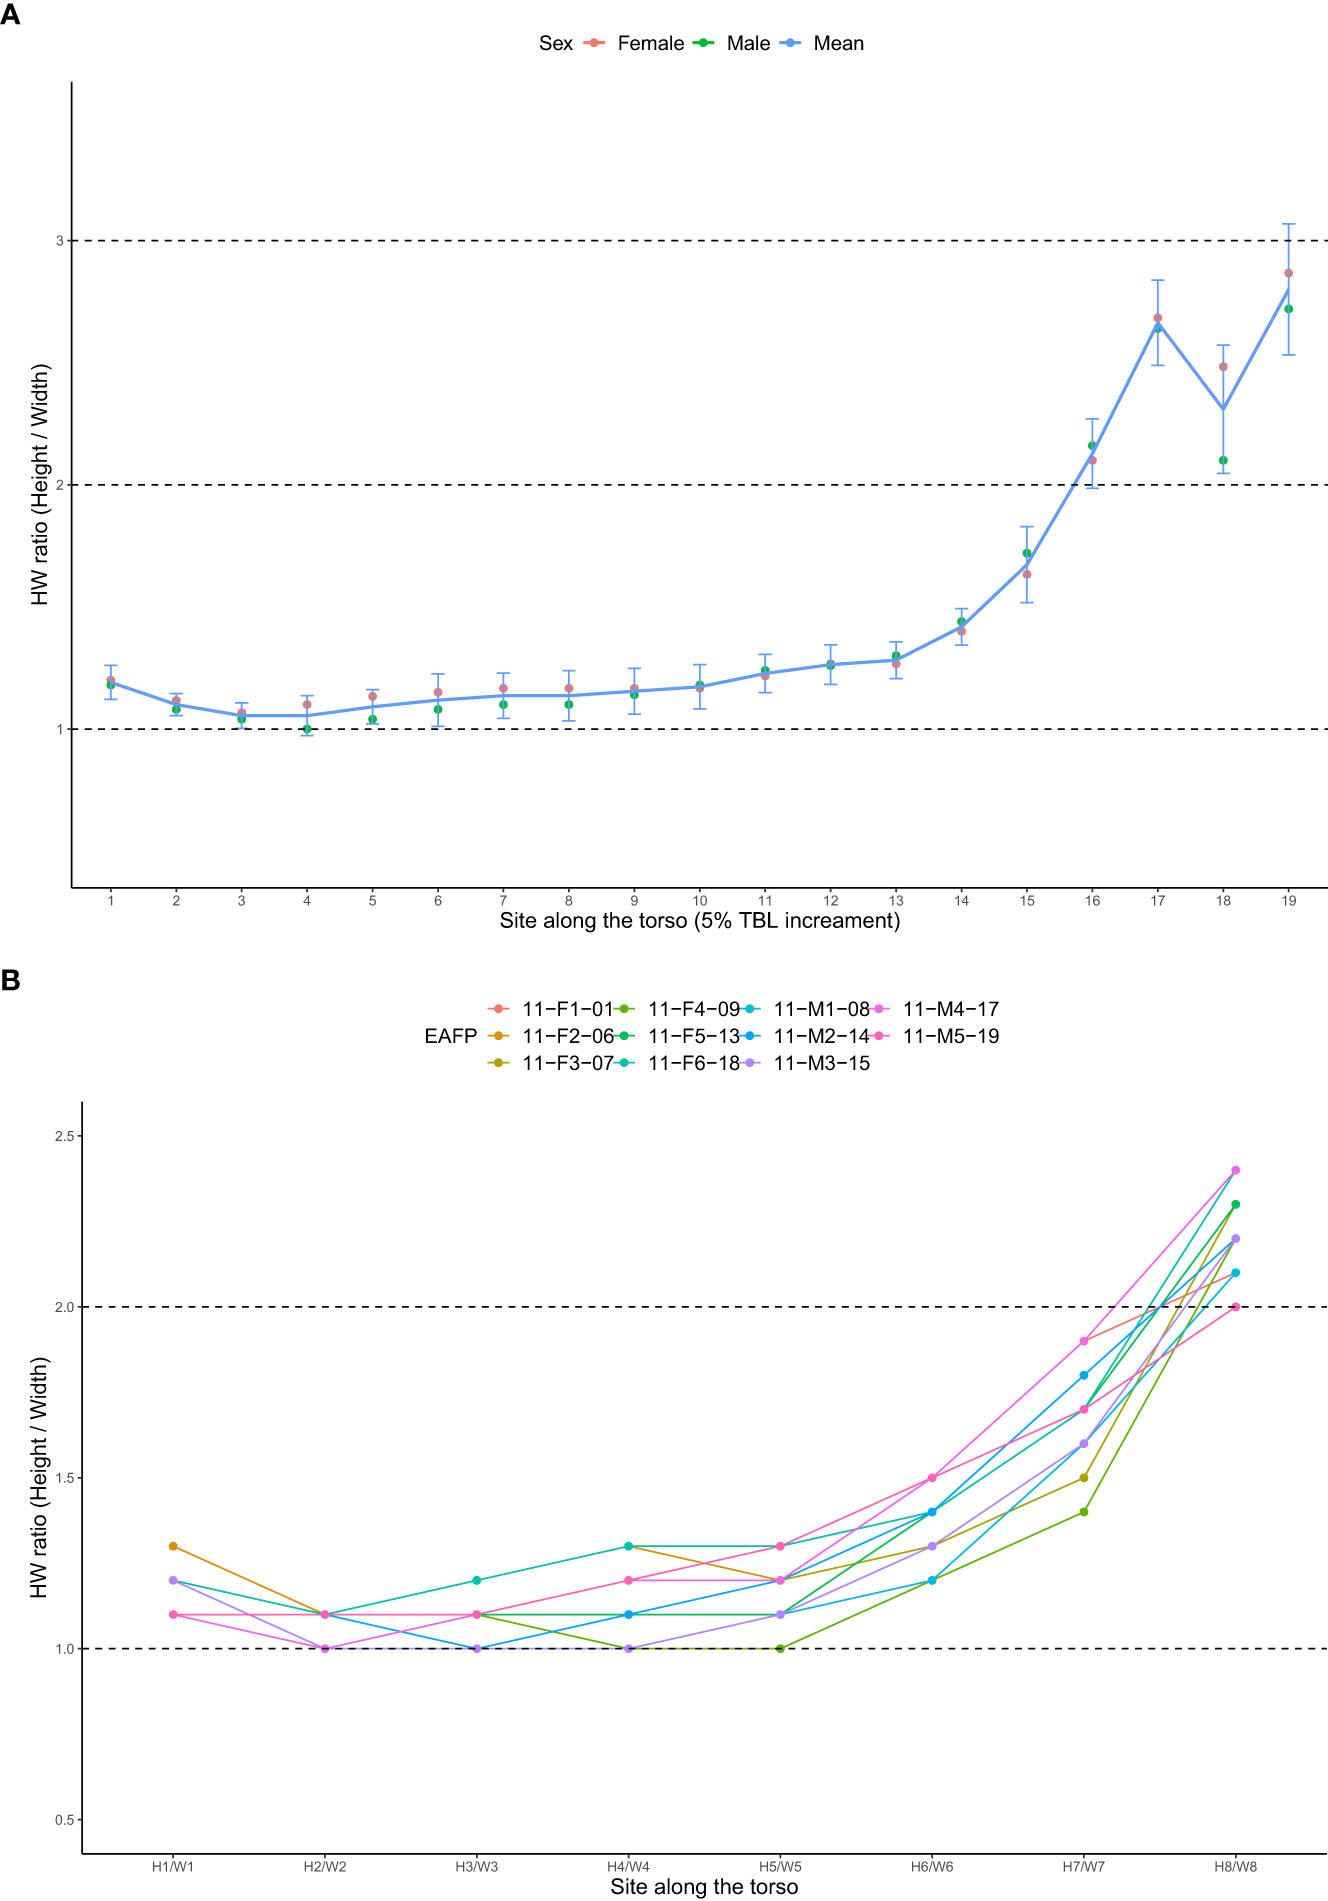
Figure 6 (A) Mean height/width (HW) ratios at sites of each 5%TBL increment (1-19). (B) HW ratios at eight sites from H1/W1 to H8/W8. Note the H3/W3, H5/W5, and H7/W7 equate sites of 25% TBL, 50% TBL, and 75% TBL respectively.
No significant difference was observed between the 3DM-generated TBV and TBVDAM (Figures 7, 8). Little significance was also produced by EM-8 and EM-19 models and MAPE values of the above three models to direct measurements were in the lowest group that are EM-19 (2.4%), 3DM (2.5%), and EM-8 (2.7%). The remaining eight models (EM-3, EM-5, TCM-3, TCM-5, TCM-8, TCM2-3, TCM2-5, and TCM2-8) produced TBV estimates that were significantly different from TBVDAM (Figures 7, 8). Among them, the lowest MEPA was calculated as 5.1% for TCM-8 and the highest value was 78.0% for TCM2-3 with the mean value computed as 21.2% ± 23.8%. When setting 3DM as the comparing reference, it was significantly different from all other models, except for the EM-19, though the MEPA of EM-8 to 3DM (0.9%) was similar to the MEPA of EM-19 to 3DM (0.8%) (Figure 8).
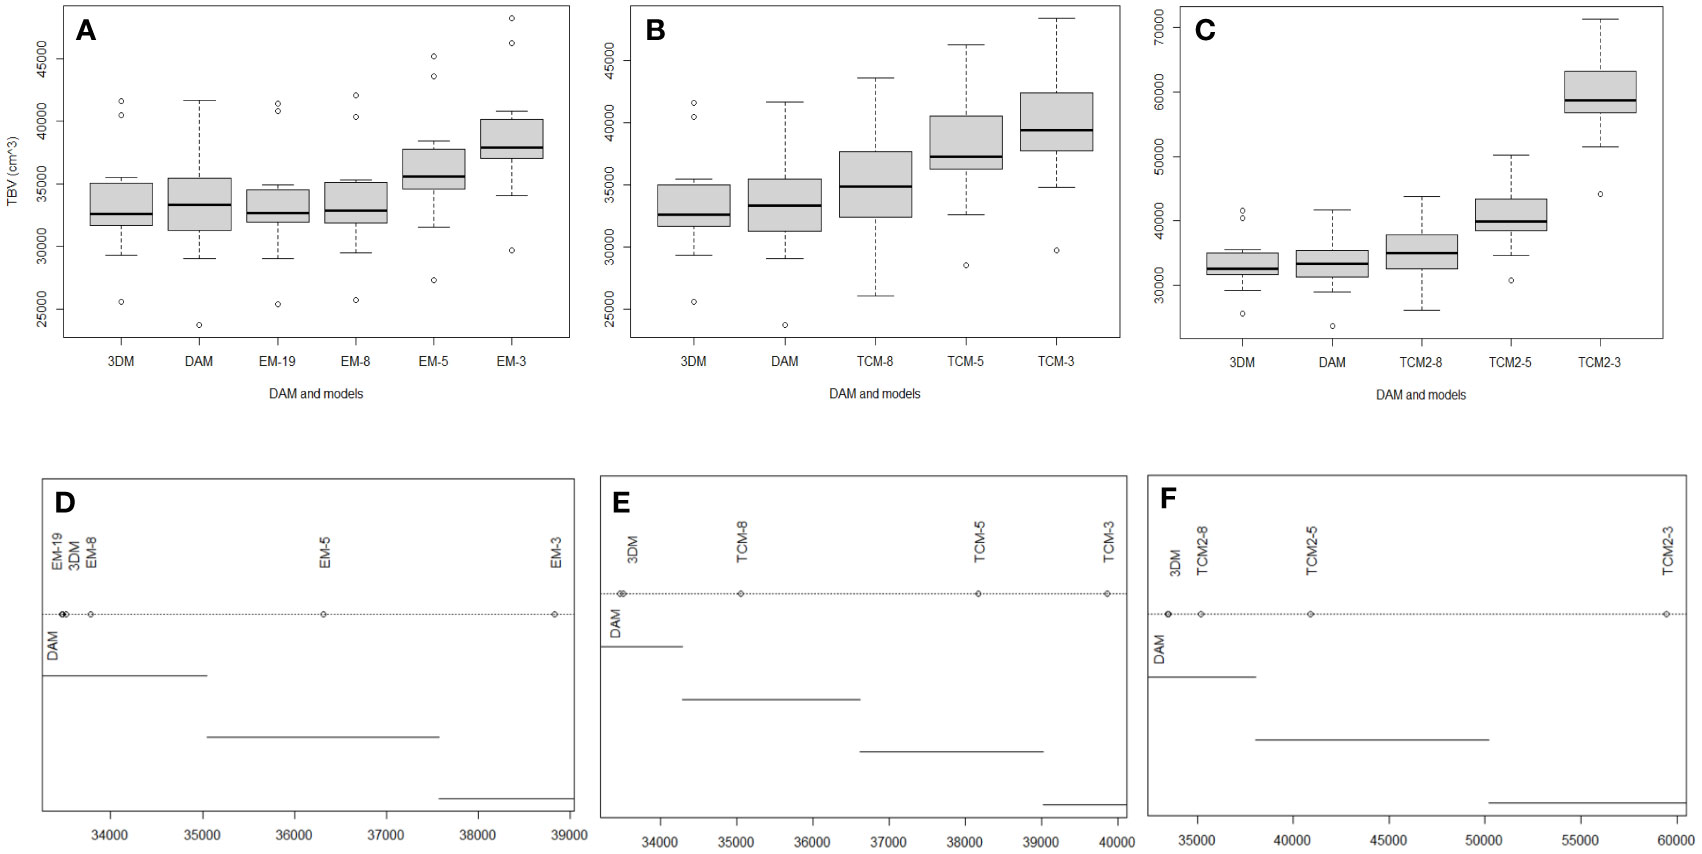
Figure 7 (A-C) Boxplots show the influence of the sections to the accuracy of EM, TCM, and TCM2 in estimating TBVs. (D-F) Significance test among above grouped models. Plot of the results from ANOVA post-hoc test (unplanned) and means connected by lines are not significantly different.
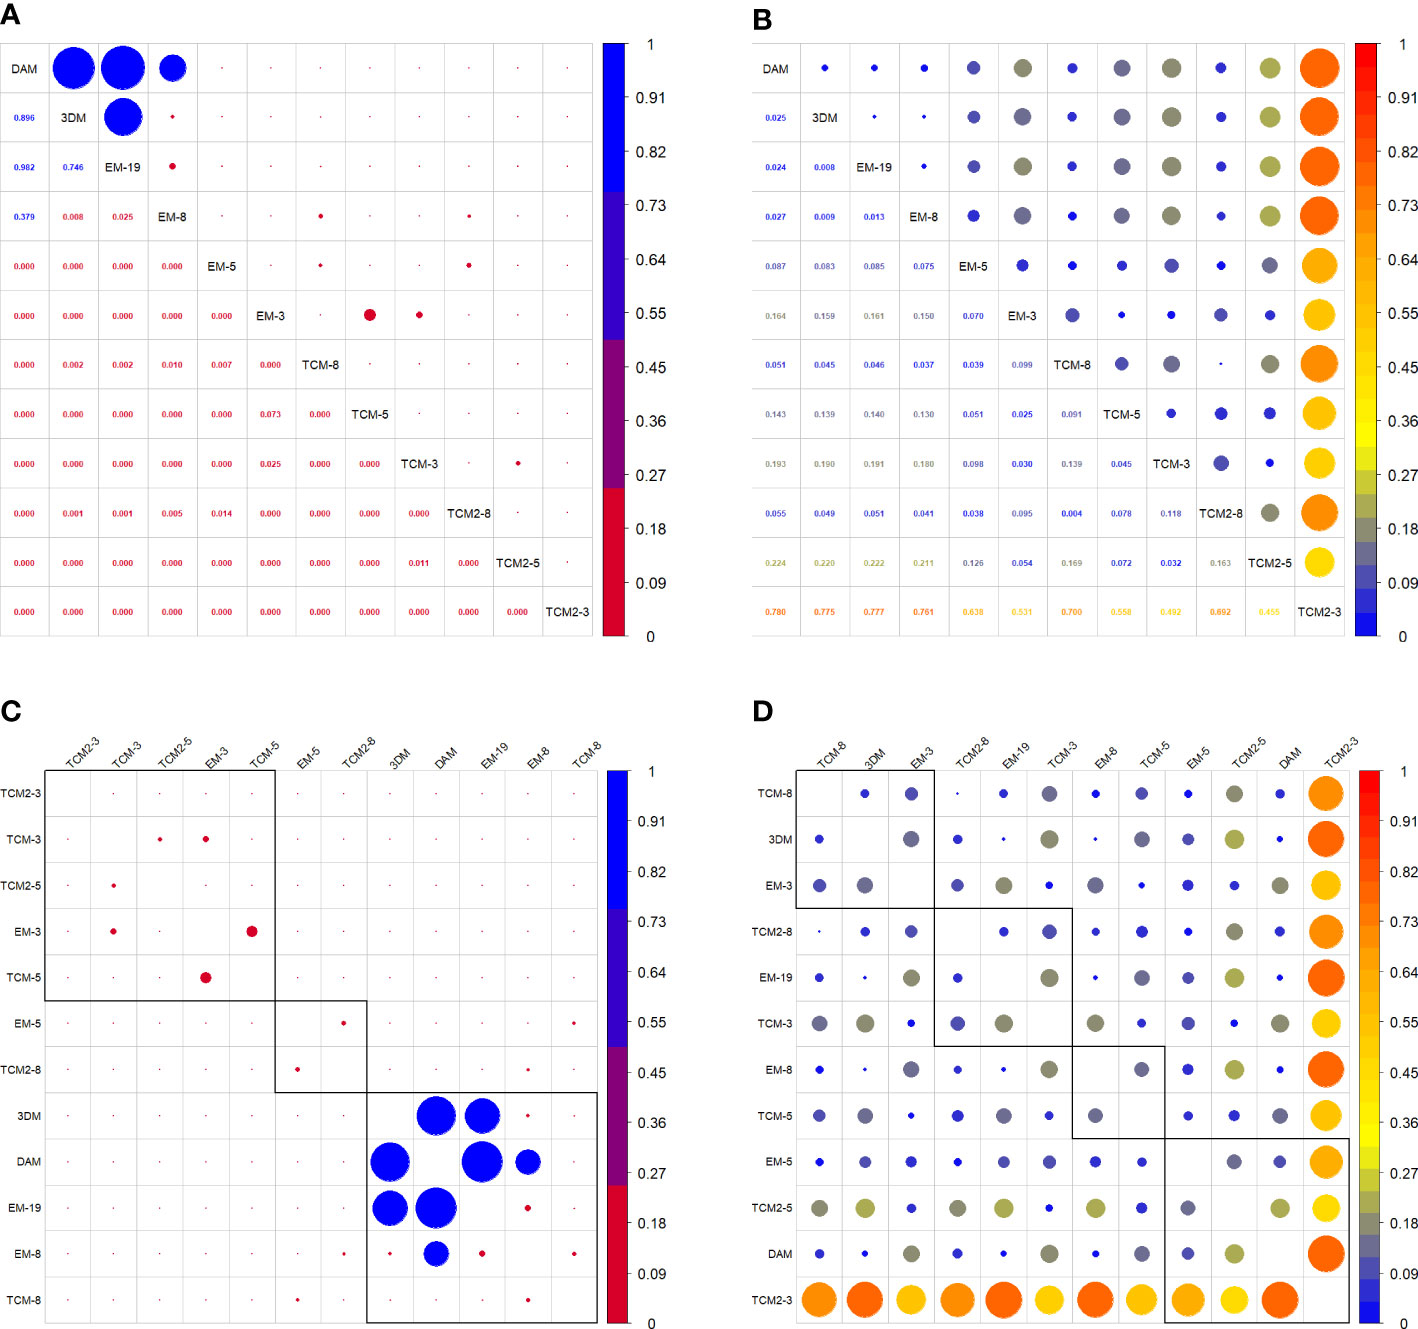
Figure 8 (A) Correlation matrix of p values of each two comparisons. (C) Grouping functions on correlated p values. (B) Correlation matrix of MAPE values of each two comparisons. (D) Grouping functions on correlated MAPE values.
The accuracy of TCM, TCM2, and EM all improved significantly with more inputs of girths or H & W pairs with the only exception of EM-8 vs. EM-19 which improved in accuracy but not significantly (Figure 7). The mean TBV estimates from these nine conventional models (excluding EM-19) were all larger than the TBVDAM and the 3DM-generated TBVs (mean value over eleven EAFPs), with a magnitude of the discrepancies becoming smaller as more measurement sites were used (Figures 7, 8). The highest MAPE to DAM was, therefore, found in each model group with the input of three girths or H & W pairs indicating results of these TCMs or EMs had the highest percentage error. TCMs with the input of eight girths gave the lowest MAPE to DAM in both types (TCM and TCM2), while the input of eight H & W pairs offered the second lowest MAPE below the input of 19 H & W pairs in EMs (Figure 8). In addition, modeling the last section as a cylinder (e.g., Adamczak et al., 2019) resulted in an overestimation of TBVs when applied to the small cetacean in our case (TCM vs TCM2). The overestimated TBVs exaggerated more when fewer numbers of input girths were used and the MAPE values from high to low were 49.2% (TCM-3 vs. TCM2-3), 7.2% (TCM-5 vs. TCM2-5), and 0.4% (TCM-8 vs. TCM2-8) (Figure 8).
When the delegated 3DM of animal F1-01 (P3D_ F1-01) was chosen for the predictability test, its simulated values were compared with baseline values, and results of the regression were reported as the skill value = 0.998, and the r-value of regression correlation (0.997 with p < 0.01) (Figure 4). The index of agreement between baseline and the simulated values of P3D_F2-06, P3D_F3-07, P3D_F4-09, P3D_F5-13, and P3D_F6-18 were all above 0.997 (~ 0.999), and the correlation r-values were all larger than 0.996 (~ 0.998) with all p < 0.01 (Figure 4). In addition, the index of agreement comparing baseline and the simulated values of P3D_M1-08, P3D_M2-14, P3D_M3-15, P3D_M4-17, and P3D_M5-19 were all above 0.998 (~ 0.999), and the correlation r-values were all larger than 0.998 (~ 0.999) with all p < 0.01 (Figure 4). This indicates that the delegate 3DMs from any of the five males also had the capability in simulating the TBVs with high accuracy regardless of the sex of the target EAFPs. The overall accuracy of the eleven delegate 3DMs was also detected and the results of the correlation were significant with the r-value reported as 0.998 (p < 0.01) and the index of agreement value as 0.998 (Figure 4).
Discussion
Through the comparison with direct measurements, our study validated the accuracy of the novel blender 3D model in mimicking the external morphology of marine mammals. The “gold standard” of direct measurements also allowed us to manipulate the number of input images and we were able to demonstrate the feasibility of using only two images (a dorsal and a lateral) to accurately recreate the 3D body shape of EAFPs. In addition, the photogrammetry-based 3DM, scaled with TBL only, is free from the impact of input numbers of girths or H & W pairs. We also found the elliptical model, when inputting 19 H & W measurement (EM-19), also produces similar accuracy in TBV estimation. However, TBV estimates from truncated models were significantly larger than the direct measurements, irrespective of the number of input girth measurements (three, five, or eight). Fewer input measurements were also an issue for the EM, which performed poorly when using less than eight measurements. Our findings showed the EM is more accurate than the TCM in estimating TBVs especially when more measurement inputs were available. As a result, we recommend either Blender 3D models or EM with a larger number of measurements (19 in this study) in estimating the body volume and mass of free-ranging marine mammals.
The cross-sectional body shapes of EAFP were overall tall ellipses along the entire torso (HW ratio > 1), though it was roughly round across the anterior half of the body and became more elliptical towards the tailstock region (Figure 6). In contrast, the anterior section of the large whales looks relatively flat (HW ratio < 1) and then it becomes tall ellipses in the posterior part (HW ratio >1) (Christiansen et al., 2016; 2019). The elliptical shape of marine mammals, therefore, goes against the fundamental assumption of the TCM that treats the cross-sections as perfect circles for radii calculation. By the rules of the isoperimetric problem (Blåsjö, 2005), the circle exaggerates more area in Euclidean space than the ellipse does when both have the same perimeter. The average HW ratio over the 19 measurement sites of EAFP was 1.5 and theoretically, such area exaggeration was 6.3% larger when assuming a circular shape rather than an elliptical shape (Ellipse perimeter using Ramanujan’s Approximation Theorem , Ramanujan, 2011). Since the body volume is calculated as the area accumulated along the total body length, the absolute error of the TCM increases by the magnitude of the body length ratio in larger animals, although the relative error may not fluctuate. This bias became more prominent over the tail stock region, where the mean HW ratio was around 2.5, which resulted in an area exaggeration of 34.1%. Thus, the conventional TCM will cause an overestimation of the TBV of animals, especially across the highly elliptical tailstock region. Similar to our results on EAFPs, a previous study on pilot whales also reported the same pattern, with TBVs estimated by conventional TCMs being significantly higher compared to estimates based on 3DM (Adamczak et al., 2019). They also suggested, through comparison among sectional volumes, that TBVs estimated by TCM deviated more for larger animals as overestimated regions (e.g., tailstock) become larger as well. Although we did not report sectional volumes as TBV is our focus interest, the influence of the tailstock region can still be quantified by comparing TCM against TCM2 as the only difference between them is the last section. The MAPE was high as 49.2% when modeling the tailstock region as a cylinder in TCM2-3 instead of a cone in TCM-3. The magnitude of this difference decreased when more sections confining the region (7.2% for TCM-5 vs. TCM2-5, 0.4% for TCM-8 vs. TCM2-8), though two comparisons were still significantly different (Figure 8). In addition to the number of girth inputs used, we further believe that girth measurements at the site of peduncle insertion (G8) also played a major role in TBV estimation that funneled down the body shape of EAFPs to a more realistic shape.
The TCM treats the streamlined body contour of the marine mammal as a series of simplified and rigid geometric shapes of cones and cylinders, which does not well describe its continuously curving external morphology (Koopman et al., 2002). This method follows the principles of Integral with each slab section acting as a dividing unit and thus the larger quantity of the sections divided by more girths (or H & W pairs in EM) will principally give a better estimation of the TBVs. The observation of our results showed the TCM offered improved accuracy with more numbers of girths input and these significant improvements were validated with direct measurements. Adamczak et al. (2019) reported a similar pattern, with the TCM for pilot whales becoming increasingly accurate as more girth measurements (6 girths vs. 3 girths) were used in the model. Although they found a significant difference between the TCM and the 3DM, the direction of the significance (improvement or deterioration) wasn’t verified, and the accuracy of their models wasn’t validated due to a lack of direct volume measurements. Thus, the calculated body volume in previous work using this model might be subject to error and we do not recommend TCM for future work on cetaceans where an accurate TBV estimate is demanded. On the other hand, TCM gained popularity due to its simplicity and convenience for several decades (Ryg et al., 1988; Bell et al., 1997) and the tape measure is the major tool required in the field to obtain the needed length and girth measurements for TBV estimates. It might still be useful when accuracy is not the priority, and the logistic supply is extremely in shortage. Using more girth measurements (especially at the peduncle insertion) and modeling the head and tailstock sections as cones can improve the performance of TCM.
The EMs produced more accurate TBV estimates compared to the TCMs at all three levels of inputs and these improvements were significant, except EM-3 vs TCM-3 that was significant when α = 0.05 (Figure 8). The EM-19 with 5% TBL increments produced TBV estimates with similar accuracy as the 3DM. It was beyond the scope of this study to test the minimum number of input girths or H & W pairs to yield trustworthy TBV estimates using EM, TCM, or TCM-2. The EAFP is one of the smallest cetaceans and five or eight girth measurements are considered reasonable for estimating TBV using TCM. When eight girths were used, the body was separated into nine sections of ~20 cm each (~ 15% of the TBL). The same density of measurements on cetaceans with TBLs of 2.0, 4.0, or 6.0 m requires roughly 10, 20, and 30 girths detection respectively. Such dense girth measurements seem rarely performed in situ, especially when many animals need to be measured. Moreover, the stranding network suggests a guideline for measuring the cetacean on several common sites regardless of the size of the animal (Norris, 1961). The TBVs estimated from these common sites on larger marine mammals when using TCM might lead to significantly overestimated TBVs. It remains uncertain how many girths are needed for TCM for other cetaceans to estimate TBV accurately.
The Blender 3D model utilized images to construct a 3D mesh that was then scaled to actual size with photogrammetrics input of either only TBL for the same individual or combined with H & W pairs for others. Therefore, the approach of 3DM inherently bypasses the highlighted issues of the TCMs and EMs. With images of the animal in the background for reference, the digital 3DM can delicately mimic the elliptical and curving contour of marine mammals. The reconstructed meshwork that is equivalent to H & W pairs can be set in an unprecedentedly fine scale that fieldwork protocols can hardly match. In this study, the 3DM scaled with TBL only outperformed conventional TCMs and EMs (except EM-19) in estimating TBVs, and our results of comparisons were validated against direct measurements through p-values and MAPE values. When the same set of images was used for both 3DM recreation and morphometric extraction, the proportional scaling on this individual-specified 3DM is free from H & W inputs as the model and the image will scale synchronously and proportionally in the same magnitude and direction. In addition, any of the eleven 3DMs were capable to serve as a predictive model in simulating other EAFPs and the simulated TBVs were accurate compared to baseline ones (Figure 4). The predictability test demonstrated the intrinsic robustness of Blender 3DM when scaling with foreign inputs in generating TBVs regardless of sex, though such tests were performed within the same species. We can assume that the 3DM constructed on the randomly selected individual regardless of size and sex might serve as a universal model for the entire population. This could be very useful when images of other individuals are absent due to logistics, weather, and other obstacles often existing in the field.
When creating 3DMs of animals, a greater number of images from different perspectives will naturally improve accuracy as it will capture more details and thus also commonly recommended by the current industry (Bot et al., 2019; Irschick et al., 2021). However, our study indicated that a 3DM constructed from only two images (one dorsal view and one lateral view) was capable of producing TBV estimates that were statistically indistinguishable from direct measurements. Therefore, the improvement in accuracy when adding additional photos was not significant in our case and, thus, did not warrant the additional time or effort required to capture them. Moreover, the visible details (such as tubercles, lumps, indentation, cuts, etc.) presented in additional images might be individual-specific marks that are commonly used for visual- or photo- identification purposes (Würsig and Würsig, 1977; Würsig and Jefferson, 1990). Efforts to model such fine details to improve accuracy might introduce errors when attempting to construct a predictive model aiming to apply to other members in a pod. In addition, the minimum requirements of two images by 3DMs allows a more efficient assessment of larger populations of marine mammals (e.g., mass stranding), compared to models requiring multiple images input for reliable TBVs output (Haley et al., 1991; Hodgson et al., 2020).
The acquisition of high-resolution aerial images (e.g., by drones) that fulfill the quality requirements for photogrammetry studies can be expensive in both time and effort for elusive and fast-swimming cetaceans (e.g., porpoise), though the story is a bit different for large whales (Christiansen et al., 2019; 2021). Small and elusive species of cetaceans might only spend a small fraction of their time at the surface and hence only offer a very short time window for researchers to obtain good images with limited perspectives of views. Thus, the verification of two images in estimating trustworthy TBVs through 3DM may offer useful guidelines for future research on finless porpoises and other species. Although it is not impossible to reconstruct a 3D model from only one image (Jackson et al., 2018; Saito et al., 2020), such a primitive 3D model needs a huge number of images for machine learning that might only be feasible to the animal when its profile images accumulated sufficiently. As one regular image usually offers no more than two-dimensional parameters, a third scale must be assumed or referred to in this case and our preliminary work shows the instability of such a 3D model. We can foresee it is especially true when the animal was considered abnormal in shape (e.g., obese, emaciated, or pregnant) as the proportion deviates from normality unless they are well studied. The availability of the HW ratio could partially solve this problem and more studies need to be done to validate the reliability of one-image-oriented 3D models.
The body of cetaceans, like their counter-partners of terrestrial mammals, is essentially bilateral, with the left lateral part being principally identical to the right lateral part (Malakhov, 2004; Toxvaerd, 2021). Although directional asymmetric has been reported for some species of cetaceans, the concerned body parts were either initially excluded from all models (e.g., pectoral fins) or believed to have a minor effect on overall TBV estimation (Galatius and Jespersen, 2005; Coombs and Felice, 2021). Researchers and 3D artists commonly treat cetaceans as symmetric shapes and the Mirror Modifier that mirrors half of the mesh along the assigned axis to form the other half is often used when modeling marine mammals (Adamczak et al., 2019). We found few abnormalities in the two cases in which 3DMs were reconstructed by images of the right lateral view and the visual inspection showed the generated TBVs falls within normal range. Therefore, the images of the left lateral view were preferably used when available for the convenience of perspective swapping in the Blender environment for model construction. In addition, the dorsal side is most visible to observers above the surface, while the ventral side is typically only seen during sexual displays or avoidance behavior (personal communication with Dr. Bernd Würsig). Thus, we used the dorsal side images preferably when available in modeling for the purpose of imitating the field research in which cetaceans were reported in a straight supine position allowing high-quality photographing (e.g., Christiansen et al., 2019; 2020).
The 3DMs in our study were exclusively scaled with photogrammetric morphometrics of body lengths, heights, and widths. Scaling the model using direct measurements of lengths and girths might introduce errors as the elliptical cross sections are treated as circles. Moreover, the small-sized marine mammals (e.g., porpoises) that are accessible for anatomic measurements (e.g., chemically or physically immobilized, stranded, or killed) are also commonly available for weighing and the convenient conversion can be made between total body mass and volume, though the scenarios may not apply to large animals. The indirect methods including 3DM and photogrammetry will be very useful when the size of the animal exceeds the range of instrumentation, the site is inaccessible, or the animal is free ranging. This is especially true in the case of large whales (e.g., baleen whales) that are logistically difficult to weigh even when dead. Moreover, the direct measurements are usually disruptive, or even lethal, and thus impractical in most endangered and free-ranging cetacean species. Given these scenarios, aerial photogrammetry is an effective and accurate approach for obtaining images that could also be utilized for constructing 3D models that generates TBVs with the input of extracted morphometrics (Christiansen et al., 2018). In addition, photogrammetry-based EMs, when 19 measurements (EM-19) are used, can also yield highly accurate TBV estimates as the 3DM. Moreover, this non-invasive approach makes long-term monitoring of cetaceans logistically and financially feasible.
Although the body volume and mass of marine mammals provide valuable insight into body conditions and population dynamics assisting conservation management (e.g., Christiansen et al., 2014; 2021), these vital parameters were historically inaccessible from free-ranging cetaceans due to the logistical challenge of acquiring direct measurements. This is particularly true for body volume, for which there exists little, or no, accurate data for most cetacean species (personal communication with Dr. Bernd Würsig). Consequently, little information exists on the directly measured average tissue density of these species, which is valuable when investigating the diving ecology, physiology, and behavior of animals. The average tissue density of eleven EAFPs in this study was calculated as 1.01 ± 0.01 g/cm3 with lung volume adjusted. This indicates that EAFPs are close to neutral buoyant when diving and slightly positively buoyant when swimming at the surface with their lungs fully inflated. This buoyancy paradigm is believed to be energetically efficient for swimming and diving in cetaceans (Nowacek et al., 2001). The average tissue density, or volume-to-mass conversion factor, reported in other cetacean species (1.00 g/cm3 and 0.8 g/cm3 for Phocoena phocoena, 0.8 g/cm3 for Eubalaena sp.) indicated the similar patterns (Christiansen et al., 2019; Irschick et al., 2021; Christiansen et al., 2022), while others reported negative buoyancy at the sea surface (1.03 g/cm3 for Hyperoodon ampullatus, 1.04 g/cm3 for Megaptera novaeangliae) (Miller et al., 2016; Aoki et al., 2021). There is little information on the average density of the pectoral fins and fluke of cetaceans for comparison with our results which were 1.18 ± 0.05 g/cm3 (n = 11). The heavier pectoral fins and fluke may suggest some assistance in diving and controls in swimming (Bose et al., 1990).
The techniques incorporating Blender 3D modeling and photogrammetry are not limited to images from immobile cetaceans. The pioneering work on free-ranging cetacean species demonstrated the feasibility of this method in the field when images for 3D modeling and photogrammetry were collected using Unmanned Aerial Vehicles (UAVs) (e.g., Christiansen et al., 2019; Irschick et al., 2022). A potential application using underwater images by either divers or unmanned underwater vehicles (UUVs) could be expected for further research with similar procedures (Lewis et al., 2021). When combing with 3D printing techniques, 3DM creates the possibility of realistic models at any desired scale allowing for education & exhibition, and flow tank tests on profile drag, fluke propulsion, and pectoral fin control (Fish and Lauder, 2017; Irschick et al., 2021; Wu et al., 2021). In addition, the animation capabilities of Blender 3D modeling make computer simulations of hydrodynamic performance possible. In long-term monitoring, the estimated values of TBL or TBV with convenient conversion to age and mass could be assigned as an appendix or suffix to visual- or photo- identified profiles of marks and sex and this additional individual-specific information might fast-forward individuals identification in large pods (Machado and Cantor, 2022). Machine-learning algorithms for estimating morphometrics (e.g., Gray et al., 2019) and convolutional neural networks for analyzing images (e.g., on homo sapiens by Saito et al., 2020) may open a new avenue to research that can automatically process images and obtain designed metrics (Langley, 2011; Jordan and Mitchell, 2015). Thus, a software package can be expected with the function of generating 3DMs and associated parameters after uploading images and type-in of some environmental settings.
Data availability statement
The original contributions presented in the study are included in the article/supplementary material. Further inquiries can be directed to the corresponding author.
Ethics statement
The animal study was reviewed and approved by Institute of Hydrobiology, Chinese Academy of Sciences.
Author contributions
CZ conceived the ideas, designed the methodology, analyzed the data, and wrote the manuscript. YH, KW, and DW offered funding, animals, and research facilities. CZ, HZ, RC, JM, and ZK collected and processed the data. CZ and ZK made and maintained measuring apparatus. YH, FC, DW, and RD edited the manuscript. All authors contributed critically to the drafts and gave final approval for publication. All authors contributed to the article and approved the submitted version.
Funding
This work was funded by the Science and Technology Service Network Initiative, and the National Key R&D Program of China (2021YFD1200304), and mini grant from Texas A&M University at Galveston.
Acknowledgments
We thank Dr. Bernd Würsig for the comments, advice, and guidance. We thank Zhengyu Deng for skills and assistance in photographing. We thank C. David Hickey, Traver J. Wright, and Stephen C. McClure for advice and suggestions. We thank Dr. Blair Sterba-Boatwright and Dr. Chengxue Li for assistance in statistical analyses.
Conflict of interest
The authors declare that the research was conducted in the absence of any commercial or financial relationships that could be construed as a potential conflict of interest.
Publisher’s note
All claims expressed in this article are solely those of the authors and do not necessarily represent those of their affiliated organizations, or those of the publisher, the editors and the reviewers. Any product that may be evaluated in this article, or claim that may be made by its manufacturer, is not guaranteed or endorsed by the publisher.
References
Adamczak S. K., Pabst A., McLellan W. A., Thorne L. H. (2019). Using 3D models to improve estimates of marine mammal size and external morphology. Front. Mar. Sci. 6, 334. doi: 10.3389/fmars.2019.00334
Alonso-Farré J. M., Gonzalo-Orden M., Barreiro-Vázquez J. D., Ajenjo J. M., Barreiro-Lois A., Llarena-Reino M., et al. (2014). Cross-sectional anatomy, computed tomography and magnetic resonance imaging of the thoracic region of common dolphin (D elphinus delphis) and striped dolphin (S tenella coeruleoalba). Anatomia histologia embryologia 43 (3), 221–229. doi: 10.1111/ahe.12065
Andrew N. L., Mapstone B. D. (1987). Sampling and the description of spatial pattern in marine ecology. Oceanogr Mar. Biol. 25, 39–90. doi: 10.1016/0198-0254(88)92605-2
Aoki K., Isojunno S., Bellot C., Iwata T., Kershaw J., Akiyama Y., et al. (2021). Aerial photogrammetry and tag-derived tissue density reveal patterns of lipid-store body condition of humpback whales on their feeding grounds. Proc. R. Soc. B 288 (1943), 20202307. doi: 10.1098/rspb.2020.2307
Baker C. S., Clapham P. J. (2004). Modelling the past and future of whales and whaling. Trends Ecol. Evol. 19 (7), 365–371. doi: 10.1016/j.tree.2004.05.005
Barratclough A., Jepson P. D., Hamilton P. K., Miller C. A., Wilson K., Moore M. J. (2014). How much does a swimming, underweight, entangled right whale (Eubalaena glacialis) weigh? calculating the weight at sea, to facilitate accurate dosing of sedatives to enable disentanglement. Mar. Mammal Sci. 30 (4), 1589–1599. doi: 10.1111/mms.12132
Bell C. M., Hindell M. A., Burton H. R. (1997). Estimation of body mass in the southern elephant seal, Mirounga leonina, by photogrammetry and morphometrics. Mar. Mammal Sci. 13 (4), 669–682. doi: 10.1111/j.1748-7692.1997.tb00090.x
Beltran R. S., Ruscher-Hill B., Kirkham A. L., Burns J. M. (2018). An evaluation of three-dimensional photogrammetric and morphometric techniques for estimating volume and mass in weddell seals Leptonychotes weddellii. PloS One 13 (1), e0189865. doi: 10.1371/journal.pone.0189865
Blåsjö V. (2005). The isoperimetric problem. Am. Math. Monthly 112 (6), 526–566. doi: 10.1080/00029890.2005.11920227
Bose N., Lien J., Ahia J. (1990). Measurements of the bodies and flukes of several cetacean species. Proc. R. Soc. London. Ser. B: Biol. Sci. 242 (1305), 163–173. doi: 10.1098/rspb.1990.0120
Bot J. A., Irschick D. J., Grayburn J., Lischer-Katz Z., Golubiewski-Davis K., Ikeshoji-Orlati V. (2019). Using 3D photogrammetry to create open-access models of live animals: 2D and 3D software solutions. Grayburn et al., eds. D, 3, 54–72.
Brose U. (2010). Body-mass constraints on foraging behaviour determine population and food-web dynamics. Funct. Ecol. 24, 28–34. doi: 10.1111/j.1365-2435.2009.01618.x
Cashman T. J., Fitzgibbon A. W. (2012). What shape are dolphins? building 3d morphable models from 2d images. IEEE Trans. Pattern Anal. Mach. Intell. 35 (1), 232–244. doi: 10.1109/TPAMI.2012.68
Castellini M. A., Kooyman G. L. (1990). Length, girth and mass relationships in weddell seals (Leptonychotes weddellii). Mar. Mammal Sci. 6 (1), 75–77. doi: 10.1111/j.1748-7692.1990.tb00227.x
Christiansen F., Bejder L., Burnell S., Ward R., Charlton C. (2022). Estimating the cost of growth in southern right whales from drone photogrammetry data and long-term sighting histories. Mar. Ecol. Prog. Ser. 687, 173–194. doi: 10.3354/meps14009
Christiansen F., Dujon A. M., Sprogis K. R., Arnould J. P., Bejder L. (2016). Noninvasive unmanned aerial vehicle provides estimates of the energetic cost of reproduction in humpback whales. Ecosphere 7 (10), e01468. doi: 10.1002/ecs2.1468
Christiansen F., Rodríguez-González F., Martínez-Aguilar S., Urbán J., Swartz S., Warick H., et al. (2021). Poor body condition associated with an unusual mortality event in gray whales. Mar. Ecol. Prog. Ser. 658, 237–252. doi: 10.3354/meps13585
Christiansen F., Sironi M., Moore M. J., Di Martino M., Ricciardi M., Warick H. A., et al. (2019). Estimating body mass of free-living whales using aerial photogrammetry and 3D volumetrics. Methods Ecol. Evol. 10 (12), 2034–2044. doi: 10.1111/2041-210X.13298
Christiansen F., Sprogis K. R., Gross J., Castrillon J., Warick H. A., Leunissen E., et al. (2020). Variation in outer blubber lipid concentration does not reflect morphological body condition in humpback whales. J. Exp. Biol. 223 (8), jeb213769. doi: 10.1242/jeb.213769
Christiansen F., Víkingsson G. A., Rasmussen M. H., Lusseau D. (2014). Female body condition affects foetal growth in a capital breeding mysticete. Funct. Ecol. 28 (3), 579–588. doi: 10.1111/1365-2435.12200
Christiansen F., Vivier F., Charlton C., Ward R., Amerson A., Burnell S., et al. (2018). Maternal body size and condition determine calf growth rates in southern right whales. Mar. Ecol. Prog. Ser. 592, 267–281. doi: 10.3354/meps12522
Ciobanu O., Xu W., Ciobanu G. (2013). The use of 3D scanning and rapid prototyping in medical engineering. Fiabil. Durab 1, 241–247.
Coombs E. J., Felice R. N. (2021). Quantifying asymmetry in non-symmetrical morphologies, with an example from cetacea. bioRxiv. doi: 10.1101/2021.11.17.468940
Czepkowshi T., Słówko W. (1996). Some limitations of surface profile reconstruction in scanning electron microscopy. Scanning: J. Scanning Microscopies 18 (6), 433–446. doi: 10.1002/sca.1996.4950180606
Davis R. W. (2019). Marine mammals: adaptations for an aquatic life (Springer International Publishing in Midtown Manhattan, New York City: Springer Nature).
de Bruyn P. N., Bester M. N., Carlini A. R., Oosthuizen W. C. (2009). How to weigh an elephant seal with one finger: a simple three-dimensional photogrammetric application. Aquat. Biol. 5 (1), 31–39. doi: 10.3354/ab00135
Del Pizzo S., Troisi S., Testa R. L., Sciancalepore G., Pedrotti D., Pietroluongo G. (2021). “Photogrammetry applications on stranded cetaceans: fin whale case study and preliminary results,” in 2021 International Workshop on Metrology for the Sea; Learning to Measure Sea Health Parameters. 63–67.
Eder E. B., Almonacid J. S., Delrieux C., Lewis M. N. (2022). Body volume and mass estimation of southern elephant seals using 3D range scanning and neural network models Mar. Mamm. Sci. 38 (3), 1037–1049
Erolin C. (2019). Interactive 3D digital models for anatomy and medical education (1-16: Biomedical visualisation).
Falkingham P. L. (2012). Acquisition of high resolution three-dimensional models using free, open-source, photogrammetric software. Palaeontologia electronica 15 (1), 15. doi: 10.26879/264
Farriol M., Rosselló J., Schwartz S. (1997). Body surface area in sprague-dawley rats. J. Anim. Physiol. Anim. Nutr. 77 (1-5), 61–65. doi: 10.1111/j.1439-0396.1997.tb00738.x
Fernandez J. C., Mounier L., Pachon C. (2005). “A model-based approach for robustness testing,” in IFIP international conference on testing of communicating systems (Springer, Berlin, Heidelberg), 333–348.
Fish F. E., Beneski J. T., Ketten D. R. (2007). Examination of the three-dimensional geometry of cetacean flukes using computed tomography scans: hydrodynamic implications. Anatomical Rec. 290 (6), 614–623. doi: 10.1002/ar.20546
Fish F., Lauder G. V. (2017). Control surfaces of aquatic vertebrates: active and passive design and function. J. Exp. Biol. 220, 4351–4363. doi: 10.1242/jeb.149617
Fontanella J. E., Fish F. E., Rybczynski N., Nweeia M. T., Ketten D. R. (2011). Three-dimensional geometry of the narwhal (Monodon monoceros) flukes in relation to hydrodynamics. Mar. Mamm. Sci. 27 (4), 889–898
Galatius A., Jespersen Å. (2005). Bilateral directional asymmetry of the appendicular skeleton of the harbor porpoise (Phocoena phocoena). Mar. mammal Sci. 21 (3), 401–410. doi: 10.1111/j.1748-7692.2005.tb01240.x
Gillooly J. F., Brown J. H., West G. B., Savage V. M., Charnov E. L. (2001). Effects of size and temperature on metabolic rate. Science 293, 2248–2251. doi: 10.1126/science.1061967
Gray P. C., Bierlich K. C., Mantell S. A., Friedlaender A. S., Goldbogen J. A., Johnston D. W. (2019). Drones and convolutional neural networks facilitate automated and accurate cetacean species identification and photogrammetry. Methods Ecol. Evol. 10 (9), 1490–1500. doi: 10.1111/2041-210X.13246
Haley M. P., Deutsch C. J., Boeuf B. J. L. (1991). A method for estimating mass of large pinnipeds. Mar. Mammal Sci. 7 (2), 157–164. doi: 10.1111/j.1748-7692.1991.tb00562.x
Heritage G., Hetherington D. (2007). Towards a protocol for laser scanning in fluvial geomorphology. Earth Surface Processes Landforms: J. Br. Geomorphological Res. Group 32 (1), 66–74. doi: 10.1002/esp.1375
Hodgson J. C., Holman D., Terauds A., Koh L. P., Goldsworthy S. D. (2020). Rapid condition monitoring of an endangered marine vertebrate using precise, non-invasive morphometrics. Biol. Conserv. 242, 108402. doi: 10.1016/j.biocon.2019.108402
Hohl R., de Oliveira R. B., Vaz de Macedo D., Brenzikofer R. (2007). Apparatus for measuring rat body volume: a methodological proposition. J. Appl. Physiol. 102 (3), 1229–1234. doi: 10.1152/japplphysiol.00744.2006
Hughes S. W. (2005). Archimedes Revisited: a faster, better, cheaper method of accurately measuring the volume of small objects. Phys. Educ. 40 (5), 468. doi: 10.1088/0031-9120/40/5/008
Irschick D. J., Christiansen F., Hammerschlag N., Martin J., Madsen P., Wyneken J., et al. (2022). 3D visualization processes for recreating and studying organismal form. Iscience, 104867. doi: 10.1016/j.isci.2022.104867
Irschick D. J., Martin J., Siebert U., Kristensen J. H., Madsen P. T., Christiansen F. (2021). Creation of accurate 3d models of harbor porpoises (Phocoena phocoena) using 3d photogrammetry. Mar. Mammal Sci. 37 (2), 482–491. doi: 10.1111/mms.12759
Jackson A. S., Manafas C., Tzimiropoulos G. (2018). “3d human body reconstruction from a single image via volumetric regression,” in In Proceedings of the European Conference on Computer Vision (ECCV) Workshops. 0–0.
Jaquet N. (2006). A simple photogrammetric technique to measure sperm whales at sea. Mar. Mammal Sci. 22, 862–879. doi: 10.1111/j.1748-7692.2006.00060.x
Jefferson T. A., Robertson K. M., Wang J. Y. (2002). Growth and reproduction of the finless porpoise in southern China. Raffles Bull. Zoology 50, 105–114.
Jensen M. M., Saladrigas A. H., Goldbogen J. A. (2017). Comparative three-dimensional morphology of baleen: cross-sectional profiles and volume measurements using CT images. Anatomical Rec. 300 (11), 1942–1952. doi: 10.1002/ar.23648
Jordan M. I., Mitchell T. M. (2015). Machine learning: Trends, perspectives, and prospects. Science 349 (6245), 255–260. doi: 10.1126/science.aaa8415
Koopman H. N., Pabst D. A., Mclellan W. A., Dillaman R. M., Read A. J. (2002). Changes in blubber distribution and morphology associated with starvation in the harbor porpoise (Phocoena phocoena): evidence for regional differences in blubber structure and function. Physiol. Biochem. Zoology 75 (5), 498–512. doi: 10.1086/342799
Kot B. C., Chan D. K., Yuen A. H., Tsui H. C. (2018). Diagnosis of atlanto-occipital dissociation: standardised measurements of normal craniocervical relationship in finless porpoises (genus neophocaena) using postmortem computed tomography. Sci. Rep. 8 (1), 1–8. doi: 10.1038/s41598-018-26866-8
Kot B. C., Tsui H. C., Chung T. Y., Cheng W. W., Mui T., Lo M. Y., et al. (2020). Photogrammetric three-dimensional modeling and printing of cetacean skeleton using an omura's whale stranded in Hong Kong waters as an example. JoVE (Journal Visualized Experiments) 163), e61700. doi: 10.3791/61700
Langley P. (2011). The changing science of machine learning. Mach. Learn. 82 (3), 275–279. doi: 10.1007/s10994-011-5242-y
Le Boeuf B. J., Laws J. M. (1994). Elephant seals: population ecology, behavior and physiology (downtown Oakland, California: University of California Press).
Lewis R., Dawson S., Rayment W. (2021). Size structure of broadnose sevengill sharks (Notorynchus cepedianus) in sawdust bay, Rakiura/Stewart island, estimated using underwater stereo-photogrammetry. New Z. J. Mar. Freshw. Res., 1–15. doi: 10.1080/00288330.2021.1968010
Lockyer C. H., McConnell L. C., Waters T. D. (1985). Body condition in terms of anatomical and biochemical assessment of body fat in north Atlantic fin and sei whales. Can. J. Zoology 63 (10), 2328–2338. doi: 10.1139/z85-345
Luque S. P., Aurioles-Gamboa D. (2001). Sex differences in body size and body condition of California sea lion (Zalophus californianus) pups from the gulf of California. Mar. Mammal Sci. 17 (1), 147–160. doi: 10.1111/j.1748-7692.2001.tb00985.x
Machado A., Cantor M. (2022). A simple tool for linking photo-identification with multimedia data to track mammal behaviour. Mamm. Biol. 102 (3), 961–971. doi: 10.1007/s42991-021-00189-0
Malakhov V. V. (2004). Origin of bilateral-symmetrical animals (Bilateria). Zhurnal obshchei biologii 65 (5), 371–388.
Marino L., Murphy T. L., Gozal L., Johnson J. I. (2001). Magnetic resonance imaging and three-dimensional reconstructions of the brain of a fetal common dolphin, Delphinus delphis. Anat. Embryol 203 (5), 393–402. doi: 10.1007/s004290100167
Miller P., Narazaki T., Isojunno S., Aoki K., Smout S., Sato K. (2016). Body density and diving gas volume of the northern bottlenose whale (Hyperoodon ampullatus). J. Exp. Biol. 219 (16), 2458–2468. doi: 10.1242/jeb.137349
Moya-Laraño J., Macías-Ordóñez R., Blanckenhorn W. U., Fernández-Montraveta C. (2008). Analysing body condition: mass, volume or density? J. Anim. Ecol. 77 (6), 1099–1108. doi: 10.1111/j.1365-2656.2008.01433.x
Nelms S. E., Alfaro-Shigueto J., Arnould J. P., Avila I. C., Nash S. B., Campbell E., et al. (2021). Marine mammal conservation: over the horizon. Endangered Species Res. 44, 291–325. doi: 10.3354/esr01115
Norris K. S. (1961). Standarized methods for measuring and recording data on the smaller cetaceans. J. Mammal 42 (47), 1–476. doi: 10.2307/1377364
Nowacek D. P., Johnson M. P., Tyack P. L., Shorter K. A., McLellan W. A. (2001). Buoyant balaenids: the ups and downs of buoyancy in right whales. Proc. R. Soc. London. Ser. B: Biol. Sci. 268 (1478), 1811–1816. doi: 10.1098/rspb.2001.1730
Porter W. P., Kearney M. (2009). Size, shape, and the thermal niche of endotherms. Proc. Natl. Acad. Sci. 106 (Supplement 2), 19666–19672. doi: 10.1073/pnas.0907321106
Rabosky D. L., Santini F., Eastman J., Smith S. A., Sidlauskas B., Chang J., et al. (2013). Rates of speciation and morphological evolution are correlated across the largest vertebrate radiation. Nat. Commun. 4 (1), 1–8. doi: 10.1038/ncomms2958
Ramanujan S. (2011). Notebooks (2 volumes), tata institute of fundamental research, bombay 1957. MR, 20, 6340.morphometrics. Mar. Mammal Sci. 13 (4), 669–682.
Ryg M., Smith T. G., Øritsland N. A. (1988). Thermal significance of the topographical distribution of blubber in ringed seals (Phoca hispida). Can. J. Fisheries Aquat. Sci. 45 (6), 985–992. doi: 10.1139/f88-121
Saito S., Simon T., Saragih J., Joo H. (2020). “Pifuhd: multi-level pixel-aligned implicit function for high-resolution 3d human digitization,” in Proceedings of the IEEE/CVF Conference on Computer Vision and Pattern Recognition. 84–93.
Schmidt-Nielsen K. (1972). Locomotion: energy cost of swimming, flying, and running. Science 177 (4045), 222–228. doi: 10.1126/science.177.4045.222
Suchocki C., Katzer J. (2018). Terrestrial laser scanning harnessed for moisture detection in building materials–problems and limitations. Automation Construction 94, 127–134. doi: 10.1016/j.autcon.2018.06.010
Toxvaerd S. (2021). The emergence of the bilateral symmetry in animals: a review and a new hypothesis. Symmetry 13 (2), 261. doi: 10.3390/sym13020261
Waite J. N., Schrader W. J., Mellish J. A. E., Horning M. (2007). Three-dimensional photogrammetry as a tool for estimating morphometrics and body mass of steller sea lions (Eumetopias jubatus). Can. J. Fisheries Aquat. Sci. 64 (2), 296–303. doi: 10.1139/f07-014
Warton D. I., Duursma R. A., Falster D. S., Taskinen S. (2012). Smatr 3-an r package for estimation and inference about allometric lines. Methods Ecol. Evol. 3 (2), 257–259. doi: 10.1111/j.2041-210X.2011.00153.x
Williams T. M. (1999). The evolution of cost efficient swimming in marine mammals: limits to energetic optimization. Philos. Trans. R. Soc. London. Ser. B: Biol. Sci. 354 (1380), 193–201. doi: 10.1098/rstb.1999.0371
Woodward B. L., Winn J. P., Fish F. E. (2006). Morphological specializations of baleen whales associated with hydrodynamic performance and ecological niche. J. Morphol. 267, 1284–1294. doi: 10.1002/jmor.10474
Wu C. Y., Nowacek D. P., Nousek-McGregor A. E., McGregor R., Howle L. E. (2021). Computational fluid dynamics of flow regime and hydrodynamic forces generated by a gliding north Atlantic right whale (Eubalaena glacialis). Mar. Mammal Sci. 37 (3), 826–842. doi: 10.1111/mms.12798
Würsig B., Jefferson T. A. (1990). Methods of photo-identification for small cetaceans. Rep. Int. Whaling Commission. Special 12, 42–43. doi: 10.1126/science.198.4318.755
Würsig B., Würsig M. (1977). The photographic determination of group size, composition, and stability of coastal porpoises (Tursiops truncatus). Science 198 (4318), 755–756.
Keywords: 3D model, body volume, body density, elliptical shape, finless porpoise, morphology, three-dimensional, validation
Citation: Zhang C, Zhou H, Christiansen F, Hao Y, Wang K, Kou Z, Chen R, Min J, Davis R and Wang D (2023) Marine mammal morphometrics: 3D modeling and estimation validation. Front. Mar. Sci. 10:1105629. doi: 10.3389/fmars.2023.1105629
Received: 22 November 2022; Accepted: 07 June 2023;
Published: 23 June 2023.
Edited by:
Jose Carlos Báez, Spanish Institute of Oceanography (IEO), SpainReviewed by:
Ghulam Nabi, Hebei Normal University, ChinaBingyao Chen, Nanjing Normal University, China
Pavel Gol’din, National Academy of Sciences of Ukraine (NAN Ukraine), Ukraine
Copyright © 2023 Zhang, Zhou, Christiansen, Hao, Wang, Kou, Chen, Min, Davis and Wang. This is an open-access article distributed under the terms of the Creative Commons Attribution License (CC BY). The use, distribution or reproduction in other forums is permitted, provided the original author(s) and the copyright owner(s) are credited and that the original publication in this journal is cited, in accordance with accepted academic practice. No use, distribution or reproduction is permitted which does not comply with these terms.
*Correspondence: Yujiang Hao, aGFvLnlqQGloYi5hYy5jbg==
†ORCID: Haojie Zhou, orcid.org/0009-0006-0314-903X