 Gaël Lavialle1
 Dorothée Kopp
 Maud A. Mouchet
- 1UMR MNHN-SU-CNRS 7204 CESCO, Paris, France
- 2UMR IFREMER-INRAE-Institut Agro DECOD, Lorient Cedex, France
Introduction: Coastal and continental shelf ecosystems are among the most productive, yet exploited, ecosystems. The Grande Vasière (GV) covers most part of the French Northern part of the Bay of Biscay, a crucial fishing ground for metropolitan France. It is the place of numerous uses, especially fishing, and will soon shelter sand extraction activities and offshore windfarms. All these activities may compete for space and resources and put pressure on habitats, biodiversity and subsequent ecosystem services (ES). Current management strategies integrate these activities and biodiversity conservation schemes but no ES.
Methods: To fill that gap, we quantified and mapped nine indicators of ecosystem processes (EP), used as proxies of four ES (i.e. sea food provisioning, biological control, regulation of environmental conditions and life cycle maintenance). Due to the complexity of ES, we investigated several EP by ES. Then we identified hotspots and coldspots of supply and spatial overlap among EP and other uses (conservation, fishing, offshore windfarms and sand extraction).
Results: EP mapping suggests a higher capacity of supply of the chosen ES in the Northern part of the GV. We found a strong spatial heterogeneity among the EP related to the same ES, underlining a point of vigilance when designing management measures to sustain ES supply. Northern EP hotspots overlap with high amounts of bottom trawl fishing effort. Higher levels of commercial species diversity and sole spawning grounds in the South overlap with higher amounts of gillnet fishing effort. Areas of sand extraction prospection and offshore windfarms under construction should not overlap with hotspots of EP, at the exception of the sole spawning ground and the commercial species diversity hotspots. Finally, we highlight an overlap of more than 20% of four EP hotspots with Natura 2000 areas, while the Marine Natural Park in the South covers more EP coldspots (i.e. hake nursery, encounter rate, trophic links diversity) than hotspots.
Discussion: Incorporating such a multifunctional spatial approach with hotspots and coldspots opens new perspective for marine spatial planning, pointing out the potential strengths and weaknesses of areas currently defined or prioritized for future uses like conservation, sand extraction or emerging activities like offshore windfarms.
1 Introduction
“Bringing nature back into our lives” constitutes the main guidance of the European Union (EU) Biodiversity Strategy for 2030 (European Commission, 2020). It follows global environmental guidelines such as the Aichi Targets and the Sustainable Development Goals of the United Nations. They all emphasize the critical role of nature in providing contributions to people (Díaz et al., 2018) and urge to action by protecting and restoring the ecosystems’ capacity to supply Ecosystem Services (ES, i.e. those “benefits provided by ecosystems that contribute to making human life both possible and worth living”, Díaz et al., 2006). According to the framework developed by Villamagna et al. (2013), these services depend on upstream ecosystems’ functions and processes (e.g. microbial loop) delivering ES flows (e.g. nutrients transfer through the trophic web) which can be used by societies (e.g. fishermen, consumers, inhabitants on the coastal area). These functions and processes, hereafter called “Ecosystem Processes” (EP), are an important target for conservation since they beget “ES capacity” (Villamagna et al., 2013). Moreover, the authors underlined that human activities boosting the supply of ES, through fishing or agricultural practices for instance, can be a driver of pressure on ES capacity at the same time, leading to feedback loops and management trade-offs. Notwithstanding the fact that these activities may affect each EP differently.
To meet the objectives of restoration and protection of ES capacity in the marine realm, Marine Protected Areas (MPA) are widely used (Leenhardt et al., 2015), and promoted by the EU Biodiversity Strategy for 2030 (European Commission, 2020). The current European MPA network is implemented through the Habitats Directive (European Commission, 1992), the Birds Directive (European Commission, 2009) and the Marine Strategy Framework Directive (European Commission, 2008). The latter seeks to find spatial trade-offs and synergies between anthropogenic activities and ecosystem conservation through national spatial frameworks. Marine Spatial Planning (MSP) usually balances conservation purposes (e.g. vulnerable marine ecosystems, protected species or habitats) with human activities such as extracting biomass (e.g. fishing), materials (e.g. sand extraction) and energy (e.g. wind, current and wave energy). Integrating ES as objectives in MSP remains challenging (but see Picone et al., 2017; Galparsoro et al., 2021) because linking complex EP to supplied ES is cumbersome (Wallace, 2007; Villamagna et al., 2013; Hattam et al., 2015; Lillebø et al., 2016; Armoškaitė et al., 2020; Depellegrin et al., 2020). A common methodological strategy is to combine or sum several EP into an ES index (see Townsend et al., 2011; Townsend et al., 2014; Rullens et al., 2022), with the risk of biasing the estimation of ES supply in the case of non-additive effect between EP (e.g. antagonistic interactions, spatial or temporal discrepancies). Yet, selecting appropriate EP and ES indicators (Böhnke-Henrichs et al., 2013; von Thenen et al., 2020) or gathering spatial data at a fine scale (Liquete et al., 2013) often limits ES assessment and their use in MSP.
Along the French Atlantic coast, the Bay of Biscay supports many anthropogenic activities (e.g. fishing, marine transport, pleasure sailing). 75% of its total surface is occupied by a mid-shelf muddy and sandy area referred as the “Grande Vasière” (hereafter, GV). The GV is of particular importance for several emblematic French fisheries (especially Norway lobster and sole) and also shelters indicator species of vulnerable marine ecosystems, such as sea pens (Pennatula phosphorea). The upcoming projects of offshore windfarms and sand extraction will compete for space with current activities and conservation issues. Management goals of the recently adopted French spatial plans in this area do not explicitly include ES (French Ministry of Ecological and Solidarity Transition (FMEST), 2020a; French Ministry of Ecological and Solidarity Transition (FMEST), 2020b), probably linked to the lack of available data on ES supply in the GV. However, properly assessing biodiversity and ES is crucial to foresee potential spatial conflicts with human uses. Besides, if higher levels of species richness may supply a wider range of services (e.g. Brandt et al., 2014), literature also suggests that focusing on biodiversity protection only may not efficiently protect the supply of ecosystem services (e.g. Lindegren et al., 2018; Girardello et al., 2019). One reason is that the range and level of ES supply vary among habitats and functional groups leading to spatial mismatches among ES and between some ES and biodiversity, advocating for explicitly integrating ES alongside biodiversity targets in MSP. To that end, we developed and mapped 9 indicators begetting 4 ES provided by the bentho-demersal compartment of the GV ecosystem.
Specifically, we followed 4 main steps. First, we mapped relevant EP indicators by compiling all available data combined with statistical modelling tools. In our framework, each ES is assessed through several EP indicators. Second, we investigated the spatial aggregation of EP by delineating hotspots (i.e. areas with significantly higher values of a given EP) and coldspots (i.e. areas with significantly lower values of a given EP). Third, we identified positive and negative spatial associations between EP to inform on non-additive effects of EP in the assessment of ES and identify links between EP values and activities. Documenting EP associations and hotspots and coldspots are preparatory steps to cost-effective strategies for ES conservation. Finally, we assessed total EP hotspots and coldspots exposure to anthropogenic activities, as well as their spatial overlaps with existing MPAs. Indeed, identifying spatial congruence among EP hotspots and among EP hotspots/coldspots and biodiversity should promote a more efficient conservation measures by protecting several EP, therefore ES capacity, in the same area.
2 Materials and methods
2.1 The Grande Vasière and its bentho-demersal biodiversity
This study specifically focused on the bentho-demersal ecosystem of the GV located in the Northern part of the Bay of Biscay over a 21,500 km² mid-shelf mud belt (Bourillet et al., 2006; green dashed line on Figure 1).
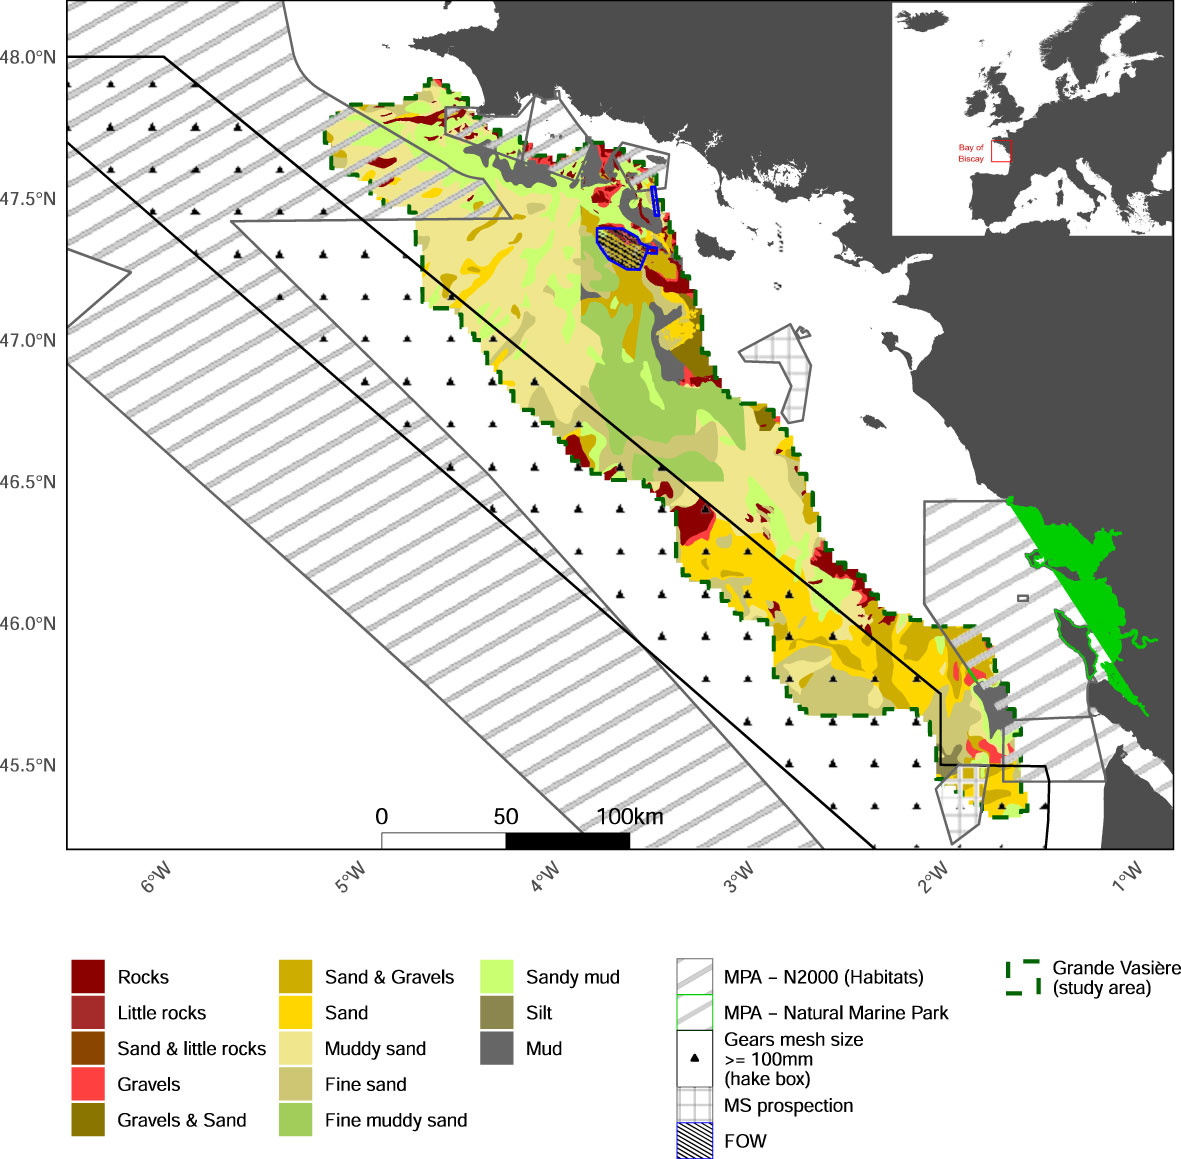
Figure 1 Map of the studied area, including types of sediments and main uses. MPA: Marine Protected Area; N2000: Natura 2000 area; MS: marine sand extraction; FOW: Floating Offshore Windfarm; hake box: managed area where gears with a mesh size inferior to 100 mm, except for vessels targeting Norway lobster, are excluded.
We compiled the data on bentho-demersal communities from two annual scientific surveys monitoring the GV. LANGOLF-TV is an underwater video survey which has been conducted each spring since 2014 in the GV for Norway lobster stock assessment (Vacherot et al., 2019). Available video footages from 2014 to 2018 were reanalyzed to identify all organisms visible. Video of the seabed are watched during 7 minutes and each species between two lasers (spaced 0.75 meters apart) is counted and identified at the lowest taxonomic level by visual inspection (Mérillet et al., 2018b). EVHOE, part of the International Bottom Trawl Survey, targets the demersal species between October and November in the Bay of Biscay and the Celtic Sea since 1997 (Laffargue et al., 2021). To fit the LANGOLF-TV temporal window, we selected the 2013-2019 period (in 2017, the survey was cancelled due to mechanical issue and no data was collected). During this survey, a GOV (Grande Ouverture Verticale) demersal trawl with a codend of 20 mm stretched mesh is towed during 30 minutes at a speed of ~3.5 knots. The total catch is weighted and sorted by species for counting and a subsample is put aside for length measurements, maturity stage identification and sexing. The species observed in the surveys are listed in Supplementary Material A. Sampling protocols, selection of species and predictions of their spatial distribution are detailed in Supplementary Material B. Over the available time series, 269 sites were sampled for EVHOE (860 for LANGOLF-TV), about 64,187 m² were swept for each operation (158 m² for LANGOL-TV) and the mean distance between sites was about 42 km (18 km for LANGOLF-TV).
To compute the several indicators presented below, we had to estimate the annual spatial biomass distribution of several taxa. To that end, we fitted Generalized Linear Models (GLMs) with spatial covariance structure and ordinary kriging with external drift on years over LANGOLF-TV and EVHOE data. We kept the 63 taxa that occurred at least in 30 stations and at least in half of the years included in each time series. When taxa were present in both surveys, we kept data from the survey that best sampled these taxa based on expert knowledge (Supplementary Material B). Regarding the GLM, we tested environmental (depth, current speed, temperature, sediment type, roughness and depth) and fishing (gillnets and bottom trawl fishing time) predictors (Supplementary Material C). Then, we compared the ability of both technics to predict taxon’s abundance by performing a Monte Carlo cross-validation with 200 iterations and selecting the model with the lower root mean square error. The full process is detailed in Supplementary Material B. Each taxon abundance was then predicted on the same spatial grid of 2.5 x 2.5 km (18 taxa by GLM or GLMM and 45 by kriging). To that end, we allocated values from the original grid of each predictor in each new pixel (“grid cell” hereafter) proportionally to their intersecting area. To approximate the total biomass, we used mean wet weights per individual by species from EVHOE and from the literature for two taxa from LANGOLF-TV absent in the EVHOE database (20 g for Pennatulacea from Murillo et al. (2018), i.e. Pennatulacea grandis, and 18 g for Spirographis spp from Currie et al. (2000), i.e. Sabella spallanzanii). Furthermore, we were not able to find the mean weights of two filter feeders from LANGOLF-TV (Alcyonacea and Crinoidea). We predicted each annual biomass values based on these weights. These predictions were then averaged to a mean annual biomass.
2.2 EP and ES indicators
Our overarching aim was to investigate the potential factors influencing ES capacity of the bentho-demersal GV ecosystem by identifying the potential spatial conflicts between uses and EP, as well as the spatial covariations between EP underpinning a given ES (Figure 2). We restricted our study to ecological processes underpinning the supply of ES (potential supply in some cases), and we did not address ES use or demand. First, we selected a list of candidate ES among existing marine classifications: sea food provisioning, biological control related to food web functioning, regulation of environmental-water and atmospheric-conditions related to nutrient cycling, regulation of seabed conditions-erosion, formation -, life cycle maintenance, coastal protection, gene pool protection as well as recreation (Böhnke-Henrichs et al., 2013; Liquete et al., 2013; Hattam et al., 2015). We identified 4 ES that were relevant to the GV according to 6 experts involved in the project, and that could be quantified, in other words, ES for which we had enough data on underpinning EP to design mappable indicators: sea food provisioning, biological control related to food web functioning, regulation of environmental conditions related to nutrient cycling and life cycle maintenance (Figure 2). The scarcity of data, sedimentary models and resolved phylogenetic tree for all taxa in our dataset was too limiting to make a robust assessment of regulation of seabed conditions and gene pool protection. Coastline protection and recreation were also disregarded in the absence of clear assumptions how the Grande Vasière supply services to beneficiaries located outside the studied area (i.e. most recreative activities are occurring on the coastline or inland, e.g. diving, museums and festivals, which are outside the GV perimeter).
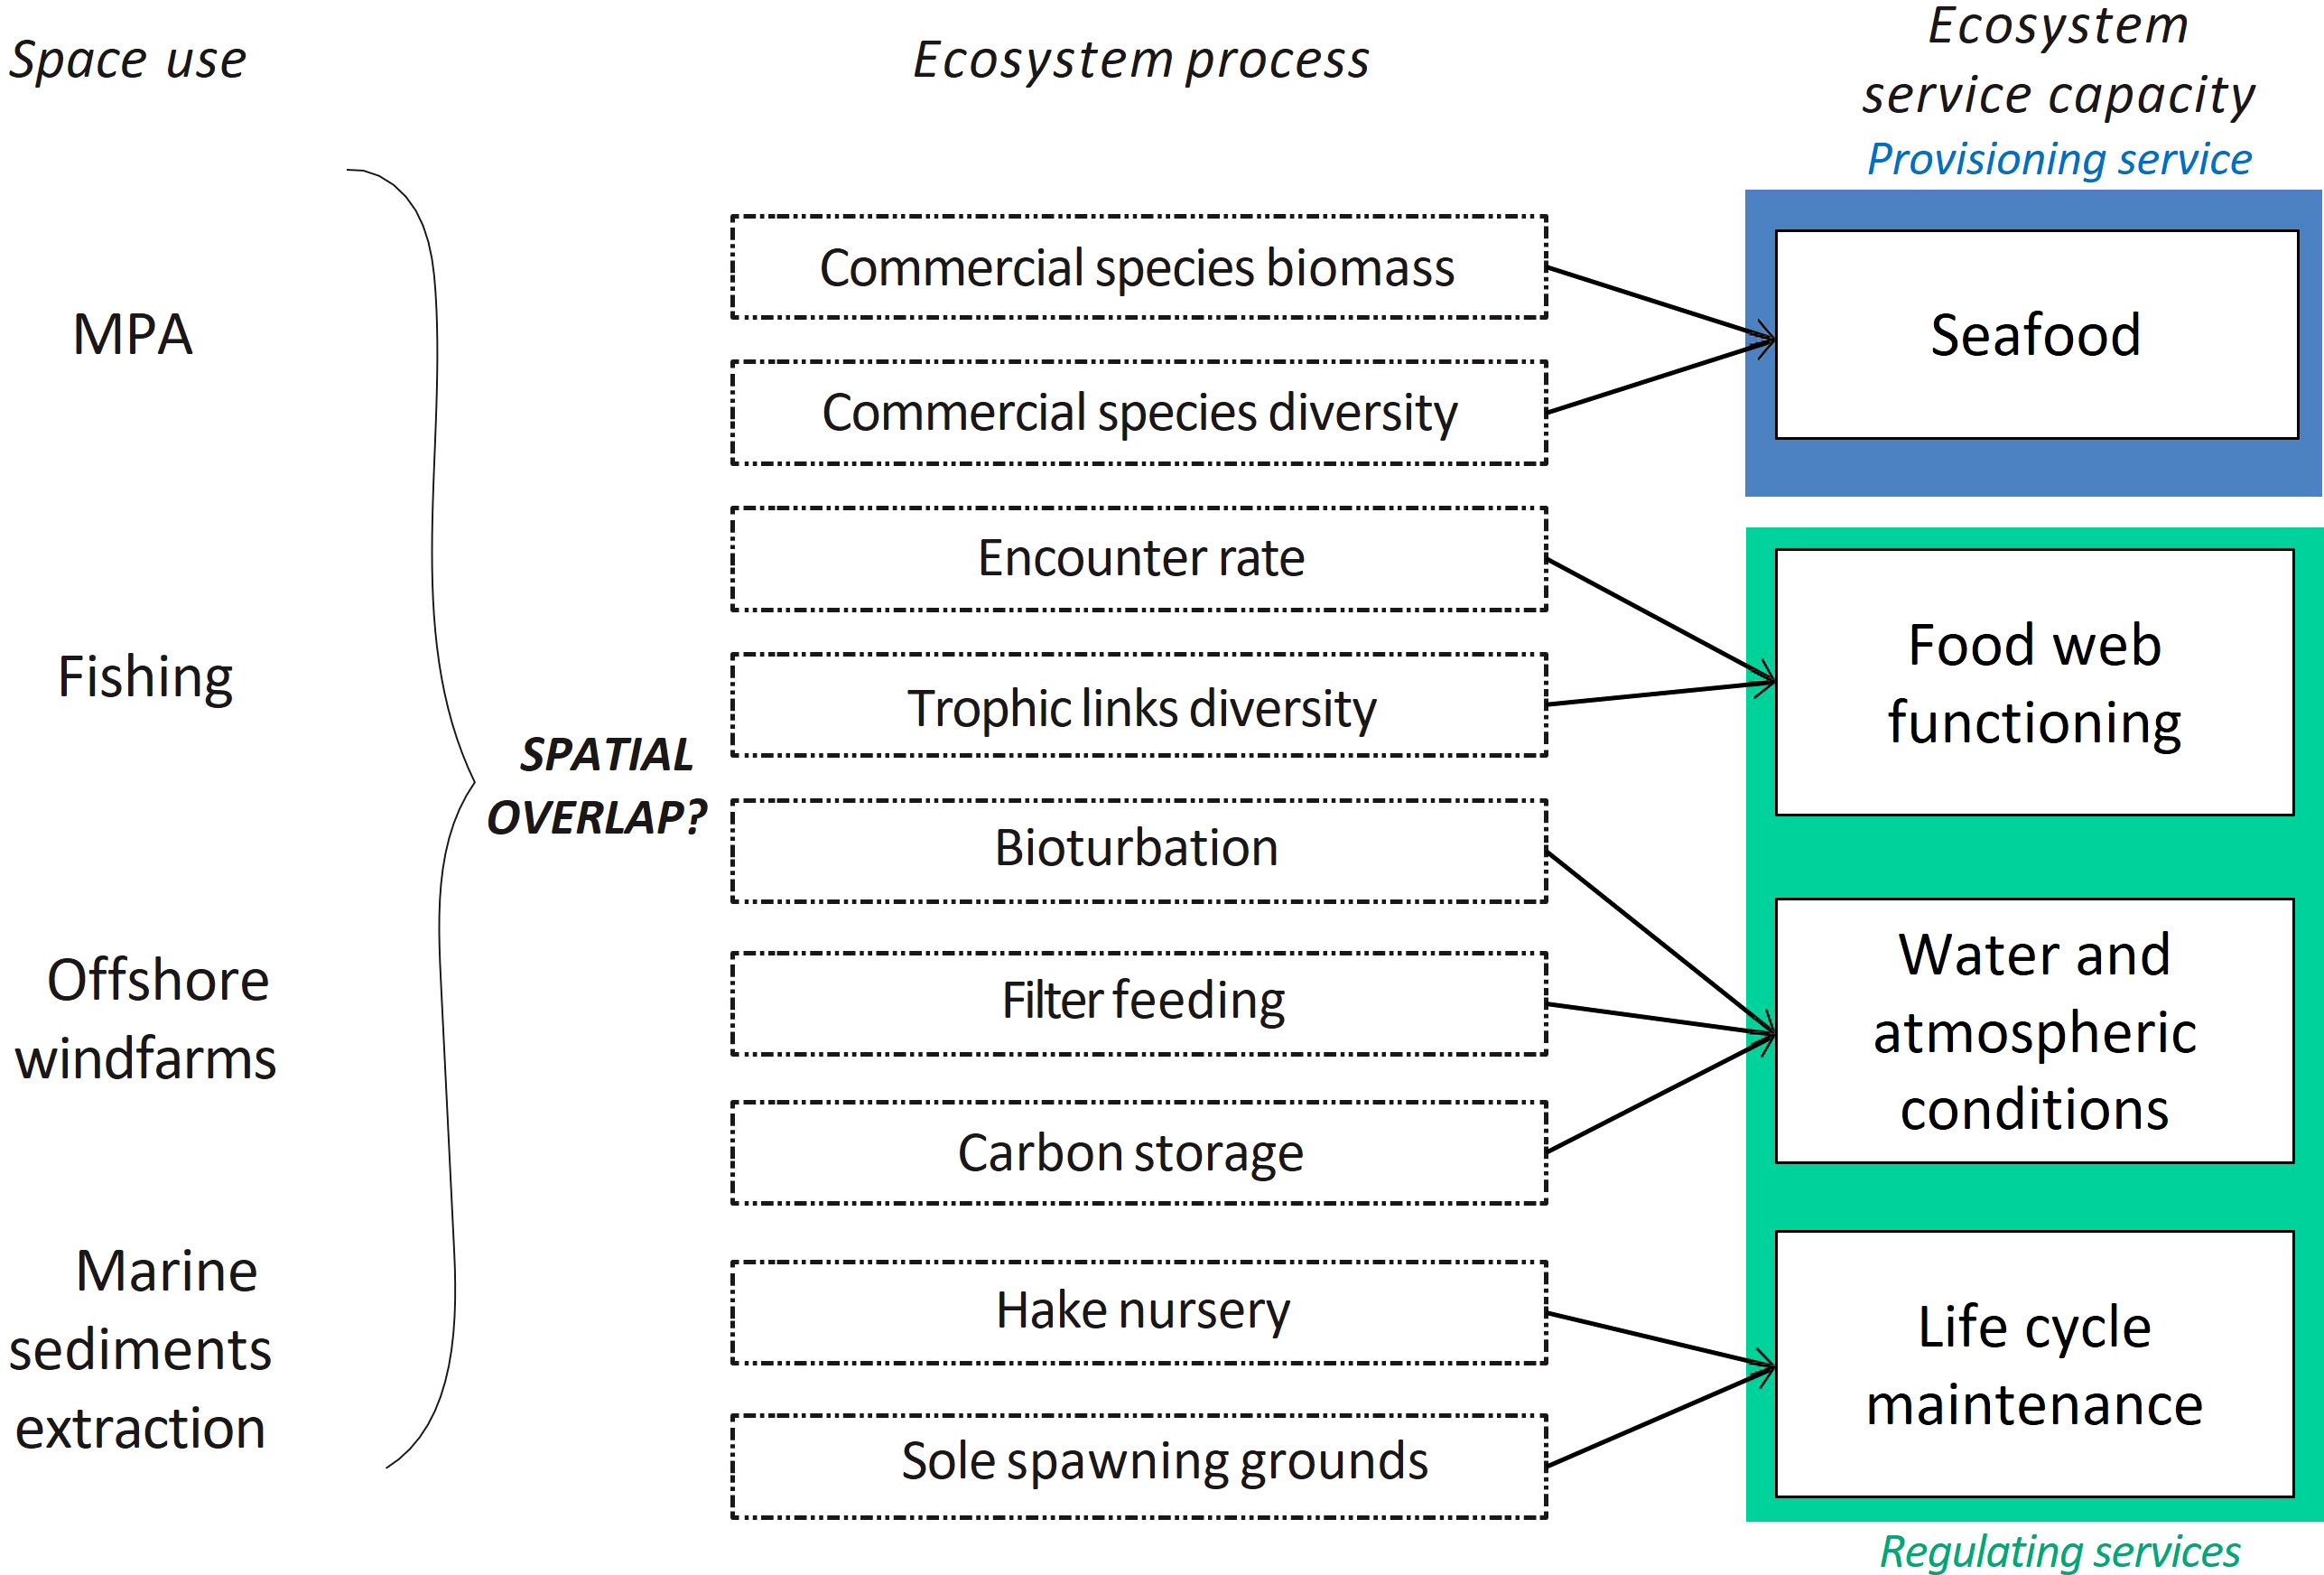
Figure 2 Links between Ecosystem Services (ES), Ecosystem Processes (EP) and uses (anthropogenic activities and MPAs). Categories of ES are based on Böhnke-Henrichs et al. (2013).
2.2.1 Sea food provisioning
Sea food provisioning directly relies on the amount and diversity of commercial taxa (Hattam et al., 2015). We measured the stock of commercial taxa with the estimated total biomass of 20 commercial taxa identified in the biodiversity datasets (P.1.1 in Table 1; see Supplementary Material A for the species’ list). Considering people’s preference for variety in their consumption behavior (Thiele and Weiss, 2003), we also estimated the diversity of commercial species as a component of this ES. We assumed that a high diversity of fished species would better satisfy the different societal demands for sea food. To that end, we calculated the Shannon’s index on the biomasses of commercial taxa (P.1.2 in Table 1). Shannon’s index is higher for higher levels of species richness and an even distribution of biomass across species (or taxa in our case).
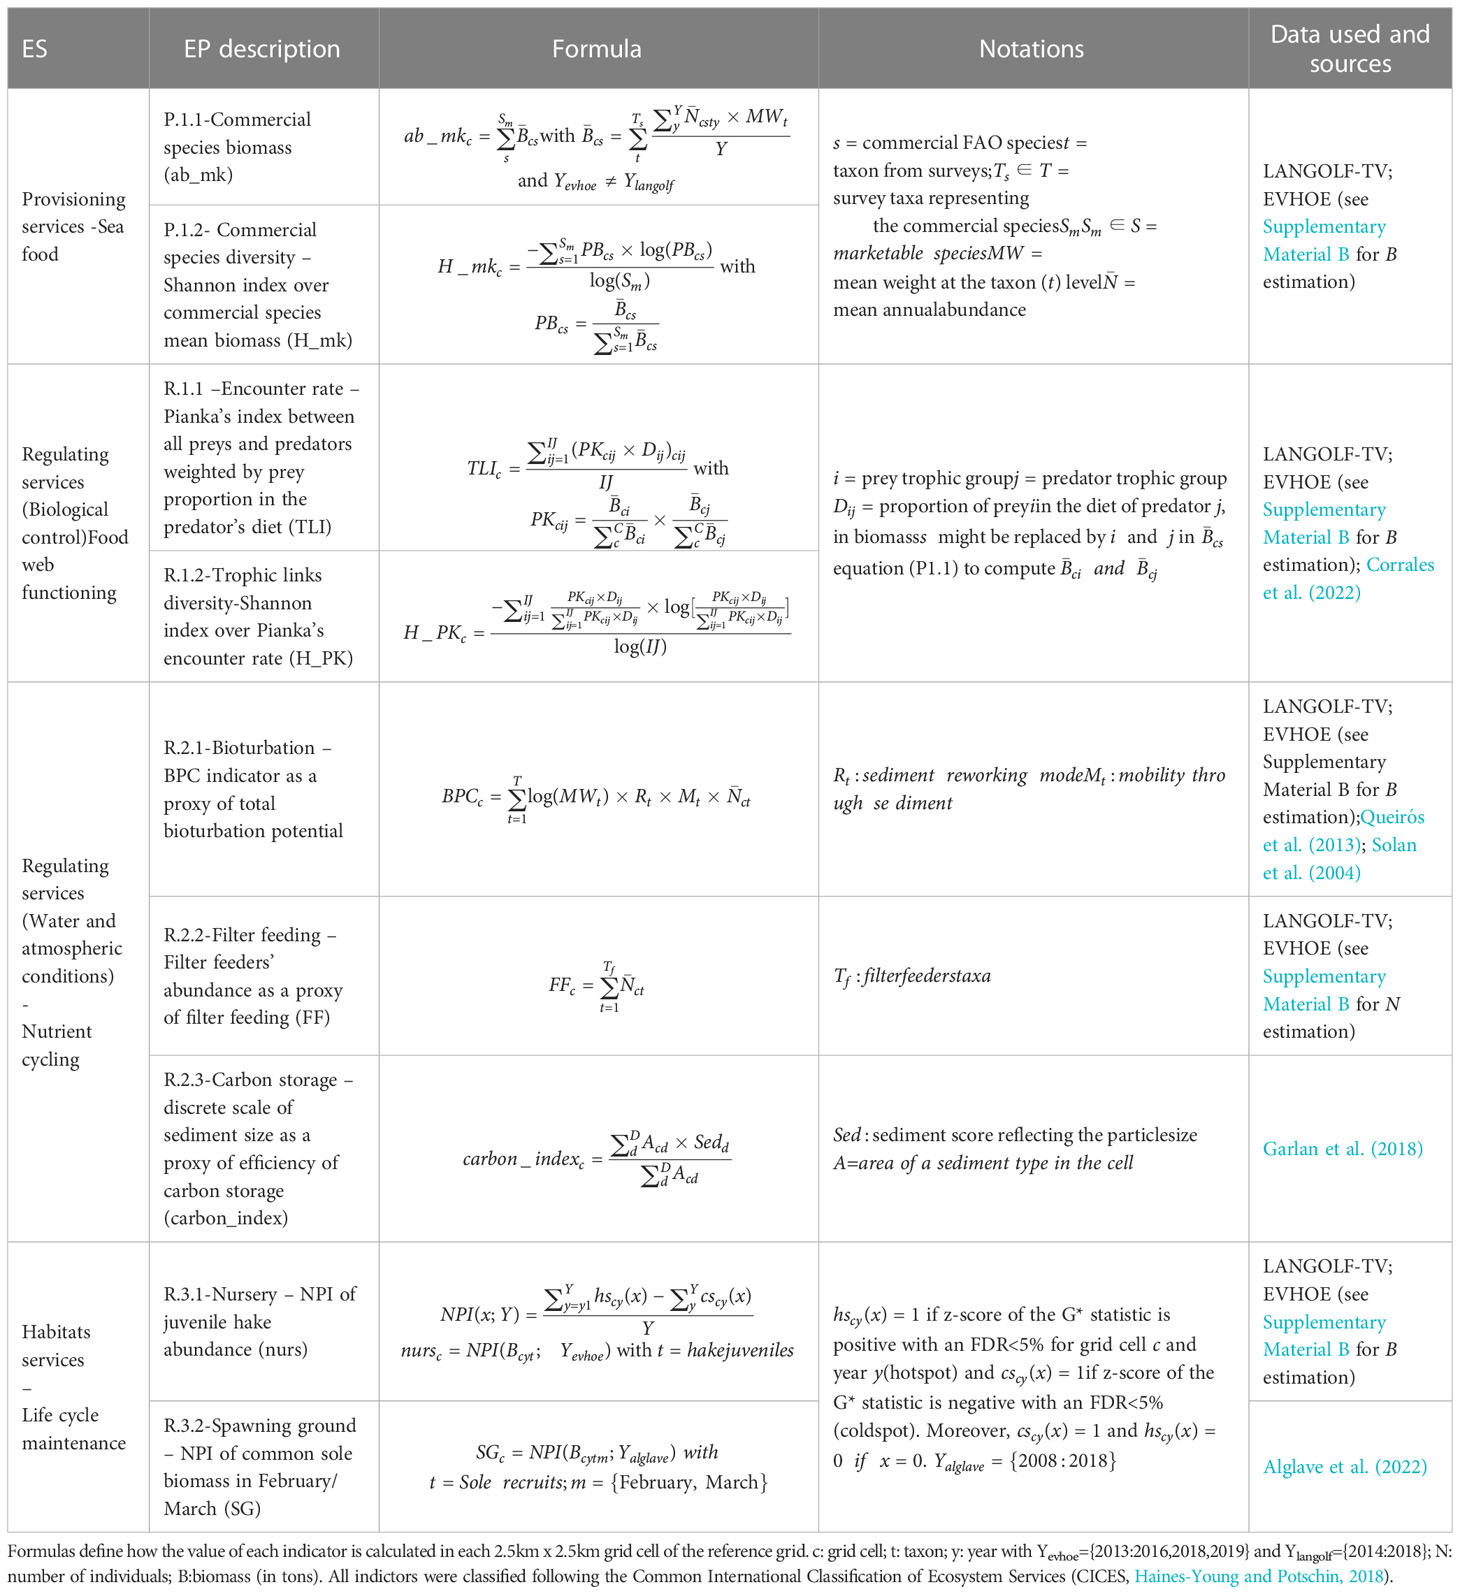
Table 1 List of ecosystem services (ES) evaluated using several ecosystem processes (EP).
2.2.2 Food web functioning
We identified two major ecological processes supporting food web functioning: the encounter of predators and preys and the diversity of trophic links. We postulated that a high overlap between the biomass of predators and prey should facilitate energy transfer through predation. Following Carroll et al. (2019), we used the Pianka’s index to measure the biomass-weighted encounter rate between each trophic group of prey and predator modeled with GLMs (R.1.1 in Table 1). Trophic groups were assigned to taxa’s biomass using the ECOPATH trophic boxes from Corrales et al. (2022); Supplementary Material A). To account for predator preferences (Vucic-Pestic et al., 2011), we weighted each Pianka’s index by the proportion of prey i in the diet of j () before being averaged over all preys and predators (R.1.1 in Table 1). Dij values are directly reported for each trophic group from the prey-predator matrix presented in the Supplementary materials 4 in Corrales et al. (2022). Note that can be lower than 1 because pelagic preys were not included in the study. Less weight is subsequently given to pelagic-prey dependent predators. Furthermore, trophic links diversity sustains food web stability by maintaining low energy transfer links (called “weak interactions” by the authors) between prey and predators (McCann et al., 1998; McCann, 2000; O’Gorman and Emmerson, 2009; Rooney and McCann, 2012). In addition, this metric allows to discriminate areas with a high diversity of trophic links by unit of surface. Finally, to estimate the diversity of trophic links while accounting for the evenness or dominance of predator/prey links (i.e. P.1.2), we calculated the Shannon’s index of these trophic links by replacing the relative proportion of species by values of Pianka’s index (R.1.2; Table 1). It allows to identify areas with numerous trophic links and an overlaying biomass equitably distributed between the prey-predator pairs from areas with numerous links but dominated by some prey-predator pairs.
2.2.3 Regulation of water and atmospheric conditions
We identified 3 main processes, based on nutrient cycling and storage, contributing to the regulation of environmental conditions in the GV: bioturbation, filter feeding and carbon storage. We chose to group all three EP indicators under “regulation of environmental conditions” because of their dependency upon nutrient cycling and storage. It is worth noting that bioturbation and filter feeding contribute to water purification (and ocean nourishment according to Liquete et al., 2013) while carbon storage to atmospheric conditions (according to the Common International Classification of Ecosystem Services – CICES, Haines-Young and Potschin, 2018).
The GV is influenced by sedimentation through winter storms and river flows (Le Loc’h, 2004), also providing nutrient loading and organic matter (Dubosq et al., 2021). We assumed that bioturbation and filter feeding play a role in the trophic chain by recycling these nutrients and biomass through microbial activity stimulation. Indeed, bioturbators and suspension feeders stimulate the microbial loop (Mermillod-Blondin, 2011; Norkko et al., 2015) and place labile organic matter at the disposal of microbial communities through feces deposited in the sediment (Middelburg, 2019). We assessed invertebrate’s bioturbation using the BPC index (Solan et al., 2004) which measures the potential quantity of bioturbated sediment for each taxon by multiplying the logarithm of its mean weight, its sediment reworking mode, its mobility through the sediment and its abundance (R.2.1; Table 1). The reworking mode and mobility through the sediment are estimated by discrete scales going respectively from 1 (bioturbation at sediment-water interface) to 4 (regenerators that excavate holes) and from 1 (living in a fixed tube) to 5 (free movement via a burrow system), respectively. We used values estimated by Queirós et al. (2013) for 20 invertebrate taxa from surveys and expert knowledge for the remaining species. Each cell value of the total bioturbation potential was given by the sum of the bioturbation potential of each taxon occurring in the cell. In the absence of data on filtration rate or mean weights for several filter feeders, we used the total abundance of the filter feeders Hydrozoa, Crinoidea, Pennatulacea, Actiniaria, Spirographis spp and Alcyonacea from the LANGOLF-TV survey as proxy of the filter feeding process (R.2.2 in Table 1; Kenchington et al., 2020).
Carbon storage is enhanced by fine grain size sediment (Middelburg, 2019) which traps organic carbon in anoxic conditions (Dubosq et al., 2021). Indeed, mud patches exposed to river flows on continental shelves are known to be carbon sinks due to a high accumulation of fine sediments and low hydrodynamic intensity, resulting in low degradation of organic carbon by bacteria (Yao et al., 2014; Dubosq et al., 2021). Thus, we used sediment distribution as a proxy of the ability of each sediment type to store residual carbon. We defined categories of sediments using a discrete linear scale ranging from 0 to 7, related to grain size (0 being rocky substrates, 4 being sand and 7 being mud (silt and clay), see Supplementary Material D). The final score was given by the average score weighted the area each category in a given grid cell (R.2.3, Table 1).
2.2.4 Life cycle maintenance
Life cycle maintenance mainly relies on seed dispersal and nurseries. According to the literature, we identified two well-established functional areas in the GV: hake (Merluccius merluccius) nursery areas located in the North of the area (Alvarez et al., 2001; Alvarez et al., 2004; Mahé et al., 2007; Woillez et al., 2007) and sole (Solea solea) spawning grounds in the South and West (Arbault et al., 1986; Koutsikopoulos and Lacroix, 1992; Petitgas, 1997; Mahé et al., 2007). We estimated juvenile hake abundance from EVHOE by filtering individuals with a body length inferior to 42.85 cm (L50 from ICES, 2016). Then, juvenile hakes were treated as a separate taxon when modelling the spatial distribution of hake’s biomass. In the absence of data on juvenile soles, we used data available on adult soles in the area and during the reproduction period. Spatialized monthly sole biomass data were estimated through Bayesian models applied to fishing and biodiversity datasets following (Alglave et al., 2022). We performed a Net Persistence Index (NPI), adapted from Colloca et al. (2009) and Milisenda et al. (2021), to identify the persistent hotspots and coldspots of juvenile hake’s annual abundance and adult sole’s biomass during February and March. The definition of a hotspot and coldspot is given below. NPI is the proportion of years the grid cell has been selected as a hotspot minus the proportion of years as a coldspot. The output maps show the areas with repeatedly high values over years of juvenile hakes’ abundance and adult soles’ biomass.
2.3 Hotspots/coldposts of ES supply and spatial covariations among EP
The hotspots and coldspots of EP correspond to significantly high and low (grid cell) values of EP, respectively. To identify these hotspots and coldspots, we used the Getis-Ord local G* statistic, a z-score normally distributed (Getis and Ord, 1992; Getis and Ord, 2010). For each grid cell, it compares the average value of the focal cell and its neighboring cells to the overall mean cell value of the GV. When the local mean is positive (or negative) and significantly different from the global mean, then it depicts a hotspot (or a coldspot). To account for multiple comparisons in means testing, the False Discovery Rate (FDR) was applied. FDR is calculated by applying the Benjamini and Hochberg’s procedure with a threshold α of 5% (Benjamini and Hochberg, 1995). FDR is preferred to family-wise error rate corrections (e.g. Bonferroni correction) which are too conservative when applied to multiple comparisons (Caldas de Castro and Singer, 2006). We used the ‘spdep’ R package (Bivand and Wong, 2018; version 1.1-12) to perform this procedure on each of the 9 EP indicators. Then, we combined maps of EP hotspots (and coldspots) and existing MPAs of the GV to visually inspect overlaps. Finally, we approximated the global ecosystem service supply by calculating, then mapping, the total ecosystem process value as the sum of EP in each grid cell, following the Total Ecosystem Service Value (or TESV) index developed by Maes et al. (2012). To that purpose, ecosystem process values were standardized between 0 and 1 by dividing each value by the maximum observed value for the given EP. Then, we further identified significantly higher and lower values of the total ecosystem process value using the Getis-Ord local G* statistic and FDR, as proxies of hotspots and coldspots of the overall ecosystem services supply.
One step further, we identified spatial associations (also called bundles; see Mouchet et al., 2014 for methodological details) of EP using a Principal Component Analysis (PCA). We used the ‘PCA’ function from the ‘FactoMineR’ R package (Lê et al., 2008; version 2.4). We deduced spatial covariations among EP from correlations between EP and PCA axes (i.e. we assumed that two or more EP highly correlated to the same axis, spatially covary). Then, we extracted the coordinates of grid cells of the four first PCA axes (i.e. axes with an eigenvalue higher or equal to 1) to build heatmaps revealing the spatial covariation among EP.
2.4 Assessing the spatial congruence or mismatch between human activities, conservation scheme and ecosystem processes
Norway lobster and demersal fish bottom trawlers (respectively, 72% and 62% of the landed biomass), hake and sole gillnetters (respectively, 20% and 25% of the landed biomass) are the dominating and long-lasting, fishing activities in the GV. Danish Seine fishing effort has increased (by circa. 3%), especially as a result of diversification strategies of pelagic trawlers since the mid-2000’s. In the last decades, other activities have been deployed or are under development. The Southern part of the GV is particularly regarded as high potential area for Floating Offshore Windfarm (FOW) and Marine Sand extraction (MS) by the French maritime and coastline strategy. Fishing, floating offshore windfarms and marine sand extraction in the GV are likely to interact with one or more ES. Notwithstanding that fishing is at the same time a vector of ES supply (Díaz et al., 2015) and a pressure on benthic ecosystem (Rijnsdorp et al., 2016; Hiddink et al., 2019).
The GV is partially covered by Marine Protected Areas (MPA) in the North (Talus du Golfe de Gascogne, Roches de Penmarch, Archipel des Glénan, Trévignon are under the Natura 2000 Habitats Directive) and in the South (Gironde estuary and Pertuis sea Marine Nature Park that encompasses several Natura 2000 areas). Conservation measures and targets focusing on benthic habitats in the N2000 areas are still pending the results of the ongoing risk assessment between fishing activities and habitats. However, the legislative framework differs between the Natura 2000 (N2000) and the Marine Nature Park, i.e. the Marine Nature Park can reject the settlement of new activities (e.g. marine sand extraction). A third managed area, the “hake box” area (European Commission, 2002), exclude all gears with a mesh size inferior to 100 mm, except for vessels targeting Norway lobster if they have a 100 mm square mesh panel (European Parliament and Council, 2019). Maps of N2000 areas and the Marine Nature Park have been retrieved from the INPN website (https://inpn.mnhn.fr).
Geolocated fishing effort between 2016 and 2020 registered with the Vessel Monitoring System (VMS) were provided by the French Directorate of Marine Fisheries and Aquaculture (DGAMPA) and IFREMER. This dataset contains position, trajectory and speed of fishing vessels as well as sales notes and fishing logbooks. The collection of these data is mandatory for vessels superior to 12 meters in the European Union. These data were processed by the SACROIS algorithm (Système d’Information Halieutique (SIH), 2017) that deduces VMS fishing time from vessel speed (< 4.5 knots) and the distance to the nearest harbors, aggregated at a 0.05°x 0.05° resolution. After resampling raw data to fit our 2.5 x 2.5 grid, we calculated mean annual fishing time (in hours) by gear and grid cell. We split fishing time between active bottom gears (bottom trawl and Danish seine) and gillnets, which are the main fishing gears used on the area. We used the same method as EP to identify hotspots and coldspots of fishing (active bottom gears and gillnets).
Prospection for marine sand extraction is already occurring and should remain restricted to this area. A floating offshore windfarm project in the North-West of the GV, however, is also ongoing but its size and exact location are unknown at this early stage. Therefore, we used information and maps included in French spatial plans (French Ministry of Ecological and Solidarity Transition (FMEST), 2020a; French Ministry of Ecological and Solidarity Transition (FMEST), 2020b) to delineate the spatial limits of areas potentially occupied by marine sand extraction and floating offshore windfarms. Then, we intersected these areas with the 2.5 x 2.5 grid. Grid cell values range from 0 to 1 depending on the proportion of the cell covered by the potential floating offshore windfarms or marine sand extraction area (0 = no floating offshore windfarm or marine sand extraction planned in the cell, 1 = the cell is entirely concerned by floating offshore windfarm or marine sand extraction projects).
Finally, we calculated the area proportion of each of EP hotspot and coldspot intersecting MPAs, floating offshore windfarm area, prospection area for marine sand extraction and hotspots of fishing effort. All the calculations of this study were made in R (R Core Team, 2022; version 4.0.3).
3 Results
3.1 Ecosystem services and EP hotspots and coldspots
Individual maps of EP as well as hotspots and coldspots revealed the spatial heterogeneity of ecological processes underpinning ES capacity (Figure 3 and Supplementary Material E). Hake nursery, sole spawning grounds, bioturbation and commercial species biomass are highly clustered. If we did identify areas of hotspots or coldspots for commercial species diversity, encounter rate, trophic links diversity, carbon storage and hake nursery, we detected no coldspot area for biomass of commercial species, bioturbation, filter feeding and sole spawning. In addition, the comparison of maps highlights contrasting patterns in the distribution of EP values, in particular among EP underpinning the same ES (Figure 3).
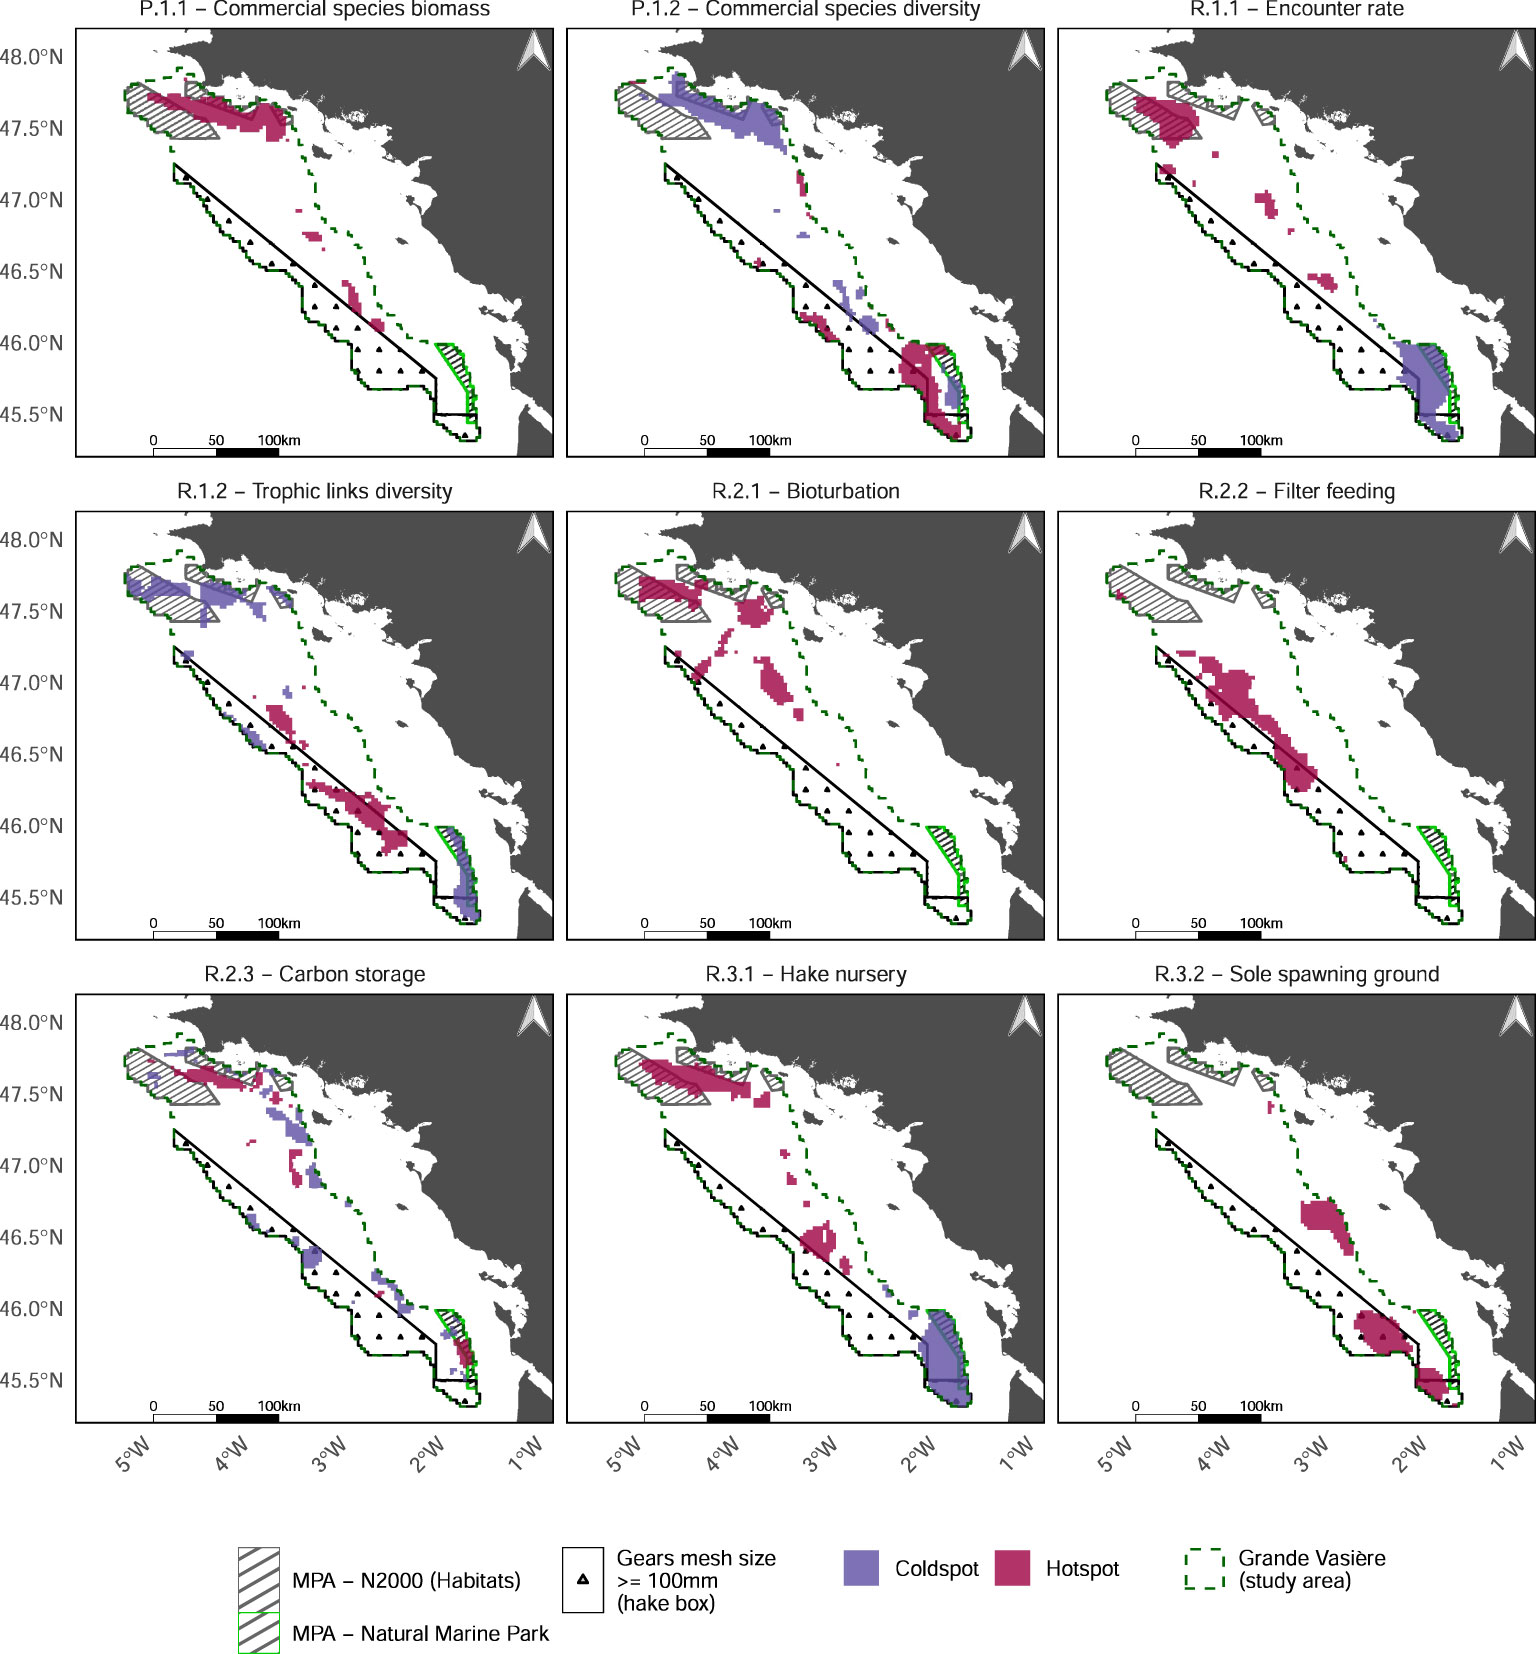
Figure 3 Hotspots (magenta) and coldspots (purple) of each EP.
Sea food provisioning (P.1) is ensured by high biomasses of commercial species in the North (mainly dominated by hake and Norway lobster) and high diversity (i.e. in species richness and in evenness of abundances distribution) of commercial species in the South. However, the Northern hotspot of commercial species biomass overlaps a coldspot of diversity of commercial species. EP related to food web functioning (R.1) also display contrasting patterns. The weighted predator/prey encounter rate shows a strong North-South gradient due to higher biomasses of commercial species in the North, while the trophic link diversity is higher in the South and center of the GV. There again, the Northern hotspot of predator/prey encounter rate partly overlap the coldspot of the diversity of trophic links, whereas the Southernmost part of GV is a coldspot of both EP, and therefore of overall food web functioning. Nutrient cycling (R.2) is highly supplied in the Northern part of GV thanks to bioturbation and carbon storage whereas and in the center of GV with filter feeding. Only few coldspots of carbon storage are spatially scattered on the margins of GV (i.e. where rocky sediments become more frequent). Lastly, the hotspots of life cycle maintenance (R.3) are ensured by hake nurseries in the North, sole spawning in the South-Western margin and both EP in center of the GV. It is worth noting that the large Southern coldspot of hake nursery is partly overlapping a hotspot of sole spawning.
Mapping coldspots and hotspots of the total ecosystem process value (given by the TESV index) confirmed that the Northern part of GV provides the highest amount of EP (Figure 4) while the Southern part of GV provides the lowest amount of EP (Figure 4). Nonetheless, the area covered by hotspots of the total ecosystem process value (Figure 4) is far less extended, i.e. 8% of the GV, than the spatial union of hotspots, i.e. 54% of the GV (Figure 4). This also holds true for coldspots but to a lesser extent (10% for coldspots of the total ecosystem process value versus 33% for union of coldspots).
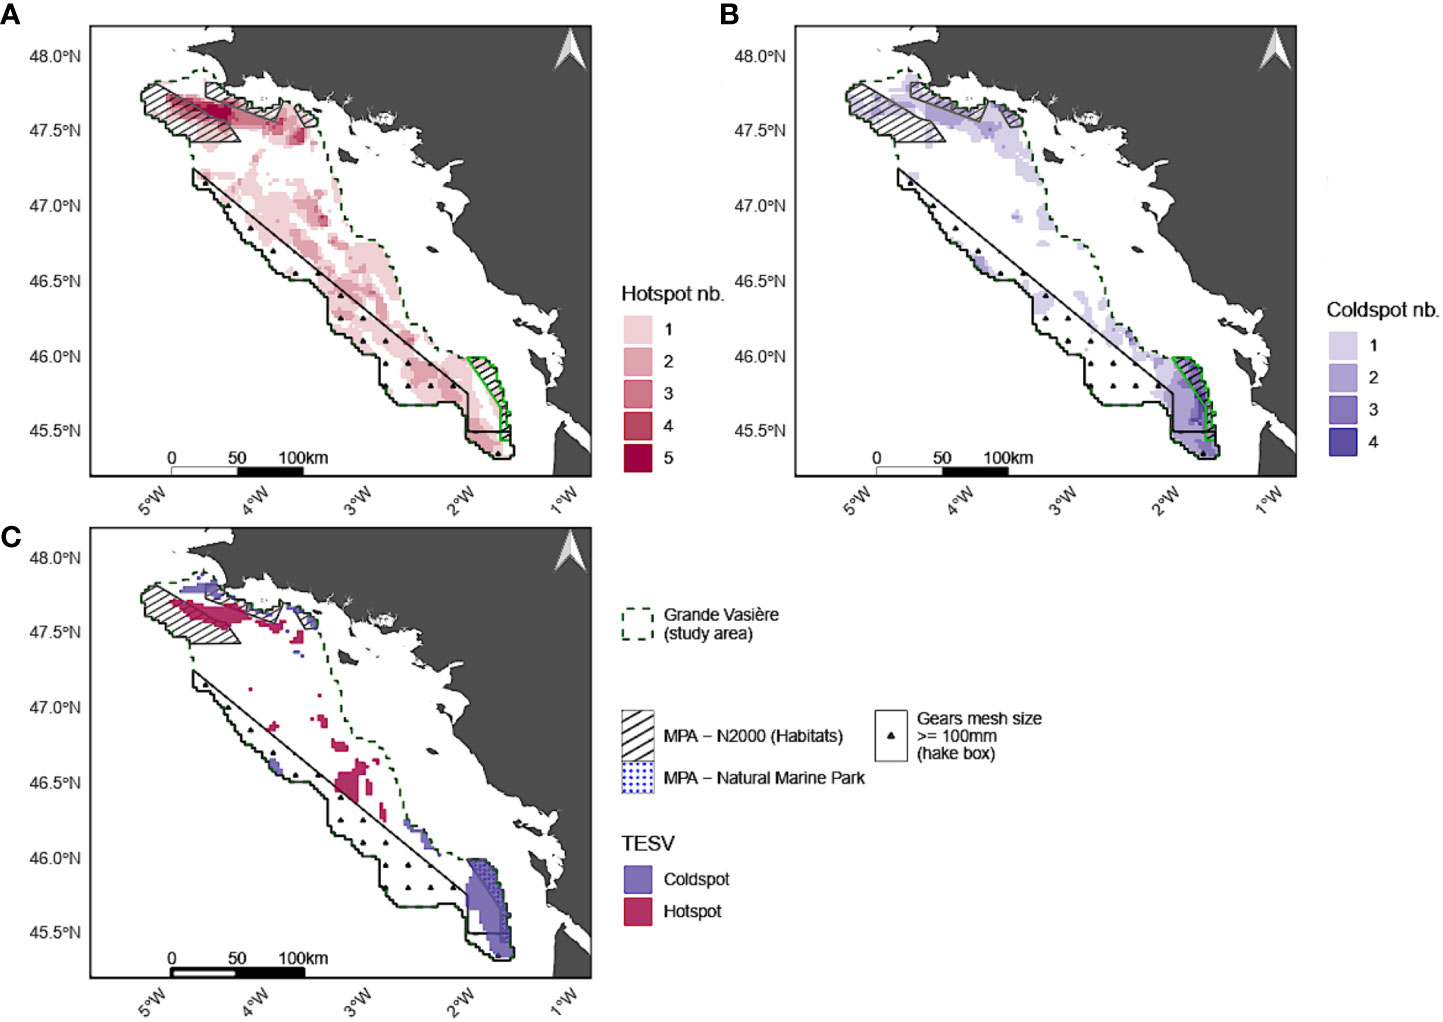
Figure 4 Number of EP hotspots (A), coldspots (B) and hotspots and coldspots of the TESV (i.e. total ecosystem process value in this study) (C) in each grid cell.
3.2 Bundles of EP
Four bundles of EP were identified using the first 4 PCA components, which represented 80.7% of the total inertia (Figure 5). Spatial congruences and mismatches among EP supply are depicted by the correlations of the EP with each principal component (Figure 5, lower panel). The first bundle (i.e. first PCA component) relies on a North-South gradient of several EP: higher levels of supply of commercial species (P.1.1), the encounter rate (R.1.1), bioturbation (R.2.1) and hake nursery (R.3.1) spatially overlap in the Northern area towards the center of the GV (in blue in Figure 5, Dim.1), while commercial species diversity supply (P.1.2) is higher in the South of the GV (in green in Figure 5, Dim.1, see also Supplementary Material E). The second bundle (i.e. second PCA component) is composed of a trade-off between filter feeding (R.2.2), mainly distributed in the offshore margins of the GV (in blue in Figure 5, Dim.2, and Supplementary Material E), and the sole spawning grounds (R.3.2) located in the South-Eastern margins (in green in Figure 5, Dim.2, and Supplementary Material E). The third and fourth bundles (i.e. last PCA components) are not true bundles as they involve one EP only, trophic links diversity (R.1.2) and carbon storage (R.2.3), respectively (Figure 5, Dim.3 and Dim.4).
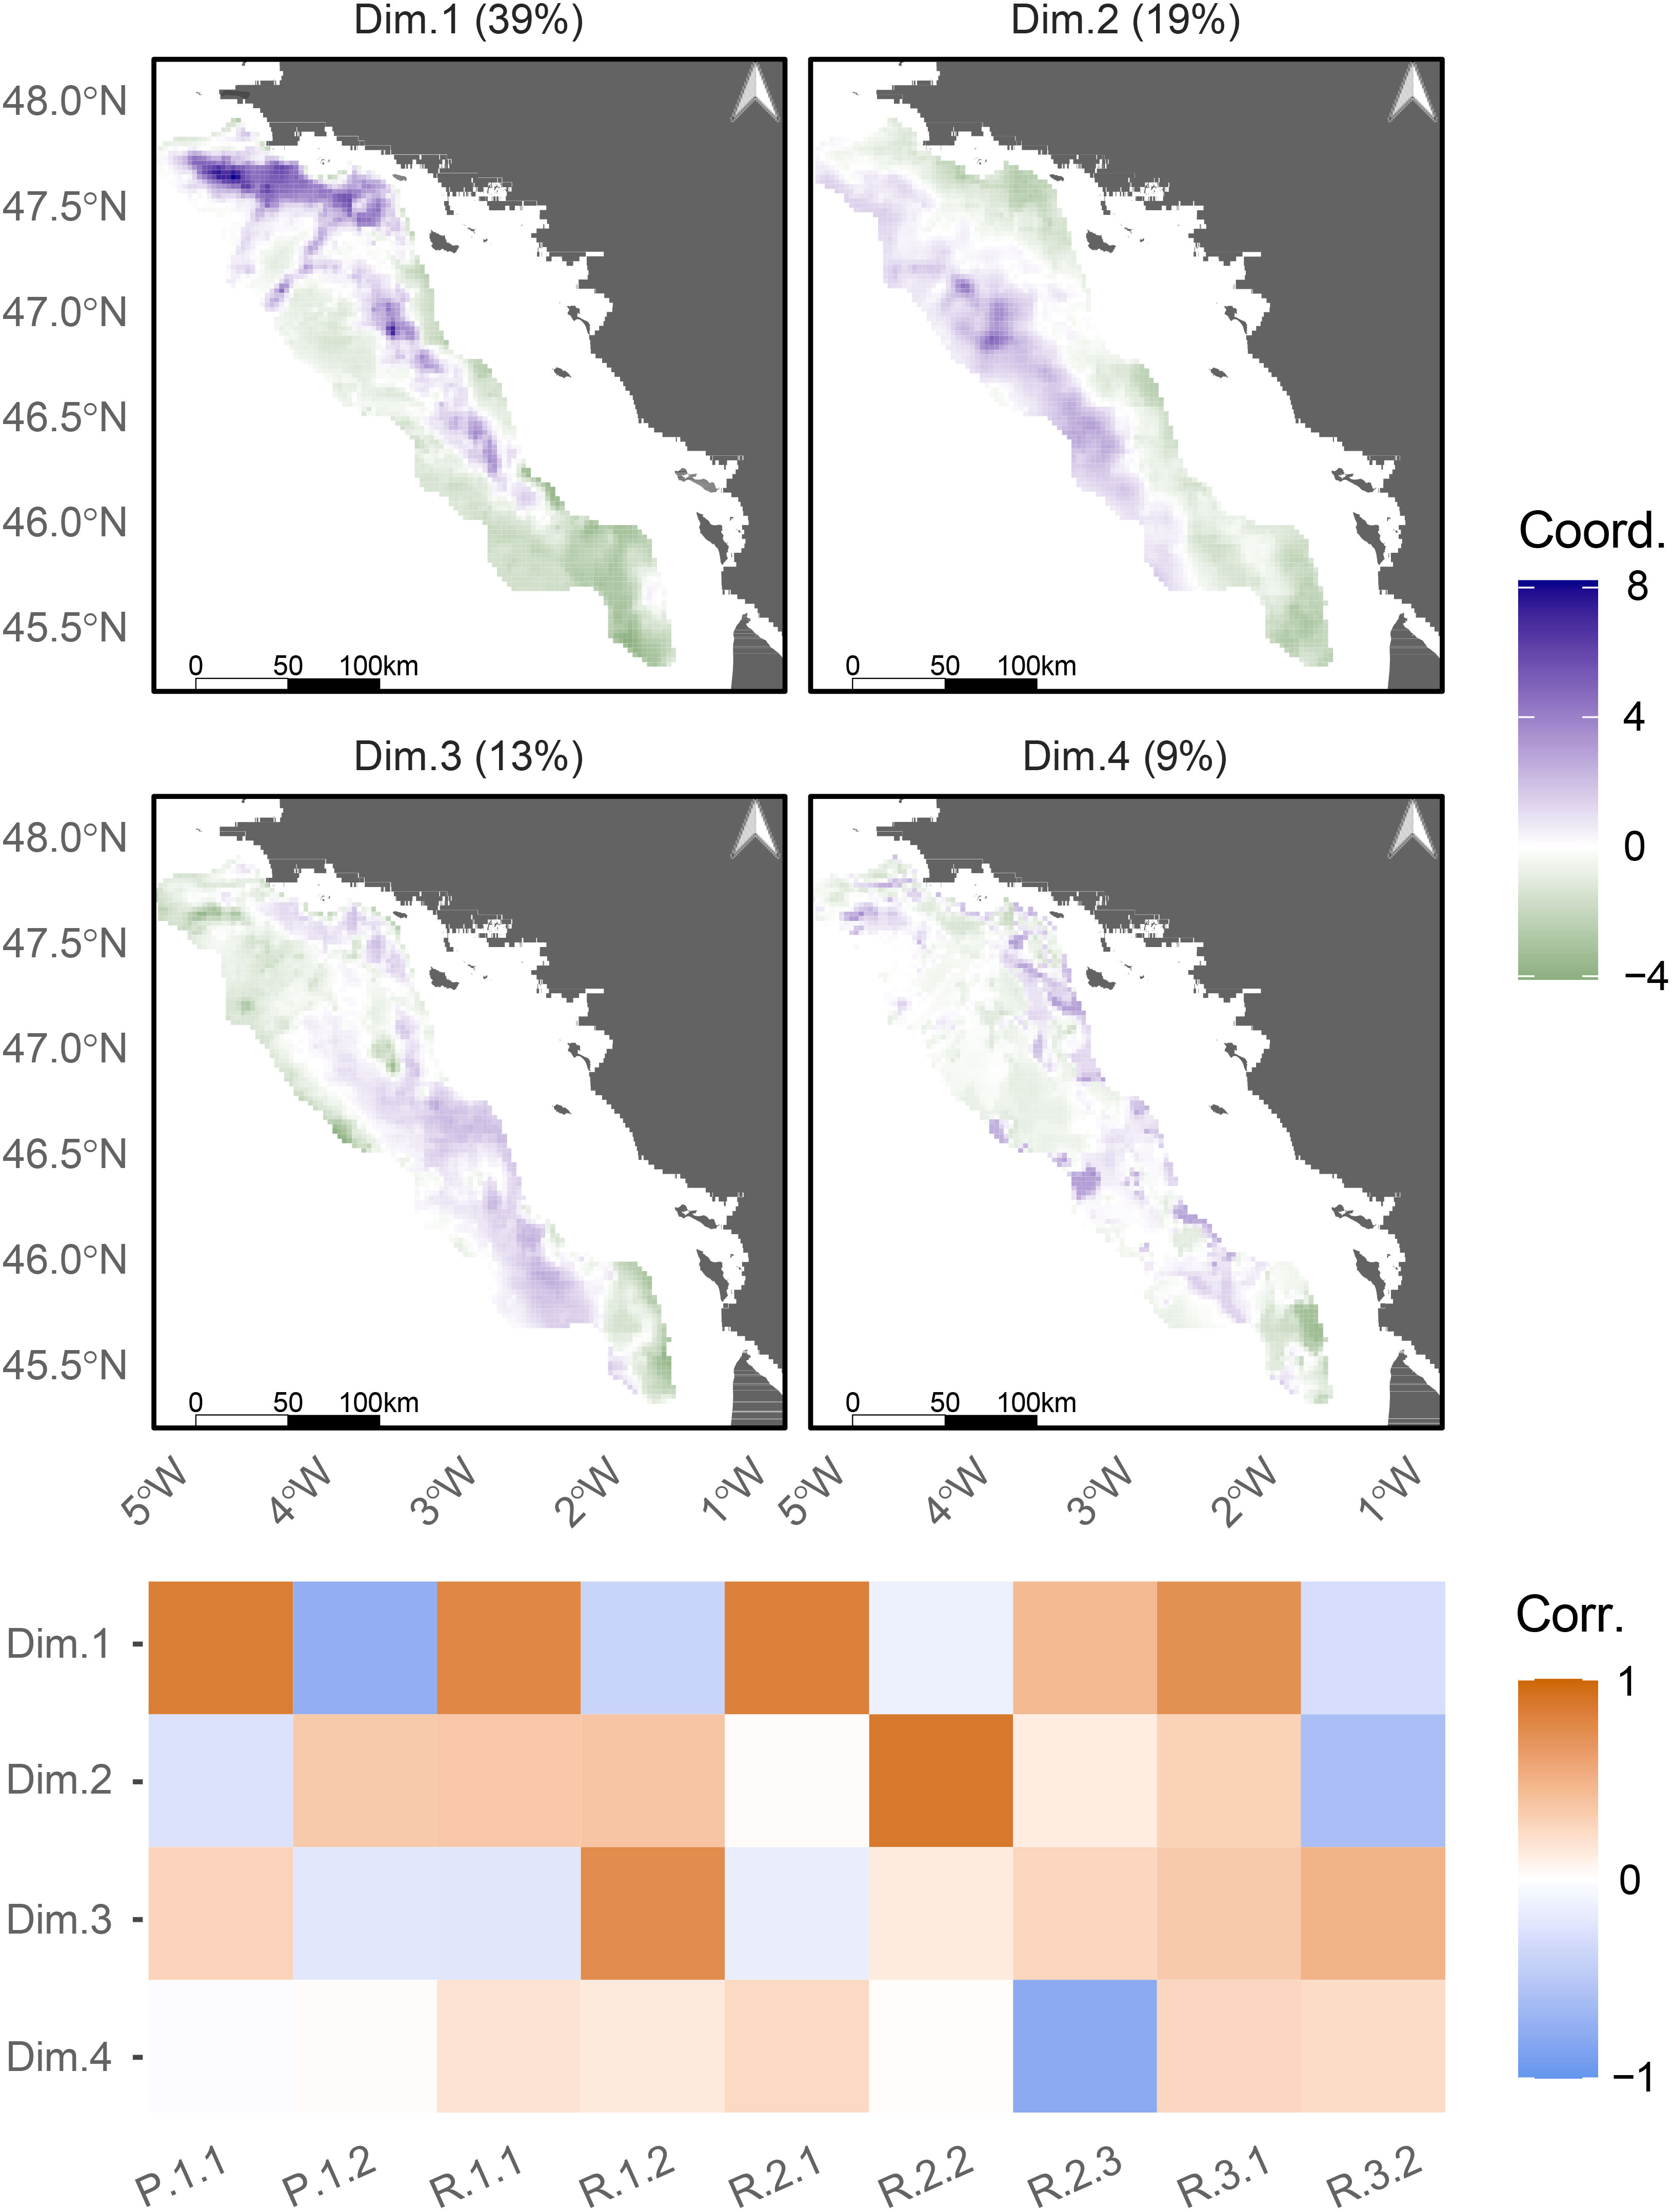
Figure 5 Illustration of the spatial associations among the 9 ecosystem processes (EP) identified using a Principal Components Analysis (PCA). Coordinates of the EP on the first 4 components are mapped (upper panel). Correlations these components and each among EP are represented as a heatmap (lower panel). Higher the absolute value of the coordinates, stronger the correlation between the EP and the given component. Besides, coordinates are negative when the EP is negatively correlated with the component and vice versa. P.1.1: Commercial species biomass; P.1.2: Commercial species diversity; R.1.1: encounter rate; R.1.2: Trophic links diversity; R.2.1: Bioturbation; R.2.2: Filter feeding; R.2.3: Carbon storage; R.3.1: Hake nursery; R.3.2: Sole spawning ground.
3.3 Spatial overlaps between EP hotspots, anthropogenic activities and MPAs
Active bottom gears and gillnets are the main gears used by fishermen in the GV, representing respectively 79% and 16% of the fishing effort from the area. Active bottom gear effort is concentrated in the Northern part of the GV and spread all along the area toward the South (Figure 6). Active bottom gears include bottom trawlers targeting Norway lobster and demersal fishes (e.g. hake, monkfishes) in the North, and Danish seiners targeting red mullet and squids in the South. Hotspots of active bottom gears fishing effort respectively overlaps 77%, 66%, 56%, 46% and 37% of the hotspots of biomass of commercial species, carbon storage, hake nursery, bioturbation and encounter rate (Figure 7). They also intersect coldspots of commercial species and trophic links diversities (respectively 58% and 34% of their surface). Reversely, gillnets effort is highly concentrated in the South-West (mainly hake fishery) and South-East (mainly sole fishery) parts of GV (Figure 6). Hotspots of gillnets effort cover other EP hotspots than the one covered by hotspots of bottom gears (i.e. respectively 58% and 20% of the commercial species diversity and sole spawning grounds hotspots surface; 45% and 44% of the encounter rate and hake nursery coldspots).
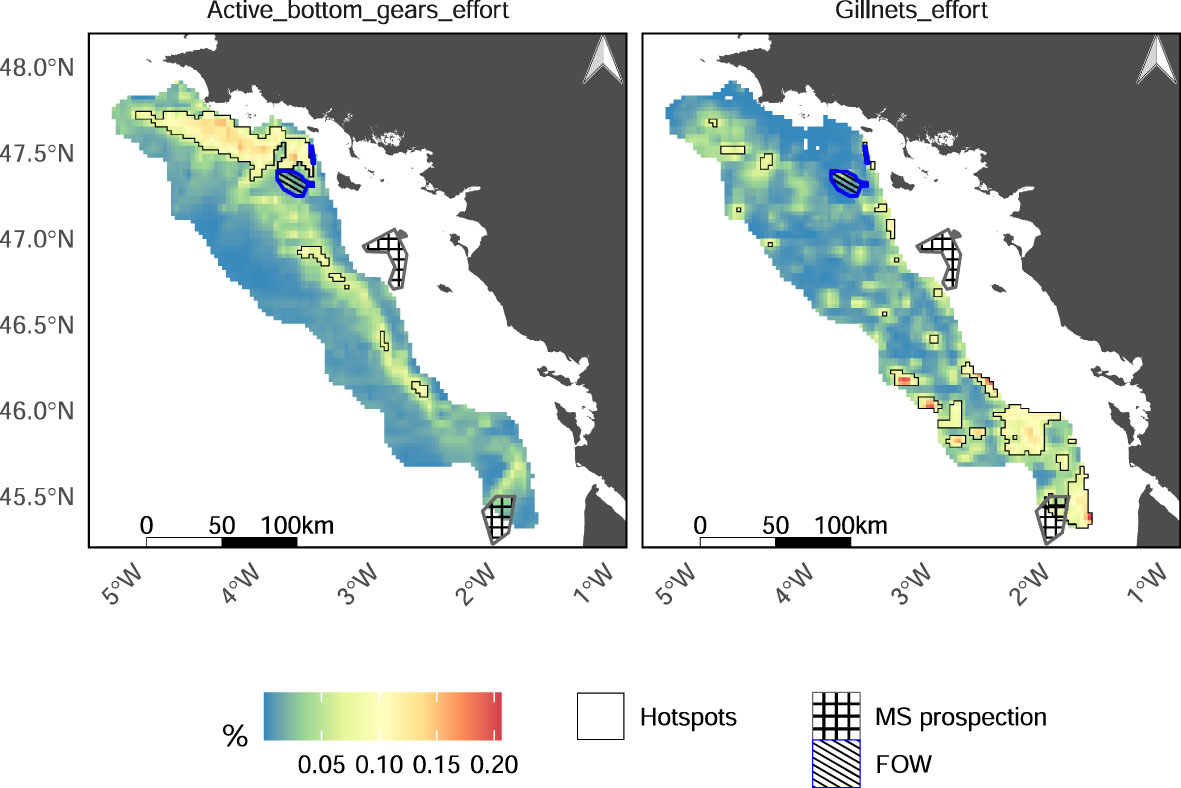
Figure 6 Representation of fishing effort (in hours) of active bottom gears (left panel) and gillnets (right panel) in the Grande Vasière, Floating Offshore Windfarm (FOW) area of designation and marine sand extraction (MS) prospection areas. Dark lines delineate the fishing effort hotspots identified through the Getis-Ord procedure. Fishing effort is given as a percentage over 2016-2020.
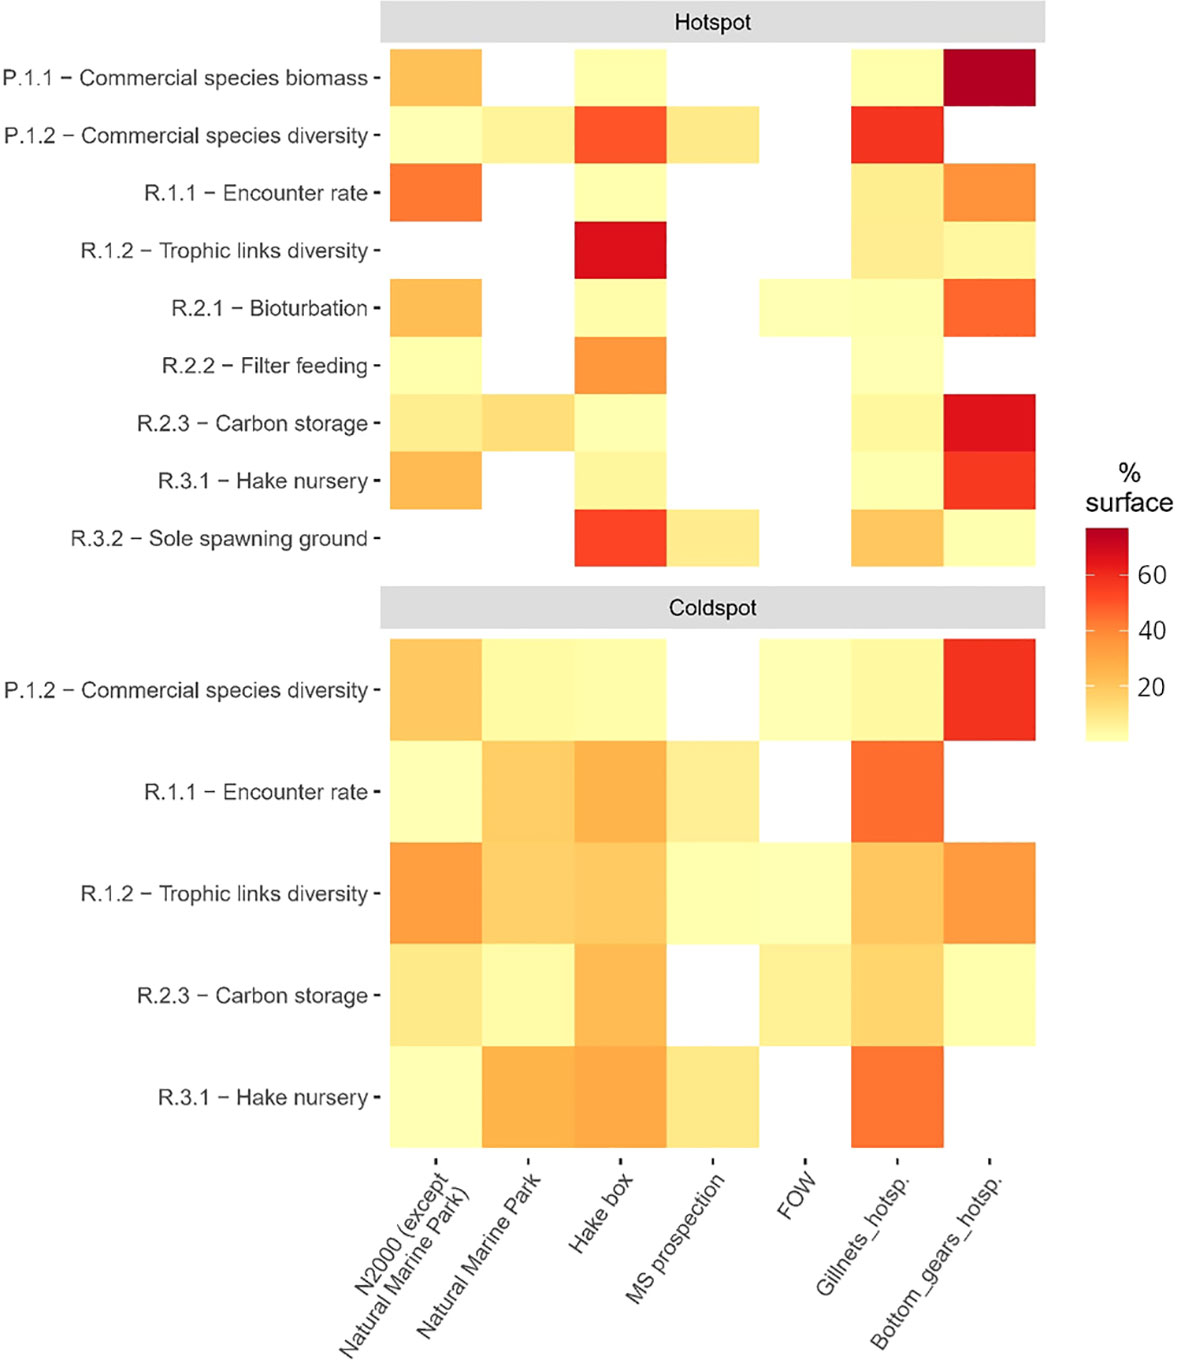
Figure 7 Percentage of overlapping surface of hotspots or coldspots of EP with MPAs, FOW designation areas, prospection area for marine sand extraction and fishing effort hotspots. N2000, Natura 2000 area; MS, marine sand extraction; FOW, Floating Offshore Windfarm; Gillnets_hotsp., hotspots of gillnet fishing effort; Bottom_gears_hotsp., hotspots of bottom gear fishing effort.
Due to their relatively small surfaces, floating offshore windfarm areas and prospection areas for marine sand extraction do not extensively cover hotspots of EP (Figure 7). However, the marine sand extraction area is fully included in the sole spawning ground and the commercial species diversity hotspots, covering 8% of each of their surface. At our scale of analysis, these activities do not highly overlap the main fishing grounds. Floating offshore windfarm projects are slightly intersecting the active bottom gear hotspot and prospection for marine sand extraction is ongoing at the border of Southern hotspots of gillnets effort.
Northern N2000 area overlap more than 20% of 4 EP hotspots: encounter rate (43%), bioturbation (23%), hake nursery (23%) and biomass of commercial species (22%) (Figure 7). They also cover coldspots of commercial species and trophic links diversities (respectively 19% and 33% of the surface). On the contrary, the Southern Marine Nature Park encompasses only a small surface of hotspots except carbon storage (12%), but several coldspots such as hake nursery (26% of the coldspot surface), encounter rate (17%) and trophic links diversity (16%). The hake box significantly overlaps commercial species diversity, trophic links diversity, filter feeding and sole spawning grounds hotspots, but it covers more surface of the hake nursery coldspot (29%) than hotspot (5%).
4 Discussion
ES and their underpinning EP are rarely integrated into management plans as operational objectives due to methodological issues, e.g. difficulty to define relevant ES indicators, unavailability of data and, therefore of ES maps (but see Egoh et al., 2010; Farella et al., 2020 for instance). In this study, we contributed to overcome this gap by building spatial indicators based on several datasets and species distribution modelling. Hereafter, we will discuss the spatial congruence and mismatch among EP, how they may affect ES supply assessment, and with conservation scheme and uses.
4.1 Drivers of EP bundles
If, overall, capacity of all ES appears to be ensured in every part of the GV, our findings suggest strong spatial discrepancies in the distribution of EP, even among EP related to the same ES. The two main bundles of EP are essentially driven by habitat and the component of biodiversity used for EP calculation, leading to strong spatial congruences and spatial mismatches in the supply of EP. The high spatial overlap between commercial species biomass, encounter rate, bioturbation and hake nursery is likely driven by the presence of muddy or sandy mud substrata in the North and center of the GV. This is in accordance with the widely documented relationships between habitats, communities, species’ ecological function, EP and ES (Salomidi et al., 2012; Galparsoro et al., 2014; Culhane et al., 2018; Armoškaitė et al., 2020; van der Biest et al., 2020). Habitat provides living conditions for communities, which in turn contribute to supply EP and ES. In our case, muddy substrata is known as a preferred habitat for detritus feeders and scavengers (Le Loc’h, 2004; Mérillet et al., 2018a), Norway lobsters, juvenile hakes (Woillez et al., 2007), demersal fishes and cephalopods. All these taxa are dominant in the GV, as they represent 49% of the whole estimated biomass of bentho-demersal species. Consistent with our results, Mérillet et al. (2018b) observed that scavenger species feeding on benthic organisms damaged by bottom trawling are more frequent in the Northern muddy areas of the GV. In 2008, Hily et al. showed a decline of endofauna diversity between 1966 and 2001 in the North and center of the GV which they explained by a sediment homogenization, shifting from mud to sandy mud substrata, related to high bottom trawling intensity and terrigenous inputs due to onland anthropogenic activities. These shifts in the seafloor and its inhabitants have consequences for ecosystem functioning and services, in particular related to nutrient fluxes (Olsgard et al., 2008), carbon storage and climate regulation (Epstein et al., 2022; Bianchi et al., 2023). This is well in line with documented impacts of fishing activities on benthic habitats and communities: homogenization of the substratum, reduction to loss of keystone species and of large and long-lived species leading to changes in benthic community composition (Thrush et al., 1998; Thrush and Dayton, 2002). If these impacts are susceptible to vary with the type of gear and habitat (e.g. Hiddink et al., 2017; Rijnsdorp et al., 2020), they most often result in similar patterns, i.e. loss of habitats, reduced biodiversity and occurrence of biological invasions. From all sediment types, muddy ones appear to be very sensitive to trawling and among the most impacted (Rijnsdorp et al., 2020; Pitcher et al., 2022). Finally, if the aforementioned taxa drive the biomass of commercial species, they also greatly contribute to bioturbation (e.g. squat lobster, Norway lobster), hake nursery (e.g. juvenile hakes), and encounter rate (e.g. demersal fishes and cephalopods feeding on benthos and scavenger decapods). Therefore, the contribution of these taxa to sea food provisioning, regulation of food web functioning and regulation of water and atmospheric conditions, partly explained the spatial congruence of these ES.
We also identified a trade-off opposing higher supply of biomass-based EP in the North (i.e. biomass of commercial species and encounter rate) to higher supply of diversity-based EP in the South (i.e. trophic links and commercial species diversities), with some exceptions in the Southern margins. It opposes the dominance of aforementioned taxa in the Northern muddy areas and a more even distribution of biomass among taxa in the Southern areas. Southern diversity hotspots are the results of more balanced commercial biomasses (e.g. Solea, solea, Trisopterus luscus, cuttlefishes) and energy transfer flows through trophic links (spectrum of medium demersal fishes and cephalopods feeding on benthos and detritus feeders). This suggests that a significant level of ES supply may be maintained throughout the area thanks to these spatial mismatches among EP underpinning a given ES. However, the outer Southern margin remains a coldspot for the diversity of commercial species as the biomass is strongly dominated by Solea solea and cuttlefishes, accentuating the low supply of sea food provisioning in this part of the Grande Vasière.
4.2 Spatial interactions between human activities, MPAs and ES
The spatial distribution of anthropogenic activities likely interacts with levels of EP supply and EP bundles. Sea food provisioning is obviously intertwined with fishing activities as fishing is needed to render fish biomass and diversity available to people, which is the case of all managed provisioning services (Díaz et al., 2015). In 2019, a IPBES report highlighted that provisioning services were the only services assessed that were not declining, precisely due to management measures to maintain productivity levels (IPBES, 2019). That raises questions about their integration in marine spatial planning without leading to spurious outputs as protecting the supply of provisioning services would result in protecting the human activities and practices ensuring the harvest of the natural goods (e.g. protecting the supply of commercial fish biomass could lead to protecting intensive fishing practices). On the contrary, the decline in fish stocks has led to stronger fishing regulations in many seas, as it is the case in the Bay of Biscay where regulations endorsed by the Common Fisheries Policy led to a decreasing fishing pressure on fish stocks, especially since the mid-2000s (ICES, 2021). In addition, outcomes of a marine spatial planning (MSP) will as well depend on the choice of targets and, therefore on ES (or EP) included in the exercise. In our case, the lack of data on EP related to regulation of seabed conditions and gene pool protection limiting our multi-ES assessment. The spatial distribution of ES hotspots and coldspots might change if these ES were considered. These shortcomings could be compensated by accounting for other parameters, such as the overall biodiversity state and the ecosystem status and these limitations should be clearly acknowledged in any spatial planning exercise (see further discussion in Rullens et al., 2022). It translates the difference between ES capacity (i.e. including undersized individuals, edible but not commercialized species) and use (i.e. commercialized individuals) (ES capacity and use sensu Crouzat et al., 2016).
Ecosystem processes ensuring the capacity of regulating ES is also exposed to anthropogenic pressures. Encounter rate, hake nursery and bioturbation are exposed to bottom trawling in the North and sole spawning grounds to gillnets and prospection for marine sand extraction in the South. The Hake box sets up much stricter mesh restrictions to protect hake juveniles (European Commission, 2002; European Parliament and Council, 2019) but covers only 5% of the hake nursery hotspot. The Northern N2000 MPAs are partly covering fishing areas and the related spatial overlap between EP, but they were not designed to deal with specific ES protection. The offshore western MPA intends to protect continental slope reef habitats and birds, whereas the North-Eastern MPA focuses on coastal rocky and tidal habitats. Besides, recent research studies (Atwood et al., 2020; Epstein and Roberts, 2023) concluded that conservation measures, such as MPAs, fail to efficiently protect sediment carbon stocks and fluxes. Therefore, the protection of services should not be encapsulated in biological conservation only. Addressing and limiting the diversity of human pressures on biodiversity and ES (or related EP) require a diversity of measures.
Finally, the floating offshore windfarm spatial extent over the GV is limited and does not significantly overlap any EP hotspots (6% of carbon storage surface; less than 0.5% for the others). However, development opportunities are considerable in the future, depending on the strategic energetic choices France will take to reach carbon neutrality in 2050, as specified by the Paris Climate Accords adopted in 2015 during the 21st COP (Conference of Parties). As an example, the current floating offshore windfarm project in the GV covers 233 km² corresponding to a 0.75 gigawatts (GW) capacity. According to the French electricity network public manager scenarios, the total metropolitan windfarms capacity (floating and fixed) should reach between 22 GW and 60 GW by 2050, and no wind turbine is currently working (RTE, 2022). In addition, according to French marine spatial plans (FMEST, 2020a;b) 55% of the GV is included into a priority area for windfarm development and 42% might host renewable energies if they cohabit with the other activities.
4.3 ES spatial management implications and opportunities
This study is a first step toward integrating ES in marine spatial planning and to the assessment of ES exposure to human activities. We showed a spatial heterogeneity between EP, hindering the management of ES as a unique target (Margules and Pressey, 2000; Moffitt et al., 2011; Magris et al., 2017; Magris et al., 2018). For instance, the spatial mismatch between hotspots of biomass and diversity of commercial species implies that they should be protected in distinct areas to preserve sea food provisioning. However, dealing with multiple MPAs might be expensive and difficult to manage. One solution could be to protect spatial aggregations of hotspots resulting from EP spatial congruence (Myers et al., 2000; Manea et al., 2019). This is already the case in the N2000 areas in the Northern GV, even if they were not designed for this purpose. Enforcing protection measures in these N2000 areas would lead to a win-win situation regarding biodiversity and ecosystem services. Still, EP hotspots are only partly covered by the N2000 network and, on the contrary, strongly overlap high bottom trawl fishing efforts. Therefore, a compromise between ES use (especially provisioning services) and the sustainability of ES supply is required. This advocates for the inclusion of ES in spatial planning targets, with a solid comprehension of the distribution and drivers of underpinning EP. If hotspot areas of multiple ES supply represent good candidates for such win-win situations, they may not overlay with areas of interest for some species or individual ES. Thus, biodiversity and individual ES should remain independent targets in spatial planning.
The management of coldspots, on the other hand, may be more challenging. Indeed, the absence or low value of one or more EP might be the consequence of ES depletion by human use or might be naturally limited by adverse environmental conditions. Here, three coldspots significantly overlap with the Marine Natural Park at the GV Southern border (encounter rate, trophic links diversity and hake nursery). In the former case, these areas could remain ‘sacrificial’ for human uses (i.e. dedicated to human activities with no specific protection for biodiversity or ecosystems), as suggested by Manea et al. (2019). In the latter case, protection or restoration measures would be relevant. To decipher between human-induced or natural causes of ES coldspots, establishing baseline conditions is needed to assess the level of the EP degradation (Borja et al., 2012). Besides, areas of low ES values could harbor rare and vulnerable species with important local ecological role (Kareiva and Marvier, 2003; Marchese, 2015).
Finally, despite being an homogenous sedimentary and habitat entity (Bourillet, 2006; Hily et al., 2008), the GV is part of the broader Bay of Biscay socio-ecosystem, meaning that ES supply and use also depends on EP and human activities in the surrounding areas. As mentioned in the introduction, the GV is of utmost importance for the provisioning of food in particular, as a place of direct harvesting but also through its nursery and spawning ground for commercial species caught outside this area. Indeed, accounting for connectivity is often a key for the efficiency of conservation measures and could help to find a better compromise in a context of MSP. In addition, further methodological developments are required to account for ecological flows throughout the three-dimensional structure of aquatic ecosystem. However, data availability is still limiting to study the whole Bay of Biscay and, therefore, its three-dimensional structure. With this study, we lay the foundation for the data collection and integration of ES in future spatial management planning in the Bay of Biscay.
Data availability statement
The original contributions presented in the study are included in the article/Supplementary Material. Further inquiries can be directed to the corresponding author.
Author contributions
GL and GB performed the analyses. GL and MAM wrote the article. All authors contributed to the article and approved the submitted version.
Acknowledgments
This study was part of the PACMAN project supported by the European Maritime and Fisheries Fund (EMFF) and France Filière Pêche. The authors are deeply indebted to the French Directorate of Marine Fisheries and Aquaculture (DGAMPA), to the team from the IFREMER French Fisheries Information System (HISSEO) for providing access to the VMS data. We also thank Jean-François Le Roux (IFREMER-LOPS-OC) for the data extraction from the MARS3D model.
Conflict of interest
The authors declare that the research was conducted in the absence of any commercial or financial relationships that could be construed as a potential conflict of interest.
Publisher’s note
All claims expressed in this article are solely those of the authors and do not necessarily represent those of their affiliated organizations, or those of the publisher, the editors and the reviewers. Any product that may be evaluated in this article, or claim that may be made by its manufacturer, is not guaranteed or endorsed by the publisher.
Supplementary material
The Supplementary Material for this article can be found online at: https://www.frontiersin.org/articles/10.3389/fmars.2023.1110299/full#supplementary-material
References
Alglave B., Rivot E., Etienne M.-P., Woillez M., Thorson J. T., Vermard Y. (2022). Combining scientific survey and commercial catch data to map fish distribution. ICES J. Mar. Sci. 79, 1133–1149. doi: 10.1093/icesjms/fsac032
Alvarez P., Fives J., Motos L., Santos M. (2004). Distribution and abundance of European hake merluccius merluccius (L.), eggs and larvae in the north East Atlantic waters in 1995 and 1998 in relation to hydrographic conditions. J. Plankton Res. 26, 811–826. doi: 10.1093/plankt/fbh074
Alvarez P., Motos L., Uriarte A., Egaña J. (2001). Spatial and temporal distribution of European hake, merluccius merluccius (L.), eggs and larvae in relation to hydrographical conditions in the bay of Biscay. Fish Res. 50, 111–128. doi: 10.1016/S0165-7836(00)00245-9
Arbault P. S., Camus P., Becle C. (1986). Estimation du stock de sole (Solea vulgaris, quensel 1806) dans le golfe de gascogne à partir de la production d’oeufs. J. Appl. Ichthyol. 2, 145–156. doi: 10.1111/j.1439-0426.1986.tb00656.x
Armoškaitė A., Puriņa I., Aigars J., Strāķe S., Pakalniete K., Frederiksen P., et al. (2020). Establishing the links between marine ecosystem components, functions and services: an ecosystem service assessment tool. Ocean Coast. Manag. 193, 105229. doi: 10.1016/j.ocecoaman.2020.105229
Atwood T. B., Witt A., Mayorga J., Hammill E., Sala E. (2020). Global patterns in marine sediment carbon stocks. Front. Mar. Sci. 7. doi: 10.3389/fmars.2020.00165
Benjamini Y., Hochberg Y. (1995). Controlling the false discovery rate: a practical and powerful approach to multiple testing. J. R. Stat. Society. Ser. B (Methodological) 57, 289–300. doi: 10.1111/j.2517-6161.1995.tb02031.x
Bianchi T. S., Brown C. J., Snelgrove P. V. R., Stanley R. R. E., Cote D., Morris C. (2023). Benthic invertebrates on the move: a tale of ocean warming and sediment carbon storage. Limnol. Oceanogr. Bull. 32 (1), 1–5. doi: 10.1002/LOB.10544
Bivand R. S., Wong D. W. S. (2018). Comparing implementations of global and local indicators of spatial association. TEST 27, 716–748. doi: 10.1007/s11749-018-0599-x
Böhnke-Henrichs A., Baulcomb C., Koss R., Hussain S. S. (2013). And de Groot, r Typology and indicators of ecosystem services for marine spatial planning and management. S.J. Environ. Manage. 130, 135–145. doi: 10.1016/j.jenvman.2013.08.027
Borja Á., Dauer D. M., Grémare A. (2012). The importance of setting targets and reference conditions in assessing marine ecosystem quality. Ecol. Indic. 12, 1–7. doi: 10.1016/j.ecolind.2011.06.018
Bourillet J. F., Jouanneau J. M., Macher C., Le Hir P., Naughton F. (2006). La grande vasière mid-shelf mud belt: Holocene sedimentary structure, natural and anthropogenic impacts. X Int. Symposium Oceanography Bay Biscay April 19-21, 2006. Available at: https://archimer.ifremer.fr/doc/00000/6243/.
Brandt P., Abson D. J., DellaSala D. A., Feller R., von Wehrden H. (2014). Multifunctionality and biodiversity: ecosystem services in temperate rainforests of the pacific Northwest, USA. Biol. Conserv. 169, 362–371. doi: 10.1016/j.biocon.2013.12.003
Caldas de Castro M., Singer B. H. (2006). Controlling the false discovery rate: a new application to account for multiple and dependent tests in local statistics of spatial association. Geogr. Anal. 38, 180–208. doi: 10.1111/j.0016-7363.2006.00682.x
Carroll G., Holsman K. K., Brodie S., Thorson J. T., Hazen E. L., Bograd S. J., et al. (2019). A review of methods for quantifying spatial predator–prey overlap. Global Ecol. Biogeogr. 28, 1561–1577. doi: 10.1111/geb.12984
Colloca F., Bartolino V., Lasinio G., Maiorano L., Sartor P., Ardizzone G. (2009). Identifying fish nurseries using density and persistence measures. Mar. Ecol. Prog. Ser. 381, 287–296. doi: 10.3354/meps07942
Corrales X., Preciado I., Gascuel D., Lopez de Gamiz-Zearra A., Hernvann P.-Y., Mugerza E., et al. (2022). Structure and functioning of the bay of Biscay ecosystem: a trophic modelling approach. Estuar. Coast. Shelf Sci. 264, 107658. doi: 10.1016/j.ecss.2021.107658
Crouzat E., Martín-López B., Turkelboom F., Lavorel S. (2016). Disentangling trade-offs and synergies around ecosystem services with the influence network framework: illustration from a consultative process over the French Alps. Ecol. Soc. 21. doi: 10.5751/ES-08494-210232
Culhane F. E., Frid C. L. J., Royo Gelabert E., White L., Robinson L. A. (2018). Linking marine ecosystems with the services they supply: what are the relevant service providing units? Ecol. Appl. 28, 1740–1751. doi: 10.1002/eap.1779
Currie D. R., McArthur M. A., Cohen B. F. (2000). Reproduction and distribution of the invasive European fanworm sabella spallanzanii (Polychaeta: sabellidae) in port phillip bay, Victoria, Australia. Mar. Biol. 136, 645–656. doi: 10.1007/s002270050724
Depellegrin D., Menegon S., Gusatu L., Roy S., Misiunė I. (2020). Assessing marine ecosystem services richness and exposure to anthropogenic threats in small sea areas: a case study for the Lithuanian sea space. Ecol. Indic. 108, 105730. doi: 10.1016/j.ecolind.2019.105730
Díaz S., Demissew S., Joly C., Lonsdale W. M., Larigauderie A. (2015). A Rosetta stone for nature’s benefits to people. PloS Biol. 13, e1002040. doi: 10.1371/journal.pbio.1002040
Díaz S., Fargione J., Chapin F. S., Tilman D. (2006). Biodiversity loss threatens human well-being. PloS Biol. 4, e277. doi: 10.1371/journal.pbio.0040277
Díaz S., Pascual U., Stenseke M., Martín-López B., Watson R. T., Molnár Z., et al. (2018). Assessing nature’s contributions to people. Sci. (1979) 359, 270–272. doi: 10.1126/science.aap8826
Dubosq N., Schmidt S., Walsh J. P., Grémare A., Gillet H., Lebleu P., et al. (2021). A first assessment of organic carbon burial in the West gironde mud patch (Bay of Biscay). Cont Shelf Res. 221, 104419. doi: 10.1016/j.csr.2021.104419
Egoh B. N., Reyers B., Carwardine J., Bode M., O’Farrell P. J., Wilson K. A., et al. (2010). Safeguarding biodiversity and ecosystem services in the little karoo, south Africa. Conserv. Biol. 24, 1021–1030. doi: 10.1111/j.1523-1739.2009.01442.x
Epstein G., Middelburg J. J., Hawkins J. P., Norris C. R., Roberts C. M. (2022). The impact of mobile demersal fishing on carbon storage in seabed sediments. Global Change Biol. 28 (9), 2875–2894. doi: 10.1111/GCB.16105
Epstein G., Roberts C. M. (2023). Does biodiversity-focused protection of the seabed deliver carbon benefits? A U.K. Case study. Conserv. Lett. 16 (1), e12929. doi: 10.1111/CONL.12929
European Commission (1992). Council directive 92/43/EEC of 21 may 1992 on the conservation of natural habitats and of wild fauna and flora. (European commission). Available at: https://eur-lex.europa.eu/legal-content/EN/TXT/?uri=celex%3A31992L0043.
European Commission (2002). Commission regulation (EC) no 494/2002 of 19 march 2002 establishing additional technical measures for the recovery of the stock of hake in ICES sub-areas III, IV, V, VI and VII and ICES divisions VIII a, b, d, e. (European commission). Available at: https://eur-lex.europa.eu/legal-content/EN/TXT/?uri=CELEX%3A32002R0494.
European Commission (2008). Directive 2008/56/EC of the European parliament and of the council of 17 June 2008 establishing a framework for community action in the field of marine environmental policy. (European commission). Available at: https://eur-lex.europa.eu/legal-content/EN/TXT/?uri=celex%3A32008L0056.
European Commission (2009). Directive 2009/147/EC of the European parliament and of the council of 30 November 2009 on the conservation of wild birds. (European commission). Available at: https://eur-lex.europa.eu/legal-content/EN/TXT/?uri=CELEX%3A32009L0147.
European Commission (2020). Communication from the commission to the European parliament, the council, the European economic and social committee and the committee of the regions-EU biodiversity strategy for 2030. (European commission). Available at: https://eur-lex.europa.eu/legal-content/EN/TXT/?uri=celex%3A52020DC0380.
European Parliament and Council (2019). European Parliament and council) regulation (EU) 2019/1241 of the European parliament and of the council of 20 June 2019 on the conservation of fisheries resources and the protection of marine ecosystems through technical measures. (European Parliament and Council). Available at: https://eur-lex.europa.eu/legal-content/EN/TXT/?uri=CELEX%3A32019R1241.
Farella G., Menegon S., Fadini A., Depellegrin D., Manea E., Perini L., et al. (2020). Incorporating ecosystem services conservation into a scenario-based MSP framework: an Adriatic case study. Ocean Coast. Manag. 193, 105230. doi: 10.1016/j.ocecoaman.2020.105230
French Ministry of Ecological and Solidarity Transition (FMEST) (2020a). “North Atlantic Sea basin strategy document,” in The European maritime spatial planning platform. (French Ministry of Ecological and Solidarity Transition). Available at: https://www.dirm.sud-atlantique.developpement-durable.gouv.fr/.
French Ministry of Ecological and Solidarity Transition (FMEST) (2020b). “South Atlantic Sea basin strategy document,” in The European maritime spatial planning platform. (French Ministry of Ecological and Solidarity Transition). Available at https://www.dirm.sud-atlantique.developpement-durable.gouv.fr/.
Galparsoro I., Borja A., Uyarra M. C. (2014). Mapping ecosystem services provided by benthic habitats in the European north Atlantic ocean. Front. Mar. Sci. 1. doi: 10.3389/fmars.2014.00023
Galparsoro I., Pınarbaşı K., Gissi E., Culhane F., Gacutan J., Kotta J., et al. (2021). Operationalisation of ecosystem services in support of ecosystem-based marine spatial planning: insights into needs and recommendations. Mar. Policy 131, 104609. doi: 10.1016/j.marpol.2021.104609
Garlan T., Gabelotaud I., Lucas S., Marchès E. (2018). A world map of seabed sediment based on 50 years of knowledge. World Acad. Science Eng. Technology Int. J. Comput. Inf. Eng. 5. doi: 10.5281/zenodo.1317074
Getis A., Ord J. K. (1992). The analysis of spatial association by use of distance statistics. Geogr. Anal. 24, 189–206. doi: 10.1111/j.1538-4632.1992.tb00261.x
Getis A., Ord J. K. (2010). The analysis of spatial association by use of distance statistics. Geogr. Anal. 24, 189–206. doi: 10.1111/j.1538-4632.1992.tb00261.x
Girardello M., Santangeli A., Mori E., Chapman A., Fattorini S., Naidoo R., et al. (2019). Global synergies and trade-offs between multiple dimensions of biodiversity and ecosystem services. Sci. Rep. 9, 8. doi: 10.1038/s41598-019-41342-7
Haines-Young R., Potschin M. B. (2018). Common international classification of ecosystem services (CICES) V5.1 and guidance on the application of the revised structure. (European Environment Agency). Available at: www.cices.eu.
Hattam C., Atkins J. P., Beaumont N., Borger T., Böhnke-Henrichs A., Burdon D., et al. (2015). Marine ecosystem services: linking indicators to their classification. Ecol. Indic. 49, 61–75. doi: 10.1016/j.ecolind.2014.09.026
Hiddink J. G., Jennings S., Sciberras M., Bolam S. G., Cambiè G., McConnaughey R. A., et al. (2019). Assessing bottom trawling impacts based on the longevity of benthic invertebrates. J. Appl. Ecol. 56, 1075–1084. doi: 10.1111/1365-2664.13278
Hiddink J. G., Jennings S., Sciberras M., Szostek C. L., Hughes K. M., Ellis N., et al. (2017). Global analysis of depletion and recovery of seabed biota after bottom trawling disturbance. Proc. Natl. Acad. Sci. U.S.A. 114 (31), 8301–8306. doi: 10.1073/PNAS.1618858114
Hily C., le Loc’h F., Grall J., Glémarec M. (2008). Soft bottom macrobenthic communities of north Biscay revisited: long-term evolution under fisheries-climate forcing. Estuar. Coast. Shelf Sci. 78, 413–425. doi: 10.1016/j.ecss.2008.01.004
ICES (2016). Stock annex: hake (Merluccius merluccius) in subareas 4, 6, and 7, and in divisions 3.a, 8.a–b, and 8.d, northern stock (Greater north Sea, celtic seas, and the northern bay of Biscay). ICES Stock Annexes. doi: 10.17895/ices.pub.18622544.v1
ICES (2021). Bay of Biscay and the Iberian Coast ecoregion – Ecosystem overview. In Report of the ICES Advisory Committee, 2021. ICES Advice 2021, Section 6.1. doi: 10.17895/ices.advice.9436
IPBES (2019). Global assessment report on biodiversity and ecosystem services of the intergovernmental science-policy platform on biodiversity and ecosystem services. Eds. Brondizio E. S., Settele J., Díaz S., Ngo H. T. (Bonn, Germany: IPBES secretariat), 1148. doi: 10.5281/zenodo.3831673
Kareiva P., Marvier M. (2003). Conserving biodiversity coldspots recent calls to direct conservation funding to the world’s biodiversity hotspots may be bad investment advice. Am. Sci. 91, 344–351. doi: 10.1511/2003.26.344
Kenchington E., Lirette C., Murillo F. J., Downie A. L., Kenny A., Koen-Alonso M., et al. (2020). Kernel density analysis and mapping of ecosystem functions in the NAFO regulatory area. Canada: Northwest Atlantic Fisheries Organization - NAFO SCR Doc. 19/058. 68 p.
Koutsikopoulos C., Lacroix N. (1992). Distribution and abundance of sole (Solea solea (L.)) eggs and larvae in the bay of Biscay between 1986 and 1989. Netherlands J. Sea Res. 29, 81–91. doi: 10.1016/0077-7579(92)90009-4
Lê S., Josse J., Husson F. (2008). FactoMineR: an r package for multivariate analysis. J. Stat. Softw. 25, 1–18. doi: 10.18637/jss.v025.i01
Leenhardt P., Low N., Pascal N., Micheli F., Claudet J. (2015). “Chapter 9 - The role of marine protected areas in providing ecosystem services,” in Aquatic functional biodiversity Belgrano A., Woodward G., Jacob U.(Academic Press), 211–239. doi: 10.1016/B978-0-12-417015-5.00009-8
Le Loc’h F. (2004). Structure, fonctionnement, évolution des communautés benthiques des fonds meubles exploités du plateau continental Nord Gascogne. PhD thesis. Université de Bretagne occidentale. Available at: https://theses.hal.science/tel-00009359.
Lillebø A. I., Somma F., Norén K., Gonçalves J., Alves M. F., Ballarini E., et al. (2016). Assessment of marine ecosystem services indicators: experiences and lessons learned from 14 European case studies. Integr. Environ. Assess. Manag. 12, 726–734. doi: 10.1002/ieam.1782
Lindegren M., Holt B. G., MacKenzie B. R., Rahbek C. (2018). A global mismatch in the protection of multiple marine biodiversity components and ecosystem services. Sci. Rep. 8, 8. doi: 10.1038/s41598-018-22419-1
Liquete C., Piroddi C., Drakou E. G., Gurney L., Katsanevakis S., Charef A., et al. (2013). Current status and future prospects for the assessment of marine and coastal ecosystem services: a systematic review. PloS One 8, e67737. doi: 10.1371/journal.pone.0067737
Maes J., Paracchini M. L., Zulian G., Dunbar M. B., Alkemade R. (2012). Synergies and trade-offs between ecosystem service supply, biodiversity, and habitat conservation status in Europe. Biol. Conserv. 155, 1–12. doi: 10.1016/j.biocon.2012.06.016
Magris R. A., Andrello M., Pressey R. L., Mouillot D., Dalongeville A., Jacobi M. N., et al. (2018). Biologically representative and well-connected marine reserves enhance biodiversity persistence in conservation planning. Conserv. Lett. 11, e12439. doi: 10.1111/conl.12439
Magris R. A., Pressey R. L., Mills M., Vila-Nova D. A., Floeter S. (2017). Integrated conservation planning for coral reefs: designing conservation zones for multiple conservation objectives in spatial rioritization. Glob. Ecol. Conserv. 11, 53–68. doi: 10.1016/j.gecco.2017.05.002
Mahé K., Delpech J. P., Carpentier A. (2007). Synthèse bibliographique des principales espèces de Manche orientale et du Golfe de Gascogne. Available at: https://archimer.ifremer.fr/doc/00000/6643/.
Manea E., di Carlo D., Depellegrin D., Agardy T., Gissi E. (2019). Multidimensional assessment of supporting ecosystem services for marine spatial planning of the Adriatic Sea. Ecol. Indic. 101, 821–837. doi: 10.1016/j.ecolind.2018.12.017
Marchese C. (2015). Biodiversity hotspots: a shortcut for a more complicated concept. Glob Ecol. Conserv. 3, 297–309. doi: 10.1016/j.gecco.2014.12.008
Margules C. R., Pressey R. L. (2000). Systematic conservation planning. Nature 405, 243–253. doi: 10.1038/35012251
McCann K., Hastings A., Huxel G. R. (1998). Weak trophic interactions and the balance of nature. Nature 395, 794–798. doi: 10.1038/27427
Mérillet L., Mouchet M., Robert M., Salaün M., Schuck L., Vaz S., et al. (2018a). Using underwater video to assess megabenthic community vulnerability to trawling in the grande vasière (Bay of Biscay). Environ. Conserv. 45, 163–172. doi: 10.1017/S0376892917000480
Mérillet L., Robert M., Salaün M., Schuck L., Mouchet M., Kopp D. (2018b). Underwater video offers new insights into community structure in the grande vasière (Bay of Biscay). J. Sea Res. 139, 1–9. doi: 10.1016/j.seares.2018.05.010
Mermillod-Blondin F. (2011). The functional significance of bioturbation and biodeposition on biogeochemical processes at the water–sediment interface in freshwater and marine ecosystems. J. North Am. Benthol. Soc. 30, 770–778. doi: 10.1899/10-121.1
Middelburg J. J. (2019). Marine carbon biogeochemistry (Cham: Springer International Publishing). doi: 10.1007/978-3-030-10822-9
Milisenda G., Garofalo G., Fiorentino F., Colloca F., Maynou F., Ligas A., et al. (2021). Identifying persistent hot spot areas of undersized fish and crustaceans in southern European waters: implication for fishery management under the discard ban regulation. Front. Mar. Sci. 8. doi: 10.3389/fmars.2021.610241
Moffitt E. A., Wilson White J., Botsford L. W. (2011). The utility and limitations of size and spacing guidelines for designing marine protected area (MPA) networks. Biol. Conserv. 144, 306–318. doi: 10.1016/j.biocon.2010.09.008
Mouchet M. A., Lamarque P., Martín-López B., Crouzat E., Gos P., Byczek C., et al. (2014). An interdisciplinary methodological guide for quantifying associations between ecosystem services. Global Environ. Change 28, 298–308. doi: 10.1016/j.gloenvcha.2014.07.012
Murillo F. J., MacDonald B. W., Kenchington E., Campana S. E., Sainte-Marie B., Sacau M. (2018). Morphometry and growth of sea pen species from dense habitats in the gulf of st. Lawrence, eastern Canada. Mar. Biol. Res. 14, 366–382. doi: 10.1080/17451000.2017.1417604
Myers N., Mittermeier R. A., Mittermeier C. G., da Fonseca G. A. B., Kent J. (2000). Biodiversity hotspots for conservation priorities. Nature 403, 853–858. doi: 10.1038/35002501
Norkko J., Gammal J., Hewitt J. E., Josefson A. B., Carstensen J., Norkko A. (2015). Seafloor ecosystem function relationships: In situ patterns of change across gradients of increasing hypoxic stress. Ecosystems 18, 1424–1439. doi: 10.1007/s10021-015-9909-2
O’Gorman E. J., Emmerson M. C. (2009). Perturbations to trophic interactions and the stability of complex food webs. Proc. Natl. Acad. Sci. 106, 13393–13398. doi: 10.1073/pnas.0903682106
Olsgard F., Schaanning M. T., Widdicombe S., Kendall M. A., Austen M. C. (2008). Effects of bottom trawling on ecosystem functioning. J. Exp. Mar. Biol. Ecol. 366 (1–2), 123–133. doi: 10.1016/J.JEMBE.2008.07.036
Petitgas P. (1997). Sole egg distributions in space and time characterised by a geostatistical model and its estimation variance. ICES J. Mar. Sci. 54, 213–225. doi: 10.1006/jmsc.1996.0184
Picone F., Buonocore E., D’Agostaro R., Donati S., Chemello R., Franzese P. P. (2017). Integrating natural capital assessment and marine spatial planning: a case study in the Mediterranean sea. Ecol. Modell 361, 1–13. doi: 10.1016/j.ecolmodel.2017.07.029
Pitcher R. C., Hiddink J. G., Jennings S., Collie J., Parma A. M., Amoroso R., et al. (2022). Trawl impacts on the relative status of biotic communities of seabed sedimentary habitats in 24 regions worldwide. Proc. Natl. Acad. Sci. 119 (2), e2109449119. doi: 10.1073/PNAS.2109449119
Queirós A. M., Birchenough S. N. R., Bremner J., Godbold J. A., Parker R. E., Romero-Ramirez A., et al. (2013). A bioturbation classification of European marine infaunal invertebrates. Ecol. Evol. 3, 3958–3985. doi: 10.1002/ece3.769
R Core Team (2022). “R: a language and environment for statistical computing,” R foundation for statistical computing (Vienna, Austria).
Rijnsdorp A. D., Bastardie F., Bolam S. G., Buhl-Mortensen L., Eigaard O. R., Hamon K. G., et al. (2016). Towards a framework for the quantitative assessment of trawling impact on the seabed and benthic ecosystem. ICES J. Mar. Sci. 73, i127–i138. doi: 10.1093/icesjms/fsv207
Rijnsdorp A. D., Hiddink J. G., van Denderen P. D., Hintzen N. T., Eigaard O. R., Valanko S., et al. (2020). Different bottom trawl fisheries have a differential impact on the status of the north Sea seafloor habitats. ICES J. Mar. Sci. 77 (5), 1772–1786. doi: 10.1093/ICESJMS/FSAA050
Rooney N., McCann K. S. (2012). Integrating food web diversity, structure and stability. Trends Ecol. Evol. 27, 40–46. doi: 10.1016/j.tree.2011.09.001
RTE (2022). Futurs énergétiques 2050-chapitre 4: la production d’électricité. 53. (RTE). Available at: https://assets.rte-france.com/prod/public/2021-10/Futurs-Energetiques-2050-principaux-resultats_0.pdf.
Rullens V., Townsend M., Lohrer A. M., Stephenson F., Pilditch C. A. (2022). Who is contributing where? predicting ecosystem service multifunctionality for shellfish species through ecological principles. Sci. Total Environ. 808, 152147. doi: 10.1016/j.scitotenv.2021.152147
Salomidi M., Katsanevakis S., Borja A., Braeckman U., Damalas D., Galparsoro I., et al. (2012). Assessment of goods and services, vulnerability, and conservation status of European seabed biotopes: a stepping stone towards ecosystem-based marine spatial management. Mediterr. Mar. Sci. 13, 49. doi: 10.12681/mms.23
Solan M., Cardinale B. J., Downing A. L., Engelhardt K. A. M., Ruesink J. L., Srivastava D. S. (2004). Extinction and ecosystem function in the marine benthos. Science 1979) 306, 1177–1180. doi: 10.1126/science.1103960
Système d’Information Halieutique (SIH) (2017). Données de production et d’effort de pêche (SACROIS) – 2003-2017 (Ifremer SIH). doi: 10.12770/3e177f76-96b0-42e2-8007-62210767dc07
Thiele S., Weiss C. (2003). Consumer demand for food diversity: evidence for Germany. Food Policy 28, 99–115. doi: 10.1016/S0306-9192(02)00068-4
Thrush S. F., Dayton P. K. (2002). Disturbance to marine benthic habitats by trawling and dredging: implications for marine biodiversity. Annu. Rev. Ecol. Syst. 33, 449–473. doi: 10.1146/ANNUREV.ECOLSYS.33.010802.150515
Thrush S. F., Hewitt J. E., Cummings V. J., Dayton P. K., Cryer M., Turner S. J., et al. (1998). Disturbance of the marine benthic habitat by commercial fishing: impacts at the scale of the fishery. Ecol. Appl. 8 (3), 866–879. doi: 10.1890/1051-0761(1998)008[0866:DOTMBH]2.0.CO;2
Townsend M., Thrush S. F., Carbines M. J. (2011). Simplifying the complex: an ‘Ecosystem principles approach’ to goods and services management in marine coastal ecosystems. Mar. Ecol-Prog Ser. 434, 291–301. doi: 10.3354/meps09118
Townsend M., Thrush S. F., Lohrer A. M., Hewitt J. E., Lundquist C. J., Carbines M., et al. (2014). Overcoming the challenges of data scarcity in mapping marine ecosystem service potential. Ecosyst. Serv. 8, 44–55. doi: 10.1016/J.ECOSER.2014.02.002
Vacherot J. P., Butler R., Coupeau Y., Garren F., Rivoalen J. J., Simon J., et al. (2019). LANGOLF-TV 2019. RBE/STH/LTBH/2019-14. doi: 10.13155/74652
van der Biest K., Meire P., Schellekens T., D’hondt B., Bonte D., Vanagt T., et al. (2020). Aligning biodiversity conservation and ecosystem services in spatial planning: focus on ecosystem processes. Sci. Total Environ. 712, 136350. doi: 10.1016/j.scitotenv.2019.136350
Villamagna A. M., Angermeier P. L., Bennett E. M. (2013). Capacity, pressure, demand, and flow: a conceptual framework for analyzing ecosystem service provision and delivery. Ecol. Complex. 15, 114–121. doi: 10.1016/j.ecocom.2013.07.004
von Thenen M., Frederiksen P., Hansen H. S., Schiele K. S. (2020). A structured indicator pool to operationalize expert-based ecosystem service assessments for marine spatial planning. Ocean Coast. Manag. 187, 105071. doi: 10.1016/j.ocecoaman.2019.105071
Vucic-Pestic O., Ehnes R. B., Rall B. C., Brose U. (2011). Warming up the system: higher predator feeding rates but lower energetic efficiencies. Glob Chang. Biol. 17, 1301–1310. doi: 10.1111/j.1365-2486.2010.02329.x
Wallace K. J. (2007). Classification of ecosystem services: problems and solutions. Biol. Conserv. 139, 235–246. doi: 10.1016/j.biocon.2007.07.015
Woillez M., Poulard J.-C., Rivoirard J., Petitgas P., Bez N. (2007). Indices for capturing spatial patterns and their evolution in time, with application to European hake (Merluccius merluccius) in the bay of Biscay. ICES J. Mar. Sci. 64, 537–550. doi: 10.1093/icesjms/fsm025
Yao P., Zhao B., Bianchi T. S., Guo Z., Zhao M., Li D., et al. (2014). Remineralization of sedimentary organic carbon in mud deposits of the changjiang estuary and adjacent shelf: implications for carbon preservation and authigenic mineral formation. Cont Shelf Res. 91, 1–11. doi: 10.1016/j.csr.2014.08.010
Keywords: ecosystem services, marine spatial planning, conservation, offshore windfarm, sand extraction, fisheries, Atlantic Ocean
Citation: Lavialle G, Boussarie G, Kopp D, Morfin M and Mouchet MA (2023) Mapping marine ecosystem services in a multifunctional seascape: the case of Grande Vasière (Bay of Biscay). Front. Mar. Sci. 10:1110299. doi: 10.3389/fmars.2023.1110299
Received: 28 November 2022; Accepted: 24 May 2023;
Published: 09 June 2023.
Edited by:
Miriam Von Thenen, Leibniz Institute for Baltic Sea Research (LG), GermanyReviewed by:
Eric Thiébaut, Sorbonne Universités, FranceJudi Hewitt, The University of Auckland, New Zealand
Copyright © 2023 Lavialle, Boussarie, Kopp, Morfin and Mouchet. This is an open-access article distributed under the terms of the Creative Commons Attribution License (CC BY). The use, distribution or reproduction in other forums is permitted, provided the original author(s) and the copyright owner(s) are credited and that the original publication in this journal is cited, in accordance with accepted academic practice. No use, distribution or reproduction is permitted which does not comply with these terms.
*Correspondence: Maud A. Mouchet, bWF1ZC5tb3VjaGV0QG1uaG4uZnI=