 John B. Horne1*
 Suzanne E. Roden2
 Erin L. LaCasella2
 Amy Frey2
 Summer L. Martin3
 T. Todd Jones3
 Shawn Murakawa3
 Shandell Brunson3†
 George H. Balazs4
 Peter H. Dutton2
- 1Southwest Fisheries Science Center, Marine Mammal and Turtle Division, National Research Council, NOAA Fisheries, La Jolla, CA, United States
- 2Southwest Fisheries Science Center, Marine Mammal and Turtle Division, NOAA Fisheries, La Jolla, CA, United States
- 3Pacific Islands Fisheries Science Center, Marine Turtle Biology and Assessment Program, NOAA Fisheries, Honolulu, HI, United States
- 4Golden Honu Services of Oceania, Honolulu, HI, United States
Longline fishing vessels, such as those that target tuna or billfish, also unintentionally catch endangered marine turtle species on the high seas. The stock composition of this bycatch is often unknown but potentially complex, with individuals coming from many possible origins on an ocean-basin scale. To better understand the stock composition of green turtle (Chelonia mydas) bycatch we obtained 46 turtles, 27-91 cm in curved carapace length, caught by Hawaii- and American Samoa-based pelagic longline fishing vessels across large areas of the North- and South-central Pacific. We genotyped these at nine microsatellite loci and one mitochondrial DNA marker, and used a baseline of 1,043 nesting female green turtles from beaches across the Pacific for population assignment and mixed-stock analysis. By analyzing both marker types jointly we were able to increase power and genetically resolve ten baseline stocks of nesting females with mean self-assignment and simulated accuracies of 75-97%. Above the Equator, green turtle bycatch was composed mostly of individuals from Hawaiian and Eastern Pacific stocks, with a small number from the Western Pacific. Below the Equator, the most common stocks in the bycatch were from Australia and the Coral Sea, American Samoa and French Polynesia, and the Galápagos Islands. Overall, turtles originating from East, West, and Central Pacific breeding populations were major components of the bycatch, suggesting that the geographic ranges of these populations overlap across large tracts of ocean during the pelagic life history stages.
Introduction
As adults, green turtles (Chelonia mydas) forage near shore and are the most frequently seen and photographed of all sea turtles, but as juveniles they are extremely rare (Witherington, 2002; Bolten, 2003). Like other species, green turtles enter the ocean immediately upon hatching and head for deep water, but it wasn’t known where they went until Carr and Meylan (1980) first reported finding young green turtles in offshore sargassum mats. Moreover, before Reich et al. (2007) used stable isotope analysis to confirm a 3-5 year pelagic phase, it was unknown that greens were like other marine turtles in this regard. The elusiveness of juvenile green turtles is due to their active nature, as they swim more vigorously, dive more eagerly, and spend more time underwater than other species (Smith and Salmon, 2009; Witherington et al., 2012), making them difficult to study or sample. Consequently, there are many unanswered questions about the distribution and ecology of young pelagic-stage green turtles in the open ocean, and this is a major knowledge gap for a species currently protected by the US Endangered Species Act (Seminoff et al., 2015), and which plays an important functional role as a megaherbivore in marine ecosystems (Jackson, 2001; Burkholder et al., 2013; Pimiento et al., 2020).
In their early years, green turtles can disperse across thousands of km, sometimes against ocean currents (Luschi et al., 2003; Putman and Naro-Maciel, 2013; Putman and Mansfield, 2015), during which time they feed on a variety of animal and algal prey (Reich et al., 2007; Boyle and Limpus, 2008; Cardona et al., 2009; Howell et al., 2016; Esteban et al., 2020). As they attain curved carapace lengths of 20-30 cm, they become large enough to scavenge on longline fishing bait and are occasionally taken as bycatch (Work and Balazs, 2002; Petersen et al., 2009; Work and Balazs, 2010; Parker et al., 2011), though infrequently relative to their nesting abundances. Bycatch individuals are available only in small numbers, but offer a unique opportunity to examine the early life history of this conservationally important marine reptile.
The purpose of this study was to use green turtle bycatch, collected from longline fishing vessels based out of Hawaii and American Samoa, to investigate the spatial distribution of pelagic Pacific green turtles in the Central Pacific, and to determine the relative proportions of various Pacific breeding stocks present in the fisheries bycatch. The bycatch collection featured in this paper, while small, culminates decades of sampling effort and is, to our knowledge, the only of its kind for Pacific green turtles. A subset of the turtles from the Hawaiian longline fishery have been previously assessed for population of origin using mitochondrial DNA (mtDNA; Parker et al., 2011), but because some mitochondrial haplotypes were common across populations the origins of individuals possessing these variants could not be resolved. Therefore, for our study we used both mtDNA haplotypes and a suite of nuclear microsatellite loci to genetically assign turtles to more finely delineated baseline units.
Mixed-marker approaches involving both mtDNA and nuclear genetic loci have proven valuable for population-level studies in a number of marine taxa (Eytan and Hellberg, 2010; Horne et al., 2011; Mesnick et al., 2011; Dibattista et al., 2012; Andrews et al., 2013; Iacchei et al., 2013; and others). In sea turtles, however, mixed-marker study designs have not been as widely used, in part because nuclear DNA markers are sometimes assumed to be less sensitive to population differentiation, because male-mediated dispersal theoretically dilutes the strong natal homing signal captured by maternally inherited mtDNA (Bowen and Karl, 2007; Wallace et al., 2010). In spite of this, Stewart et al. (2016) showed that a separate population assignment using a suite of microsatellite loci added clarity to a mtDNA analysis of leatherback turtle bycatch, suggesting that microsatellite diversity can be a useful complement to mtDNA. In our study we take this a step further by using both marker types jointly in the same analysis to increase assignment power.
Hereafter, we show that by combining two marker types we were able to partition our genetic baseline into a larger number of reporting units, thereby increasing the geographic precision of genetic assignment without compromising much accuracy. Similarly, to Stewart et al. (2016), we also show that the nuclear microsatellite markers complemented patterns in the mtDNA much more often than not. The results presented herein suggest that future conservation genetic studies of sea turtles should consider the advantages of using multiple types of genetic markers.
Materials and methods
Genetic baseline, bycatch collection, and laboratory processing
As a baseline for genetic assignment and mixed-stock analysis, we drew on the respective mtDNA and microsatellite data of Jensen et al. and Roden et al. (2023), comprising 20 rookeries throughout the Pacific (Table 1; Figure 1). The samples from these two papers overlap and represent the most up-to-date compilation of new and previously published population genetic datasets for Pacific green turtles. Green turtle bycatch samples, with curved carapace lengths (CCL) of 27-91 cm, were acquired from longline fishing vessels based out of Hawaii and American Samoa (29 and 24 turtles, respectively). Tissue for DNA extraction was sampled at sea by trained observers between 1996 and 2017. Storage and transport of tissue collections, as well as laboratory processing, was performed using the same methods as Jensen et al. and Roden et al. (2023). Final products included a 770-bp fragment of the mitochondrial control region (see Dutton et al., 2014), and ten unlinked microsatellite loci.
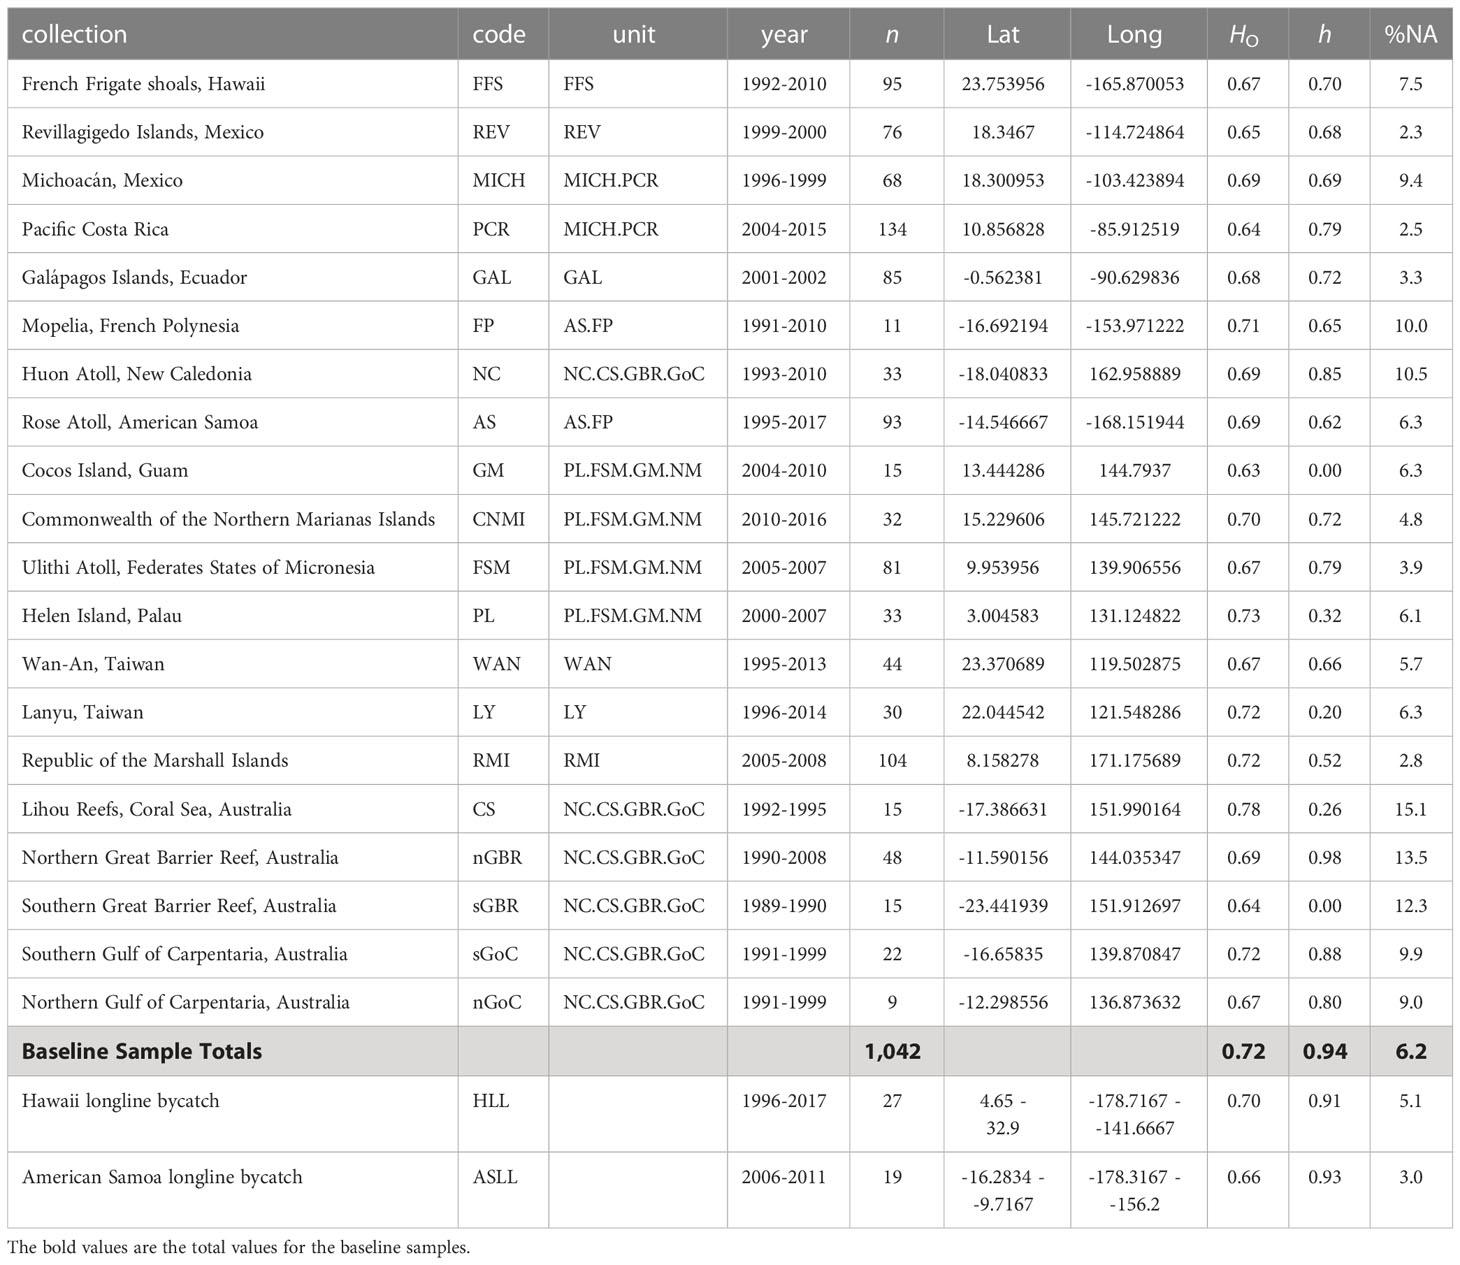
Table 1 Green turtle baseline and bycatch sample collections: Collection location, collection code, baseline reporting unit, year(s) of collection, number of samples genotyped, approximate decimal longitude and latitude, observed heterozygosity across nine microsatellite loci (HO), mitochondrial haplotype diversity (h), and percent missing data (%NA).
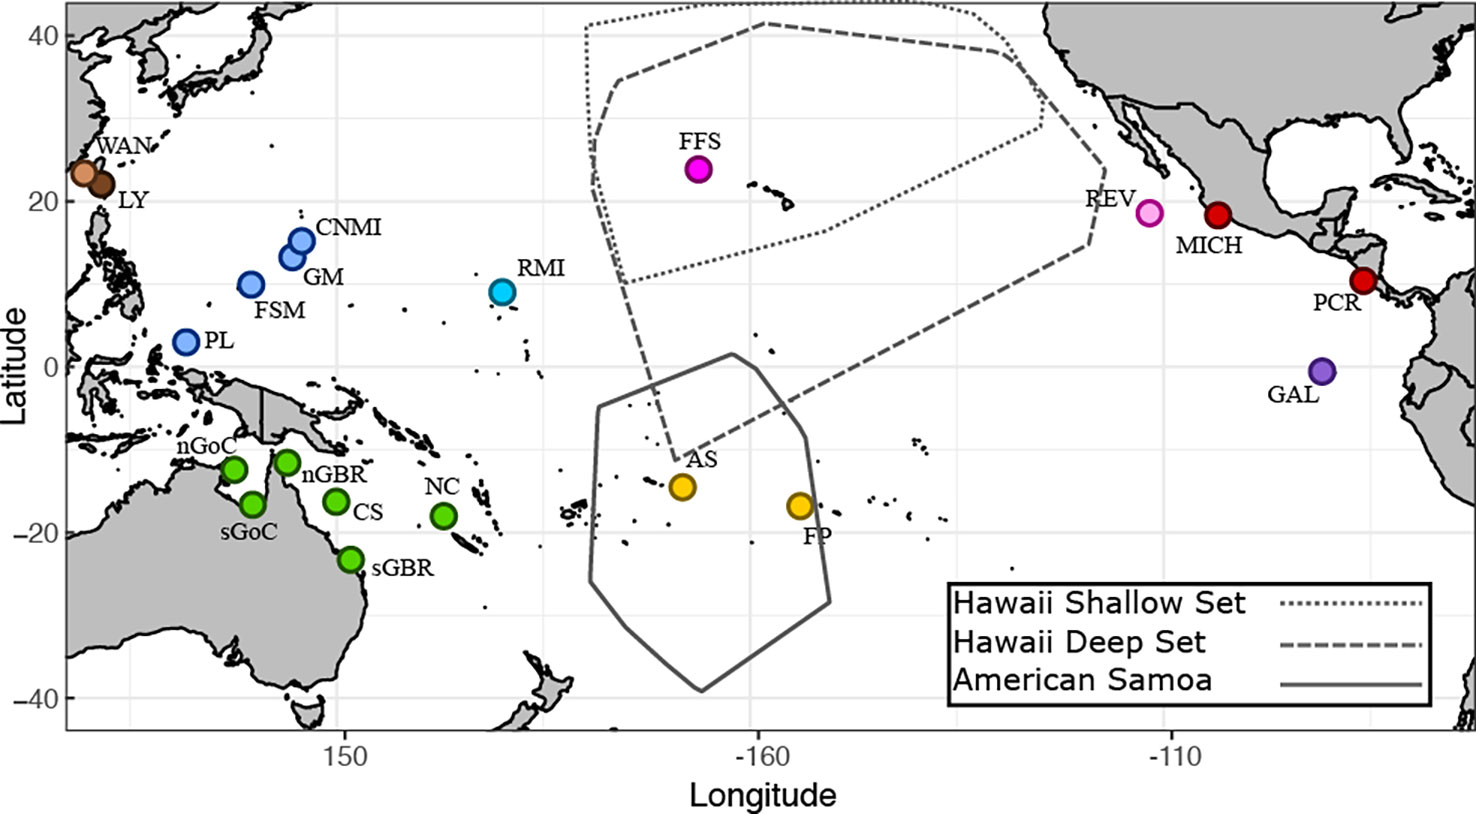
Figure 1 Geographic sampling locations for green turtles. Baseline nesting populations are indicated by circles. Population codes and colored reporting units are explained in Table 1. The areas encircled by polygons represent the spatial boundaries of longline fisheries. The Hawaii-based fishery is composed of two separate gear types (shallow and deep) that target different depths.
Data processing and population genetics
Any turtle that was missing data at more than three loci (microsatellite or mtDNA) was removed prior to analysis. Loci were removed if they had more than 30% missing data in either the genetic baseline or fishery bycatch samples. Diversity statistics for each baseline rookery and bycatch collection were calculated in the R package DiveRsity v. 1.9.90 (Keenan et al., 2013). Tests of Hardy-Weinberg equilibrium and the presence of null alleles for microsatellites were performed previously by Roden et al. (2023). To help inform the organization of baseline samples into reporting units for genetic assignment and mixed-stock analysis, we computed population-level genetic distances between all pairs of rookeries (microsatellite loci only) using the R package ADEGENET 1.5 (Jombart et al., 2011). Two different computations were used: Nei’s genetic distance (Nei, 1978) which is a heterozygosity-based metric, and Edwards genetic distance (Edwards, 1971) which is an allele frequency-based metric. Both types of genetic distance were plotted as networks using the R package NETWORK v. 1.16.1 (Csardi and Nepusz, 2006) for visualization and interpretation. We also took into account the population genetic patterns in Jensen et al. and Roden et al. (2023) for combining rookeries into reporting units.
Mixed-stock analysis and genetic assignment
After considering genetic distances and other available results, the two primary criteria for determining reporting unit boundaries were mean simulated reporting accuracy and self-assignment rate, calculated using the R package RUBIAS v. 0.3 (Moran and Anderson, 2019). Self-assignment was the rate at which nesting females could be correctly grouped with other individuals from the same reporting unit given their genotypic similarity and using the leave-one-out method of Anderson et al. (2008). Reporting accuracy was assessed by simulating stock mixtures from baseline allele frequencies and was the proportion of the simulated mixture that was correctly identified by analysis. We simulated 10,000 mixtures, with a mixture size of 50, sampling all reporting units (repunit) uniformly from a flat Dirichlet distribution with a default sampling parameter of 1.5 per unit, allowing the proportion of reporting units in the mixture to vary randomly.
We aimed for accuracies of > 75% in at least one of the two approaches and tested different combinations of nesting populations iteratively, starting at the largest geographic scale (West-central Pacific vs. Eastern Pacific) and gradually splitting groups into the smallest units possible per our predefined criteria. If any nesting population had less than 20 individuals these were automatically combined with the most genetically similar population, or populations, into a single reporting unit. Pre-defined distinct population segments (DPSs) as recognized for C. mydas under The United States Endangered Species Act (Seminoff et al., 2015) were not used to determine reporting units, and neither were other proposed management units for this species (Wallace et al., 2010). To gauge the power of different marker types for genetic assignment and mixed-stock analysis, we simulated stock mixtures with the mtDNA and microsatellite loci separately as well as jointly. To assess whether the stock proportions of our different bycatch collections biased the analysis, we also retrospectively simulated 10,000 mixtures where the means of the Dirichlet sampling distributions for each repunit were the same as the mean mixing proportions estimated for fisheries bycatch, making the simulated stock mixtures more realistic for our data.
For our final mixed-stock analysis we ran RUBIAS with 10,000 iterations of the MCMC, discarding the first 1,000 samples as burn-in. Each mixture inference was also parametrically bootstrapped 1,000 times as a measure to reduce reporting unit biases (Moran and Anderson, 2019). The analysis was run ten times with different starting seed to ensure that mixing proportions remained consistent across runs. To assess whether any bycatch turtles could have originated from populations not represented by our baseline, we consulted the z-score values calculated by RUBIAS, which are the log-likelihoods for each individual compared to an expected distribution of log-likelihoods, while accounting for missing data (Clemento et al., 2014). The range of acceptable z-scores was determined by calculating the same statistic for nesting females from each reporting unit. Overall, an individual assignment to a reporting unit was considered plausible if the assignment posterior was greater than 0.70 and the z-score was larger than the reference minimum. An assignment was considered strong if the posterior was greater than 0.9 (Anderson et al., 2008) and the z-score was within the interquartile range of the reference.
Results
Final data
A total of 27 out of 29, and 19 out of 24, green turtle bycatch samples, respectively from the Hawaiian and American Samoan longline fisheries, were retained for analysis after filtering for missing data. For our baseline, 1,042 out of 1,111 nesting females were retained (Table 1). Out of ten original microsatellite loci, one was removed because more than 30% of bycatch samples had missing data at this locus. For comparison with Roden et al. (2023), the locus removed was A6. Missing genotypes made up 6.2% of the baseline data, with the Coral Sea rookery having the most missing data at 15% and the Revillagigedo Islands having the least at 2.3%. In general, the West Pacific was more genetically diverse than the East Pacific, with the highest diversity estimates belonging to southwestern rookeries (Table 1). Microsatellite genetic distances between rookeries were consistent at most scales (Figure 2), and mostly consistent with population structure reported in Jensen et al. and Roden et al. (2023).
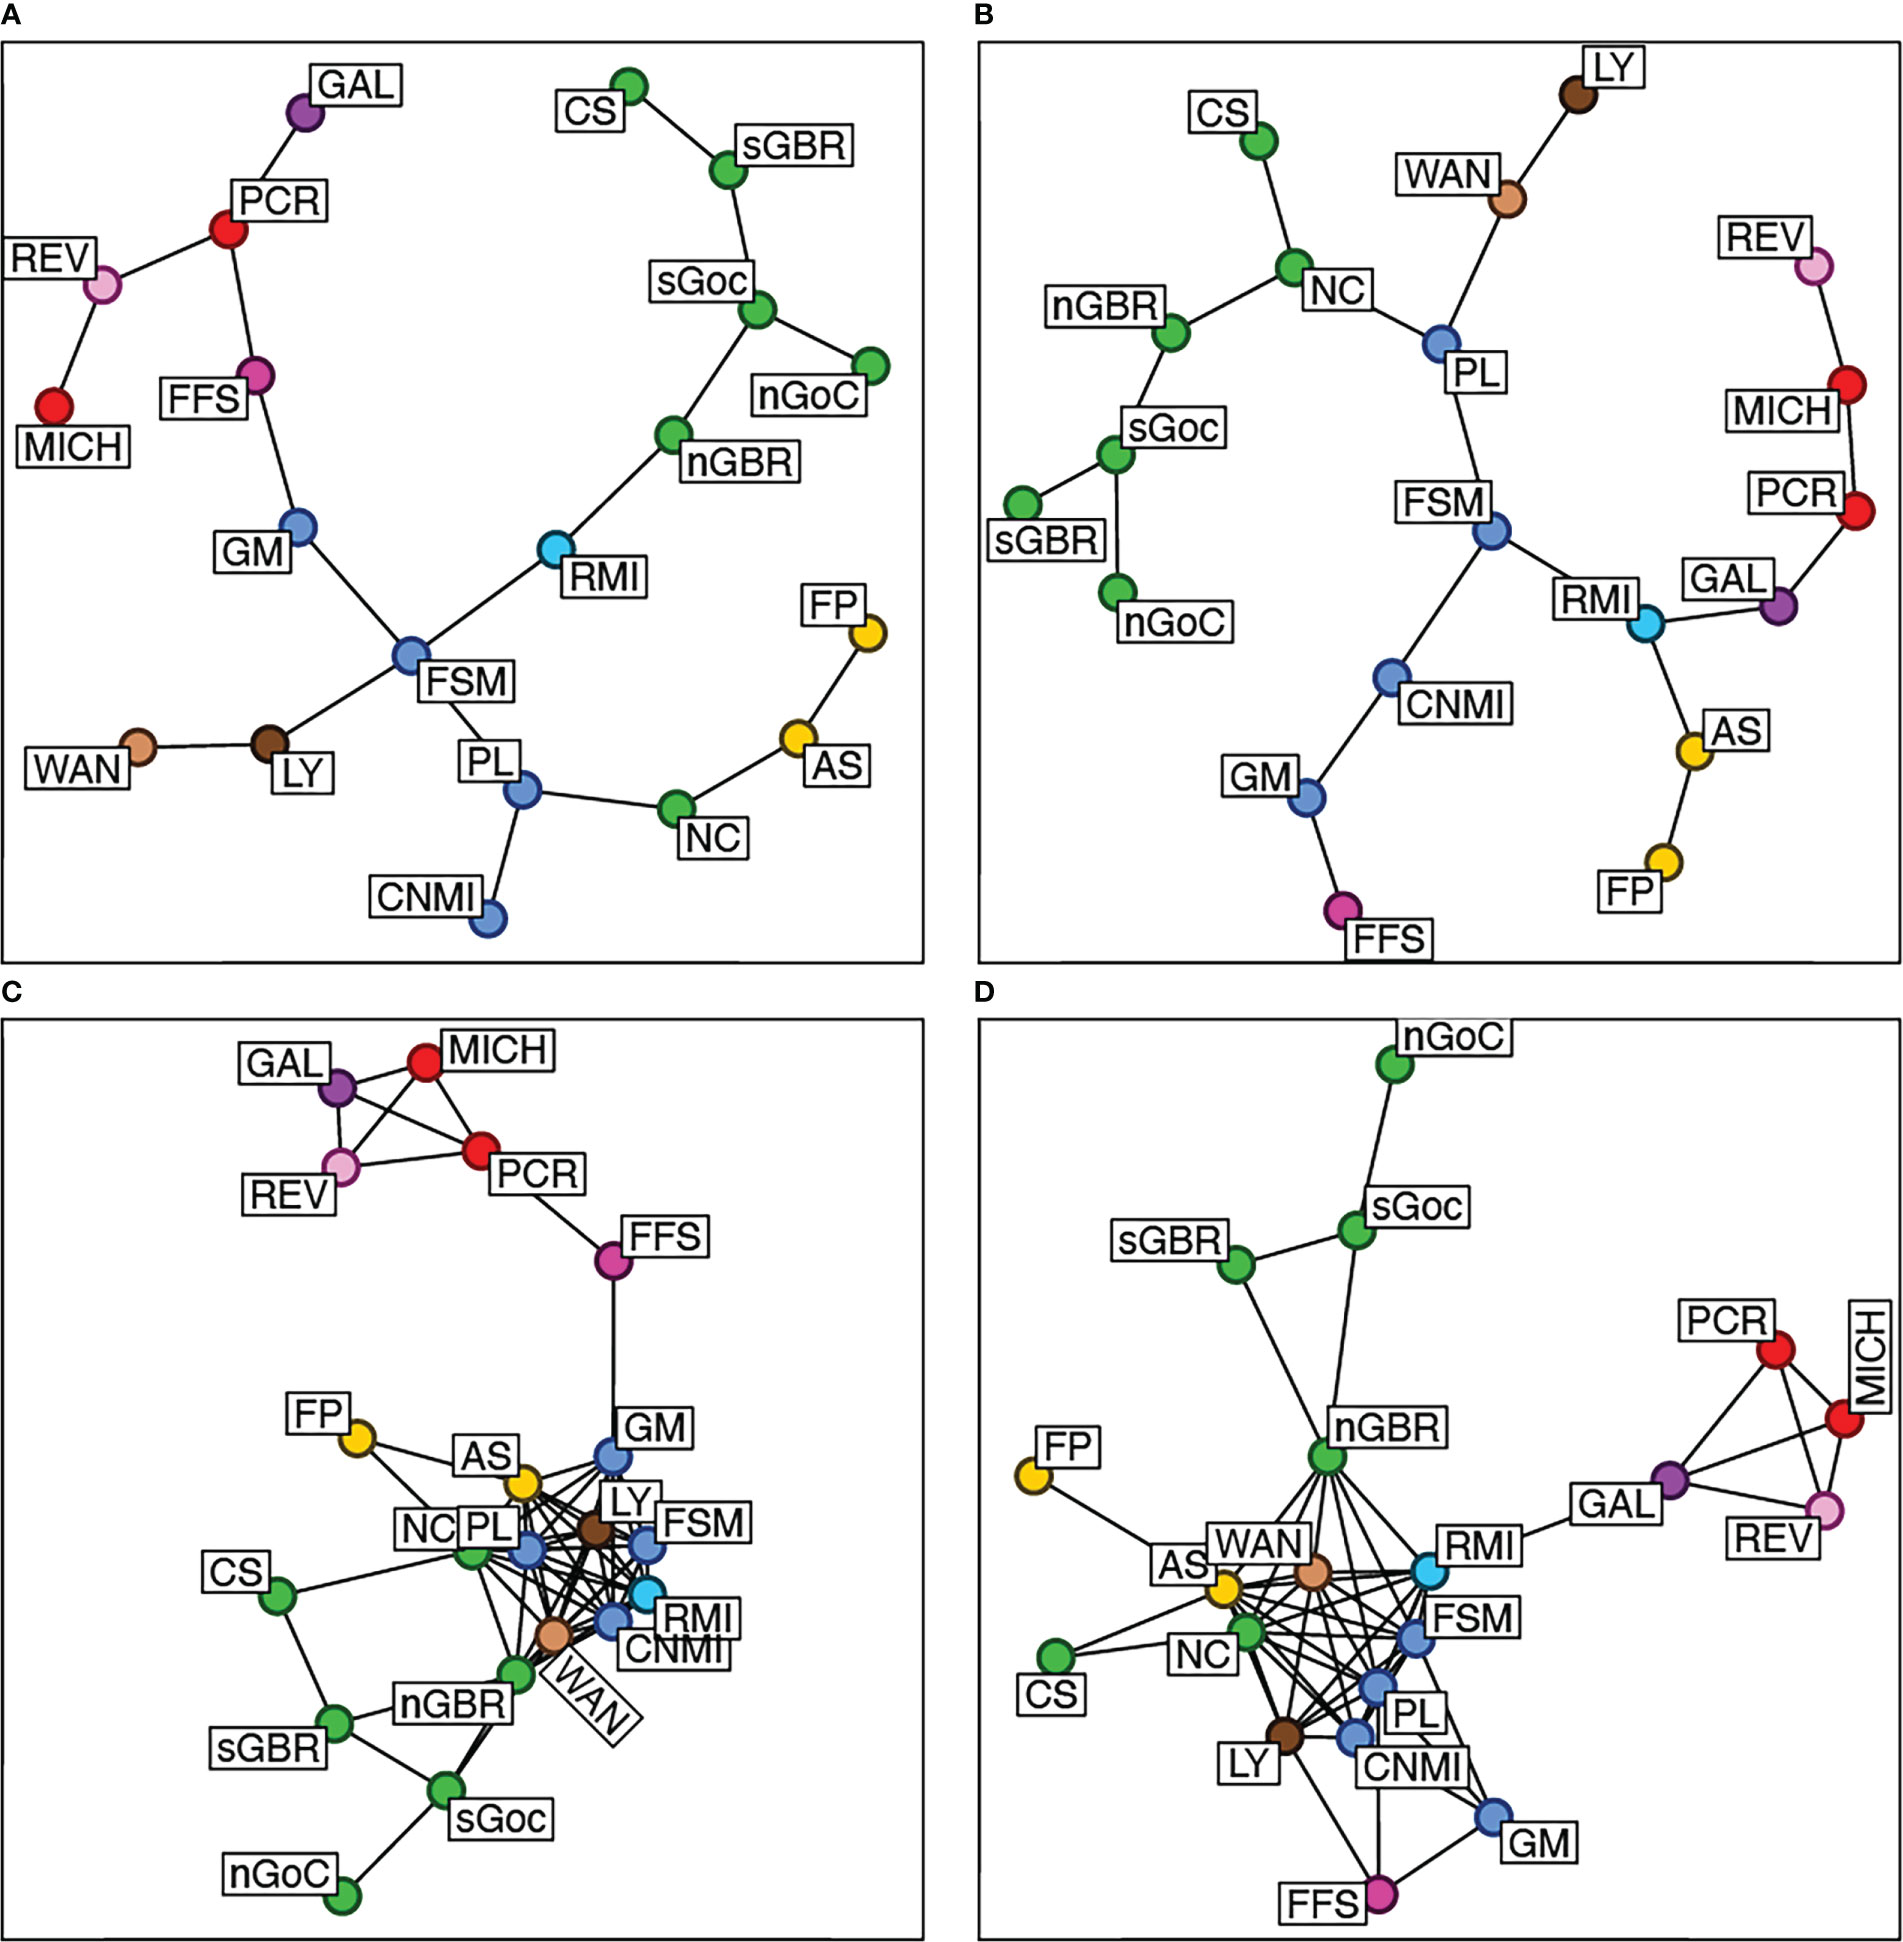
Figure 2 Genetic distance networks for all rookeries. Heterozygosity-based distances (Nei’s distance, Nei, 1978) are in the left column (A, C). Allele frequency-based distances (Edwards, 1971) are in the right column (B, D). Minimum spanning trees are on the top row. Minimum spanning networks bottom row. Edge lengths are proportionate to genetic distance. Population codes and colored reporting units are explained in Table 1.
Genetic baseline units
Based on a minimum self-assignment rate or simulated reporting accuracy threshold of 0.75, we resolved ten baseline reporting units from 20 green turtle nesting rookeries using mtDNA and nuclear microsatellite loci jointly (Tables 1, 2; Figure 1). Six of these units were represented by single nesting populations, and the rest grouped somewhat according to tectonic boundaries. The six Southwestern Pacific rookeries from Australian plate populations formed a reporting unit, as did the four rookeries from islands running the eastern boundary of the Philippine Plate. The two rookeries from the Central American coast formed a unit, while the last included American Samoa and western French Polynesia. With the exception of the Hawaiian Islands, all other Pacific Plate rookeries had some genetic similarities, sharing many of the same mtDNA haplotypes, and might have been combined into one reporting unit. However, the Marshall Islands also had similarities with the other Micronesian unit, could be considered intermediate between the Pacific Plate rookeries and the Philippine Plate rookeries, and had high enough accuracy scores to stand alone. American Samoa had high enough accuracy scores to be its own reporting unit as well, but French Polynesia was too small (n = 11) and was geographically close enough that combining the two rookeries made biological sense (Figure 2).
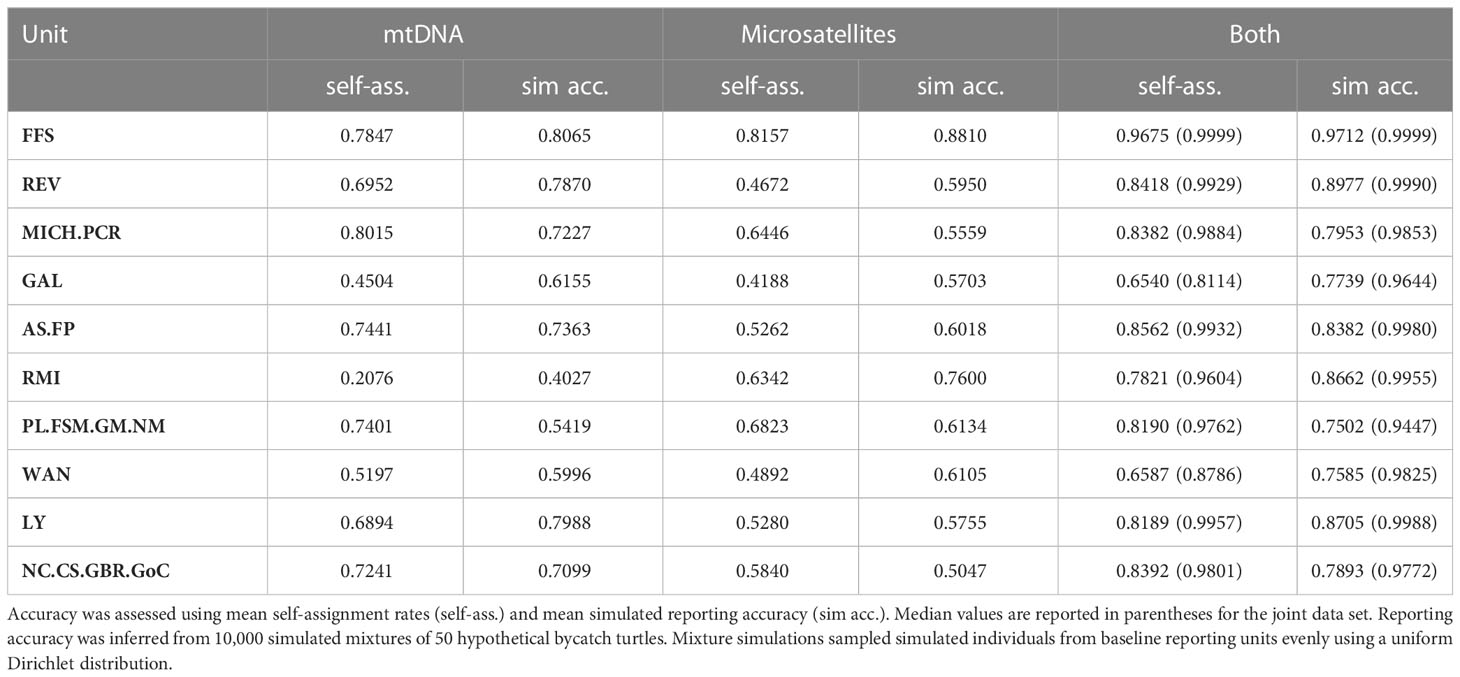
Table 2 Accuracy of mtDNA, microsatellite loci, and both marker types jointly, for genetic assignment and mixed stock analysis.
The Hawaiian reporting unit had the highest mean scores for self-assignment and simulated accuracy at 0.97 for both tests, while the Taiwanese Wan-An unit and the Galápagos unit had the lowest (Table 2). Notwithstanding that the Galápagos unit only had a mean self-assignment rate of 0.65, the median self-assignment score for this reporting unit was 0.81 and median simulated reporting accuracy was 0.96. Furthermore, all individual assignments of bycatch to this reporting unit had high statistical support (Table 3), suggesting enough unique genetic diversity in this rookery to justify being separate from the other Eastern Pacific stocks.
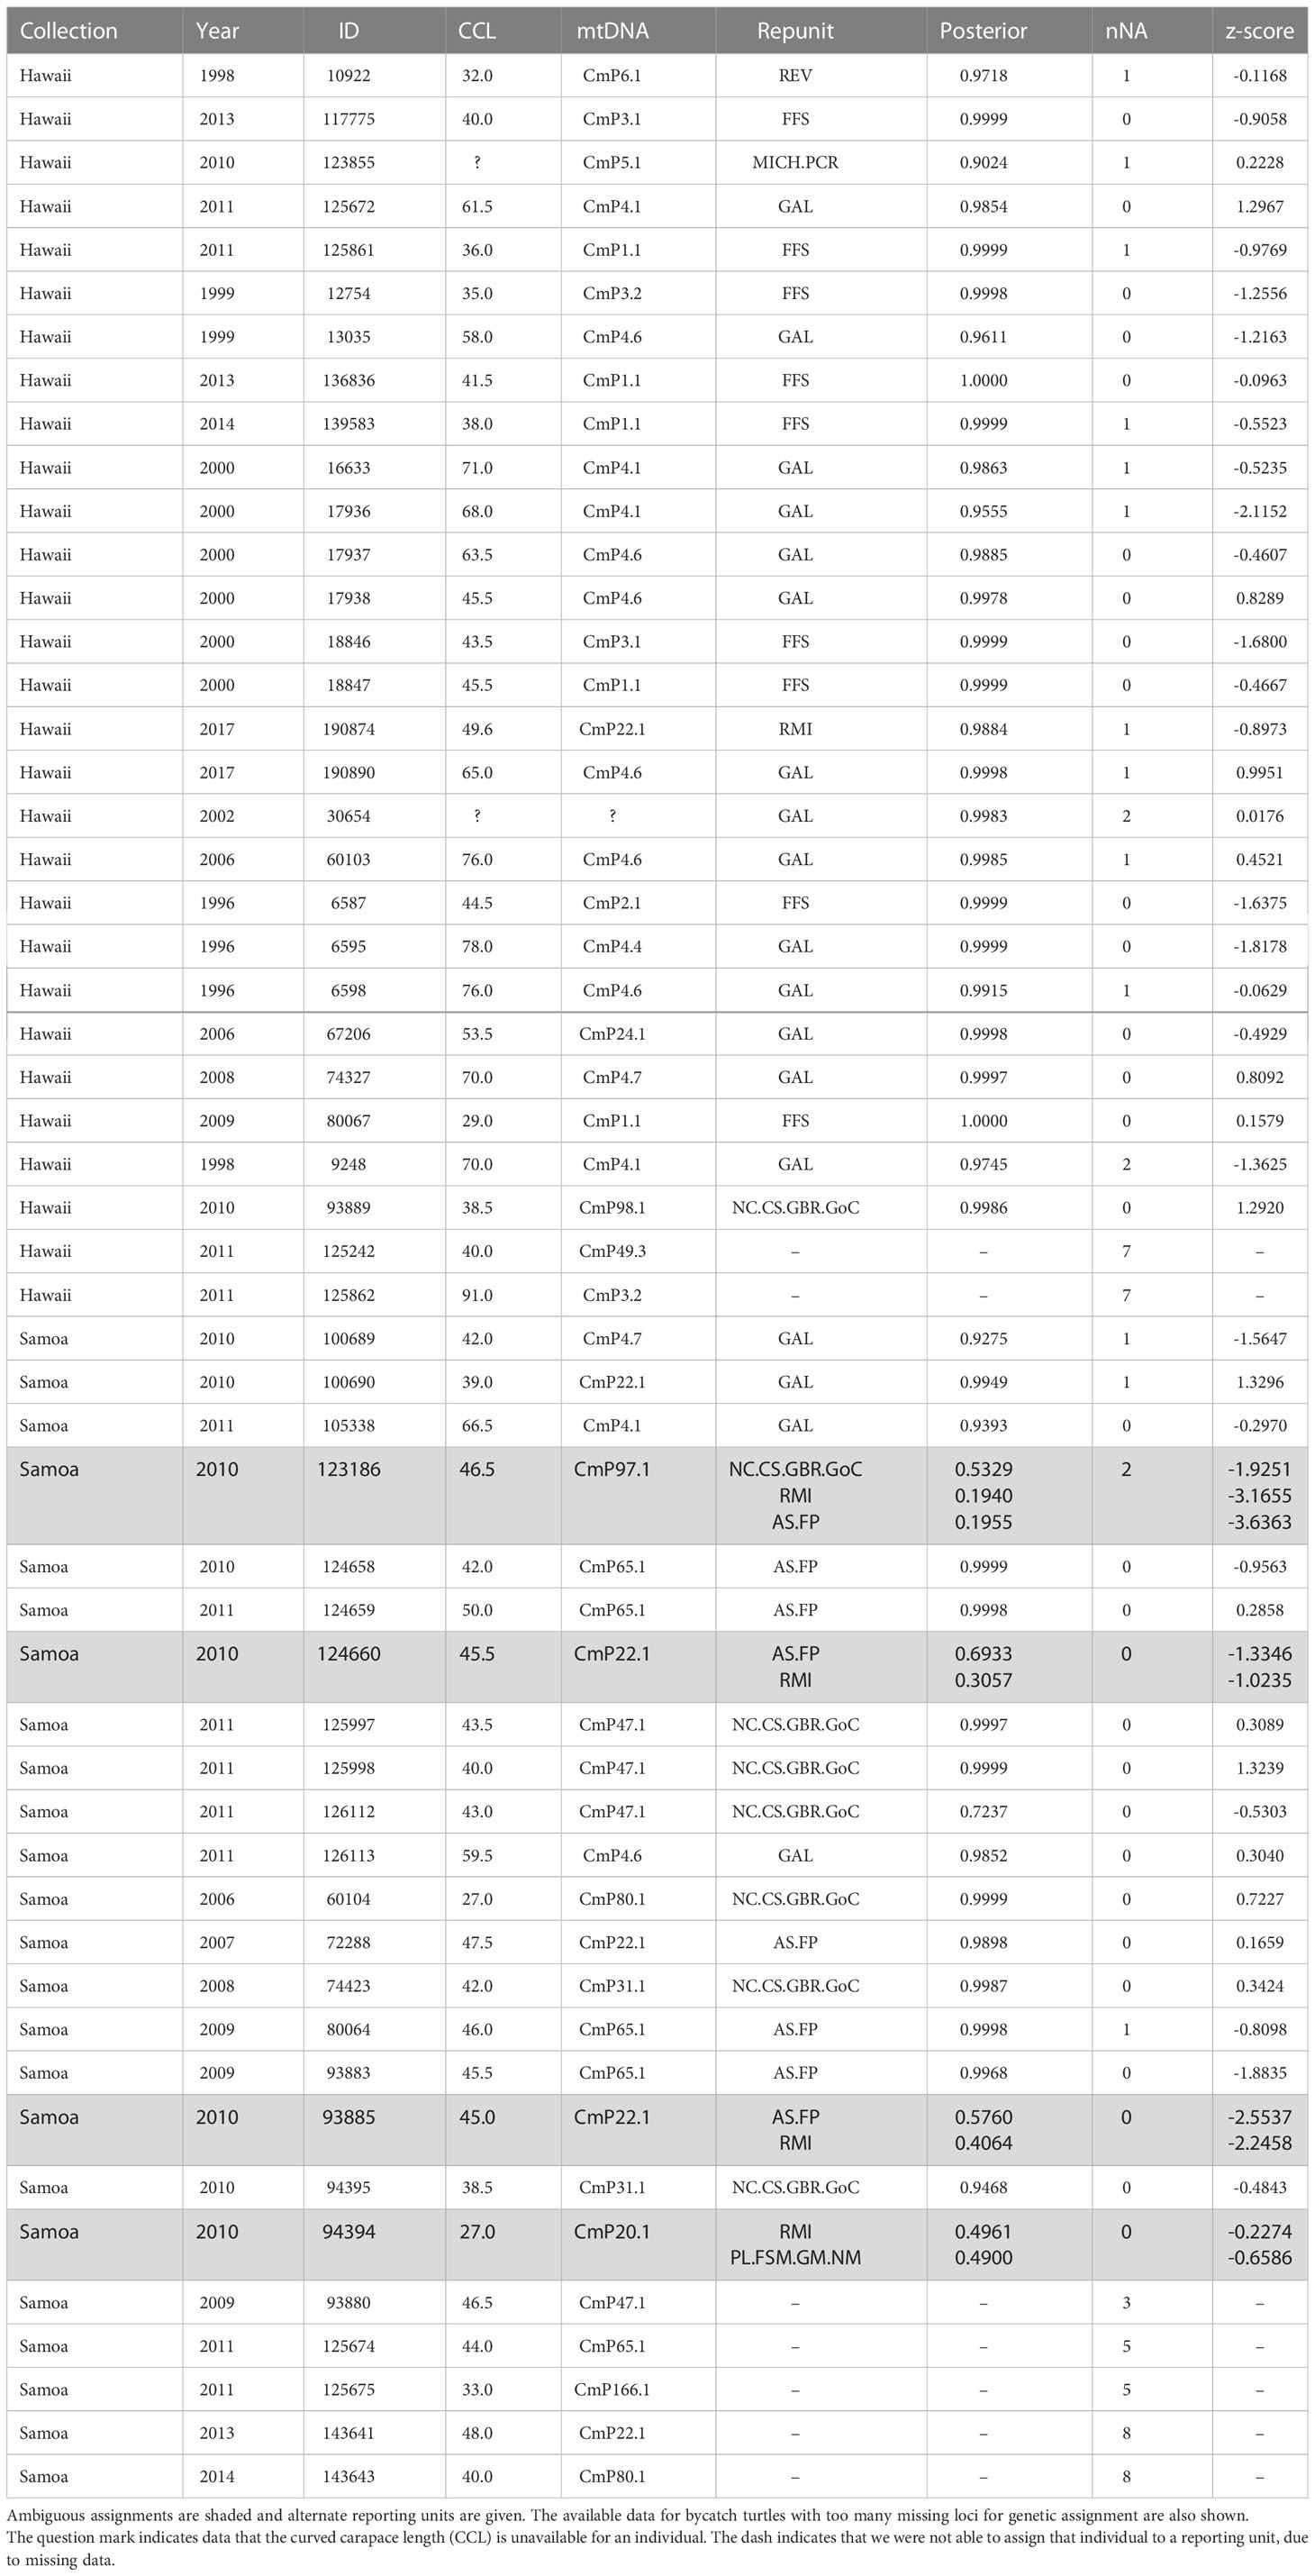
Table 3 Green turtle bycatch data: Bycatch collection, year collected, individual ID number, curved carapace length to the nearest half centimeter (CCL), mtDNA haplotype, assigned baseline reporting unit, assignment posterior, number of missing loci (nNA), and z-score.
Accuracy was greatly improved when both marker types were included, and every reporting unit showed some improvement (Table 2). For the Revillagigedo reporting unit, the combined self-assignment rate was almost 40 percentage points higher than using microsatellites alone. For the Marshall Islands unit, the combined self-assignment rate was over 50 percentage points higher than for the mtDNA alone. These results argue that mixing marker types has an obvious benefit for genetic assignment and mixed-stock analysis of sea turtles, and that nuclear DNA markers generally enhance the signal of natal philopatry in the mtDNA rather than detract from it.
Mixed-stock analysis and genetic assignment
The results of mixed-stock analysis and genetic assignment were consistent across ten independent runs, suggesting that the MCMC was able to adequately sample from the posterior distribution. The mean of all assignment posteriors for bycatch samples was 0.94, indicating that most assignments were highly supported. The mean z-score across samples was -0.39, which was within the interquartile ranges of all reference populations (Figure 3). Only four bycatch turtles were given assignments that were statistically unreliable, having a posterior less than 0.70, or a z-score below the reference minimums (Table 3).
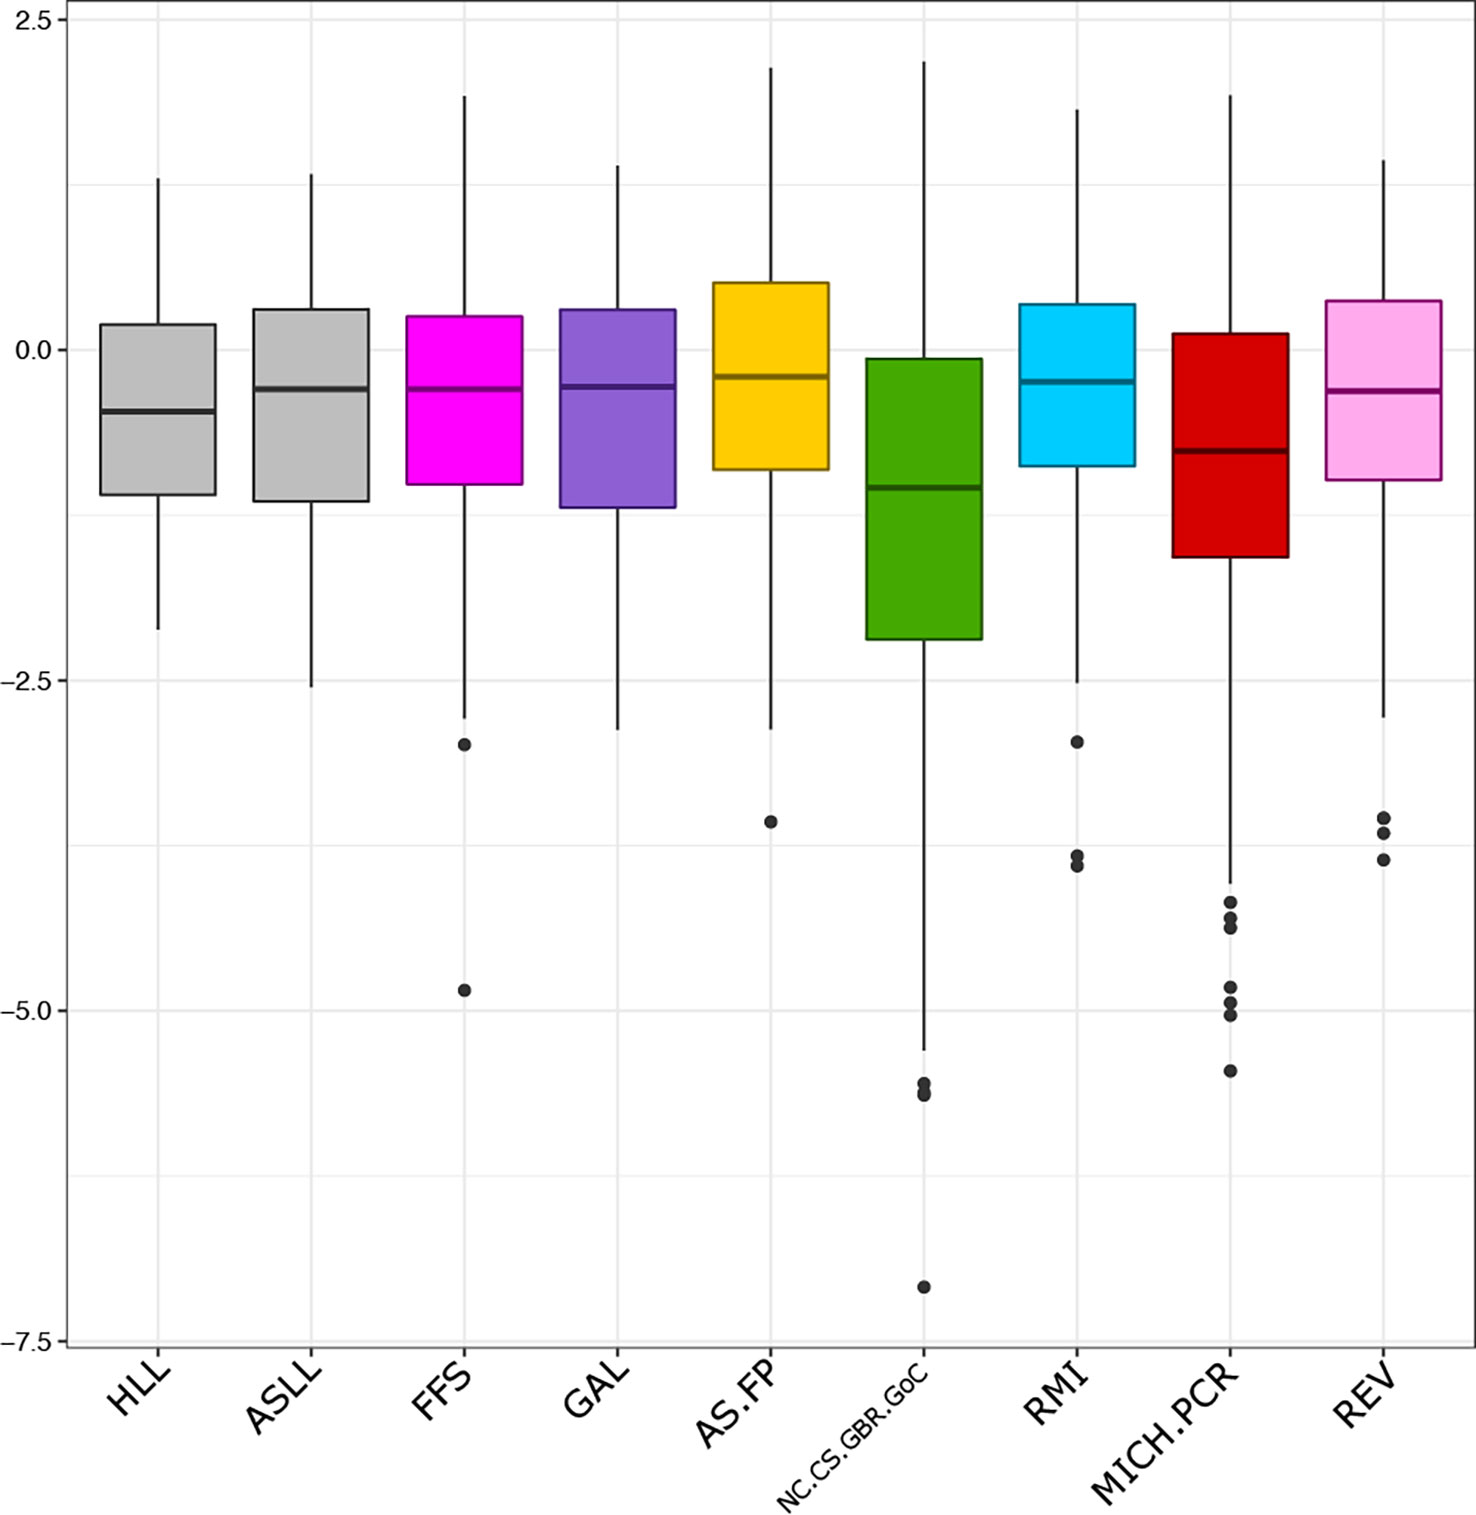
Figure 3 Z-scores for green turtle bycatch assignments (grey boxplots) from Hawaiian and American Samoan longline fisheries. Reference Z-scores calculated from self-assignment for the six most common reporting units present in bycatch samples (colored boxplots).
Turtles captured in the Hawaii-based fishery were mostly of Eastern Pacific origin. The Galápagos Islands reporting unit, in particular, represented over half of the total stock mixture with a mean scaled posterior of 0.52. Hawaiian green turtles composed about a third of the mixture (mean scaled posterior = 0.32) and all of these were encountered north of the main Hawaiian Islands (Figure 4). Other reporting units in the stock mixture were present only at low frequencies, but the individual assignments of turtles from each of these units were strong. The one turtle assigned to the Central American reporting unit had a mtDNA haplotype that is private to the Colola rookery (CmP5.1), indicating that this individual came from mainland Mexico (Table 3). The one turtle assigned to the Southwestern Pacific unit (Australia, Coral Sea, and New Caledonia) had a haplotype that is private to the Northern Great Barrier reef (CmP98.1), suggesting that this individual may have come from Raine Island, the largest green turtle rookery in the world (Seminoff et al., 2015). We also looked at private microsatellite alleles to help identify the origins of turtles within their assigned reporting units, but private alleles in our baseline were present only at low frequencies and none of our bycatch samples, apart from a few individuals assigning to the Hawaiian reporting unit, exhibited private alleles. One unassigned individual (125862) had a haplotype known previously only from Hawaii, was 91 cm in curved carapace length, and large enough to be considered an adult (Figure 3).
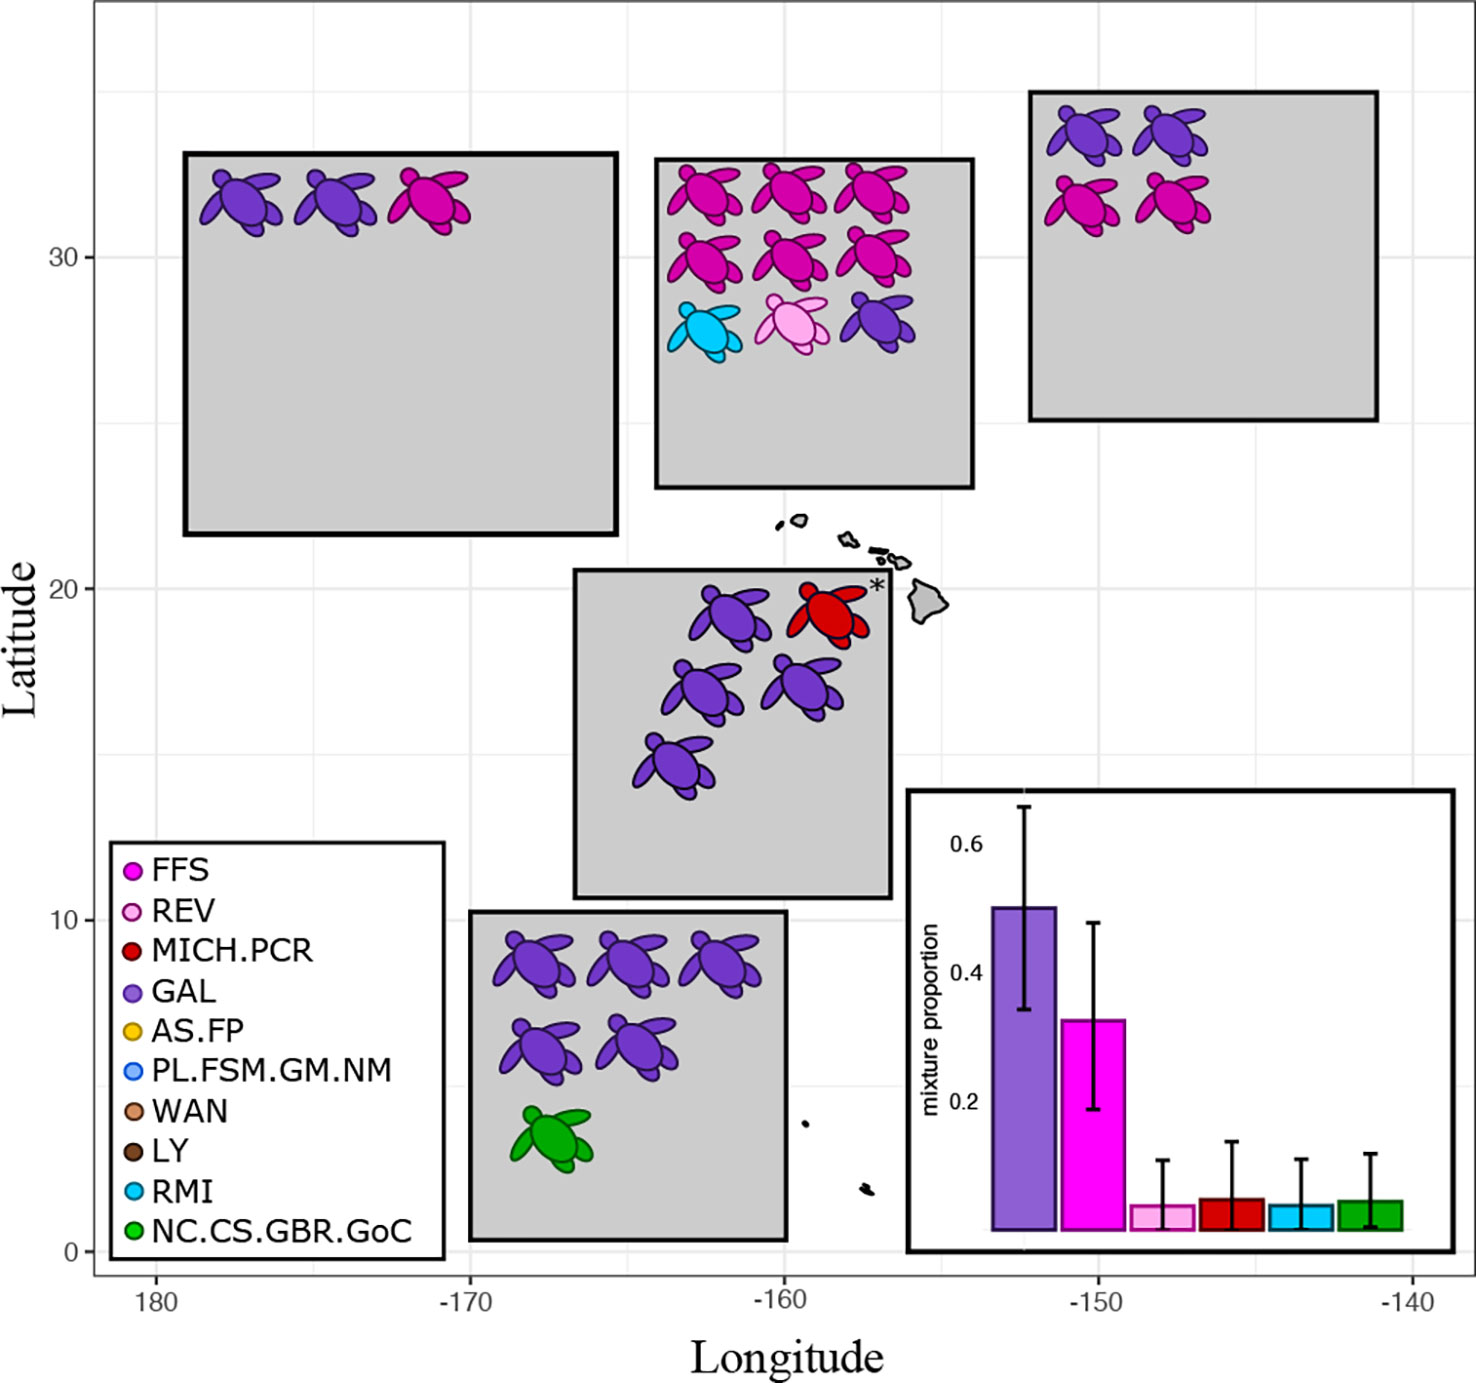
Figure 4 Genetic assignment for 27 pelagic green turtles caught as bycatch in Hawaii-based fisheries. Mean assignment posteriors and z-scores for each individual are found in Table 3. All turtles were caught by longline fishing gear, except for one net entanglement (marked with an asterisk). The bar plot insert shows the mean scaled posterior mixed-stock proportions of the bycatch, with upper and lower 95% credible intervals given as error bars. Only the top six reporting units are shown. Precise sampling locations of the bycatch cannot be shown due to confidentiality agreements and are instead summarized in shaded boxes that cover a subsampling area.
The three most prevalent reporting units in the bycatch from the American Samoa collection were: American Samoa and French Polynesia (mean scaled posterior = 0.33), Southwestern Pacific (mean scaled posterior = 0.32), and the Galápagos islands (mean scaled posterior = 0.21). The other two units with top-five mixture proportions were both from Micronesia but the lower 95% boundary of the credible interval was zero in both cases (Figure 5). The one turtle in the American Samoa bycatch collection that was individually assigned to the Marshall Islands also showed genetic similarity to the Micronesian reporting unit that included Palau (Table 3), suggesting that this individual has a common Micronesian genotype and mtDNA haplotype. Of the seven turtles assigned to the Southwestern Pacific reporting unit, two had the same rare haplotype (CmP31.1) that is known only from the Coral Sea and New Caledonia, four had haplotypes CmP47.1 and CmP80.1 that are not known from the Gulf of Carpentaria and are uncommon in the Northern Great Barrier reef, suggesting that these individuals probably also came from the Coral Sea, New Caledonia, or the Southern Great Barrier Reef. The last mtDNA haplotype for this repunit (CmP97.1) is not known from any nesting population but the microsatellite data suggests that it comes from the Southwestern Pacific. One other bycatch turtle from the American Samoa longline fishery had an orphan mtDNA haplotype, but it was missing data at five out of the nine microsatellite loci so it was not suitable for genetic assignment. Bycatch turtles excluded from genetic assignment for missing data at too many microsatellite loci are also listed in Table 3, with their mtDNA haplotype for comparison with Jensen et al. (this issue).
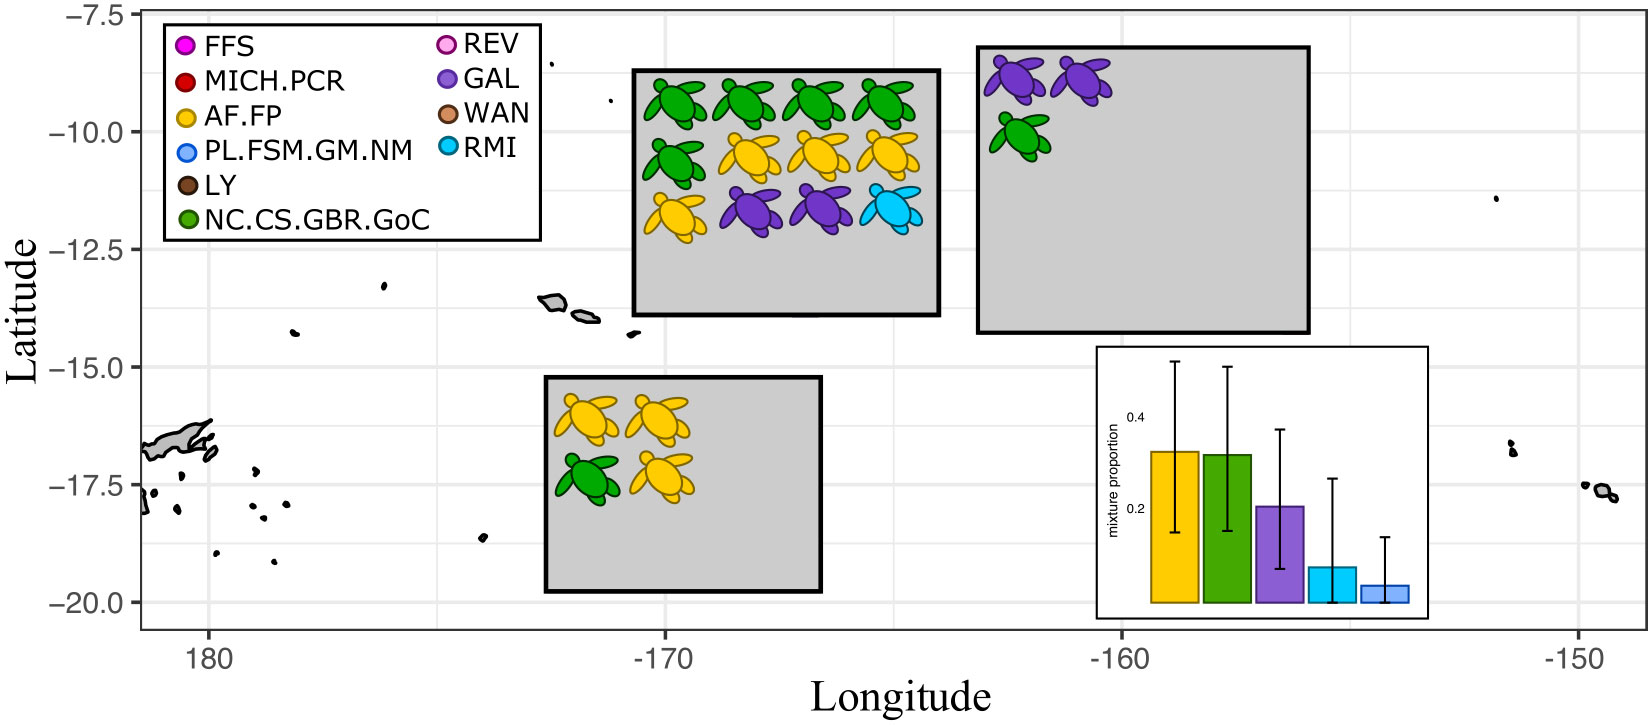
Figure 5 Genetic assignment for 19 pelagic green turtles caught by American Samoa-based longline fishing vessels. Mean assignment posteriors and z-scores for each individual are found in Table 3. The bar plot insert shows the mean scaled posterior mixed-stock proportions of the bycatch, with upper and lower 95% credible intervals given as error bars. Only the top five reporting units for each collection are shown. Precise sampling locations of the bycatch cannot be shown due to confidentiality agreements and are instead summarized in shaded boxes that cover a subsampling area.
All turtles in our bycatch collections had mtDNA haplotypes that were typical of the reporting unit they were assigned to, except for one: Turtle 100690 had the CmP22.1 haplotype that is known from American Samoa and the Marshall Islands, but this individual was assigned to the Galápagos Islands. We are unable to say whether this is a dubious assignment or if this turtle simply has an unusual genotype/haplotype combination, but the assignment to the Galápagos was strong with an assignment posterior greater than 0.99 and a positive z-score of 1.32. Therefore, in this one sample alone the signal in the microsatellites seems to be overpowering the signal in the mtDNA.
Post hoc tests of reporting unit accuracy revealed a linear relationship between simulated stock proportions and the estimation of those stock proportions (Figure 6), adding credence to our results in spite of the fact that our analysis was conducted using only nine microsatellite loci and one mtDNA marker. The Galápagos and Southwestern Pacific units had slight downward biases, and the Central American unit had a slight upwards bias at low mixing proportions, but all were nonetheless informative. Furthermore, there were no discernable differences in accuracy between reporting units present in both the Hawaiian and American Samoan fisheries, suggesting no biases between bycatch collections.
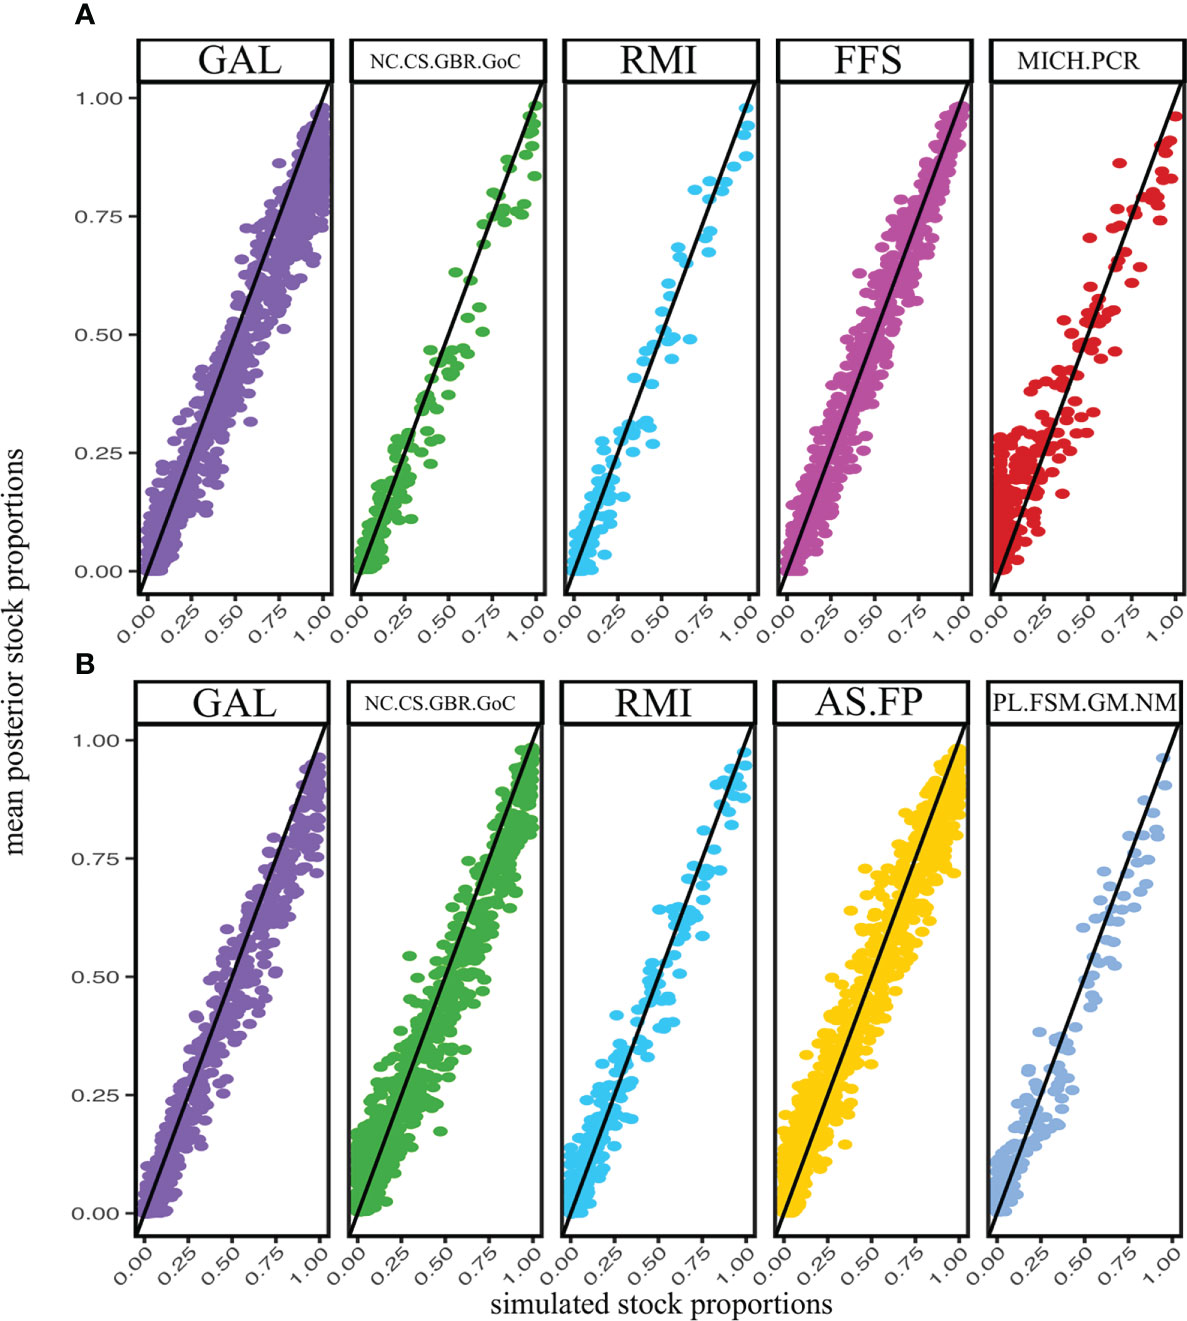
Figure 6 Comparisons of mean posterior stock estimations (y-axis) against simulated stock proportions (x-axis). Mixture simulations sampled individuals from a dirichlet distribution where the mean value for each reporting unit was the estimated mixing proportion for the Hawaiian and Samoan bycatch samples (A, B), respectively). Only the five most common units for each collection are shown. Simulations were composed of 50 hypothetical bycatch turtles and 1,000 replicate iterations.
Discussion
Biogeography and life history
During their early years, green turtles live a cryptic existence in the open ocean and are not frequently encountered by humans, except as fisheries bycatch. Even so, they are caught less often than other species and typically only when young. For these reasons the distributions of young green turtles in pelagic habitats have been largely unknown, particularly in the Pacific which has received less research attention than the Atlantic. Our results show that at least seven out of the ten baseline units designated in this study were present in the green turtle bycatch, suggesting that the pelagic distributions from many different rookeries across the Pacific basin overlap broadly in the Central Pacific.
Green turtles from the Eastern Pacific have a different color phenotype, being darker than their western counterparts, and are previously known from Hawaiian waters (and as far west as New Zealand: Godoy et al., 2012), but mtDNA has been unable to precisely assign most of these turtles to their nesting populations (Parker et al., 2011). Our mixed-marker assay better resolves genetic differences among Eastern Pacific rookeries and indicates a Galápagos origin for the majority of these individuals. The Galápagos also contributed substantially to the American Samoa bycatch, suggesting a strong presence of this reporting unit throughout the Central Pacific. Turtles assigned to the Galápagos were larger on average than those from other locations (Figure 7), with several individuals exceeding 70 cm CCL (Table 3), well above the 35-45 cm range at which greens typically transition to herbivorous diets and recruit to neritic habitats (Reich et al., 2007), and overlapping with the 60 cm CCL minimum size reported for Galápagos nesting females (Zarate et al., 2003). Parker et al. (2011) proposed several hypotheses for why eastern green turtles in the north Central Pacific tend to be larger, including an extended pelagic stage as an alternate life history, and facultative pelagic foraging by post-nesting females (see Seminoff et al., 2008). Whatever the case, our results show that eastern green turtles in the South Pacific also attain large sizes, and that this could be peculiar to the Galápagos population.
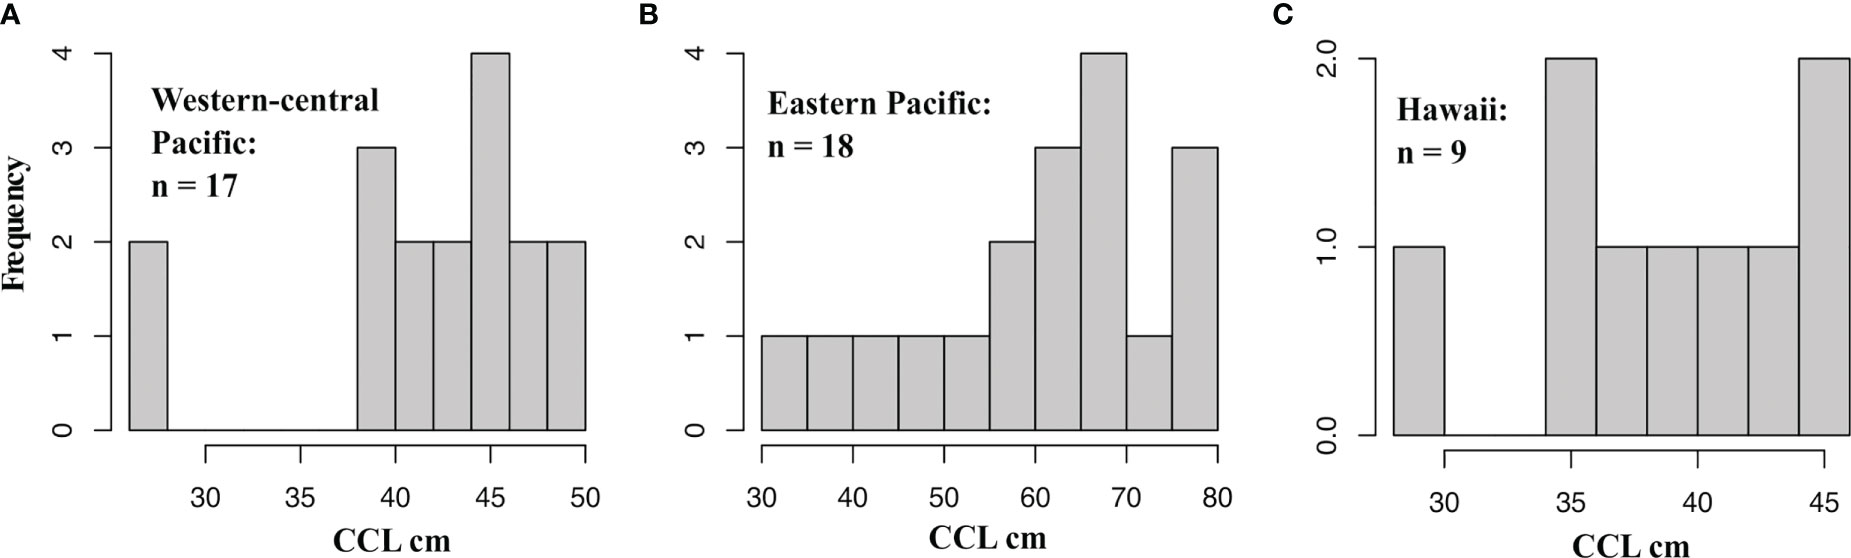
Figure 7 Histograms of curved carapace length (CCL) for all green turtle bycatch. (A) Turtles assigned to Western-central Pacific reporting units (NC.CS.GBR.GoC, AS.FP, RMI). (B) Turtles assigned to Eastern Pacific reporting units (GAL, MICH.PCR, REV). (C) Turtles assigned to the Hawaiian reporting unit (FFS).
Satellite tagging studies conducted in the Gulf of Mexico show no evidence that ocean currents influence the dispersal trajectories of 14-30 cm green turtles (Putman and Mansfield, 2015, see also Polovina et al., 2006), but with so many individuals in our study assigned to the Galápagos, the possibility of turtles riding the large North and South Equatorial Currents into the Central Pacific is difficult to ignore. It’s also worth pointing out that six turtles were caught in the North Equatorial Counter Current that spans 3-10 degrees north of the equator (Figure 4), one of these was assigned to the Southwest Pacific, possibly indicating current-use as a means of reaching the Central Pacific from the west. Young green turtles may not be passive propagules, but the algal rafts that provide them with food and cover are subject to ocean circulations (Thiel and Gutow, 2005) and could motivate turtles to go with the flow. Some evidence suggests that adult green turtles sometimes use ocean currents to migrate between foraging areas and nesting beaches (Luschi et al., 2003; Bass et al., 2006; Nishizawa et al., 2013), but at what point they learn to use currents is unknown.
Performance of the markers and baseline samples
The combined mixed-marker data set was considerably more powerful for genetic assignment than either marker type alone (Table 2). Therefore, mixing marker types allowed a finer partitioning of baseline units and greater assignment precision, without compromising much accuracy. In addition, because the two marker types have different modes of inheritance, and different substitution rates, together they offer a more complete representation of genetic diversity, not confined to strictly matrilineal gene genealogies but not excluding them either. Most assignments were consistent with the known distributions of mitochondrial haplotypes, indicating that microsatellite variation was largely in agreement with the mtDNA, while also increasing resolution. However, there were several ambiguous assignments in our results that highlight shortcomings in our marker panel and overall study design.
First, there were four individuals with assignment posteriors below 0.7 (Table 3). Considering the limited number of markers used, only four such individuals could be considered a success but all of them involved assignments to rookeries from the Western Pacific genetic cluster (Figure 2). Ambiguous assignments made up nearly a quarter of all Western Pacific assignments from this study, suggesting that our marker panel did not characterize the genetic diversity of this region very well, though sample size was small. Confusion with the Marshall Islands was a feature of every ambiguous assignment, perhaps because this reporting unit had the weakest mtDNA genetic fingerprint (Table 2). The obvious solution to this problem is to increase the number of molecular markers used, specifically selecting for loci that better resolve the Western Pacific (see next section). Increasing resolution through larger marker sets also means increasing the number of reporting units, which will enhance assignment precision.
Large combined reporting units are undesirable for several reasons, aside from being imprecise for genetic assignment and mixed stock analysis. In our data, the combined reporting units had z-score distributions much lower than single-rookery units (Figure 3), making z-scores a less reliable statistic for assessing the quality of genetic assignments. Conglomerate reporting units also introduce bias into mixed-stock analysis because larger more diverse reporting units receive a larger mixing proportion when the information content of the genetic data is poor (Moran and Anderson, 2019). In our analysis we took measures to reduce reporting unit bias (see methods) but combining so many rookeries together, such as in the case of the Southwestern Pacific, should still be avoided when possible.
Second, based on all known green turtle nesting locations (Wallace et al., 2010; Seminoff et al., 2015) the baseline used in this study is largely comprehensive for Hawaii and the East Pacific populations, but significant gaps exist in the Western Pacific. Many nesting sites in New Guinea, Indonesia, the Philippines, Japan, mainland Asia, Melanesia, and elsewhere, could have contributed to green turtle bycatch assignment in the Central Pacific. Therefore, genotyping samples from an increased number of baseline rookeries will give context to mixed-stock analysis and help resolve ambiguities in the Western Pacific.
Green turtle conservation management and future directions
Genetic assignment and mixed-stock analysis are useful tools for conservation and management, especially when molecular markers are sensitive enough to finely delineate the stock structure of baseline samples (Beacham et al., 2009; Seeb et al., 2011; McKinney et al., 2017; Beacham et al., 2020). For sea turtles, it is recognized that new molecular assays are needed to better describe the genetic diversity of nesting populations and organize them into precise demographic units (Komoroske et al., 2017). Some labs, including ours, are currently exploring genome-wide SNP panels for sea turtle conservation genetics (Komoroske et al., 2018; Banerjee et al., 2020; Driller et al., 2020; Hamabata et al., 2020; Horne et al. 2023), but the results of the present study show that not all green turtle populations require extensive panels of molecular markers for reliable stock discrimination. Furthermore, new marker development may not be fruitful without increased baseline sampling (Komoroske et al., 2017). When designing new sets of genetic markers for sea turtles it should be remembered that programs such as RUBIAS accept all bi-parentally inherited loci, including SNPs, microsatellite variants, and indels, as well as maternally inherited mtDNA, or any combination thereof. As such, mixtures of different marker types, each with its own advantages (SNPs for genomic coverage and abundance, microsatellites for allelic diversity, and mtDNA haplotypes for their association with female natal homing) should not be overlooked as best options for conservation genetics, both in terms of accuracy and cost effectiveness.
Inasmuch as the Central Pacific appears to be a crossroads for young green turtles, bycatch in this area has the potential to impact a large number of nesting populations. Turtles from nearby rookeries make up a significant portion of the bycatch (Hawaiian turtles in the Hawaiian fishery and American Samoan turtles in the American Samoan fishery; Figures 4, 5), so proximity to nesting beaches appears to influence mixed-stock proportions to some degree. But since many of the common reporting units in the bycatch, such as Hawaii, the Galápagos, mainland Mexico, American Samoa, and the Southwest Pacific, represent populations thought to be stable or increasing in numbers of nesting females (Seminoff et al., 2015), stock proportions could also be a reflection of reproductive output from major rookeries. However, turtles from struggling populations, such as the Marshall Islands (Seminoff et al., 2015), were also present in both fishery collections, in spite of small sample sizes. Therefore, the overall bycatch is collectively a well-mixed migrant pool consisting of individuals from diverse origins and represents an international marine management issue.
Though the data were limited, it may be worth noting that all bycatch individuals assigned to the Hawaiian reporting unit were encountered above 24 degrees latitude. If turtles from this rookery are primarily using pelagic habitat north of the main Hawaiian Islands during their early years, then this information could be helpful in managing the Hawaiian unit, which is currently recognized as its own DPS. Naro-Maciel et al. (2014) also show that adults foraging at Palmyra Atoll, just south of the main Hawaiian Islands (5.88˚N, 162.1˚W) do not come from the Hawaiian rookery, possibly supporting the idea that Hawaiian green turtles stay north. Without a larger mixture sample, it is difficult to draw such conclusions concretely, but given that the ranges of Pacific green turtles during their pelagic life history stages remain largely unknown, even incomplete patterns could provide clues for spatial management planning.
Data availability statement
The original data from this study are available from the Dryad data repository (www.datadryad.org) and are stored under the accession: https://doi.org/10.5061/dryad.905qfttqh.
Ethics statement
The animal study was reviewed and approved by Southwest Pacific Islands Institutional Animal Care and Use Committee (SWPI IACUC).
Author contributions
PD, JH, and SR designed the study. JH performed the data analysis, created the figures and tables, and drafted the manuscript. MtDNA sequencing and microsatellite genotyping was performed by SR, AF, and EL. Sample coordination and curation was handled by PD, GB, EL, TJ, SMa, SMu, SB. All authors contributed to the article and approved the submitted version. with the exception of SB who is a posthumous author. SB, your contributions to this work will not be forgotten.
Funding
Thank you to the National Marine Fisheries Service seagoing observers for collecting sea turtle bycatch samples for this study. Laboratory analysis was funded by NMFS, Southwest Fisheries DScience Center and Pacific Islands Regional Office.
Acknowledgments
We thank Robin LeRoux, Gabriella Serra-Valente, Vicki Pease, and Amy Lanci for laboratory assistance and support. Special thanks to Matthew Craig for helpful comments on the manuscript. This research was performed while JH held a National Research Council Associateship at the National Oceanic and Atmospheric Administration.
Conflict of interest
The authors declare that the research was conducted in the absence of any commercial or financial relationships that could be construed as a potential conflict of interest.
Publisher’s note
All claims expressed in this article are solely those of the authors and do not necessarily represent those of their affiliated organizations, or those of the publisher, the editors and the reviewers. Any product that may be evaluated in this article, or claim that may be made by its manufacturer, is not guaranteed or endorsed by the publisher.
References
Anderson E. C., Waples R. S., Kalinowski S. T. (2008). An improved method for predicting the accuracy of genetic stock identification. Can. J. Fish. Aquat. Sci. 65, 1475–1486. doi: 10.1139/F08-049
Andrews K. R., Perrin W. F., Oremus M., Karczmarski L., Bowen B. W., Puritz J. B., et al. (2013). The evolving male: spinner dolphin ( Stenella longirostris ) ecotypes are divergent at y chromosome but not mtDNA or autosomal markers. Mol. Ecol. 22, 2408–2423. doi: 10.1111/mec.12193
Banerjee S. M., Komoroske L. M., Frey A., Hancock-Hanser B., Morin P. A., Archer F. I., et al. (2020). Single nucleotide polymorphism markers for genotyping hawksbill turtles (Eretmochelys imbricata). Conserv. Genet. Resour. 12, 353–356. doi: 10.1007/s12686-019-01112-z
Bass A. L., Epperly S. P., Braun-Mcneill J. (2006). Green turtle (Chelonia mydas) foraging and nesting aggregations in the Caribbean and Atlantic: impact of currents and behavior on dispersal. J. Hered. 97, 346–354. doi: 10.1093/jhered/esl004
Beacham T. D., Candy J. R., Wallace C., Urawa S., Sato S., Varnavskaya N. V., et al. (2009). Microsatellite stock identification of chum salmon on a Pacific rim basis. N. Am. J. Fish. Manage. 29, 1757–1776. doi: 10.1577/m08-188.1
Beacham T. D., Wallace C., Jonsen K., McIntosh B., Candy J. R., Rondeau E. B., et al. (2020). Accurate estimation of conservation unit contribution to coho salmon mixed-stock fisheries in British Columbia, Canada, using direct DNA sequencing for single nucleotide polymorphisms. Can. J. Fish. Aquat. Sci. 77, 1302–1315. doi: 10.1139/cjfas-2019-0339
Bolten A. B. (2003). “Variation in sea turtle life history patterns: neritic vs. oceanic developmental stages,” in The biology of sea turtles, vol. II . Eds. Lutz P. L., Musick J. A., Wyneken J. (Boca Raton, FL: CRC Press), 243–257.
Bowen B. W., Karl S. A. (2007). Population genetics and phylogeography of sea turtles. Mol. Ecol. 16, 4886–4907. doi: 10.1111/j.1365-294X.2007.03542.x
Boyle M. C., Limpus C. J. (2008). The stomach contents of post-hatchling green and loggerhead sea turtles in the southwest Pacific: an insight into habitat association. Mar. Biol. 155, 233–241. doi: 10.1007/s00227-008-1022-z
Burkholder D. A., Heithaus M. R., Fourqurean J. W., Wirsing A., Dill L. M. (2013). Patterns of top-down control in a seagrass ecosystem: could a roving apex predator induce a behaviour-mediated trophic cascade? J. Anim. Ecol. 82, 1192–1202. doi: 10.1111/1365-2656.12097
Cardona L., Aguilar A., Pazos L. (2009). Delayed ontogenic dietary shift and high levels of omnivory in green turtles (Chelonia mydas) from the NW coast of Africa. Mar. Biol. 156, 1487–1495. doi: 10.1007/s00227-009-1188-z
Carr A., Meylan A. B. (1980). Evidence of passive migration of green turtle hatchlings in sargassum. Copeia 1980, 366. doi: 10.2307/1444022
Clemento A. J., Crandall E. D., Garza J. C., Anderson E. C. (2014). Evaluation of a single nucleotide polymorphism baseline for genetic stock identification of Chinook salmon (Oncorhynchus tshawytscha) in the California current Large marine ecosystem. Fish. Bull. 112, 112–130. doi: 10.7755/FB.112.2-3.2
Csardi G., Nepusz T. (2006). The igraph software package for complex network research. Int. J. Complex Syst. 1695. Available at: https://igraph.org.
Dibattista J. D., Rocha L. A., Craig M. T., Feldheim K. A., Bowen B. W. (2012). Phylogeography of two closely related indo-Pacific butterflyfishes reveals divergent evolutionary histories and discordant results from mtDNA and microsatellites. J. Hered. 2012, 617–629. doi: 10.1093/jhered/ess056
Driller M., Vilaca S. T., Arantes L. S., Carrasco-Valenzuela T., Heeger F., Chevallier D., et al. (2020). Optimization of ddRAD-like data leads to high quality sets of reduced representation single copy orthologs (R2SCOs) in a sea turtle multi-species analysis. bioRxiv, 024331. doi: 10.1101/2020.04.03.024331
Dutton P. H., Jensen M. P., Frey A., Lacasella E., Balazs G. H., Zárate P., et al. (2014). Population structure and phylogeography reveal pathways of colonization by a migratory marine reptile (Chelonia mydas) in the central and eastern Pacific. Ecol. Evol. 4, 4317–4331. doi: 10.1002/ece3.1269
Edwards A. W. F. (1971). Distance between populations on the basis of gene frequencies. Biometrics 27, 873–881. doi: 10.2307/2528824
Esteban N., Mortimer J. A., Stokes H. J., Lalöe J.-O., Unsworth R. K. F., Hays G. C. (2020). A global review of green turtle diet: sea surface temperature as a potential driver of omnivory levels. Mar. Biol. 167, 183. doi: 10.1007/s00227-020-03786-8
Eytan R. I., Hellberg M. E. (2010). Nuclear and mitochondrial sequence data reveal and conceal different demographic histories and population genetic processes in Caribbean reef fishes. Evolution 64, 3380–3397. doi: 10.1111/j.1558-5646.2010.01071.x
Godoy D. A., FitzSimmons N. N., Boyle M. C. (2012). “A long way from home: First confirmed records of the east Pacific green turtle (Chelonia mydas agassizii) in new Zealand,” in Proceedings of the Thirty-Second Annual Symposium on Sea Turtle Biology and Conservation (Oaxaca, Mexico).
Hamabata T., Matsuo A., Sato M. P., Kondo S., Kameda K., Kawazu I., et al. (2020). Natal origin identification of green turtles in the north Pacific by genome-wide population analysis with limited DNA samples. Front. Mar. Sci. 7. doi: 10.3389/fmars.2020.00658
Horne J.B., Frey A., Gaos A.R., Martin S., Dutton P.H. (2023). Non-random mating within an island rookery of Hawaiian hawksbill turtles: demographic discontinuity at a small coastline R. Soc. Open Sci. 10, 221547. doi: 10.1098/rsos.22154
Horne J. B., Momigliano P., Welch D. J., Newman S. J., van Herwerden L. (2011). Limited ecological population connectivity suggests low demands on self-recruitment in a tropical inshore marine fish (Eleutheronema tetradactylum: Polynemidae). Mol. Ecol. 20, 2291–2306. doi: 10.1111/j.1365-294X.2011.05097.x
Howell L., Reich K., Shaver D., Landry A. Jr., Gorga C. (2016). Ontogenetic shifts in diet and habitat of juvenile green sea turtles in the northwestern gulf of Mexico. Mar. Ecol. Prog. Ser. 559, 217–229. doi: 10.3354/meps11897
Iacchei M., Ben-Horin T., Selkoe K. A., Bird C. E., García-Rodríguez F. J., Toonen R. J. (2013). Combined analyses of kinship and FST suggest potential drivers of chaotic genetic patchiness in high gene-flow populations. Mol. Ecol. 22, 3476–3494. doi: 10.1111/mec.12341
Jackson J. B. C. (2001). What was natural in the coastal oceans? Proc. Natl. Acad. Sci. U.S.A. 98, 5411–5418. doi: 10.1073/pnas.0910
Jombart T., Ahmed I., Bateman A. (2011). Adegenet 1.3-1: new tools for the analysis of genome-wide SNP data. Bioinform. Appl. 27, 3070–3071. doi: 10.1093/bioinformatics/btr521
Keenan K., McGinnity P., Cross T. F., Crozier W. W., Prodöhl P. A. (2013). diveRsity: An r package for the estimation and exploration of population genetics parameters and their associated errors. Methods Ecol. Evol. 4, 782–788. doi: 10.1111/2041-210X.12067
Komoroske L. M., Jensen M. P., Stewart K. R., Shamblin B. M., Dutton P. H. (2017). Advances in the application of genetics in marine turtle biology and conservation. Front. Mar. Sci. 7. doi: 10.3389/fmars.2017.00156
Komoroske L., Miller M., O’Rourke S., Stewart K. R., Jensen M. P., Dutton P. H. (2018). A versatile rapture (RAD-capture) platform for genotyping marine turtles. Mol. Ecol. Resour. 19, 497–511. doi: 10.1111/1755-0998.12980
Luschi P., Hays G. C., Papi F. (2003). A review of long-distance movements by marine turtles, and the possible role of ocean currents. Oikos 103, 293–302. doi: 10.1034/j.1600-0706.2003.12123.x
McKinney G. J., Seeb J. E., Seeb L. W. (2017). Managing mixed-stock fisheries: genotyping multi-SNP haplotypes increases power for genetic stock identification. Can. J. Fish. Aquat. Sci. 74, 429–434. doi: 10.1139/cjfas-2016-0443
Mesnick S. L., Taylor B. L., Archer F. I., Martien K. K., Treviño S. E., Hancock-Hanser B. L., et al. (2011). Sperm whale population structure in the eastern and central north Pacific inferred by the use of single-nucleotide polymorphisms, microsatellites and mitochondrial DNA. Mol. Ecol. Resour. 11, 278–298. doi: 10.1111/j.1755-0998.2010.02973.x
Moran B. M., Anderson E. C. (2019). Bayesian Inference from the conditional genetic stock identification model. Can. J. Fish. Aquat. Sci. 76, 551–560. doi: 10.1139/cjfas-2018-0016
Naro-Maciel E., Gaughran S. J., Putman N. F., Amato G., Arengo F., Dutton P. H., et al. (2014). Predicting connectivity of green turtles at Palmyra atoll, central Pacific: a focus on mtDNA and dispersal modelling. J. R. Soc Interface 11, 20130888. doi: 10.1098/rsif.2013.0888
Nei M. (1978). Estimation of average heterozygosity and genetic distance from a small number of individuals. Genetics 23, 341–369. doi: 10.1093/genetics/89.3.583
Nishizawa H., Naito Y., Suganuma H., Abe O., Okuyama J., Hirate K., et al. (2013). Composition of green turtle feeding aggregations along the Japanese archipelago: Implications for changes in composition with current flow. Mar. Biol. 160, 2671–2685. doi: 10.1007/s00227-013-2261-1
Parker D. M., Dutton P. H., Balazs G. H. (2011). Oceanic diet and distribution of haplotypes for the green turtle, Chelonia mydas, in the central north Pacific. Pac. Sci. 65, 419–431. doi: 10.2984/65.4.419
Petersen S. L., Honig M. B., Ryan P. G., Nel R., Underhill L. G. (2009). Turtle bycatch in the pelagic longline fishery off southern Africa. Afr. J. Mar. Sci. 31, 87–96. doi: 10.2989/AJMS.2009.31.1.8.779
Pimiento C., Leprieur F., Silvestro D., Lefcheck J. S., Albouy C., Rasher D. B., et al. (2020). Functional diversity of marine megafauna in the anthropocene. Sci. Adv. 6, eaay7650. doi: 10.1126/sciadv.aay7650
Polovina J., Uchida I., Balazs G., Howell E. A., Parker D., Dutton P. (2006). The kuroshio extension bifurcation region: A pelagic hotspot for juvenile loggerhead sea turtles. Deep Sea Res. Part II: Top. Stud. Oceanogr. 53, 326–339. doi: 10.1016/j.dsr2.2006.01.006
Putman N. F., Mansfield K. L. (2015) Direct evidence of swimming demonstrates active dispersal in the sea turtle “lost years.” Curr. Biol 25, 1221–1227 doi: 10.1016/j.cub.2015.03.014
Putman N. F., Naro-Maciel E. (2013). Finding the ‘lost years’ in green turtles: insights from ocean circulation models and genetic analysis. Proc. R. Soc B: Biol. Sci. 280, 20131468. doi: 10.1098/rspb.2013.1468
Reich K. J., Bjorndal K. A., Bolten A. B. (2007). The ‘lost years’ of green turtles: using stable isotopes to study cryptic lifestages. Biol. Lett. 3, 712–714. doi: 10.1098/rsbl.2007.0394
Roden S. E., Horne J. B., Jensen M. P., FitzSimmon N. N., Balazs G. H., Cruce Horeg J., et al. (2023). Population structure of Pacific green turtles: a new perspective from microsatellite DNA variation. Front. Mar. Sci. 10. doi: 10.3389/fmars.2023.1116941
Seeb J. E., Carvalho G., Hauser L., Naish K., Roberts S., Seeb L. W. (2011). Single-nucleotide polymorphism (SNP) discovery and applications of SNP genotyping in nonmodel organisms. Mol. Ecol. Resour. 11 (Suppl. 1), 1–8. doi: 10.1111/j.1755-0998.2010.02979.x
Seminoff J. A., Allen C. D., Balazs G. H., Dutton P. H., Eguchi T., Haas H., et al. (2015). Status review of the green turtle (Chelonia mydas) under the U.S. endangered species act (Washington D.C.: NOAA Technical Memorandum, NOAA-NMFS-SWFSC-539), 571.
Seminoff J., Zárate P., Coyne M., Foley D., Parker D., Lyon B., et al. (2008). Post-nesting migrations of galápagos green turtles chelonia mydas in relation to oceanographic conditions: integrating satellite telemetry with remotely sensed ocean data. Endanger. Species Res. 4, 57–72. doi: 10.3354/esr00066
Smith M. M., Salmon M. (2009). A comparison between the habitat choices made by hatchling and juvenile green turtles (Chelonia mydas) and loggerheads (Caretta caretta). Mar. Turtle Newslett. 126, 9–13.
Stewart K. R., LaCasella E. L., Roden S. E., Jensen M. P., Stokes L. W., Epperly S. P., et al. (2016). Nesting population origins of leatherback turtles caught as bycatch in the U.S. pelagic longline fishery. Ecosphere 7, e10272. doi: 10.1002/ecs2.1272
Thiel M., Gutow L. (2005). The ecology of rafting in the marine environment. i. the floating substrata. Oceanogr. Mar. Biol: Annu. Rev. 42, 181–264.
Wallace B. P., DiMatteo A. D., Hurley B. J., Finkbeiner E. M., Bolten A. B., Chaloupka M. Y., et al. (2010). Regional management units for marine turtles: A novel framework for prioritizing conservation and research across multiple scales. PloS One 5, e15465. doi: 10.1371/journal.pone.0015465
Witherington B. E. (2002). Ecology of neonate loggerhead turtles inhabiting lines of downwelling near a gulf stream front. Mar. Biol. 140, 843–853. doi: 10.1007/s00227-001-0737-x
Witherington B., Hirama S., Hardy R. (2012). Young sea turtles of the pelagic sargassum-dominated drift community: habitat use, population density, and threats. Mar. Ecol. Prog. Ser. 463, 1–22. doi: 10.3354/meps09970
Work T. M., Balazs G. H. (2002). Necropsy findings in sea turtles taken as bycatch in the north Pacific longline fishery. Fish. Bull. 100, 876–880.
Work T. M., Balazs G. H. (2010). Pathology and distribution of sea turtles landed as bycatch in the Hawaii-based north Pacific pelagic longline fishery. J. Wildl. Dis. 46, 422–432. doi: 10.7589/0090-3558-46.2.422
Zarate P., Fernie A., Dutton P. (2003). “First results of the East Pacific green turtle, chelonia mydas, nesting population assessment in the Galapagos islands,” in Proceedings of the Twenty-Second Annual Symposium on Sea Turtle Biology and Conservation. (Washington D.C.: NOAA Technical Memorandum NMFS-SEFSC-503) 70–73. Seminoff, J.A.
Keywords: sea turtles, conservation genetics, population assignment, lost years, Pacific Ocean, longline fisheries
Citation: Horne JB, Roden SE, LaCasella EL, Frey A, Martin SL, Jones TT, Murakawa S, Brunson S, Balazs GH and Dutton PH (2023) Origins of green turtle fishery bycatch in the central Pacific revealed by mixed genetic markers. Front. Mar. Sci. 10:1112842. doi: 10.3389/fmars.2023.1112842
Received: 30 November 2022; Accepted: 21 March 2023;
Published: 03 July 2023.
Edited by:
Molly E. Lutcavage, University of Massachusetts Boston, United StatesReviewed by:
Kiki E. M. Dethmers, Royal Netherlands Institute for Sea Research (NIOZ), NetherlandsJeanne A. Mortimer, University of Florida, United States
Copyright © 2023 At least a portion of this work is authored by John B. Horne, Suzanne E. Roden, Erin L. LaCasella, Amy Frey, T.Todd Jones, Shawn Murakawa, Shandell Brunson and Peter H. Dutton on behalf of the U.S. Government and as regards Dr. Horne, Ms. Roden, Ms. LaCasella, Ms. Frey, Dr. Jones, Ms. Murakawa, Ms. Brunson and Dr. Dutton and the U.S. Government, is not subject to copyright protection in the United States. Foreign and other copyrights may apply. This is an open-access article distributed under the terms of the Creative Commons Attribution License (CC BY). The use, distribution or reproduction in other forums is permitted, provided the original author(s) and the copyright owner(s) are credited and that the original publication in this journal is cited, in accordance with accepted academic practice. No use, distribution or reproduction is permitted which does not comply with these terms.
*Correspondence: John B. Horne, am9obi5ob3JuZUBnbWFpbC5jb20=
†Deceased