 Yuji Zhang
 Xu Yang1*
 Fukun Gui
- 1National Engineering Research Center for Marine Aquaculture, Zhejiang Ocean University, Zhoushan, China
- 2School of Fisheries, Zhejiang Ocean University, Zhoushan, China
- 3School of Naval Architecture and Maritime, Zhejiang Ocean University, Zhoushan, China
To improve the water reuse efficiency of circular recirculating aquaculture tanks in Recirculating Aquaculture Systems (RAS) this research investigated the effect of inlet pipe deployment distance d (the distance between the stream tube hole and the tank wall) and the inlet pipe deployment angle α (the acute angle between the inlet pipe jetting direction and the nearest tank wall) on the self-cleaning ability of the circular aquaculture tank under dual and single inlet pipe designs. First, waste collection experiments were conducted to figure out the preferable inlet pipe design based on the efficiency of waste collection. Then, flow field measurement experiments were carried out employing the Particle Image Velocimetry (PIV) technique to measure the flow field in the near bottom layer of the tank, and the essential mechanism of the inlet pipe deployment on the waste collection was explored by analyzing the flow field and the corresponding hydrodynamic characteristic indicators, such as the average flow velocity (vavg), the uniformity coefficient of water flow (DU50), and the water resistance coefficient (Ct). The results indicate that the variations of waste movement, flow filed and hydrodynamic indicators are consistent in both designs of dual inlet and single inlet, and merely differ in the absolute value. Based on the comprehensive analysis, the optimal performance of self-cleaning can be obtained at α=0°~10°, 20°~30°, 40°~50° for d=1/2 r, 1/4 r, and 1/50 r, respectively. At the same flow rate condition, the jetting velocity of the inlet pipe in the single inlet pipe design is significantly greater than that in the dual inlet pipe design, and the hydrodynamic characteristics of the waste collection are better. Therefore, in circulating water aquaculture production, it is recommended to design the inlet pipe in a similar aquaculture tank to the single inlet pipe with d=1/4 r, α=20°~30°, thus improving the self-cleaning ability of the aquaculture tank. The study results also provide a reference for adjusting the inlet pipe in circular recirculating aquaculture tank.
1 Introduction
China is the world’s largest aquaculture country, with aquaculture production accounting for most of the world’s total aquaculture production, but many problems need to be solved, such as low efficiency of the current production system, pollution of the aquaculture environment, and frequent occurrence of diseases. Under resource and environmental constraints, the Recirculating Aquaculture System (RAS) has been recognized as an effective solution for increased biosecurity and control of parasites and pathogens and gradually becomes one of the main directions for the future development of aquaculture in China. RAS is an advanced aquaculture method with a high level of aquaculture technology and a controllable aquaculture environment, which has the advantages of integrated use of space and water, intensive production, and fewer negative environmental impacts. Thus, it performs much better than traditional aquaculture methods, such as ponds and open-water aquaculture in the outdoor environment. Effective removal of offish wastes (uneaten feed and feces) is crucial for RAS since they can be decomposed into fine particles and release a series of harmful substances to cultured fishes. Overall, improving the self-cleaning ability to remove fish wastes from tank water is conducive to enhancing the water quality of the aquaculture system to maintain a good culture environment and achieve satisfactory production.
A good flow environment of aquaculture tanks contributes to the welfare and growth of cultured fish. The circular tank is widely used in RAS. However, there is few design criteria in particles to guide the inlet pipe design. Thus, it is of vital importance to figure out the effect of inlet pipe design on the flow environment to improve the self-cleaning ability of circular tanks. Many previous studies have focused on this problem and given many helpful results. Tvinnereim et al. (1989) and Skybakmoen et al. (1989) compared the effects of four inlet pipe designs of open-ended pipe point source, vertical inlet pipe with evenly spaced holes, lateral inlet pipe with evenly spaced holes, and a combination of horizontal and vertical inlet pipes. They recommended using the lateral inlet pipe to drive the water body in actual production, and the formula for calculating the average flow velocity in the culture tank was also given. Burrows et al. (1995) advanced the experimental method by injecting pigments into a model circular aquaculture tank to observe pigment distribution to visualize its hydrodynamic characteristics. Benoit et al. (2007) showed through an experiment that different inlet pipe angles significantly affect the flow field distribution in the aquaculture tank. Firstly, three-dimensional unsteady models were established by replacing a rectangular tank with a circular arc tank. Then, the hydrodynamics of recirculating aquaculture tanks were analyzed, including velocity distribution, vorticity strength, energy effective utilization coefficient, and the flow uniformity index. Furthermore, flow characteristics, including the evolution of turbulent structures and the relevant influence factors, were also analyzed. Finally, a comprehensive performance index was proposed to effectively evaluate the spatial utilization and hydrodynamic characteristics for different aquaculture tanks. In addition to experiments, numerical techniques have been widely applied to analyze the flow field and improve fish wastes removal efficiency (Ren et al., 2020; Xue et al., 2020). The study of Davidson et al. (2004) demonstrated that the deployment angle of the jetting pipe is an important parameter affecting the tangential and radial flow velocity in the aquaculture tank, while the average flow velocity (vavg) in the aquaculture tank is an important indicator of waste collection ability, and the larger the average flow velocity, the better the waste collection ability. Good water flow uniformity in the aquaculture tank can make the distribution of dissolved oxygen more uniform, which is beneficial to the growth of aquaculture objects. Oca and Masalo et al. (2013) used the velocity distribution uniformity coefficient (DU50) to measure velocity distribution uniformity. In addition, characteristic quantities such as torque, friction coefficient, wall shear stress, velocity gradient, and kinetic energy gradient affect the flow field distribution, the effect of waste collection and discharge, and the distribution pattern of dissolved oxygen in the tank. Venegas et al. (2014) conducted experiments on the effect of the injector on flow field characteristics in a circular aquaculture tank, where the inlet system was switched to an injector. Studies have indicated that injectors obtain better results than the conventional setup, e.g., producing significantly higher tangential velocity and uniformity of the flow field and lower mixing times and secondary flow patterns, thus ensuring self-cleaning of fish wastes. The hydrodynamic characteristics of the waste collection of the aquaculture tank have been studied by investigating the waste collection or discharge ability in the aquaculture tank. Optimizing the design of the tank shape and the internal structure parameters of the aquaculture tank system can improve the flow field conditions in the aquaculture tank, which is crucial to increasing energy utilization and improving the collection and discharge performance of the aquaculture tank system. investigated the effect of different water intake structures on the flow velocity and discharge in a circular aquaculture tank. They considered that the key to waste discharge was that the flow velocity at each point of the tank bottom was greater than the starting flow velocity of waste. Oca et al. (2007) carried out a comparative analysis of water flow patterns in rectangular aquaculture tanks with four different inlet and outlet modes, and they used Particle Tracking Velocimetry (PTV) to track the flow patterns in the tank. The study results indicated that the horizontal tangential inlet mode effectively reduces the low-flow velocity vortex zone, leading to higher and more uniform flow velocity in the tank and avoiding sludge settling. Currently, there are few studies on the self-cleaning ability of different inlet modes of circular aquaculture tanks, and the change in the parameters of the aquaculture tank system will directly affect the hydrodynamic characteristics of the aquaculture tank, which further affects the waste collection and discharge performance. Therefore, it is necessary to conduct in-depth systematic research on the self-cleaning ability of circular aquaculture tanks, optimize the flow field characteristics of the system, and enhance the self-cleaning ability of the aquaculture tank, thus ensuring the stable operation of the aquaculture tank system.
Currently, Hu et al. (2022) have explored the self-cleaning ability of octagonal aquaculture tanks and the results indicated that the inlet pipe design has considerable effects on the hydrodynamic characteristics and further the performance of fish wastes collection and discharge within the tank. However, similar studies on circular aquaculture tanks are rare. To further investigate the self-cleaning ability of circular aquaculture tanks, this paper conducts an in-depth systematic study on the self-cleaning ability of circular aquaculture tanks based on the research of Hu et al. (2022). The study results can guide the design of the most common circular aquaculture tanks in actual production.
2 Materials and methods
To elucidate the effect of inlet pipe design on the aquaculture tank's self-cleaning ability, waste collection and flow field experiments in the aquaculture tank were carried out. The details of the experiments are as follows.
2.1 Waste movement collection experiments in aquaculture tank
2.1.1 Setup of waste collection experiments
The experiment on the effect of the inlet pipe design on waste collection in the aquaculture tank was conducted at the National Engineering Research Center for Marine Aquaculture, Zhejiang Ocean University. The aquaculture tank is connected to the conical barrel through a wire pipe, and the water in the tank forms a circulation through the pump. As indicated in Figure 1, the blue arrow represents the direction of water flowing out of the aquaculture tank, and the red arrow represents the direction of water flowing into the aquaculture tank. The circular tank is made of transparent acrylic sheets, with a height of 50 cm, an internal diameter of 98 cm, a flat bottom, and a drainage opening right in the center with a diameter of 5 cm. The circular tank is placed on an operating table made of aluminum profiles. The inlet pipe is a rigid PVC pipe with an external diameter of 20 mm, which is set up on an aluminum operating table, and the distance of the inlet pipe is adjusted by changing the length of the horizontal PVC pipe above the aquaculture tank. A dial is placed at the connection of the inlet pipe and the bracket, a pointer is set on the inlet pipe in the same direction as the inlet, and the pointer is kept relatively stationary with the inlet pipe. When the inlet pipe turns, the pointer points out the corresponding angle on the dial, thus adjusting the angle of the inlet pipe. The flow meter measurement system consists of a valve and two flow meters (Keyence FD-Q20C) mounted on the inlet pipe. The valve regulates the volume of the water flow in the inlet pipe, and the flow meter monitors the flow rate (L/min) of the water input from the inlet pipe to the aquaculture tank in real time, thus achieving precise control of the inlet pipe flow. The inlet pipe has three uniform round holes of 5 mm at an interval of 3 cm from the bottom so that water enters the aquaculture tank evenly. The image acquisition system consists of a high-definition camera (VA-200PRO) placed directly above the tank and the corresponding control software, which mainly records the waste particle's movement process. Besides, a white film is laid on the bottom of the aquaculture tank to more clearly capture the waste distributed at the bottom of the tank.
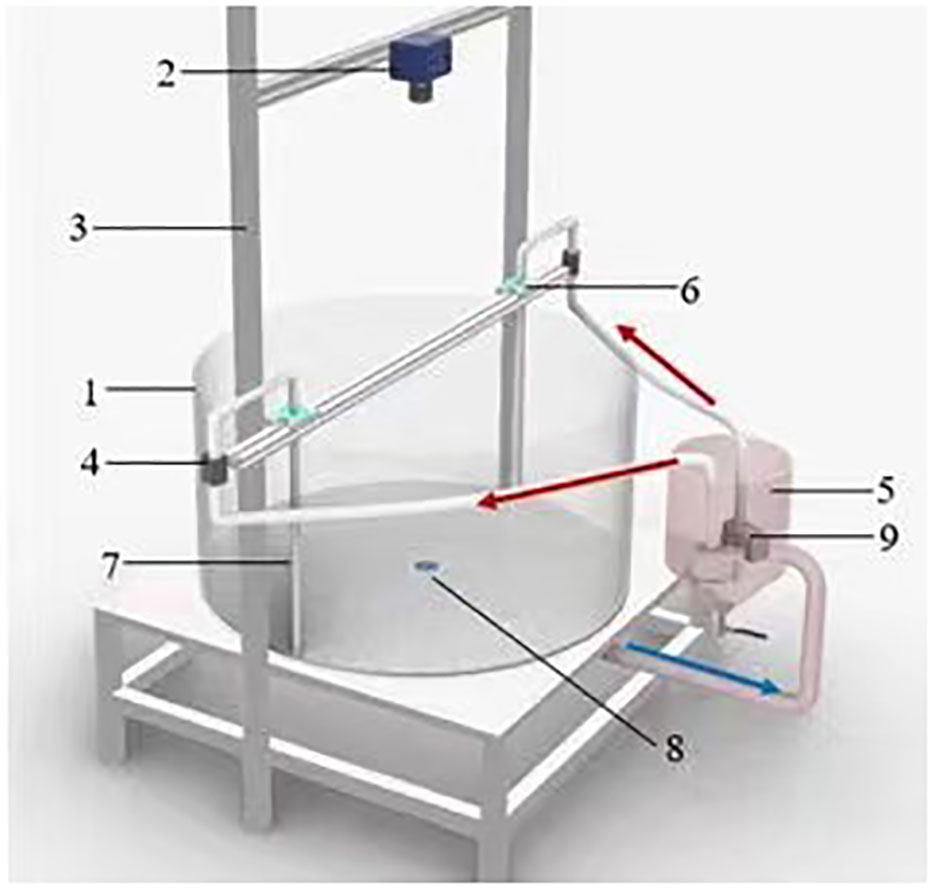
Figure 1 Diagram of experiment setup 1. Aquaculture tank; 2. Camera; 3. Aluminum bracket; 4. Flowmeter; 5. Cone-shaped bucket; 6. Angle adjusting device; 7. Inlet pipe; 8. Outlet hole; 9. Water pump.
2.1.2 Design of waste collection experiment
The effect of the deployment and the angle of the inlet pipe driven by the jet on the waste collection characteristics in the circular aquaculture tank is mainly studied in this research. The experimental design water depth for measuring the waste collection characteristics was 20 cm, the diameter-to-depth ratio (diameter/water depth) was about 5:1, the inlet flow rate was 5.2 L/min (the flow velocity at each inlet was about 0.51 m/s in the dual inlet experiment and about 1.02 m/s in the single inlet experiment, and the hydraulic retention time is about 30 minutes. Based on the previous studies Hu et al. (2021) and the inlet pipe design in aquaculture practices, we totally designed 54 inlet pipe design cases in this experiment, including two inlet pipe designs of a single inlet pipe and dual inlet pipes (Figure 2) three groups of inlet pipe layout distance of d=1/50 r, 1/4 r, and 1/2 r, and nine groups of inlet pipe design angles: α=0°, 10°, 20°, 30°, 40°, 45°, 50°, 60°, 70°. The angles above 70° are not considered in this paper since the self-cleaning ability is obviously poor in such conditions and 45° is included for its wide use in aquaculture practice Gorle et al. (2018). In which before the experiment was started, the angle and distance of the inlet pipe were first adjusted to the preset condition, the pump and the flow meter were turned on, and the valve regulated the flow of the inlet pipe. Then, the flow of water through the inlet pipe into the aquaculture tank was monitored in real-time (L/min) by the flow meter, and the flow was regulated to the required value of the experiment. After waiting about 30 min, the flow field in the tank tended to be stable (the pre-test results showed that the flow field in the aquaculture tank was almost unchanged when the system was operated for 30 minutes). At this time, the high-definition camera was turned on, and 10 g shrimp feed with a diameter of 1.6 mm and a length of 1.0-2.0 mm were sprayed quickly and evenly into the tank, and the waste collection situation and pattern in the tank were observed from this time (t=0 min at this point). Based on the previous studies Summerfelt et al. (2016), Xue et al. (2021), the maximum monitoring time was set to 30 min. That is to say, we will turn off the recording camera and start the next cases even though not all the waste particles were completely discharged.
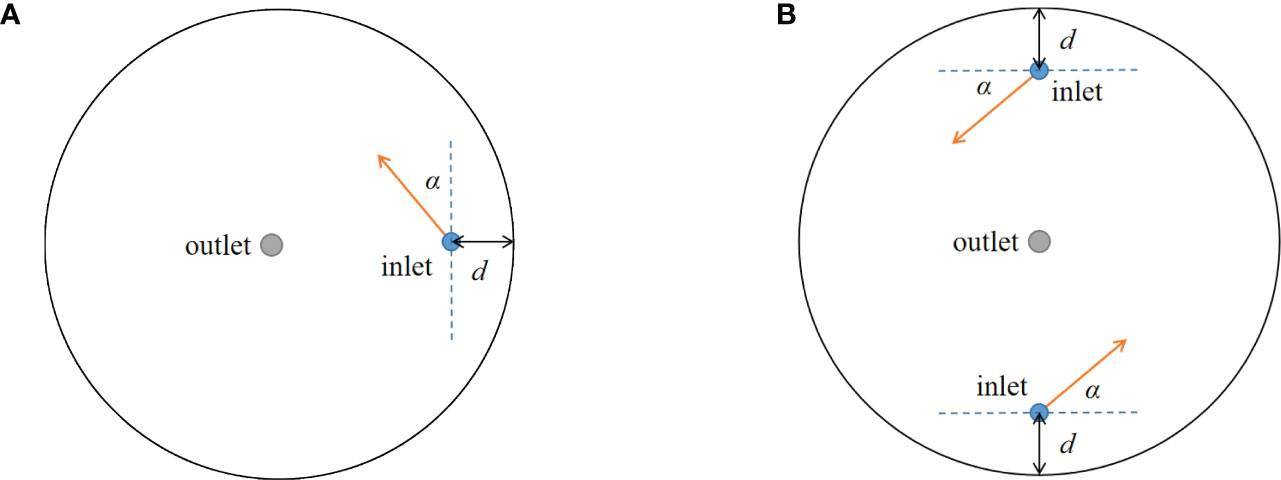
Figure 2 Top view (A) Single inlet deployment (B) Dual inlet deployment.
2.1.3 Data processing of waste collection experiment
In the experiment of waste collection under the dual inlet pipe design, it was found that the waste residuals could not completely discharge within 30 min. To quantitatively compare the self-cleaning ability, MATLAB R2020b software was used to process the raw image of the waste residuals in the tank. (1) After the raw image (Figure 3A) of the waste in the aquaculture tank was input into MATLAB software, the rgb2gray function was used to convert it into a grayscale image. (2) The grayscale image of the waste in the aquaculture tank was binarized, and the binarized image of the aquaculture tank was extracted by deploying the grayscale threshold after processing. In this study, the gray index value threshold was set to 200, i.e., when the gray value of a pixel point is greater than 200, the color of the pixel point is set to black; otherwise, it is set to white, and the black pixel point represents the waste residual in the aquaculture tank. (Figure 3B) (3) The calculation range in the binarized image was set, and all the black pixels outside the bottom of the aquaculture tank were removed to obtain the binarized bottom waste image. (Figure 3C) (4) After binarization, the number of black pixels in the bottom waste image of the aquaculture tank was calculated, and the self-cleaning ability of the aquaculture tank was quantified by comparing the number of pixels in the binarized image of the bottom waste residuals under different experimental working conditions.
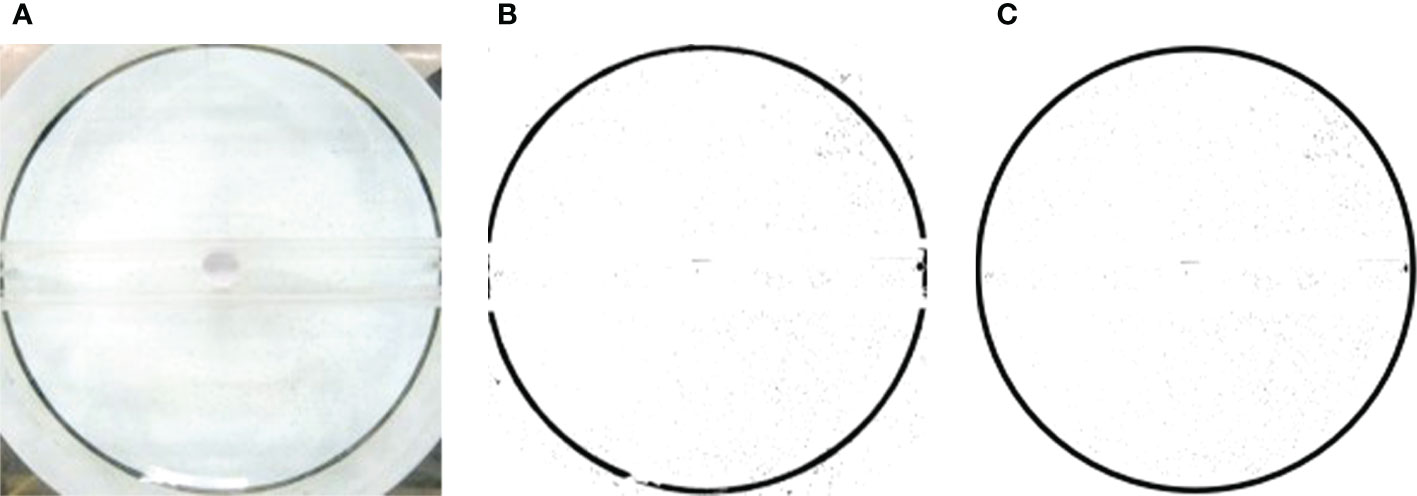
Figure 3 Image processing procedure (A) Raw image (B) Thresholding image (C) Diagram of waste residual pixel image.
2.2 Flow field measurement experiments
2.2.1 Setup of flow field measurement experiments
The flow field measurement experiment in the aquaculture tank was conducted in the marine measurement laboratory of QD GL Technology Co, Ltd. The flow field measurement setup (Figure 4) was similar to the waste collection experiments except for the flow field measurement system. In this test, the PIV technique was employed to measure the flow field distribution characteristics in the aquaculture tank. The circular aquaculture tank was embedded in a square acrylic tank to avoid refraction of the laser by the circular tank wall. The waste residuals have a small effect on the flow velocity in the aquaculture tank. The water clarity will be affected if the water is in the aquaculture tank for a long time, thus weakening the laser penetration and affecting the PIV experiment results. Considering this, no waste residuals were spread into the aquaculture tank in the flow field distribution characteristic measurement experiments.
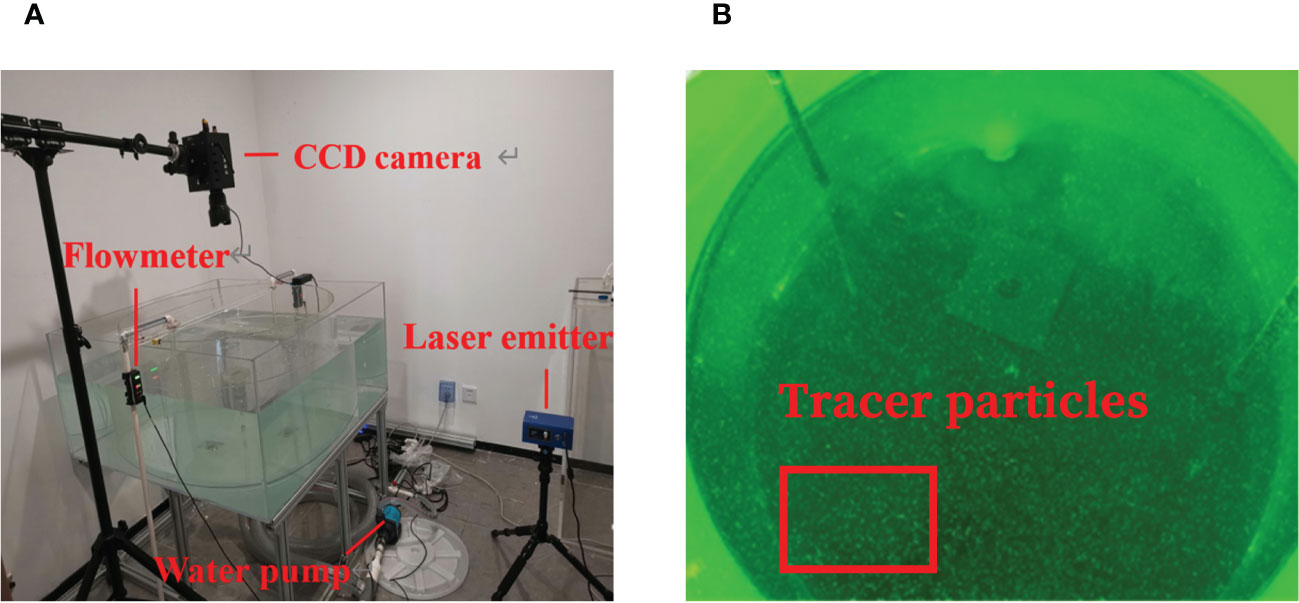
Figure 4 Photo of (A) PIV flow field measurement setup (B) PIV tracer particles.
The PIV system combines tracer particles, a laser transmitter, high-speed cameras, control systems, and data processing software. Measurements were conducted by scattering tracer particles in the aquaculture tank, and the velocity of the fluid in the flow field was represented with particle velocity. Meanwhile, a laser was applied to irradiate a test plane, and the position of particles exposed twice was recorded with an imaging method. An image analysis technique obtained the displacement of the particle swarm, and the flow velocity vector at each point was obtained by the time interval of displacement and exposure.
50-μm polystyrene tracer particles were used in this experiment (the white particles in Figure 4B), with a density of 1.3 kg/m3 (close to the density of water) and good following and light diffusion characteristics. The laser is an ideal light source for the PIV system, which can ensure good collimation and uniformity of the slice beam. In the experiment, a continuous laser plane was generated by the GL-532-1045 model from QD GL Technology Co, Ltd. Besides, the GL-JR-20P high-speed camera was used, with a maximum frame rate of 16 fps and an image resolution of 5,120×3,800.
2.2.2 Data processing of flow field measurement experiments
The SVMC capture software of QD GL Technology Co, Ltd. was used for image acquisition of the flow field (Figure 5). The camera shooting frame rate was 16 fps, the image frequency was set to 8, and the number of images collected in the experiment was 96 (with every two images forming a group, there were 48 groups in total). The experimental acquisition duration was 6 s; dt is the acquisition time interval of two images in the same group, and the dt was set to 15000 μs. The high-speed camera automatically stopped shooting after 96 images were acquired, and the captured photos were stored automatically. The flow pattern tracking master V50 software performed preliminary flow field processing on the captured images and automatically saved the flow field image and flow velocity data.
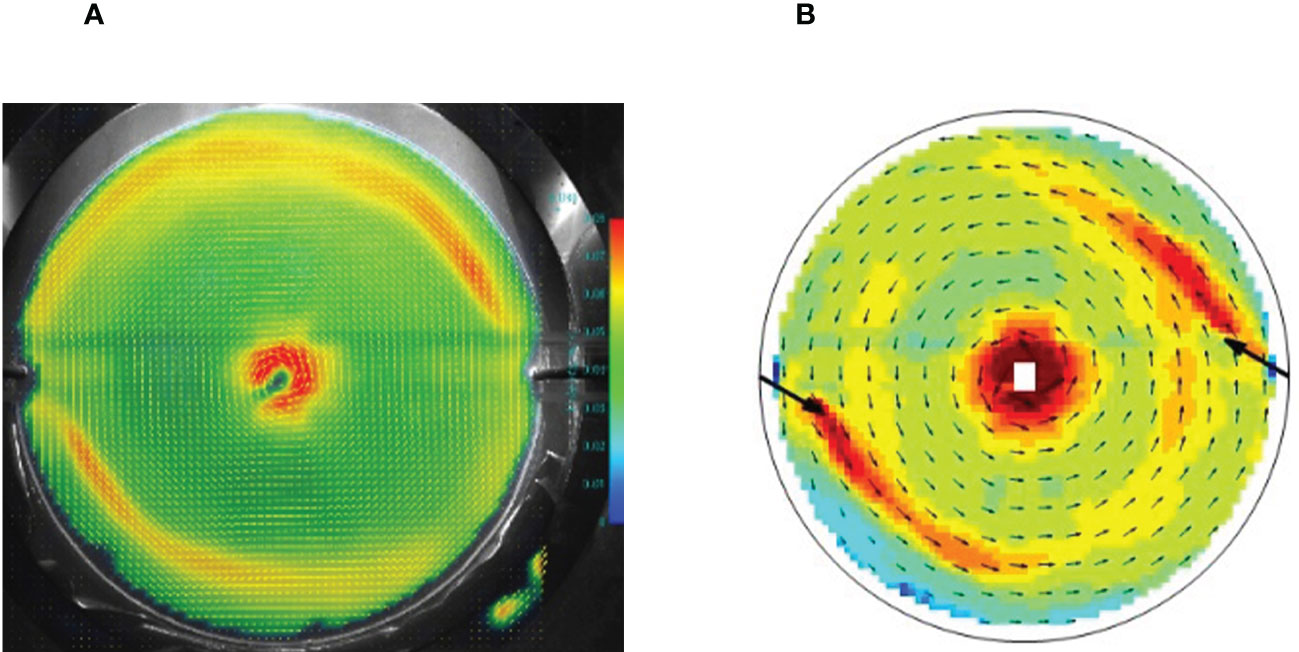
Figure 5 Diagram of (A) Flow pattern tracking master V50 treatment; (B) MATLAB treatment.
The PIV images were analyzed by a direct cross-correlation method to obtain the flow field under different inlet pipe design cases. The removal efficiency of fish wastes is evaluated in a comprehensive analysis. For this purpose, the EQ method was deployed to determine the inlet setup considering the uniformity of water flow velocity (1) Masaló and Oca et al. (2016). To systematically compare the hydrodynamic characteristics in the aquaculture tank under different working conditions, the flow field was quantitatively analyzed based on the hydrodynamic characteristic quantities such as the average flow velocity (vavg) in the aquaculture tank, the flow uniformity coefficient (DU50), and the resistance coefficient (Ct) of the aquaculture tank. vavg can be expressed mathematically in the following form Venegas, et al. (2014):
where,
The average flow velocity (vavg) is the average flow velocity of each monitoring point in the aquaculture tank. In formula (1), v is the average weighted velocity (m/s); vi is the velocity of the monitoring point (m/s); ri is the distance of the monitoring point from the center of the tank (m); DU50 is the uniformity coefficient of the water flow in the aquaculture tank; v50 is the average value of the first 50% of the velocity at each point of a depth section (m/s); DU50 is larger than 0 and smaller than 100, and the closer to 100 represents better velocity uniformity. In formula (1), the aquaculture tank resistance coefficient (Ct) refers to the quantified expression of the aquaculture tank on the energy obstruction of the water flow in the tank, and a larger aquaculture tank resistance coefficient represents more energy loss of the inlet pipe input to the aquaculture tank; Q is the inlet flow rate (m3/s); v1 is the inlet velocity (m/s).
3 Results
3.1 Effect of the inlet pipe design on the waste collection
3.1.1 Dual inlet pipe design
Figure 6 shows the waste residuals distribution driven by dual inlet pipe at t=30 min, and the inlet pipe design angles of 0°, 10°, 20°, 30°, 40°, 45°, 50°, 60°, and 70° and distance of 1/50 r, 1/4 r, and 1/2 r are represented in horizontal and vertical axis represents, respectively. Obviously, it can be observed that the angle and distance of the inlet pipe significantly affect the waste collecting process in the aquaculture tank.
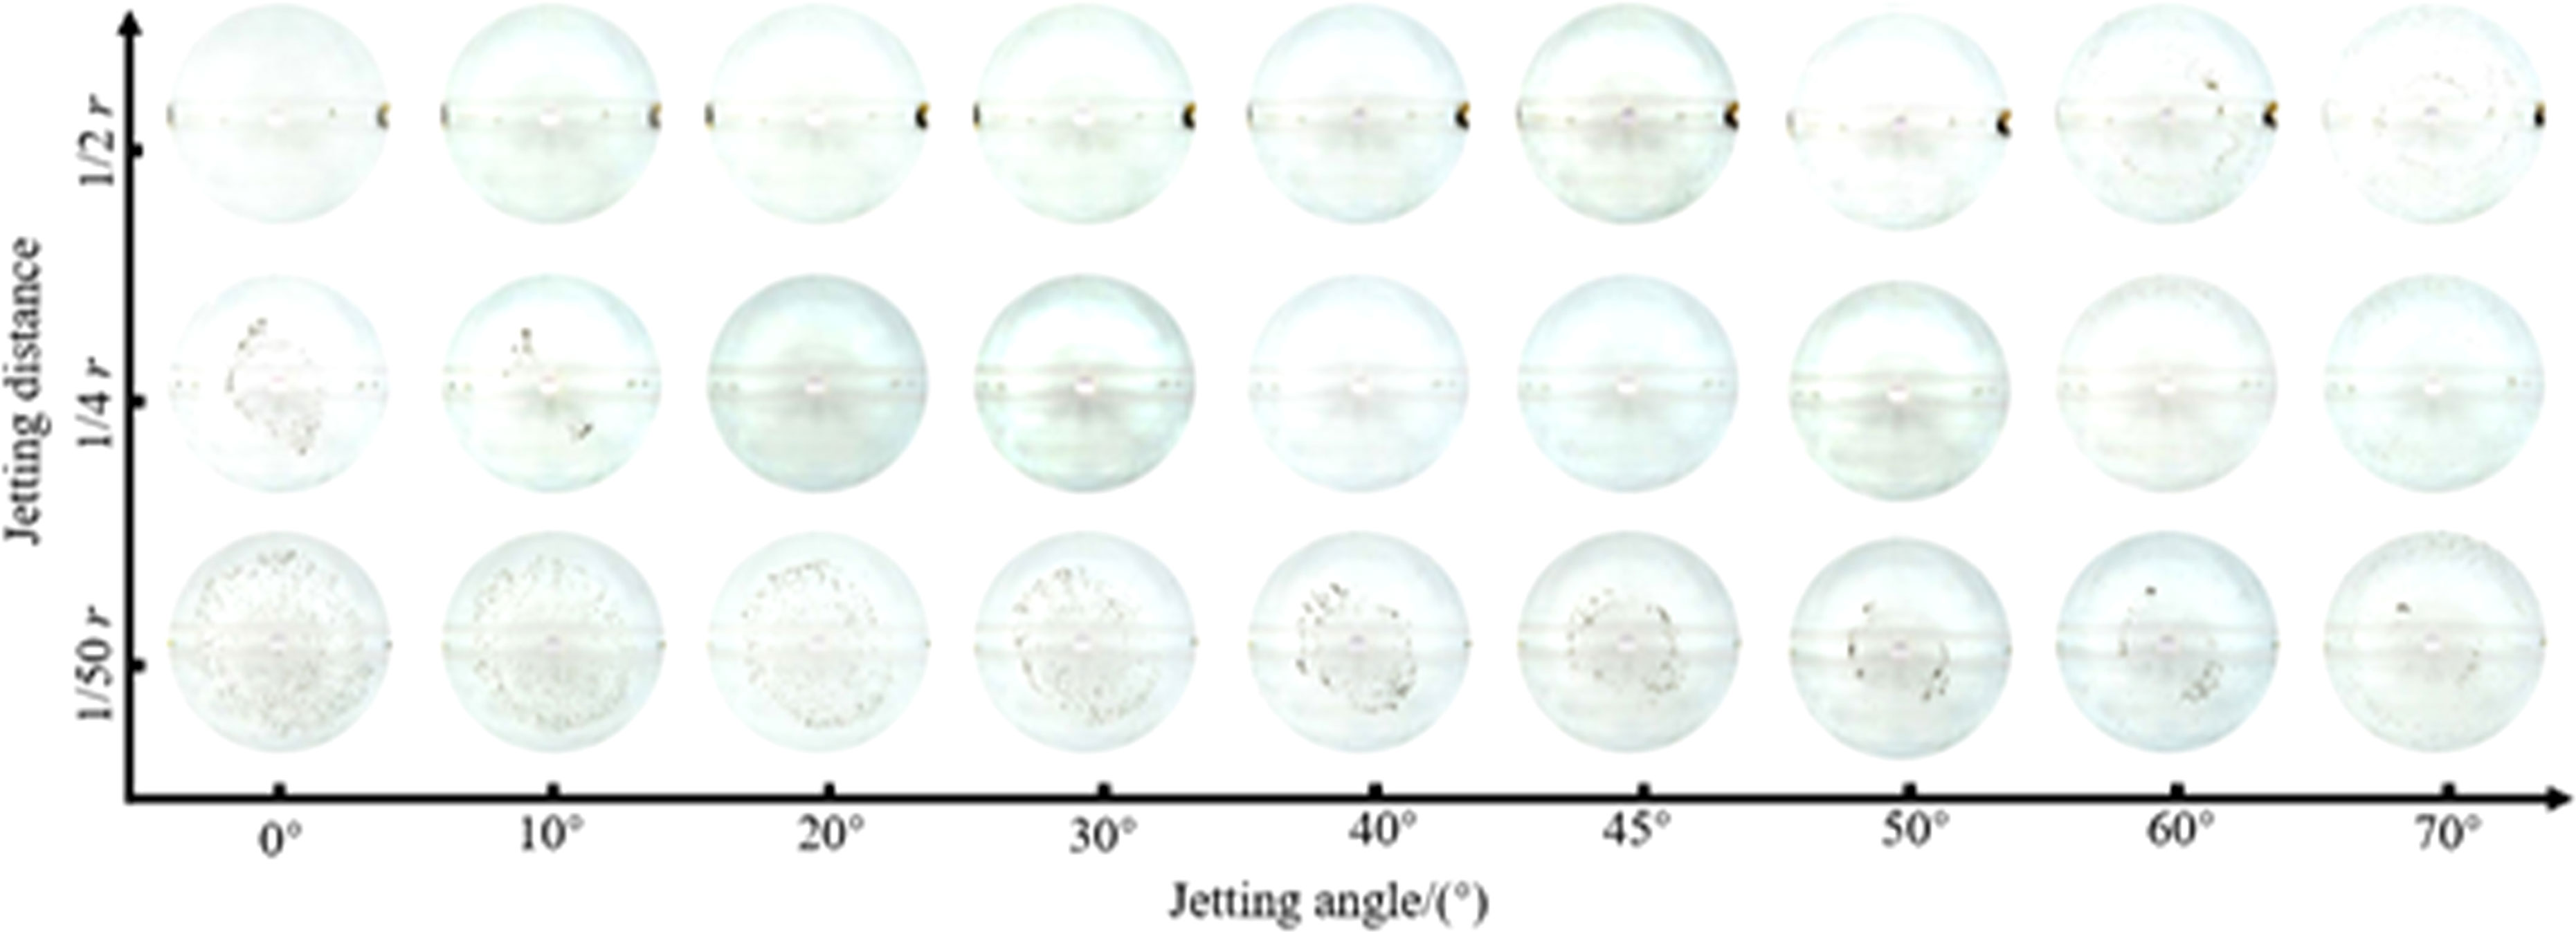
Figure 6 Photo of the waste collection under different conditions (Dual inlet deployment; t=30 min).
When the distance of the inlet pipe is at d=1/50 r and the angle is at α=0°~70°, the waste collection ability of the aquaculture tank shows an overall trend of first strengthening and then weakening with the increase of the angle of the inlet pipe, and the highest ability was achieved when the angle of the inlet pipe was at α=50°; when the waste residual in the tank was distributed in a hollow oval shape, the overall waste collection ability was low. When the distance at d=1/4 r and the angle at α=0°~10°, some waste remained in the aquaculture tank, and the waste collection ability was low; when the angle of the inlet pipe was at α=20°~40°, the waste remained in the area near the outside of the aquaculture tank, and the outlet was reduced; meanwhile, most of the waste was gathered in the middle area of the aquaculture tank in a hollow elliptical distribution, and the waste collection ability was poor; when the angle of the inlet pipe was at α=50°~70°, a small amount of circular waste remained at the wall of the aquaculture tank, and the waste collection ability was low.
When the distance of the inlet pipe was at d=1/2 r, and the angle was at α=0°~20°, the waste in the aquaculture tank was basically discharged out of the tank, and the waste collection effect was the best; when the angle of the inlet pipe was at α=30°~70°, a small amount of circular waste remained at the wall of the aquaculture tank, and the waste collection effect was poor.
To further measure the effect of the distance and angle of the inlet pipe on the hydrodynamic characteristics of the waste collection of the aquaculture tank, the images in the aquaculture tank were quantitatively analyzed at t=30 min, and the results are illustrated in Figure 7. It can be observed from the figure that the overall amount of waste residual (pixel numbers) decreased with the increase in the distance of the inlet pipe, and the difference of waste residual between d=1/4 r and 1/2 r was significantly smaller than that at d=1/50 r. When the angle of the inlet pipe was at α=0°~20°, the amount of waste residual gradually decreased with the increase of d; when the angle of the inlet pipe was at α=30°~50°, the difference of waste residual between d=1/4 r and 1/2 r was small but significantly smaller than that of d=1/50 r. When the angle of the inlet pipe was at α=50°~70°, there was no obvious pattern change in the waste residual.
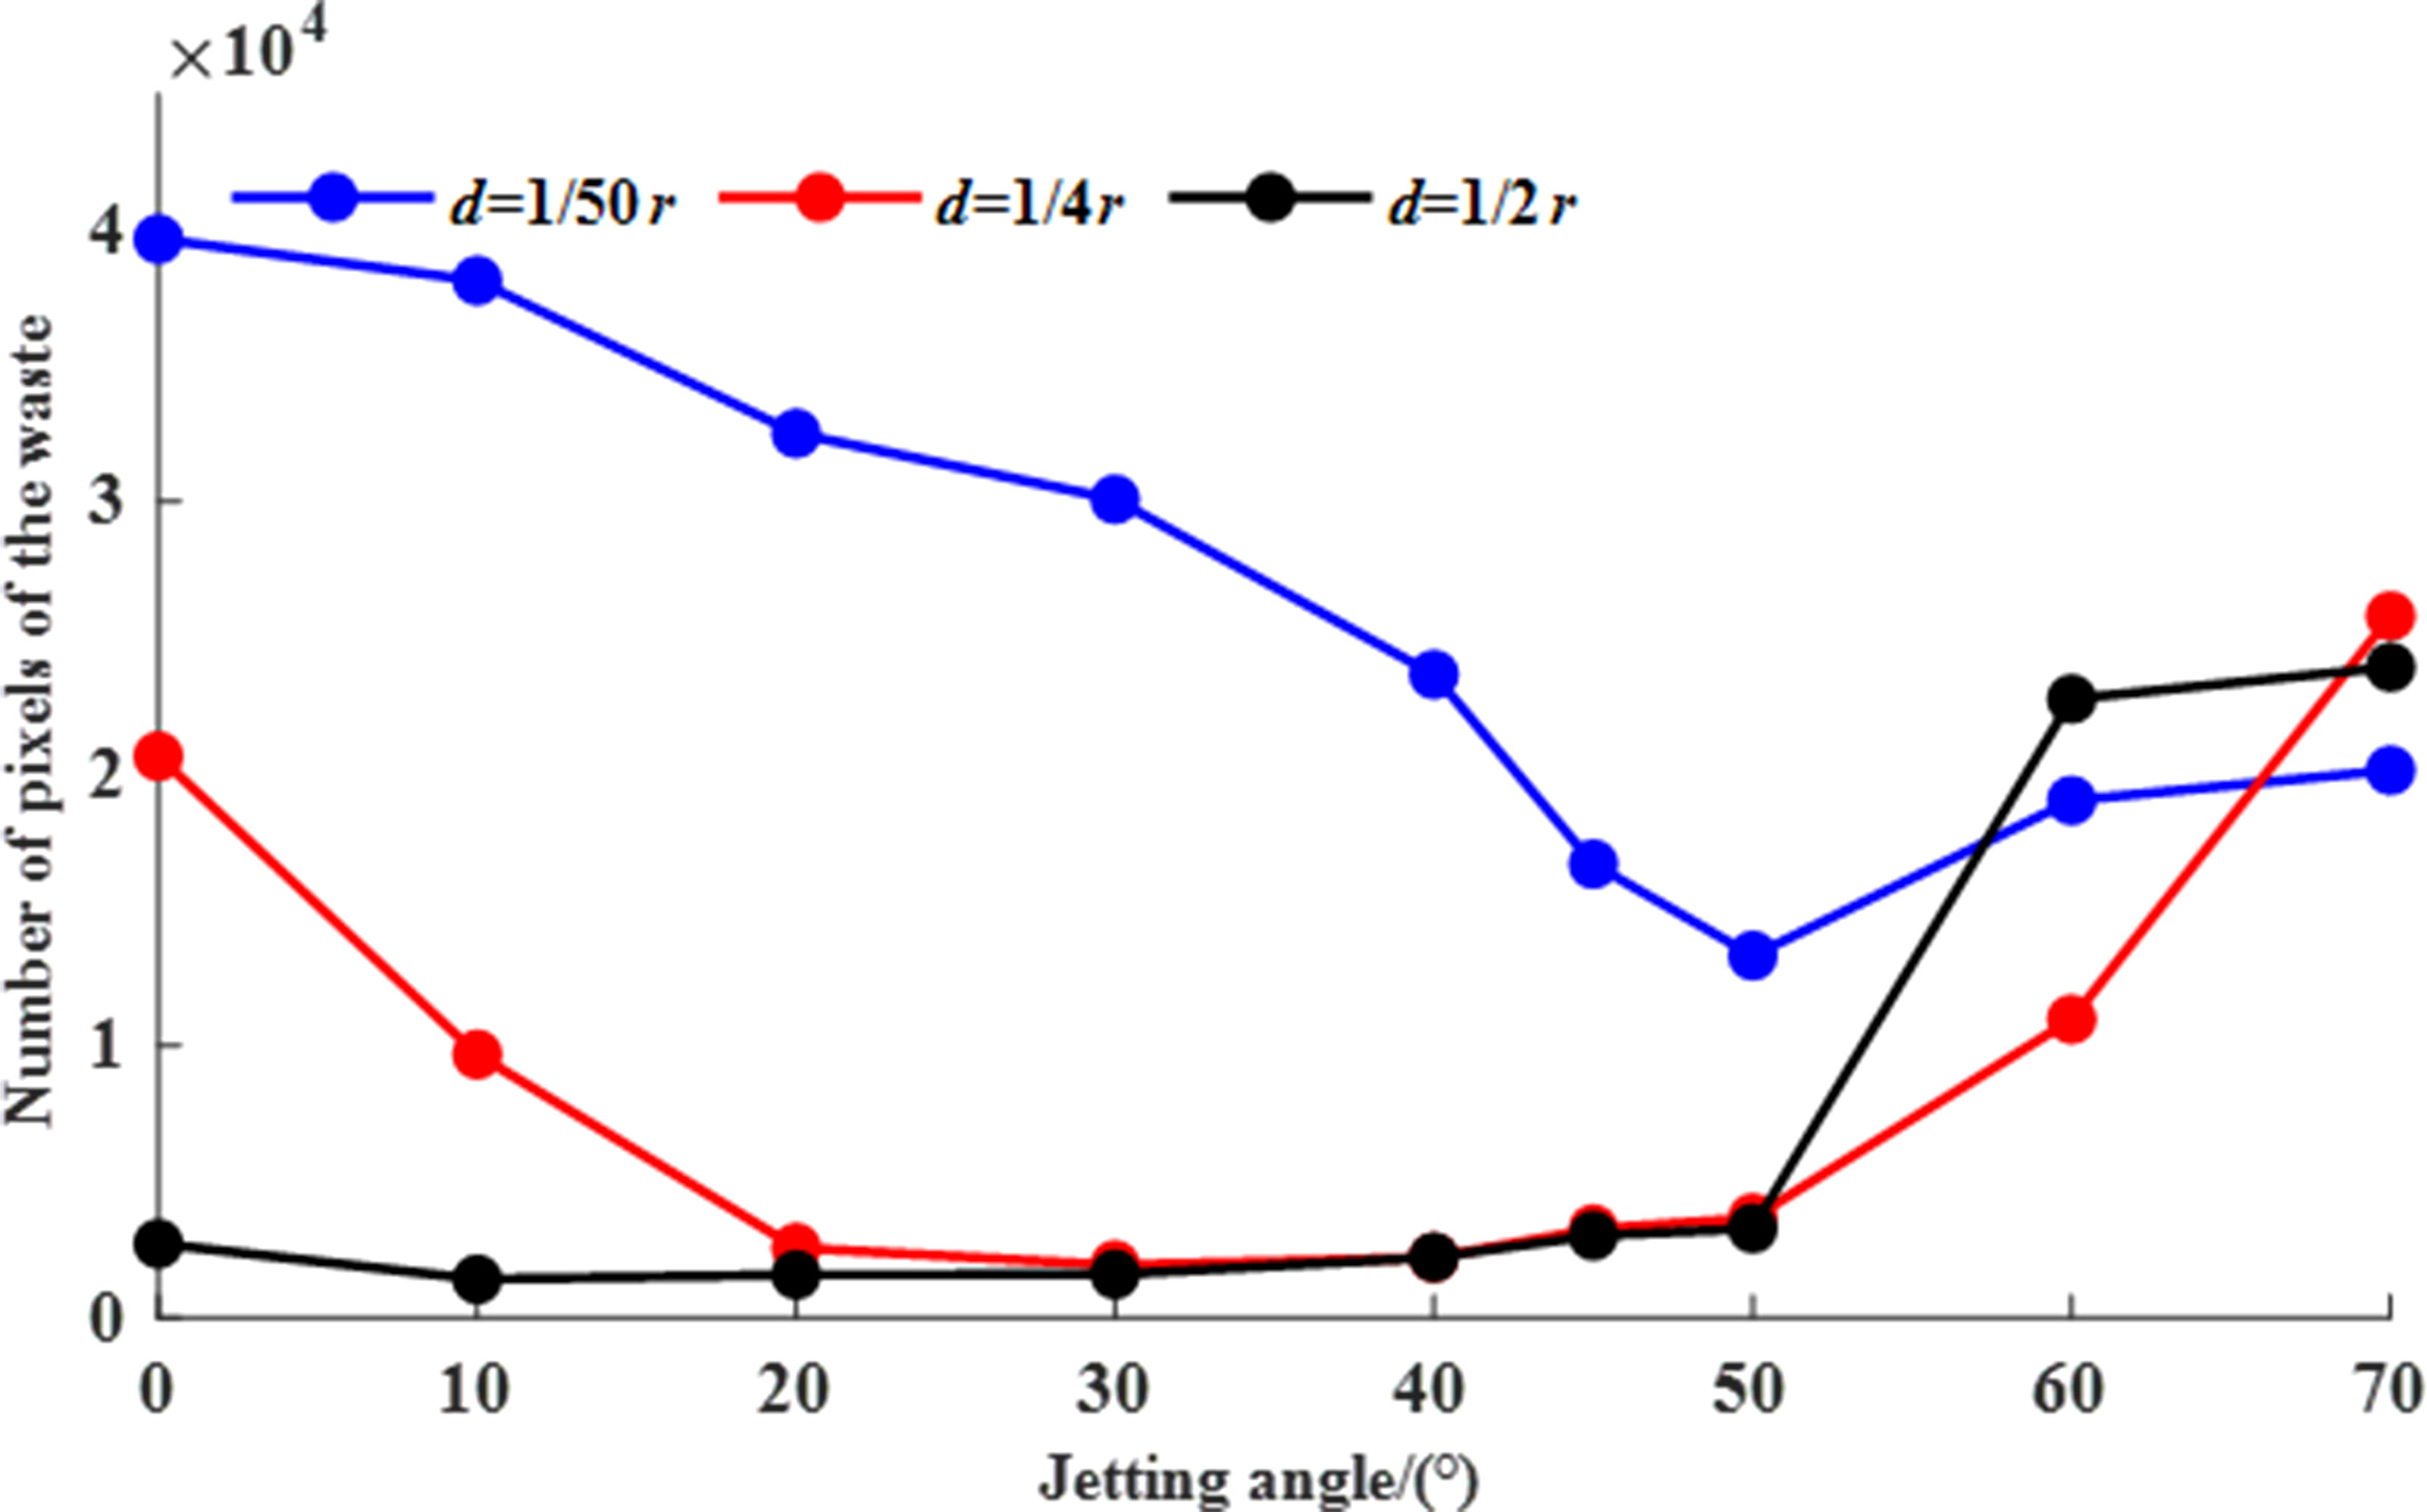
Figure 7 The number of pixels of the waste under different conditions (Dual inlet deployment; t=30 min).
The above analysis indicates that the aquaculture tank achieves the best effect of collecting waste at distance of d=1/4 r, angle of α=20°~40° or at distance of d=1/2 r, angle of α=10° and its self-cleaning ability is the highest.
3.1.2 Single inlet pipe design
The single inlet pipe is to remove one inlet pipe in the dual inlet pipe experiment, and the rest of the device is the same as that of the dual inlet pipe experiment. The inlet pipe flow rate was set to 5.2 L/min in the single inlet pipe experiment to ensure the same hydraulic retention time. The single inlet pipe experiment design was identical to the dual inlet pipe experiment. However, during the experiment, it was found that due to the large flow rate of the single inlet pipe, the waste in the aquaculture tank could be completely discharged within the hydraulic retention time of 30 minutes except for three groups of special conditions. Thus, in the cases of single inlet, the time consumed for completing the discharge of waste residuals in the aquaculture tank was used as an index to quantify the waste collection ability of the aquaculture tank, and the shorter the waste collection time, the stronger the waste collection ability.
The waste collection time under different inlet pipe design angles is indicated in Figure 8. Note that the data of waste collection time exceeding 30 min will not be displayed in the figure. In the case of d=1/50 r, the curve of waste collection time featured a parabolic shape, showing a bottom at the angle of α=45°. It decreased rapidly at α=0°~30°, slowing its reduction among angle of α=30°~45° and finally increased from 45°~70°. For the case the distance of d=1/4 r, the waste collection time was almost the same for the angles of α=0°~45° and depicted an increasing trend from 45°~70°. The waste collection time increased gradually with the inlet pipe angle increment, achieving the best waste collecting performance for α=0° at the distance of d=1/2. The waste in the aquaculture tank cannot be completely discharged at the angle of α=60°~70°.
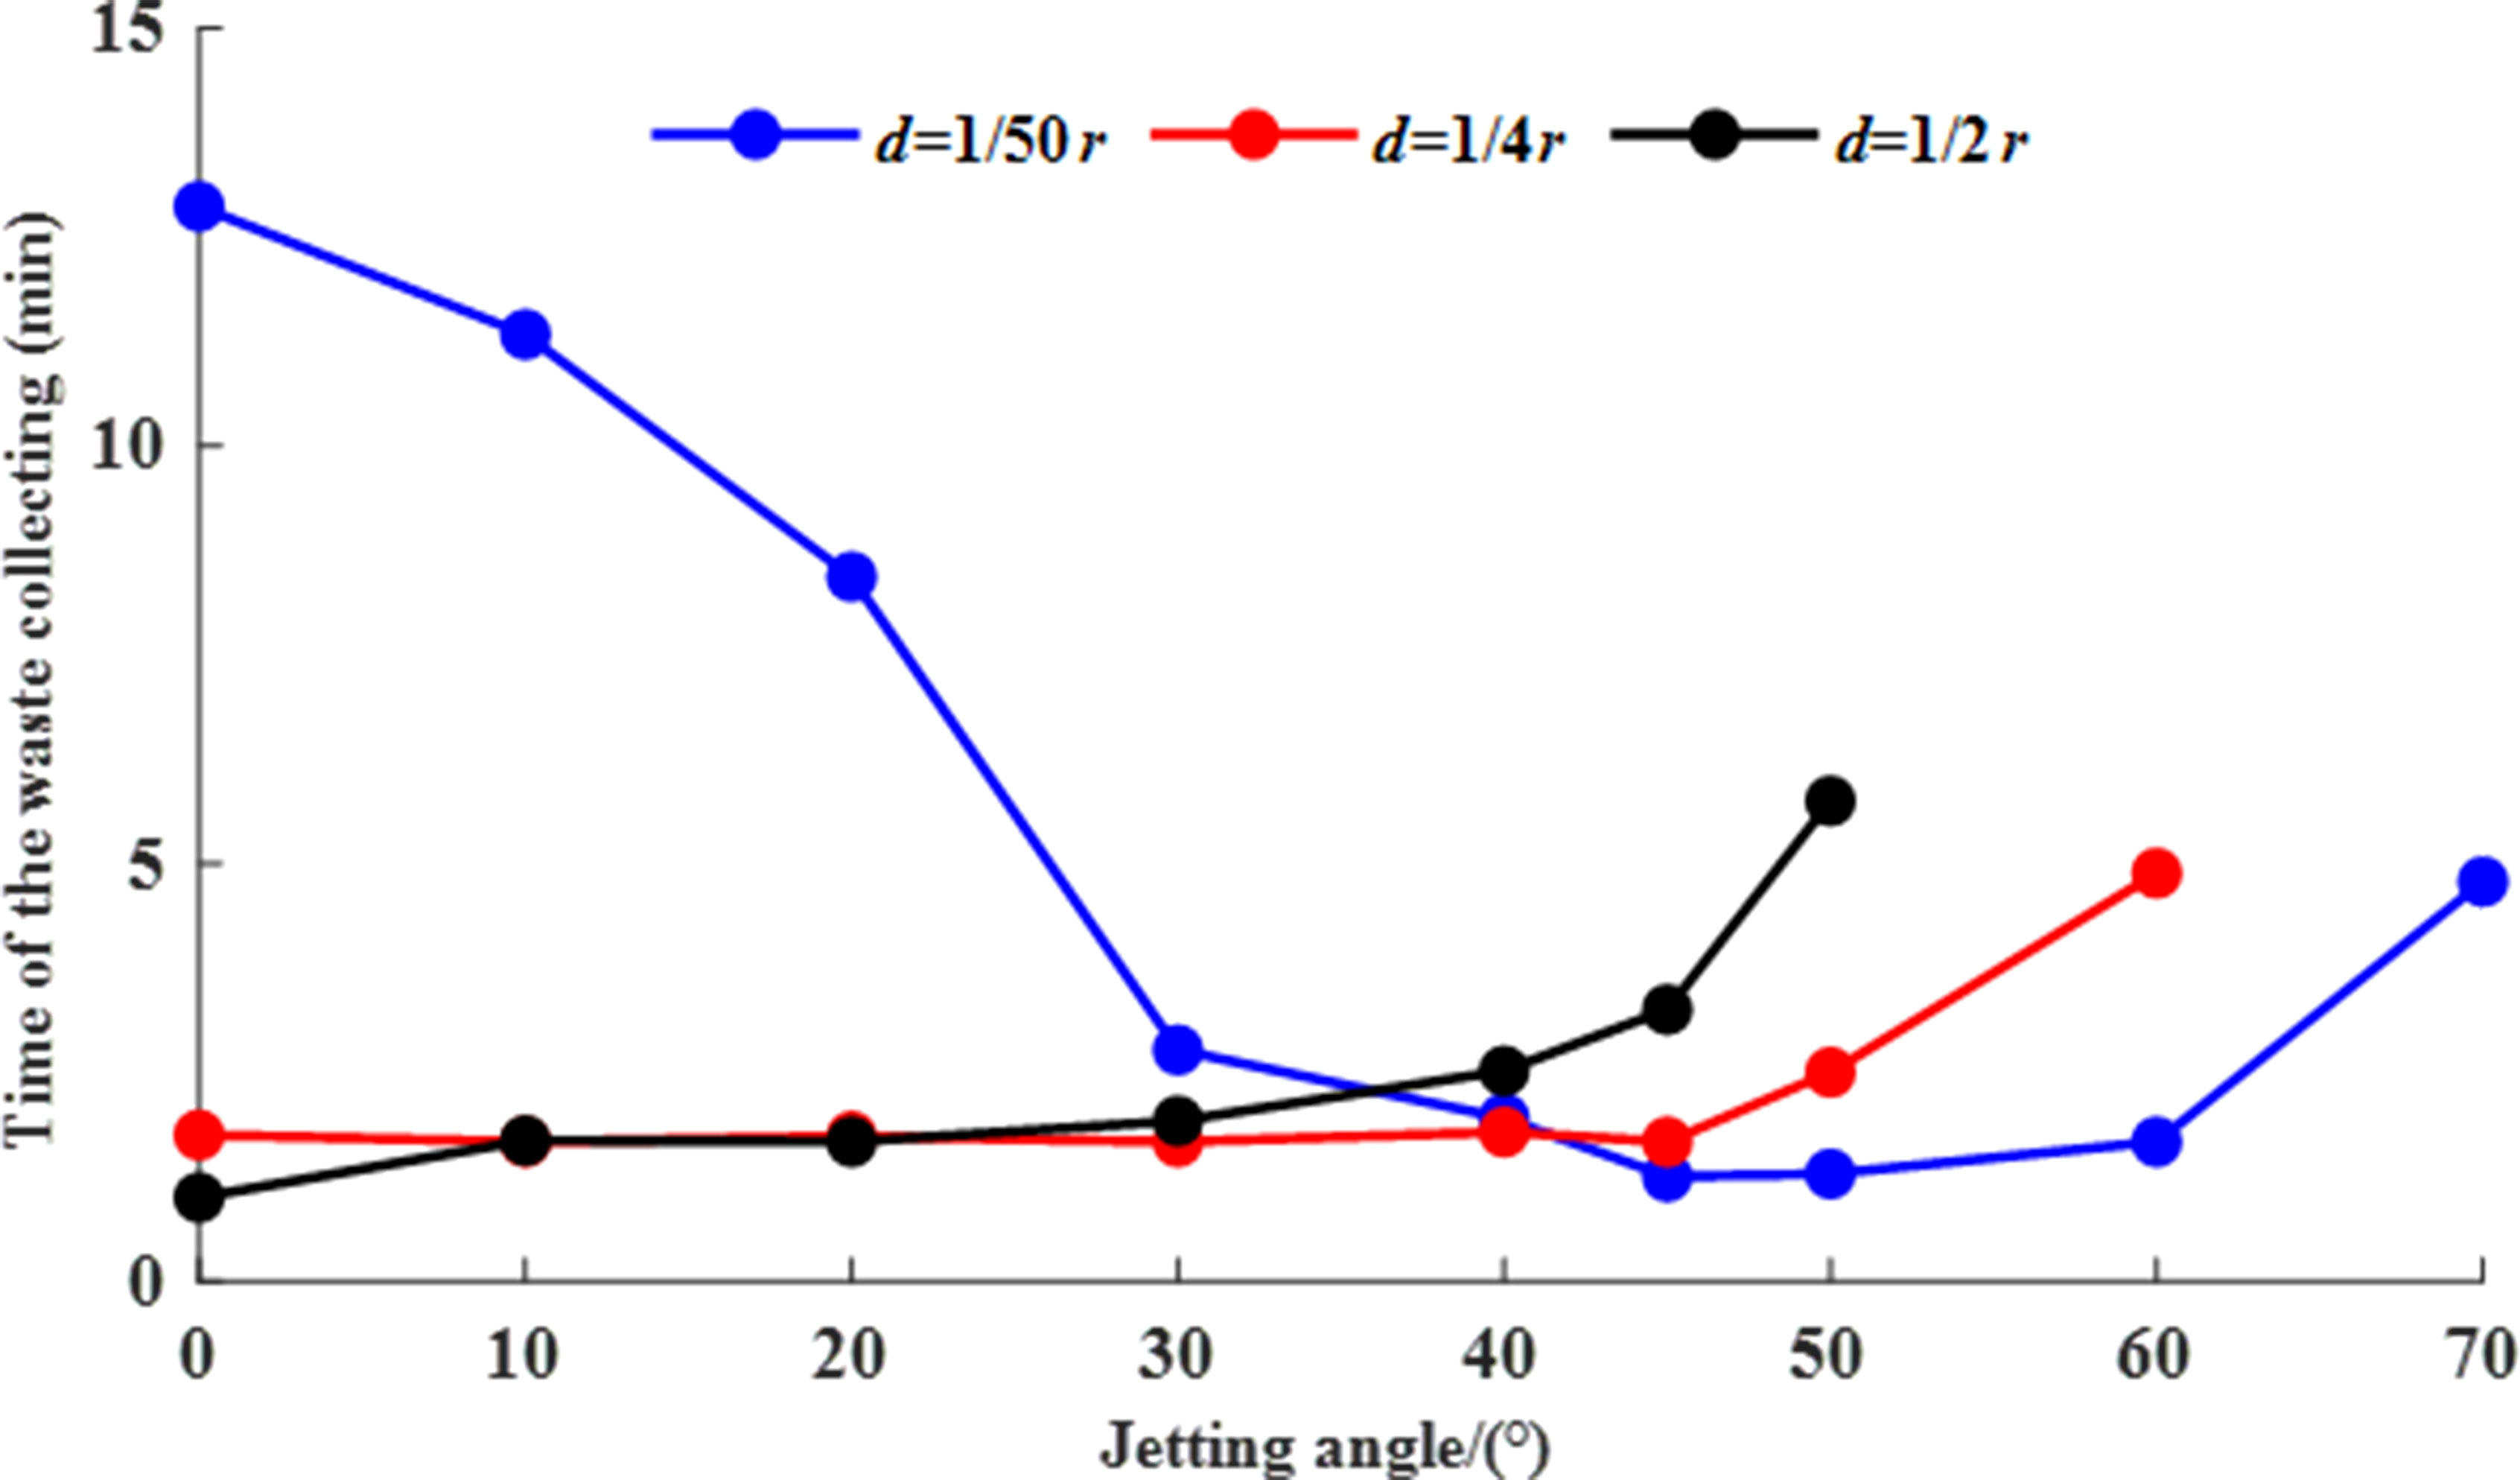
Figure 8 Time of the waste collecting under different conditions (Single inlet deployment).
3.2 Effect of inlet pipe design on the flow field
The flow field in the near bottom (2 cm from the bottom) in the cases of dual inlet pipe design was indicated in Figure 9 with the variations of jetting angle and jetting distance in the horizontal and vertical axes, respectively. Two long black arrows (not so obvious) in each subpanel show the jetting angle and distance. Meanwhile, the small arrows and colormap indicated the velocity direction and magnitude, respectively. Not all the small arrows were displayed in the figure to enhance visibility.
3.2.1 Effect of inlet pipe design on the flow field
The flow field in the near bottom (2 cm from the bottom) in the cases of dual inlet pipe design was indicated in Figure 9 with the variations of jetting angle and jetting distance in the horizontal and vertical axes, respectively. Two long black arrows (not so obvious) in each subpanel show the jetting angle and distance. Meanwhile, the small arrows and colormap indicated the velocity direction and magnitude, respectively. Not all the small arrows were displayed in the figure to enhance visibility.
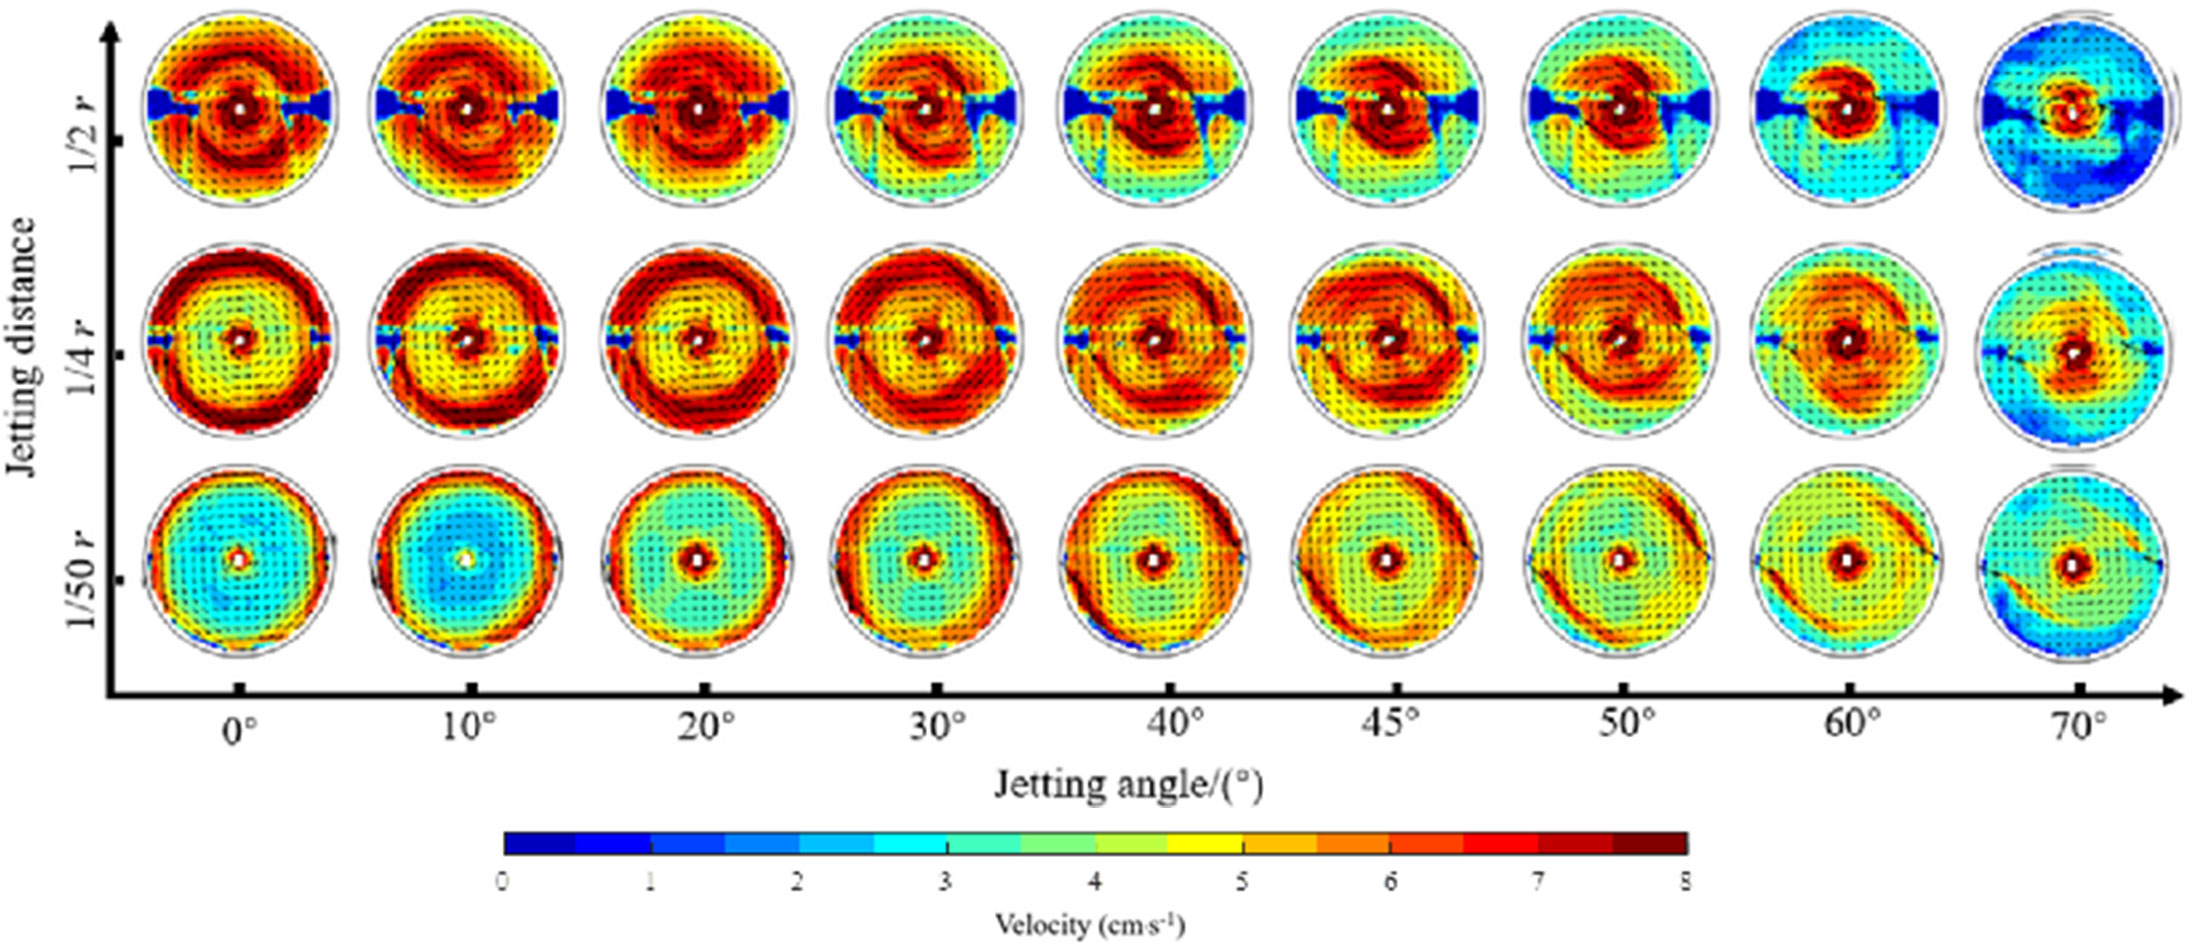
Figure 9 Distribution of flow field under different conditions (Dual inlet deployment).
As depicted in Figure 9, two kinds of high-speed circulation flow were formed in the tank at all the cases, one is around the center of the tank caused by the narrow outlet and one is around the inlets due to the high jetting flow. However, the location and area of the high-speed circulation flow due to the jetting varied with the jetting angle. The flow evolution process with jetting angle is similar in general and still several little inconsistencies exist and the details are described in the following. For the case of d=1/50 r, with the increase of the jetting angle, the flow velocity close to the wall of the tank gradually decreases and the high-speed circulation flow moves away from the tank wall. In addition, the area of the high-speed flow increases from α=0° ~ 45° and decreases after α=45°, indicating a uniform good flow condition for aquaculture. The area increment arises from the less water flow collision between the jetting flow and the tank wall. On the contrary, the area decrement is caused by energy loss due to the discrepancy in the directions of the general flow in the tank and the jetting. The similar phenomenon (flow evolution) also can be found in the case of d=1/4 r but it differs in the velocity magnitude with obviously larger velocities than these in the case of d=1/50 r owing to the longer distance between the jetting and tank wall. Meanwhile, a gradual decrease in the area of high-speed flow with increasing jetting angle is observed in the case of d=1/2 r, revealing that the jetting distance is far enough to avoid the flow collision in this case. Figure 10 shows the flow field measured in the cases of single inlet pipe design. Although the inlet pipe design was adjusted to single pipe, the characteristics of flow field are basically the same with those in Figure 9. Notably, the maximum value of the colorbar in Figure 10 is twice that in Figure 9, thus the velocity magnitude in single inlet pipe design is generally larger. Assessing from the views of high-speed flow area and the flow uniformity, the optimum flow environment can be achieved at the angel of α=40° ~ 50°, 20° ~ 30° and 10° ~ 20° for d=1/50 r, 1/4 r and 1/2 r, respectively.
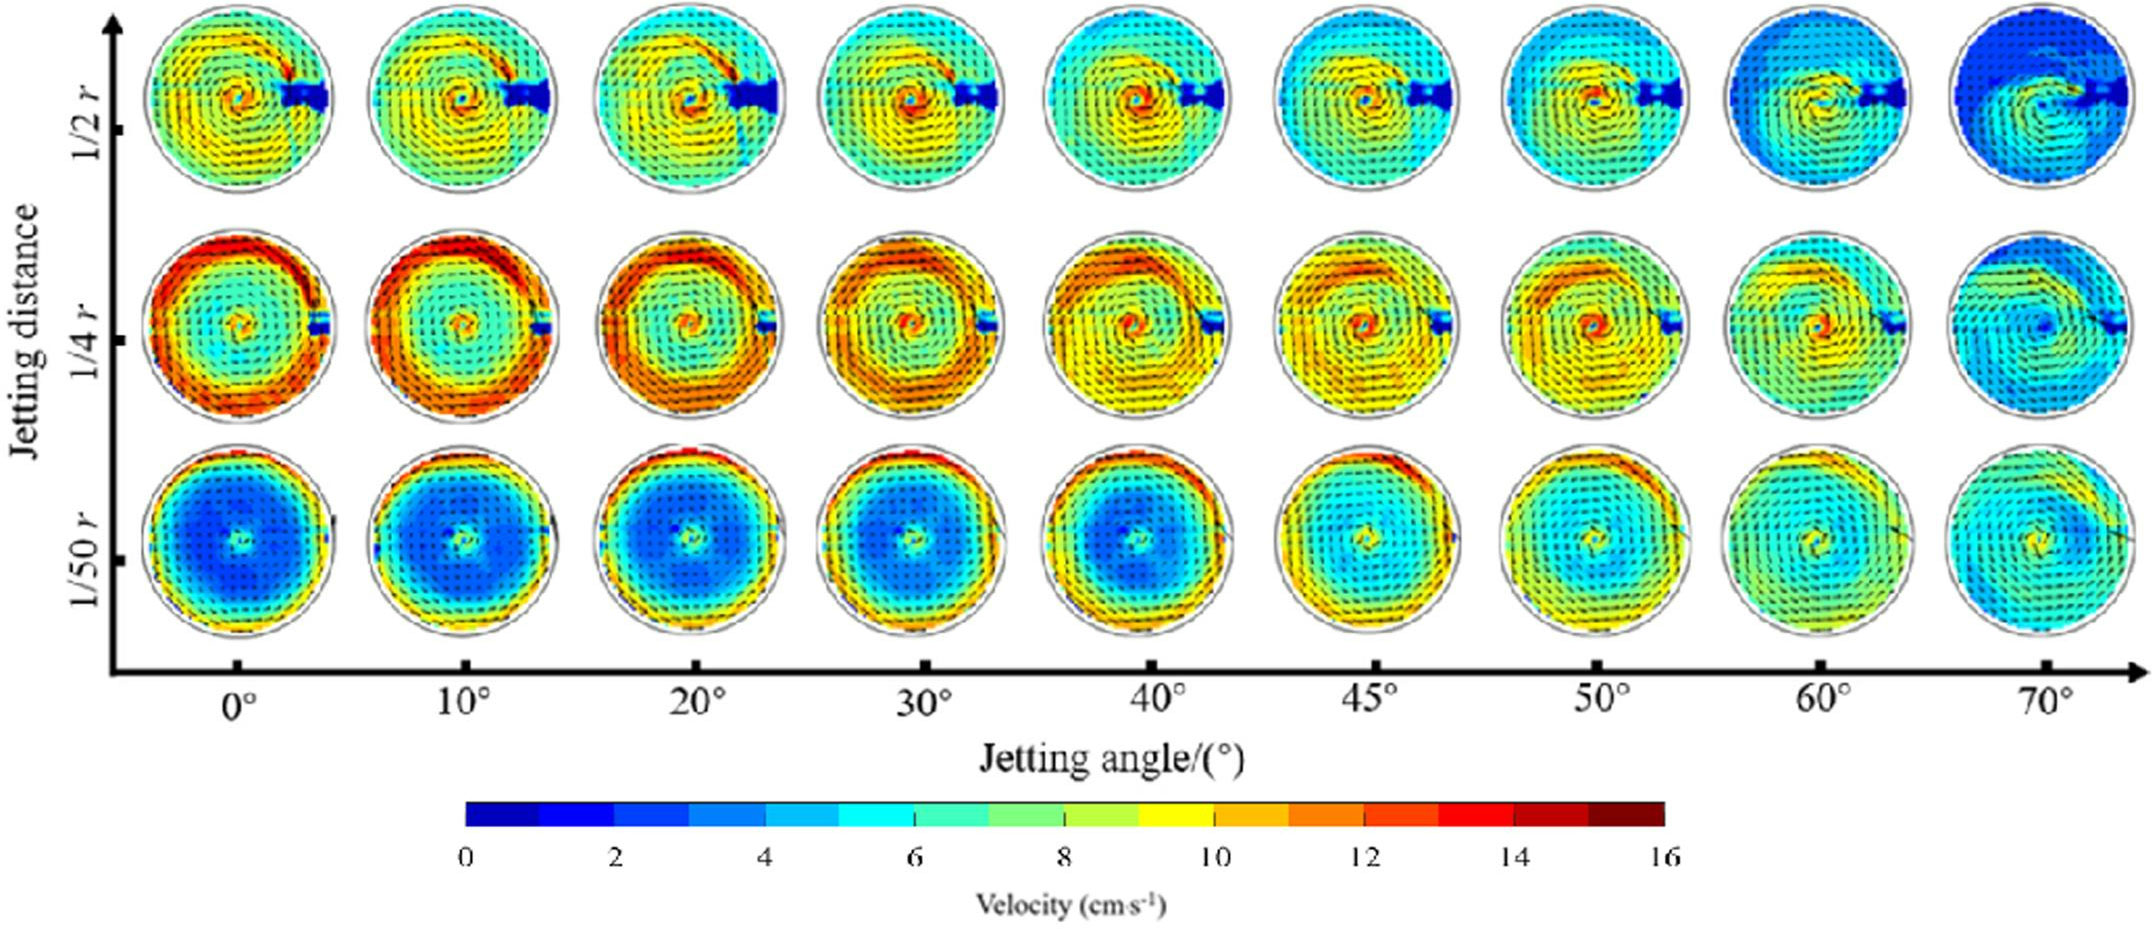
Figure 10 Distribution of flow field under different conditions (Single inlet deployment).
3.3 Effect of inlet pipe design on the hydrodynamic characteristics
The hydrodynamic characteristics in the case of dual inlet pipe design obtained from PIV measurements are displayed in Figure 11. Moreover, the average velocity, uniformity coefficient and resistance coefficient are presented in panels (A), (B) and (C). For the average velocity in Figure 11A, it shows a parabolic shape and reaches the peak around α=45° at d=1/50 r. A slow downward trend can be found at the cases of d=1/4 r and 1/2 r with the increasing jetting angle, resulting in the largest average velocity at α=20° ~ 30° and 10° ~ 20°, respectively. The uniformity coefficient can be regarded as an indicator for a better flow condition in the tank. However, it should be noted that the larger uniformity coefficient does not necessarily guarantee a better flow condition. For example, as shown in Figure 11B, it increases with the jetting angle for the case of d=1/50 r and achieved the maximum value at α=70°. However, the flow condition at d=1/50 r and α=70° is not good since its average velocity is so low. In short, the uniformity coefficient and average velocity should be considered comprehensively to evaluate the flow. For the case of d=1/4 r and 1/2 r, the variation in uniformity coefficient is consist with that in average velocity and achieves the maximum value at similar jetting angles. It can be observed in Figure 11C the variation in resistance coefficient of aquaculture tank is not obvious before α=50° and a significant increment is following after that. The lower resistance coefficient, the better the energy utilization of the aquaculture tank. Thus, the jetting angle is reasonably designed not larger than α=50°. The hydrodynamic characteristics in the tank equipped with single inlet pipe is exhibited in Figure 12. Obviously, it is very similar to those generated by dual inlet pipe design and only differs in the absolute value of each indicator.
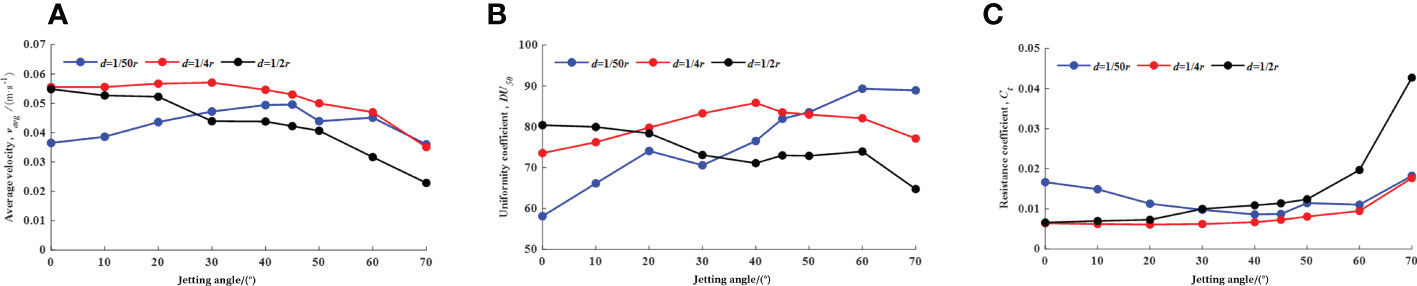
Figure 11 Hydrodynamic characteristics under different conditions (A) Distribution of average velocity under different conditions (B) Distribution of uniformity coefficient under different conditions (C) Distribution of resistance coefficient under different conditions (Dual inlet mode).
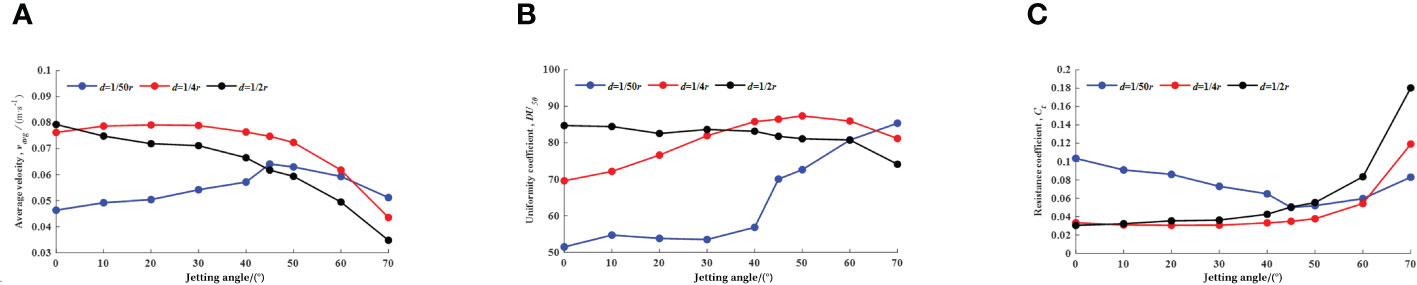
Figure 12 Hydrodynamic characteristics under different conditions (A) Distribution of average velocity under different conditions (B) Distribution of uniformity coefficient under different conditions (C) Distribution of resistance coefficient under different conditions (Single inlet mode).
4 Discussion
The core of RAS is to make the water in the system recyclable through efficient water treatment. The primary source of pollution in the water body of the system is the uneaten feed, feces and other waste produced by the culturing objects. The waste left in the tank for a long time will decompose, produce harmful substances such as ammonia and nitrogen, and consume dissolved oxygen, thus seriously affecting the safety of the culturing objects and greatly increasing the water treatment load. Therefore, how to quickly and efficiently discharge the waste from the aquaculture tank is the primary problem that needs to be solved for RAS. The optimal solution to this problem is to construct an aquaculture tank with excellent hydrodynamic characteristics of waste collection by appropriately designing the inlet structures.
The previous studies assessed the self-cleaning ability mainly from direct and indirect aspects by comparing the residual amount of waste. Scattering fish feed pellets (representing feces and uneaten feed) into the aquaculture tank and then observing and recording the process of waste movement is the most intuitive and effective way to study the hydrodynamic characteristics of the waste collection of the aquaculture tank. However, previous studies did not fully study the inlet pipe design. Venegas et al. (2014) scattered 10 feed pellets into the tank from a position 10 cm from the tank wall; Davidson et al. (2004) scattered 1 pellet feed particle into the tank from a position 0.6 m from the tank wall. This is not consistent with the actual culturing situation. The fish wastes are generated randomly distributed during the culturing process, and it is not concentrated at a fixed point. For this reason, in this study, the pellet feed was scattered evenly and densely into the aquaculture tank during the stable operation of the water circulation system to meet the actual culturing conditions. Therefore, it is necessary to integrate several hydrodynamic characteristics and the waste collection results to more reasonably analyze the aquaculture tank's advantages and disadvantages to better design the inlet pipe.
A comprehensive comparison of the two inlet designs revealed that high-speed flow from the inlet pipe collides with the tank wall, when the distance of the inlet pipe is set to d=1/50 r. In this case, a large amount of energy is lost, the overall flow velocity in the aquaculture tank is small, the high-speed circulation area is small, and the waste collection performance is not good. As the deployment distance increases to d=1/4 r, the collision between the high-speed flow from the inlet pipe and the tank wall is weakened, and the energy loss is apparently reduced. In this case, the overall flow velocity in the aquaculture tank is the highest, the high-speed circulation area is the largest, and the waste collection performance is satisfactory. Myong et al. (2021) found that in the case of a single inlet pipe, the self-cleaning ability of the tank is best at the golden split point, which is very close to the results in this paper. After further increasing the inlet pipe deployment distance to d=1/2 r, the high-speed flow was less affected by the tank wall due to the large deployment distance. Meanwhile, the overall flow velocity in the aquaculture tank is higher, the high-speed circulation area is larger, and the hydrodynamic characteristics of the waste collection are better. The numerical simulation results of Hu et al. (2022) indicated that the optimal waste collection efficiency was achieved when the inlet pipe was set at an angle of α=0° and 45° and at the distance of d=3/8 r and d=1/50 r, respectively, which basically agreed with the results of this paper and provided support for the experimental study of this paper.
The angle of the inlet pipe design is an essential factor affecting waste collection and flow field characteristics in the aquaculture tank. The loss of energy in the aquaculture tank is mainly due to the collision between the high-speed flow and the tank wall and the loss of the fusion of the high-speed flow and the overall circulation. The circular aquaculture tank studied in this paper exhibits good hydrodynamic characteristics of the waste collection when the distance and angle of the inlet pipe are set to d=1/4 r and α=20°~30° in the single inlet pipe design and d=1/2 r and α=0°~10° under the dual inlet pipe design. Ren et al. (2020) investigated the effect of angle on waste movement and collection in a square circular angle aquaculture tank with dual inlet pipe. The results show that when the angle is 40° and 50°, respectively, the performance of waste collection and hydrodynamic characteristics in the aquaculture tank are optimal, which is similar to the optimal single inlet pipe deployment angle when the distance is d=1/50 r in this paper. Since the difference between the optimal deployment angle and the data of the adjacent angle is small, for the convenience of the deployment operation in actual production, this study gives the reference range instead of a specific value of the deployment angle of the inlet pipe.
5 Conclusion
This paper investigated the effect of the inlet pipe design on the waste collection and hydrodynamic characteristics of the aquaculture tank under two types of inlet pipe design (dual and single inlet pipe designs) through physical model experiments, and the main findings are as follows:
1. The variations of waste movement, flow filed and hydrodynamic indicators are consistent in both designs of dual inlet and single inlet, and merely differ in the absolute value. Based on the comprehensive analysis, the optimal performance of self-cleaning can be obtained at α=0°~10°, 20°~30°, 40°~50° for d=1/2 r, 1/4 r, and 1/50 r, respectively.
2. By comparing the optimal results of each deployment distance in both inlet pipe designs, it is recommended to adopt the single inlet design with the setup of α=20°~30°, d=1/4 r on the condition of the same flow rate of these two inlet designs.
Data availability statement
The original contributions presented in the study are included in the article/supplementary material. Further inquiries can be directed to the corresponding author.
Author contributions
YZ: Data curation, Formal analysis, Writing-original draft. XY: conceptualization; XQ: Conceptualization, Funding acquisition, Resources, Writing-review and editing. JH: Methodology, Software, Conceptualization, Supervision; FZ: Investigation, Methodology. FG: Conceptualization. DF: Funding acquisition, Resources. All authors contributed to the article and approved the submitted version.
Funding
This research was funded by the National Natural Science Foundation of China under grant number 31902425, the Natural Science Foundation of Zhejiang Province under grant number LGN21C190010, and the Bureau of Science and Technology of Zhoushan under grant number 2020C21003.
Acknowledgments
The authors would like to thank all the reviewers who participated in the review, as well as MJEditor (www.mjeditor.com) for providing English editing services during the preparation of this manuscript.
Conflict of interest
The authors declare that the research was conducted in the absence of any commercial or financial relationships that could be construed as a potential conflict of interest.
Publisher’s note
All claims expressed in this article are solely those of the authors and do not necessarily represent those of their affiliated organizations, or those of the publisher, the editors and the reviewers. Any product that may be evaluated in this article, or claim that may be made by its manufacturer, is not guaranteed or endorsed by the publisher.
References
Benoit D. (2007). Hydrodynamic characteristics of muti-drain circular tanks. Proc. Sixth. Int. Conf. Recirculating. Aquacult., 394–404.
Burrows R. E., Chenoweth H. (1955). Evaluation of three types of fish rearing tanks[M] (US Government Printing Office).
Davidson J., Summerfelt S. (2004). Solids flushing, mixing, and water velocity profiles within large (10 and 150 m3) circular ‘Cornell-type’ dual-drain tanks. Aquacult. Eng. 32 (1), 245–271. doi: 10.1016/j.aquaeng.2004.03.009
Gorle J. M. R., Terjesen B. F., Mota V. C., Summerfelt S. (2018). Water velocity in commercial RAS culture tanks for Atlantic salmon smolt production. Aquac. Eng. 81, 89–100. doi: 10.1016/j.aquaeng.2018.03.001
Gorle J. M. R., Terjesen B. F., Summerfelt S. T. (2020). Influence of inlet and outlet placement on the hydrodynamics of culture tanks for Atlantic salmon. Int. J. Mechanical. Sci. 188. doi: 10.1016/j.ijmecsci.2020.105944
Hu J., Zhang H., Wu L., Zhu F., Zhang X., Gui F., et al. (2022). Investigation of the inlet layout effect on the solid waste removal in an octagonal aquaculture tank. Front. Mar. Sci. 9. doi: 10.3389/fmars.2022.1035794
Hu J., Zhu F., Yao R., Gui F., Liu B., Zhang Z., et al. (2021). Optimization of the inlet pipe layout of circular recirculating water aquaculture tank based on STAR-CCM+. doi: 10.11975/j.issn.1002-6819.2021.21.028
Masaló I., Oca J. (2016). Influence of fish swimming on the flow pattern of circular tanks. Aquac. Eng. 74, 84–95. doi: 10.1016/j.aquaeng.2016.07.00
Oca J., Masalo I. (2007). Design criteria for rotating flow cells in rectangular aquaculture tanks. Aquacult. Eng. 36), 36–44. doi: 10.1016/j.aquaeng.2006.06.001
Oca J., Masaló I. (2013). Flow pattern in aquaculture circular tanks: Influence of flow rate, water depth, and water inlet & outlet features. Aquacult. Eng. 52 (52), 65–72. doi: 10.1016/j.aquaeng.2012.09.002
Oca J., Masaló I., Reig L. (2004). Comparative analysis of flow patterns in aquaculture rectangular tanks with different water inlet characteristics. Aquacult. Eng. 31 (3-4). doi: 10.1016/j.aquaeng.2004.04.002
Plew D. R., Klebert P., Rosten T. W., et al. (2015). Changes to flow and turbulence caused by different concentrations of fish in a circular tank. J. Hydraulic. Res. 53), 364–383. doi: 10.1080/00221686.2015.1029016
Ren X. Z., Wang J. Z., Zhang Q. (2020). Influence of inlet structure on flow field in a rectangular arc angle tank in aquaculture. Journal of Dalian Ocean University 726–732. doi: 10.16535/j.cnki.dlhyxb.2020-097
Sin M-G, An C-H, Cha S-J, Kim M-J, Kim H-N (2021). A method for minimizing the zone of low water flow velocity in a bottom center drain circular aquaculture tank. doi: 10.1111/jwas.12792
Skybakmoen (1989). “Impact of water hydraulics on water quality in fish rearing units,” in Aqua Nor 89, Conference 3-water treatment and quality. 17–21.
Summerfelt S. T., Davidson J., Timmons M. B. (2000). “Hydrodynamics in the ‘cornell-type’ dual-drain tank,” in The third international conference on recirculating aquaculture. Eds. Libey G. S., Timmons M. B. (Roanoke, VA, USA: Virginia Polytechnic Institute and State University), 160–166.
Summerfelt S. T., Mathisen F., Holan A. B., Terjesen B. F. (2016). Survey of large circular and octagonal tanks operated at Norwegian commercial smolt and post-smolt sites. Aquac. Eng. 74, 105–110. doi: 10.1016/j.aquaeng.2016.07.00
Tvinnereim K., Skybakmoen S. (1989). “Water exchange and self-cleaning in fish-rearing tanks,” in Aquaculture. a biotechnology in progress. Eds. DePauw N., Jaspers E., Aokefors H., Wiikens N. (Bredena, Belgium: European Aquaculture Society), 1041–1047.
Venegas P. A., Narváez A. L., Arriagada A. E., Llancaleo K. A. (2014). Hydrodynamic effects of use of eductors (Jet-mixing eductor) for water inlet on circular tank fish culture. Aquac. Eng. 59, 13–22. doi: 10.1016/j.aquaeng.2013.12.00
Xue B. R., Jiang H.Z., Ren X. Z. (2020). Study on the influence of the relative inflow distance on the flow field characteristics in square arc angle aquaculture tank. Fishery Modernization. doi: 10.3969/j.issn.1007-9580.2020.04.004
Keywords: recirculating water aquaculture, flow field distribution, waste collection, hydrodynamic characteristics, circular aquaculture tank
Citation: Zhang Y, Yang X, Hu J, Qu X, Feng D, Gui F and Zhu F (2023) Effect of inlet pipe design on self-cleaning ability of a circular tank in RAS. Front. Mar. Sci. 10:1120205. doi: 10.3389/fmars.2023.1120205
Received: 09 December 2022; Accepted: 04 January 2023;
Published: 30 March 2023.
Edited by:
Ce Shi, Ningbo University, ChinaReviewed by:
Yong Cui, Yellow Sea Fisheries Research Institute (CAFS), ChinaRen Xiaozhong, Dalian Ocean University, China
Copyright © 2023 Zhang, Yang, Hu, Qu, Feng, Gui and Zhu. This is an open-access article distributed under the terms of the Creative Commons Attribution License (CC BY). The use, distribution or reproduction in other forums is permitted, provided the original author(s) and the copyright owner(s) are credited and that the original publication in this journal is cited, in accordance with accepted academic practice. No use, distribution or reproduction is permitted which does not comply with these terms.
*Correspondence: Xu Yang, MjAyMjE4OEB6am91LmVkdS5jbg==; Jiajun Hu, ejIwMDk1MTM2MjEyQHppb3UuZWR1LmNu