 Lauren R. Bolzan
 Alison M. Roark*
- Department of Biology, Furman University, Greenville, SC, United States
In cnidarian symbiosis research, studying algal uptake, maintenance, and expulsion typically requires quantification of algal density in host tissue. Multiple methods are used to measure algal density including in vitro cell counts of holobiont homogenate and in situ cell counts of tentacle clippings. The relative precision of both types of measurement has not previously been reported for the model cnidarian Exaiptasia diaphana in the fully symbiotic state. The objective of this study was to evaluate the precision of in vitro and in situ algal density measurement protocols using light, fluorescent, and confocal microscopy and an automated cell counter. In situ algal density was quantified as algal area fraction (%) using confocal images of tentacle clippings mounted on two types of slides. In vitro algal density of holobiont homogenate was quantified as algal cells/µl of holobiont homogenate using an automated cell counter and a hemocytometer viewed using light and fluorescent microscopy. Triplicate measurements of each method for ten anemones were collected and the coefficient of variation was calculated and compared across the ten anemones within each method. The algal density measurements were equally precise when they were obtained by quantifying in vitro cell counts using a hemocytometer and when they were obtained by quantifying in situ cell counts. While both light and fluorescent microscopy yielded similar measurement precision of in vitro cell counts, use of a fluorescent microscope was more efficient and convenient than use of a light microscope, and both methods required terminal sampling. Conversely, in situ methods required more sophisticated equipment (namely a confocal microscope) but involved non-terminal sampling. An automated cell counter was ineffective for in vitro quantification of algal density, although the potential utility of this technology warrants future attempts using a more robust algal cell purification process that could include filtering homogenate prior to analysis. This study demonstrated that in vitro and in situ methods yield estimates of algal density with comparable precision, which is information that researchers can use for future studies when making decisions about methodology.
1 Introduction
The symbiotic relationship between cnidarians and dinoflagellates is the foundation for coral reef systems. Dinoflagellates are photosynthetic microalgae that commonly live as endosymbionts within host-derived, membrane-bound vesicles called symbiosomes in the gastrodermal tissue of cnidarians (Wakefield and Kempf, 2001). These symbionts provide photosynthetic products that facilitate host metabolism, growth, reproduction, and survival in exchange for a stable habitat and inorganic nutrients in an otherwise nutrient-poor habitat (Yellowlees et al., 2008; Davy et al., 2012).
In cnidarians, elevated temperatures induce bleaching, in which the host expels its symbionts through apoptotic pathways mediated at least in part by reactive oxygen species (Weis, 2008; Hawkins et al., 2013). As a consequence of climate change, mass bleaching events are increasing in frequency (Hoegh-Guldberg et al., 2017). While bleached cnidarians often suffer starvation and death (Hoegh-Guldberg, 1999), others can tolerate bleaching and eventually recover by re-establishing a population of resident symbionts via gastrodermal phagocytic pathways (Davy et al., 2012; Tivey et al., 2022).
Given the important role of symbiotic dinoflagellates in reef systems, recent research has focused on the establishment, maintenance, loss, and re-establishment of the symbiosis (Weis, 2008; Davy et al., 2012; Hawkins et al., 2013; Weis, 2019; Tortorelli et al., 2020). However, studying these processes in corals is logistically challenging for many reasons (Hambleton et al., 2014). In lieu of corals, the sea anemone Exaiptasia diaphana is increasingly used as a model cnidarian. E. diaphana is facultatively symbiotic with dinoflagellates from the family Symbiodiniaceae. Unlike many reef-building corals, this sea anemone does not have a calcium skeleton, propagates asexually, is easy to rear in the laboratory, and tolerates bleaching, so it can be used to study the uptake, loss, and recovery of symbionts (Dungan et al., 2020). Such studies typically require the quantification of symbiont density in host tissue.
Many methods have been used to repeatably estimate symbiont density in anemones (Cunning and Baker, 2014). Some researchers have used a manual (Bhagooli and Hidaka, 2004; Hawkins et al., 2013) or automated (Dungan et al., 2020; Hartman et al., 2020; Dungan et al., 2022) hemocytometer and/or a flow cytometer (Krediet et al., 2015) to measure in vitro algal density after homogenizing the anemone with its resident symbionts (collectively termed the holobiont). Other researchers have used fluorescent imaging methods (Parkinson et al., 2018; Tortorelli et al., 2020; Presnell et al., 2022) to measure algal density in situ, particularly in early stages of colonization or re-colonization after symbiont loss when algal densities are relatively low (Jinkerson et al., 2022; Maruyama et al., 2022; Tivey et al., 2022). These methods differ not only in cost, efficiency, and convenience, but also in accuracy and precision (Krediet et al., 2015).
Whereas accuracy reflects the proximity of an estimate to its true or “correct” value, precision reflects the repeatability of a measurement. All else being equal, the “optimal” method for measuring algal density would be one that is both accurate and precise. However, accuracy and precision of a method likely depend on the size of the anemone, the stage of algal colonization, and thus the relative algal density. For example, in vitro analysis of algal density in holobiont homogenate may be less accurate for smaller anemones and for anemones early in the colonization process than for larger or more symbiotic anemones due to difficulties in obtaining algal pellets during the homogenization process. On the other hand, in situ imaging of anemone tentacles might be less accurate for larger or more symbiotic anemones due to the potential for overlapping of cells within a three-dimensional matrix. In addition, in situ methods typically quantify the autofluorescence of algal chlorophyll, which can vary by algal strain, algal cell size, and environmental conditions. The “optimal” method for measuring algal density may also differ depending on the need for repeated sampling and the availability of equipment, which can be particularly limiting in teaching laboratories.
The purpose of this study was to quantify the precision of both in vitro and in situ methods for measuring algal density that are commonly used in both teaching and research laboratories. Notably, the anemones we tested were in the maintenance phase of symbiosis and were thus fully symbiotic with high algal densities. Of the five methods tested, two comprised in situ measurements of tentacles viewed using a confocal microscope, and three comprised in vitro measurements of holobiont homogenate. While in vitro measurement precision has previously been evaluated (Krediet et al., 2015), our comparison of in vitro and in situ measurements of fully symbiotic anemones provides additional, valuable methodological information for researchers studying cnidarian symbiosis and for those seeking to leverage such methods in their teaching laboratories.
2 Materials and equipment
2.1 Reagents
-Artificial sea water (Instant Ocean, 30 ppt)
-MgCl2 (0.37 M)
2.2 Supplies
-Anemone tanks (crystallizing dishes) with lids (glass Petri dish tops)
-Incubator
-Artemia spp. nauplii
-Micropipettors and tips
-Dissecting scissors
-Microscope slides and coverslips
-Gasket stickers (Secure-Seal Spacer™, Grace Bio-Labs, Bend, Oregon)
-Balance (to 0.001 g)
-Microcentrifuge tubes
-Glass homogenizing tubes (12 x 75 mm)
-Syringes outfitted with 25-gauge needles
2.3 Equipment and software
-Laboratory refrigerator/freezer
-Homogenizer (e.g., PowerGen 500 S1, Germany)
-Vortexer
-Brightline hemocytometer (Hausser Scientific, Horsham, PA)
-Automated cell counter (e.g., Scepter™, Millipore, Burlington, MA) with sensor tips
-Light microscope (e.g., Motic® BA300, Schertz, TX)
-Inverted fluorescent microscope (excitation wavelength 470 ± 22, emission wavelength 685 ± 40; e.g., EVOS® M7000, Thermo Fisher Scientific, Waltham, MA)
-Confocal microscope (e.g., DMi 8 with LAX software, Leica Microsystems CMS, Wetzlar, Germany)
-ImageJ
3 Methods
Anemones were maintained and algal densities were determined using in situ and in vitro methods as described previously (Poole et al., 2022) with some modifications. Briefly, ten medium symbiotic Exaiptasia diaphana sea anemones (blotted wet masses of approximately 5-35 mg) harboring Symbiodiniaceae symbionts (clades unknown) were maintained in artificial sea water (Instant Ocean, 30 ppt) in 100 ml crystallizing dishes at 26°C on a 12:12 light:dark cycle under alternating wide spectrum white and actinic bulbs. Anemones were fed brine shrimp (Artemia spp.) nauplii and tanks were cleaned twice weekly in the weeks leading up to the study.
3.1 In situ analyses
Tentacle clippings were used for in situ quantification of algal density. Each of ten anemones was first anesthetized for 5-10 minutes in a 50:50 mix of 0.37 M MgCl2 and sea water (30 ppt) until fully relaxed. Dissecting scissors were then used to remove three tentacles, which were placed on a slide and coverslipped. Each slide was visualized at 5x magnification using a DMi 8 confocal microscope (Leica Microsystems CMS, Wetzlar, Germany) and LAX software (version 3.5.5.19976). The following image acquisition settings were used: 488 nm excitation wavelength, 649-721 nm emission wavelengths, 2% power, and gain of 250 V. Brightfield, fluorescent, and overlay images of the middle of the tentacle, where the gastrodermal outline could be seen in the brightfield display and the algal density was brightest on the fluorescent display, were simultaneously captured at a resolution of 2048 x 2048 pixels and a speed of 200 Hz. Fluorescent images with white pixels representing autofluorescence of algal chlorophyll were then inverted (white pixels to black and vice versa) and converted into binary images using automatic thresholding in ImageJ (version 1.53; Figure 1).
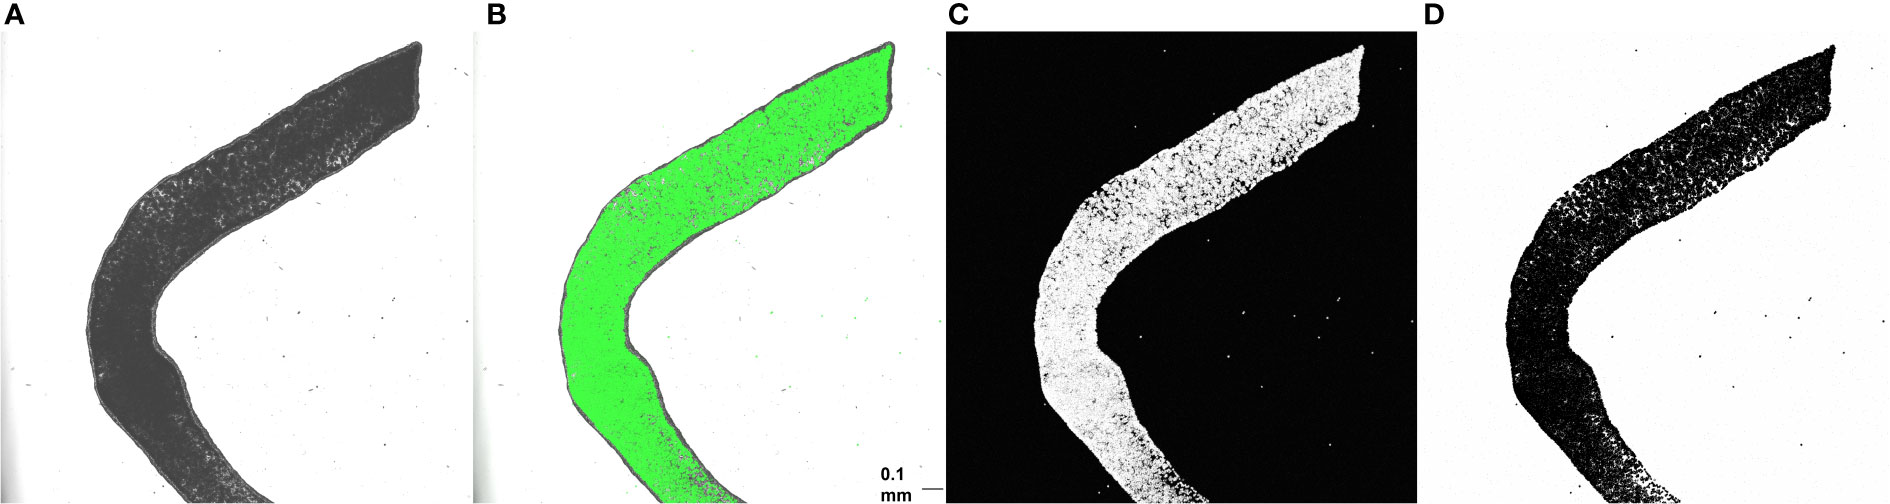
Figure 1 Brightfield (A), overlay (B), fluorescent (C), and inverted binary (D) images of one anemone tentacle mounted on a plain slide. Scale bar = 0.1 mm. ImageJ was used to quantify algal area fraction in binary images. A region of the tentacle containing only gastrodermal cells was first outlined using the freeform tool, and area fraction was then determined using the measure tool.
From each anemone, three additional tentacles were clipped, placed on a slide containing a gasket sticker (Secure-Seal Spacer™, Grace Bio-Labs, Bend, Oregon) with eight circular wells (0.12 mm deep), and coverslipped. Gasket stickers were used to elevate coverslips above the tentacles, thereby maintaining the three-dimensional structure of tentacle clippings with more fidelity than is possible when mounting tentacle clippings using only a coverslip. Images of each tentacle were then visualized using the same confocal microscopy settings as above with the addition of a z-stack at 12 µm intervals. When stacked images were merged, pixel saturation occurred. For this reason, only the single brightest of the resulting individual fluorescent images was analyzed.
ImageJ (version 1.53) was used to quantify algal area fraction (%) as the proportion of total tentacle area occupied by black pixels. A region of the tentacle containing only gastrodermal cells was first outlined using the freeform tool, and area fraction was then determined using the measure tool.
3.2 In vitro analyses
After the six tentacles used for in situ analyses were removed from each anemone, the anemone was placed in a 2 ml microcentrifuge tube and frozen overnight at -20°C. Each frozen anemone was subsequently thawed and then homogenized (PowerGen 500 S1, Fisher Scientific, Waltham, Massachusetts) in 12 x 75 mm glass tubes in 1 ml of sea water (30 ppt) using 10-second pulses four or five times. The resulting homogenate was transferred into a microcentrifuge tube and needle-homogenized several times using a syringe outfitted with a 25-gauge needle to shear apart any remaining tissue clumps. The microcentrifuge tube was vortexed for 10 seconds and then centrifuged at 10,000 rpm for 5 minutes. The supernatant was discarded, and the pellet was reconstituted in 1 ml of sea water (30 ppt). The reconstituted sample was needle-homogenized and centrifuged again as described above. The supernatant was discarded, and the pellet was again reconstituted in 1 ml of sea water (30 ppt). This final algal suspension was either analyzed immediately (via light microscopy) or stored in the dark at 4°C for two days before subsequent analyses (via fluorescent microscopy) were completed.
Each algal suspension was analyzed in triplicate using 15 µl aliquots in a brightline hemocytometer (Hausser Scientific, Horsham, PA) visualized using both a light microscope (Motic® BA300, Schertz, TX) and an inverted fluorescent microscope (excitation wavelength 470 ± 22, emission wavelength 685 ± 40; EVOS® M7000, Thermo Fisher Scientific, Waltham, MA). For aliquots visualized using fluorescent microscopy, a tiled image of the whole hemocytometer grid was captured (Figure 2). Algal cells visualized using light and fluorescent microscopy were manually counted in each of four (of nine) large grid squares on the hemocytometer. Algal counts in the four grid squares were then averaged. This process was repeated for two additional aliquots of each algal suspension, yielding a total of three algal density measurements per sample.
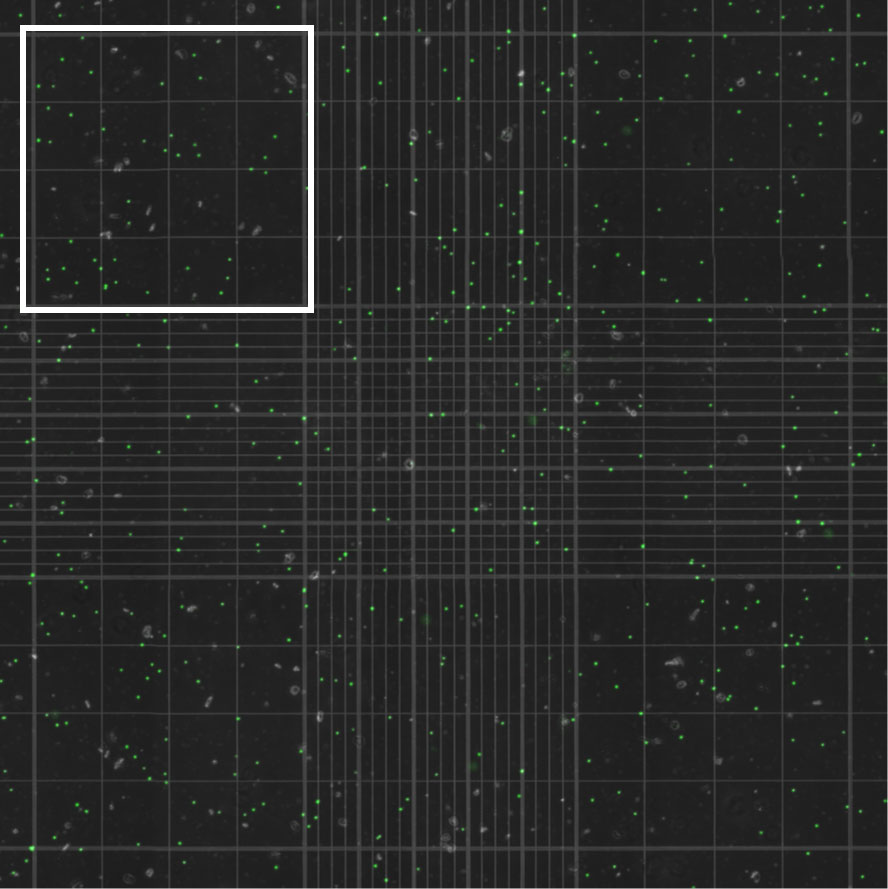
Figure 2 Algal cells extracted from an anemone and quantified using a hemocytometer visualized with an inverted fluorescent microscope. Autofluorescent algal cells were counted in each of four (of nine) large grid squares on the hemocytometer, one of which is outlined in white, for each of three aliquots per anemone. Algal counts in the four grid squares were then averaged for each aliquot.
Algal suspensions were also analyzed using a Scepter™ (Millipore, Burlington, MA) automated cell counter with a 40 µm sensor. Following manufacturer instructions, algal densities were obtained for several aliquots, but the sensors frequently clogged. Thus, this method was eventually abandoned.
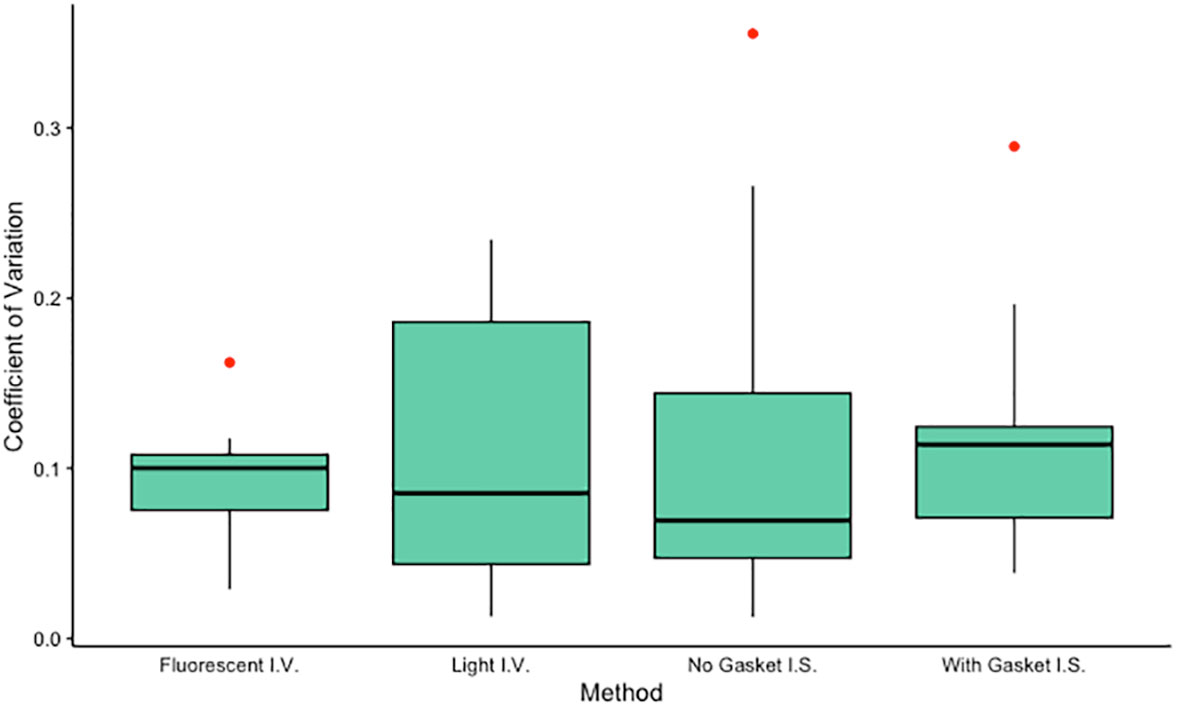
Figure 3 Coefficients of variation for each method tested (n = 10 each). Algal density of one anemone from each of 10 different clone lines was determined in triplicate using each of four methods: an in vitro method using a hemocytometer visualized with fluorescent microscopy, an in vitro method using a hemocytometer visualized with light microscopy, an in situ method using a slide-mounted tentacle visualized using a confocal microscope, and an in situ method using a tentacle mounted on a gasket slide visualized using a confocal microscope. Mean CVs did not differ significantly among groups (ANOVA, F3,36 = 0.155, p = 0.93) or between pairs of in situ or in vitro methods (paired t-tests, t = 0.34, p = 0.74 and t = 0.05, p = 0.96 respectively). I.V., in vitro; I.S., in situ.
3.3 Data analysis
Our goal was to evaluate relative precision of raw algal density measurements, not algal density measurements normalized to anemone size (e.g., mass, protein content), as normalization measurements also vary in their precision. To avoid confounding the variation among algal density measurements with the variation among normalization measurements, algal densities were expressed in untransformed units generated directly from the analytical tools we used. In situ analyses yielded algal densities measured as percent of tentacle area occupied by algae, and in vitro analyses yielded algal densities measured as cells per microliter. For all in situ and in vitro measurements of algal density except those generated using the automated cell counter, the coefficient of variation (CV) was calculated as standard deviation divided by the mean for each set of triplicate measurements, resulting in 10 CVs for each of four methods (two in situ methods and two in vitro methods). Estimates of in situ algal density measured in units of algal area fraction correlate tightly with estimates measured in cells per tentacle area (Tortorelli et al., 2020), indicating that our measurements of algal area fraction reflect biologically relevant algal densities.
We analyzed CVs using R (version 4.2.1; R Development Core Team, 2013). CVs were transformed to satisfy the assumptions of normality and equal variances. Normality was evaluated using Shapiro tests, and equality of variances was evaluated using Bartlett tests. We compared mean CVs among all four methods using analysis of variance (ANOVA). We also compared mean CVs for the two in situ methods and for the two in vitro methods using paired t-tests. We compared algal density measurements (n = 10 values, each representing the mean of triplicate values) for the two in situ methods and for the two in vitro methods using sign tests for matched pairs. Lastly, we tested for correlations between the algal density measurements for each method and the algal density measurements for each of the other methods using Spearman tests. In vitro algal densities were corrected for anemone mass before they were used in correlation tests. For all tests, α = 0.05.
4 Results
The two in situ methods, in which algal density was quantified using tentacle clippings, yielded algal density values (mean ± standard error) of 73.17 ± 4.89% for images generated without a gasket slide and 62.08 ± 3.74% for images generated using a gasket slide. These algal densities differed significantly (sign test for matched pairs, p = 0.021). The two in vitro methods, in which algal density in holobiont homogenate was quantified using a hemocytometer, yielded algal density values (mean ± standard error) of 900.1 ± 157.8 cells/µl for samples analyzed using a light microscope and 621.7 ± 46.8 cells/µl for samples analyzed using a fluorescent microscope. These algal densities did not differ significantly (sign test for matched pairs, p = 0.754). Mean coefficients of variation (CVs) did not differ significantly among methods (ANOVA, F3,36 = 0.155, p = 0.93, Figure 3) or between pairs of in situ or in vitro methods (paired t-tests, t = 0.34, p = 0.74 and t = 0.05, p = 0.96 respectively). While the algal densities generated by the two in situ methods were significantly correlated (Spearman test, S = 22, p = 0.003), no additional significant correlations were identified (Spearman tests, p > 0.05).
5 Discussion
In cnidarian symbiosis research, studying algal uptake, maintenance, and expulsion typically requires quantification of algal density in host tissue. The goal of this study was to determine the most precise method for measuring algal density in the maintenance phase of colonization in the model sea anemone Exaiptasia diaphana. We evaluated two in situ methods and three in vitro methods for quantifying algal density, all of which have been used in both teaching and research laboratories. Of these five methods, four generated repeatable measurements. Our data indicate that either a light or a fluorescent microscope can be used to measure algal density of holobiont homogenate with comparable precision (median CVs of 9 and 10%, respectively). While we did not evaluate relative accuracy of our methods, we suspect that use of a fluorescent microscope in lieu of a light microscope yields algal counts that are more accurate simply because the autofluorescence of algal chlorophyll provides visual confirmation that an appropriately sized object on the slide is actually an algal cell. Our data also indicate that a single fluorescent image of a tentacle mounted on either a plain slide or a slide with a gasket sticker can be used to measure in situ algal density in anemone tentacles with comparable precision (median CVs of ~7% and 11%, respectively). The precision of in vitro and in situ methods we tested was comparable across methods. The differences we observed among triplicate measurements likely result from some combination of measurement error and true biological variation, but the relative magnitude of these two sources of error cannot be determined from our data.
In vitro analyses of algal density require the homogenization of the holobiont and isolation of algal cells from animal homogenate. The three in vitro methods we tested differed only in the equipment used to count the isolated algal cells. These methods included the use of a manual hemocytometer visualized with either a light or fluorescent microscope and the use of an automated cell counter. Unfortunately, the sensors we used with our automated cell counter clogged repeatedly. For this reason, we measured all of our in vitro algal densities using a manual hemocytometer visualized with a light or fluorescent microscope. Regardless of the device used for counting cells, in vitro methods generate measurements of algal density that include all resident symbiont cells and are thus terminal.
Conversely, in situ methods generate measurements of algal density that include only symbiont cells within a limited number of selected tentacles and are non-terminal. Tentacles contain both longitudinal and circular muscles that enable tentacle retraction (Parker and Titus, 1916; Jahnel et al., 2014). They also vary in size both within and among anemones and change size in response to nutritional conditions (Rädecker et al., 2019). Therefore, for in situ analyses, the amount of tissue analyzed, the extent of tentacle compaction, and the algal density can vary among samples, even when tentacles are harvested from anesthetized anemones. Furthermore, algal density varies spatially and temporally within an anemone and even within individual tentacles, especially during colonization (Gabay et al., 2018). Moreover, in situ methods may become increasingly inaccurate as algal densities increase (e.g., in later stages of the colonization process) due to cell overlapping or pixel saturation. Overlapping of cells may also explain why our algal density measurements were typically larger for tentacles mounted on a plain slide, on which tentacle tissue was flattened between the slide and coverslip before being imaged, than for tentacles mounted on a gasket slide, on which three-dimensional tentacle structure was maintained and individual planes of tissue were imaged. Thus, while in situ analyses can provide tissue-specific information about algal density using non-terminal sampling, such measurements may not accurately reflect the entire symbiont population, especially in later stages of algal colonization. The fact that our in situ and in vitro algal density measurements were not significantly correlated lends support to this idea.
While the four methods we tested did not differ in their precision, they did differ in their efficiency. For both successful in vitro methods, a hemocytometer was used to measure cell density in holobiont homogenate. In both cases, cells were manually counted either from an image captured by a fluorescent microscope or directly from the hemocytometer visualized by a light microscope. Image capture using the tiling function on a fluorescent microscope required approximately two minutes per aliquot, whereas use of a light microscope did not require any time for image capture. However, the autofluorescence of algal chlorophyll made cell counting of captured fluorescent images faster relative to cell counting in real time using a light microscope. In addition, unlike cell counting in real time, cell counting of fluorescent images could be completed at the researcher’s convenience on a personal device. Thus, for terminal studies, we recommend quantifying algal density of holobiont homogenate using a hemocytometer visualized with a fluorescent microscope to maximize precision, efficiency, convenience, and possibly also accuracy. While Krediet et al. (2015) reported that measurement of in vitro algal densities with a flow cytometer was more precise and efficient than use of a hemocytometer, we found that our robust sample preparation process allowed us to measure in vitro algal densities both efficiently and precisely. This process therefore holds great promise for researchers who do not have access to a flow cytometer but need to measure algal density, especially in fully symbiotic anemones.
For both in situ methods, tentacles were mounted on slides and then visualized using a confocal microscope. Although only a single image of each tentacle was ultimately analyzed with both methods, the image capture process differed between the two methods because of differences in tentacle thickness and shape. A single image of each flattened tentacle mounted on a plain slide was captured, whereas multiple images of each tentacle mounted on a slide with a gasket sticker were captured. For this reason, image capture required approximately 30 seconds for each tentacle mounted on a plain slide or six minutes for each tentacle mounted on a slide with a gasket sticker. Regardless of the in situ method used to generate tentacle images, image analysis required less than a minute per image and could be completed at the researcher’s convenience on a personal device. Thus, for non-terminal studies, we recommend quantifying algal density by capturing fluorescent images of tentacles mounted on plain slides to maximize both precision and efficiency.
The results of this study suggest that counting algal cells in holobiont homogenate using a hemocytometer visualized with a fluorescent microscope and quantifying algal area fraction in anemone tentacles mounted on plain slides are both precise, efficient, and convenient methods for measuring symbiont density in fully symbiotic anemones. Of these two methods, the former also requires fairly basic laboratory equipment and thus has utility in both teaching and research laboratories. Because many older studies (e.g., Steele, 1976; Muscatine et al., 1991) reported algal densities that were also measured using hemocytometers, the in vitro methods we tested provide a way to compare historical and modern measurements while also minimizing error. The in vitro methods we tested can also be used alongside other analytical techniques (e.g., protein assays, molecular sequencing) that similarly require homogenization of the holobiont. However, these in vitro methods are incompatible with non-terminal studies that require repeated sampling of the same holobiont over time. In such cases, our data indicate that algal density can be quantified using either of two in situ methods with comparable precision.
Data availability statement
The raw data supporting the conclusions of this article will be made available by the authors, without undue reservation.
Author contributions
AR and LB conceived of and designed the study. LB generated the data and wrote the first draft. AR revised and submitted the final manuscript. All authors contributed to the article and approved the submitted version.
Funding
Furman University provided funding for this project.
Acknowledgments
We thank Adi Dubash for assistance with image analysis and three reviewers for feedback that substantially improved the quality of this manuscript.
Conflict of interest
The authors declare that the research was conducted in the absence of any commercial or financial relationships that could be construed as a potential conflict of interest.
Publisher’s note
All claims expressed in this article are solely those of the authors and do not necessarily represent those of their affiliated organizations, or those of the publisher, the editors and the reviewers. Any product that may be evaluated in this article, or claim that may be made by its manufacturer, is not guaranteed or endorsed by the publisher.
References
Bhagooli R., Hidaka M. (2004). Release of zooxanthellae with intact photosynthetic activity by the coral Galaxea fascicularis in response to high temperature stress. Mar. Biol. 145, 329–337. doi: 10.1007/s00227-004-1309-7
Cunning R., Baker A. C. (2014). Not just who, but how many: The importance of partner abundance in reef coral symbioses. Front. Microbiol. 5. doi: 10.3389/fmicb.2014.00400
Davy S. K., Allemand D., Weis V. M. (2012). Cell biology of cnidarian-dinoflagellate symbiosis. Microbiol. Mol. Biol. Rev. 76 (2), 229–261. doi: 10.1128/MMBR.05014-11
Dungan A. M., Hartman L. M., Blackall L. L., van Oppen M. J. H. (2022). Exploring microbiome engineering as a strategy for improved thermal tolerance in Exaiptasia diaphana. J. Appl. Microbiol. 132 (4), 2940–2956. doi: 10.1111/jam.15465
Dungan A. M., Hartman L. M., Tortorelli G., Belderok R., Lamb A. M., Pisan L., et al. (2020). Exaiptasia diaphana from the great barrier reef: A valuable resource for coral symbiosis research. Symbiosis 80, 195–206. doi: 10.1007/s13199-020-00665-0
Gabay Y., Weis V. M., Davy S. K. (2018). Symbiont identity influences patterns of symbiosis establishment, host growth, and asexual reproduction in a model cnidarian-dinoflagellate symbiosis. Biol. Bull. 234, 1–10. doi: 10.1086/696365
Hambleton E. A., Guse A., Pringle J. R. (2014). Similar specificities of symbiont uptake by adults and larvae in an anemone model system for coral biology. J. Exp. Biol. 217 (9), 1613–1619. doi: 10.1242/jeb.095679
Hartman L. M., van Oppen M. J. H., Blackall L. L. (2020). The effect of thermal stress on the bacterial microbiome of Exaiptasia diaphana. Microorganisms 8 (1), 20. doi: 10.3390/microorganisms8010020
Hawkins T. D., Bradley B. J., Davy S. K. (2013). Nitric oxide mediates coral bleaching through an apoptotic-like cell death pathway: Evidence from a model sea anemone-dinoflagellate symbiosis. FASEB. J. 27 (12), 4790–4798. doi: 10.1096/fj.13-235051
Hoegh-Guldberg O. (1999). Climate change, coral bleaching and the future of the world’s coral reefs. Mar. Freshw. Res. 50, 839–866. doi: 10.1071/MF99078
Hoegh-Guldberg O., Poloczanska E. S., Skirving W., Dove S. (2017). Coral reef ecosystems under climate change and ocean acidification. Front. Mar. Sci. 4. doi: 10.3389/fmars.2017.00158
Jahnel S. M., Walzl M., Technau U. (2014). Development and epithelial organisation of muscle cells in the sea anemone Nematostella vectensis. Front. Zool. 11, 44. doi: 10.1186/1742-9994-11-44
Jinkerson R. E., Russo J. A., Newkirk C. R., Kirk A. L., Chi R. J., Martindale M. Q., et al. (2022). Cnidarian-symbiodiniaceae symbiosis establishment is independent of photosynthesis. Curr. Biol. 32, 2402–2415. doi: 10.1016/j.cub.2022.04.021
Krediet C. J., Denofrio J. C., Caruso C., Burriesci M. S., Cella K., Pringle J. R. (2015). Rapid, precise, and accurate counts of Symbiodinium cells using the Guava flow cytometer, and a comparison to other methods. PLoS One. 10(8):e0135725. doi: 10.1371/journal.pone.0135725
Maruyama S., Unsworth J. R., Sawiccy V. (2022). Algae from aiptasia egesta are robust representations of symbiodiniaceae in the free-living state. PeerJ 10, e13796. doi: 10.7717/peerj.13796
Muscatine L., Grossman D., Doino J. (1991). Release of symbiotic algae by tropical sea anemones and corals after cold shock. Mar. Ecol. Prog. Ser. 77, 233–243. doi: 10.3354/meps077233
Parker G. H., Titus E. G. (1916). The neuromuscular structure of sea anemones. PNAS 2, 339–341. doi: 10.1073/pnas.2.6.339
Parkinson J. E., Tivey T. R., Mandelare P. E., Adpressa D. A., Loesgen S., Weis V. M. (2018). Subtle differences in symbiont cell surface glycan profiles do not explain species-specific colonization rates in a model cnidarian-algal symbiosis. Front. Microbiol. 9. doi: 10.3389/fmicb.2018.00842
Poole A. Z., Mitchell G., Roark A. M., Schwartz J. (2022). SEAS CURE: exploring coral biology across scales. CourseSource 9:1–19. doi: 10.24918/cs.2022.38
Presnell J. S., Wirsching E., Weis V. M. (2022). Tentacle patterning during Exaiptasia diaphana pedal lacerate development differs between symbiotic and aposymbiotic animals. PeerJ 10, e12770. doi: 10.7717/peerj.12770
Rädecker N., Chen J. E., Pogoreutz C., Herrera M., Aranda M., Voolstra C. R. (2019). Nutrient stress arrests tentacle growth in the coral model aiptasia. Symbiosis 78, 61–64. doi: 10.1007/s13199-019-00603-9
R Development Core Team (2013). R: A language and environment for statistical computing (Vienna: R Foundation for Statistical Computing). Available at: http://www.R-project.org/.
Steele R. D. (1976). Light intensity as a factor in the regulation of the density of symbiotic zooxanthellae in Aiptasia tagetes (Coelenterata, anthozoa). J. Zool. 179 (3), 387–405. doi: 10.1111/j.1469-7998.1976.tb02302.x
Tivey T. R., Coleman T. J., Weis V. M. (2022). Spatial and temporal patterns of symbiont colonization and loss during bleaching in the model sea anemone aiptasia. Front. Mar. Sci. 9. doi: 10.3389/fmars.2022.808696
Tortorelli G., Belderok R., Davy S. K., McFadden G. I., van Oppen M. J. H. (2020). Host genotypic effect on algal symbiosis establishment in the coral model, the anemone Exaiptasia diaphana, from the great barrier reef. Front. Mar. Sci. 6. doi: 10.3389/fmars.2019.00833
Wakefield T. S., Kempf S. C. (2001). Development of host- and symbiont-specific monoclonal antibodies and confirmation of the origin of the symbiosome membrane in a cnidarian–dinoflagellate symbiosis. Biol. Bull. 200, 127–143. doi: 10.2307/1543306
Weis V. M. (2008). Cellular mechanisms of cnidarian bleaching: Stress causes the collapse of symbiosis. J. Exp. Biol. 211 (19), 3059–3066. doi: 10.1242/jeb.009597
Weis V. M. (2019). Cell biology of coral symbiosis: Foundational study can inform solutions to the coral reef crisis. Integr. Comp. Biol. 59, 845–855. doi: 10.1093/icb/icz067
Keywords: Aiptasia, density, fluorescent, hemocytometer, method, microscope, precision, symbiont
Citation: Bolzan LR and Roark AM (2023) Methodological precision of in situ and in vitro algal density measurements in the model cnidarian, Exaiptasia diaphana. Front. Mar. Sci. 10:1120403. doi: 10.3389/fmars.2023.1120403
Received: 09 December 2022; Accepted: 15 March 2023;
Published: 04 April 2023.
Edited by:
Stephane Roberty, University of Liège, BelgiumReviewed by:
Cory J. Krediet, Eckerd College, United StatesTrevor R. Tivey, Oregon State University, United States
Shumpei Maruyama, Carnegie Institution for Science, United States
Copyright © 2023 Bolzan and Roark. This is an open-access article distributed under the terms of the Creative Commons Attribution License (CC BY). The use, distribution or reproduction in other forums is permitted, provided the original author(s) and the copyright owner(s) are credited and that the original publication in this journal is cited, in accordance with accepted academic practice. No use, distribution or reproduction is permitted which does not comply with these terms.
*Correspondence: Alison M. Roark, YWxpc29uLnJvYXJrQGZ1cm1hbi5lZHU=