 Kelly Elschot
 Martin J. Baptist
 Marinka E. B. van Puijenbroek1
- 1Wageningen Marine Research, Wageningen University & Research, Den Helder, Netherlands
- 2Aquatic Ecology and Water Quality Management Group, Wageningen University & Research, Wageningen, Netherlands
A global concern for coastal ecosystems is the predicted rise in sea-level for which salt marshes must keep pace by increasing in surface elevation sufficiently. Variables that control this elevation change need to be identified to predict the adaptability of marshes to future sea-level rise. Many European marshes are grazed by livestock and these heavy grazers can biocompact the soil, a process often underestimated in studies assessing the long-term survival of marshes. We measured elevation changes for thirteen years in the field in grazed and non-grazed marshes. With a statistical model the most important factors controlling rates of surface elevation change were identified and provided the input for a mathematical model to study future elevation change of grazed and non-grazed salt marshes up to 2100 under three Sea Level Rise and sediment supply scenarios. We found that trampling by grazing cattle significantly reduced the annual rates of elevation gain from 11.9 mm yr-1 in the non-grazed marsh to 3.6 mm yr-1 in the grazed marsh. Next to biocompaction by livestock, precipitation deficit and extreme drought resulted in extra compaction. Our model results showed that cattle presence had a negative impact on the future adaptability of salt marshes to grow vertically for rising sea levels. Biocompaction reduced the total elevation change by 42% if the current linear SLR does not accelerate. For an accelerating and high SLR to 109 cm +NAP in 2100, biocompaction reduced elevation changes by 12% and the grazed marsh can no longer outcompete the rise in sea level from around 2050 onwards, compared to the non-grazed marsh. The grazed marsh will slowly drown but this will not lead to a significant change in vegetation composition yet. For an extreme SLR to 195 cm +NAP in 2100 the elevation changes in both the grazed and non-grazed marshes cannot keep pace with the rise in sea level and the marsh vegetation is expected to show regression to plants typical for a low marsh. A reduction in sediment supply will aggravate the effects of SLR and may result in highly increasing inundation frequencies and subsequent disappearance of the marsh vegetation.
1 Introduction
Sea level rise (SLR) is a global concern for coastal ecosystems and human habitats worldwide (Warren et al., 2011). Global Mean Sea Level (GMSL) is rising 3.6 mm yr-1 over the period 2006-2015 and will accelerate. GMSL will rise between 0.43 m (0.29–0.59 m, likely range; RCP2.6) and 0.84 m (0.61–1.10 m, likely range; RCP8.5) by 2100 relative to 1986–2005 (IPCC, 2022). Coastal ecosystems are most vulnerable to accelerated sea-level rise, but provide several important ecosystem services such as biodiversity, as breeding and staging grounds for migratory birds, carbon sequestration, and coastal protection (Chmura et al., 2003; Barbier et al., 2011; Temmerman et al., 2013; Leonardi et al., 2018; Zhu et al., 2020). With enhanced sea level rise, salt marshes may drown, important ecosystem services could get lost and coastal protection compromised (Schuerch et al., 2018; Fitzgerald and Hughes, 2019). It is thus imperative that coastal systems, such as salt marshes, can keep pace with local sea level rise.
Salt marshes are highly dynamic ecosystems where an interplay between vegetation and tidal introduced sediment determine the morphology of the marsh platform (Doody, 2008; Baptist et al., 2016). Sediment moves through the water column during inundations and settles on the marsh platform, i.e. the sedimentation rate (Allen, 2000b; Yang et al., 2008). This enables the marsh to increase in elevation. The marsh surface elevation change is the net result of sedimentation during flooding, organic matter accumulation form the local vegetation, erosion and compaction of the marsh soil (Allen, 2000b; Day et al., 2011). For marshes to withstand the predicted enhanced sea-level rise, rates of marsh elevation change need to be equal or higher than the increase in sea level to maintain the current marsh area. The elevation change varies annually (Yang et al., 2008), across marshes (de Groot et al., 2011; van Dobben et al., 2022) and with age of the system (Elschot et al., 2015; Best et al., 2018). Local marsh elevation changes depend on many biotic and abiotic factors, such as the suspended sediment concentration, vegetation structure, distance to sediment source (i.e. nearest creek and/or mudflat), inundation frequency and/or storm activity (Leonardi et al., 2018; van Dobben et al., 2022). Next to tidal-driven sediment deposition, organic matter accumulation from the local vegetation positively effects vertical marsh growth (Day et al., 2011). Factors negatively affecting marsh growth are erosion due to high bed shear stress from tidal velocities and waves (Allen, 2000b), autocompaction (natural compaction) of the soil due to self-weight or periods of drought (Cahoon et al., 1995; Allen, 2000a) and biocompaction due to large grazers (Elschot et al., 2013; Schrama et al., 2013; Keshta et al., 2020; Marin-Diaz et al., 2021). Additionally, salt marshes shrink and swell depending on the moisture content of the saltmarsh soil (Cahoon et al., 2011).
The marsh elevation and therefore the number of inundations determines for a large part which salt marsh plants can successfully establish (Erchinger, 1985; Davy et al., 2011). Marshes are present in the upper tidal frame above Mean high Tide (MHT) and can be divided in low marsh and high marsh, each with their own characteristic halophytes (Petersen et al., 2014). Low marsh vegetation is generally limited between 120 and 400 inundations yr-1. High marsh vegetation is present between ca. 120 inundations yr-1 and extreme high water levels that are reached only a few times per year (Erchinger, 1985). Below MHT only a few pioneer species can establish, with generally lower cover, aboveground and belowground biomass and higher erosion rates (Bass et al., 2022). When marshes cannot keep pace with an increasing sea level, the number of inundations will increase resulting in regression of the vegetation, for example high marsh vegetation will be replaced by vegetation typical of a low marsh. Ultimately, low marsh vegetation could regress to pioneer zone or bare mudflat. At this point the salt marsh area will be reduced unless the marsh can migrate landwards (Kirwan et al., 2016a). In Europe most mainland marshes are backed up by dikes and are unable to migrate landwards, a process also referred to as coastal squeeze (French, 1997).
Globally, a well-used management practice on tidal marshes is grazing by livestock to maintain plant diversity (Bakker et al., 2002; Davidson et al., 2017; Esselink et al., 2017). Several studies tried to determine the impact of livestock on vertical marsh growth, but results have shown positive (Suchrow et al., 2012), neutral (Davidson et al., 2017) as well as a negative effects (Neuhaus et al., 1999; Schulze et al., 2021; Koppenaal et al., 2022). The impact of livestock grazing also differs between grazer type and intensity (Nolte et al., 2015; Davidson et al., 2017). Livestock can alter marsh elevation changes directly, by trampling the marsh soil, as well as indirectly, by removing aboveground biomass which can hamper the settlement of suspended sediment. Previous studies have shown that the presence of a high dense canopy on the marsh platform reduces the velocity of the inundating water thereby allowing the suspended sediment to settle on the marsh platform (Temmerman et al., 2005; Mudd et al., 2010). Grazers generally alter the vegetation composition, reduce cover, structure, canopy height and litter (Davidson et al., 2017). This could negatively affect local sedimentation rates (Mudd et al., 2010; Bass et al., 2022).
In the past few decades a multitude of models have been developed to predict the ability of marshes to keep up with an increase in sea level (e.g. Morris et al., 2002; Kirwan et al., 2016b; van Dobben et al., 2022). Some conclude that large marsh areas will be lost (FitzGerald et al., 2008; Kirwan and Megonigal, 2013) whereas others state that marshes will be relatively resilient to an accelerated sea-level rise and their vulnerability is overestimated (Kirwan et al., 2016a; Mariotti, 2020; van Dobben et al., 2022). Despite decades of research the dynamic nature of salt marshes with their complex feedbacks between sediment supply, hydrodynamic conditions, local geomorphology and vegetation characteristics has prohibit a clear answer to the question posed whether tidal marshes can keep pace with an enhanced sea-level rise (Fagherazzi et al., 2020). Positive or negative outcomes depend on the local marsh elevation change (e.g. van Dobben et al., 2022), sediment supply (Temmerman et al., 2003; Fagherazzi et al., 2020), the ability of marshes to migrate inland (Kirwan et al., 2016a) as well as which sea level rise scenarios are considered in the model (Kirwan et al., 2010; Mariotti, 2020). Often shallow subsidence and compaction of the marsh soil are neglected (Webb et al., 2013). This becomes increasingly important when marshes are grazed by heavy livestock, which is biocompacting the soil. Therefore, models could overestimate elevation changes and the ability for salt marshes to survive sea level rise.
This study had the unique opportunity to analyse a monitoring data set in which the marsh elevation was measured twice annually over a period of almost twenty years (2001-2020). These type of data sets are key to study long-term changes including mechanisms of succession in dynamic systems such as marshes (Bakker et al., 1996). In 2005, extensive grazing by livestock was introduced to part of the study area, overlapping partially with our long-term monitoring data set. The aims of this study were: 1) determine the impact of grazing by cattle on the rates of marsh elevation change, 2) determine which variables control the elevation changes in grazed and non-grazed marshes in winter and summer and 3) predict future elevation change under grazed and non-grazed management regimes.
2 Material and methods
2.1 Study area
The salt marshes near Holwerd (Figure 1) are located along the mainland coast in the northern part of the Netherlands bordering the Wadden Sea (53°23’7 N, 5°54’11 E). The mainland coast has mesotidal minerogenic salt marshes with a tidal amplitude of 2.3 m (Esselink et al., 2015). They are part of the Wadden Sea area, which is a Nature 2000 conservation area and a UNESCO World Heritage Site. Within the Wadden Sea area there are about 31,000 ha of salt marshes and 7,800 ha of salt marsh pioneer vegetation stretching along the mainland coasts of the Netherlands, Germany and Denmark and on a stretch of back-barrier islands forming the North-Western border of the Wadden Sea (Baptist et al., 2019). Like most Wadden Sea mainland marshes, the salt marshes near Holwerd originate from former reclamation works that started in the first half of the 20th century (Bakker et al., 2002; Esselink et al., 2017). Sedimentation fields delineated by brushwood groynes were used to dampen the hydrodynamic energy of the water allowing sediment to settle within the fields, and a dense drainage system of primary and secondary ditches was used to speed-up the development of vegetation suitable for grazing (Bakker et al., 1997; Hartmann and Stock, 2019). Due to socio-economic developments in the 1990s, mainland salt marshes, including Holwerd, became less popular for commercial livestock grazing and became important nature conservation areas. Efforts were made to increase their naturalness by reducing the maintenance of the dense drainage system (Esselink et al., 2017). Natural marshes now develop in front of the semi-natural marshes (Hartmann and Stock, 2019).
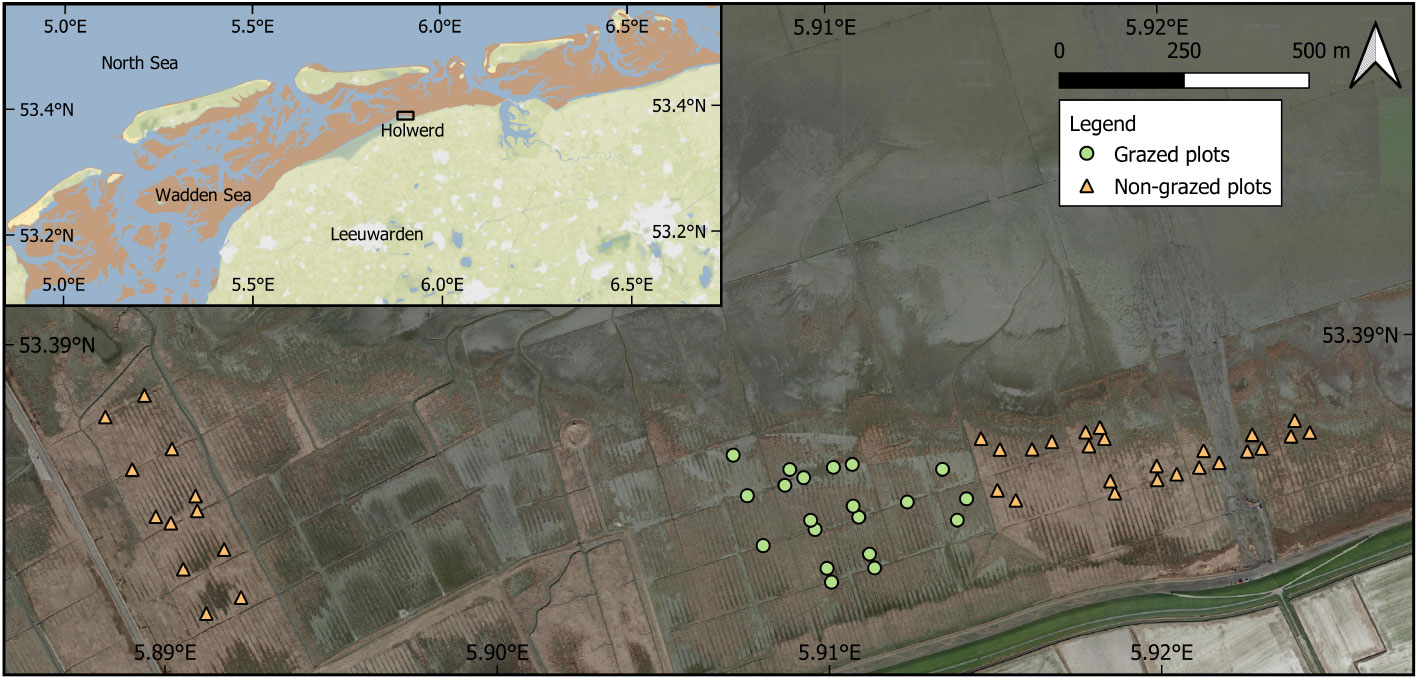
Figure 1 Study area showing all 56 plots included in the statistical and mathematical models (background images ©Google Earth and © Stamen Design CC BY 3.0 license). Symbols show grazed (green circles) and non-grazed permanent plots (orange triangles).
2.2 Experimental set-up and data selection
A monitoring study was initiated in 1998 consisting of 74 permanent plots spread over 2.15 km2 of salt marsh (van Duin and Dijkema, 2003; Elschot et al., 2020). Plots were situated within the pioneer zone, low and high marshes based on the vegetation composition (Petersen et al., 2014). In 2005, grazing was introduced to a part of this marsh.18 plots were subjected to grazing from 2005 onwards which increased to 20 plots from 2007 onwards. Grazing only takes place in summer, generally from June till September/October, with low stocking densities of approximately 20-25 cattle per km2, an intensity that varies slightly each year. Due to nature conservation management decisions 18 from the initial 74 plots were lost during construction work and by relocating the cattle grazed fence several times during this study period. Ultimately, 56 plots were left that could be included in this study that were measured twice a year for the entire study period and had a consistent grazed or non-grazed treatment, of which 36 non-grazed and 20 grazed plots from 2008 till 2020 (Figure 1).
2.3 Marsh elevation change and vegetation measurements
At each plot the change in marsh surface elevation was measured twice per year in spring (March) and summer (August or September) and vegetation composition once per year during the summer measurements. Marsh elevation changes are estimated using sedimentation erosion bars (SEBs), see also van Wijnen and Bakker (2001). SEBs are similar the Sedimentation Erosion Tables (SET) further explained by Boumans and Day (1993) and Cahoon et al. (2002). Both SEBs and SETs can be used to measure changes in surface elevation over months to decades with high precision (Nolte et al., 2013a). A SEB consists of two horizontally aligned poles that are placed permanently in the marsh soil at least 1.5 m deep and into the underlying sand layer to ensure stability in time. During measurements a 2 m long alumium bar is placed on top of these two permanent poles. A ruler is placed through 17 holes in the aluminium bar to measure the distance to the marsh platform with a 1.5 mm accuracy (Nolte et al., 2013a). Holes 1 and 17 were removed from the analyses as these are closest to the SEB poles with highest chance of disturbances. Holes 2 – 16 are averaged to get one value for each plot for each measurement moment. The difference between two consecutive measurements is the surface elevation change over that period.
After establishing the SEB poles in 1998 the absolute height of the poles was measured in meters above the Dutch Ordnance Level (m + NAP) by the Dutch Authority of Waterways (Rijkswaterstaat) using an optical levelling device (van Duin and Dijkema, 2003). In 2022 the SEB poles were measured again using a trimble RTK DGPS, with a few centimetres level of accuracy, to estimate their stability for the duration of this study. Between 1998 and 2022 the permanent SEB poles subsided 3.5 ± 1.7 cm (average ± SD) which is partially explained by tectonic subsidence (Kooi et al., 1998; Hijma and Kooi, 2017) and by the errors of the equipment used.
Next to each SEB a permanent plot was present (2 x 2 m or 1 x 2 m) to map plant species composition and their abundance using either the Tansley method (Tansley, 1946) or the Londo scale (Londo, 1976). All plant species present within the plot get identified and their cover (%) estimated. In 1998 and 1999 the vegetation composition was not mapped and therefore excluded from further analyses. Vegetation height was estimated by placing a ruler within each vegetation plot and estimating the height by eye. Since vegetation presence can affect the wave attenuation and thus sedimentation (Bouma et al., 2007; Mudd et al., 2010; Möller et al., 2014) a measure for vegetation index was calculated by multiplying the total vegetation cover (%) with the average vegetation height (cm) per plot.
2.4 Environmental variables
Distance to the sediment source was measured as the distance to the mudflat edge and the distance to the primary ditch. The geographic position of all plots was logged using a hand-held GPS. For each year the distance for each plot to the saltmarsh edge was determined by using the outer edge of the pioneer zone from vegetation maps of 2002, 2008 and 2014 (Reitsma et al., 2016). The distance to the nearest primary ditch was estimated in the field as close by (<1 m) or further away (> 1 m).
Difference in flooding regime over time was accounted for by including the inundation frequency and the average water column height above the marsh platform during inundation. A time series for water levels was obtained from the InterTides model (Rappoldt et al., 2020). InterTides is a model for interpolation between water levels measured at the tidal gauge stations from Rijkswaterstaat in the Wadden Sea (https://waterinfo.rws.nl). Water levels for the location of the Holwerd salt marsh were obtained from InterTides every 10 minutes for the time interval 18-03-2008 to 31-12-2020. The inundation frequency and water column height during inundation were calculated with the R-package Tides (Cox and Schepers, 2018).
Shrink and swell of the salt marsh soil will result in extra variation in marsh elevation change both seasonally and annually (Cahoon et al., 2011), depending whether the measurement followed a period of either a precipitation deficit or a surplus. To account for this variation, the precipitation deficit (mm) was calculated for one week before the measurement. The precipitation and evaporation are measured at the nearest weather station in Lauwersoog (data available at https://www.knmi.nl/nederland-nu/klimatologie/daggegevens). The precipitation deficit is calculated by subtracting the evaporation from the precipitation.
2.5 Statistical model
To determine which environmental factors explain the measured surface elevation change in the field between 2008 and 2020, three general additive mixed models (GAMs) were performed for annual, winter (1 October – 1 April) and summer (1 April – 1 October) rates of elevation change (mm/month). All three models included grazing (Yes or No), distance from a primary ditch (<1 or >1 m), vegetation index, inundation frequency (tides/year), average water column height during inundation (cm), and precipitation deficit from one week until measurement (mm) as explanatory variables. Marsh elevation (m + NAP) was excluded from the analysis as it was highly correlated with inundation frequency (tides/month). The explanatory variables that showed a non-linear relationship were analysed using a smoothing term, which can capture a non-linear relationship. To analyse annual and winter elevation change, inundation frequency and average water column height during inundation were analysed with a smoothing term. For the summer period precipitation deficit was analysed with a smoothing term. To analyse the summer elevation change, the elevation change measured in the previous winter was included as an explanatory variable, because a higher sedimentation rate in winter could explain a higher compaction rate in the following summer. To account for spatial correlation the plot identity was included in the models with a random intercept. The normality and homogeneity of variance was graphically checked. All data was analysed using R (R Core Team, 2018).
2.6 Mathematical model equations
Sediment deposition on the salt marsh was modelled with a simple zero-dimensional mass-balance model (French and Spencer, 1993; Allen, 2000b; Temmerman et al., 2003; Marijnissen et al., 2020). The rate of change of sediment deposition is modelled by the settling of the suspended sediment in the water column above the marsh divided by the dry bulk density of the inorganic sediment to obtain sediment thickness:
Where Smin is the mineral sediment deposition height (m), ws is the settling velocity (m/s), C(t) is the depth-averaged suspended sediment concentration (kg/m3) and ρ is the dry bulk density (kg/m3). Organic deposition was omitted in this study because the Holwerd salt marsh is a minerogenic marsh.
At storm conditions the water level h(t) is set-up to a height at which the salt marsh at bed elevation z(t) is inundated with a water column h(t)-z(t). During the flood tide (when dh/dt > 0) suspended sediments are added to the water column above the marsh. Simultaneously the sediments settle towards the bed, lowering the sediment concentration. The rate of change in the suspended sediment concentration above the marsh at flood tide is modelled as the removal of sediment by vertical settling from the overlying water column and addition of sediment from the lateral influx of water with a suspended sediment concentration C(0). During the ebb tide (when dh/dt ≤ 0) the receding water is assumed to contain the instantaneous sediment concentration C(t). This leads to the following mass balance equations for flood and ebb tides:
When the salt marsh is not inundated an exponentially decreasing autocompaction is modelled. The starting value for the exponential decrease P(0) is the sediment thickness s (m) deposited in the previous year. Each time the salt marsh is flooded we reset to the starting value P(0) by applying a fast-approaching logistic function, safeguarding numerical stability of the model:
where P is the autocompaction height of the sediment (m), k is the autocompaction decay factor (s-1) and s (m) is the thickness of the sediment deposited in the previous year.
Finally, in our study we model an additional biocompaction induced by trampling, which is modelled as a linear compaction rate. The rate of change in marsh surface elevation z (in m relative to Dutch Ordnance Datum NAP) at a unit area is determined by the balance between deposition and compaction, and is written as:
where p is the biocompaction rate by trampling (m/s).
The model consists of the above set of ordinary differential equations that were solved in R with the package “deSolve” (Soetaert et al., 2010) at 10-minute time steps.
2.7 Mathematical model parameter values
Settling velocities of mud (particles< 63 µm) are dependent on salinity and sediment concentration (van Rijn et al., 2007). The settling velocity of suspended mud at Holwerd was assessed by van Rijn (2020). Suspended samples were taken by a sampler bottle in February and September 2019 and mainly consisted of fine silt of 30 to 40 µm. In February 2019 the median settling velocity was relatively low (0.1 mm/s) for low concentrations of about 0.2 kg/m3, increasing to 1 mm/s for concentrations of around 3 kg/m3 and to 2 mm/s for concentrations of around 9 kg/m3. In September 2019 the measured mud concentrations were significantly smaller (0.5 to 1 kg/m3 in the summer period) than in February (up to 8.9 kg/m3 in the winter period with more wave activity) and thus the median settling velocities were much lower in the range of 0.1 to 0.25 mm/s. In our model we applied suspended sediment concentrations of around 1 kg/m3 for which we applied a settling velocity of 0.5 mm/s. For the dry bulk density we applied the empirical relation for sand-mud mixtures in Wadden Sea sediments reported by (Flemming and Delafontaine, 2000). We assume settling of suspended muds only, so the deposited layer contains 100% mud content having a dry bulk density of 282 kg/m3, which agrees with measurements of the top layer in a nearby mainland salt marsh (Nolte et al., 2013b). The water level h(t) is a forcing function to the model. A time series for h(t) was obtained from the InterTides model (Rappoldt et al., 2020). Fine sediments on a salt marsh consolidate with time, which affects the deposit’s thickness. The compaction of soft muddy deposits can be described by the Gibson equation (Gibson et al., 1967), which is the state of the art for engineering applications (Zhou et al., 2016; Winterwerp et al., 2018). The compaction time is determined mainly by the diffusion term in the Gibson equation, for which a general solution shows that the compaction rate can be approximated by exponential decay. A simplified, semi-empirical model for autocompaction by Allen (2000a) also shows an exponentially decreasing thickness of the sediment layer, as does the Koppejan compression model (Koppejan, 1948). Empirical data on autocompaction of shallow silty salt marsh clay indeed showed that the bulk dry density in the top soil varied as a logarithmic function of depth below the surface (Bartholdy et al., 2010b). We model compaction of dewatered sediment with an exponential decay rate. Three model parameters were calibrated, i.e., the suspended sediment concentration influx C(0), the autocompaction decay factor k, and the biocompaction by trampling p, see result section 3.3.
2.8 Modelling long-term marsh elevation changes until 2100
To model the long-term change in marsh surface elevation, the time evolution in water level of an individual flood event as well as the probability of occurrence of flood events needs to be modelled for the years 2008 – 2100. A standardised time evolution of the water height for a flood event was designed based on the tool “Waterstandsverloop”, which is used to assess the safety standards of Dutch flood defences (Botterhuis et al., 2017) and derived from location Holwerd 900240. The time evolution of a storm surge at this location can be modelled as a trapezoidal shape (Chbab, 2015). The rising and falling of the surge level has a total duration of 45 hours. In the two-hour interval around the top, the water level rises for one hour and drops for one hour with 0.1 m. This results in a top shape with a slightly steeper slope for lower surge heights and a milder slope for higher surge heights. Based on an analysis of measured water levels during storm surges a phase lag of 5.5 hours between the occurrence of the storm surge maximum and the astronomic tide maximum was found representative for storms along the Wadden Sea coast (Chbab, 2015). The trapezium-shape flood event was added with a phase lag of 5.5 hours to a standard tidal signal with amplitude 1 m and equilibrium 0 m +NAP. A water level evolution for a single flood event has a total duration of four tidal periods.
The probability of occurrence of flood events was derived from water level data. A twenty-year time series for water level at 10-minute intervals for the period 01-01-2001 to 31-12-2020 was obtained for the Holwerd salt marsh from the InterTides model (Rappoldt et al., 2020). The time series were divided into winter water levels (1 October to 1 April) and summer water levels (1 April to 1 October) to distinguish between winter flood frequencies and summer flood frequencies. Flood extremes above mean high tide (1.0 m +NAP) were obtained in R with the package “Tides” (Cox and Schepers, 2018). The probability for the recurrence times of flood events were fitted to various models for extreme distributions including the Gumbel distribution, generalised extreme value distribution, log Pearson type 3, lognormal, gamma, Weibull and generalised normal distribution. Model fitting was done in R using package “lmom” (Hosking, 2019). Best fits for the probability of winter flood events and summer flood events were found for a three-parameter lognormal distribution with parameters: location ζ (zeta), scale µ (mu), and shape σ (sigma) for values ζ_winter = 0.88221011, µ_winter = -0.9838063, σ_winter = 0.6228740 and ζ_summer = 0.9028377, µ_summer = -1.3670181, σ_summer = 0.5438813. For each model year 88 random samples were obtained from the summer distribution and 88 random samples from the winter distribution to generate flood heights. Each sample was applied into the standard trapezium-shaped flood event in a series of four tidal periods, totalling 704 tidal periods a year in 10-minute intervals. This was repeated 93 times for the years 2008 to 2100.
To predict the long-term consequences of saltmarsh trampling by cattle on the vertical elevation changes under sea level rise, time series for three scenarios for sea level rise until the year 2100 were added to the tidal signal. A scenario ‘low’ assumes a linear extrapolation of the current Dutch sea level rise of 2.4 mm/y, resulting in 25.2 cm rise in 2100, relative to the base year 1995. High-end projections for sea level rise that include rapid Antarctic ice sheet mass loss were specified for the Dutch coast by the Royal Dutch Meteorological Society based on Le Bars et al. (2017) and applied for the Netherlands’ Delta Commission (Haasnoot et al., 2018). In the scenario ‘high’ an accelerating sea level rise for RCP4.5 reaches a height of 108.1 cm in 2100, and in the scenario ‘extreme’ an accelerating rise for RCP8.5 reaches a height of 194.4 cm in 2100 relative to the base year 1995.
The Holwerd salt marshes are located at the mainland of the Netherlands close to the tidal divide to Ameland and is characterised by relatively high suspended matter concentrations (Colina Alonso et al., 2022). Other salt marshes, particularly those on the Wadden islands, have lower suspended matter concentrations (Sassi et al., 2015; Colina Alonso et al., 2022). Furthermore, human interventions may lead to a lowering of sediment concentrations and sediment import may become insufficient with accelerated sea level rise (Wang et al., 2015). To model the possible effects of lowered suspended sediment concentrations on the long-term vertical elevation change of grazed and non-grazed salt marshes three different boundary concentrations for suspended sediment were used. The base scenario applies the concentration derived from model calibration, whereas the ‘50%’ and ‘25%’ scenarios multiply this by 0.5 and 0.25 respectively.
Three SLR scenarios for three suspended sediment concentrations yield nine model runs for grazed and non-grazed plots. Each stochastic model run was repeated ten times to account for the probability of flood events. Model output consists of two surface heights, for the non-grazed and grazed plots (m +NAP), and the water height (m +NAP), for which the median as well the 10% and 90% percentiles were calculated. Inundation frequencies of the salt marsh (y-1) were derived for tidal and flood water heights exceeding the marsh surface elevation applying R with the package “Tides” (Cox and Schepers, 2018).
3 Results
3.1 Effects of livestock presence on marsh elevation changes
The elevation changes between August/September and March were predominantly positive, meaning that sedimentation dominated over compaction during the winter months (Figure 2). The surface elevation changes between March and August/September were predominantly negative, meaning that compaction dominated during the summer months. The marsh elevation change differed between years and livestock presence consistently increased the compaction rate during summer months (Figure 2). The first two years after introduction of livestock the impact was highest, increasing the compaction rates with approximately 167% (Figure 2). After two years the difference in autocompaction vs. biocompaction stabilized at an additional contribution by trampling of approximately 67% (from 2.1 ± 0.1 mm/month to 3.5 ± 0.2 mm/month in non-grazed and grazed marsh respectively, Table 1). The year 2018 showed extreme high compaction rates for both grazed and non-grazed marsh, most likely due to the extreme dry weather conditions in summer.
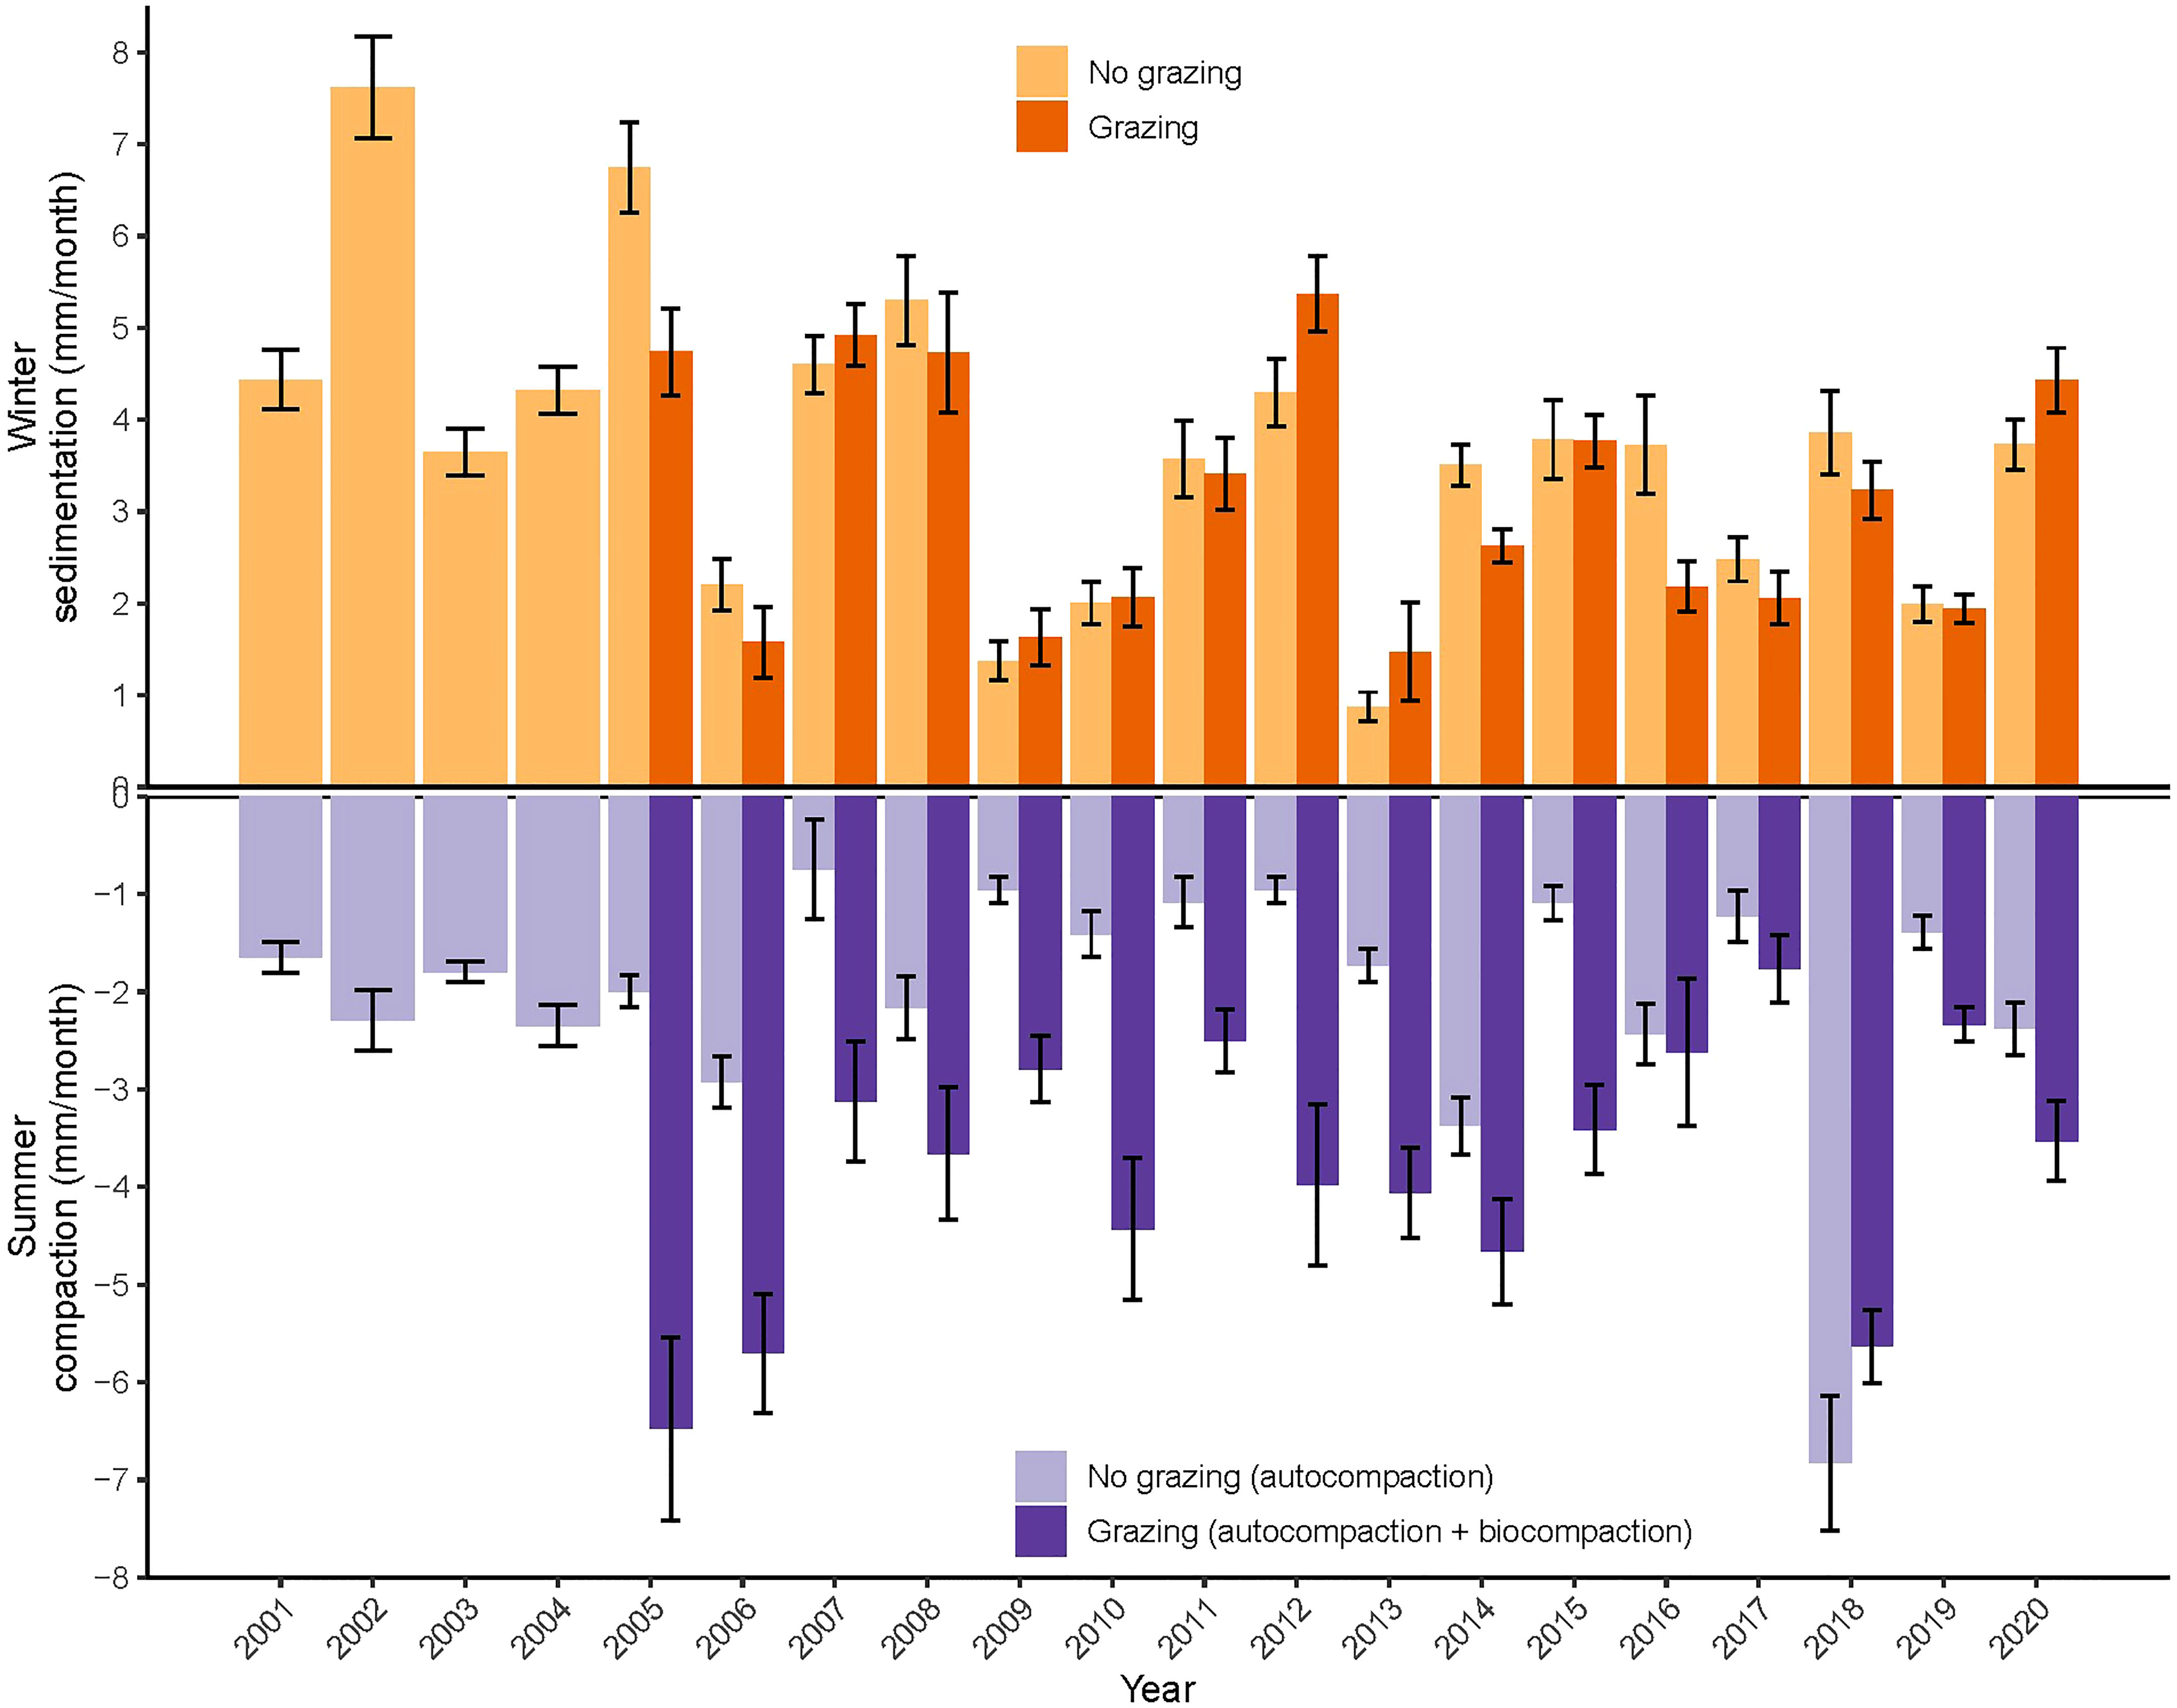
Figure 2 Marsh surface elevation changes in winter months (October to April) and summer months (April to October) from 2001 till 2020 shown for grazed and non-grazed marsh separately. Grazing by livestock was introduced in 2005 (18 plots) and 2007 (2 additional plots).
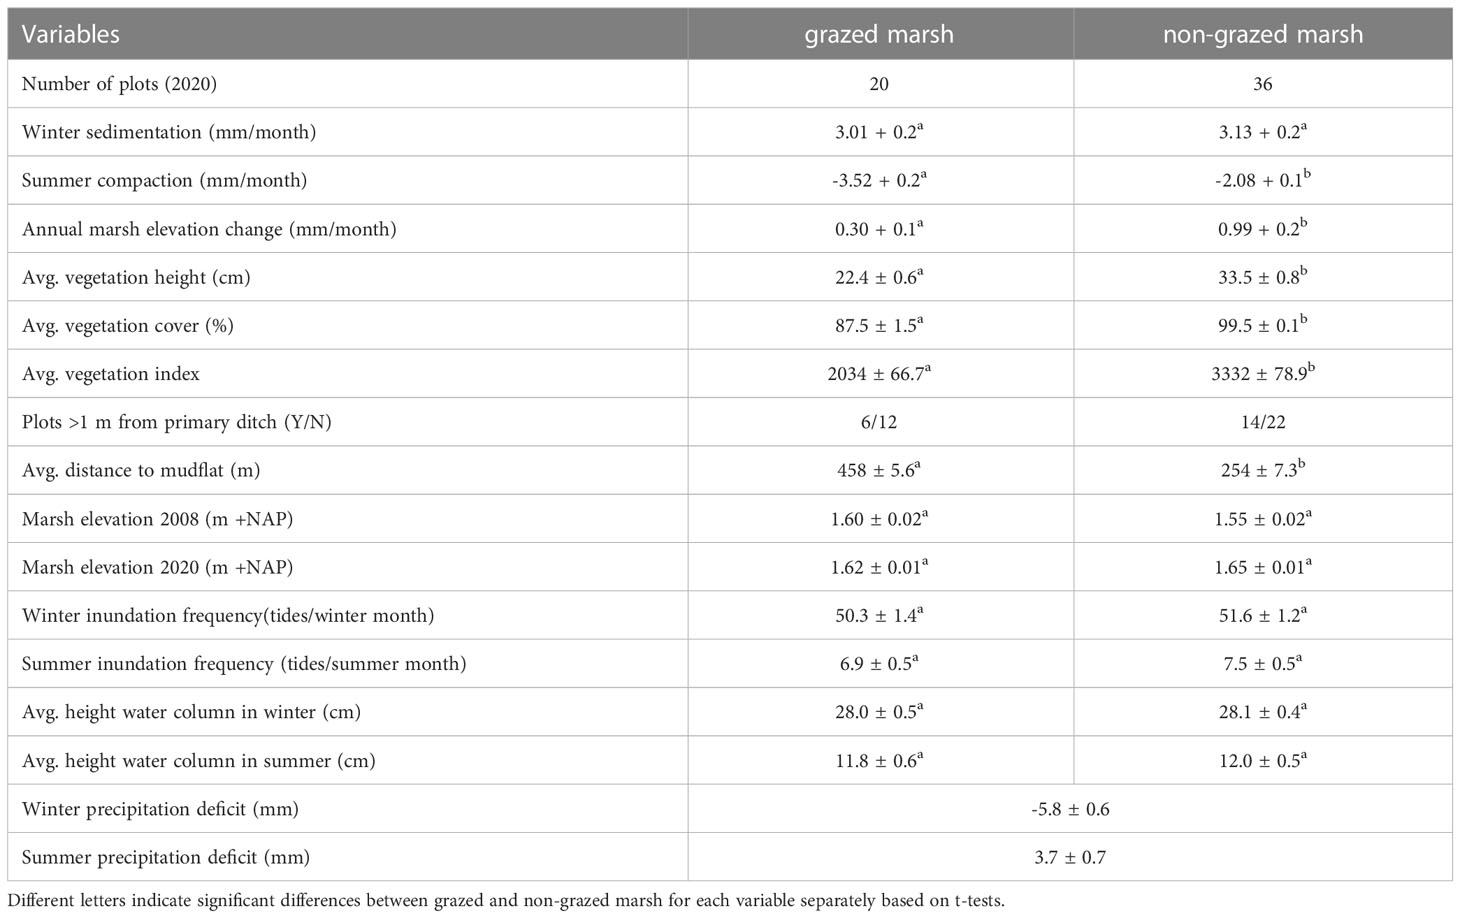
Table 1 Variables included in this study showing averages (± SE) for grazed and non-grazed marsh.
The winter surface elevation change was not significantly affected by livestock presence (Table 1). The summer surface elevation change was negative and compaction effects were significantly higher when cattle was present. On average, we found that trampling by livestock reduced rates of elevation change from 0.99 mm/month to 0.30 mm/month (Table 1). This translates to a reduced rate of annual elevation change of 8.3 mm/y, from 11.9 mm/y for non-grazed marshes to 3.6 mm/y for grazed marshes.
The grazed and non-grazed marsh differed significantly in vegetation characteristics. Average vegetation height, cover and index were all significantly higher in the non-grazed marsh (Table 1). Average marsh elevations in 2008 and 2020, inundation frequencies and average water column height did not differ significantly (Table 1). The distance to the mudflat was significantly higher in the grazed marsh. Inundations mostly occurred during winter, whereas the precipitation deficit was largest in summer.
3.2 Variables that explain elevation changes in grazed and non-grazed marsh
The three general additive mixed models (GAMM’s) explained between 49 and 53% of the variation found (Table 2). Rates in elevation change (mm/month) were significantly affected by grazing treatment, precipitation deficit, distance to the mudflat, inundation frequency and average height of the water column above the marsh platform during inundation (Table 2). In winter, when sedimentation rates dominate (Figure 2), inundation frequency and average water column height were significantly enhancing marsh growth (Table 2 and Figure 3). An increase in inundations resulted in an increasing marsh surface elevation change up to about 100 inundations after which the data scarcity results in a high model uncertainty (Figure 3). Furthermore, elevation changes were highest closest to the mudflat. Precipitation deficit had a small but positive effect in winter. Meanwhile, in summer, when compaction processes dominate, the compaction depended on the thickness of the new sediment layer deposited during the previous winter months and grazing (Figure 4). Distance to the mudflat also had a significant but small positive impact in summer (Table 2). Precipitation deficit resulted in more compaction once the deficit was more than 20 mm in the week prior to measurement (Figure 4). The vegetation index did not affect the marsh surface elevation change significantly.
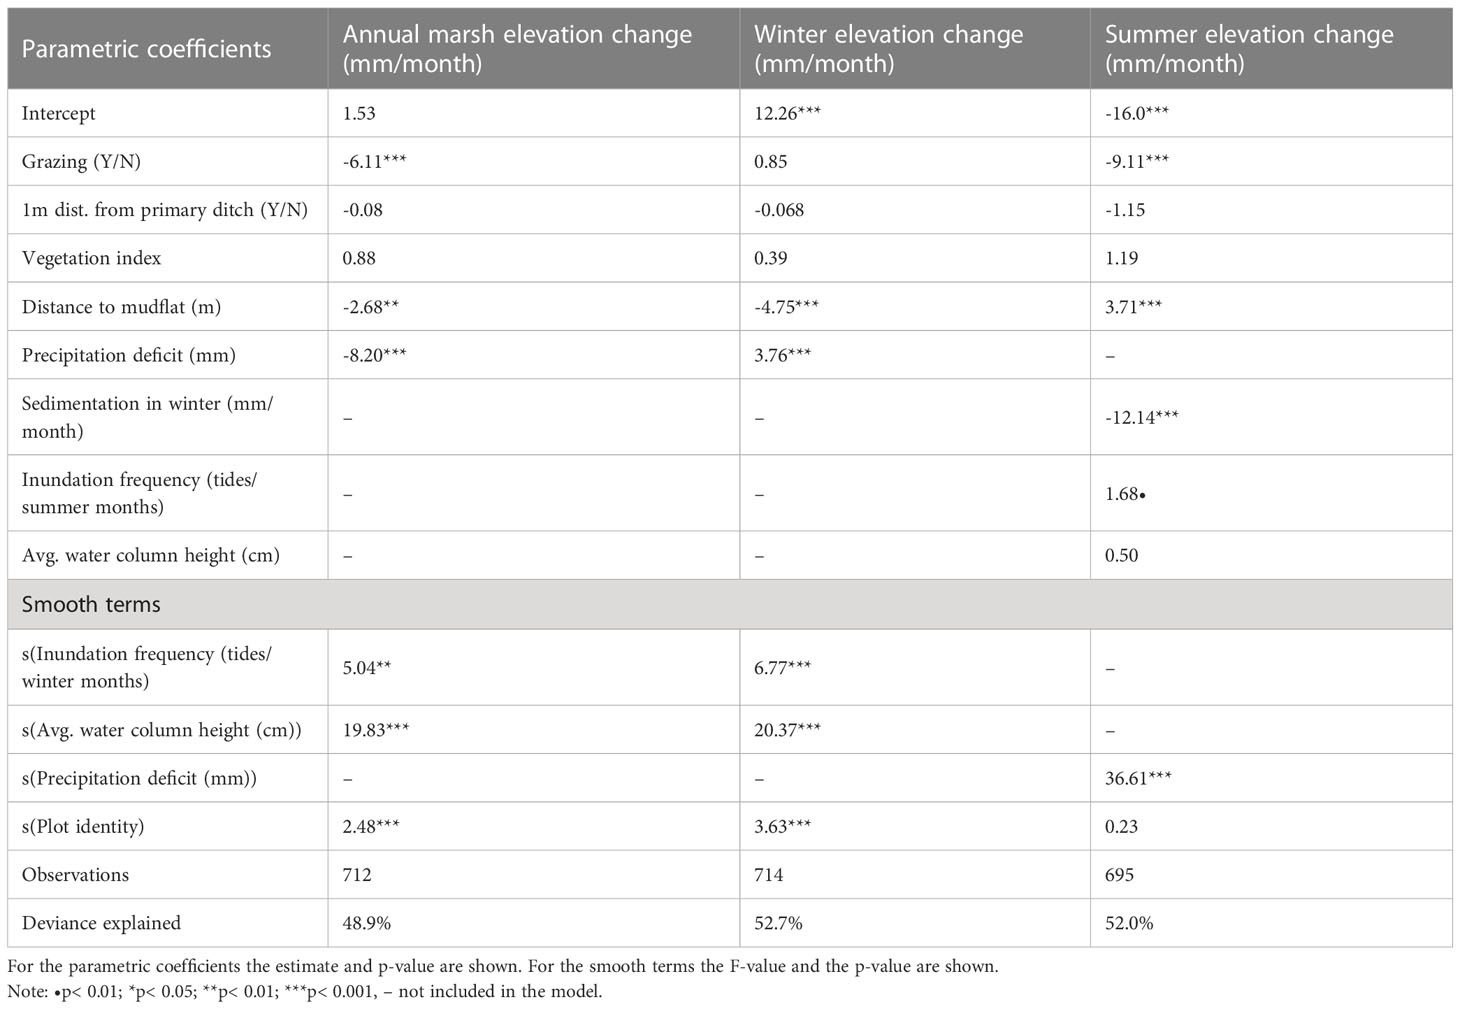
Table 2 General additive mixed model results for three datasets: The average annual marsh elevation change, elevation changes during winter months and during summer months for the period 2008 - 2020.
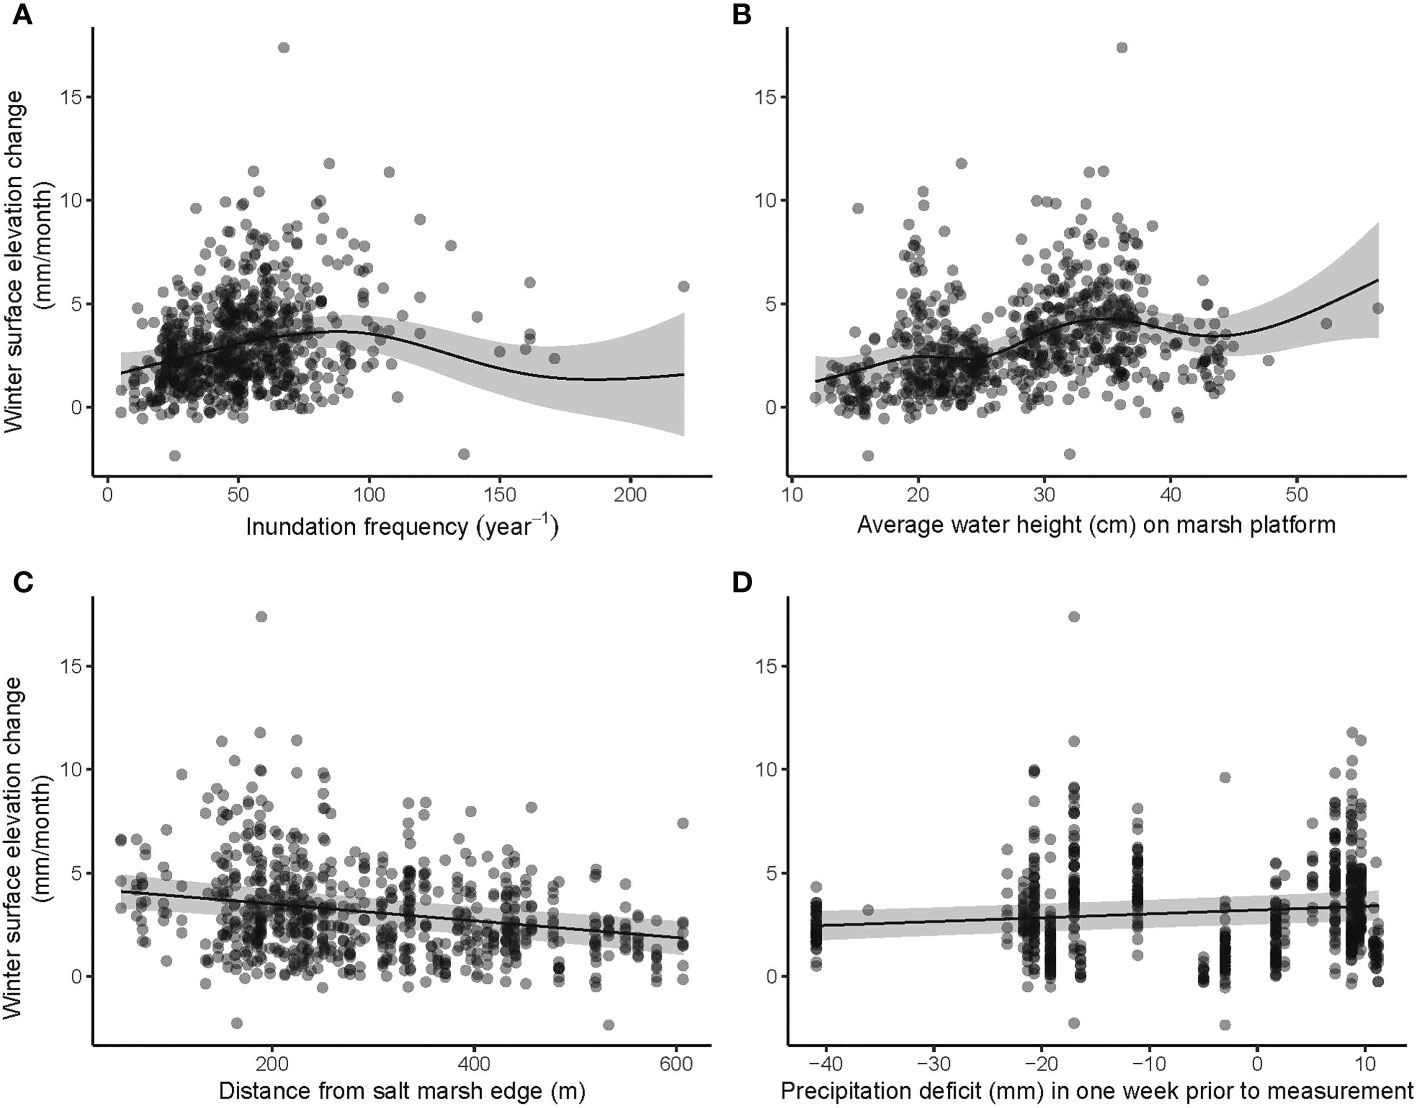
Figure 3 Most important variables explaining marsh surface elevation changes in winter: (A) Inundation frequency, (B) Average water height in the marsh platform, (C) Distance from the salt marsh edge and (D) precipitation deficit. All measurements are shown with bullets and a prediction is plotted with confidence interval (95%) based on the GAMM (Table 2).
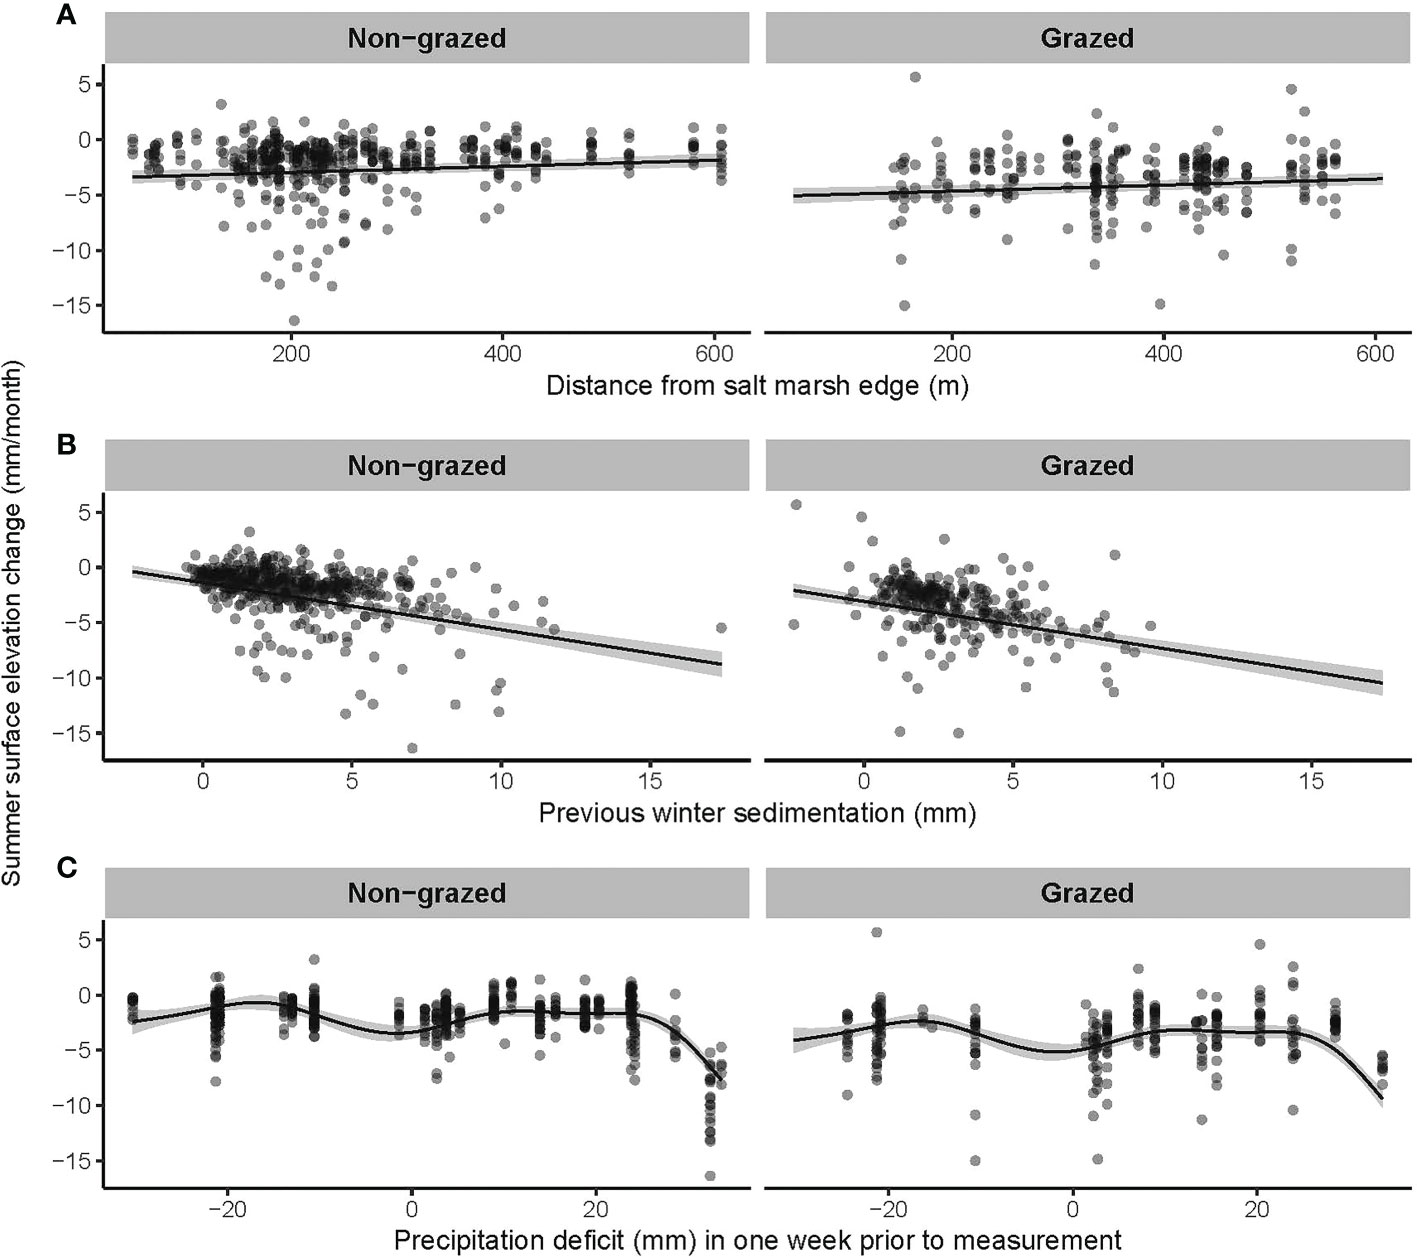
Figure 4 Most important variables explaining marsh surface elevation changes in summer: (A) distance from marsh edge, (B) previous winter sedimentation and (C) precipitation deficit, shown for non-grazed (left) and grazed marsh (right). All measurements are shown with bullets and a prediction is plotted with confidence interval (95%) based on the GAMM (Table 2).
3.3 Future salt marsh elevation change – Model calibration
Before predicting future marsh elevation change first model calibrations were performed on two time series of averaged bed elevations, one for plots that were grazed and one for plots that were non-grazed. Three model parameters were changed in model calibration, i.e., the suspended sediment concentration influx C(0), the autocompaction decay factor k, and the biocompaction by trampling p. We started model calibration on the sedimentation rates without compaction by calibrating the sediment concentration influx. We subsequently calibrated the autocompaction rate using the non-grazed plots and lastly, we calibrated the biocompaction by trampling using the grazed plots. Calibrating the model on the measured time series for sedimentation rates obtained a C(0) of 0.9 kg/m3. van Rijn (2020) measured a suspended sediment concentration at the water surface in the flood current at Holwerd in February 2019 of 0.8 kg/m3, which is representative for flooding of the salt marsh. Sediment concentrations generally build-up during a storm and tend to lag behind after the storm has faded (Temmerman et al., 2003), as shown by a suspended sediment concentration at the surface in the ebb current of 0.19 kg/m3 (van Rijn, 2020). Our model captures these dynamics above the salt marsh, having modelled suspended sediment concentrations between 0.1 and 0.3 kg/m3 in retreating flows.
A second calibration factor is the autocompaction decay factor k (s-1). Following winter flood events with sedimentation of mineral sediments, prolonged summer autocompaction leads to lowering of the bed level. Model calibration on the non-grazed time series resulted in an exponential autocompaction decay factor of 2.1x10⁻⁸ s-1 matching the slopes of the declining bed level in the data (Figure 5). This rate corresponds to a half-life of 382 days.
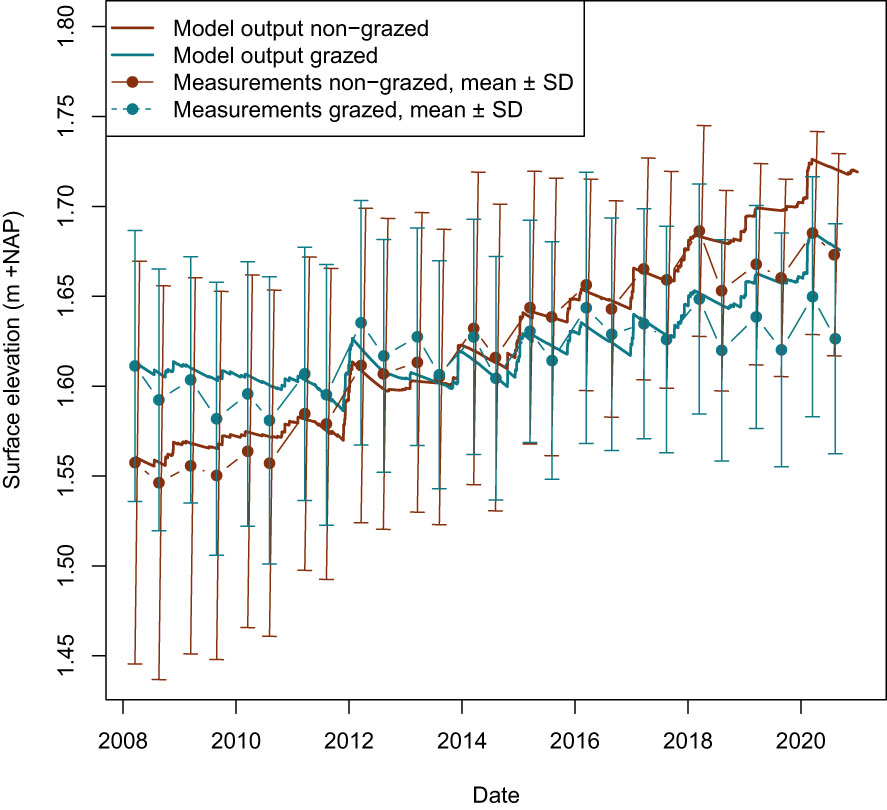
Figure 5 Model outputs and measurements for surface elevation in non-grazed plots and grazed plots. The average bed elevation of the non-grazed plots at the beginning of the measurement interval was 1.56 m +NAP, whereas the grazed plots started at 1.61 m +NAP.
Without compaction, the modelled sedimentation rate on the non-grazed salt marsh over the 12.5-year measurement period is 26.0 mm/y. Under the assumption that sedimentation occurs in autumn and winter, this equals to 4.3 mm/winter month between October and April. This is about 1.2 mm higher than the field measurements show (Table 1), but the field measurements do not include the compaction that also takes place during inundation-free periods in winter. The modelled net elevation change over the measurement period is 12.9 mm/y. The contribution of compaction equals to 13.0 mm/y and autocompaction halved the gross sedimentation on the salt marsh. Under the assumption that autocompaction occurs in spring and summer, this equals to 2.2 mm/summer month between April and October This compares well with the field measurements that showed an autocompaction of 2.1 mm/summer month (Table 1). The high compaction that occurred in the extremely dry summer of 2018 was not captured in this generic model, which results in a measured net elevation change that is 4.6 cm lower than the modelled net elevation change in 2020 (Figure 5).
Finally, the linear biocompaction rate by trampling of cattle was calibrated on the data of the grazed plots applying the same autocompaction rate as for the non-grazed plots. The additional biocompaction by grazers yielded a value of 3.0x10⁻¹⁰ m/s, equalling 9.5 mm/y. This compares well with the 8.3 mm/y for biocompaction derived from the measurements (Table 1).
3.4 Long-term vertical marsh growth until 2100
We modelled the surface elevation and the inundation frequency of the grazed and non-grazed plots for three scenarios of sea level rise and three suspended particulate matter (SPM) concentrations until the year 2100 (Figures 6, 7).
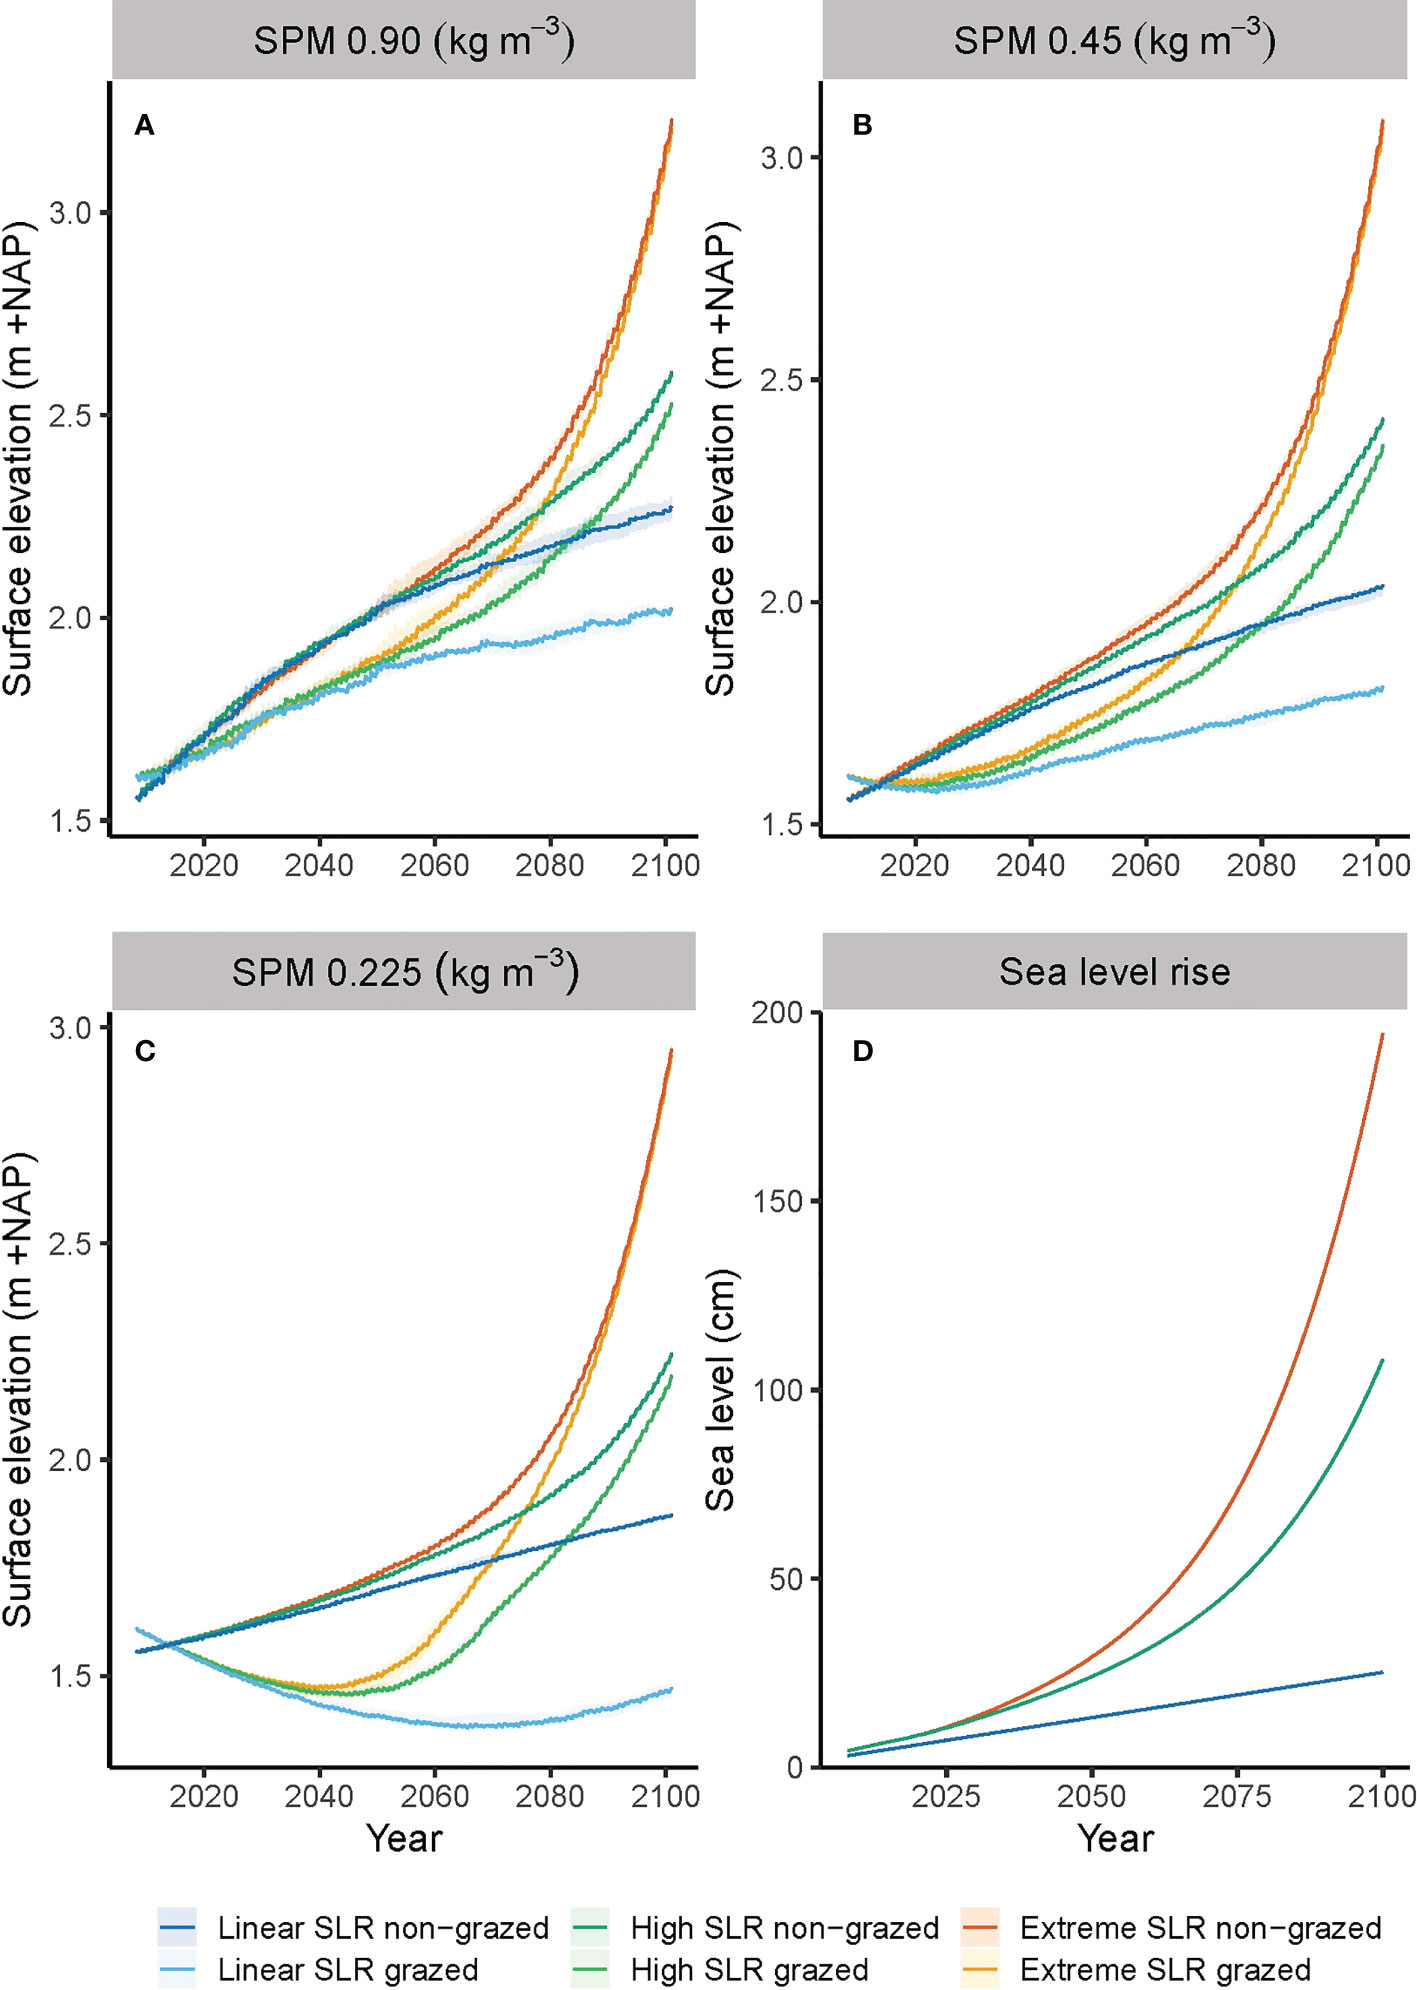
Figure 6 (A–C) Development of grazed and non-grazed salt marsh surface elevation for three scenarios of sea level rise combined with three suspended particulate matter (SPM) scenarios. Presented are the median values and 10% and 90% percentile intervals of ten stochastic model runs. (D) shows three scenarios for sea level rise until the year 2100 used to predict the long-term consequences of management by grazing on the future vulnerability of salt marshes.
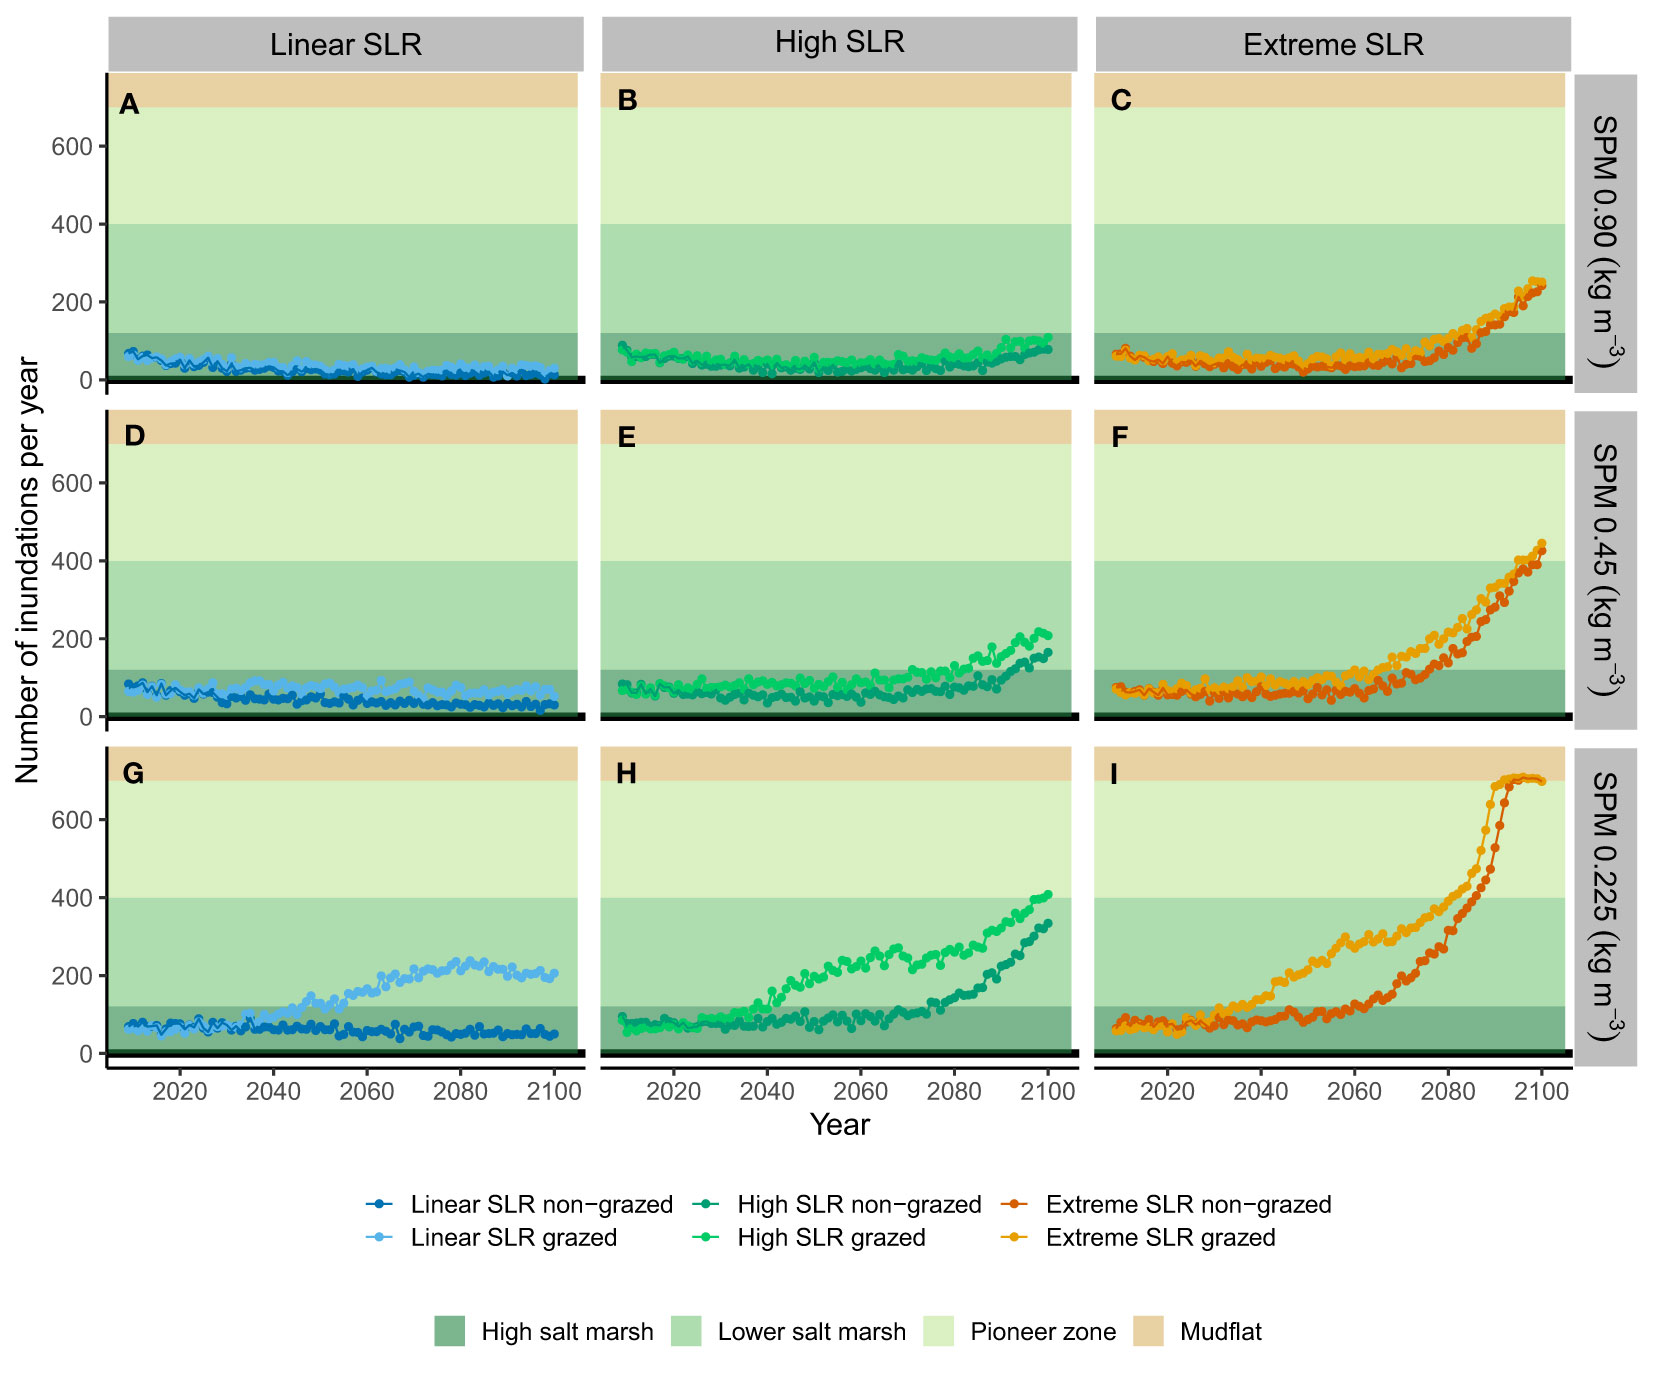
Figure 7 Development of the number of yearly inundations for grazed and non-grazed salt marsh for in total nine scenarios (A–I) combining three scenarios of sea level rise (left to right) and three scenarios of suspended particulate matter (SPM, top to bottom). Presented are the median values of ten stochastic model runs. The shaded areas indicate the inundation frequencies in which the different salt marsh zones occur.
3.5 The effect of livestock presence on changes in salt marsh elevation for three sea level rise scenarios
The Holwerd salt marshes are characterized by a suspended sediments concentration during storm events of 0.90 kg m-3. At this concentration and for the scenario of a linearly increasing sea level of 2.4 mm y-1, the surface elevation of the salt marsh over time follows a concave down increasing curve (Figure 6A). The shape is explained by frequent flooding and subsequent sedimentation of mud, making the rates of marsh elevation change faster than the sea level rise, which is counterbalanced by a decreasing inundation frequency and, therefore, decreasing rate in elevation change over time (Figures 6A, 7A). The height of the non-grazed plots reached 2.27 m +NAP (median value of ten repetitive model runs) and the inundation frequency levelled out to 13 y-1, whereas the grazed plots reached a height of 2.02 m and an inundation frequency of 30 y-1 (Figure 7A and Table 3). The total sea level rise between 2008 and 2100 was 0.22 m, while the total vertical elevation change of the non-grazed plots was 0.71 m. The grazed plots showed a smaller vertical elevation change of 0.41 m due to the additional biocompaction by trampling of cattle. For the linear sea level rise scenario, in combination with the current high sediment load, the ability of the marsh to grow with sea level rise until 2100 is reduced by grazing cattle with 42% (Table 3), but the marsh elevation change still outcompetes the rise in sea level.
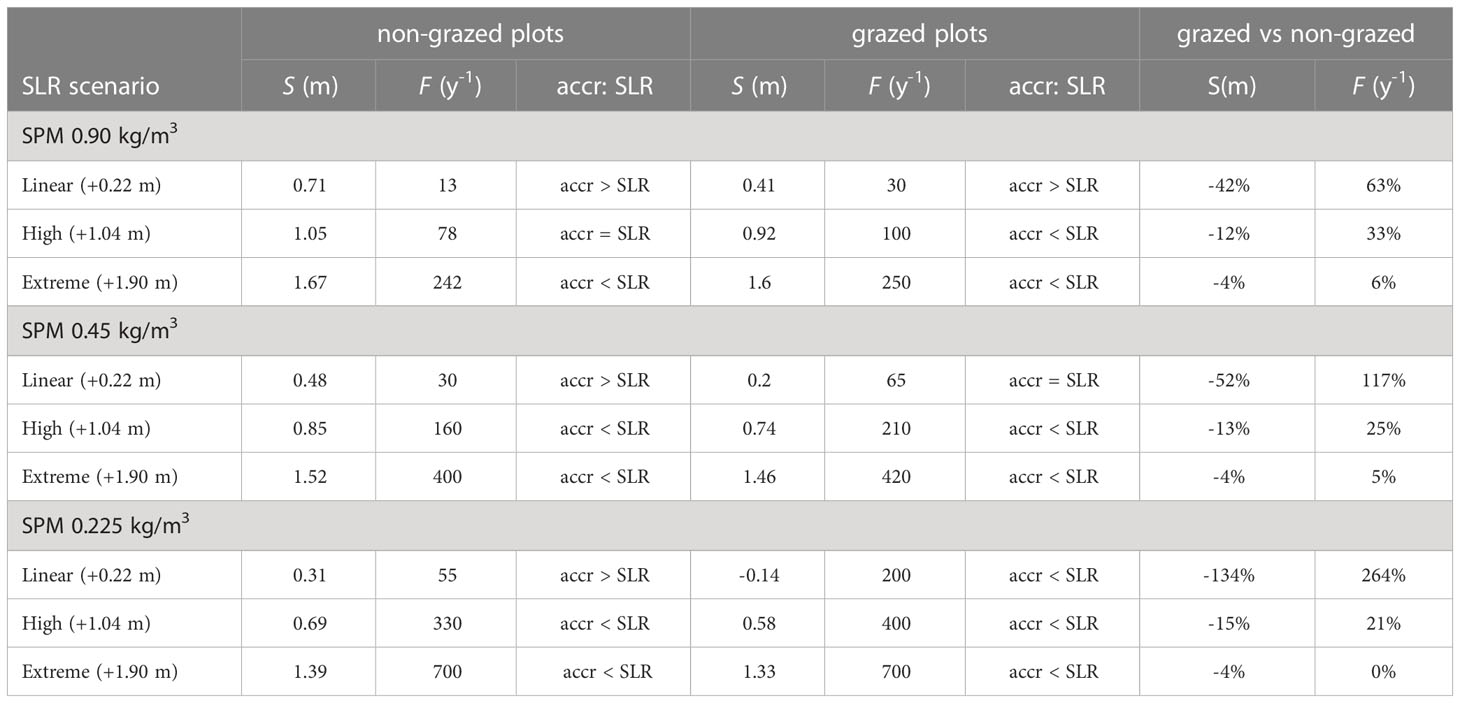
Table 3 Total elevation change S (m), inundation frequency F (y-1), rate in elevation change vs. SLR in 2100 distinguished between non-grazed plots and grazed plots and percent change for grazed compared to non-grazed plots for nine model scenarios.
In the scenario for High SLR the curve for the surface elevation over time is a concave down increasing curve until around 2050, and then changes to a concave up increasing curve (Figure 6A). The shape is explained by the curve for sea level rise, which is almost linear and relatively mild with 0.20 m rise until 2050, after which the acceleration kicks in and a total rise of 1.04 m is reached in 2100 (Figure 6D). In 2050 the vertical elevation change of the marsh is still larger than the sea level rise of 0.20 m, i.e., 0.47 m for non-grazed plots and 0.28 m for grazed plots. However, in 2100 the vertical elevation change of grazed plots could not keep up with the rise in sea level, so the marsh was slowly drowning (Figure 7B). The inundation frequency of grazed plots was around 100 y-1 compared to 78 y-1 for non-grazed plots (Table 3). More frequent flooding and higher water depths resulted in an increasing sedimentation rate of mud and a concave up increasing surface height of the marsh. The total elevation change of non-grazed plots equalled SLR with 1.05 m, while grazed plots lagged behind with 0.92 m. For the high SLR scenario, in combination with the current high sediment load, the ability of the marsh to grow with sea level rise until 2100 is reduced by grazing cattle with 12% (Table 3), and the marsh elevation change in grazed plots cannot outcompete the rise in sea level from around 2050 onwards (Figure 7B).
In the scenario for extreme SLR, the curve for the surface elevation over time is like that for high sea level rise until 2050 (Figures 6A, D). In 2050 the vertical elevation change of the marsh is larger than the sea level rise of 0.25 cm, i.e., 0.46 m for non-grazed plots and 0.29 m for grazed plots, and the inundation frequency decreased. From 2050 onwards the sea level rise accelerated strongly, and the vertical elevation change could not keep up with the rise in sea level. As a result, the flooding frequencies increased to 242 y-1 for non-grazed plots and around 250 y-1 for grazed plots (Figure 7 and Table 3). This implies that the salt marsh vegetation composition will show regression from plant species typical for high marshes to plant species typical for low marshes. The total elevation change reached 1.67 m for non-grazed plots and 1.60 m for grazed plots (Table 3). For the extreme SLR scenario, in combination with the current high sediment load, the ability of the marsh to grow with sea level rise until 2100 is reduced by grazing cattle with 4% (Table 3), and the marsh surface elevation change cannot outcompete the rise in sea level from around 2050 onwards (Figure 7C).
3.6 The effect of livestock presence in combination with a reduction in SPM concentration
In the scenario for a linearly increasing sea level of 2.4 mm/y in combination with a 50% reduction in suspended particulate matter (SPM) concentration during flooding, the curve for surface elevation over time of non-grazed plots is a concave down increasing curve (Figure 6B). Due to the lower sediment load the total elevation change in 2100 reduced by 33% to 0.48 m compared to the case with 100% SPM concentration (Table 3). This is enough to outcompete the total sea level rise of 0.22 m, which is also shown by the steadily decreasing inundation frequency to a dynamic equilibrium of about 30 y1. In combination with a 75% reduction of the base SPM concentration (Figure 6C) the curve for the surface height over time is approaching linearity. Due to the 75% reduced sediment load the total elevation change in 2100 reduced by 56% to 0.31 m (Table 3). This is slightly more than the sea level rise, which is reflected by a small decrease in inundation frequency to 55 y-1 (Figure 7 and Table 3). The effect of grazers on marsh elevation at 50% sediment reduction is shown by an initial lowering of about 0.035 m until 2025 after which the marsh started to accrete more or less linearly. The trampling resulted in a lowering of the salt marsh, which was then counterbalanced by an increasing inundation frequency and subsequent mud sedimentation, following into a steadily increasing marsh height and about 65 inundations per year. The total elevation changes for grazed plots in 2100 reduced by 52% to 0.20 m, which is slightly lower than the sea level rise. For a linearly increasing sea level of 2.4 mm/y in combination with a 50% reduction in SPM, the ability of the marsh to grow with sea level rise until 2100 is reduced by grazing cattle with 52%, making the annual rate of elevation gain lower than the rise in sea level compared to a non-grazed marsh. In case of a 75% reduction in suspended sediments the effects of grazers are severe at this scenario for sea level rise. The surface height showed a lowering of 0.23 m until 2070 and a steadily increasing inundation frequency to over 200 y-1 until a new dynamic equilibrium was reached in which the marsh could accrete. The total elevation change is reduced by 134% to -0.14 m, which is clearly not compensating sea level rise. For a linearly increasing sea level of 2.4 mm/y in combination with a 75% reduction in SPM, the ability of the marsh to grow with sea level rise until 2100 is reduced by grazing cattle with 134%, leading to a decreased marsh height, drowning of the marsh and regression to a low marsh vegetation (Figure 7G).
In the scenario for a high sea level rise in combination with a 50% reduction in SPM during flooding, the curve for surface elevation over time of non-grazed plots is a concave down increasing curve until around 2050, implying that the marsh elevation change exceeds SLR, but then changes to a concave up increasing curve implying drowning. Due to the 50% lower sediment load the total elevation change in 2100 is reduced by 19% to 0.85 m. The inundation frequency initially lowered, but eventually increased to around 160 y-1 in 2100. In combination with a 75% reduction in SPM the total elevation change in 2100 is reduced by 34% to 0.69 m. The inundation frequency increased to around 330 y-1 in 2100. The effect of grazers on marsh elevation at 50% sediment reduction is shown by an initial lowering of about 0.025 m until 2020 after which the marsh started to accrete concave up to a total elevation change of 0.74 m and an inundation frequency of 210 y-1. For the high sea level rise scenario in combination with a 50% reduction in SPM, the ability of the marsh to grow with sea level rise until 2100 is reduced by grazing cattle with 13%. In case of a 75% reduction in suspended sediments the surface height showed an initial lowering of 0.15 m until 2045, followed by an increase in surface elevation to a total of 0.58 m, and a steadily increasing inundation frequency to 400 y-1 in 2100. This inundation frequency implies that the vegetation composition has to change to a pioneer vegetation. For the high sea level rise scenario in combination with a 75% reduction in SPM, the ability of the marsh to grow with sea level rise until 2100 is reduced by grazing cattle with 15%, leading to drowning of the marsh and regression to a pioneer vegetation.
In the scenario for an extreme sea level rise in combination with a 50% reduction in SPM during flooding, the curve for surface elevation over time of non-grazed plots is almost linear until around 2060, implying that the annual rate in elevation change is in pace with SLR. This is also reflected in a dynamic equilibrium for the inundation frequency of around 50 y-1. From 2060 onwards the curve is concave up increasing, implying drowning of the marsh. The flooding increased to over 400 y-1. Due to the 50% lower sediment load the total elevation change in 2100 is reduced by 9% to 1.52 m. In combination with a 75% reduction the total elevation change in 2100 is reduced by 17% to 1.39 m. However, the inundation frequency increased to 700 y-1 in 2100. This means that the salt marsh is no longer vegetated but has drowned completely and turned into a mudflat. The effect of livestock on marsh elevation at 50% sediment reduction is shown by an initial lowering of about 0.015 m until 2020 after which the marsh started to accrete concave up to a total elevation change of 1.46 m and a inundation frequency of 420 y-1. For the extreme sea level rise scenario in combination with a 50% reduction in SPM, the ability of the marsh to grow with sea level rise until 2100 is reduced by trampling livestock with 4%. In case of a 75% reduction in suspended sediments the surface height of grazed plots showed an initial lowering of 0.13 m until 2045, followed by an increase in surface elevation to a total of 1.33 m, and a steadily increasing inundation frequency to 700 y-1 in 2100, drowning the salt marsh completely into a mudflat. For the extreme sea level rise scenario in combination with a 75% reduction in SPM, the ability of the marsh to grow with sea level rise until 2100 is reduced by trampling livestock with 4% (Table 3).
4 Discussion
4.1 Effects of livestock on marsh elevation change
The first aim of this paper was to determine the impact of livestock presence on current rates of vertical elevation change.
Field measurements showed that the rates of surface elevation change in the winter months were not significantly different in the grazed versus the non-grazed salt marsh. In summer the elevation changes were negative, and the compaction rate was significantly higher when livestock was present. Cattle most importantly affected the rate of soil compaction in summer, reducing the annual rates of surface elevation change significantly from 11.9 mm yr-1 in the non-grazed marsh to 3.6 mm yr-1 in the grazed marsh. Other studies show similar results with higher compaction rates and bulk densities in grazed marshes (Elschot et al., 2013; Koppenaal et al., 2022). Koppenaal et al. (2022) did find a small but significantly higher elevation change in winter in non-grazed marsh, although it was of a similar magnitude as the grazed marsh. Belowground effects of cattle have been neglected for a long time, although it has received a bit more attention in the last decade. Generally, a higher soil compaction is found in grazed marsh than non-grazed marsh (Davidson et al., 2017), which is in line with results found in this study.
Cover and height of the vegetation were significantly reduced in the grazed marsh in this study, but this had no significant effect on the winter elevation change and will be discussed in detail in the next section. The grazed and non-grazed marshes were similar in geomorphology, except that the distance to the mudflat was significantly higher in the grazed marsh. This did not have a large impact on the results or conclusions drawn in this study, as the winter elevation changes between both sites were not significantly different.
4.2 Variables explaining marsh elevation change
The second aim of this study was to identify the most important variables explaining the marsh surface elevation changes during winter and summer.
In winter, when sedimentation rates dominate, distance to mudflat, inundation frequency and average water column height were significantly enhancing the rates of marsh elevation change. The elevation gain slowly increased with inundation frequency up to about 100 inundations per year, which is in line with results found in previous studies (e.g. Koppenaal et al., 2022). It reduced again above 100 inundations per year although this trend became unclear due to scarcity of data. Vertical marsh growth generally reduces with increasing distance to the mudflat and where inundation frequencies are lower (e.g. van Dobben et al., 2022). Highest inundation frequencies occur low in the tidal frame at low marshes and pioneer zones, where higher erosion rates can be expected due to lower root biomass reducing the annual elevation change (Ford et al., 2016; Bass et al., 2022; Marin-Diaz et al., 2022).
In summer compaction processes dominated. Next to biocompaction by heavy grazers, precipitation deficit resulted in more compaction once the deficit was over 20 mm week-1 prior to measurement. Field measurements showed an extreme compaction in both grazed and non-grazed marshes in 2018 most likely due to an extreme drought event (Cahoon et al., 1995). The precipitation deficit in 2018 between April and September was 309 mm, placing it in the top 3 years with highest deficit in the past 100 years (https://www.knmi.nl/klimaatdashboard). With global climate change extreme droughts should become more common (Attema et al., 2014), which implies that coastal marshes on a global scale could have a much harder time to keep up with increasing sea levels until compaction of the soil reached its maximum. Effects of extreme drought events is often not included in studies estimating the future survival of coastal habitats in a changing climate (e.g. Kirwan et al., 2016a), but may have a large impact on the adaptability of marshes to keep up with a rising sea level and should receive more attention.
The vegetation did not affect the change in marsh elevation significantly in this study, which is in line with the results found in some studies (e.g. Elschot et al., 2013; Reef et al., 2018), but in contrast with others that show a positive effect (e.g. Mudd et al., 2010; Bass et al., 2022). The effect by the vegetation on vertical marsh growth has shown to depend on plant species, root and leaf biomass, shoot stiffness, canopy height and is density dependent (Peralta et al., 2008; Bass et al., 2022). This study is based on a long-term monitoring dataset and specific plant traits were not included, but they may explain part of the unexplained variance present in the statistical models. The Holwerd salt marsh does not have a high stocking density, therefore differences in vegetation cover and height between the plots may not be large enough to significantly affect vertical marsh growth.
4.3 Future adaptability of salt marshes for three sea-level rise and three suspended sediment concentration scenarios
The third aim of this study was to predict future elevation change under grazed and non-grazed management regimes, for three sea-level scenarios combined with three suspended sediment concentration scenarios.
Sediment availability is a key factor controlling vertical marsh growth and ultimately marsh survival. Quantifying the sediment supply to marshes is one of the main challenges in salt marsh modelling (Fagherazzi et al., 2020). In calibrating our model, we reproduced measured sedimentation rates for an initial suspended sediment concentration in the flood water of 0.9 kg/m3. Temmerman et al. (2003) measured suspended sediment concentrations in a Western Scheldt salt marsh. They found a linearly increasing suspended sediment concentration as function of the inundation height with a value of 0.04 kg/m3 at a median inundation height of 0.30 m and up to a maximum of c. 0.2 kg/m3 at 1 m inundation height. Marijnissen et al. (2020) applied a constant value of 0.19 kg/m3 for a salt marsh in the Ems-Dollard estuary. Our calibrated concentration is relatively high but is supported by field measurements at Holwerd by van Rijn (2020). An explanation is that the Holwerd salt marsh lies in a region of the Wadden Sea that is sediment rich (Winterwerp et al., 2012; Colina Alonso et al., 2022).
The marsh platform is only inundated at storm conditions so a time-averaged concentration in the seawater in front of the marsh is not representative. Instead, the SPM concentration results from resuspension of bed sediment by wave action leading to enhanced concentrations at storms. This implies a relation between SPM concentration of the overlying water and the inundation frequency and/or inundation height (Temmerman et al., 2003). When modelling a drowning marsh, inundation of the lowered marsh platform becomes less dependent on extreme storms and more dependent on milder storms. The initial value for suspended sediment in the flood water then needs adjustment to lower values for increasing inundation frequencies. This might even lead to an optimum inundation frequency for which the sedimentation rate is maximum, but this should be further studied. Lacking field data for a range of (non-)storm conditions, we did not model this dynamic feedback. However, our model runs for 50% and 25% of current SPM concentrations show that lower concentrations lead to a positive feedback loop of lower sedimentation rates, leading to acceleration of salt marsh drowning.
Our model results further show that for non-grazed marshes under current conditions for suspended sediments the surface elevation of the salt marsh over time follows a concave down increasing curve for the linear SLR scenario. This means that the rate of elevation gain is slowing down, and the inundation frequency of the marsh is decreasing. For the scenarios with accelerating sea level rise the curve for surface elevation over time starts as a concave down increasing curve but shows an inflection point towards a concave up increasing curve around the year 2050. This means that once the inflection point is reached the rate of elevation change increases in response to the increasing sea level rise and the inundation frequency is increasing. This inflection point thus gives the critical SLR for the onset of drowning of the marsh. The critical rate for drowning is not the maximum rate in surface elevation gain the marsh can reach. For the high and extreme SLR scenarios the Holwerd marsh showed maximum rates of vertical elevation change of 22 mm yr-1 and 62 mm yr-1 respectively at the end of the century. However, the rate of change of SLR at the end of the century is 36 mm yr-1 and 73 mm yr-1 respectively. So, in response to an accelerating SLR the marsh elevation change accelerates as well, but it cannot keep pace and thus drowns gradually. At the Holwerd salt marsh the inflection point is reached in 2055 at a critical SLR of 8 mm yr-1 for the High SLR scenario at current levels of SPM. Applying a similar interpretation on the curves shown for the elevation change of a salt marsh at Ameland in van Dobben et al. (2022), we find a critical rate of 8 mm yr-1 for the lowest marsh platform at 70 cm +NAP, 2 mm yr-1 for the 100 cm +NAP platform and drowning of marsh platforms higher than 120 cm +NAP. In comparing the Ameland marsh with the Holwerd marsh that lies at 170 cm +NAP we thus find that the Holwerd marsh can withstand higher rates of SLR. The Ameland marsh lies opposite of the Holwerd marsh in the Wadden Sea but is an island marsh with lower SPM concentrations than the mainland marsh at Holwerd, which can explain the difference.
It should be understood that effects of an accelerating SLR on the vegetation composition lag tens of years for a drowning marsh. This implies that the definition of drowning can be seen differently (also see van Dobben et al., 2022) if drowning means the disappearance of all marsh vegetation. Additionally, marshes can change in different ways when they cannot keep pace with sea level. For example the formation of ponds at the inner marsh (Mariotti, 2016; Schepers et al., 2020), changes in creek dimension (Deegan et al., 2012; Mariotti, 2020) and horizontal wind-induced erosion (Mariotti and Fagherazzi, 2010). Here, we simply state that when the inundation frequency increases the marsh cannot keep up with sea level rise and starts to drown. An increase in the number of inundations leads to a regression of the salt marsh vegetation to an earlier successional stage. A high marsh will change into a low marsh, then into a pioneer vegetation and lastly into a bare mudflat. Only in the latter case, is a salt marsh completely drowned and has disappeared. In evaluating the transitions to different vegetation zones we applied the salt marsh inundation zoning of Erchinger (1985). However, the class boundaries for inundation frequencies are based on research for the succession from mudflat to salt marsh (Beeftink, 1977; Erchinger, 1985; Dijkema, 1987). Because plants are most sensitive to environmental conditions during germination and seedling stage (Heerdt et al., 1996), established plants might be able to survive under much higher inundation frequencies, leading to a hysteresis loop. Preliminary results for the Ameland salt marsh vegetation development during soil subsidence point at this (Elschot et al., 2017) but still requires further study.
Our model results showed that for the high SLR scenario with a maximum rate of SLR of 36 mm yr-1 did the Holwerd site still remain a high marsh at the end of this century. When the SLR rate increases to over 50 mm yr-1 then the marsh will still exist, but vegetation shifts from high marsh into a low marsh vegetation. High values for the critical rate of SLR for drowning fall in the range of 10-50 mm yr-1 were also reported by Kirwan et al. (2016a). Only in combination with reduced SPM concentrations will the Holwerd marsh regress towards pioneer vegetation. In this case, vegetation cover and root biomass are reduced, and erosion is expected to occur (Bass et al., 2022), reducing the adaptability of marshes to SLR further. Only at an extreme SLR may the marsh vegetation disappear completely and turn into a bare mudflat. Using the definition for marsh drowning as the tipping point towards a bare mudflat, the Holwerd marsh shows to be very resistant to an accelerated sea level rise.
Grazing livestock on marshes trample the soil and induce additional (bio)compaction. Our measurements and models showed an additional compaction of 9 mm yr-1. This biocompaction inhibited a salt marsh in growing vertically and increased the number of yearly inundations. In case the present SLR continues linearly, the trampling even results in a lowering of the marsh elevation by 3.8 mm yr-1. Such compaction rates are not uncommon for silty marsh clay, as shown by an autocompaction of 7.8 mm yr-1 at Ameland (van Dobben et al., 2022), and 2 mm yr –1 for a 75-year-old Danish salt marsh (Bartholdy et al., 2010a).
For marshes to survive sea level rise, their horizontal migration rate is just as important. Marin-Diaz et al. (2021) showed that the erosion resistance of muddy marshes increased with the presence of large grazers that compacted the soil by trampling, so there is a trade-off. Our model results showed that for increasing rates of SLR the relative influence of biocompaction by cattle is decreasing, but only when there is sufficient suspended sediment, which corroborates the recommendation of Marin-Diaz et al. (2021) to avoid high intensity grazing in sediment-poor salt marshes.
Another factor that showed to be of importance for salt marsh compaction is extreme drought. An extremely high compaction was measured following the extremely dry summer of 2018. Although subsequent summers of 2019 and 2020 were also a lot drier than usual, the compaction was not as extreme. Once soil is compacted it cannot easily compact any further. Climate change leads to more frequent droughts so this adds to the effects of marsh drowning but it is unknown after how many years another extreme drought can result in another extreme compaction. Because the measured compaction resulted from an extreme event and future effects are not known, this was not included in our model and requires further study.
Our results further highlight the importance of implementing autocompaction when modelling changes in salt marsh elevation. For the Holwerd salt marshes, disregarding the autocompaction in the model while leaving all else unchanged leads to an elevation change of 25.5 cm compared to 16.2 cm including auto-compaction. Disregarding auto-compaction leads to a smaller accommodation space for sedimentation because of the faster increase in surface height that decreases the number of inundations. Studies on long-term elevation change in salt marshes or transitional polders in which compaction is not included, such as from (Gourgue et al., 2022; Weisscher et al., 2022) should be evaluated with care. And when marshes are grazed by heavy livestock, as are most European marshes, biocompaction becomes another key factor to consider.
Data availability statement
The original contributions presented in the study are publicly available. This data can be found here: https://doi.org/10.4121/22128674.v1.
Author contributions
KE and MvP contributed to the field measurements and data analyses, KE and MB conceived of the idea, MvP developed the statistical model and the graphical designs, MB developed the mathematical model. All authors contributed to the article and approved the submitted version.
Funding
This study was funded by the Dutch Ministry of Agriculture, Nature and Food Quality (LNV) as part of the Nature & Environment program WOT Natuur & Milieu with project code WOT-04-009-035.02.
Acknowledgments
We would like to acknowledge Staatsbosbeheer for the opportunity to work in the salt marshes of Holwerd. We would like to acknowledge Kees Dijkema and Willem van Duin for setting up this monitoring network and collecting field data in the past, Piet-Wim van Leeuwen and Cor Sonneveld for help during fieldwork, and Marin van Regteren and Georgette Lagendijk for help during data organisation and analysis. We thank Kees Rappoldt for providing water level time series for the Holwerd salt marshes. Tidal information and suspended sediment supply were provided by Rijkswaterstaat and data on precipitation deficit by KNMI.
Conflict of interest
The authors declare that the research was conducted in the absence of any commercial or financial relationships that could be construed as a potential conflict of interest.
Publisher’s note
All claims expressed in this article are solely those of the authors and do not necessarily represent those of their affiliated organizations, or those of the publisher, the editors and the reviewers. Any product that may be evaluated in this article, or claim that may be made by its manufacturer, is not guaranteed or endorsed by the publisher.
References
Allen J. R. L. (2000a). Holocene Coastal lowlands in NW Europe: Autocompaction and the uncertain ground. Geol. Soc London Spec. Publ. 175, 239–252. doi: 10.1144/GSL.SP.2000.175.01.18
Allen J. R. L. (2000b). Morphodynamics of Holocene salt marshes: A review sketch from the Atlantic and southern north Sea coasts of Europe. Quat. Sci. Rev. 19, 1155–1231. doi: 10.1016/S0277-3791(99)00034-7
Attema J., Bakker A., Beersma J., Bessembinder J., Boers R., Brandsma T., et al. (2014). KNMI’14: Climate change scenarios for the 21st century–a Netherlands perspective. Scientific Report WR2014-01, KNMI, De Bilt, The Netherlands. Available at: http://www.klimaatscenarios.nl/brochures/images/KNMI_WR_2014-01_version26May2014.pdf.
Bakker J. P., Esselink P., Dijkema K. S., van Duin W. E., De Jong D. J., Duin W. E., et al. (2002). Restoration of salt marshes in the Netherlands. Hydrobiologia 478, 29–51. doi: 10.1023/A:1021066311728
Bakker J. P., Esselink P., van der Wal R., Dijkema K. S. (1997). “Options for restoration and management of coastal salt marshes in Europe,” in Restoration ecology and sustainable development. Eds. Urbanska K. M., Webb N. R., Edwards P. J. (Cambridge: Cambridgre University Press), 286–322.
Bakker J. P., Olff H., Willems J. H., Zobel M. (1996). Why do we need permanent plots in the study of long-term vegetation Dynamics? J. Veg. Sci. 7, 147–155. doi: 10.2307/3236314
Baptist M. J., de Groot A. V., van Duin W. E. (2016). Contrasting biogeomorphic processes affecting salt-marsh development of the mokbaai, texel, the Netherlands. Earth Surf. Process. Landforms 41, 1241–1249. doi: 10.1002/esp.3949
Baptist M. J. M. J., van der Wal J. T., Folmer E. O. E. O., Gräwe U., Elschot K., Wal J. T., et al. (2019). An ecotope map of the trilateral wadden Sea. J. Sea Res. 152, 101761. doi: 10.1016/j.seares.2019.05.003
Barbier E. B., Hacker S. D., Kennedy C., Koch E. W., Stier A. C., Silliman B. R. (2011). The value of estuarine and coastal ecosystem services. Ecol. Monogr. 81, 169–193. doi: 10.1890/10-1510.1
Bartholdy A. T., Bartholdy J., Kroon A. (2010a). Salt marsh stability and patterns of sedimentation across a backbarrier platform. Mar. Geol. 278, 31–42. doi: 10.1016/j.margeo.2010.09.001
Bartholdy J., Pedersen J. B. T., Bartholdy A. T. (2010b). Autocompaction of shallow silty salt marsh clay. Sediment. Geol. 223, 310–319. doi: 10.1016/j.sedgeo.2009.11.016
Bass J., Granse D., Hache I., Jensen K., Karius V., Minden V., et al. (2022). Plant traits affect vertical accretion of salt marshes. Estuar. Coast. Shelf Sci. 276, 108010. doi: 10.1016/j.ecss.2022.108010
Beeftink W. G. (1977). The coastal salt marshes of Western and Northern Europe: an Ecological and phytosociological approach. Ecosyst. world 1, 109–155.
Best Ü.S.N., van der Wegen M., Dijkstra J., Willemsen P. W. J. M., Borsje B. W., Roelvink D. (2018). Do salt marshes survive sea level rise? Modelling wave action, morphodynamics and vegetation dynamics. Environ. Model. Software 109, 152–166. doi: 10.1016/j.envsoft.2018.08.004
Botterhuis T., Waterman R., Geerse C. (2017). Gebruikshandleiding waterstandsverloop versie 3.0.1. Rijkswaterstaat WVL, Lelystad. Available at: https://www.helpdeskwater.nl/publish/pages/132765/waterstandverloop_-_gebruikershandleiding_versie_3_0_1_definitief.pdf.
Bouma T. J., van Duren L. A., Temmerman S., Claverie T., Blanco-Garcia A., Ysebaert T., et al. (2007). Spatial flow and sedimentation patterns within patches of epibenthic structures: Combining field, flume and modelling experiments. Cont. Shelf Res. 27, 1020–1045. doi: 10.1016/j.csr.2005.12.019
Boumans R. M. J., Day J. W. (1993). High precision measurements of sediment elevation in shallow coastal areas using a sedimentation-erosion table. Estuaries 16, 375–380. doi: 10.2307/1352509
Cahoon D. R., Lynch J. C., Hensel P., Boumans R., Perez B. C., Segura B., et al. (2002). High-precision measurements of wetland sediment elevation: I. recent improvements to the sedimentation-erosion table. J. Sediment. Res. 72, 730–733. doi: 10.1306/020702720730
Cahoon D. R., Perez B. C., Segura B. D., Lynch J. C. (2011). Elevation trends and shrink-swell response of wetland soils to flooding and drying. Estuar. Coast. Shelf Sci. 91, 463–474. doi: 10.1016/j.ecss.2010.03.022
Cahoon D. R., Reed D. J., Day J. W. (1995). Estimating shallow subsidence in microtidal salt marshes of the southeastern united states: Kaye and barghoorn revisited. Mar. Geol. 128, 1–9. doi: 10.1016/0025-3227(95)00087-F
Chbab H. (2015). Waterstandsverlopen kust: Wettelijk toetsinstrumentarium WTI-2017 (Delft: Deltares). Available at: http://publications.deltares.nl/1220082_002d.pdf.
Chmura G. L., Anisfeld S. C., Cahoon D. R., Lynch J. C. (2003). Global carbon sequestration in tidal, saline wetland soils. Global Biogeochem. Cycles 17, n/a–n/a. doi: 10.1029/2002GB001917
Colina Alonso A., van Maren D. S., Herman P. M. J., van Weerdenburg R. J. A., Huismans Y., Holthuijsen S. J., et al. (2022). The existence and origin of multiple equilibria in sand-mud sediment beds. Geophys. Res. Lett. 49, e2022GL101141. doi: 10.1029/2022gl101141
Cox T., Schepers L. (2018) Tides: Quasi-periodic time series characteristics. r package version 2.1. Available at: https://cran.r-project.org/package=Tides.
Davidson K. E., Fowler M. S., Skov M. W., Doerr S. H., Beaumont N., Griffin J. N. (2017). Livestock grazing alters multiple ecosystem properties and services in salt marshes: a meta-analysis. J. Appl. Ecol. 54, 1395–1405. doi: 10.1111/1365-2664.12892
Davy A. J., Brown M. J. H., Mossman H. L., Grant A. (2011). Colonization of a newly developing salt marsh: Disentangling independent effects of elevation and redox potential on halophytes. J. Ecol. 99, 1350–1357. doi: 10.1111/j.1365-2745.2011.01870.x
Day J. W., Kemp G. P., Reed D. J., Cahoon D. R., Boumans R. M., Suhayda J. M., et al. (2011). Vegetation death and rapid loss of surface elevation in two contrasting Mississippi delta salt marshes: The role of sedimentation, autocompaction and sea-level rise. Ecol. Eng. 37, 229–240. doi: 10.1016/j.ecoleng.2010.11.021
Deegan L. A., Johnson D. S., Warren R. S., Peterson B. J., Fleeger J. W., Fagherazzi S., et al. (2012). Coastal eutrophication as a driver of salt marsh loss. Nature 490, 388–392. doi: 10.1038/nature11533
de Groot A. V., Veeneklaas R. M., Kuijper D. P. J., Bakker J. P. (2011). Spatial patterns in accretion on barrier-island salt marshes. Geomorphology 134, 280–296. doi: 10.1016/j.geomorph.2011.07.005
Dijkema K. S. (1987). Geography of salt marshes in Europe. Z. für Geomorphol. 31, 489–199. doi: 10.1127/zfg/31/1987/489
Doody J. P. (2008). Saltmarsh conservation, management and restoration (Dordrecht: Springer Netherlands). doi: 10.1007/978-1-4020-5748-9
Elschot K., Bakker J. P., Temmerman S., Van De Koppel J., Bouma T. J. (2015). Ecosystem engineering by large grazers enhances carbon stocks in a tidal salt marsh. Mar. Ecol. Prog. Ser. 537, 9–21. doi: 10.3354/meps11447
Elschot K., Bouma T. J., Temmerman S., Bakker J. P. (2013). Effects of long-term grazing on sediment deposition and salt-marsh accretion rates. Estuar. Coast. Shelf Sci. 133, 109–115. doi: 10.1016/j.ecss.2013.08.021
Elschot K., Duin W., Van De Groot A. V., Dijkema K. S., Sonneveld C., Van Der Wal J. T., et al. (2017). Chapter 4: Ontwikkeling kwelder ameland-oost; evaluatie bodemdalingsonderzoek 1986-2016 (Wageningen UR, Den Helder: Wageningen Marine Reseach). Available at: https://edepot.wur.nl/425069.
Elschot K., van Puijenbroek M. E. B., Lagendijk D. D. G., van der Wal J. T., Sonneveld C. (2020). Lange-Termijnontwikkeling van kwelders in de waddenze (1960-2018). Wettelijke Onderzoekstaken Natuur & Milieu, WOt-technical report 182, Wageningen Marine Research, Den Helder. doi: 10.18174/521727.
Erchinger H. F. (1985). Dünen, watt und salzwiesen (Hannover). Available at: http://www.norderney-chronik.de/download/diverses/ostfr-natur.pdf.
Esselink P., Bos D., Daniels P., van Duin W. E., Veeneklaas R. M. (2015). Van polder naar kwelder : tien jaar kwelderherstel noarderleech. PUCCIMAR rapport 06 Vol. 1901 (Vries: Altenburg & Wyminga). Available at: https://www.waddenzee.nl/fileadmin/content/Dossiers/Natuur_en_Landschap/pdf/10jr_Van_polder_naar_kwelder_eindrapport.pdf.
Esselink P., van Duin W. E., Bunje J., Cremer J., Folmer E. O., Frikke J., et al. (2017). “Salt marshes,” in Wadden Sea quality status report 2017. Eds. Kloepper S., Al E. (Wilhelmshaven, Germany: Common Wadden Sea Secretariat). Available at: http://cwss.www.de/TMAP/Qsr99/Qsr99.html.
Fagherazzi S., Mariotti G., Leonardi N., Canestrelli A., Nardin W., Kearney W. S. (2020). Salt marsh dynamics in a period of accelerated Sea level rise. J. Geophys. Res. Earth Surf. 125, e2019JF005200. doi: 10.1029/2019JF005200
FitzGerald D. M., Fenster M. S., Argow B. A., Buynevich I. V. (2008). Coastal impacts due to Sea-level rise. Annu. Rev. Earth Planet. Sci. 36, 601–647. doi: 10.1146/annurev.earth.35.031306.140139
Fitzgerald D. M., Hughes Z. (2019). Marsh processes and their response to climate change and sea-level rise. Annu. Rev. Earth Planet. Sci. 47, 481–517. doi: 10.1146/annurev-earth-082517-010255
Flemming B. W., Delafontaine M. T. (2000). Mass physical properties of muddy intertidal sediments: Some applications, misapplications and non-applications. Cont. Shelf Res. 20, 1179–1197. doi: 10.1016/S0278-4343(00)00018-2
Ford H., Garbutt A., Ladd C., Malarkey J., Skov M. W. (2016). Soil stabilization linked to plant diversity and environmental context in coastal wetlands. J. Veg. Sci. 27, 259–268. doi: 10.1111/jvs.12367
French J. R., Spencer T. (1993). Dynamics of sedimentation in a tide-dominated backbarrier salt marsh, Norfolk, UK. Mar. Geol. 110, 315–331. doi: 10.1016/0025-3227(93)90091-9
Gibson R. E., England G. L., Hussey M. J. L. (1967). The theory of one-dimensional consolidation of saturated clays. Géotechnique 17, 261–273. doi: 10.1680/geot.1967.17.3.261
Gourgue O., Van Belzen J., Schwarz C., Vandenbruwaene W., Vanlede J., Belliard J. P., et al. (2022). Biogeomorphic modeling to assess the resilience of tidal-marsh restoration to sea level rise and sediment supply. Earth Surf. Dyn. 10, 531–553. doi: 10.5194/esurf-10-531-2022
Haasnoot M., Bouwer L., Diermanse F., Kwadijk J., van der Spek A., Oude Essink G., et al. (2018). Mogelijke gevolgen van versnelde zeespiegelstijging voor het deltaprogramma. een verkenning (Delft: Deltares rapport).
Hartmann K., Stock M. (2019). Long-term change in habitat and vegetation in an ungrazed, estuarine salt marsh: Man-made foreland compared to young marsh development. Estuar. Coast. Shelf Sci. 227, 106348. doi: 10.1016/j.ecss.2019.106348
Heerdt G. N. J., Ter Verweij G. L., Bekker R. M., Bakker J. P. (1996). An improved method for seed-bank analysis: Seedling emergence after removing the soil by sieving. Funct. Ecol. 10, 144. doi: 10.2307/2390273
Hijma M., Kooi H. (2017). Bodemdaling in het kustfundament en de getijdenbekkens. door geologische processen en menselijke activiteiten (Delft: Delft). Available at: https://www.helpdeskwater.nl/publish/pages/156533/11200538-008-zks-0001-v1-r-bodemdaling_in_het_kustfundament_en_de_getijdenbekkens_deel_1.pdf.
Hosking J. R. M. (2019) L-moments. Available at: https://cran.r-project.org/package=lmom.
IPCC (2022). “Sea Level rise and implications for low-lying islands, coasts and communities,” The Ocean and Cryosphere in a Changing Climate (Cambridge: Cambridge University Press), 321–446. doi: 10.1017/9781009157964.012.
Keshta A., Koop-Jakobsen K., Titschack J., Mueller P., Jensen K., Baldwin A., et al. (2020). Ungrazed salt marsh has well connected soil pores and less dense sediment compared with grazed salt marsh: A CT scanning study. Estuar. Coast. Shelf Sci. 245, 106987. doi: 10.1016/j.ecss.2020.106987
Kirwan M. L., Guntenspergen G. R., D’Alpaos A., Morris J. T., Mudd S. M., Temmerman S. (2010). Limits on the adaptability of coastal marshes to rising sea level. Geophys. Res. Lett. 37, 1–5. doi: 10.1029/2010GL045489
Kirwan M. L., Megonigal J. P. (2013). Tidal wetland stability in the face of human impacts and sea-level rise. Nature 504, 53–60. doi: 10.1038/nature12856
Kirwan M. L., Temmerman S., Skeehan E. E., Guntenspergen G. R., Fagherazzi S. (2016a). Overestimation of marsh vulnerability to sea level rise. Nat. Clim. Change 6, 253–260. doi: 10.1038/nclimate2909
Kirwan M. L., Walters D. C., Reay W. G., Carr J. A. (2016b). Sea level driven marsh expansion in a coupled model of marsh erosion and migration. Geophys. Res. Lett. 43, 4366–4373. doi: 10.1002/2016GL068507.Received
Kooi H., Johnston P., Lambeck K., Smither C., Molendijk R. (1998). Geological causes of recent (~100 yr) vertical land movement in the Netherlands. Tectonophysics 299, 297–316. doi: 10.1016/S0040-1951(98)00209-1
Koppejan A. W. (1948). International Society for Soil Mechanics and Geotechnical Engineering (ISSMGE). (Rotterdam), 32–37. doi: 10.1007/978-3-319-73568-9_174
Koppenaal E. C., Esselink P., van Duin W. E., Bakker J. P. (2022). Temporal and spatial accretion patterns and the impact of livestock grazing in a restored coastal salt marsh. Estuaries Coasts 45, 510–522. doi: 10.1007/s12237-021-00963-w
Le Bars D., Drijfhout S., De Vries H. (2017). A high-end sea level rise probabilistic projection including rapid Antarctic ice sheet mass loss. Environ. Res. Lett. 12, 044013. doi: 10.1088/1748-9326/aa6512
Leonardi N., Carnacina I., Donatelli C., Ganju N. K., Plater A. J., Schuerch M., et al. (2018). Dynamic interactions between coastal storms and salt marshes: A review. Geomorphology 301, 92–107. doi: 10.1016/j.geomorph.2017.11.001
Londo G. (1976). The decimal scale for relevees of permanent quadrates. Vegetatio 33, 31–64. doi: 10.1007/BF00055300
Marijnissen R., Esselink P., Kok M., Kroeze C., van Loon-Steensma J. M. (2020). How natural processes contribute to flood protection - a sustainable adaptation scheme for a wide green dike. Sci. Total Environ. 739, 139698. doi: 10.1016/j.scitotenv.2020.139698
Marin-Diaz B., Govers L. L., van der Wal D., Olff H., Bouma T. J. (2021). How grazing management can maximize erosion resistance of salt marshes. J. Appl. Ecol. 58, 1533–1544. doi: 10.1111/1365-2664.13888
Marin-Diaz B., Govers L. L., van der Wal D., Olff H., Bouma T. J. (2022). The importance of marshes providing soil stabilization to resist fast-flow erosion in case of a dike breach. Ecol. Appl. 32, e2622. doi: 10.1002/eap.2622
Mariotti G. (2016). Revisiting salt marsh resilience to sea level rise: Are ponds responsible for permanent land loss? J. Geophys. Res. Earth Surf. 121, 1391–1407. doi: 10.1002/2016JF003900
Mariotti G. (2020). Beyond marsh drowning: The many faces of marsh loss (and gain). Adv. Water Resour. 144, 103710. doi: 10.1016/j.advwatres.2020.103710
Mariotti G., Fagherazzi S. (2010). A numerical model for the coupled long-term evolution of salt marshes and tidal flats. J. Geophys. Res. Earth Surf. 115, F01004. doi: 10.1029/2009JF001326
Möller I., Kudella M., Rupprecht F., Spencer T., Paul M., van Wesenbeeck B. K., et al. (2014). Wave attenuation over coastal salt marshes under storm surge conditions. Nat. Geosci. 7, 727–731. doi: 10.1038/ngeo2251
Morris J. T., Sundareshwar P. V., Nietch C. T., Kjerfve B., Cahoon D. R. (2002). Responses of coastal wetlands to rising Sea level. Ecology 83, 2869–2877. doi: 10.1890/0012-9658(2002)083[2869:ROCWTR]2.0.CO;2
Mudd S. M., D’Alpaos A., Morris J. T. (2010). How does vegetation affect sedimentation on tidal marshes? investigating particle capture and hydrodynamic controls on biologically mediated sedimentation. J. Geophys. Res. Earth Surf. 115, 1–14. doi: 10.1029/2009JF001566
Neuhaus R., Stelter T., Kiehl K. (1999). Sedimentation in salt marshes affected by grazing regime, topographical patterns and regional differences. Senckenbergiana maritima 29, 113–116. doi: 10.1007/BF03043134
Nolte S., Esselink P., Bakker J. P., Smit C. (2015). Effects of livestock species and stocking density on accretion rates in grazed salt marshes. Estuar. Coast. Shelf Sci. 152, 109–115. doi: 10.1016/j.ecss.2014.11.012
Nolte S., Koppenaal E. C., Esselink P., Dijkema K. S., Schuerch M., de Groot A. V., et al. (2013a). Measuring sedimentation in tidal marshes: A review on methods and their applicability in biogeomorphological studies. J. Coast. Conserv. 17, 301–325. doi: 10.1007/s11852-013-0238-3
Nolte S., Müller F., Schuerch M., Wanner A., Esselink P., Bakker J. P., et al. (2013b). Does livestock grazing affect sediment deposition and accretion rates in salt marshes? Estuar. Coast. Shelf Sci. 135, 296–305. doi: 10.1016/j.ecss.2013.10.026
Peralta G., Van Duren L. A., Morris E. P., Bouma T. J. (2008). Consequences of shoot density and stiffness for ecosystem engineering by benthic macrophytes in flow dominated areas: A hydrodynamic flume study. Mar. Ecol. Prog. Ser. 368, 103–115. doi: 10.3354/meps07574
Petersen J., Kers B., Stock M. (2014). TMAP typology of coastal vegetation in the wadden Sea area. WADDEN SEA ECOSYSTEM No. 32 - 2014 Wilhelmshaven, Germany. Available at: https://www.waddensea-worldheritage.org/resources/ecosystem-32-tmap-typology-coastal-vegetation-wadden-sea-area.
Rappoldt C., Roosenschoon O. R., van Kraalingen D. W. (2020). InterTides; maps of the intertidal by interpolation of tidal gauge data (Haren: EcoCurves BV).
R Core Team (2018). R: A language and environment for statistical computing. R foundation for statistical Computing, Vienna, Austria. Available at: https://www.r-project.org/.
Reef R., Schuerch M., Christie E. K., Möller I., Spencer T. (2018). The effect of vegetation height and biomass on the sediment budget of a European saltmarsh. Estuar. Coast. Shelf Sci. 202, 125–133. doi: 10.1016/j.ecss.2017.12.016
Reitsma J. M., de Jong J., Bureau Waardenburg (2016) Toelichting bij de vegetatiekartering kwelderwerken friesland & groningen 2014: op basis van false colour-luchtfoto’s 1:10.000. Available at: https://puc.overheid.nl/doc/PUC_150335_31/1.
Sassi M., Duran-Matute M., van Kessel T., Gerkema T. (2015). Variability of residual fluxes of suspended sediment in a multiple tidal-inlet system: The Dutch wadden Sea. Ocean Dyn. 65, 1321–1333. doi: 10.1007/s10236-015-0866-2
Schepers L., Brennand P., Kirwan M. L., Guntenspergen G. R., Temmerman S. (2020). Coastal marsh degradation into ponds induces irreversible elevation loss relative to Sea level in a microtidal system. Geophys. Res. Lett. 47, 1–10. doi: 10.1029/2020GL089121
Schrama M. J. J., Heijning P., Bakker J. P., Van Wijnen H. J., Berg M. P., Olff H. (2013). Herbivore trampling as an alternative pathway for explaining differences in nitrogen mineralization in moist grasslands. Oecologia 172, 231–243. doi: 10.1007/s00442-012-2484-8
Schuerch M., Spencer T., Temmerman S., Kirwan M. L., Wolff C., Lincke D., et al. (2018). Future response of global coastal wetlands to sea-level rise. Nature 561, 231–234. doi: 10.1038/s41586-018-0476-5
Schulze D., Jensen K., Nolte S. (2021). Livestock grazing reduces sediment deposition and accretion rates on a highly anthropogenically altered marsh island in the wadden Sea. Estuar. Coast. Shelf Sci. 251, 107191. doi: 10.1016/B978-0-323-60984-5.00062-7
Soetaert K., Petzoldt T., Setzer R. W. (2010). Solving differential equations in R : Package deSolve. J. Stat. Software 33, 1–25. doi: 10.18637/jss.v033.i09
Suchrow S., Pohlmann N., Stock M., Jensen K. (2012). Long-term surface elevation changes in German north Sea salt marshes. Estuar. Coast. Shelf Sci. 98, 71–83. doi: 10.1016/j.ecss.2011.11.031
Temmerman S., Bouma T. J., Govers G., Wang Z. B., de Vries M. B., Herman P. M. J. (2005). Impact of vegetation on flow routing and sedimentation patterns: Three-dimensional modeling for a tidal marsh. J. Geophys. Res. Earth Surf. 110, 1–18. doi: 10.1029/2005JF000301
Temmerman S., Govers G., Meire P., Wartel S. (2003). Modelling long-term tidal marsh growth under changing tidal conditions and suspended sediment concentrations, scheldt estuary, Belgium. Mar. Geol. 193, 151–169. doi: 10.1016/S0025-3227(02)00642-4
Temmerman S., Meire P., Bouma T. J., Herman P. M. J., Ysebaert T., De Vriend H. J. (2013). Ecosystem-based coastal defence in the face of global change. Nature 504, 79–83. doi: 10.1038/nature12859
van Dobben H. F., de Groot A. V., Bakker J. P. (2022). Salt marsh accretion with and without deep soil subsidence as a proxy for Sea-level rise. Estuaries Coasts. 45, 1562–1582. doi: 10.1007/s12237-021-01034-w
van Duin W. E., Dijkema K. S. (2003). Proef met de onderhoudsarme ontwatering in de kwelderwerken: “De Krekenproef”; evaluatie 1997-2003 (Wageningen: Alterra). Available at: https://library.wur.nl/WebQuery/wurpubs/320600.
van Rijn L. C. (2020) Settling velocity of mud. Available at: www.leovanrijn-sediment.com (Accessed November 29, 2022).
van Rijn L. C., Walstra D.-J. R., van Ormondt M. (2007). Unified view of sediment transport by currents and waves. IV: Application of morphodynamic model. J. Hydraul. Eng. 133, 776–793. doi: 10.1061/(asce)0733-9429(2007)133:7(776
van Wijnen H. J., Bakker J. P. (2001). Long-term surface elevation change in salt marshes: A prediction of marsh response to future sea-level rise. Estuar. Coast. Shelf Sci. 52, 381–390. doi: 10.1006/ecss.2000.0744
Wang Z. B., Van Maren D. S., Ding P. X., Yang S. L., Van Prooijen B. C., De Vet P. L. M., et al. (2015). Human impacts on morphodynamic thresholds in estuarine systems. Cont. Shelf Res. 111, 174–183. doi: 10.1016/j.csr.2015.08.009
Warren R., Price J., Fischlin A., de la Nava Santos S., Midgley G. (2011). Increasing impacts of climate change upon ecosystems with increasing global mean temperature rise. Clim. Change 106, 141–177. doi: 10.1007/s10584-010-9923-5
Webb E. L., Friess D. A., Krauss K. W., Cahoon D. R., Guntenspergen G. R., Phelps J. (2013). A global standard for monitoring coastal wetland vulnerability to accelerated sea-level rise. Nat. Clim. Change 3, 458–465. doi: 10.1038/nclimate1756
Weisscher S. A. H., Baar A. W., van Belzen J., Bouma T. J., Kleinhans M. G. (2022). Transitional polders along estuaries: Driving land-level rise and reducing flood propagation. Nature-Based Solut. 2, 100022. doi: 10.1016/j.nbsj.2022.100022
Winterwerp J. C., de Boer G. J., Greeuw G., van Maren D. S. (2012). Mud-induced wave damping and wave-induced liquefaction. Coast. Eng. 64, 102–112. doi: 10.1016/j.coastaleng.2012.01.005
Winterwerp J. C., Zhou Z., Battista G., Van Kessel T., Jagers H. R. A., Van Maren D. S., et al. (2018). Efficient consolidation model for morphodynamic simulations in low-SPM environments. J. Hydraul. Eng. 144, 04018055. doi: 10.1061/(asce)hy.1943-7900.0001477
Yang S. L., Li H., Ysebaert T., Bouma T. J., Zhang W. X., Wang Y. Y., et al. (2008). Spatial and temporal variations in sediment grain size in tidal wetlands, Yangtze delta: On the role of physical and biotic controls. Estuar. Coast. Shelf Sci. 77, 657–671. doi: 10.1016/j.ecss.2007.10.024
Zhou Z., van der Wegen M., Jagers B., Coco G. (2016). Modelling the role of self-weight consolidation on the morphodynamics of accretional mudflats. Environ. Model. Software 76, 167–181. doi: 10.1016/j.envsoft.2015.11.002
Keywords: cattle, global climate change, coastal wetland, marsh accretion rate, autocompaction, Wadden Sea, subsidence, sedimentation
Citation: Elschot K, Baptist MJ and van Puijenbroek MEB (2023) Biocompacting livestock accelerate drowning of tidal salt marshes with sea level rise. Front. Mar. Sci. 10:1129811. doi: 10.3389/fmars.2023.1129811
Received: 22 December 2022; Accepted: 20 March 2023;
Published: 11 April 2023.
Edited by:
Angel Borja, Technology Center Expert in Marine and Food Innovation (AZTI), SpainReviewed by:
Nadia S. Santini, The University of Queensland, AustraliaGlenn Guntenspergen, United States Geological Survey (USGS), United States
Copyright © 2023 Elschot, Baptist and van Puijenbroek. This is an open-access article distributed under the terms of the Creative Commons Attribution License (CC BY). The use, distribution or reproduction in other forums is permitted, provided the original author(s) and the copyright owner(s) are credited and that the original publication in this journal is cited, in accordance with accepted academic practice. No use, distribution or reproduction is permitted which does not comply with these terms.
*Correspondence: Kelly Elschot, a2VsbHkuZWxzY2hvdEB3dXIubmw=