 Suman Barua
 Qun Liu
 Mohammed Shahidul Alam
 Petra Schneider
 M.M.H. Mozumder
 Md. Abdur Rouf2
- 1College of Fisheries, Ocean University of China, Qingdao, China
- 2Department of Fisheries, Ministry of Fisheries and Livestock, Dhaka, Bangladesh
- 3Department of Fisheries, University of Chittagong, Chattogram, Bangladesh
- 4Department for Water, Environment, Civil Engineering and Safety, University of Applied Sciences Magdeburg-Stendal, Magdeburg, Germany
- 5Fisheries and Environmental Management Group, Helsinki Institute of Sustainability Science (HELSUS), Faculty of Biological and Environmental Sciences, University of Helsinki, Helsinki, Finland
Muraenesox bagio (black eel) and Congresox talabonoides (brown eel) are two major eels (Muraenesocidae) species which are commercially significant in the marine catch of Bangladesh, but population dynamics and stock assessment of marine eel fishery in Bangladesh are yet to be studied. This study is the first endeavour to analyze the population dynamics and stock assessment of this marine eels collected from July 2021 to May 2022 using three length-based methods namely TropFishR, the Length Based-Spawning Potential Ratio (LB-SPR) & the length-Based Indicators (LBI) and two catch-based methods including Depletion-Based Stock Reduction Analysis (DB-SRA) and the Catch-Maximum Sustainable Yield (CMSY). A slightly positive allometric growth pattern (b=3.10) for the black eel and a negative allometric growth pattern (b=2.33) for the brown eel were observed in the length-weight relationship. The parameters of von Bertalanffy Growth Function (VBGF) and the linearized length-converted catch curve (LCCC) analysis for black eel and brown eel were L∞=190.67cm and 166.63cm, k=0.18 year-1 and 0.16 year-1, and the total mortality, Z=0.70 year-1 and 0.45 year-1. The eel fishery is calculated to be overfished due to overexploitation and the stock’s spawning biomass (SPR=19% for black eel and 21% for brown eel) is close to the limit reference point but well outside the targeted range because the majority of the catches were found to have below-maturity levels. This study advised an optimum length limit to catch from 93 to 114 cm for black eel and 83 to 101 cm for brown eel. Though the estimated reference points of the CMSY were more optimistic than those from the DB-SRA, the tendency of the status of eel stock has been displayed moving towards overexploitation from a safe stock scenario. This study, therefore, recommended an annual landing limit of 250 mt as OFL (Over fishing limit) for the next ten years in association with existing management measures to maintain the present stock biomass of eel fishery over the BMSY level.
1 Introduction
Common pike conger, Muraenesox bagio (Hamilton, 1822) is commonly known as Black eel (greyish body coloration) and Indian pike conger, Congresox talabonoides (Bleeker, 1853) is commonly known as Brown eel (yellowish body coloration). These are two major eel species, which are locally known as Kamila substantially present in Bangladesh marine fishing waters. But, the most dominant species is the black eel. Based on an unpublished report, it is shown that the catch of black eel is around 90% and the rest is brown eel. Black eel is found all year round but brown eel is least come into view from February to April (Personal communication). The maximum length of black eel and brown eel are reported 200 cm and 250 cm respectively (Fishbase). In terms of weight, adult black eels were observed to have 2-3 times heavier than that of brown eels. Though, consumer preference goes for brown eels more than black eels. Thereby, the market price of brown eel is higher than black eel. Due to the increased demand, a commercially significant fishery resource like eel in Bangladesh marine waters is supposed to be overfished. Overfishing is a major anthropogenic problem in the marine ecosystem that has harmed ecosystem function and diminished biodiversity (Worm et al., 2009).
The eel is a long-lived animal, with an average age the maturation of 5-15 years for females, and a maximum observed age of 84 years (Vøllestad, 1992; Dekker et al., 1998). Though, most field studies have covered a few years only. The marine eel population in the world is gradually declining. There are some factors including overexploitation, water pollution, habitat damage, and a decrease in the quality and quantity of freshwater inflow, estuaries, and coastal habitats contributing to the decline of the eel population in the world (Aprahamian and Walker, 2008; Jacoby et al., 2015). The eel fishery constitutes one of the important fishery resources in the marine catch of Bangladesh, but its population potential and stock assessment are not well known. However, its population has been exploited for years using uncontrolled fishing gear due to the high economic value and demand of consumers at home and abroad, especially exports to South-East Asian countries. Besides, the fish maw of eels has huge demand in the export market because of processed fish air bladder or swim bladder of eels like Congridae and Muraenesocidae are highly priced for edible purposes as well as medicinal value in many countries of Southeast Asia (Akhilesh et al., 2022). To date, most of the studies in this kind in Bangladesh are limited to the population dynamics and stock assessment of other commercially important fin fish and shrimp species (Barua et al., 2014; Barua et al., 2018; Barua, 2019; Alam et al., 2021; Barua et al., 2022; Alam et al., 2022a; Alam et al., 2022b; Alam et al., 2022c; Al-Mamun et al., 2021; Barua et al., 2023 and other studies). But, studies on the population dynamics and stock assessment of marine and estuarine eels of Bangladesh are yet to explore. Accordingly, this is the first endeavour to study population dynamics and stock assessment of both black and brown eels in the Bay of Bengal Bangladesh waters. The novelty of this study is to elucidate the life history parameters, assessing present stock status, harvest strategy and finally to project a catch limit as management measures for sustainable management and conservation of marine eels in the Bay of Bengal Bangladesh waters.
Length composition data are often utilized to analyze the stock status and population dynamics when age composition data are not easily available (Sparre and Venema, 1998). Therefore, in data-limited fisheries where age determination has not been achievable, length-based approaches are routinely utilized (Morgan, 1985; Parsamanesh et al., 1998). Length-based models outperformed some catch-based models when reliable prior data was available because of the high sensitivity to catch history scenarios and depletion levels (Pons et al., 2019). Three length-based approaches and two catch-based methods have been used in conjunction with this research to address the stock assessment of the highly valued eel fishery in Bangladesh’s marine waters. Using the “TropFishR” package (Mildenberger et al., 2017), estimating life history traits like growth, mortality, and fisheries reference points; using LBSPR (Hordyk et al., 2015a; Hordyk et al., 2015b) to evaluate the impact of fishing on the stock’s spawning biomass; and using LBI (Froese, 2004) to determine the selectivity pattern of gears are all length-based methods for assessing stock of eel fishery. There is no specific record of marine eels in the catch composition of the national database due to the catch data of eels is not particularly recorded in the artisanal mechanized sector. Though, the catch data of marine eels has been distinctly maintained in industrial catch log books from 2005-06 (MFO, 2022). Therefore, management efforts become difficult because of the lack of well-managed inclusive catch data. But, understanding of exploited fish population dynamics is essential with a view to achieving maximum benefits and effective fishery management. The DB-SRA, and the CMSY are two catch-based methods that have been considered to estimate management reference points. The DB-SRA method, which is particularly useful for the assessment of data-limited fish stocks, has been accepted and recommended by the Pacific Fisheries Management Council (PFMC) and the National Oceanic and Atmospheric Administration (NOAA) (Berkson et al., 2011; Alam et al., 2022b). It is an alternate method of stock reduction analysis (SRA) presented by Walters et al. (2006), which involved using only catch data and not effort data. By including a depletion rate (the ratio between current biomass and the initial carrying capacity of the stock) in the SRA processes, Dick and MacCall (2011) later developed the depletion-based stock reduction analysis (DB-SRA). Based on life-history parameters (mainly the intrinsic population growth rate r, carrying capacity K, and natural mortality rate M), it estimates the minimum biomass required to maintain current fishery catches without causing extinction. Finally, the catch-MSY method (CMSY) was suggested by Kimura and Tagart (1982) based on stock reduction analysis. This surplus production-based Monte Carlo method evaluates the stock biomass with the exploitation and estimates fisheries reference points based on catch series and resilience data (Froese et al., 2017).
The purpose of this study is to estimate growth parameters and population dynamics of the marine eel fishery as an instrument in eel resource stock assessment. The result of this study could be used as scientific information for the sustainable management of marine eel fishery resources in Bangladesh and form the foundation of future research in this kind as well.
2 Methodology
2.1 Study area and sampling method
For the stock assessment of marine eel fishery, length-weight data were mainly collected from industrial trawlers which are allowed to fish beyond 40 m depth of water column in Bangladesh marine waters and partially from two large landing centers of Bangladesh including Chattogram and Cox’s Bazar where mainly landed fish from artisanal mechanized boats (Figure 1).
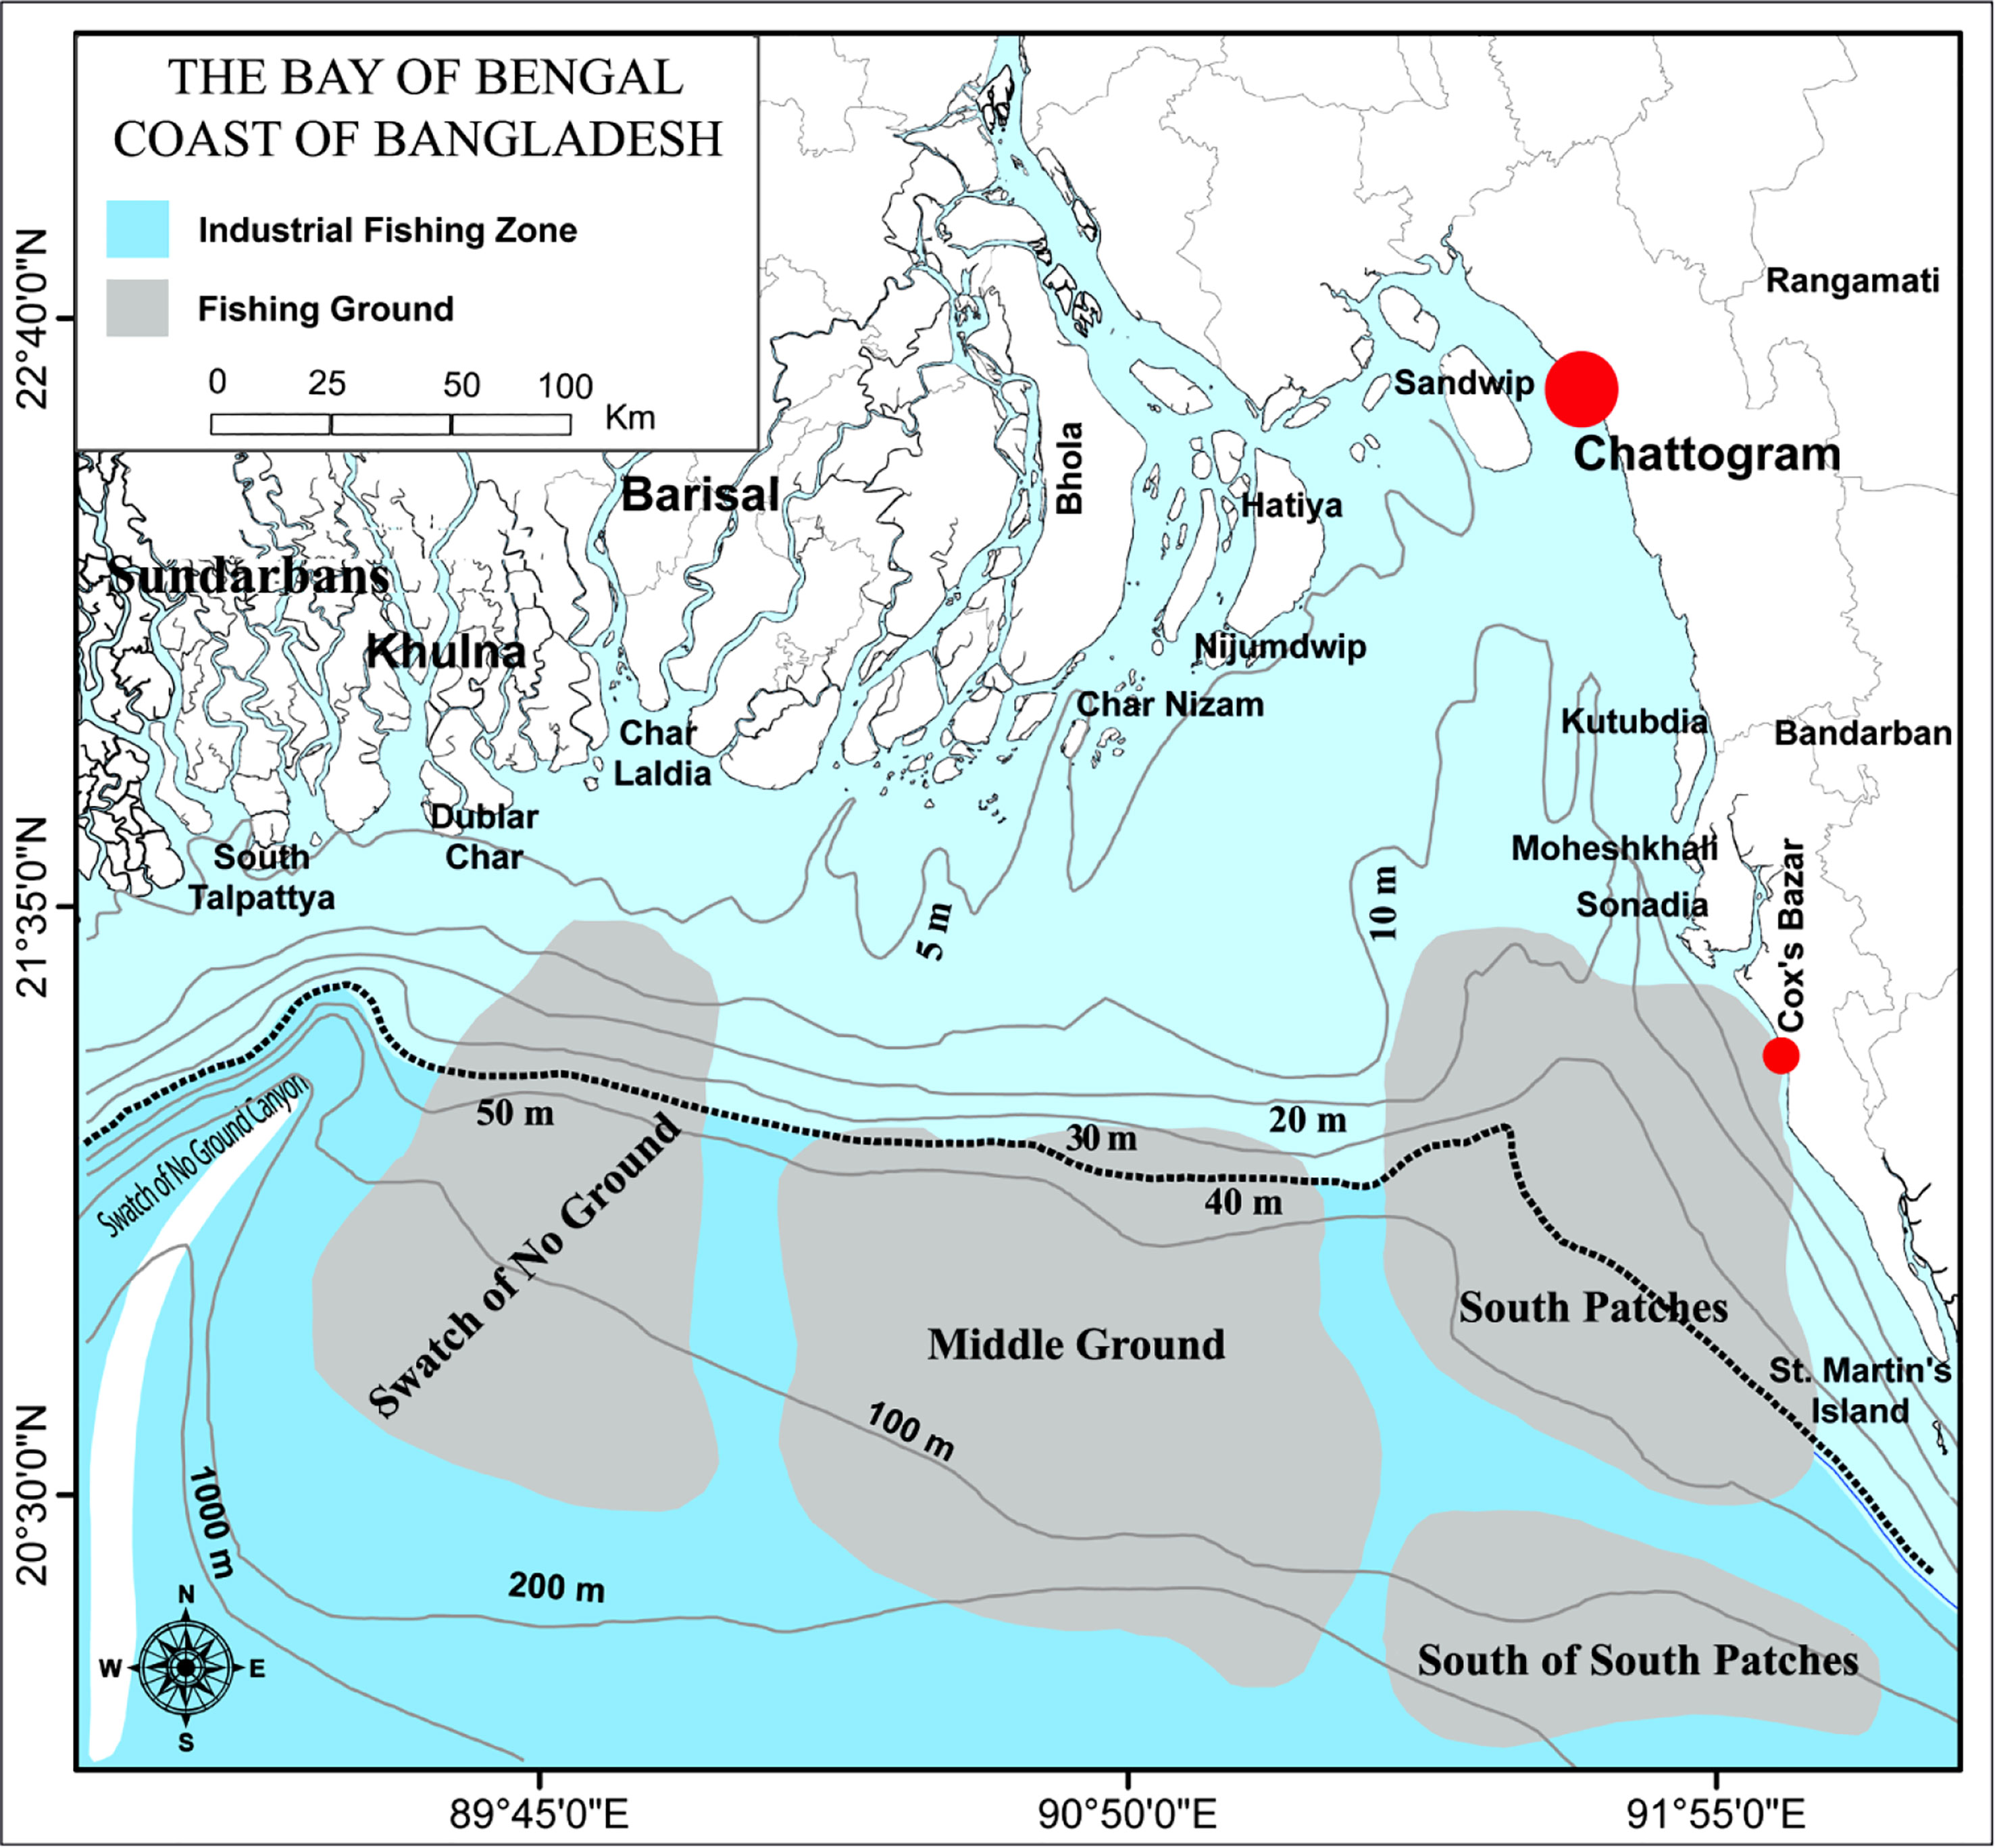
Figure 1 Map of the Bay of Bengal Bangladesh marine waters showing industrial fishing zone (beyond 40 m depth colored by deep sky) and the location of sampling sites (red circle) (Alam et al., 2022b; Barua et al., 2022; Barua et al., 2023).
A total of 2222 black eel and 1755 brown eel samples (both sexes) were collected monthly from July 2021 to May 2022 as length and weight data (Figure 2). Specimens were taken from the onboard conditions after hauling at sea and from the unloading state of trawlers and partially from two major landing stations such as Chattogram and Cox’s Bazar. Data collection crews of trawlers while on-board condition randomly measured specimens. As for low landing, in some cases, brown eel took 100% of the fish for measurement. In most cases the catch of black eel becomes enormous and in this case, samples were taken randomly. All samples of the eels were measured their total length from the terminal mouth up to the caudal tip using a ruler/measuring tape to the nearest 0.1 cm and weighed their total weight using a digital balance to the nearest 1 g. Time series catch data from 2005-06 to 2021-22 were taken from the Marine Fisheries Office under the Department of Fisheries (MFO, 2022). Because there was no available data on species-wise in Fisheries Resources Statistical Survey (FRSS) database except for some commercially important fish and shrimp species and groups.
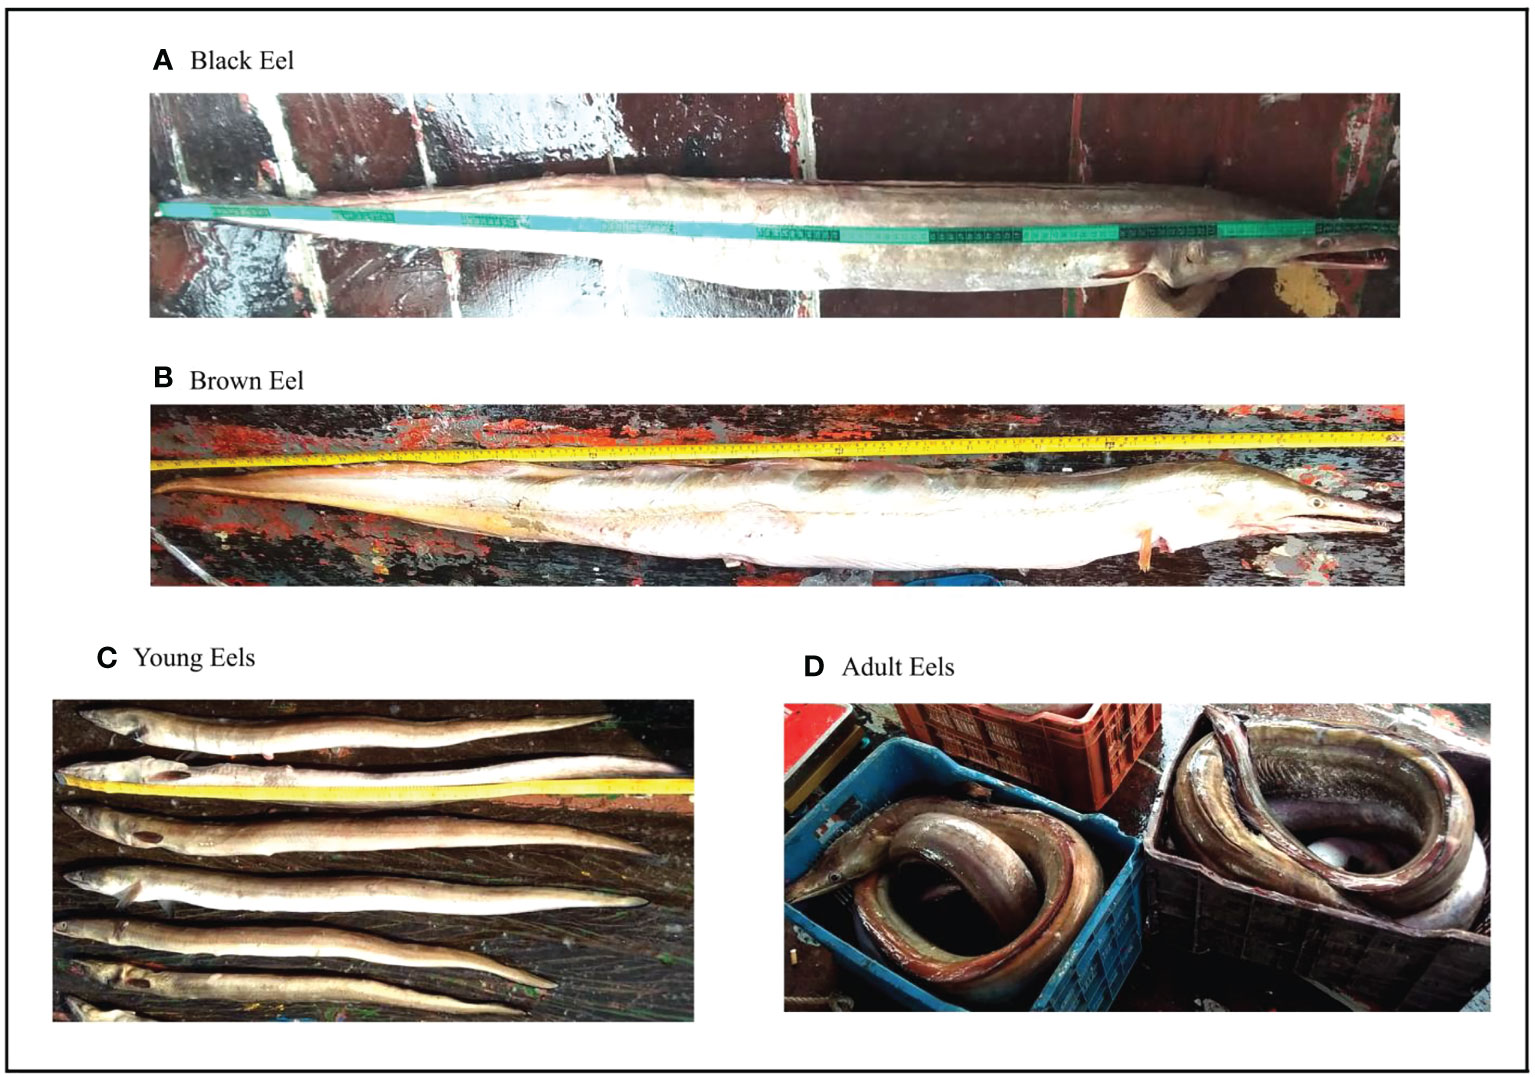
Figure 2 Data collection on black eels and brown eels from an industrial fishing vessel during unloading at Karnafuly River, Chattogram, Bangladesh.
2.2 Length distribution
Samples were taken for measurement from July 2021 to May 2022 from the Bay of Bengal Bangladesh marine waters. Due to the annual fishing ban, June is excluded from the sampling scheme (MFA, 2020). Length frequency composition (Table 1 and Figure 3) for two calendar years (2021-2022) was pooled into a single year from January to December 2021 and displayed a length range as total length (TL) from 35 to 176 cm for black eel and 42 to 159 cm for brown eel. The average length of the black eel was 88.67 cm with a standard deviation of 34.60 and that of the brown eel was 88.62 cm with a standard deviation of 20.38. The weight of black eel ranged between 64 g and 11000 g and that of brown eel ranged between 150 g and 5780 g. The mean weight of the black eel was 1775 g and that of the brown eel was 1454 g. Both species showed lesser quantity in total landings from February to April, particularly brown eels were very minimum in catch quantity during field observation of above reported months.
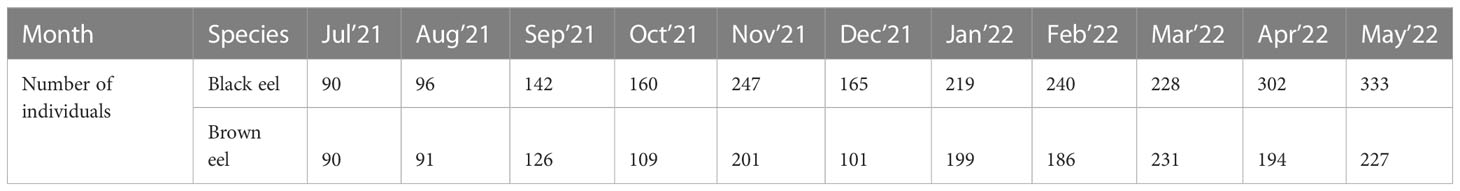
Table 1 The number of individuals of the monthly sample collections from July 2021 to May 2022.
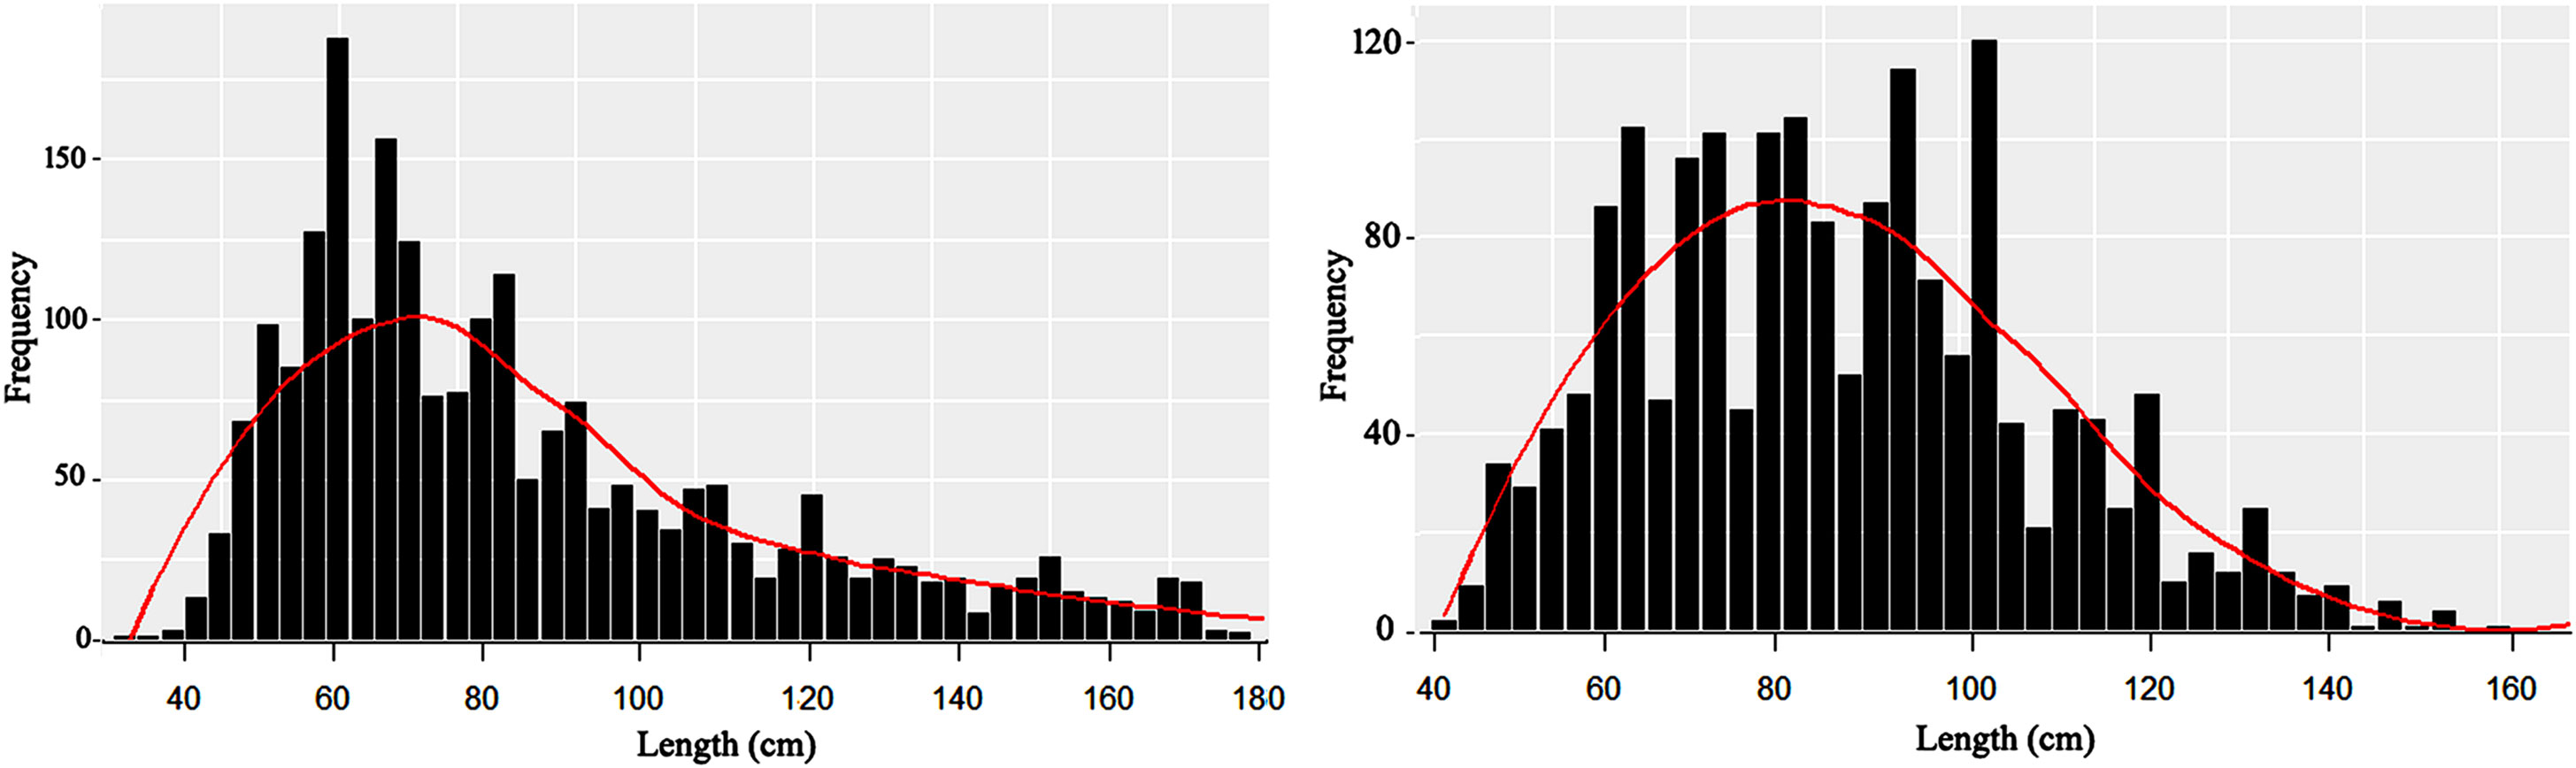
Figure 3 The bar chart shows the length-frequency distribution and the curve shows the unimodal distribution of the size data of the black eel (Left) and the multimodal distribution of the size data of the brown eel (Right) based on month-wise data collection from July 2021 to May 2022.
2.3 Length-weight relationship
The length-weight relationships were calculated by using the formula (Le Cren, 1951), which is expressed logarithmically as
Where W is the body weight of the fish in gram; L is the total length of the fish in cm; ‘a’ and ‘b’ are parameters.
2.4 Stock assessment indicators
In the beginning, we estimated the fishery’s life history parameters (growth and mortality), exploitation, and selectivity by using a newly developed R package that was based on FAO traditional stock assessment methods (Sparre and Venema, 1998; Mildenberger et al., 2017). These methods were used for assessing the life history parameters of both black and brown eels. Second, to compute the Spawning Potential Ratio (SPR) as a function of relative fishing mortality (F/M), we made use of an R package referred to as LBSPR (Length-based spawning Potential Ratio). This program was developed by Hordyk et al., (2015a). The SPR refers to the unfished reproductive potentials that are still present in the stock notwithstanding the high level of exploitation that has taken place (Hordyk et al., 2015b). This biological reference point, which is highly recommended for medium to long-lived species, has been noted in the scientific literatures to estimate the influence that current fishing pressure has on the stock’s reproductive capacity (Hordyk et al., 2015a; Hordyk et al., 2015b). As an approximated number, 40% SPR is commonly used as a benchmark for a fishery’s sustainability and 20% as a limit reference point (Prince et al., 2015). Then, we evaluated our length composition data with length reference points (Froese, 2004; Cope and Punt, 2009) using Froese’s (2004) length-based sustainability indicators. This was followed by a useful management prescription for overfishing. Finally, the reasonable yield and management reference points were estimated using two catch-based methods, the DBSRA, and the CMSY. Using the DB-SRA approach, we projected biomass from time series catch data to determine realistic yields and management reference points (Dick and MacCall, 2011; Alam et al., 2022b) and the CMSY method (Froese et al., 2017) to estimate fisheries reference points from catch and prior range of resilience and justified to the outputs of above methods.
2.4.1 Estimation of growth parameter
Using the seasonalized von Bertalanffy’s growth function on the length-frequency data, the TropFishR package (Mildenberger et al., 2017) computed the von Bertalanffy’s growth parameters (k, L∞, and t0) (von Bertalanffy, 1938; Mildenberger et al., 2017):
Where Lt is the length of the fish at age t, L∞ is the asymptotic length in cm, k is the growth rate coefficient in year-1, t0 is the theoretical age of a fish at which length is zero.
Fish in tropical waters rarely have significant changes in growth between winter and summer (Froese and Pauly, 2000). The preceding equation was adjusted so that s(t)-s(t0) equaled zero because in this study the eel growth is not seasonal.
The fitting tool in TropFishR uses a bootstrapped Electronic Length Frequency Analysis (ELEFAN) (Pauly and David, 1981; Schwamborn et al., 2019). The parameter known as tanchor in ELEFAN within TropFishR is what is utilized to define the percentage of the year at which the von Bertalanffy growth curve for a certain cohort crosses the length zero point (Taylor and Mildenberger, 2017). For tanchor, the original seed values ranged from 0 to 1 (Mildenberger et al., 2017).
Additionally, the growth parameter index (Φ′) was calculated using the formula provided by Pauly and Munro (1984):
The priors L∞ and k are necessary components of TropFishR, with the initial value of L∞ determined by applying a formula presented by Pauly (1984):
In which, is the maximum length of the fish that has been measured. The average size of the 1% largest fish in the sample was used to calculate . Then, we used L ± 20% as the starting seed value for L∞, and the range for k was set between 0.01 and 3. After reorganizing the data according to the rule of thumb suggested by Taylor & Mildenberger (2017), a suitable moving average (MA=7 for both black eel and brown eel) was then computed.
2.4.2 Exploitation rate and fishing mortality
A linearized length-converted catch curve (LCCC) was generated using the available length data and growth parameters, the slope of the regression line representing the declining portion of the catch curve was used to derive the instantaneous total mortality rate (Z) (Mildenberger et al., 2017). To determine natural mortality (M), we applied the formula published by Then et al. (2015):
When accurate estimates of maximum age are unavailable, this formula was chosen from among other empirical formulas due to its better predictive power. After that, we used the following formulas to get the fishing mortality rate (F) and exploitation rate (E):
The rate of exploitation was then measured against the 0.5 threshold value suggested by Gulland (1971). Beverton and Holt (1956) Yield Per Recruit (YPR) model provided additional benchmarks against which the estimated fishing mortality and exploitation rate were evaluated:
a) Fishing mortality and exploitation at maximum yield per recruit (Fmax and Emax),
b) Fishing mortality and exploitation that reduces the population to 50% of unfished spawning biomass (F0.5 and E0.5), and
c) Fishing mortality and exploitation that reduces the marginal gain in yield per recruit to an arbitrary 10% of that at F=0 (F0.1 and E0.1).
2.4.3 Length-based spawning potential ratio
LBSPR is a generally accepted data-limited stock assessment method (Hordyk et al., 2015a, Hordyk et al., 2015b). It calculates a reference point of stock state (spawning Potential Ratio-SPR), which has been thoroughly benchmarked in popular worldwide literature and has a solid theoretical base (Prince et al., 2015; Pons et al., 2019; Alam et al., 2022a; Barua et al., 2022). The LBSPR technique assumes that the length composition of an exploited population and the SPR are a function of relative fishing pressure (F/M) and two life history ratios (M/k and Lm/L), where Lm is the length at which 50% of a size class is mature (Alam et al., 2022a). The LBSPR model requires the following input parameters: (i) the M/k ratio, (ii) the asymptotic length (L ), and (iii) the variability of length-at-age (CV L∞), which is likely expected to be between fifty percent (L50%) and ninety-five percent (L95%) of a fish population is mature (Alam et al., 2022a). In a data-poor fishery, it is likely impossible to predict L∞; however, Lm is more easily calculated, and an estimate of Lm/ can be used to estimate . The SPR (Prince 2015) is computed using maximum likelihood methods to predict the length of the first capture of 50% (SL50%) to 95% (SL95%) of the population and the relative fishing mortality (F/M).
The LBSPR model, which is equilibrium-based like many length-based approaches, is predicated on the following tenets: (i) asymptotic selectivity; (ii) growth accurately described by the von Bertalanffy equation; (iii) normal distribution of length at age; (iv) constant natural mortality rates over adult age classes; and (v) constant growth rate across cohorts of stock (Prince 2015).
2.4.4 Input parameters of LB-SPR
In this work, the computed values of L∞, M, and k of TropFishR were employed as input parameters for LB-SPR. The length at 50% sexual maturity (L50%) was then determined using the empirical formula published by Froese and Binohlan (2000):
Using the equation given by Prince et al. (2015), the length at 95% sexual maturity was computed;
Using the LB-SPR R package (Hordyk, 2015), available at: https://CRAN.R-project.org/package=LB-SPR (accessed on 08 September 2022), we were able to conduct the LB-SPR analysis.
2.4.5 Length-based indicator
Three straightforward length-based indicators (LBI) based on the principles “Let them spawn, let them grow, and let the mega spawners live” were presented by Froese (2004) to maintain sustainable fishing and prevent growth and recruitment overfishing. and are the symbols used to represent these parameters, respectively.
With a target of 100%, the proportion of mature fish () in a catch can be determined as the proportion of fish with a length at sexual maturity (Lm) or more. Froese (2004) established as a target for this indication that all fish be allowed to spawn at least once in their lifetime before being caught, with the hopes that this would both replenish and maintain a healthy spawning biomass (Froese, 2004).
If we were able to catch every single fish that would equal a catch rate of 100% ( = 100%). can be expressed as:
Where, (Froese and Binohlan, 2000).
is the proportion of fish caught that are at least 10% longer than the optimum length ((≥1.1 ) (Froese, 2004). No mega-spawners should be caught at all (0%) as a motto of the management approach. If no such plan exists, less than 20% of mega-spawners in the capture should be tolerated at max (Froese, 2004). Finally, the three LBIs are summarized below:
Where, is the percentage of fish in the catch in the length interval L.
2.4.6 The DB-SRA model
The DB-SRA model accounts for uncertainty in the observed time series of catches (Walters et al., 2006; Dick and MacCall, 2011) by analyzing four Monte Carlo-drawn life history input parameters and projecting the biomass ahead based on the number of removals at each epoch. Natural mortality (M), the ratio of fishing mortality that gives MSY to natural mortality (FMSY/M), the relative biomass at maximum latent productivity (BMSY/K), and the relative biomass depletion level for a specific recent year (Bt/K) were used as input parameters for the model run. The study used the year t after the last year of the time series as the reference year (here it is to be 2023). The DB-SRA model (Dick and MacCall, 2011) is predicated on the concept of surplus production in the form of
In the DB-SRA model, annual production is estimated by using the Pella-Tomlinson-Fletcher production model (Fletcher, 1978) and deriving peak latent productivity and MSY as
The maximum productivity of stock under some conditions is given by the product of the Pella-Tomlinson profile parameter (n) and the stock"s carrying capacity (K).
m denotes the stock’s maximum sustainable yield (MSY) and is a function of n, K, and exploitation at maximum sustainable yield (UMSY). For the model runs, K was set at ten times the maximum catch shown in the time series data. Age at sexual maturity was approximated using the von Bertalanffy (1938) growth equation, the age at maturity ( ) was then calculated using the growth coefficient ( ), , and estimated :
Based on the results of this study, the average age of sexual maturity for black eels is 3.73 years and for brown eels it is 4.27 years, using the parameters Linf and k from the TropFishR program. This is why the average age of maturity for both black and brown eels population was set to 4 (=4.0) years for the model run.
The natural mortality, M was determined to be 0.20 year−1 for black eel and 0.20 year−1 for brown eel using equation 5. The average M for both black and brown eels was determined to be 0.20 year−1. The distributions of K, MSY, BMSY, UMSY, and harvest control rule as overfishing limit (OFL) can be calculated from the distributions of the acceptable parameter sets.
2.4.7 The CMSY model
The CMSY model (Froese et al., 2017) uses a surplus production-based Monte Carlo method to estimate fisheries reference points of eel fishery from catch and prior range of resilience (Martell and Froese, 2012; Froese et al., 2017). Typical surplus production model using Schaefer model for CMSY which selects “viable” r-k combinations from a possible range for the maximal intrinsic rate of population growth (r) and the unexploited population size (or carrying capacity, K). The proxy for the resilience of studied marine eels in the Fishbase is medium, which denotes prior r-ranges from 0.2 to 0.8 (Fishbase). And, the initial relative biomass was set to a moderately exploited stock level of 0.4-0.8 (Froese et al., 2017). CMSY computed the Schaefer function for biomass dynamics using SPM as follows (Schaefer, 1954):
Where Bt and Ct are biomass and catches in the year t; r is the intrinsic rate of population increase; K is the carrying capacity; t is the time increment.
Then, the MSY and related fisheries reference points are calculated as MSY=rK/4, fishing mortality corresponding to MSY (FMSY) =0.5r, and biomass corresponding to MSY (BMSY) =0.5K (Ricker, 1975; Barua et al., 2018). Indicators such as the current fishing mortality rate relative to that at MSY (F/FMSY) and the current population biomass relative to that at MSY (B/BMSY) were employed in this investigation (FAO, 1999). For a sustainable stock, the expected criteria were F/FMSY ≤ 1 and B/BMSY≥1.
3 Results
3.1 Length-weight relationship
Using the length-weight equation, the relationship between length (Total length) and body wet weight (g) showed a slightly positive allometric growth for black eel and a negative allometric growth for brown eel (Eq. 1). Weight and length were related by the formula W=0.0015L3.1 (R2 = 0.88) for black eel and that of W=0.025L2.33 (R2 = 0.87) for brown eel (Figure 4). The parameter of the length-weight equation “a” and “b” was used as input parameters in the estimation of yield per recruit of TropFishR.
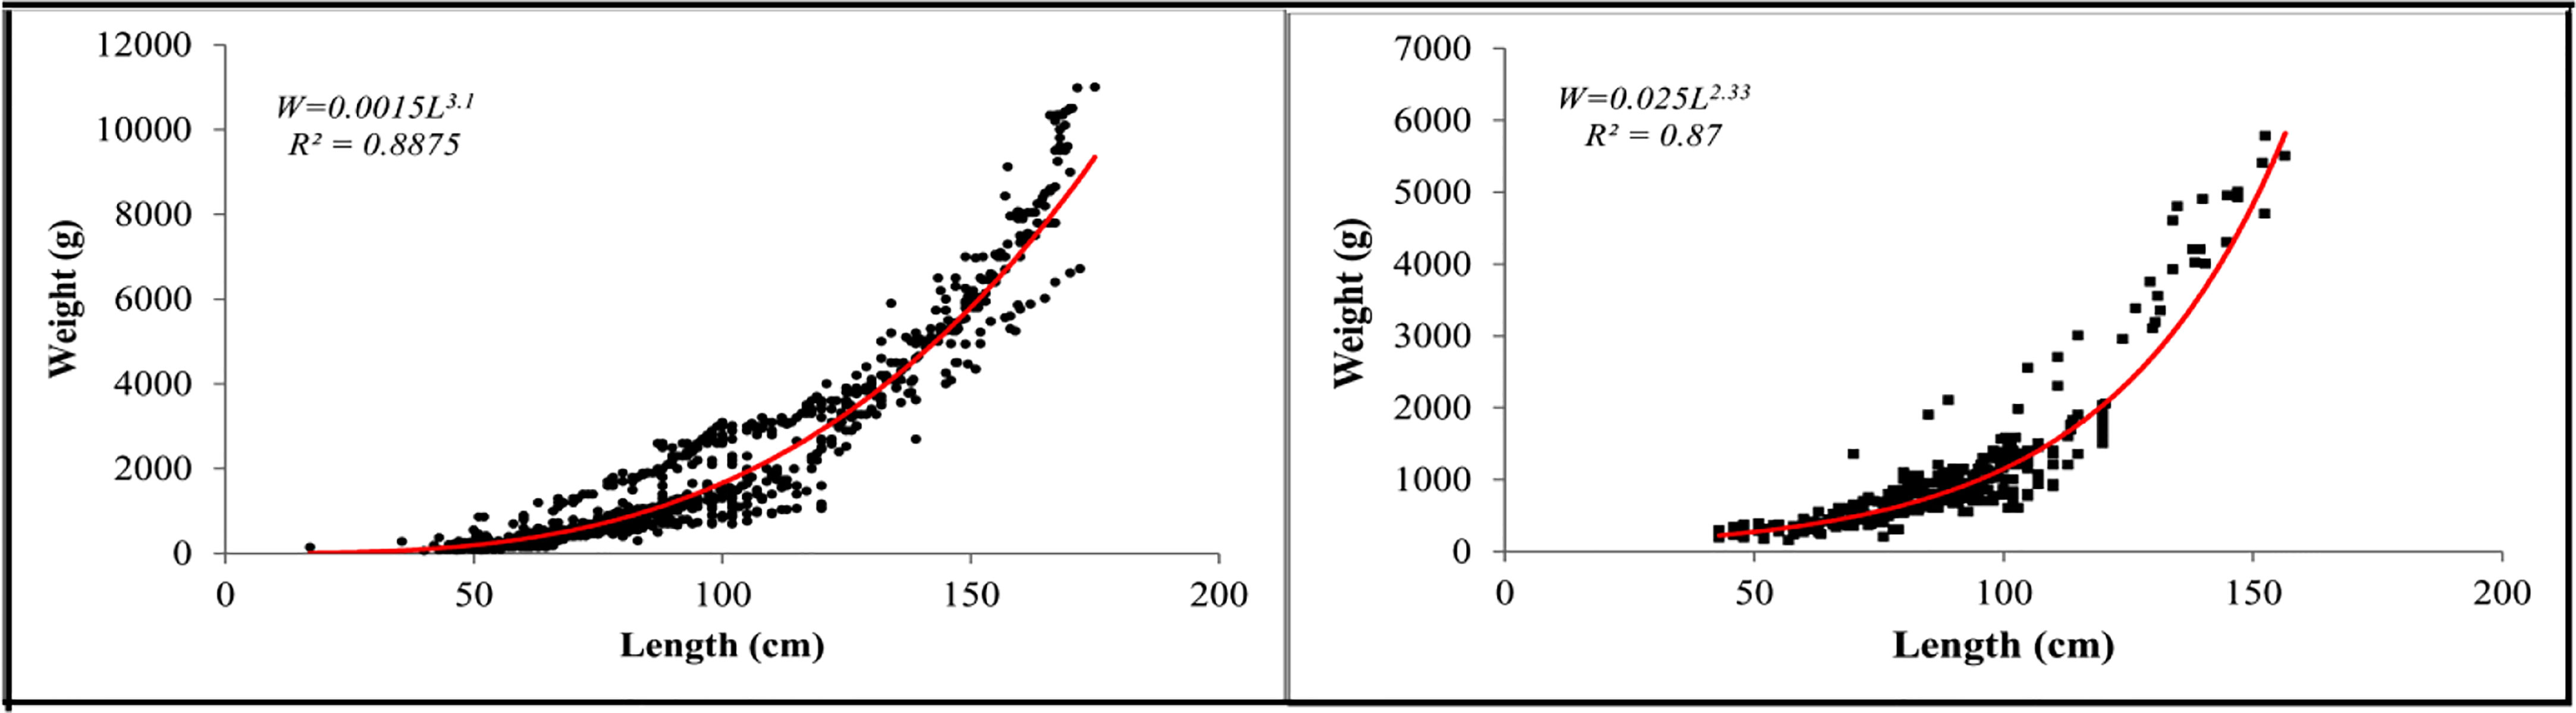
Figure 4 Length-weight relationship of black eel (left) and brown eel (right) from Bangladesh marine waters.
3.2 Results of growth parameters and mortality estimation by TropFishR
3.2.1 Growth parameters
The growth parameters were determined using the von Bertalanffy growth equation of Electronic Length Frequency Analysis (ELEFAN) in the TropFishR R package (Table 2 and Figure 5). For black eel, the estimated growth parameters were 190.67 cm for L∞ and 0.18 year-1 for the growth coefficient and for brown eel, the estimated growth parameters were 166.63 cm for L∞ and 0.16 year-1 for k. The value of k indicated both species of eel would grow at a slow rate to reach the asymptotic lengths if given the option to develop spontaneously. The goodness of fit value (Rn) of 0.22 for the black eel and 0.25 for the brown eel was found in the growth performance indexes (Φ′), which were 3.63 for the black eel and 3.59 for the brown eel. The same values (0.40) of tanchor for both black and brown eels indicate growth curves when approaching length zero were on 26 May.
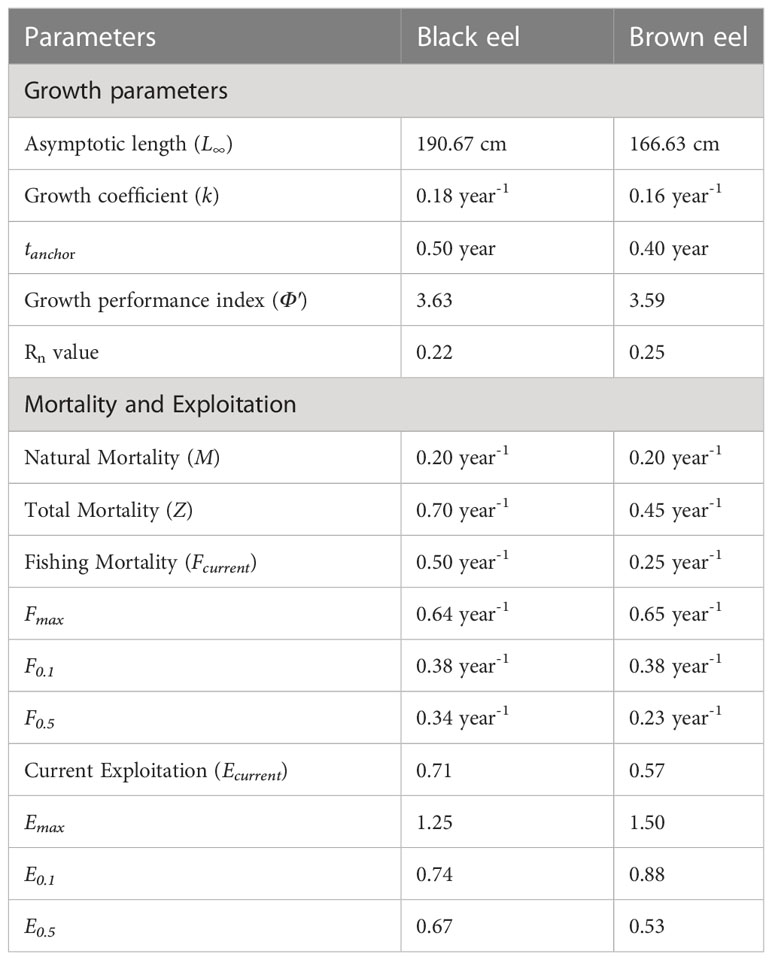
Table 2 Growth parameters, mortality, and exploitation rates of eels assessed by TropFishR.
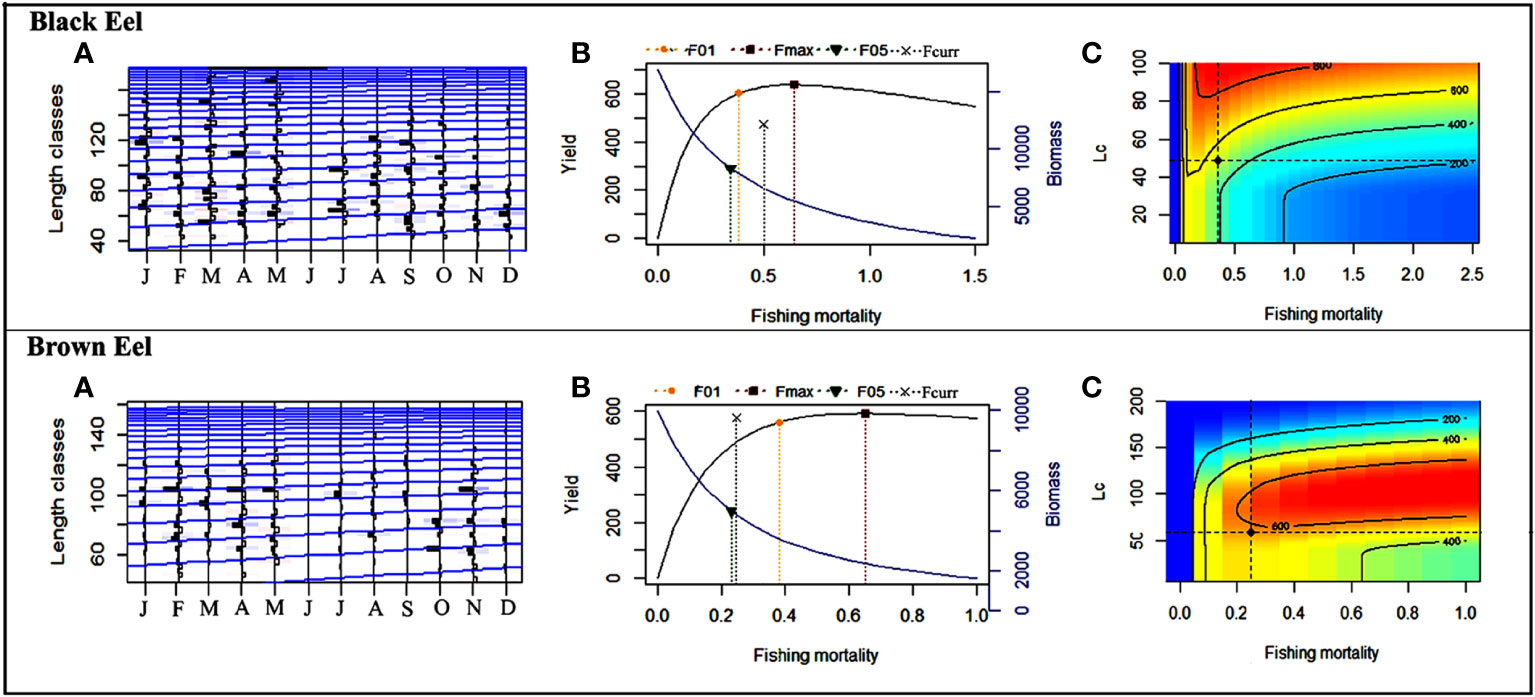
Figure 5 The result of TropFishR shows: For Black eel, (A) the von Bertalanffy growth curve and length-frequency distribution of the Black eel (L∞ = 190.67 cm, k = 0.18 year−1); (B) the green, violet, yellow and black dashed lines represent F0.5 = 0.34 year−1, Fmax = 0.64 year−1, F0.1 = 0.38 year−1 and Fcurrent=0.50 year−1 respectively; (C) relative YPR contour map in response to different fishing mortality and different length at first capture (Lc) of 48.87 cm. For Brown eel, (A) the von Bertalanffy growth curve and length-frequency distribution of the Brown eel (L∞ = 166.63 cm, k = 0.16 year−1); (B) the green, violet, yellow and black dashed lines represent F0.5 = 0.23 year−1, Fmax = 0.65 year−1, F0.1 = 0.38 year−1 and Fcurrent=0.25 year−1 respectively; (C) relative YPR contour map in response to different fishing mortality and different length at first capture (Lc) of 58.89 cm.
3.2.2 Exploitation and fishing mortality
Based on a linearized length-converted catch curve, total mortality (Z) was calculated using TropFishR computer package. Z has been calculated to be 0.70 year-1 for black eel and 0.45 year-1 for brown eel. The natural mortality rate (M) was found to be 0.20 year-1 for both black eel and brown eel. The fishing mortality rate (F) was estimated to be 0.50 year-1 for black eel and 0.25 year-1 for brown eel by subtracting M from Z. The estimated and compiled biological reference points for fishing mortality and exploitation are displayed in Table 2. The catch curve and the output of the YPR model are depicted visually in Figures 5A, B. The estimated current fishing mortality (Fcurrent =0.50 year-1) is higher than presumed Fmsy (F0.1 =0.38 year-1) and lower than the maximum reference fishing mortality (Fmax = 0.64 year-1) for black eel. In brown eel, the estimated current fishing mortality (Fcurrent =0.25 year-1) is lower than both F0.1(=0.38 year-1) and Fmax (=0.65 year-1). The estimated current exploitation rates, Ecurrent for both black eel (=0.71) and brown eel (=0.57) was higher than the threshold exploitation rate (Eopt=0.5 (Le Cren, 1951) and lower than the maximum exploitation rate for both black eel (Emax=1.25) and brown eel (Emax=1.50).
For the black eel, the length at first capture (Lc) was determined to be 48.87 cm and the length at 95% probability of capture was 56.32 cm, given the current level of gear selectivity when the total mortality (Z) is 0.70 year-1. For brown eel, the length at first capture (Lc) was estimated to be 58.89 cm and the length at 95% probability of capture was 69.77 cm, given the current level of gear selectivity when the total mortality (Z) is 0.45 year-1. The highest yield of the YPR model can be achieved when Fmax and Emax are 0.64 year-1 and 1.25, respectively for black eel and 0.65 year-1 and 1.50, respectively for brown eel. Half of the stock biomass may also be obtained as the annual yield when F0.5 and E0.5 were at 0.34 year-1 and 0.67, respectively for black eel and 0.23 year-1 and 0.53, respectively for brown eel. The biologically optimum yield for both marine eels could be attained when F0.1 =0.38 year-1 and E0.1 =0.74 for black eel and F0.1 =0.38 year-1 and E0.1 =0.88 for brown eel.
3.3 Results from length-based spawning potential ratio
3.3.1 Estimation of life history ratio and size of maturity
Two LHR (L∞ and M/k) were extracted from the findings of TropFishR analysis and used as input parameters for LB-SPR analysis. LB-SPR’s input parameters were then calculated from the sizes at which 50% (L50%) and 95% (L95%) of maturity were reached (Table 3).
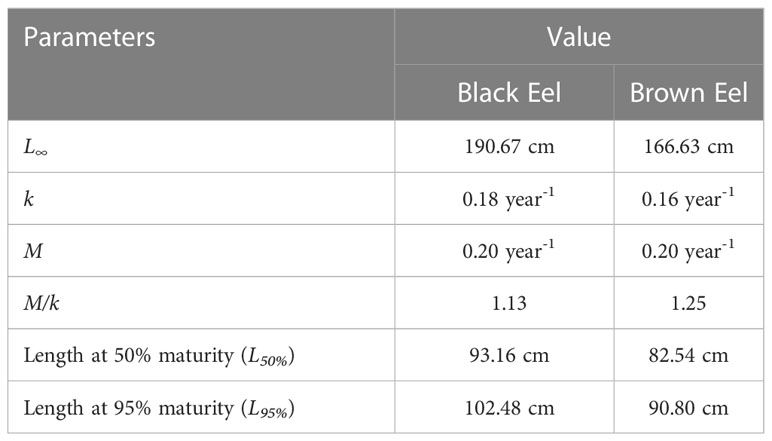
Table 3 Input parameters for LB-SPR analysis.
3.3.2 Length selectivity and maturity
The mean estimates of 50% selectivity (SL50%) and 95% selectivity (SL95%) for black eel were 50.22 cm and 58.05 cm respectively, while the mean estimates for brown eel were 60.01 cm and 77.06 cm, showing that a small meshed net is utilized in fishing (Table 4). Selectivity curves of fishing gear for both types of eels were drawn (Figure 6). The ogive curve demonstrated that the mean length of black eels at the time of their initial capture was approximately one-half of the mean length at the time of their maturity. The fact that the average estimate of F/M for black eel was 1.14 and for brown eel, it was 1.3, both of which are higher than the threshold of F/M=1, indicates that additional fishing efforts have been put out into the fishery.
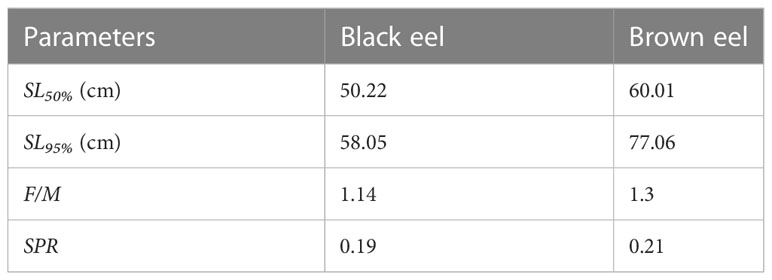
Table 4 Outputs from LB-SPR analysis.
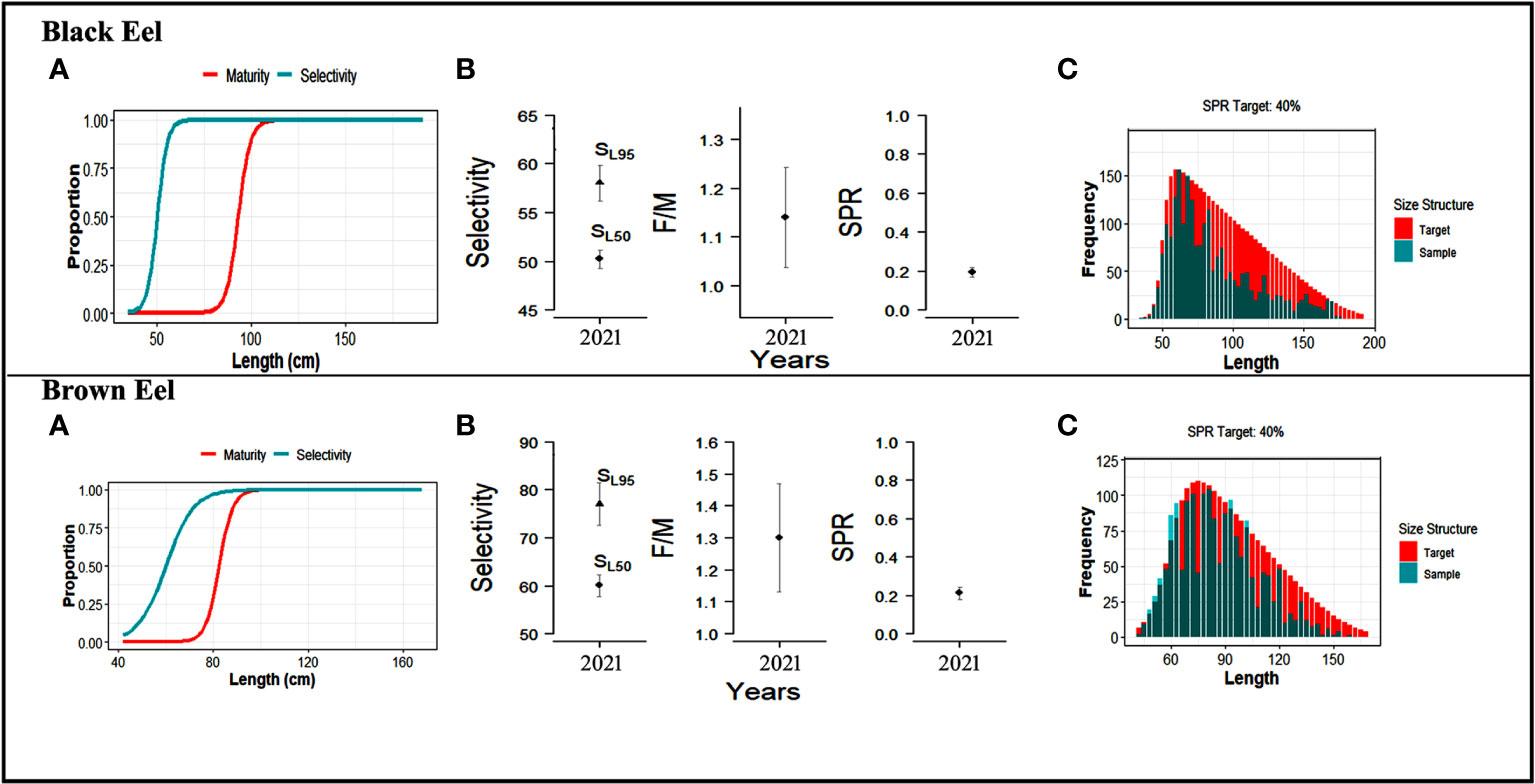
Figure 6 The result of the LB-SPR model shows: For Black eel, (A) Maturity and selectivity curve from the fitted LB-SPR model when L50% = 93.16 cm and L95% = 102.48 cm; (B) the distribution of mean selectivity parameters (SL50% and SL95%), fishing mortality to natural mortality (F/M=1.14), and spawning potential ratio, SPR=0.19; (C) Observed size data (sample) against an estimated size composition at a target SPR (0.4). For Brown eel, (A) Maturity and selectivity curve from the fitted LB-SPR model when L50% = 82.54 cm and L95% = 90.80 cm; (B) the distribution of mean selectivity parameters (SL50% and SL95%), fishing mortality to natural mortality (F/M=1.3), and spawning potential ratio, SPR=0.21; (C) Observed size data (sample) against an estimated size composition at a target SPR (0.4).
The values of the spawning potential ratios, selectivity parameters, and ratio of the fishing and natural mortality rates are given in Table 4.
3.3.3 Spawning potential ratio
This analysis revealed that the SPR for the years 2021-2022 of 19% for black eels and 21% for brown eels is close to the limit reference point (LRP) of 20%. It is assumed that the length composition data used in this study are steady-state data (Hordyk et al., 2015a; Hordyk et al., 2015b) (Figure 6C and Table 4). Since the calculated SPRs (0.19 and 0.21) are well below the desired reference point (0.40), the stock is formally considered overfished. The use of a lower-meshed trawl net in the fishery is demonstrated by other metrics too, such as mean length at initial capture smaller than the length at maturity (50.22cm< 93.16cm for black eel, and 60.01cm< 82.54cm for brown eel).
3.4 Results from length-based indicators
According to the data analysis of the catch composition, only 13.82 percent and 33.22 percent of the fish were of optimum sized (Popt) for black eel and brown eel, respectively, while 30.15 percent and 52 percent of the fish were of mature size (Pmat) for those species. The proportion of older, larger fish, known as mega-spawners (Pmega), was 16.34% for black eel and 18.64% for brown eel (Table 5). Maximizing marine eel fisheries production requires targeting length classes (Lopt ± 10% of Lopt) between 94 cm and 114 cm for black eel, and between 82 cm and 101 cm for brown eel (Figure 7).
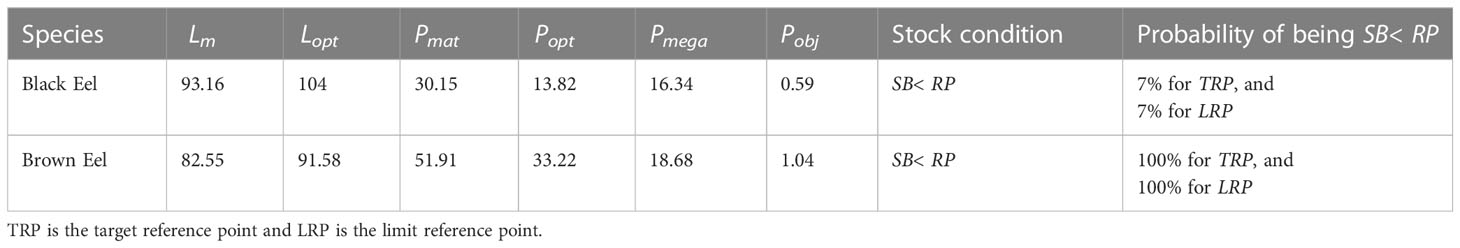
Table 5 The result of LBI based on the indicators, and a decision tree proposed by Froese (2004) and Cope and Punt (2009) respectively.
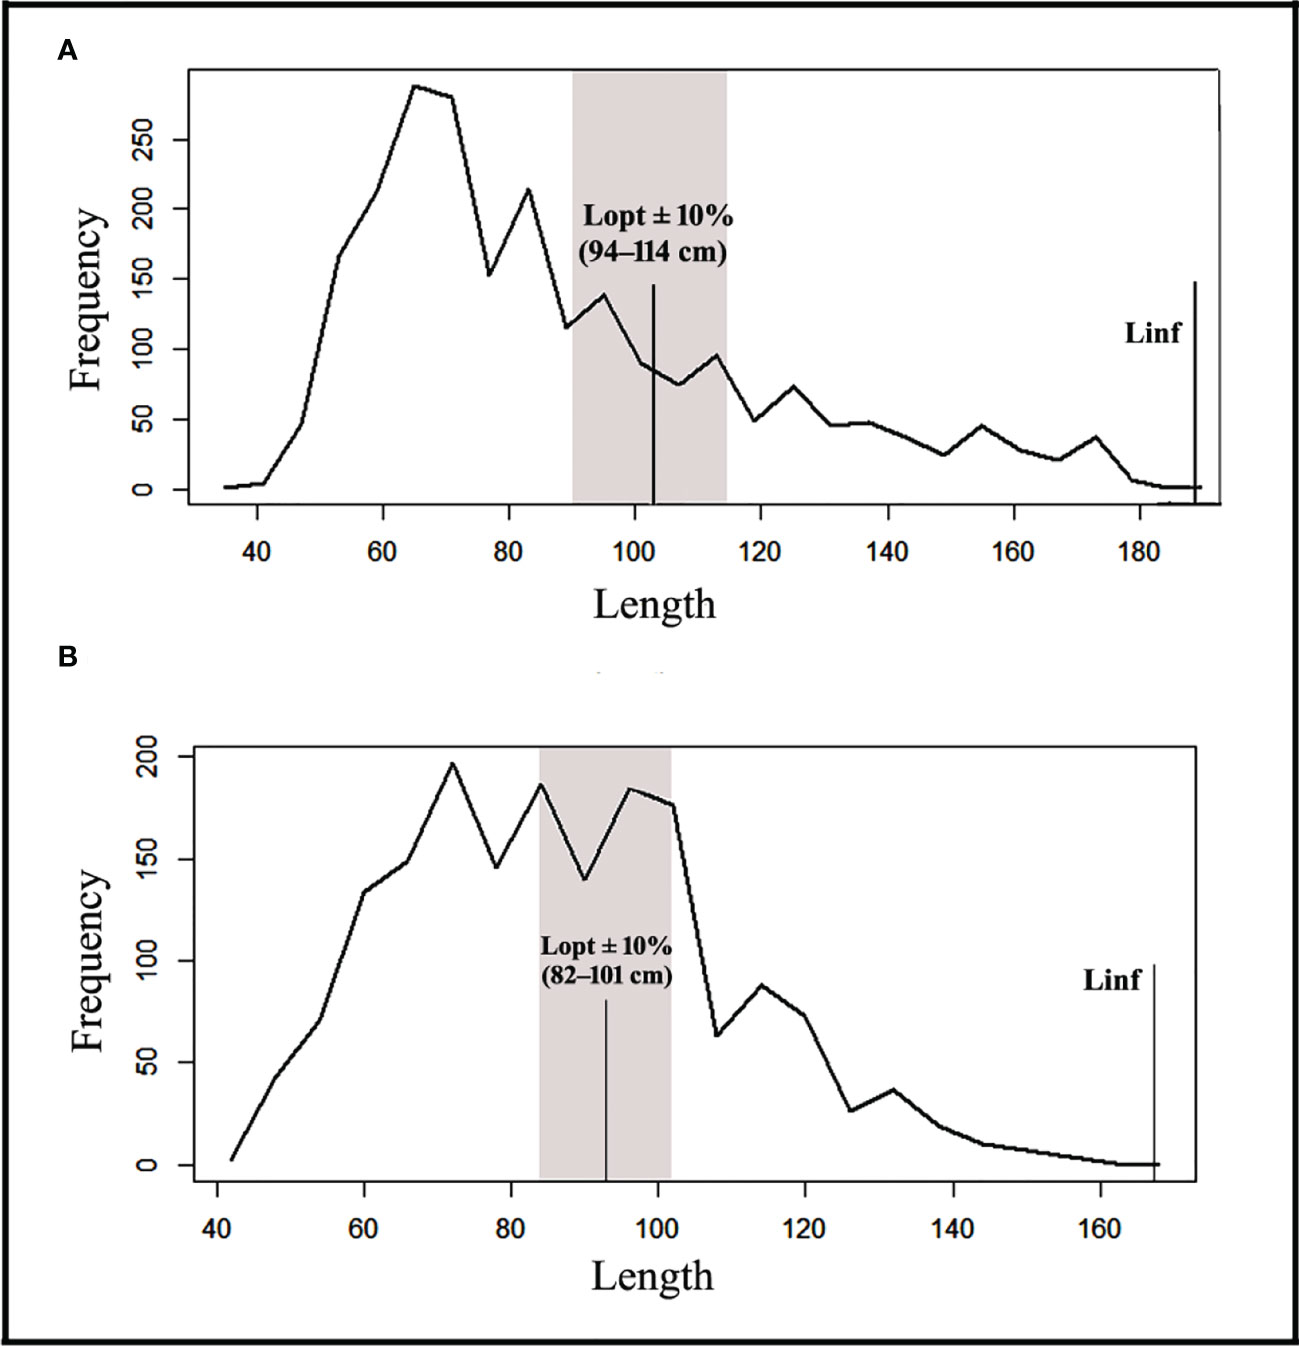
Figure 7 Length frequency distribution of the Black eel (A) and Brown eel (B) show the L∞, Lopt, and Lopt ± 10% of Lopt.
In the decision tree, the sum of the three proportions (Pmat, Popt, and Pmega) is called Pobj (0.59 and 1.04 for black eel and brown eel respectively) and provides comprehensive information for distinguishing selectivity patterns. However, using the decision tree showed that both eel stocks were likely to be overfished, with probabilities of overfishing were 7% for black eel and 100% for brown eel in the target reference point (TRP) and the limit reference point (LRP), respectively.
3.5 Results from DB-SRA
3.5.1 Landing trend
The maximum catch of 646 mt for marine eels was observed in 2019. In the final year of the data (2022), the catch was 597 mt, which was 264 mt in 2006. From 2011 through the end of the study, catch rates rose steadily with minor fluctuations (Figure 8A).
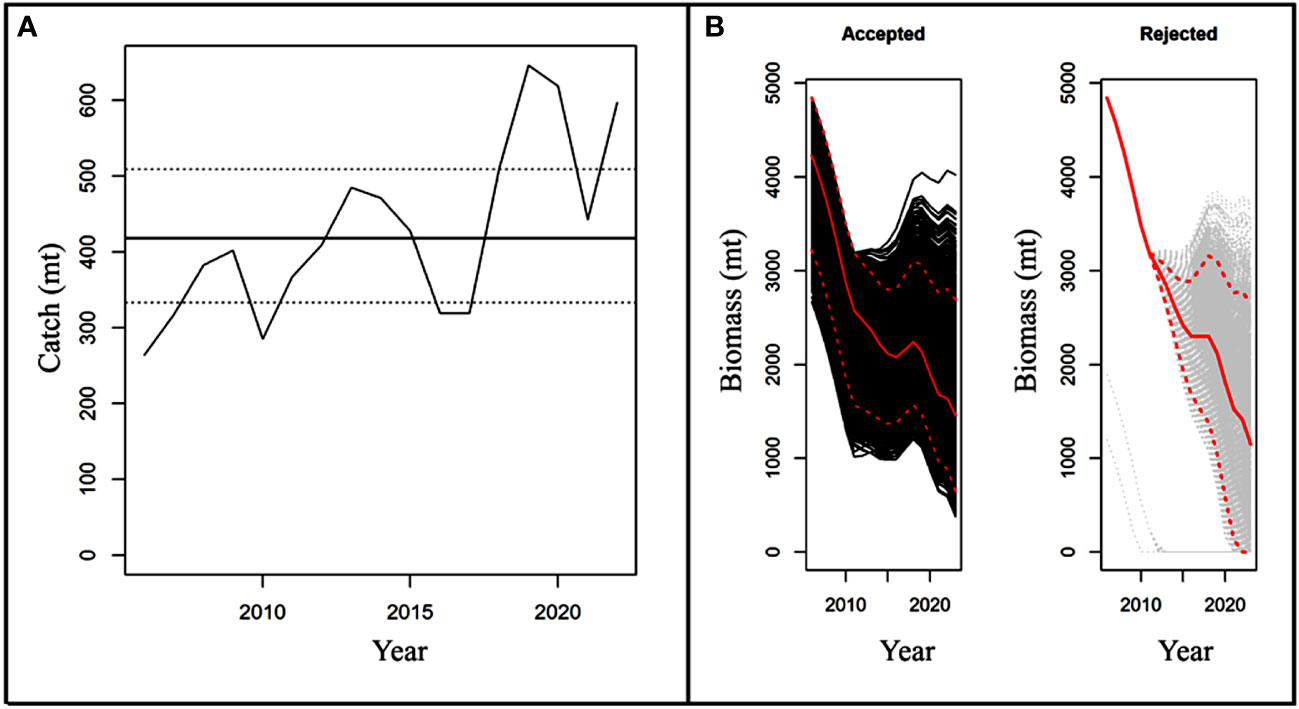
Figure 8 Shows (A) Historical catches of eels with MSY estimates; (B) Biomass projections for eels from accepted (black) and rejected (white) model runs.
3.5.2 Stock analysis based on DB-SRA model results
The mean carrying capacity (K) of the population was 5576 metric tons before the start of commercial fishing. As a result, fishing has reduced the biomass of the population by more than 72% (assuming K = initial biomass). The estimated mean MSY for marine eel is 419 metric tons, however from 2013 through the end of the study year, this level was exceeded by slightly lower in consecutive years from 2016 to 2017 (Figure 8A). As a result, population biomass declined below the mean of the estimated BMSY of 2309 metric tons (Table 6; Figures 8B, 9A).
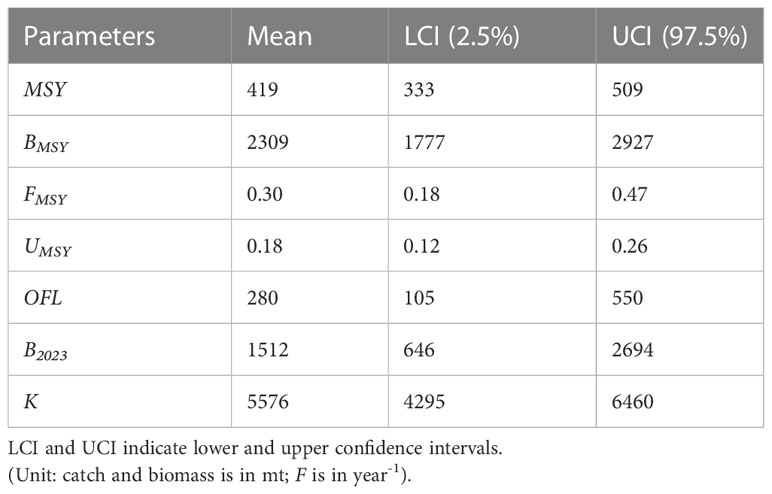
Table 6 Parameters estimate from DB-SRA model with 95% CI.
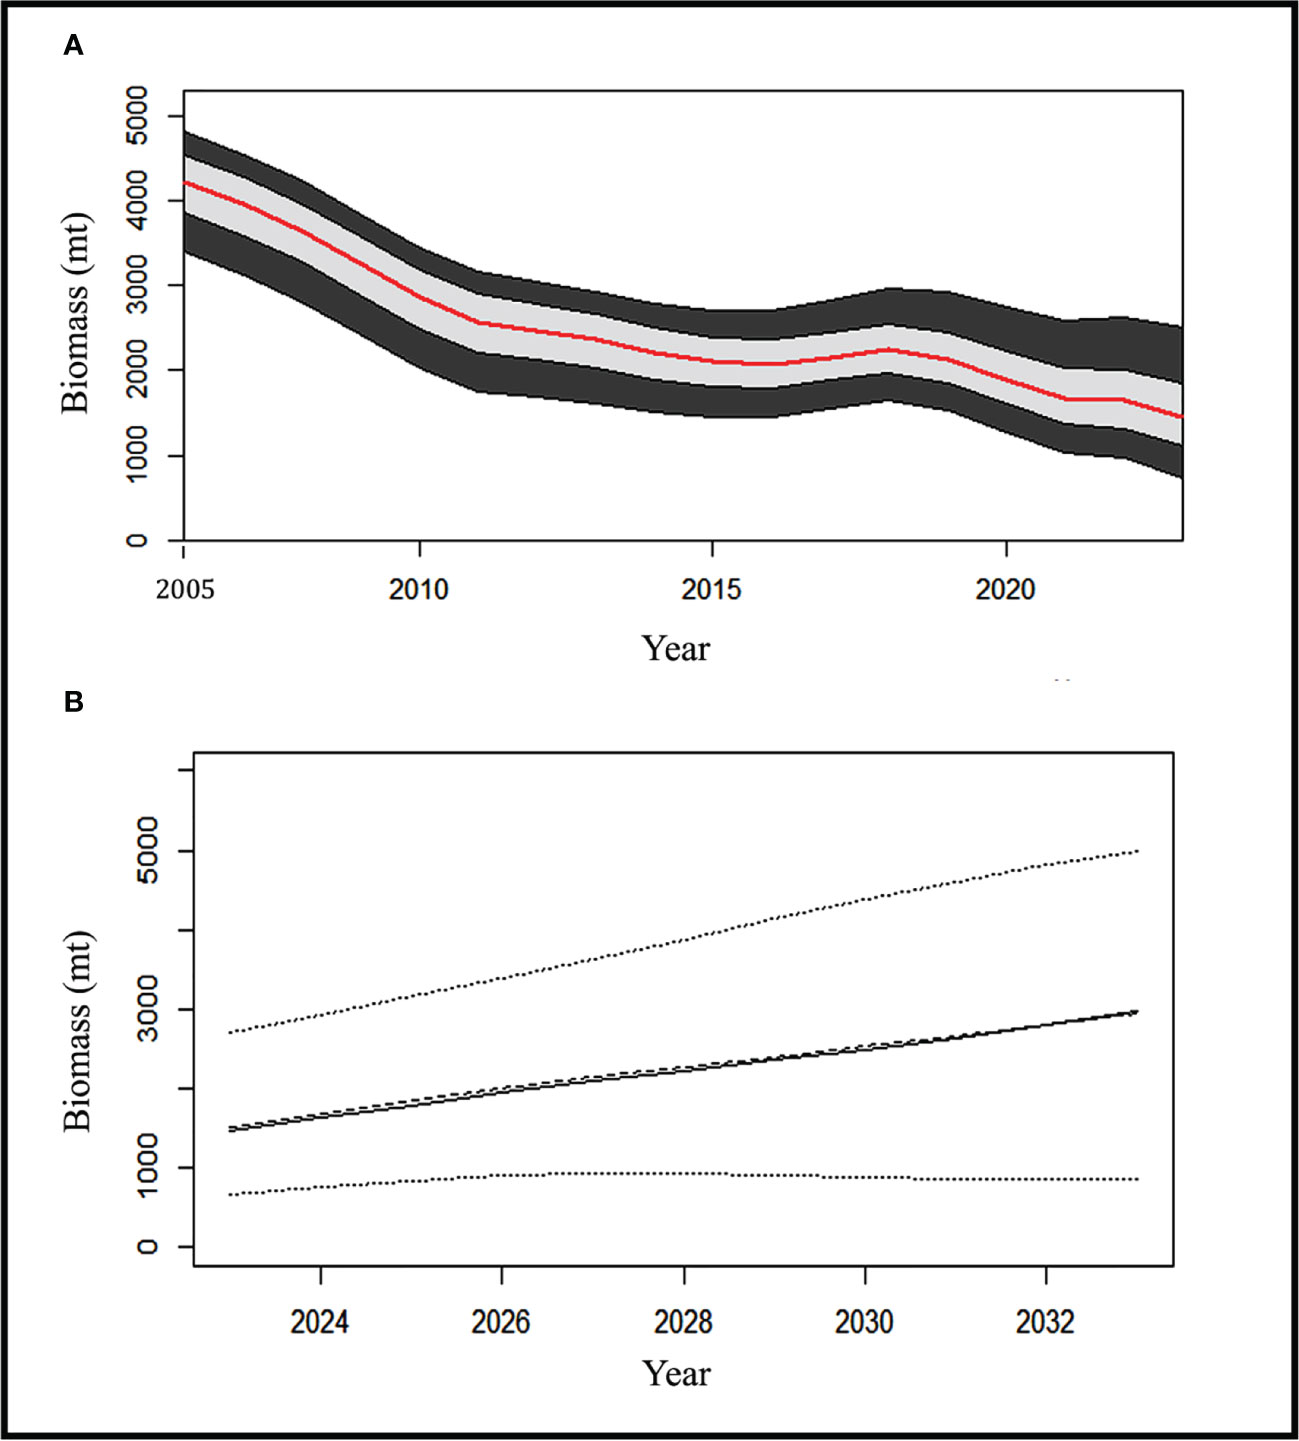
Figure 9 shows (A) Biomass trend with 90% (black) & 50% (grey) CI for eel fishery during study years; (B) When catch quota is 250mt, biomass projection for the next ten years with CI (Dots indicate the BMSY for the respective years).
Since the predicted MSY values from 2013 to the end of the time series were less than the recorded catches except some dip in 2016 and 2017, this suggests that the fisheries are continually overfished every year, with an exploitation rate that is much greater than the mean UMSY estimates of 0.18. After the study year (2022), eel biomass was at its lowest point, and estimates for the reference year (2023) reveal that it will not be able to produce MSY (B2023<BMSY) if removal rates (Figure 9A) are maintained at their current levels.
The yearly landing limit of 250 metric tons (below OFL) has resulted in steady biomass growth, reversing the trend of continuous stock biomass decline for the eel population. After 10 years, the biomass of this species will have increased by 95% (2,945 mt) with this current annual catch limit (Figure 9B).
3.6 Results from CMSY
From 2012, the catch statistics showed a steady rise (Figure 8A). The catches of the Eel population were close to MSY in 2013 and 2014 but exceeded this predicted MSY of 491 mt from 2018 (Figure 10; Table 7). The ratio of estimated fishing mortality, F to FMSY was higher than 1, indicating that overfishing was going on. Relative biomass estimates were close to BMSY of 1740 mt, but at the end of the study year (2022), they were below the threshold (0.94). The changes in the stock status of eel fishery over the years show a tendency to move from a healthy stock to an overfished stock conducted by overfishing pressure at the end of the study (Figure 10; Table 7).
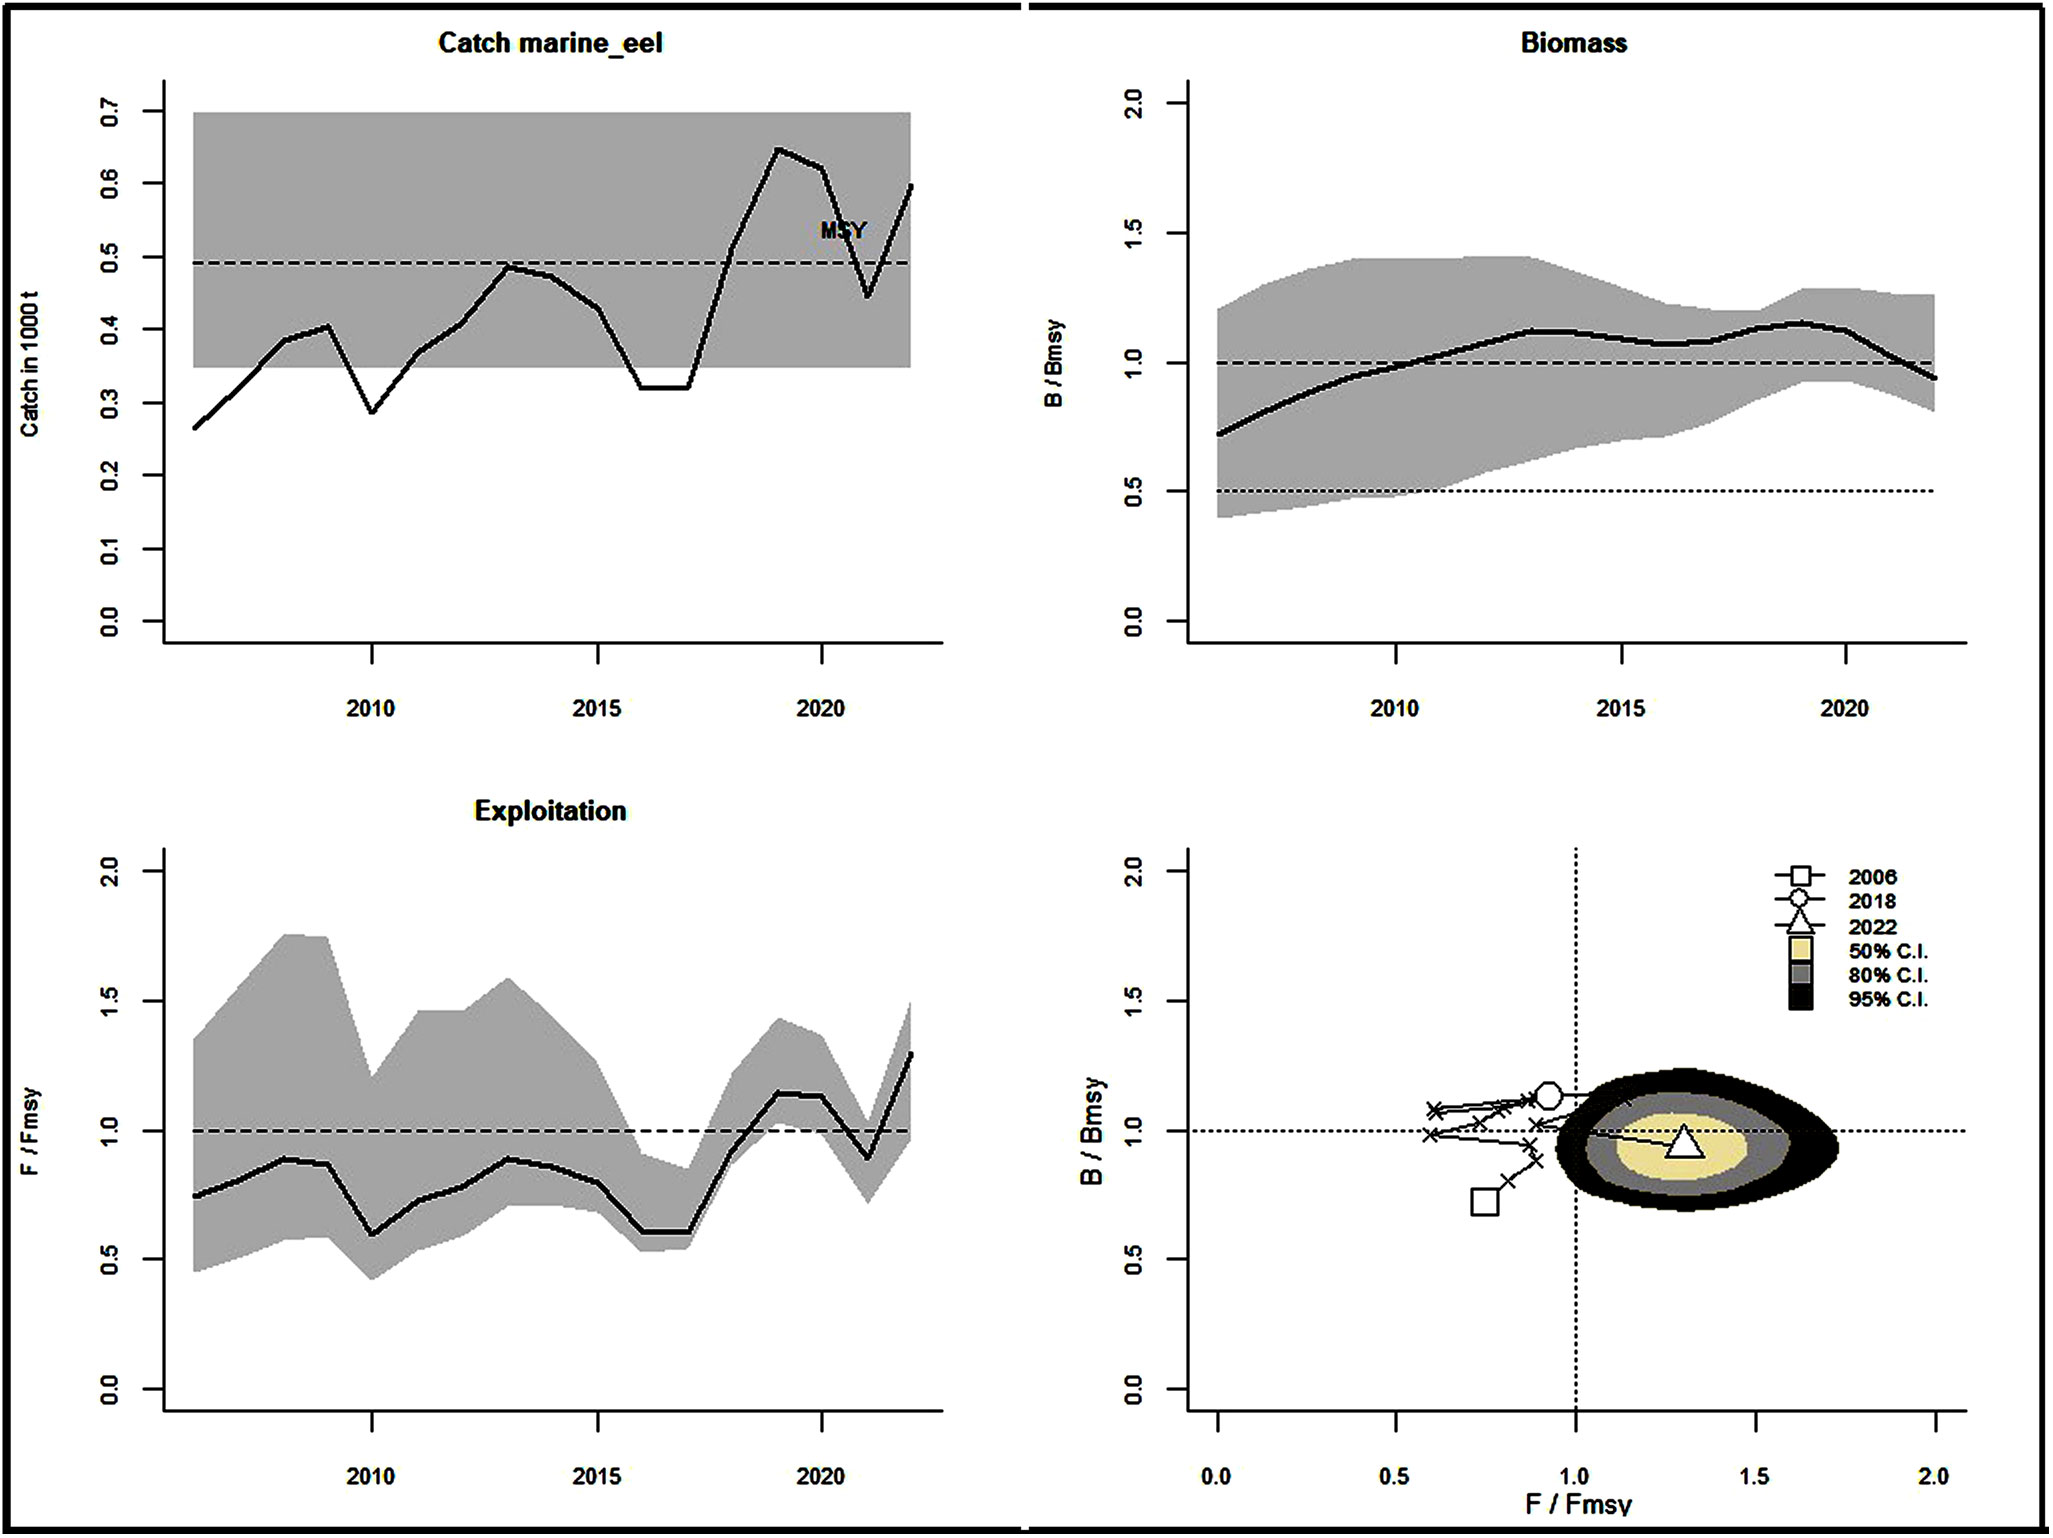
Figure 10 The schematic output of the CMSY algorithm. Time series catches relative to estimated MSY are shown in the upper left panel with a 95% confidence interval (grey). The upper right and lower left panels indicate the movement of relative biomass (B/BMSY) and exploitation (F/FMSY), the lower right panel shows changes in the stock status of eel fishery over the years with 50% (off-white), 80% (grey) and 95% (black) confidence intervals.
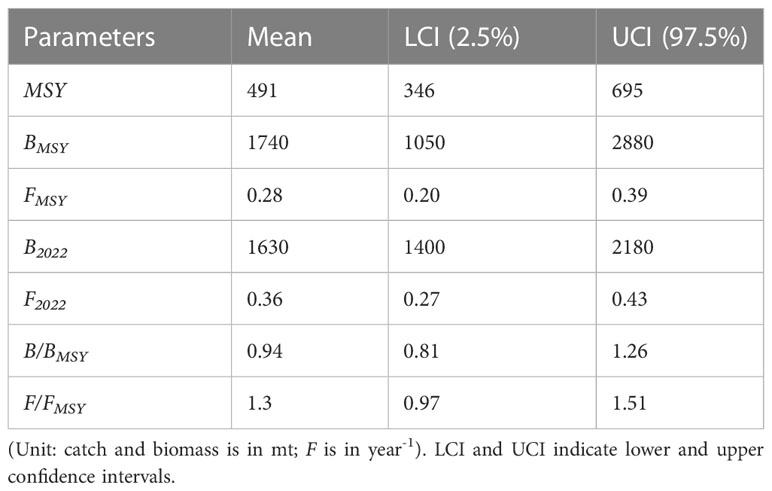
Table 7 Parameters estimate from CMSY model with 95% CI.
4 Discussion
4.1 Length-weight relationship
Before executing TropFishR, the length-weight parameters ‘a’ and ‘b’ were determined because they are used as input parameters for YPR analysis within the package. Seasonally, the regression coefficients (b) of the weight-length relationship of the eels may vary. The captured black eels appear pretty hefty. The variance of the exponential value of the length-weight relationship, as represented by the ‘b’ value, is greater in the black eel than in the brown eel. The ‘b’ value, therefore, implies slightly positive allometry for black eels and negative allometry for brown eels (Wootton, 1992; Piria et al., 2014). Positive allometry in fish may be attributable to greater proficiency in feeding (Saikia et al., 2011) and improved environmental conditions for the species’ existence. Bura Gohain and Goswami (2013) also observed the effect of food availability and other parameters linked with positive allometric growth. This is because eels can easily hunt their natural food source. This length-weight relationship in fishes can be affected by habitat, area, seasonal effect, degree of stomach fullness, gonad maturation, sex, health, and variances in observed length ranges, among others (Tesch, 1971). Tesch (2003) found that the seasonal dietary patterns of tropical eels differed significantly from those of their temperate counterparts. Compared to the winter season, eels take more food during the summer. The majority of studies estimating slope ‘b’ are found near this research (>2) (Table 8). The study of Koh et al. (2019) on same genus (Muraenesox cinereus) found positive allometric (b>3), which is correspondent to the estimated ‘b’ value of blackeel (M. bagio) in our study. Parameter ‘a’ of the LWR may alter daily, seasonally, or based on the type of environment, while ‘b’ does not vary significantly over the years (Bagenal and Tesch, 1978).
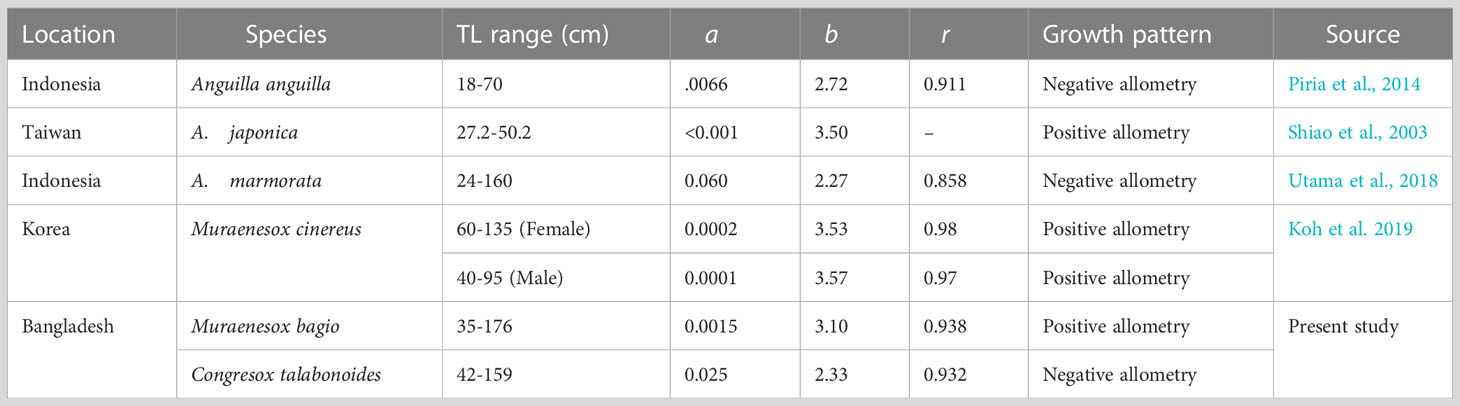
Table 8 Estimates of the relationship between the body weight-length of different species of eels from several regions of the world.
4.2 Size category
Length frequency composition revealed a length range of 35 to 176 cm for black eels and 42 to 159 cm for brown eels as total length (TL). The size distribution reveals that the average length of collected black eel specimens is 105.5 cm, with 77% of samples below this length class, whereas the average length of collected brown eel samples is 100.5 cm, with 75% of samples falling below this length class. This depicts a higher proportion of young fish in the catch for both eels.
4.3 Growth parameters, mortality, and exploitation
Using length composition data, the von Bertalanffy Growth Function (VBGF) model generates a growth curve under the premise that the model follows the assumption (Pitcher and Hart, 1982). For successful fisheries management, a thorough conception of the species’ life history parameters (Hilborn and Walters, 1992) is recommended. A remarkable variation among the growth parameters has been observed in different stock studies on eels (Table 9).
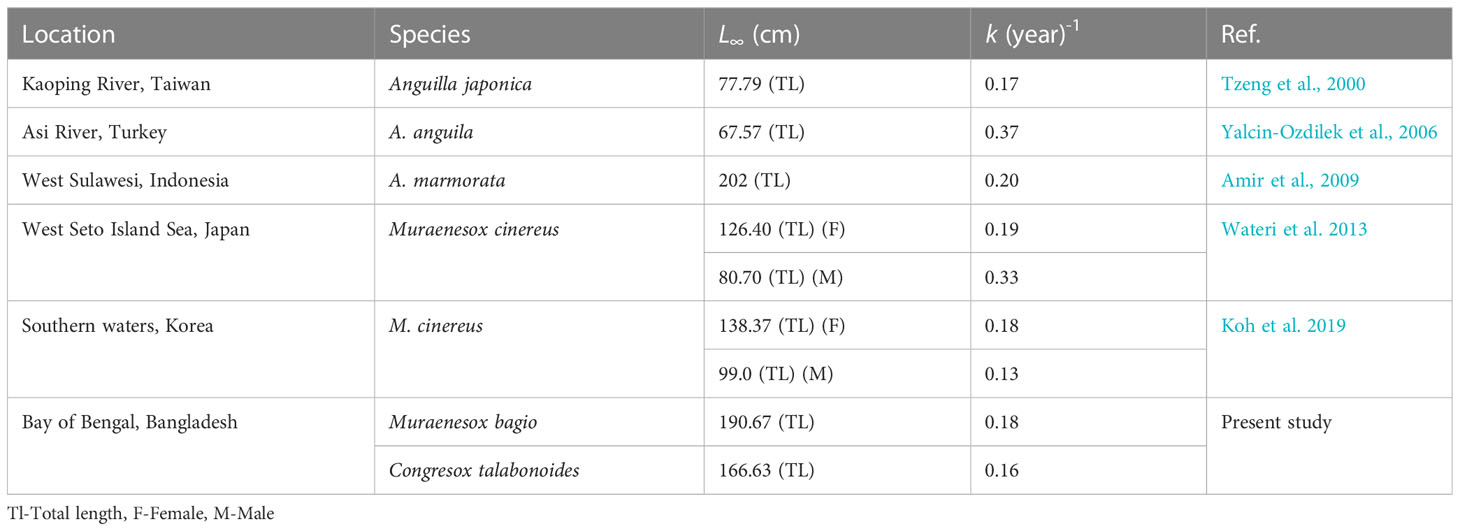
Table 9 Summary of estimated population parameters of eels in different water bodies of the world.
The growth parameters of length infinity (L∞) for the black and brown eels in the present study were found to be 190.67 cm and 166.63 cm, respectively, while the growth coefficients (k) were 0.18 year-1 and 0.16 year-1, respectively (Figure 4), which are both consistent with other studies of k of various eel species from different regions (Table 9), specifically the study on Muraenesox cinereus (Watari et al., 2013; Koh et al., 2019). When compared to the maximum observed lengths of 175.5 cm and 156.5 cm for black eels and brown eels, respectively, the calculated asymptotic lengths, L∞=190.67 cm and 166.63 cm for both species, were seen in the present investigation, which falls within the accepted range. In comparison to other research conducted in other parts of the world, the L∞ and growth coefficient (k) exhibit results that are comparable to those of other regional researches (Table 9). The lower ‘k’ value indicates that it has required a longer time to reach the asymptotic length and increase the life span as well (Hunter et al., 2015). Accordingly, the life span of a black eel would be 16.66 years and that of a brown eel would be 18.75 years.
Studies on the eel’s growth strategies were mainly observed to conduct in freshwater eels and temperate regions (Table 9) (Tzeng et al., 2000; Yalcin-Ozdilek et al., 2006; Amir et al., 2009). k and L∞ growth parameters revealed that there was a difference in those parameters between different species and geographic regions, such as those collected in tropical and others caught in temperate regions. Therefore, the growth parameters were found to be varied between the two studied species of black and brown eels. During a species’ life span, growth parameters might also be altered based on the stock. Due to sex differences and environmental conditions, the growth of the series of the cohort in a particular species may vary. Sex differences are typically easy to detect based on their rate of growth (Sparre and Venema, 1998). The eel’s growth parameters are not uniform. All those growth parameters of L∞, K, and t0 are supposed to be influenced by some factors like sex, water column depth, and population size (Tesch, 2003).
Creating a sustainable management plan for an exploited fish stock is required to tune the existing and desired levels of fishing mortality and exploitation. In the study on fish populations, there are two categories of mortality: natural mortality (M) and fishing mortality (F). In this investigation, natural mortality was estimated using the method suggested by Then et al. (2015). Based on length data, the catch curve was linearized to estimate the total mortality rate (Z). For black eels, Z was found to be 0.70 year-1, M to be 0.20 year-1, and F to be 0.50 year-1. For brown eels, Z was found to be 0.45 year-1, M to be 0.20 year-1, and F to be 0.25 year-1. Here, the current fishing mortality was above M for both black and brown eels, which indicates present fishing strategy is not within sustainable limits. It is fact that fishing mortality is heavily influenced by natural mortality, which is largely dependent on several variables (King, 1997). Ideally, fishing mortality is equal to natural mortality. But it is observed a higher F than M that addresses considering the result of other assessment methods before drawing any conclusion.
Besides, another key parameter of TropFishR package is exploitation, which is 0.71 for black eels and 0.57 for brown eels. When the exploitation ratio is greater than 0.5 or the condition is , the stock is regarded as overfished (Gulland, 1971). The eel populations in Bangladesh’s industrial fisheries have been overfished as a result of fishing operations carried out by highly modernized active fishing trawlers. In addition to a variety of commercially important species, both eels are landed by active fishing gears with high exploitation rate than recommended. Additionally, the mean length at first capture, Lc for black eels (=48.87 cm) and brown eels (=58.89 cm) shows significant losses of juvenile fish from the stock. However, to prevent overexploitation, it is advised to allow young spawners to breed at least once during their lifetime (Martell and Froese, 2012).
In comparison to other investigations, the present study estimated the lowest natural mortality. In this calculation, the M/k ratio for black and brown eels was 1.13 and 1.25, respectively, falling within the range of 1.12 to 2.50 for the majority of fish species (Beverton and Holt, 1957).
4.4 Stock condition analysis based on LBSPR
In a population that is being heavily fished, the Spawning Potential Ratio (SPR) represents the percentage of natural, unfished reproductive production that remains (Walters et al., 2006). The SPR method has become more popular as a tool for developing a fishery management strategy, especially in poorly managed or data-limited fisheries. Using information about length data from the landing base, Hordyk (Hordyk et al., 2015b) created the straightforward SPR technique. For recruitment overfishing in a less resilient fish population, an SPR value of 40% is regarded as a proxy for the Maximum Sustainable Yield (MSY) (Nugroho et al., 2017). There has been a decline in both selectivity and adult stock, which has led to a simultaneous decrease in SPR and spawning fish size.
In this research, the outputs of TropFishR were used as input parameters for LBSPR analysis. The reason for this is that the LBSPR method is extremely delicate to the values of its input parameters (L, k, M, L50, L95). The aforementioned parameters have been shown to observe some variations among previous studies. Accordingly, it is more prudent to use input parameters from the same study rather than those from other studies (Alam et al., 2022a). The life history ratio (LHR) of M and k, were 1.13 and 1.25 for black eels and brown eels respectively, which denoted a moderately slow growth rate of eels to reach their maximum length.
As a result of incorporating LBSPR strategies into marine and coastal eel fisheries, the eel stock has been reasonably over-exploited (F/M=1.14 and 1.3 for black eel and brown eel, respectively), and the reproductive potential thereby left to the stock is low (0.19 for black eel and 0.21 for brown eel). As the SPR value drops, the proportion of smaller fish in the capture increases, indicating that the stock is overfished by young eels. Although the targeted SPR is 40%, this is not possible in many commercially exploited stocks, such as both eels stock, due to historical catch driven by indiscriminate fishing ranging from juvenile to brood fishes using gears ranging from the coastal water push net for shrimp PL collection (Barua, 2019) to deep sea trawling with poor surveillance (Alam et al., 2022a). This resulted in growth and recruitment overfishing, which has persisted in the fishery over the last decade.
If we zoom-in on our focus, we can see from eel stocks in the Bay of Bengal Bangladesh waters, the average total SPR was around 20% and the total value of F/M was greater than 1 showing that the fishing pressure was relatively high. SPR is a critical indicator for fisheries governance in data-limited fisheries like Bangladesh. The proxy of optimal effort (F40%) is recommended to maintain demersal fish life history. To maintain sustainable catches from the demersal fishery, fishermen need to keep their efforts within the Fmsy, with the use of approved mesh sizes, especially for trawling (Yonvitner et al., 2020). The sustainability of stocks can be assessed by the level of sustainability so that the risk of vulnerability and degradation can be anticipated by regulating fishing techniques to achieve sustainability in fishing operations.
4.5 Stock condition analysis based on LBI
To further analyze the catch composition, we applied the sustainability indicators developed by Froese (2004) to determine the proportion of mature fish (Pmat), optimally bigger fish (Popt), and mega-spawners (Pmega). To avoid overfishing and ensure future fish populations, a fishery’s gear selectivity should only target fish at the optimal size (Froese, 2004). Even while more juvenile and immature black eels (about 70%) and brown eels (48% of the total) were caught, the proportion of adults, or mega-spawners, was not alarmingly low (16.34 percent for black eels and 18.68 percent for brown eels). Despite this, the calculated Popt for black eel is lower (13.82%) than it is for brown eel (33.22%). Since few fish survive to breed, it follows that few fish attain sexual maturity. This finding is consistent with the LB-SPR finding that there are not many spawning-capable adults in the population (19% for black eel and 21% for brown eel). Unfortunately, fishermen frequently choose not to voluntarily employ responsible fishing gear (Eayrs and Pol, 2019), leading to an abundance of juvenile and small-sized fish in the catch. For this reason, it is usual for governments to specify either the sorts of gears that must be used or the minimum size of the mesh that must be used. Selective fishing methods increase the yield per recruit of the desired species by regulating active fishing days and decreasing the discard rate of juveniles (MacLennan, 1992). The management of mesh size was essential, but the type of mesh was also crucial. Diamond mesh is commonly used in industrial trawl nets in Bangladesh. Many fishermen avoid switching to square mesh cod-end nets because they are afraid of losing their catch. Ates et al. (2010) reported that switching a 44 mm diamond mesh cod-end to a 40 mm square mesh cod-end increased the mean retention length (SL50) in the demersal trawl fishery (Ates et al., 2010). Another study found that increased catch quality and reduced discards by switching from a 40 mm diamond mesh to a 40 mm square mesh (Rajeswari et al., 2013). Many studies have found that square meshes are extremely effective in increasing the selectivity of trawls, hence their use is strongly encouraged (Rajeswari et al., 2013; Madhu, 2018).
4.6 Parameters show the variations between the black eel and brown eel
Muraenesox bagio and Congresox talabonoides are two different species of congrid eels, which are substantially found in Bangladesh territory. The following life history parameters Table 10 that display the variations between this two eel species.
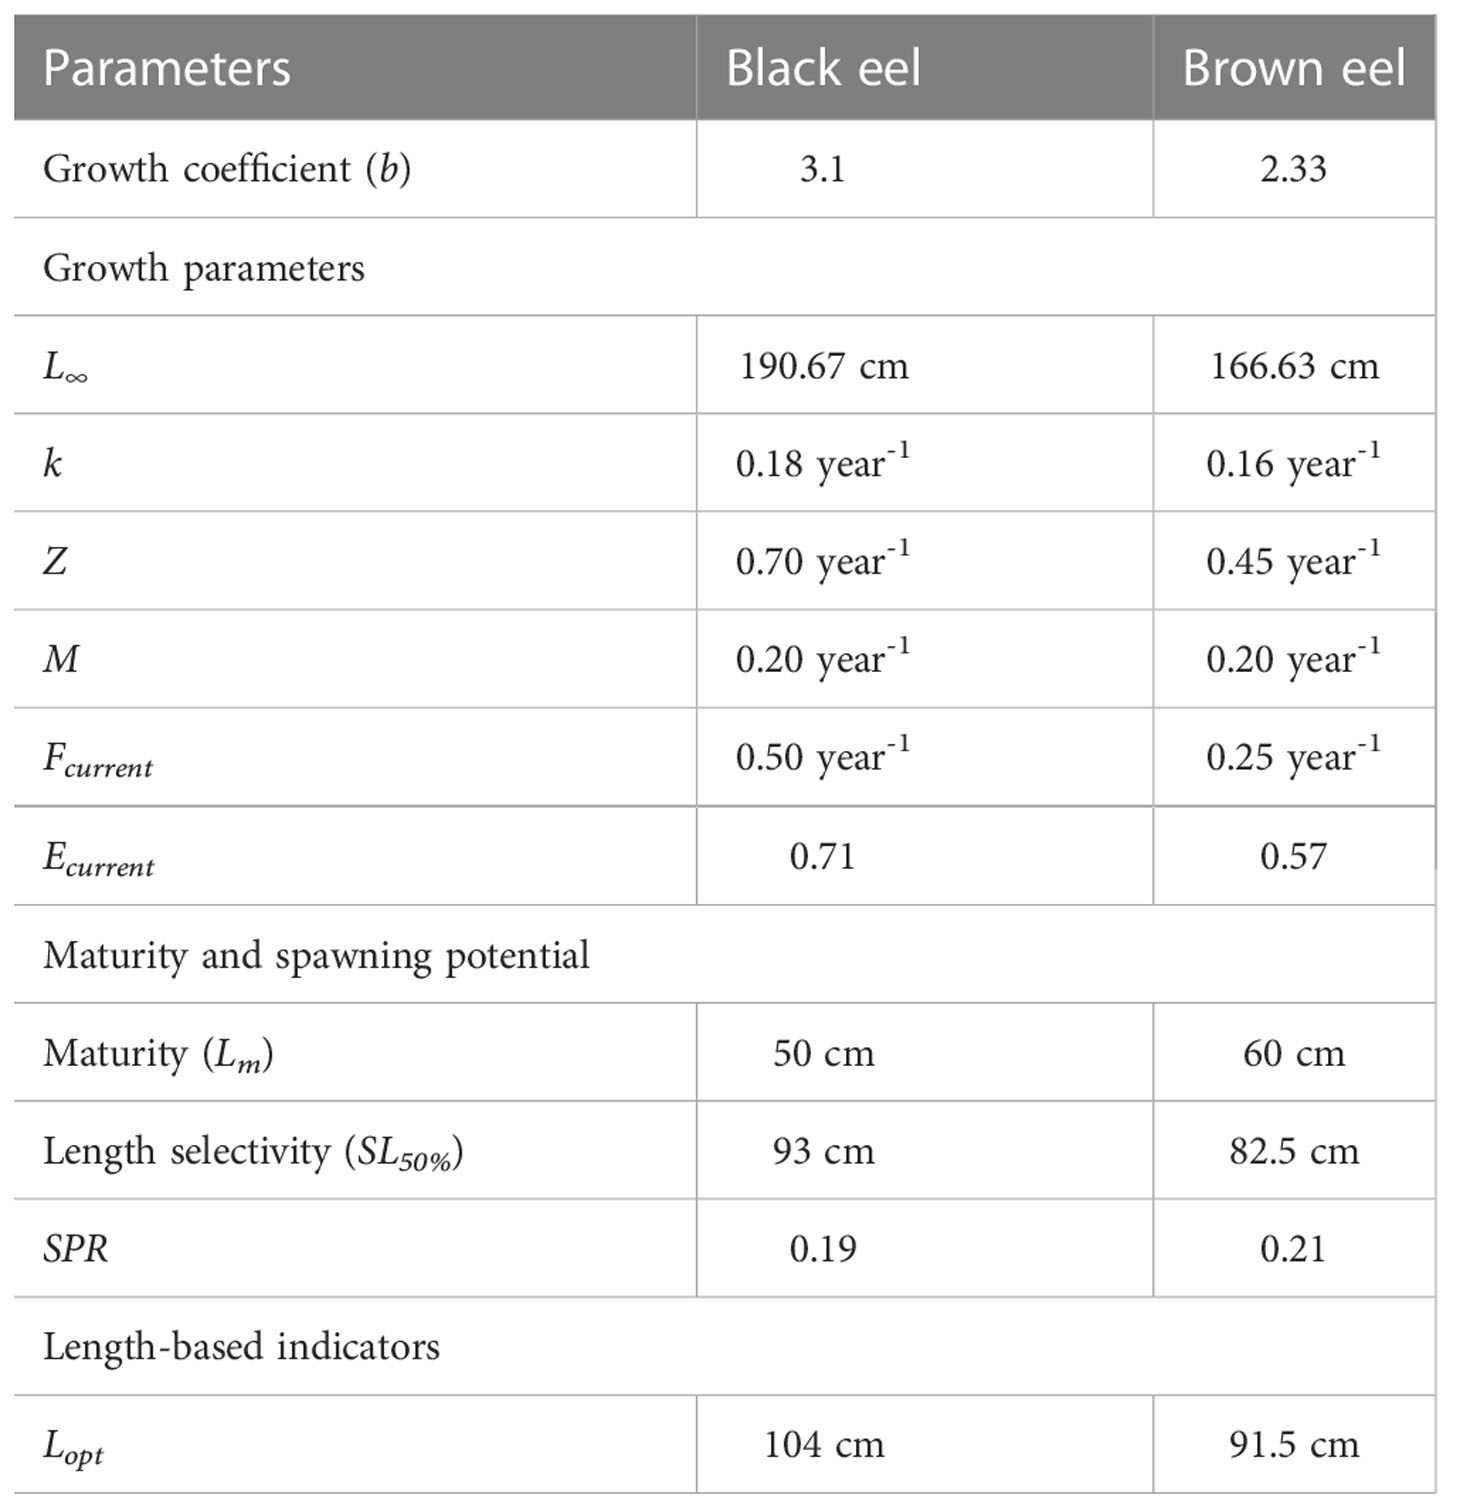
Table 10 Parameters show the variations between two eels.
4.7 Stock condition analysis based on DB-SRA
There is no time series data of eels in the national database; this study relied solely on industrial capture data to conduct its catch-based estimate of the marine eel stock, comprising both black eel and brown eel recorded together in the industrial catch logs. The data on industrial catches is limited given that it only spans the last 17 years, but what little there is it can shed light on the current state of the stock and projections for its biomass in the future. DB-SRA is a stock reduction analysis that can analyze the current stock status based on catch records, and it works particularly well for stocks that have had a steady fall in abundance over the time series (Dick and MacCall, 2011). For the DB-SRA method to provide a reliable assessment of stock status, it is preferable to have complete capture records dating back to the beginning of fisheries (Dick and MacCall, 2011), though it is likely to be impossible in many developing fisheries where it has to be a mean of livelihood for coastal fishers.
Because of the high degree of removal, stock biomass has been declining since the fisheries began. This is because catches have often exceeded the OFL Limit. Stock biomass decline exacerbated the problem, and by the end of the referenced year (2022), these fisheries were unable to produce MSY due to insufficient biomass. Any sustainable harvest strategy must take MSY into account, and DB-SRA can assist reduce the uncertainty in this estimation (Dick and MacCall, 2011).
The results of the DB-SRA model suggest that there has been a decline in the biomass of eel stocks in the deep seas of Bangladesh, suggesting that action is needed to restore these populations. Although maintaining the annual fishing ban during the breeding season has proven to be effective since its inception, it is likely that other effective measures, such as the establishment of catch limits or quotas, should be considered in tandem with this strategy to increase the biomass of the stocks above the BMSY. However, in this study, forecasts were made using different catch limits to guarantee the sustainable expansion of the species’ biomass resource. The OFL is an effective instrument for optimizing yield without jeopardizing the long-term viability of the stock biomass. Using the OFL’s projected numbers, if we can bring it in 250 metric tons annually, we can reverse the declining trend in biomass. By 2033, with these catch limits; biomass will have nearly reached the BMSY threshold. Total allowable catch (TACs) for the industrial eel fishery in Bangladesh marine waters is then recommended based on this study.
4.8 Stock condition analysis based on CMSY
Though TropFishR, LBSPR, LBIs, and DB-SRA have provided a thorough understanding of the current state of the fishery’s exploitation and stock biomass, a Monte Carlo Method-CMSY has also been used in this study to assess the stock status using catch-resilience and catch data to compare the accuracy of the estimates provided by earlier methods (Martell and Froese, 2012; Froese et al., 2017). The estimated results of CMSY were more optimistic than those from the DB-SRA given the low input data needed. According to the results of CMSY analysis, the eel population in Bangladesh’s offshore waters has an intrinsic growth rate that indicates the stock can replenish itself by 57 percent annually. Therefore, the stock’s overall mortality should not go over this cap. However, the high fishing mortality and exploitation rate are now seen, as evaluated by this method, to reveal the stock’s worrying situation.
Despite the ratio of F/FMSY being above the threshold, the predicted MSY, BMSY, and ratio of B/BMSY all pointed to the stock’s sustainability. Even though the stock status was in the recovery zone at the start of the time series, the stock status plot (Figure 10) shows the stock biomass movement from the safe zone to the highly exploited zone. If overfishing and overexploitation let to continue, this fishery won’t produce MSY in the next years because of the medium resilience, which keeps the stock biomass near the reference point. To manage the eel fishery sustainably, the estimated MSY through using the CMSY method is around 18% lower than the fish landed in 2022, which is concerning.
4.9 Management recommendations
The analysis of TropFishR, LB-SPR, and LBI shows that the fishing mortality rate for black eels is now high whereas it is relatively low for brown eels. The fishery’s stock biomass is already overfished, as shown by the LB-SPR, DB-SRA, and other studies, even though the estimated reference points from CMSY were more optimistic than those from the DB-SRA. Therefore, the main management goal should be to prevent the depletion of stock spawning biomass, and it is advised that fishing mortality should be reduced. Because the estimated length at first capture (Lc) and mean gear selectivity (SL50%) is considerably smaller (nearly half) than the mean length of first sexual maturity (Lm) for black eels but shows little difference for brown eels, imposing size limits for the catch may help to sustain the stock biomass and reduce fishing mortality. There should be a minimum length requirement before a fish can be caught, and this study indicates 93 centimeters for black eels and 83 centimeters for brown eels. In this way, every juvenile fish has a fair chance to reproduce and reach its full potential size. Once again, this research calculated the length, recommending a maximum capture size of 93–114 cm for black eels and 83–101 cm for brown eels. Although this length range accounts for a very high percentage of the catch, only 14% of black eels and 33% of brown eels are caught every year. For black eels, however, a bigger proportion of mega-spawners were recorded than the optimal size of fish, suggesting that larger individuals are available. Mega-spawners should not be captured if at all possible. It is recommended that industrial trawl fishing should be urged to use square-meshed nets and apply mesh size limitations to address this issue. This will allow juvenile fish to reach their full potential in length, compensating for the deliberate no-fishing of mega-spawners. Although this strategy would have initially resulted in lower annual production, it would have gradually increased to its maximum level and steadily improved the present spawning potential ratio for both eel populations from almost limit reference points (20%). To reduce fishing pressure from the current F/M (=1.14 for black eel and 1.3 for brown eel) and bring fishing mortality to the FMSY level, it is advised to reduce the number of fishing vessels and active fishing days.
The time series though not longer enough, but the catch-based analysis does provide sound guidance on the trend and the subtle projections of the stock’s present state. The current catch quantity is significantly larger than the MSY calculated using either the DB-SRA or CMSY methodologies. As a result, the current eel stock biomass is below the BMSY level, and the dynamics of the stock status are shifting into the overexploitation zone from the sustainable scenario. To increase the stock’s biomass beyond the BMSY level for obtaining a sustainable yield, it is expected that a catch limit will be enforced in tandem with the yearly fishing moratorium. In addition, the pressure of overfishing and overexploitation on fish populations could be reduced with the use of a buy-back programme (Göktay et al., 2018) of fishing vessels in a specific range of large-size vessels for the industrial fishing sector. The biomass trend will reverse from declining to increasing within the following decade if the annual total allowable catch (TAC) of eels is set at 250 mt.
5 Conclusion
In this study, three length-based approaches and two catch-based methods were used to undertake a thorough and rigorous stock assessment of the marine eel fishery, one of the commercially significant fisheries in the maritime waters of Bangladesh. Statistics on catches and the maximum sustainable yield (MSY) indicated that the fishery is overfished due to intense fishing pressure. After summarizing the findings, the following information about this study has been suggested:
I A slightly positive allometric growth pattern (b=3.10) for black eel and a negative allometric growth pattern (b=2.33) for brown eel were observed in the length-weight relationship;
II. The estimated L∞=190.67cm and 166.63cm, k=0.18 year-1 and 0.16 year-1, the total mortality, Z=0.70 year-1 and 0.45 year-1 values for the black eel and brown eel, respectively, were the VBGF life history parameters;
III. The eel fishery is calculated to be overfished due to overexploitation and the stock’s spawning biomass (SPR=19% for black eel and 21% for brown eel) is close to the limit reference point but well outside the targeted range because the majority of the catches were found to have below-maturity levels;
IV. The recommended minimum length for the catch is >93 cm for black eel and >83 cm for brown eel; This study advised an optimum length limit to catch from 93 to 114 cm for black eel and 83 to 101 cm for brown eel;
V. The status of eel stock has been displayed moving towards overexploitation from a safe stock scenario, this study therefore, recommended an annual landing limit of 250mt as OFL for the next ten years in association with the existing management measures to maintain the current stock biomass of eel fishery over the BMSY level.
Data availability statement
The raw data supporting the conclusions of this article will be made available by the authors, without undue reservation.
Ethics statement
Ethical review and approval was not required for the animal study because the samples measured for this study were taken from fishing vessels and artisanal mechanized boats during landing of their catch while unloaded for taking into the market and all samples were dead. It is clearly mentioned that our studied eel species are regular catches for all fishers in Bangladesh marine waters and they are allowed to catch these marine fishes after taking registration from Department of Fisheries (DoF), Bangladesh of their vessels annually plus taking sailing permission for industrial fishing vessels before every voyage after showing the catch log of previous trip. As per reply of the second query, there was no chance of harm or injury of eels because these are all dead and we conducted our research study based on dependent data. Hence, no need to kill animals while research study carried on. No live eels were measured as it was not an independent survey. Therefore, not required to take approval from ethics committee.
Author contributions
SB: conceptualization, data collection, methodology, software, data curation, data analysis, visualization, writing the entire manuscript, review and editings. QL: conceptualization, reviewing and editing; MSA: visualization, editings, & reviewings. PS: editing, & reviewing. MMHM: editing, & reviewing. MAR: investigation, editing, & reviewing. All authors have read and agreed to the submitted version of the manuscript.
Funding
This work is supported by the special research fund of Ocean University of China (201562030).
Acknowledgments
The first author would like to express his gratitude to the Chinese Scholarship Council (CSC) and SOA (State Oceanic Administration) for the sponsorship his doctoral degree course. The first author is also grateful to the College of Fisheries, Ocean University of China and Department of Fisheries, Ministry of Fisheries and Livestock, Bangladesh for their kind approval to admit and continue his doctoral study. The authors extend thanks to owners, management, skippers, officers and crews of the industrial fishing vessels specially Sk. Saiful Islam (Senior Skipper), Suman Sen (ED), Mohammed Saiful Islam (Proprietor), Md. Saleh Johur (GM), Sayed Ahamed (Proprietor) and Mohammad Ali (Manager) for their immense cooperation in the collection of data during the study period. The authors appreciate the valuable comments made by reviewers, which significantly improved the manuscript. The first author also extends thanks to the Marine Fisheries Office, Chattogram, specifically to Md. Zaherul Hoque, Statistical Officer, SM Sajjad Uddin, Inspector, Md. Manjur Alam, Inspector and Md. Zakir Hossain, Inspector of Marine Fisheries Office, for their support during the collection of data and review article.
Conflict of interest
The authors declare that the research was conducted in the absence of any commercial or financial relationships that could be construed as a potential conflict of interest.
Publisher’s note
All claims expressed in this article are solely those of the authors and do not necessarily represent those of their affiliated organizations, or those of the publisher, the editors and the reviewers. Any product that may be evaluated in this article, or claim that may be made by its manufacturer, is not guaranteed or endorsed by the publisher.
References
Akhilesh K. V., Thakurdas, Nakhawa A. D., Bhendekar S. N., Anulekshmi C., Kizhakudan S. J., et al. (2022). Fish swim-bladder trade in India. ICAR-CMFRI Mar. Fisheries Inf. Service Tech. Extension Ser. No. 251, 29–32.
Alam M. S., Liu Q., Nabi M. R. U., Al-Mamun M. A. (2021). Fish stock assessment for data-poor fisheries, with a case study of tropical hilsa shad (Tenualosa ilisha) in the water of Bangladesh. Sustainability 13 (7), 3604. doi: 10.3390/su13073604
Alam M. S., Liu Q., Schneider P., Mozumder M. M. H., Chowdhury M. Z. R., Uddin M. M., et al. (2022a). Length-based stock assessment for the data-poor Bombay duck fishery from the northern bay of Bengal coast, Bangladesh. J. Mar. Sci. Eng. 10, 213. doi: 10.3390/jmse10020213
Alam M. S., Liu Q., Schneider P., Mozumder M. M. H., Uddin M. M., Monwar M. M., et al. (2022b). Stock assessment and rebuilding of two major shrimp fisheries (Penaeus monodon and Metapenaeus monoceros) from the industrial fishing zone of Bangladesh. J. Mar. Sci. Eng. 10, 201. doi: 10.3390/jmse10020201
Alam M. S., Liu Q., Monwar M. M., Hoque M. E., Barua S., Hassan M. L., et al. (2022c). Assessing the pomfret stock for setting catch limits in the northern bay of Bengal, Bangladesh. Aqua. Fish. 12. doi: 10.1016/j.aaf.2022.07.003
Al-Mamun M. A., Liu Q., Chowdhury S. R., Uddin M. S., Nazrul K. M. S., Sultana R. (2021). Stock assessment for seven fish species using the LBB method from the northeastern tip of the bay of Bengal, Bangladesh. Sustainability 13, 1561. doi: 10.3390/su13031561
Amir F., Mallawa A., Budimawan, Tresnati J. (2009). Population dynamics of tropical eels (Anguilla marmorata) in malunda waters, West sulawesi. Torani J. Ilmu Kelautan dan Perikanan. 19 (2), 116–121.
Aprahamian M., Walker A. (2008). Status of eel fisheries, stocks and their management in England and Wales (Knowledge Management of Aquatic Ecosystems 390-391), 22.
Ates C., Deval M., Deniz T., Tosunoğlu Z. (2010). Selectivity of diamond (PA) and square (PE) mesh codends for commercially important fish species in the antalya bay, Eastern Mediterranean. J. App. Ichthyo. 26, 465–471. doi: 10.1111/j.1439-0426.2010.01462.x
Bagenal T. B., Tesch A. T. (1978). Conditions and growth pattern in fresh water habitats (Oxford: Blackwell Scientific Publications), 75–89.
Barua S. (2019). Maximum sustainable yield (MSY) estimates for industrial finfish fishery in marine waters of Bangladesh using trawl catch log. Bang. J. Fish. 31 (2), 313–324.
Barua S., Karim E., Humayun N. M. (2014). Present status and species composition of commercially important finfish in landed trawl catch from Bangladesh marine waters. J. P. App. Zool. 2 (2), 150–159.
Barua S., Liu Q., Alam M. S., Schneider P., Mozumder M. M. H. (2022). Application of length-based assessment methods to elucidate biological reference points of black pomfret stock in the bay of Bengal, Bangladesh. Fishes 7, 384. doi: 10.3390/fishes7060384
Barua S., Liu Q., Alam M. S., Kanak M. K., Ali M. M. (2023). Population dynamics and stock assessment of Red snapper (Lutjanus johnii) in the Bay of Bengal Bangladesh waters. Reg. Stud. Mar. Sci. 63, 102983. doi: 10.1016/j.rsma.2023.102983
Barua S., Magnuson A., Humayun N. M. (2018). Assessment of offshore shrimp stocks of Bangladesh based on commercial shrimp trawl logbook data. Ind. J. Fish. 65 (1), 1–6. doi: 10.21077/ijf.2018.65.1.61384-01
Berkson J., Barbieri L., Cadrin S., Cass-Calay S., Crone P., Dorn M., et al. (2011). Calculating acceptable biological catch for stocks that have reliable catch data only (Only reliable catch stocks-ORCS) (Washington, DC, USA: NOAA Technical Memorandum NMFS-SEFSC-616; National Oceanic and Atmospheric Administration), 56.
Beverton R. J. H., Holt S. J. (1956). A review of methods for estimating mortality rates in fish populations, with special references to sources of bias in catch sampling. rapp ProcesVerb. Reun. Cons. Int. Explor. Mer. 140, 67–83.
Beverton R. J. H., Holt S. J. (1957). On the dynamics of exploited fish populations (London: Ministry of Agriculture, Fisheries, and Food. Fishery Investigations), 533.
Bura Gohain A., Goswami M. M. (2013). A study on length-weight relationship and condition factor in different age groups of clarias magur (Hamilto) in wetland- aqua habitat of Assam. Ind. J. Aqua. 14 (1-2), 65–70.
Cope J., Punt A. E. (2009). Length-based reference points for data-limited situations: applications and restrictions. Mar. Coast. Fish. Dyn. Manage. Ecosyst. Sci. 1, 169–186. doi: 10.1577/C08-025.1
Dekker W., van Os B., van Willigen J. A. (1998). Minimal and maximal size of eel. Bull. Français la Pêche Pisciculture Conseil Supérieur la Pêche Paris (France) 349, 195–197. doi: 10.1051/kmae:1998044
Dick E. J., MacCall A. D. (2011). Depletion-based stock reduction analysis: a catch-based method for determining sustainable yields for data-poor fish stocks. Fish. Res. 110, 331–341. doi: 10.1016/j.fishres.2011.05.007
Eayrs S., Pol M. (2019). The myth of voluntary uptake of proven fishing gear: investigations into the challenges inspiring change in fisheries. ICES J. Mar. Sci. 76 (2), 392–401. doi: 10.1093/icesjms/fsy178
FAO (1999). Indicators for sustainable development of marine capture fisheries (Rome: Technical Guidelines for Responsible Fisheries), 68.
Fishbase. Available at: https://www.fishbase.se/search.php (Accessed 5th November 2022).
Froese R. (2004). Keep it simple: three indicators to deal with overfishing. Fish Fish. 5, 86–91. doi: 10.1111/j.1467-2979.2004.00144.x
Froese R., Binohlan C. (2000). Empirical relationships to estimate asymptotic length, length at first maturity and length at maximum yield per recruit in fishes, with a simple method to evaluate length frequency data. J. Fish Biol. 56, 758–773.
Froese R., Demirel N., Coro G., Kleisner K., Winker H. (2017). Estimating fisheries reference points from catch and resilience. Fish Fish. 18, 506–526. doi: 10.1111/faf.12190
Froese R., Pauly D. (2000). “FishBase,” in Concepts, design and data sources; ICLARM(Los Baños, Philippines), 344.
Göktay S., Göncüoğlu-Bodur H., Ünal V. (2018). Analysis of the first buy-back program for fishing vessels in Turkey. Ege J. Fish. Aquat. Sci. 35 (4), 433–445. doi: 10.12714/egejfas.2018.35.4.09
Hilborn R., Walters C. J. (1992). Quantitative fisheries stock assessment: choice, dynamics and uncertainty. 2nd ed (New York, NY, USA: Chapman and Hall Inc), 570.
Hordyk A. (2015) LB-SPR: length-based spawning potential ratio (R Package). Available at: https://CRAN.R-project.org/package=LB-SPR (Accessed 08 September 2022).
Hordyk A., Ono K., Sainsbury K., Loneragan N., Prince J. (2015a). Some explorations of the life history ratios to describe length composition, spawning-per-recruit, and the spawning potential ratio. ICES J. Mar. Sci. 72, 204–216.
Hordyk A., Ono K., Valencia S., Loneragan N., Prince J. (2015b). A novel length-based empirical estimation method of spawning potential ratio (SPR), and tests of its performance, for small-scale, data-poor fisheries. ICES J. Mar. Sci. 72, 217–231.
Hunter A., Speirs D. C., Heath M. R. (2015). Fishery-induced changes to age and length dependent maturation schedules of three demersal fish species in the firth of Clyde. Fish. Res. 170 (4), 14–23. doi: 10.1016/j.fishres.2015.05.004
Jacoby D. M. P., Casselman J. M., Crook V., DeLucia M. B., Ahn H., Kaifu K., et al. (2015). Synergistic patterns of threat and the challenges facing global anguillid eel conservation. Glob. Ecol. Conserv. 4, 321–333. doi: 10.1016/j.gecco.2015.07.009
Kimura D., Tagart J. (1982). Stock reduction analysis, another solution to the catch equations. Can. J. Fish. Aquat. Sci. 39, 1467–1472. doi: 10.1139/f82-198
Koh E. H., Kwon D. H., Kim Y. (2019). Age and growth of daggertooth pike conger Muraenesox cinereus in the South Sea of Korea. J. Fish. Aquat. Sci. 51 (6), 650–655. doi: 10.5657/KFAS.2019.0650
Le Cren E. D. (1951). The length-weight relationships and seasonal cycle in gonad weight and condition in the perch (Perca fluviatilis). J. Anim. Ecol. 20, 201–219. doi: 10.2307/1540
MacLennan D. N. (1992). Fishing gear selectivity: an overview. Fish. Res. 13, 201–204. doi: 10.1016/0165-7836(92)90076-6
Madhu V. R. (2018). A review of trawl selectivity estimates carried out along Indian coast. Fish. Tech. 55, 1–18.
Martell S., Froese R. (2012). A simple method for estimating MSY from catch and resilience. Fish Fish. 1-11. doi: 10.1111/j.1467-2979.2012.00485.x
MFA (2020) Marine fisheries act 2020 (Ministry of Fisheries and Livestock, SRO 211-AIN/2019). Available at: http://bdlaws.minlaw.gov.bd/act-1347.html (Accessed 10 November 2022).
Mildenberger T. K., Taylor M. H., Wolff M. (2017). TropFishR: an r package for fisheries analysis with length-frequency data. Methods Ecol. Evol. 8, 1520–1515. doi: 10.1111/2041-210X.12791
Morgan G. R. (1985). Stock assessment of the pomfret (Pampas argenteus) in Kuwaiti waters. J. Cons. Int. Explor. Mer. 42, 3–10. doi: 10.1093/icesjms/42.1.3
Nugroho D., Patria M. P., Supriatna J., Adrianto L. (2017). The sestimates spawning potential ratio of three dominant demersal fish species landed in Tegal, north coast of Central Java, Indonesia. Biodiversitas. J. Biol. Div. 18, 844–849.
Parsamanesh A., Shalbaf M., Najafpour N. (1998). Status of pampas argenteus fisheries in khoozestan waters (North-west Persian gulf), I.R. Iran. Ind. J. Ani. Sci. 68 (4), 407–409.
Pauly D. (1984). Fish population dynamics in tropical waters: a manual for use with programmable calculator. ICLARM. Stud. Rev. 8, 325.
Pauly D., David N. (1981). ELEFAN I, a basic program for the objective extraction of growth parameters from length-frequency data. Ber. Dtsch. Wiss. Kommissuib Meeresforsch 28 (4), 205–211.
Pauly D., Munro J. L. (1984). Once more on the composition of growth in fish and invertebrates. Fishbyte 2 (1), 1–21.
Piria M., Sprem N., Tomljanovic T., Sliskovik M., Mrcelic G. J., Treer T. (2014). Lengthweight relationships of European eel (Anguilla anguilla l) from six karst catchments of the Adriatic basin, Croatia. Croat. J. Fish. 72, 32–35. doi: 10.14798/72.1.704
Pons M., Kell L., Rudd M. B., Cope J. M., Fre L. (2019). Performance of length-based datalimited methods in a multi- fleet context: application to small tunas, mackerels and bonitos in the Atlantic ocean. Can. J. Fish. Aquat. Sci. 4, 960–973.
Prince J., Victor S., Kloulchad V., Hordyk A. (2015). Length based SPR assessment of eleven indo-pacific coral reef fish populations in Palau. Fish. Res. 171, 42–58. doi: 10.1016/j.fishres.2015.06.008
Rajeswari G., Raghu P. R., Sreehar U., Swamy K. M. (2013). Size selectivity of diamond and square mesh codends for largehead hairtail trichiurus lepturus linnaeu. Indian J. Fish. 60 (4), 13–16.
Ricker W. E. (1975). Computation and interpretation of biological statistics of fish population (Ottawa, ON, Canada: Bulletin of the fisheries research board of Canada), 382.
Saikia A. K., Singh A. S. K., Das D. N., Biswas S. P. (2011). Length weight relationship and condition factor of spotted snakehead, channa punctatus (Bloch). Bull. Life Sci. XVII 102-108.
Schaefer M. B. (1954). Some aspects of the dynamics of populations important to the management of the commercial marine fisheries. IATTC Bull. 1, 27–56.
Schwamborn R., Mildenberger T. K., Taylor M. H. (2019). Assessing source of uncertainty in length-based estimates of body growth in populations of fishes and macro-invertebrates with bootstrapped ELEFAN. Ecol. Model. 293, 37–51. doi: 10.1016/j.ecolmodel.2018.12.001
Shiao J. C., Iizuka Y., Chang C. W., Tzeng W. N. (2003). Disparities in habitat use and migratory behavior between tropical eel Anguilla marmorata and temperate eel a. japonica in four Taiwanese rivers. Mar. Ecol. Prog. Ser. 261, 233–242. doi: 10.3354/meps261233
Sparre P., Venema S. C. (1998). Introduction to tropical fish stock assessment–part 1: manual. FAO Fish. Tech. Pap 306, 1–407.
Taylor M., Mildenberger T. K. (2017). Extending electronic length frequency analysis in r. Fish. Manage. Ecol. 24, 330–338. doi: 10.1111/fme.12232
Tesch F. W. (1971). “Age and growth,” in Methods for assessment of fish production in fresh waters. Ed. Ricker (Oxford: Blackwell Scientific Publications), 99–130.
Tesch F. W. (2003). The eel (English edition). 3rd edition (Oxford, UK: Blackwell Science Ltd, Blackwell Publishing Company, 9600 Garsington Road), 408.
Then A. Y., Hoenig J. M., Hall N. G., Hewitt D. A. (2015). Evaluating the predictive performance of empirical estimators of natural mortality rate using information on over 200 fish species. ICES J. Mar. Sci. 72, 82–92. doi: 10.1093/icesjms/fsu136
Tzeng W. N., Han Y. S., He J. T. (2000). The sex ratios and growth strategies of wild and captive Japanese eels, Anguilla japonica (Vancouver: International Congress on the Biology of Fish, University of British Columbia), 25–42.
Utama K., Pangerang L. S., Usman R., Andi I. N. (2018). Population dynamics of the eel (Anguilla marmorata) in southeast sulawesi waters, Indonesia. AACL Bioflux 11 (2).
Vøllestad L. A. (1992). Geographic variation in age and length at metamorphosis of maturing European eel: environmental effects and phenotypic plasticity. J. Anim. Ecol. 61, 41–48. doi: 10.2307/5507
von Bertalanffy L. A. (1938). Quantitative theory of organic growth (inquiries on growth laws. II.). Hum. Biol. 10, 181–213.
Walters C. J., Martell S. J. D., Korman J. A. (2006). Stochastic approach to stock reduction analysis. Can. J. Fish. Aquat. Sci. 63, 212–223. doi: 10.1139/f05-213
Watari S., Murata M., Hinoshita Y., Mishiro K., Oda S., Ishitani M. (2013). Re-examination of age and growth of daggertooth pike conger Muraenesox cinereus in the western Seto Inland Sea, Japan. Fish. Sci. 79, 376–373. doi: 10.1007/s12562-013-0605-x
Worm B., Hilborn R., Baum J. K., Branch T. A., Collie J. S., Costello C., et al. (2009). Rebuilding global fisheries. Science 325 (5940), 578–585.
Yalcin-Ozdilek S., Gumus A., Dekker W. (2006). Growth of European eel in a Turkish river at the south-eastern limit of its distribution. Elec. J. Ichth 2, 55–64.
Keywords: the Bay of Bengal, black eel (Muraenesox bagio), brown eel (Congresox talabonoides), spawning potential ratio (SPR), overexploitation, mesh size regulation, over fishing limit (OFL)
Citation: Barua S, Liu Q, Alam MS, Schneider P, Mozumder MMH and Rouf MA (2023) Population dynamics and stock assessment of two major eels (Muraenesox bagio and Congresox talabonoides) from the marine waters of Bangladesh. Front. Mar. Sci. 10:1134343. doi: 10.3389/fmars.2023.1134343
Received: 30 December 2022; Accepted: 06 April 2023;
Published: 31 May 2023.
Edited by:
Salvatore Siciliano, Fundação Oswaldo Cruz (Fiocruz), BrazilReviewed by:
Kar-Hoe Loh, Universiti Malaya, MalaysiaMiaohua Mao, Yantai Institute of Coastal Zone Research, Chinese Academy of Sciences (CAS), China
Copyright © 2023 Barua, Liu, Alam, Schneider, Mozumder and Rouf. This is an open-access article distributed under the terms of the Creative Commons Attribution License (CC BY). The use, distribution or reproduction in other forums is permitted, provided the original author(s) and the copyright owner(s) are credited and that the original publication in this journal is cited, in accordance with accepted academic practice. No use, distribution or reproduction is permitted which does not comply with these terms.
*Correspondence: Qun Liu, cXVubGl1QG91Yy5lZHUuY24=; Suman Barua, c2JhcnVhMTIzYmRAZ21haWwuY29t