 Guang Yang
 Guanyu Chen1,2
 Xiangqian Quan
 Yang Zhu
- 1College of Instrumentation and Electrical Engineering, Jilin University, Changchun, China
- 2Jilin Province Key Laboratory of Trace Analysis Technology and Instruments, Changchun, China
- 3Institute of Deep-ocean Science and Engineering, Chinese Academy of Science, Sanya, China
- 4National Engineering Research Center of Geophysics Exploration Instruments, Jilin University, Changchun, China
Introduction: Marine ferromanganese crusts are potentially important metal resources.The deep-ocean research and survey ships often need to carry out rapid chemical element component analysis of mineral resources, so as to plan for the geological resource exploration mission.
Methods: The laser-induced breakdown spectroscopy can obtain the spectrum of chemical elements by the plasma excited by high-energy laser irradiation on the surface of the sample. A laser induced breakdown spectroscopy optical system for the detection of deepocean ferromanganese crusts is designed and built, which can meet the requirements of near-insitu chemical component detection of deep-ocean mineral resources on ocean-going survey ships.
Results: Hyperspectral data of Fe-Mn crusts are carried out by the Laser-induced breakdown spectroscopy (LIBS) system during a deep-sea exploration mission at a depth of 2,490 m in the South China Sea. The experimental parameters of laser energy and spectral acquisition delay are optimized to improve the spectral measurement accuracy. Based on the calibration-free method, the significant spectral features of the chemical elements Fe and Mn were obtained through proper alignment with the National Institute of Standards and Technology (NIST) chemical element spectral library.
Discussion: The LIBS instrument can be placed on board long-range survey vessels in the future to provide a fast, convenient, accurate, and economical detection method for deep-ocean resource exploration.
1 Introduction
The resource detection and exploration of deep-ocean minerals have been studied for decades (Hein et al., 2013). Marine ferromanganese oxide crusts (Fe-Mn crusts) are potentially important metal resources formed on the seafloor by precipitation of dissolved and colloidal components from ambient seawater onto rocky surfaces (Lusty and Murton, 2018; Lusty et al., 2018). Ferromanganese crusts may provide a future resource for a large variety of metals, including emerging high-tech and green technologies applications. Fe-Mn crusts have a high potential economic value and is a hotspot of marine mineral resources research. Fe-Mn crusts are found typically at cold, ambient ocean depths of 400– 7,000 m onto the surface of seamounts, ridges, and plateaus, with the thickest and most metal-rich crusts occurring at depths of approximately 800–2,500 m (Corliss et al., 1979; Hein and Koschinsky, 2014). In addition, based on the assumption that the chemical composition of the ferromanganese crusts is not affected by late diagenesis, the chemical information of the crust can be used to reverse the ancient marine evolution (Chen et al., 2013; Jiang et al., 2021).
The distribution of Fe-Mn crusts can be preliminarily determined by deep-ocean optical imaging, while the finer classification of Fe-Mn crusts should be obtained by deep-ocean geological sampling and chemical analysis in the laboratory (Huang et al., 2021; Xue et al., 2021; Bell et al., 2022; Zhou et al., 2022). At present, there are two main methods to analyze the components of deep-ocean crust samples: laser spectroscopic detection and inductively coupled plasma optical emission spectrometer (ICP-OES) in the laboratory. The deep-ocean research and survey ships often need to carry out rapid chemical element component analysis of mineral resources (Lai et al., 2017), so as to plan for geological resource exploration missions. ICP-OES can achieve detection limits of 1–10 ppb for most elements and a linear range of four to six orders of magnitude on the standard curve (Becker-Ross et al., 2002; Piskunov and Valenti, 2002; Xie et al., 2009; Lavigne et al., 2010; Xu et al., 2011). However, it generally requires pretreatment such as microwave digestion, evaporation, ashing, and the individual preparation of the solutions for the samples to be tested and the standards. A large amount of high-purity argon gas is consumed in the ICP-OES analysis process. In addition, ICP-OES generally relies on the standard curve method for quantitative elemental analysis, with relatively long sample analysis cycles and complex equipment, which is unsuitable for rapid near-insitu testing in oceanic regions. In contrast, this paper proposes the use of the laser-induced breakdown spectroscopy (LIBS) technique, where high-energy laser pulses are focused onto the surface of a sample and excited to produce a high-brightness, high-heat plasma. The qualitative and quantitative analysis method of the excitation spectra of complex matrix samples in the field through the calibration-free method is presented, without complex sample pretreatment and high-purity gas environments (Kiefer et al., 2015; Yang et al., 2020). It also effectively prevents the interference of the spectrum of seawater saline substances to the spectrum of seabed resources, which is more conducive to rapid chemical component detection near-insitu in the deep ocean. The LIBS instrument could be placed on board long-range survey vessels in the future to provide a fast, convenient, accurate, and economical detection method for deep-ocean resource exploration.
In this study, a laser-induced breakdown spectroscopy optical system for the detection of deep-ocean ferromanganese-rich ores is designed and built, which can meet the requirements of the near-insitu chemical component detection of deep-ocean mineral resources on ocean-going survey ships. The 1,064-nm-wavelength and 90-mJ-energy laser is chosen as the excitation light source, realizing spectral information detection with a spectral resolution of 0.05 nm and completing the integration and testing of the principal prototype. Hyperspectral detection of ores collected from a seafloor exploration mission to the South China Sea area at a depth of 2,490 m below the seafloor was carried out using LIBS, and hyperspectral data were obtained for deep-ocean ferromanganese-rich ores. The experimental parameters of laser energy and spectral acquisition delay are optimized for the spectral data, and the stability of laser energy fluctuations as well as acquisition angle fluctuations was discussed. Finally, based on the calibration-free method, the significant spectral features of the chemical elements Fe and Mn were obtained through proper alignment with the National Institute of Standards and Technology (NIST) chemical element spectral library, and the chemical element contents of Fe and Mn are obtained by calculating the plasma temperature, distribution function, and instrument parameters. The principal prototype enables the detection of deep-ocean ferromanganese-rich ores, and through experimental optimization, the impact on the detection stability of the instrument due to offshore work is reduced and provides a basis for the engineering of near-insitu component detection of seabed ores on board ocean resources exploration in the future.
2 Methods
2.1 LIBS instruments and components
As shown in Figure 1, the laser emits a pulsed laser beam that is split by a beam splitting mirror and a portion of the laser is monitored in real time by an energy meter; as the beam splitting ratio of the beam splitting mirror is fixed, the energy ratio of the two splitting beams is also fixed and the actual laser energy of the optical path can be calculated from the monitored laser energy. The actual optical path is focused onto the surface of the sample through a focusing mirror to create a plasma. The elemental composition of the material is then analyzed by collecting the plasma spectra.
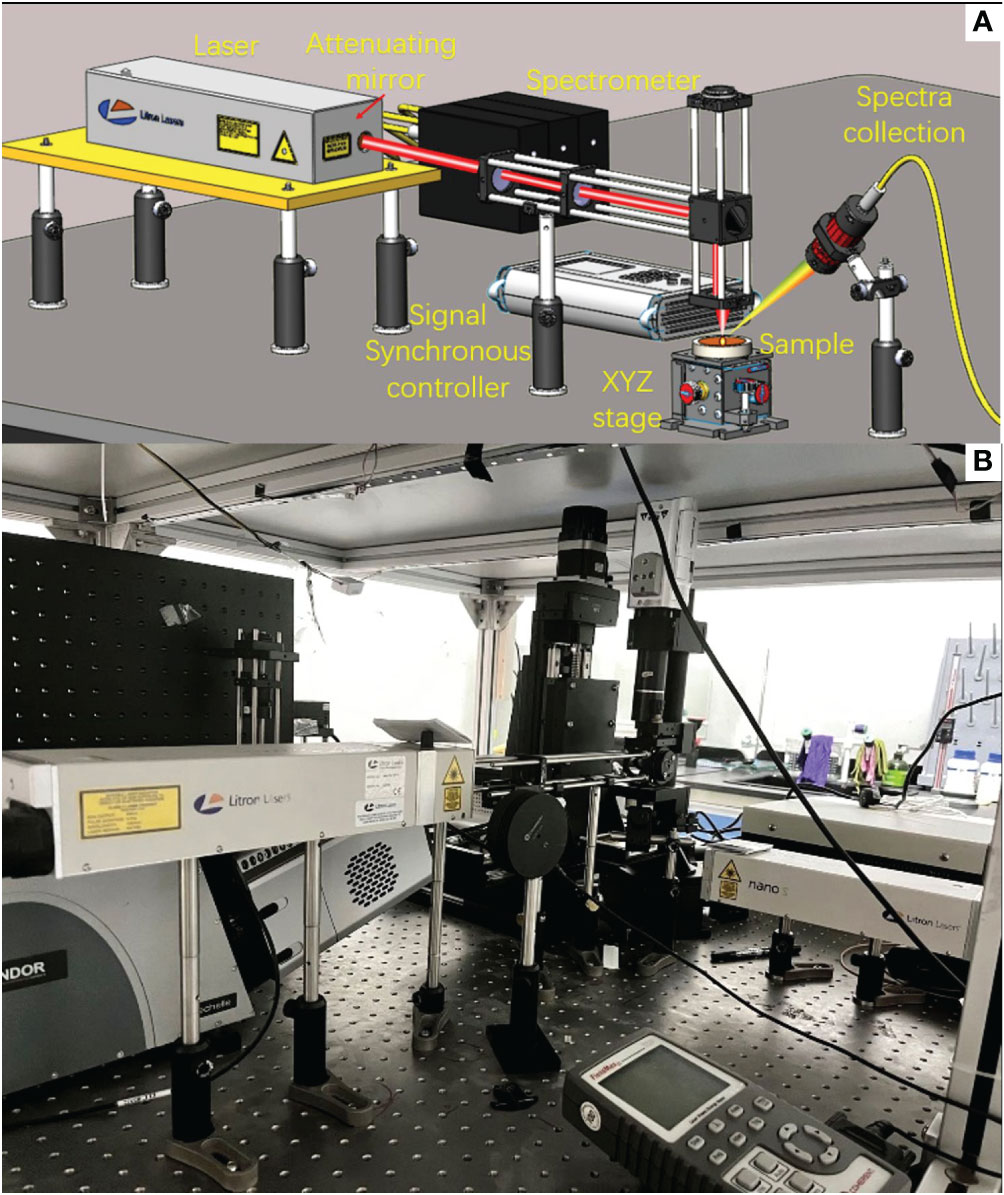
Figure 1 The experimental setup of laser-induced breakdown spectroscopy: (A) the schematic diagram of experimental setup; (B) the inside components of the LIBS system.
For the deep-ocean ferromanganese detection instrument, the wavelength of laser is 1,064 nm, the maximum laser energy is 100 mJ, and the standard deviation of laser energy stability is 0.433. The polarization attenuator is set at the laser outlet port. For linearly polarized beams, a tunable attenuator can be constructed by a half-wave plate and a polarization beam splitter. The ratio of S light and P light can be changed continuously by the attenuator to achieve the purpose of continuous attenuation. The polarization angle can be adjusted by rotating the knob at the laser output port, thereby adjusting the offset angle of the laser’s output energy, so that the laser energy can be continuously adjusted from 0 mJ to 100 mJ and provide a hardware foundation for the subsequent optimization of the laser energy parameters of the LIBS system.
The overall spectral response range of the hyperspectral detector is 200–950 nm. The broad spectrum is divided into three channels: 200–320 nm, 320–420 nm, and 420–950 nm, with a detection accuracy of 0.05 nm, 0.05 nm, and 0.1 nm, respectively. The sensitivity of the detector is 310,000 (in counts/µW per millisecond integration time), with a sampling rate of 1.1 ms each and a minimum integration time of 3 ms, which can meet the requirements for spectral collection of subsea ferromanganese crust samples.
As illustrated in Figure 1, the LIBS optical path is built using a high-precision cage system, which ensures both stability and convenience of adjustment. The three-dimensional translation platform control system consists of a high-precision three-dimensional translation platform and an electronically controlled 3D translation platform control box, which mainly functions to control the coordinate translational transformation of the laser focus position on the sample surface, to control the excitation position of the sample, and to assist in focusing and spectral surface array scanning, to name a few. The high-precision three-dimensional translation platform is equipped with precision-grade ball screws, in combination with linear slider guides, high-quality couplings, and other components to ensure that it can be used for high-precision control over a stroke range of 100 mm and a resolution of 20 μm. The electronically controlled three-dimensional translation platform control box allows for delicate control of the three-dimensional movement direction, movement speed, and movement acceleration of the three-dimensional translation platform.
The delay pulse generator is a self-developed component of the laboratory, which allows precise control for the time sequence pulses of the various functional components by receiving and sending precise time sequence pulse signals. The delay accuracy of 10 ns provides hardware support for the subsequent optimization and analysis of the spectral acquisition delay parameters. The self-developed 3D printed slope simulation component was independently designed by the laboratory of Jilin University to simulate the surface roughness of the sample. The slope can be applied to represent the cut surface of the rough sample and then used to verify the angular size of the sample, as well as the effect of the roughness size on the spectral data acquisition.
2.2 Deep-ocean sample acquisition
The Hai Yang 6 Hao ocean survey ship navigated the South China Sea to explore the deep-ocean geological and seabed minerals. The deep-ocean mining vehicle developed by the Institute of Deep-ocean Science and Engineering (Chinese Academy of Science) has been placed on the seabed and collected samples of deep-ocean rocks at a water depth of 2,490 m at 115°06′ E, 18°17′ N, as illustrated in Figure 2A. The LIBS measurement system has completed the development of the principal prototype with the implementation of packaging and integration (Figure 2B). The Hai Yang 6 Hao ocean survey ship is shown in Figure 2C. The seabed mineral sample mined by the deep-ocean mining vehicle is shown in Figure 2D. After a simple surface leveling treatment, the spectrum of the sample is measured by the LIBS system in the laboratory, and there are plans to implement near-insitu measurement on ocean survey ships in the future.
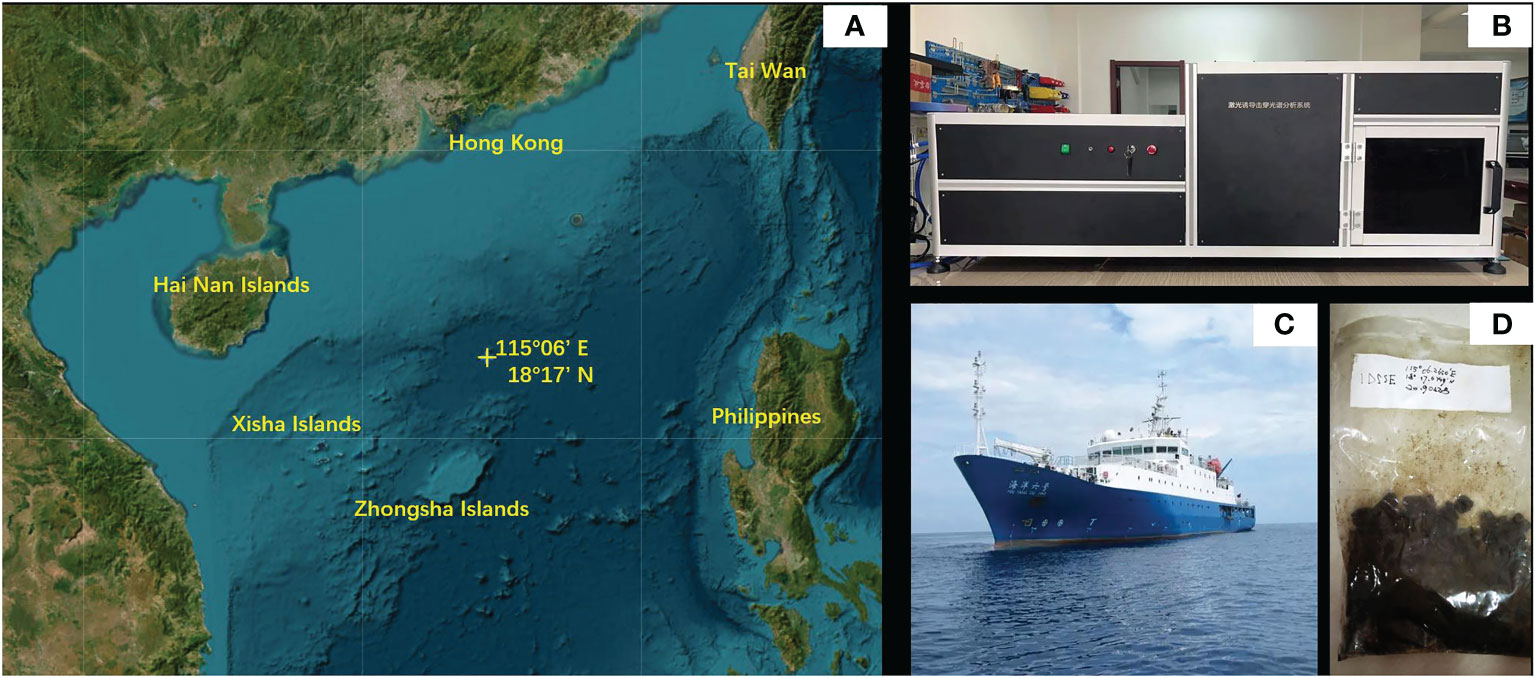
Figure 2 (A) The deep-ocean geological survey region of the South China Sea; (B) the LIBS measuring system with the implementation of packaging and integration; (C) the Hai Yang 6 Hao ocean survey ship; (D) the seabed mineral sample mined by a deep-ocean mining vehicle at a water depth of 2,490 m.
3 Optimization of experimental parameters
Before the exploration of deep-ocean ferromanganese crusts by LIBS, we should first run an experimental simulation. Based on the simulation experiment platform, the experimental conditions are optimized to simulate the marine exploration environment and avoid the measurement errors attributed to the measurement conditions of the marine exploration environment.
3.1 Optimization of laser energy
Based on the LIBS system, we have conducted the laser excitation spectroscopy measurements. The results are shown in Figure 3; the laser-induced breakdown spectra obtained significantly change as the laser energy is gradually increased. The number and intensity of the characteristic peaks also tend to rise. Several strong peaks in the diagram are caused by metals such as Na, K, and Ca in seawater or carbonates in stone, which have been processed by filtering to remove the influence on the Fe-Mn crust spectrum. The characteristic spectral lines of typical mineral elements of Fe and Mn are extracted at laser energies of 30 mJ, 40 mJ, 60 mJ, and 90 mJ, respectively (A–I spectral lines).
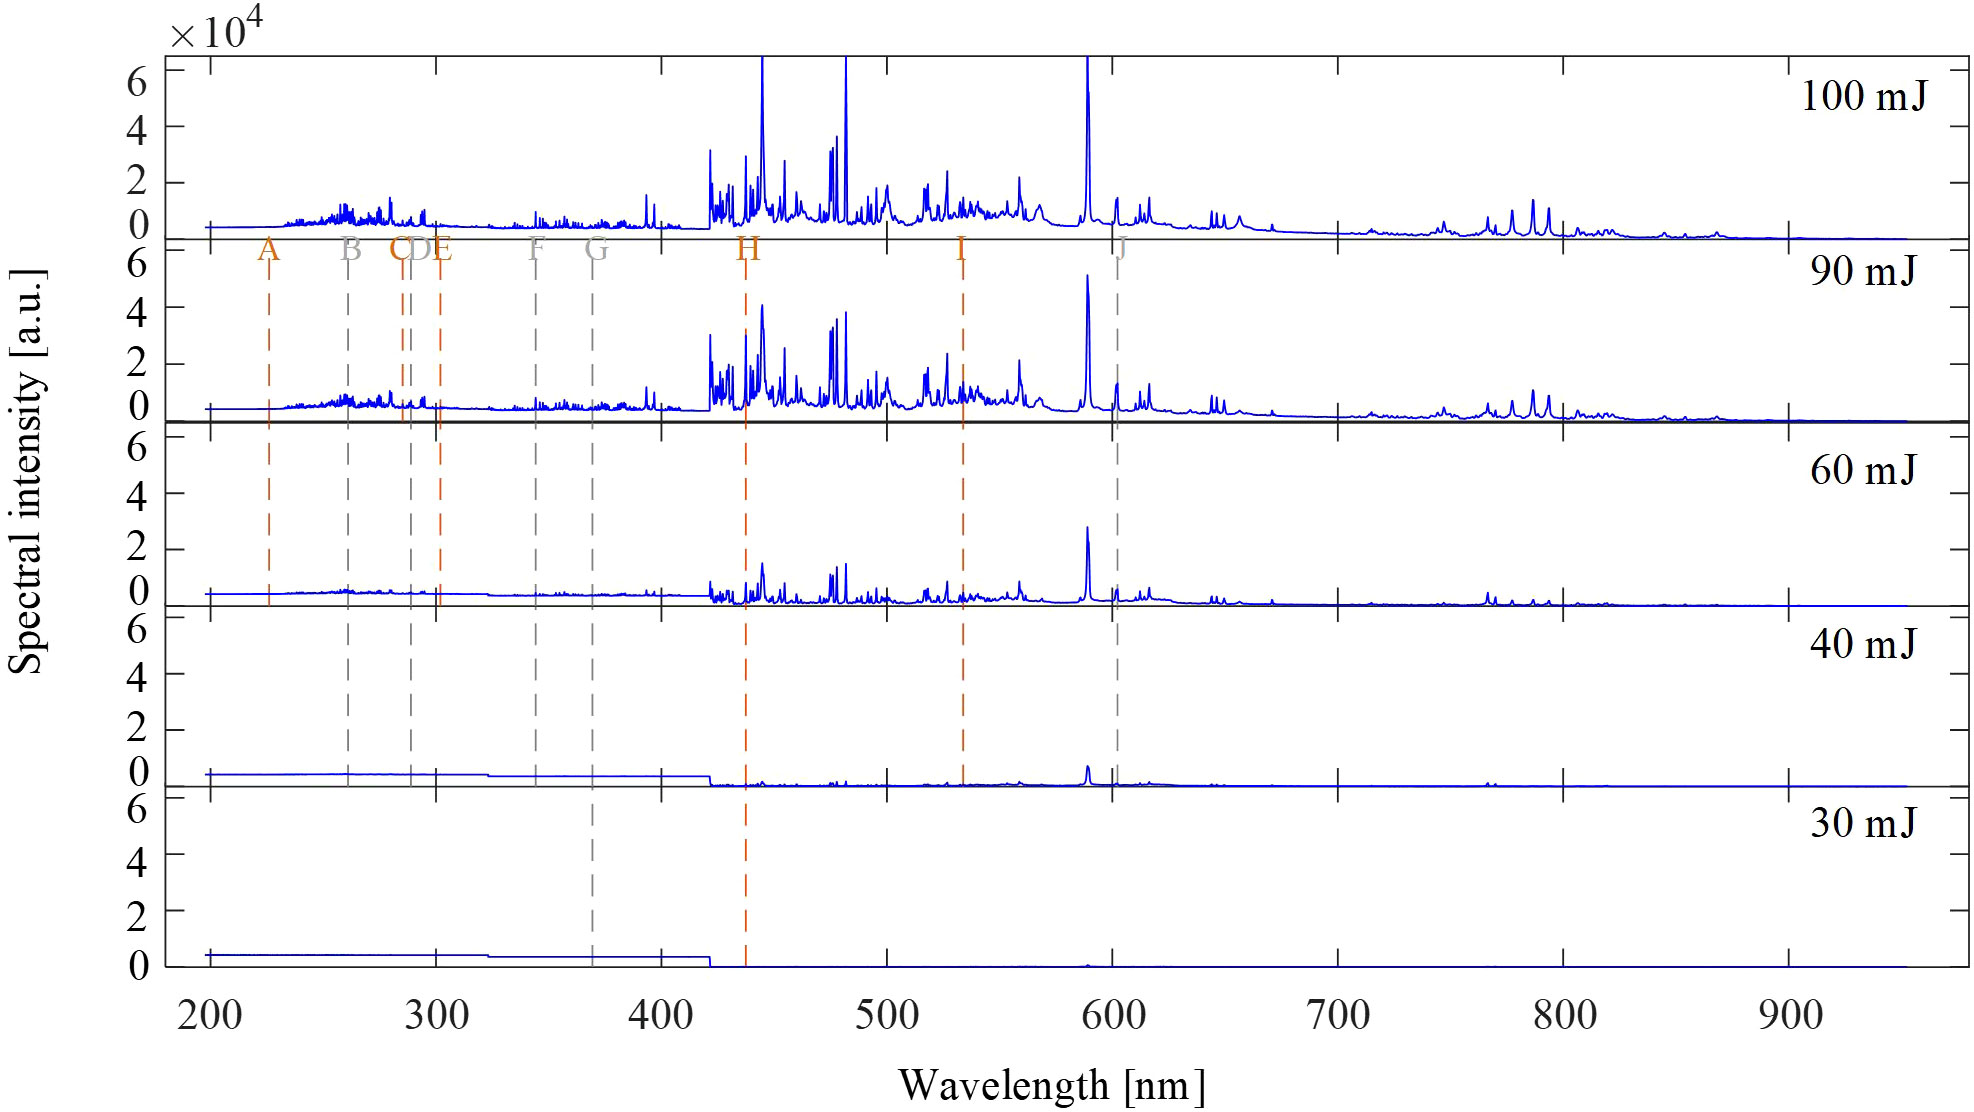
Figure 3 The spectra of the sample at a laser energy of 30–100 mJ.
Due to the low energy compared to the high energy in the excitation of the sample, the chemical bonds internal to the sample cannot absorb enough energy to break, thus failing energy level transition. In addition, because of the small amount of sample ablation, as the internal structure of the sample is not sufficiently homogeneous and dense at this point, without a complex pretreatment, the ablated sample is not guaranteed to contain the measured elements completely, resulting in the characteristic lines of the measured elements not being fully excited.
As shown in Table 1, by analyzing the data from actual measurements, when the laser energy is 30 mJ, only the G (Mn 369.391 nm) and H (Fe 437.450 nm) spectral lines could be excited properly. At a laser energy of 40 mJ, A (Fe 225.977 nm), C (Fe 285.208 nm), and E (Fe 301.991 nm) are not properly excited, while the other A–I spectral lines can be excited normally. As the laser energy increases to 90 mJ, all the individual A–I spectral lines are excited. Once the laser energy is further increased to 100 mJ, part of the spectrum appears saturated due to the limited intensity of the spectral lines collected by the spectrometer, which will reduce the analytical accuracy of typical elements; thus, we finally selected 90 mJ of laser energy as the experimental parameter for the next step.
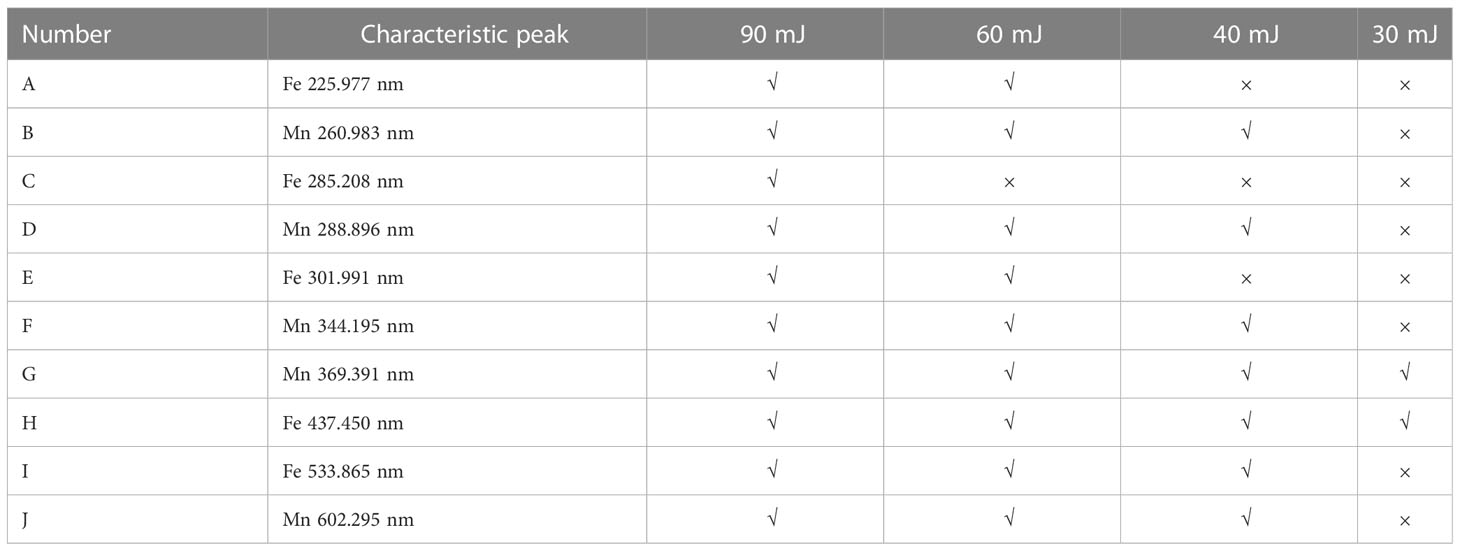
Table 1 Characteristic peaks of Fe, Mn, and Co at a laser energy of 30–90 mJ.
3.2 Optimization of spectral acquisition delay
During the initial stages of plasma formation, the strong signal generation is accompanied by a high level of background noise due to the interference of the bremsstrahlung (Fu et al., 2020; Nosrati et al., 2020). As the signal decays at a much lower rate than the background noise, time-delayed collection is required. When the acquisition is performed after the background noise has been almost exhausted, the signal with a high signal-to-noise ratio (SNR) can be obtained.
As presented in Figure 4, when the delay is −150 μs to +18 μs, the SNR tends to rise slowly as the signal decays at a rate much lower than the background decay. The SNR increases abruptly and rapidly during the delay phase of 18–18.5 μs and decreases fast during the phase of 18.5–19 μs. With a delay time of 18.5–30 μs, the SNR shows a decreasing trend, which could be due to the background noise nearly decaying out and the signal continuing to decay. The signal can be extracted to a highly SNR peak in a short time, which puts a demand on the delay time resolution of the spectral collection delay; a higher resolution of the delay time enables the near step change features in the vicinity of the peak to be captured, thus allowing the highest SNR transient excitation spectrum to be obtained. The reason for spectral acquisition delay optimization is that the high-energy laser focused on the sample surface causes charged particles to collide with atoms and suddenly slow down to produce bremsstrahlung.
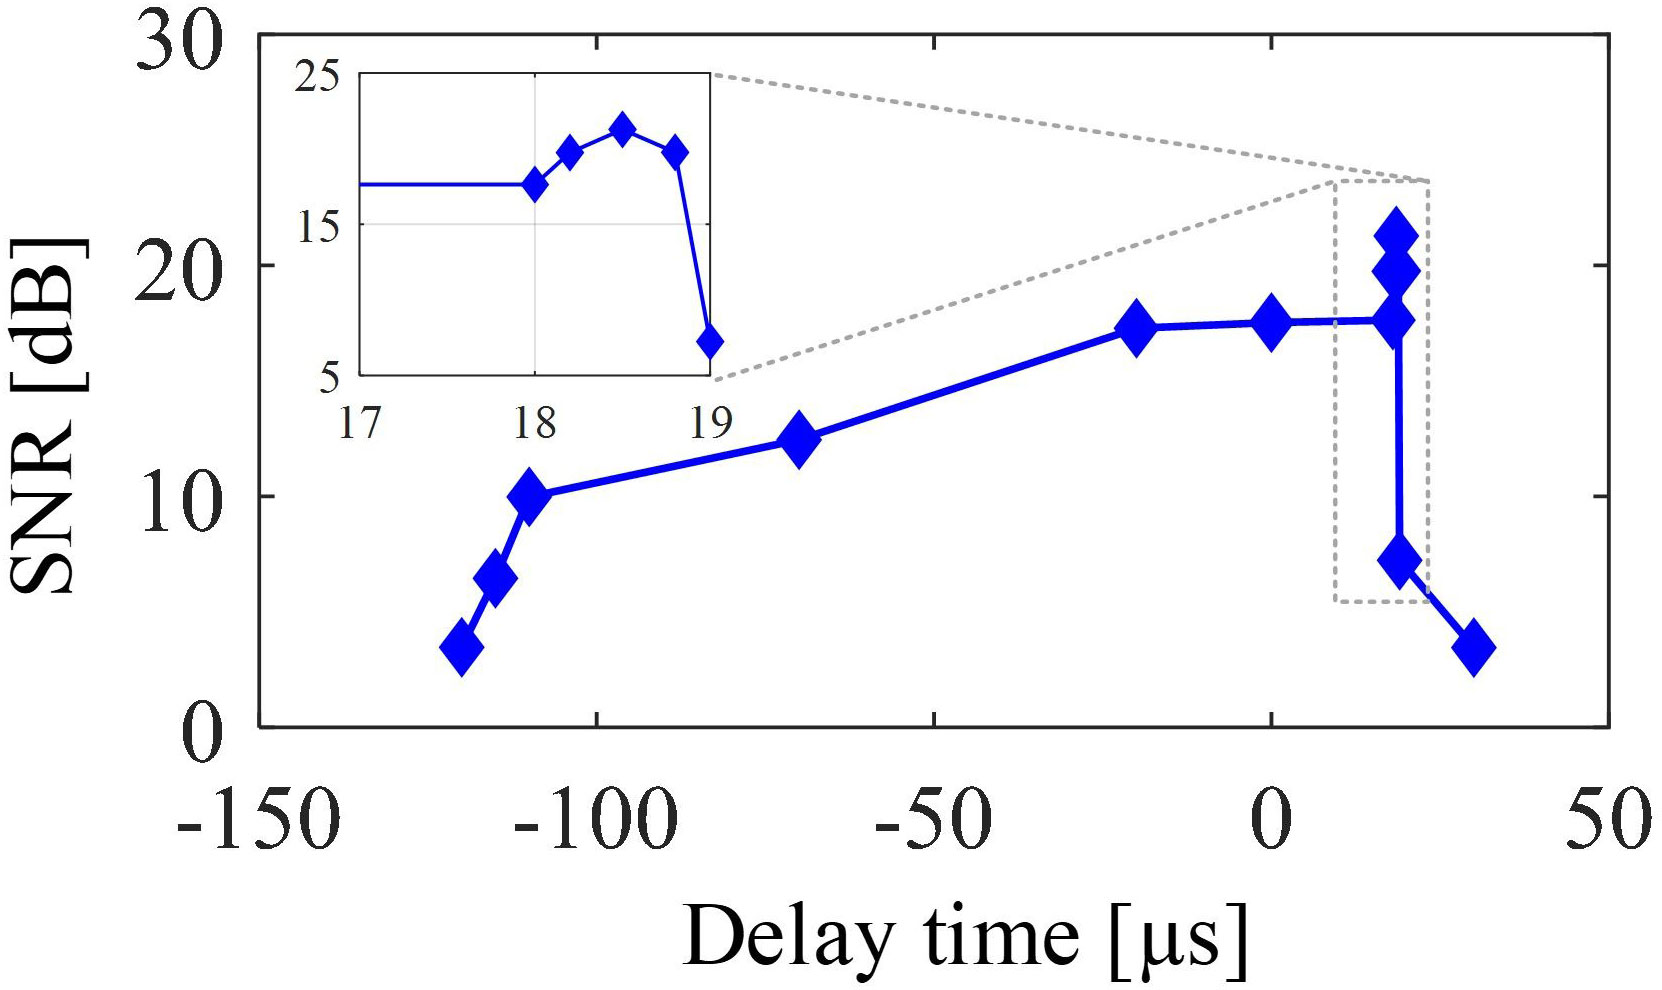
Figure 4 The figure of signal-to-noise ratio changing with spectral acquisition delay.
4 Experiment and results
4.1 Stability measurement and analysis of laser energy
During deep-ocean exploration missions, we tend to execute long-term ocean-going offshore field exploration surveys. Due to the power supply and distribution on ocean-going measurement vessels and the harsh environment at sea, the intensity, surge, and reflection ripple of the supply voltage to the LIBS equipment and its lasers may change accordingly, resulting in the instability of the laser energy and a drift in the intensity of the excitation spectrum, which will finally reduce the accuracy of the spectral measurements. Hence, there is a need to measure and evaluate the effect of laser energy instability on the precision of spectral measurements.
The instrument utilizes a beam splitting mirror fitted to the laser outlet for laser energy splitting, with a beam splitting ratio of 1:1. The laser we use has an energy of approximately 100 mJ, and the energy of the laser beam after the beam splitting mirror is approximately 50 mJ. Under conditions of stable supply voltage, the standard deviation of the laser’s own energy is 0.433 after actual measurements, with the small fluctuations in its energy having essentially no effect on the system’s measurements.
We then simulate the undulating drift of the laser energy by adjusting the linear polarization angle of the polarizer. When the laser energy fluctuates in the interval of 50–56 mJ, the collected sample excitation characteristic peak spectrum is also obtained to fluctuate in the intensity range of 4,300–4,600 by the real measurements. As shown in Figure 5, for every 2-mJ fluctuation in laser energy, the characteristic spectral lines fluctuate by roughly 100. For the laser employed in this equipment, it is required to ensure that the laser energy fluctuates by less than 2 mJ if the intensity of the characteristic spectrum is to be fluctuated within 100.
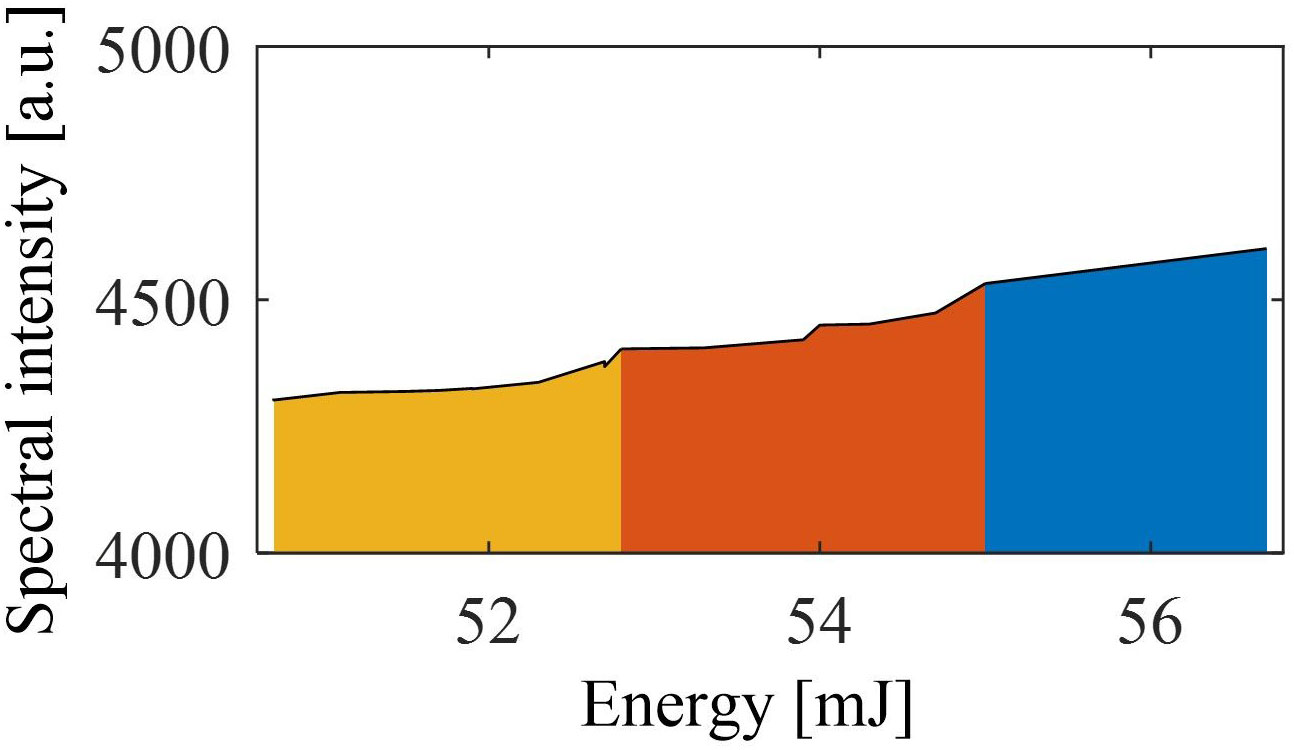
Figure 5 The figure of relationship between the fluctuation of laser energy and the change of spectral intensity.
4.2 Influence of sample surface roughness on spectral measurement
As the mineral samples we collected from the deep ocean was simply polished without more complex pretreatment, the surfaces of the samples are still undulating. In order to verify the effect of the extent of surface undulations on the spectra of deep-ocean ores, we microstimulated the laser focus location (i.e., the surface of the sample at the sample ablation location) by modeling the cut surface as a smooth bevel at a certain angle. The effect of surface roughness on the spectra of deep-ocean ores is illustrated by measuring the effect of different angle bevels at the sample surface on the spectrum.
During the changing of the slope of the sample with the use of the slope tool, if the height of the 3D translation platform is not adjusted, the focusing position will change accordingly and reduce the focusing quality of the laser spot. A Charge-coupled Device (CCD) sensor is placed coaxially with the focusing mirror to ensure consistency of focus. The accuracy of spot focusing can be judged according to the focusing image obtained by the CCD sensor. As shown in Figure 6, the spot image is clear in the best focusing position. The spot image is blurred under defocus conditions. The larger the defocus distance, the blurrier the image.
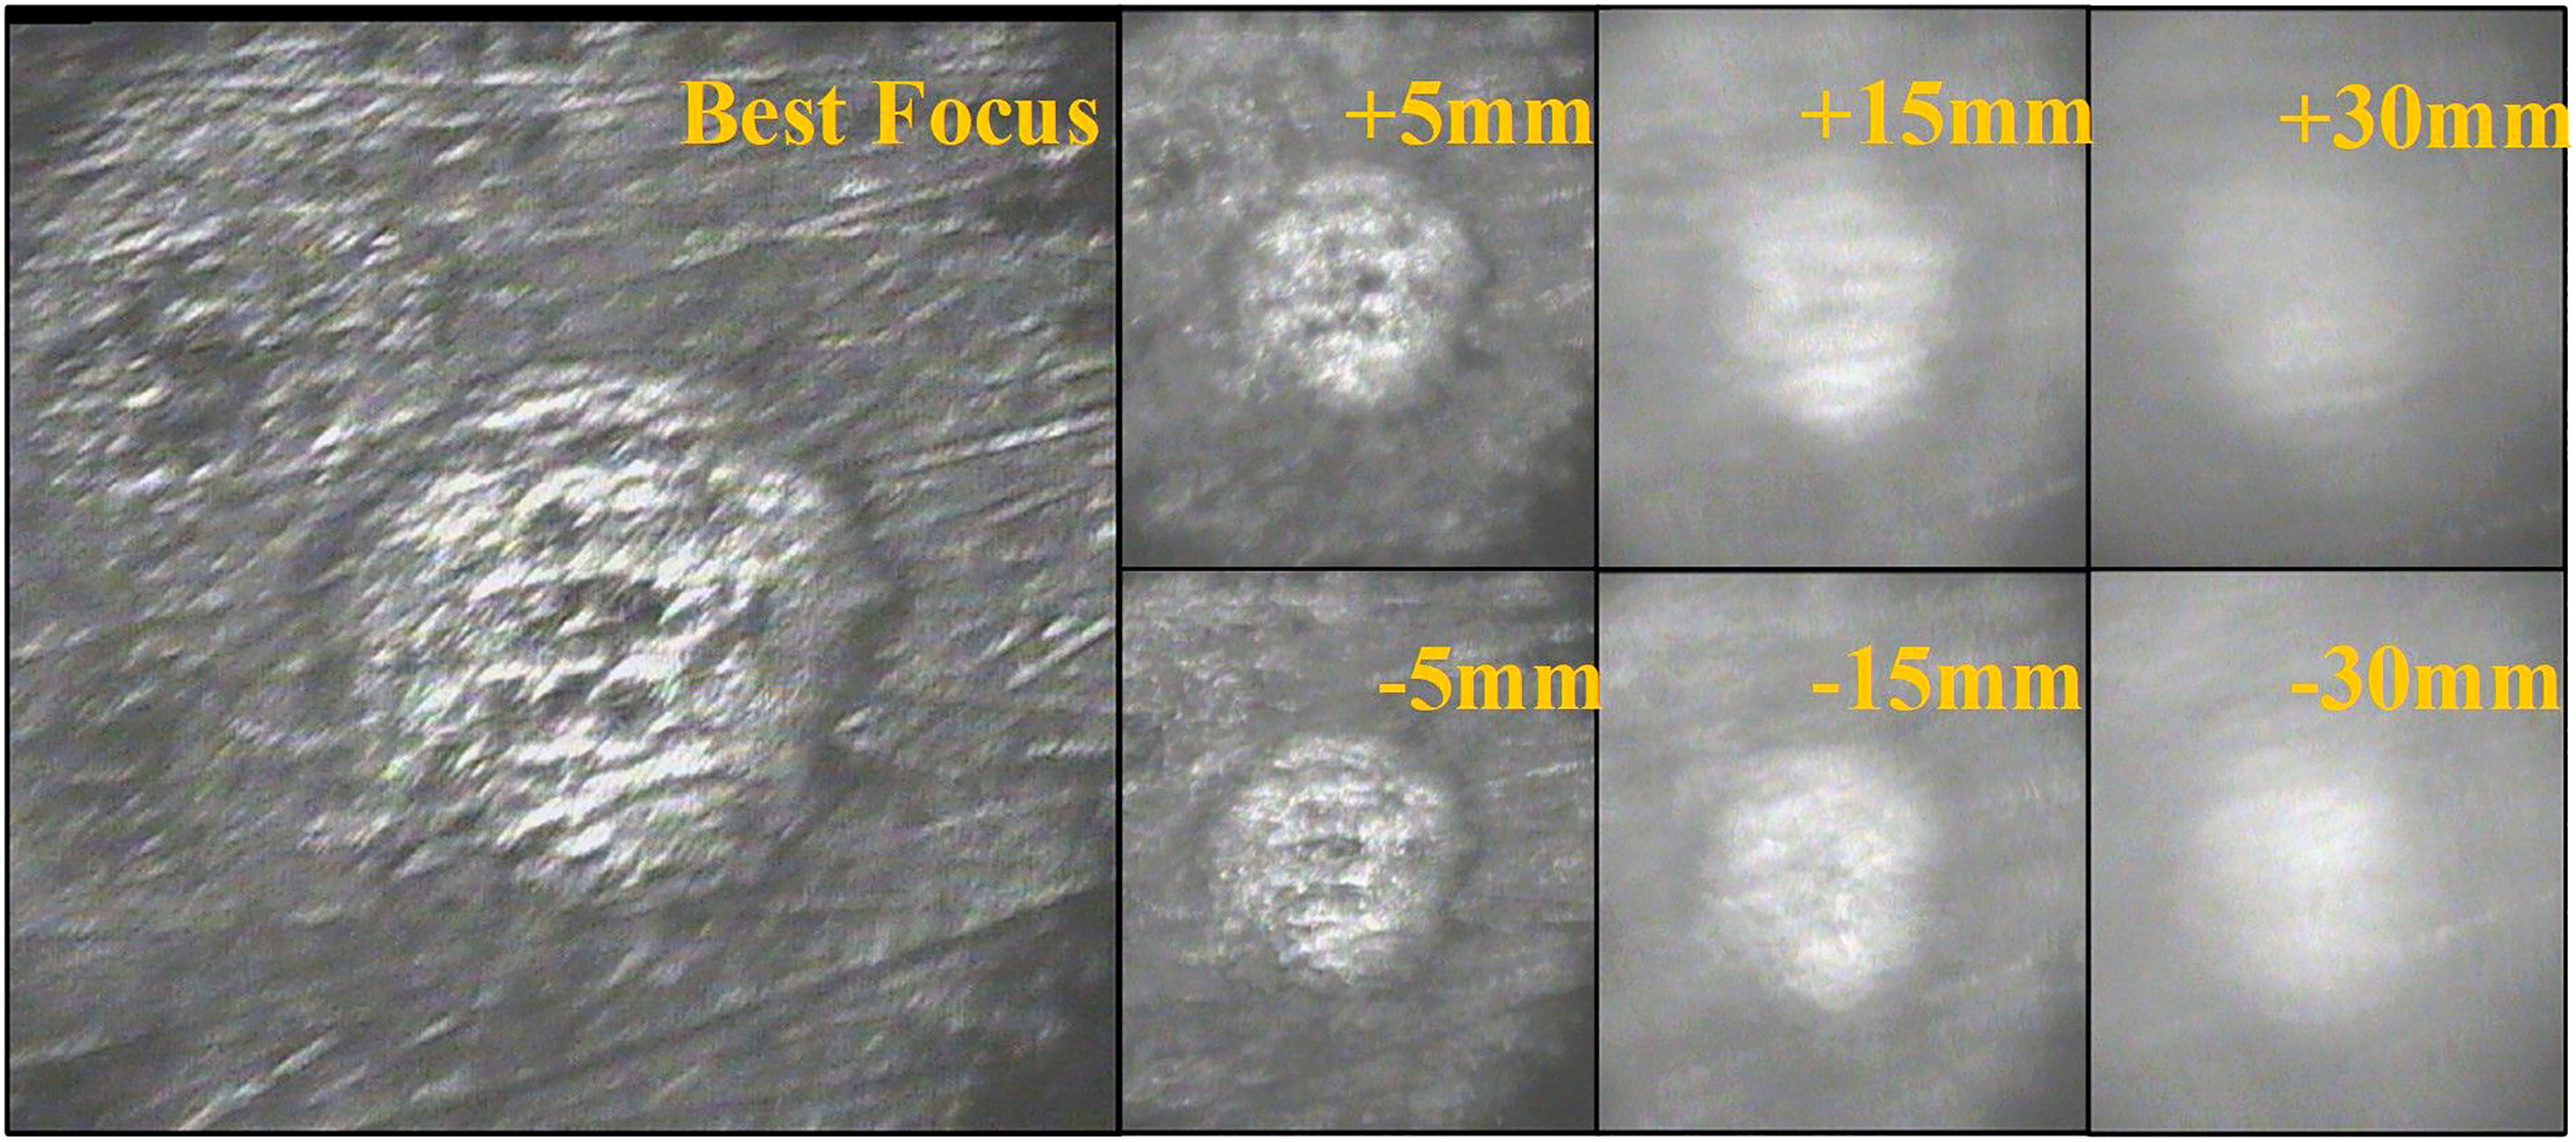
Figure 6 Focus photo and defocus photos by CCD.
We have simulated the ore spectra generated from the same sample ablation point for inclination angles of 0° , 15° , 22° , 30° , 37°, and 45° of the slope. As shown in Figure 7, the spectrum varies insignificantly at slope angles of 0° and 15° , the total intensity of the spectrum decreases at a bevel angle of 22° , the decline is 1/5 of the overall, and at a bevel angle of 22° – 45° , the overall intensity of the spectrum follows a continuing downward trend. The results show that if the spectral signal needs to remain stable, the roughness of the sample surface should be less than 15° in the section of the sample ablative position.
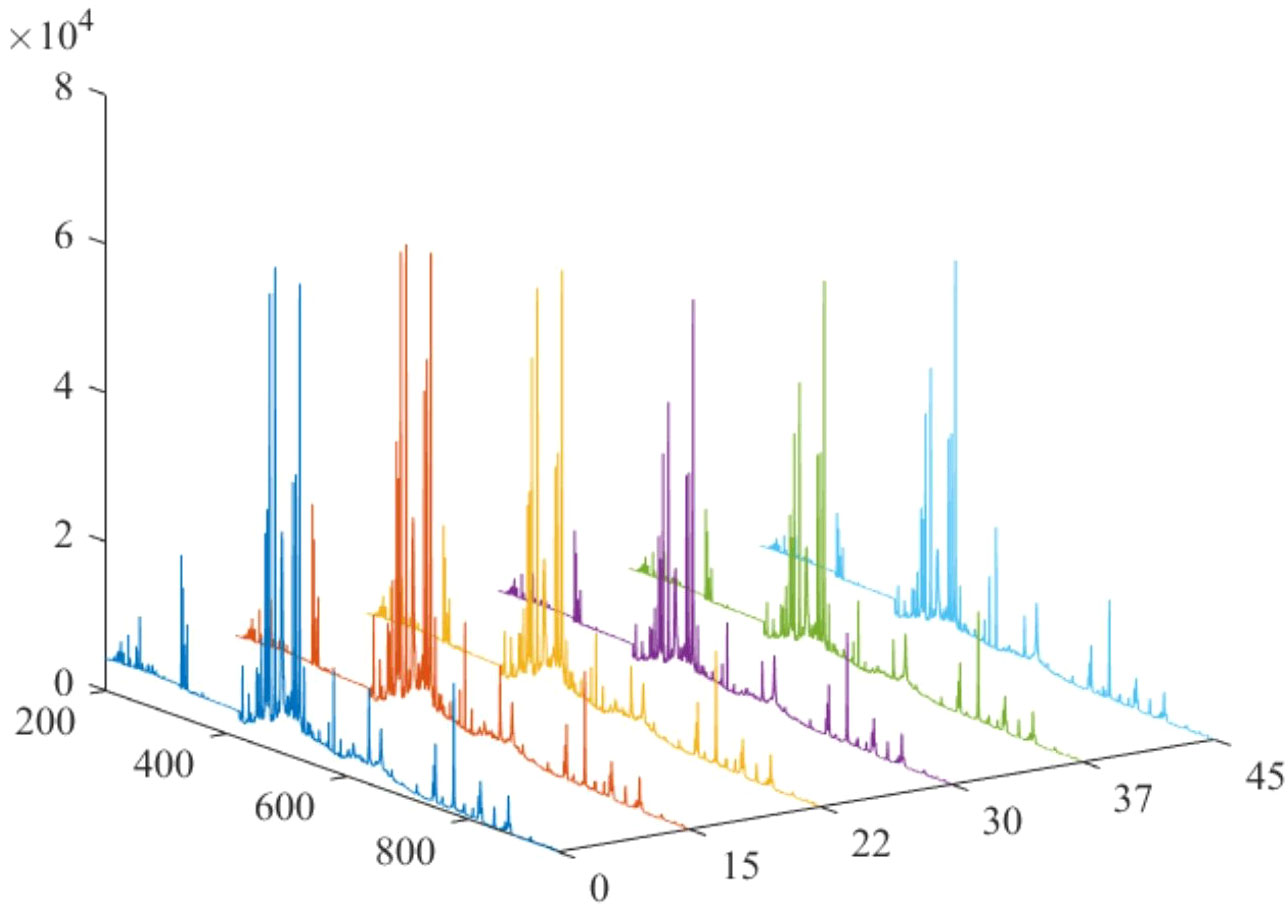
Figure 7 The variation of spectra of the sample ablative section angle from 0° to 45°.
5 Data analysis and calibration
The calibration-free model (CF-LIBS) (Ciucci et al., 1990; Dell’Aglio et al., 2018; Ferus et al., 2018; Umar et al., 2018) is implemented on the premise of three basic assumptions: (1) the elemental composition of the plasma produced by LIBS corresponds exactly to the elemental constitution of the sample analyzed before ablation, which is also known as chemometric ablation; (2) the plasma formed by LIBS is in the local thermodynamic equilibrium (LTE), judged by Eq. (1), which specifically means that the excitation rate of all the energy levels p and q that collide cannot be less than 10 times the rate of spontaneous radiation; and (3) the plasma from LIBS is in an optically thin state, meaning that no self-absorption is present in the plasma emission spectrum.
where Te is the electron temperature, Ne is the electron density, and Δ E is the maximum energy difference of the ions analyzed. Based on the three fundamental assumptions, the mathematical relationship between the spectral line intensities and the plasma parameters can be expressed by Eq. (2):
In Eq. (2), is the intensity of the integrated spectral line at the leap wavelength λ; i and j are the high and low energy levels of the electron leap corresponding to the leap wavelength λ; F is the experimental constant; Cs is the relative concentration of emitting species in the plasma; s is the particle species; Aij is the probability of jumping for a given spectral line; gi is the statistical weight of energy level i; T is the excitation temperature of the plasma; Ei is the energy of particle energy level i; kB is the Boltzmann constant; and Us(T) is the partition function of the species s at temperature T, which can be calculated by Eq. (3):
By taking the logarithm of Eq. (2), the equation can be transformed into a linear form:
In Eq. (4), a is the slope; qs is the intercept, where qs= ln CsFUs(T) , a = − 1 kBT , , and x = Ei. The two-dimensional plane defined by the x and y coordinates is called the Boltzmann plane, and every characteristic spectral line obtained by the experiment can be plotted as a point on the Boltzmann plane. Therefore, each chemical element in the sample that needed to be measured can be formulated using a relationship similar to Eq. (4) and plotted on the Boltzmann line. From Eq. (4), the slope a is related to the plasma temperature, while qs is proportional to the logarithm of the particle concentration. According to the properties of LIBS plasma, the temperature of each particle in the plasma is the same; therefore, the Boltzmann lines of different elemental particles in the sample have theoretically the same slope.
The plasma temperature obtained from the plotted Boltzmann diagram is utilized to calculate the particle distribution function Us(T); then, combining with the intercept qs of each particle in the Boltzmann diagram, the concentration Cs of each particle can be obtained. F can be obtained by normalizing the elemental concentrations:
By substituting the calculated F into Eq. (6), the mass percentages of the various particles and analyzed elements can be acquired.
where is the concentration of the atom of the element being analyzed, is the concentration of the ion of the element being analyzed, and is the concentration of the element being analyzed.
As shown in Table 2, the final mass fractions of the elements Fe and Mn were calculated to be 26.2% and 15.3%, respectively, by using the calibration free method; in comparison with the ICP elemental determination, the relative errors reached 14.4% and 13.1% (Xinglong et al., 2012; Dehua et al., 2016; Lei et al., 2019), respectively, and the measurement accuracy could meet the practical requirements for the offshore near-in situ chemical fraction analysis of deep-sea Fe-Mn crusts.
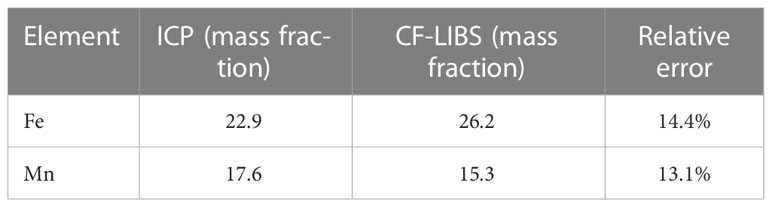
Table 2 The relative measurement error analysis of ICP and CF-LIBS measurement results and.
6 Conclusion
A laser-induced breakdown spectroscopy instrument has been designed and built to the spectrum of chemical elements of deep-ocean Fe-Mn crusts. The overall spectral response range of the hyperspectral detector is 200–950 nm. The broad spectrum of LIBS was divided into three channels: 200–320 nm, 320–420 nm, and 420–950 nm, with a detection accuracy of 0.05 nm, 0.05 nm, and 0.1 nm, respectively. Hyperspectral data of Fe-Mn crusts have been carried out by the LIBS system during a deep-sea exploration mission at a depth of 2,490 m in the South China Sea. Through measurement and parameter optimization, and with a laser energy of 90 mJ and a delay time of 18.5–19 μs, the highest spectral resolution and SNR were obtained. The significant spectral features of the chemical elements Fe and Mn were obtained through proper alignment with the NIST chemical element spectral library based on the free spectral calibration. As shown by the results of the experiment, the LIBS instrument and spectrum processing method provide a technical foundation for the near-insitu component detection in deep-ocean resource explorations in the future.
Data availability statement
The original contributions presented in the study are included in the article/supplementary material. Further inquiries can be directed to the corresponding authors.
Author contributions
GY completed the design and construction of the equipment/instrument. GC conducted the experimental tests and data analysis method. ZC participated in manuscript preparation and data processing. XQ organized the deep-ocean exploration and supervised the project. YZ conceived the work and provided guidance in manuscript preparation. All authors contributed to the article and approved the submitted version.
Funding
This study was supported by the National Natural Science Foundation of China (62105119 and 62275099) and Youth Innovation Promotion Association CAS (No. 2020361).
Acknowledgments
The authors thank Ming Chen (Institute of Deep-sea Science and Engineering, Chinese Academy of Science) for the assistance during the experiment and data measurement.
Conflict of interest
The authors declare that the research was conducted in the absence of any commercial or financial relationships that could be construed as a potential conflict of interest.
Publisher’s note
All claims expressed in this article are solely those of the authors and do not necessarily represent those of their affiliated organizations, or those of the publisher, the editors and the reviewers. Any product that may be evaluated in this article, or claim that may be made by its manufacturer, is not guaranteed or endorsed by the publisher.
References
Becker-Ross H., Okruss M., Florek S., Heitmann U., Huang M. D. (2002). Echelle-spectrograph as a tool for studies of structured background in flame atomic absorption spectrometry, spectrochim. Acta Part B 57, 1493–1504. doi: 10.1016/S0584-8547(02)00107-6
Bell K. L.C., Chow J. S., Hope A., Quinzin M. C., Cantner K. A., Amon D. J., et al. (2022). Low-cost, deep-ocean imaging and analysis tools for deep-ocean exploration: a collaborative design study. Front. Mar. Sci. 9. doi: 10.3389/fmars.2022.873700
Chen T. Y., Ling H. F., Hu R., Frank M. (2013). Lead isotope provinciality of central north pacific deep water over the Cenozoic. Geochemistry Geo-physics Geosystems 14 (5), 1523–1537. doi: 10.1002/ggge.20100
Ciucci A., Corsi M., Palleschi V., Rastelli S., Salvetti A., Tognoni E. (1990). New procedure for quantitative elemental analysis by laser-induced plasma spectroscopy. Appl. Spectrosc. 53, 960–964. doi: 10.1366/0003702991947612
Corliss J. B., Dymond J., Gordon L. I., Edmond J. M., Von Herzen R. P., Ballard R. D., et al. (1979). Submarine thermal springs on the galápagos rift. Science 203, 1073–1083. doi: 10.1126/science.203.4385.1073
Dehua Z., Cao Y., Rong and C. Xiaojing Z. (2016). Quantitative analysis of composition change in AZ31 magnesium alloy using CF-LIBS after laser material processing. Plasma Sci. Technol. 17, 909–913. doi: 10.1088/1009-0630/17/11/03
Dell’Aglio M., Lopez-Claros M., Laserna J. J., Longo S., Giacomo A. (2018). Stand-off laser induced breakdown spectroscopy on meteorites: calibration-free approach, spectrochim. Acta Part B At. Spectrosc 147, 87–92. doi: 10.1016/j.sab.2018.05.024
Ferus M., Koukal J., Lenˇza L., Srba J., Kubelík P., Laitl V., et al. (2018). Calibration-free quantitative elemental analysis of meteor plasma using reference laser-induced breakdown spectroscopy of meteorite samples. Astron. Astrophys 610, 1–12. doi: 10.1051/0004-6361/201629950
Fu C., Wu D., Wang Q., Sun L., Wang and H. Ding Y. (2020). Time-resolved study of bremsstrahlung emission and spectra at the early stage in a nanosecond laser ablated tungsten plasma. J. Of Insturment 15, C02022. doi: 10.1088/1748-0221/15/02/C02022
Hein J. R., Koschinsky A. (2014). “Deep-ocean ferromanganese crusts and nodules,” in Treatise on geochemistry, 273–291. doi: 10.1016/B978-0-08-095976-7.01111-6
Hein J. R., Mizell K., Koschinsky A., Conrad T. A. (2013). Deep-ocean mineral deposits as a source of critical metals for high-and green-technology applications: Comparison with land-based resources. Ore Geology Rev. 51, 1–14. doi: 10.1016/j.oregeorev.2012.12.001
Huang H., Sun Z., Liu S., Di Y. N., Xu J. Z., Liu C. C., et al. (2021). Underwater hyperspectral imaging for in situ underwater microplastic detection. Sci. Total Environ. 776, 145960. doi: 10.1016/j.scitotenv.2021.145960
Jiang X. D., Zhao X., Zhao X. Y., Chou Y. M., Hein J. R., Sun X. M., et al. (2021). A magnetic approach to unravel-ling the paleoenvironmental significance of nanometer-sized fe hy-droxide in NW pacific ferromanganese deposits. Earth Planet-ary Sci. Lett. 565, 116945. doi: 10.1016/j.epsl.2021.116945
Kiefer J., Zhou B., Li Z. S., Alden M. (2015). Impact of plasma dynamics on equivalence ratio measurements by laser-induced breakdown spectroscopy. Appl. Opt 54, 4221–4226. doi: 10.1364/AO.54.004221
Lai C.-Z., De Grandpre M. D., Darlington R. C. (2017). Autonomous optofluidic chemical analyzers for marine applications: insights from the submersible autonomous moored instruments (SAMI) for pH and pCO(2). Front. Mar. Sci. 4. doi: 10.3389/fmars.2017.00438
Lavigne J.-F., Doucet M., Wang M., Lacoursière J., Grill M., Melchiorri R., et al. (2010). Study of the image quality and stray light in the critical design phase of the compact echelle spectrograph for aeronomical research (CESAR). Proc. SPIE 7735, 773539. doi: 10.1117/12.857509
Lei Z., Shuxia Z., Ying S. (2019). Quantitative CF-LIBS analysis of alloys via comprehensive calibration of plasma temperature and spectral intensity. Scientia Sinica-physica Mechanica Astronomica 48. doi: 10.1360/SSPMA2017-00221
Lusty P. A. J., Hein J. R., Josso P. (2018). Formation and occurrence of ferromanganese crusts: earth's storehouse for critical metals. Elements 14 (5), 313–318. doi: 10.2138/gselements.14.5.313
Lusty P. A. J., Murton B. J. (2018). Deep-ocean mineral deposits: metal resources and windows into earth processes. Elements 14, 301–306. doi: 10.2138/gselements.14.5.313
Nosrati Y., Tavassoli S. H., Hassanimatin and A. Safi M. M. (2020). Study of material ablation and plasma radiation in double-pulse laser induced breakdown spectroscopy at different delay times:Modeling and numerical simulation. Phys. Plasmas 27, 023301. doi: 10.1063/1.5132804
Piskunov N. E., Valenti J. A. (2002). New algorithms for reducing cross-dispersed echelle spectra, astron. Astrophys 385, 1095–1106. doi: 10.1051/0004-6361:20020175
Umar Z. A., Ahmed N., Ahmed R., Liaqat U., Baig M. A. (2018). Elemental composition analysis of granite rocks using LIBS and LA-TOF-MS. Appl. Opt 57, 4985. doi: 10.1364/AO.57.004985
Xie P., Ni Z., Huang Y., Zhang D., Zhang Y. (2009). Application research progress in the echelle grating. Laser J. 30, 4–6. doi: 10.1109/JSTQE.2012.2213804
Xinglong C., Fengzhong D., Qi W. (2012). Quantitative analysis of slag by calibration-free laser-induced breakdown spectroscopy. Spectrosc. Spectral Anal. 31, 3289–3293. doi: 10.3964/j.issn.1000-0593(2011)12-3289-05
Xu L., Davonport M. A., Turner M. A., Sun T., Kelly K. F. (2011). Compressive echelle spectroscopy. Proc. SPIE 8165, 81650E. doi: 10.1117/12.894191
Xue Q., Tian Z., Bai Y., Liang J. S., Li C., Wang F. P., et al. (2021). Underwater hyperspectral imaging system using a prism-Grating-Prism structure. Appl. Optics. 60 (4), 894–900. doi: 10.1364/AO.415351
Yang G., Liu L., Wang T., Fan L. S., Huang X., Tian D., et al. (2020). Laser-induced breakdown spectroscopy of ammonia gas with resonant vibrational excitation. Optics Express 28, 1197–1205. doi: 10.1364/OE.382663
Keywords: deep ocean, marine spectral analysis, marine resource exploration, laser-induced breakdown spectroscopy, marine Fe-Mn crusts, parameter optimization
Citation: Yang G, Chen G, Cai Z, Quan X and Zhu Y (2023) Laser-induced breakdown spectroscopy instrument and spectral analysis for deep-ocean Fe-Mn crusts. Front. Mar. Sci. 10:1135058. doi: 10.3389/fmars.2023.1135058
Received: 31 December 2022; Accepted: 10 February 2023;
Published: 10 March 2023.
Edited by:
Hong Song, Zhejiang University, ChinaReviewed by:
Yuan Lu, Ocean University of China, ChinaTianlong Zhang, Northwest University, China
Aofei Mao, University of Nebraska-Lincoln, United States
Copyright © 2023 Yang, Chen, Cai, Quan and Zhu. This is an open-access article distributed under the terms of the Creative Commons Attribution License (CC BY). The use, distribution or reproduction in other forums is permitted, provided the original author(s) and the copyright owner(s) are credited and that the original publication in this journal is cited, in accordance with accepted academic practice. No use, distribution or reproduction is permitted which does not comply with these terms.
*Correspondence: Yang Zhu, emh1eWFuZ0BqbHUuZWR1LmNu; Xiangqian Quan, cXVhbnhxQGlkc3NlLmFjLmNu