 Wenfei Jia1,2
 Yujun Yi1,2*
- 1Ministry of Education Key Laboratory of Water and Sediment Science, School of Environment, Beijing Normal University, Beijing, China
- 2State Key Laboratory of Water Environment Simulation, School of Environment, Beijing Normal University, Beijing, China
Introduction: The transport of suspended sediment plays an important role in regulating erosion-accretion in estuaries. The Yellow River, the second longest river in China, which has a large amount of sediment and contributes sediment to the Yellow River Estuary (YRE) every year. The water and sediment discharge patterns in the lower reaches of the Yellow River have experienced significant changes over recent decades. In particular, the water-sediment regulation scheme (WSRS) of the Xiaolangdi Reservoir transports large amounts of water and sediment to the YRE within a very short time, causing dramatic changes in the spatiotemporal estuarine sediment dynamics.
Methods: In this study, we presented a coupled numerical model based on FVCOM-SWAVE-SED that considered the highly dynamic sediment variations in the YRE. The sediment distribution and erosion-accretion patterns in the YRE during the WSRS in 2013 were analyzed by the high-resolution model.
Results: The sediment entering the YRE spread with freshwater, forming a high sediment concentration zone near the river mouth, where most of the sediments were deposited. The sediment dispersal distance was limited by the tidal shear frontal (TSF), and the southeast outspread length of the sediment was slightly larger than the northwest spread. Outside of the YRE, the areas with high flow currents exhibited high erosion. We examined the effects of the main external driving forces (such as waves, tides, and runoff) on the sediment distribution and showed that runoff, tides, and waves were the key factors affecting the sediment distribution of the YRE.
Results: This study shows that WSRS effectively changes the sediment distribution and erosion condition in the YRE and provides a data for researches on changes in estuarine ecosystems.
1 Introduction
As the transitional zones between rivers and oceans, estuaries exhibit strong environmental variations caused by complex dynamic processes such as tidal currents, runoff, wind, waves, and storms. The sediment transport of estuaries is an important carrier of materials that circulate between land and marine ecosystems (Li et al., 2021). However, due to increasing human activities, including the construction and operation of water conservation projects, serious environmental problems, such as runoff discharge reduction, coastal erosion and seawater intrusion, have occurred in global estuary systems (Bertone et al., 2016; Chang et al., 2020).
The Yellow River is a nonnegligible sediment contributor to estuaries in the world (Wu et al., 2020), draining approximately 1 billion tons of sediment annually from the 1950s to 1970 due to the strong soil erosion of the Loess Plateau in the middle reach of the Yellow River (Ren et al., 2002; Yang et al., 2018). The Yellow River Estuary (YRE) is one of the most turbid water areas in the world due to a large amount of sediment discharge (Zhang et al., 2021). To mitigate siltation and maintain reservoir storage capacity, the Yellow River Conservancy Commission initiated the water-sediment regulation scheme (WSRS) in 2002. The WSRS was implemented during 2002-2015, as well as in 2018, and generally lasted for 20 days from mid-June to early July. During this short period, more than 30% and 60% of the annual water and sediment, respectively, were discharged into the Bohai Sea (Bi et al., 2014; Li and Sheng, 2011). The WSRS inputs very large amounts of water and sediment into the YRE over a short period, which are much greater than the river discharge during the natural flood seasons (Ji et al., 2020). The WSRS altered the natural hydrologic processes and significantly changed the physical and chemical properties of the YRE and the distribution characteristics of the estuarine sediment (Li and Sheng, 2011; Zhang et al., 2021). It is of great importance to investigate how the changed sediment dynamics affect the spatiotemporal pattern of the suspended sediment concentration (SSC) in the YRE.
The dispersal and deposition of sediments from the Yellow River plume have been investigated by previous studies in the following ways: i) field observations of sediment deposition and the influence of hydrodynamic conditions (Jiang et al., 2002; Li et al., 2010), ii) satellite imagery of the distribution of surface suspended sediment over the shelf (Li et al., 2021), and iii) numerical simulations of the spatiotemporal distribution of suspended sediment in the Bohai Sea (Li et al., 2010; Teng et al., 2015). For the numerical simulations, many studies have been performed. For instance, Wang and Li (2009) used the Estuarine, Coastal Ocean Model with Sediment Transport (ECOMSED) to simulate the sediment in the YRE, and their results revealed that the suspended sediment in the Bohai Sea showed obvious seasonal differences. The sediment resuspension in winter was obviously stronger than that in summer due to the stronger wind waves. Pang and Yu (2013) quantitatively analyzed the distribution of suspended sediment in the surface layer of the Bohai Sea and the effect of wind, waves, and tides on the sediment resuspension process. Li et al. (2019) discussed the transport path of suspended sediment in the Bohai Sea and Yellow Sea using remote sensing images and the Hybrid Coordinate Ocean Model (HYCOM). Further analysis was conducted on the effects of runoff, tides, and waves on the sediment distribution in the YRE. The tidal shear front was found to limit the dispersion range of suspended sediment to the south of Laizhou Bay (Zhan et al., 2020), and waves were reported to be closely related to sediment resuspension (Lu et al., 2011). However, all these numerical simulations were based on large-scale freshwater/sediment plume modeling due to the low horizontal grid resolution at and near the YRE. Thus, the structure of the near-field plumes is not accurately captured in these models, let alone the partitioning of freshwater and sediment fluxes at the various passages.
Moreover, the WSRS caused great changes in the runoff and sediment discharge of the Yellow River into the sea as well as in the complex hydrodynamics and sediment deposition patterns of the YRE. The inter- or intraday variations in the sediment during this short-term event and their associated driving forces (such as tides, waves, wind, and runoff) have rarely been considered in previous studies. Thus, the objectives of this study were i) to develop a high-resolution sediment transport model that provides a comprehensive description of the spatiotemporal variation in sediment in the YRE; ii) to analyze the sediment distribution characteristics of the YRE during the WSRS; and iii) to demonstrate how waves, tides and runoff affect sediment transport and distribution. Although this study focused on the YRE, the methods may be applicable to similar estuaries worldwide.
2 Data and methodology
2.1 Study area
The computational domain of this study is in the Bohai Sea, which extends eastward to 122.70°E, westward to 117.60°E, southward to 37.10°N, and northward to 41.09°N (Figure 1). The Yellow River, the second largest river in China, accounts for more than 75% of the total freshwater input of the Bohai Sea (Ren et al., 2002). The annual average discharge of the Yellow River from 2000 to 2010 is 155 × 108 m3, more than 60% of which is discharged into the Bohai Sea (Xu et al., 2013). The WSRS of the Xiaolangdi reservoir was implemented in 2002, and its annual operation duration is 10-20 days, during which 30-45% of the annual sediment load of the Yellow River is delivered to the YRE (Wang et al., 2010; Zhang et al., 2021). The salinity in the YRE is low due to the large input of freshwater. The nearshore water depth is less than 10 m, and the offshore water depth is approximately 19 m. The study area has a warm temperate continental monsoon climate, with an annual average temperature of 11.5–12.4°C and an annual average rainfall of 590.9 mm (Li et al., 2021). The YRE is a weak tidal estuary with mostly irregular semidiurnal tides and an average tidal range of 0.73-1.77 m (Zhang et al., 2021). The tidal current is usually a reciprocating flow parallel to the coastline, with a flow velocity of 0.5 to 1.0 m/s. The flood tides flow southeastward and the ebb tides flow northwestward (Bi et al., 2014). The waves in the YRE are mainly wind waves, with an average wave height of 1.5 m, and the wave strength varies with wind speed (Chu et al., 2006).
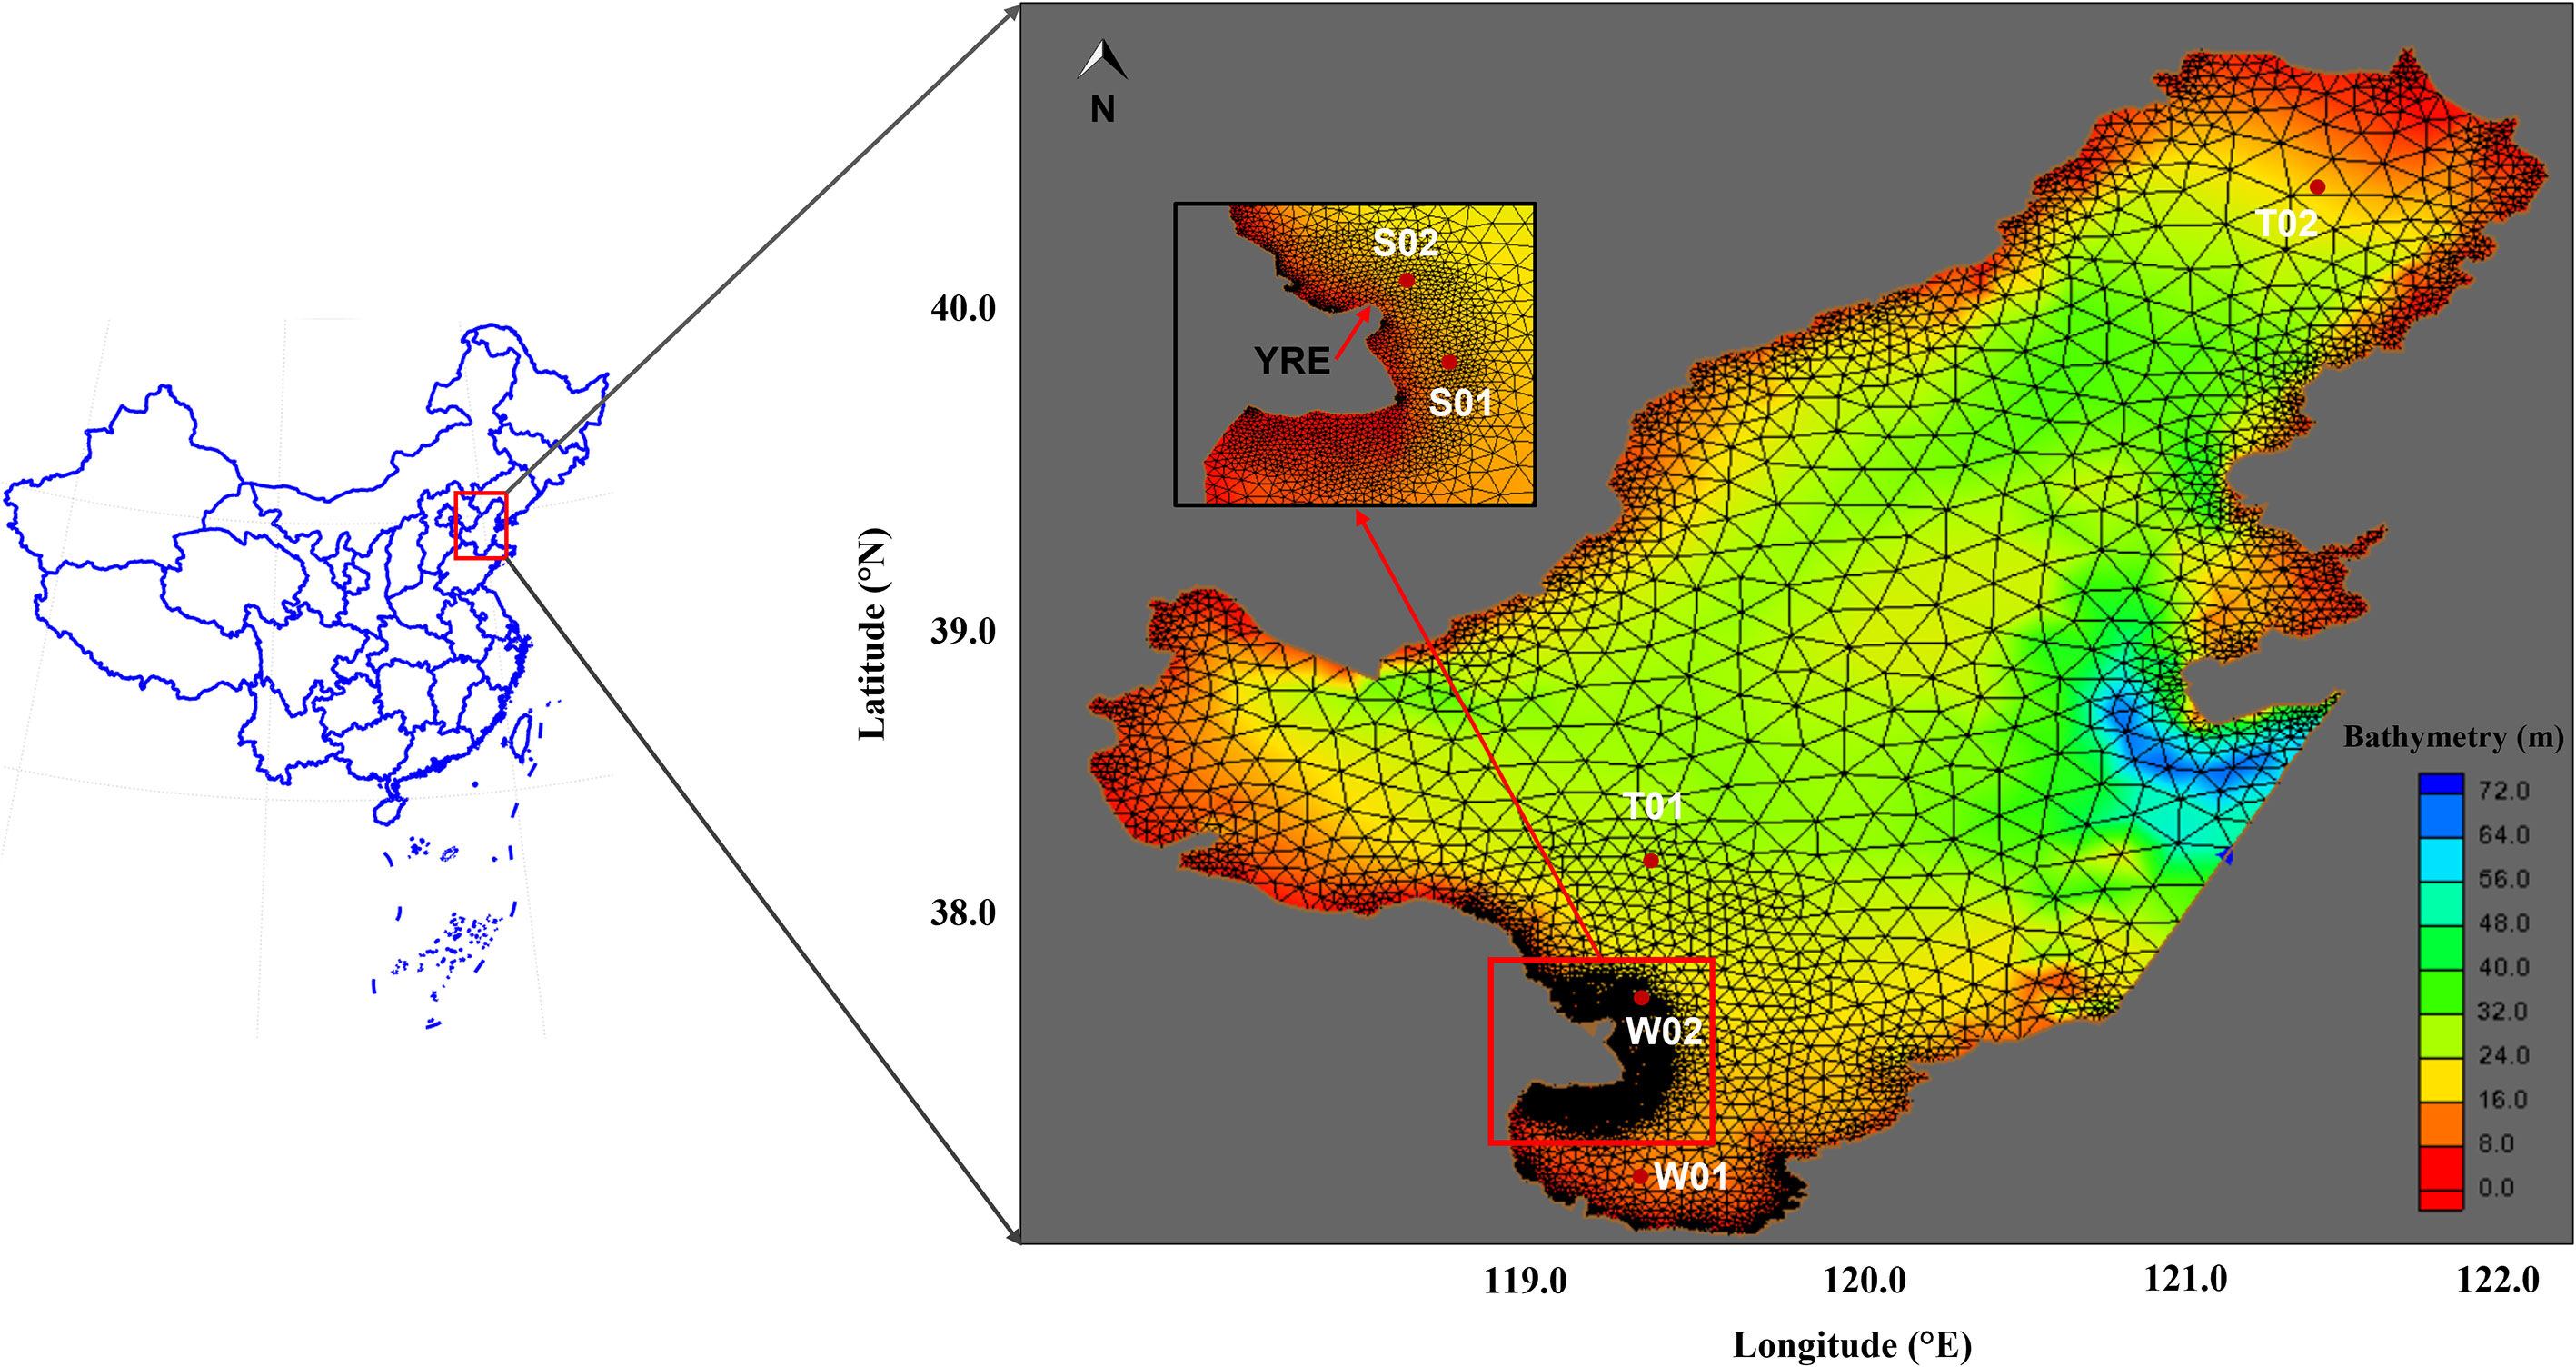
Figure 1 The numerical model domain and configuration of the FVCOM unstructured grid for the regional domain of the Bohai Sea and the local domain of the Yellow River Estuary, the observation points for tide, velocity, temperature and salinity (T01, T02), the observation points for significant wave height (W01, W02), and the observation points for sediment (S01, S02).
2.2 Model description
To analyze the effects of the WSRS on suspended sediment transportation in the YRE, the finite volume community ocean model (FVCOM), a 3D ocean model for hydraulic simulation, the FVCOM-SWAVE model for wave simulation and the FVCOM-SED for sediment simulation were used.
The FVCOM, which is an unstructured-grid and finite-volume model, solves the integral form of the governing equations for momentum, continuity, temperature, salinity, and density by calculating the fluxes over a triangular mesh composed of nonoverlapping horizontal control volumes using spherical coordinates (Chen et al., 2006). Turbulence closure is implemented by the MY-2.5 scheme for vertical mixing and the Smagorinsky scheme is used for horizontal mixing (Chen et al., 2006). The conservative nature of FVCOM, in addition to its flexible grid topology and code simplicity, make this model ideally suited for interdisciplinary applications in the coastal ocean.
FVCOM-SWAVE is the SWAN (Simulating Waves Nearshore) structured-grid surface wave model that is converted to an unstructured-grid, finite-volume version under the FVCOM framework. This model considers the characteristics of surface waves in shallow water by solving the wave action balance equation with the inclusion of dissipation from bottom friction, triad and quadruplet wave−wave interactions, and shallow water wave breaking (SWAN Team, 2008). The SWAN model is discretized using a curvilinear-structured grid and solved using fully implicit finite difference algorithms. By applying a coarse-fine grid nesting approach, SWAN can be set up with variable grids in deep and shallow ocean regions to provide high-quality simulations of the surface waves in the nearshore region. SWAN uses the flux-corrected transport (FCT) algorithm in frequency space, the implicit Crank-Nicolson method in directional space, and explicit or implicit second-order upwind finite-volume schemes in geographic space. FVCOM-SWAVE was developed for use in coastal ocean regions with a complex irregular geometry. FVCOM-SWAVE has been fully coupled with FVCOM and FVCOM-SED.
The FVCOM-SED model considers multiple underwater conditions and various sediment compositions, including suspended sediment and bed load transport, and can be applied to sediment transport simulations of continental shelves and estuaries. FVCOM version 4.0 also adds the sediment transport models of the Community Sediment Transport Model (CSTM). There are three important stages in the suspended sediment transport model: sedimentation, erosion and horizontal transport.
The main equations of the FVCOM-SWAVE-SED are showed in Appendix, and more detailed descriptions can be found in (Chen et al., 2006).
2.3 Bathymetry and validation data
Bohai shoreline data are obtained from the Landsat remote sensing interpretation of the U.S. Land Resources Satellite Remote Sensing Imagery data at a 30 m spatial resolution. The apparent land structure is set as the land, and the tidal flat area is considered the ocean. In addition, we modified the coastline using data matching with water depth from Google Earth. The water depth data are obtained from the electronic map of the Compass Department of the Admiralty, People’s Liberation Army of China, and interpolated using ArcGIS and SMS software.
The verification data for the tides are obtained from the Tidal Model Driver (TMD) tidal prediction system. The wave data are obtained from the ERA5 reanalysis products of the European Centre for Medium-Range Weather Forecasts (ECMWF, https://cds.climate.copernicus.eu/cdsapp#!/dataset/reanalysis-era5-single-levels?tab=form). The flow velocity, temperature and salinity data are global reanalysis data from the HYCOM global hybrid coordinate ocean model (https://www.hycom.org/data/glby0pt08/expt-93pt0). The water samples were collected every hour from 09:00 on August 25 to 09:00 on August 26, 2003, and analyzed in the laboratory to determine the SSC (Shi, 2008).
2.4 Model setup
The model uses a horizontal triangular grid covering the Bohai Sea and its offshore regions (Figure 1). The unstructured grid is composed of 8624 cells and 4675 nodes, with a horizontal resolution of approximately 8 km in the northern offshore boundary to approximately 30 m in the shallow YRE area. In the vertical direction, the numerical model has 15 nonuniformly distributed sigma layers.
There are many small gaps and outlets of the YRE and Bohai Sea, but only the Yellow River is explicitly resolved in FVCOM. It is believed that freshwater and sediment fluxes from the other small outlets contribute an insignificant amount of the total discharges compared with the Yellow River (Xu et al., 2013). Therefore, the hydrodynamic model is driven by wind and heating at the sea surface, water level elevation and waves at the open boundary, and freshwater inflows from the Yellow River. Most areas of the YRE are exposed to air at low tide because of the relatively shallow water and large tidal range. To account for these emergent tidal flats, the wetting and drying scheme is used by comparing the water level of each cell with a critical minimum depth of 0.1 m (Warner et al., 2013). The grid cell is assumed to be “land” when the modeled water depth is shallower than the critical minimum depth; otherwise, the grid cell is considered to be “sea”. Grid cells with alternating wet and dry natures mostly appear behind the exposed sand shoals at low tide.
The Yellow River is an inflow to the YRE and is used as the flow boundary of the model, which is forced by the daily river flux and water temperature. The daily runoff discharge and average sediment concentration of the Yellow River are obtained from the Yellow River Hydrologic Information Database of the Yellow River Conservancy Commission (http://www.yellowriver.gov.cn/) at Lijin Station.
At the open boundary, hourly sea level time series data are obtained from the TMD tidal prediction system. The sea surface elevation at the nodes of the open boundary is calculated by piecewise linear interpolation of the eight major tidal constituents: M2, S2, K1, O1, N2, K2, P1, and Q1.
Hourly heat flux, wind, and wave data with a resolution of 0.25° × 0.25° are obtained from the ERA5 reanalysis products of the ECMWF and are linearly interpolated to each time step and grid point. Heat flux data include temperature, dew point temperature, pressure, longwave radiation, and shortwave radiation. Wind speed is measured at 10 m above ground. Wave data include the significant wave height, wave direction, and wave period data. The initial temperature and salinity data are the global reanalysis data from the HYCOM that are interpolated horizontally and vertically onto the model grid points.
The internal model time step of the model system integration is 6.0 s, with an external model time step of 1.0 s. The initial velocity, water level and sediment concentration are specified as zero throughout the entire computational domain. The model verification period is from August 01 to September 30, 2003.
The sediment erosion parameters and other parameters are initially selected based on a similar study (Fan, 2019). The parameters are set as follows: sediment particle size of 0.05 mm, sediment density of 1600 kg/m3, sediment settling velocity of 0.15 mm/s, erosion rate of 5×10⁻⁴ m2/s, critical initial stress of 0.115 N/m2, and porosity of 0.5. The sediment model begins after the hydrodynamic model is run for 48 (model) hours. Only cohesive suspended sediments are considered because they make up the majority of suspended sediments and are most easily transported in the Bohai Sea. We assume that the sediments in the Yellow River and Bohai Sea have the same characteristics.
The sediment discharge of the Yellow River is from the Lijin Station. The proportion of fine sediment in the numerical model is determined by subtracting the sand load from the total load. Based on Fan’s (2019) research, 75% and 25% of the fine sediment discharge is apportioned for fine and silt sediments, respectively.
2.5 Verification skills
The hydrodynamic model is calibrated against the observation data, and the bottom roughness parameter z0 is varied to improve the model accuracy. The performance of the model is evaluated using two error statistics: root mean square error (RMSE) and correlation coefficient (CC). The computation formulas of the two parameters are:
where Xm is the modeled value, Xo is the observed value, superscript ¯ represents the arithmetic mean value, and n is the number of statistical variables.
3 Results
3.1 Model calibration and verification
The parameter that is needed to calibrate the hydrodynamic model is the bottom roughness parameter z0. The best performance, with an RMSE of 0.14 and a CC of 0.98, is obtained with a bottom roughness of 0.0037.
(1) Tidal level
The simulated tidal level and the observation values at T01 and T02 are shown in Figure 2. The statistical results of an RMSE of 0.1231 m and a CC of 0.9823 (Table 1) show the ability of the model to represent tide variations in the study area.
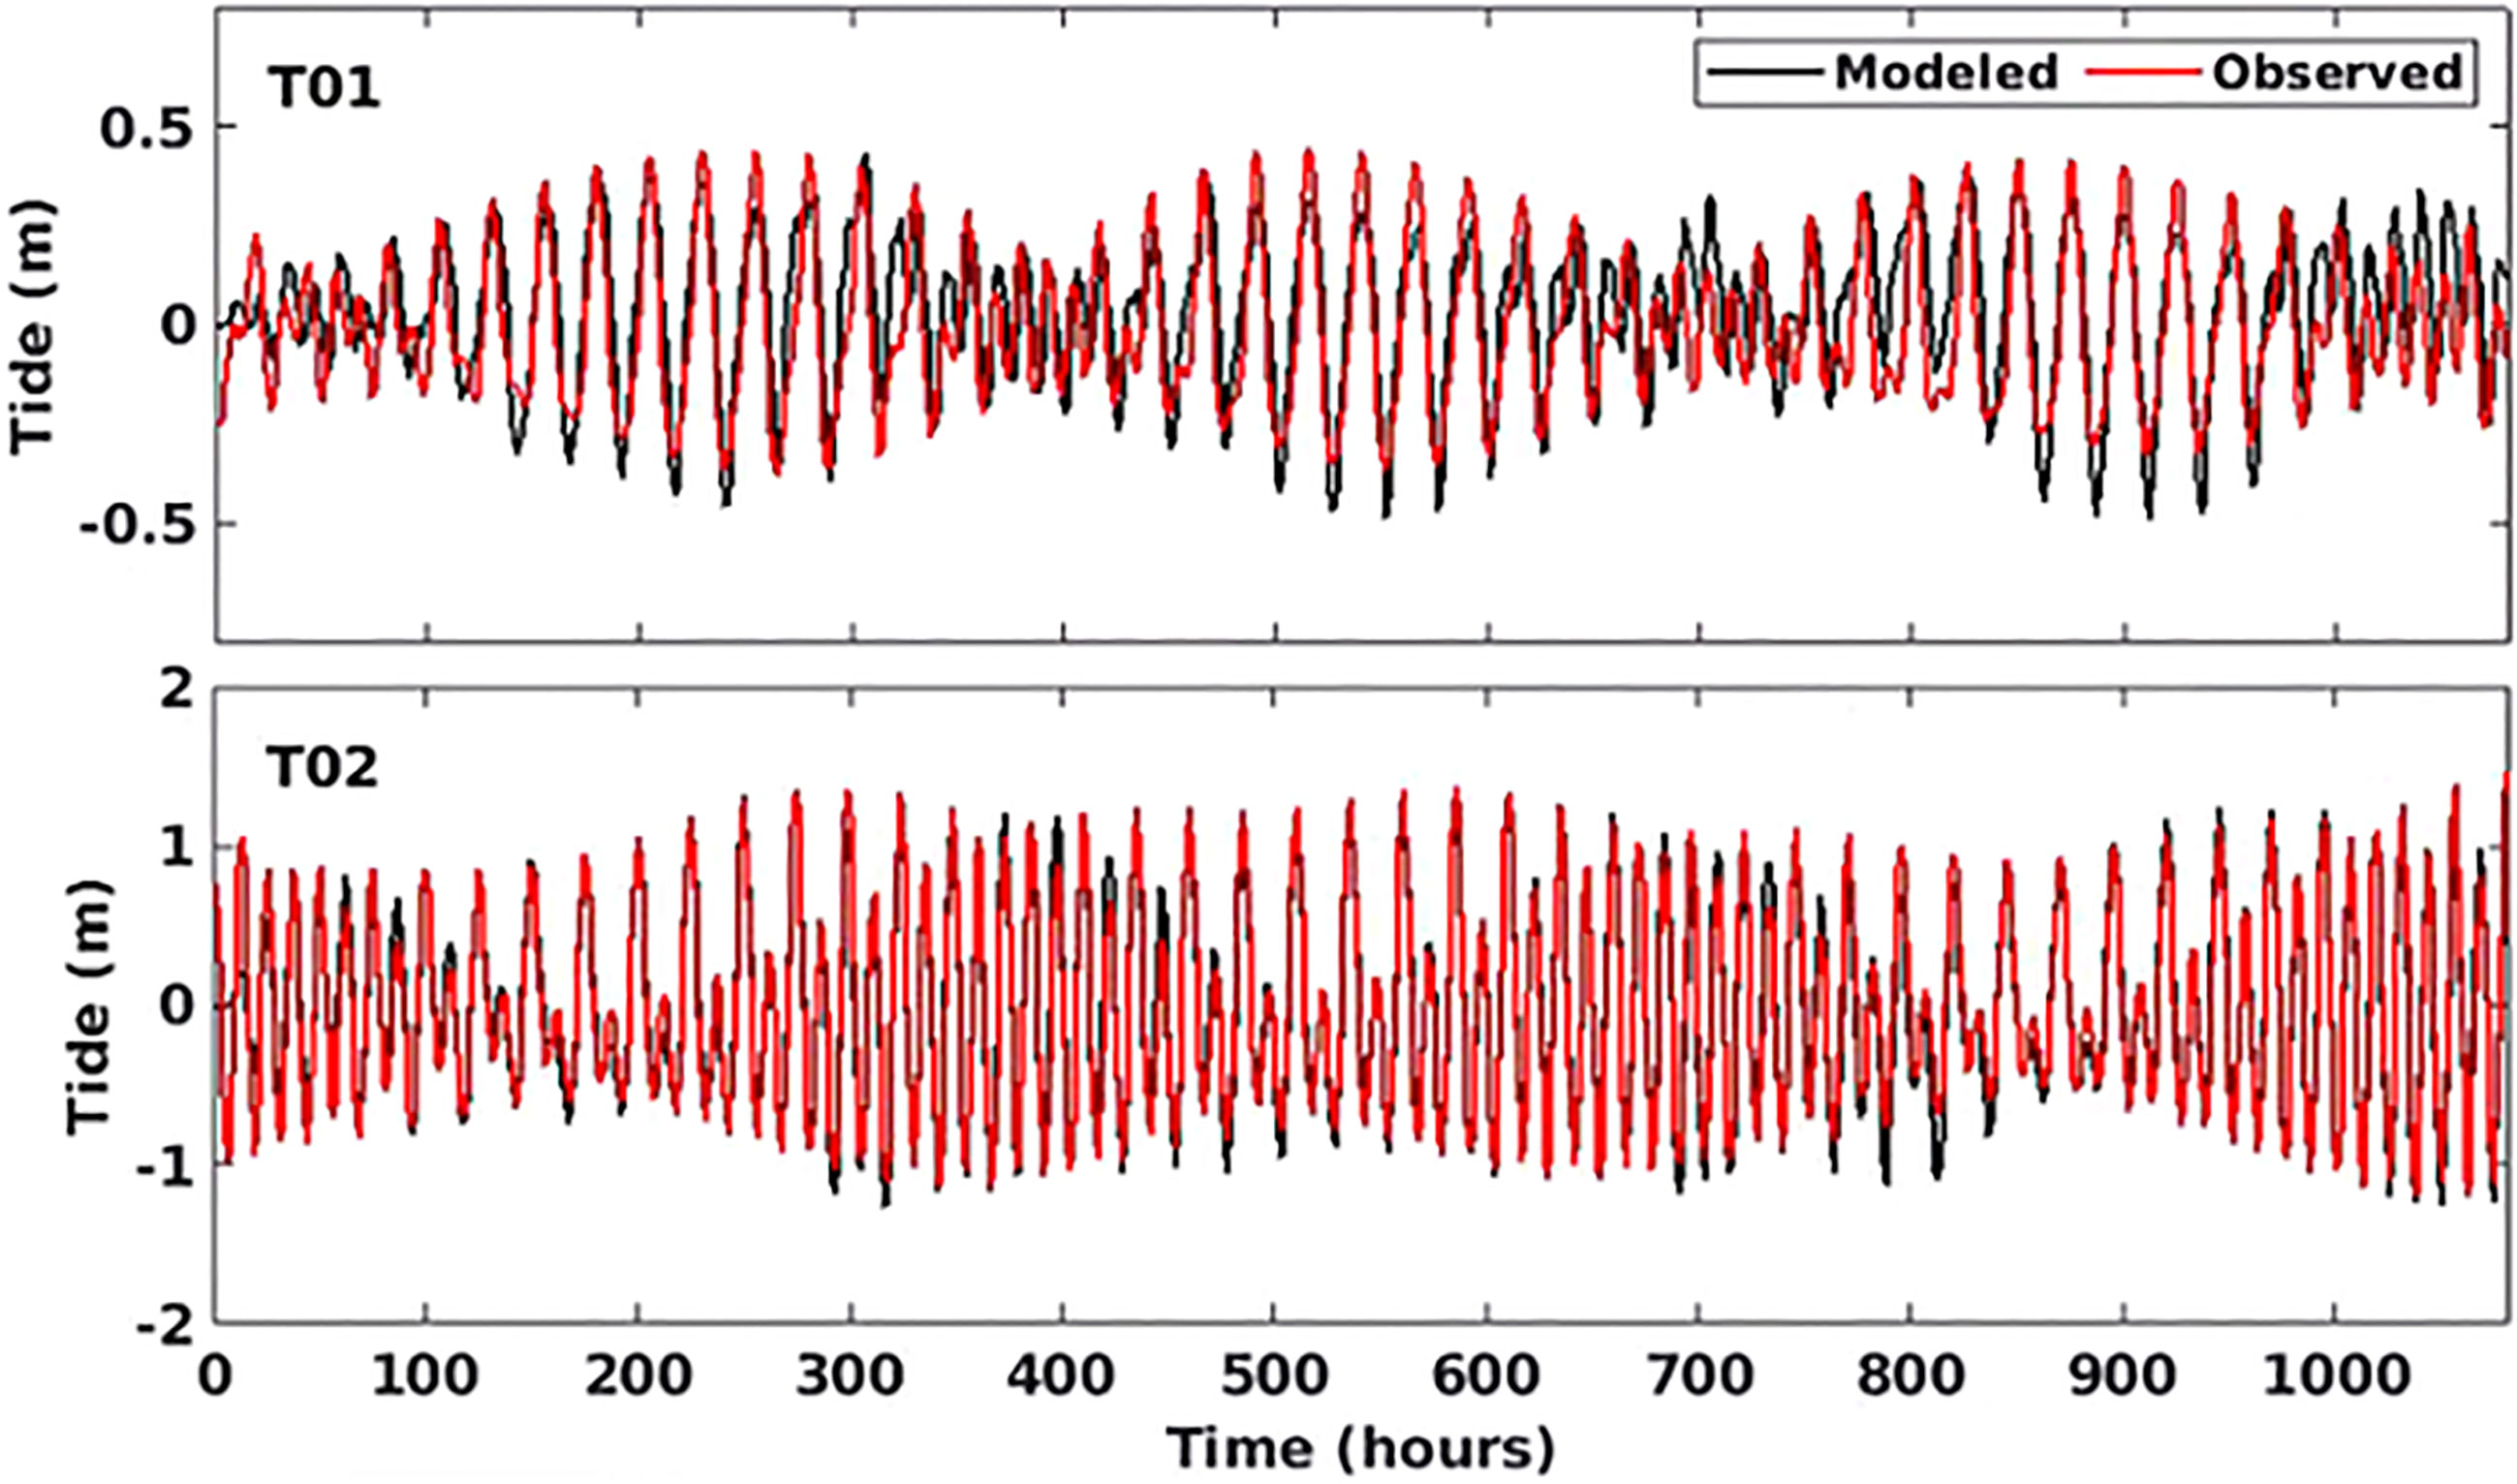
Figure 2 Comparison of the predicted and observed tide heights (m) at Stations T01 and T02 (black line: modeled data; red circles: observations).
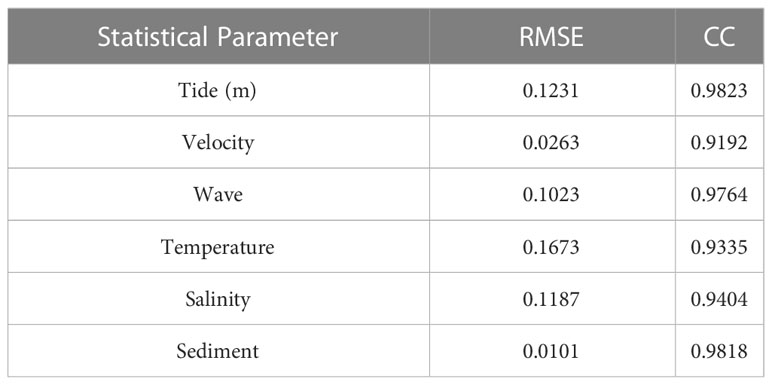
Table 1 Model validation indices for hydrodynamics and suspended sediment concentration (SSC).
(2) Velocity
Figure 3 compares the simulated and measured velocities at T01 and T02, showing that the velocities of the model are consistent with the observation values. The ability of the model to calculate the velocity is verified with an RMSE of the north velocity (u) and east velocity (v) of less than 2.63 cm/s and a CC over 0.9192 (Table 1).
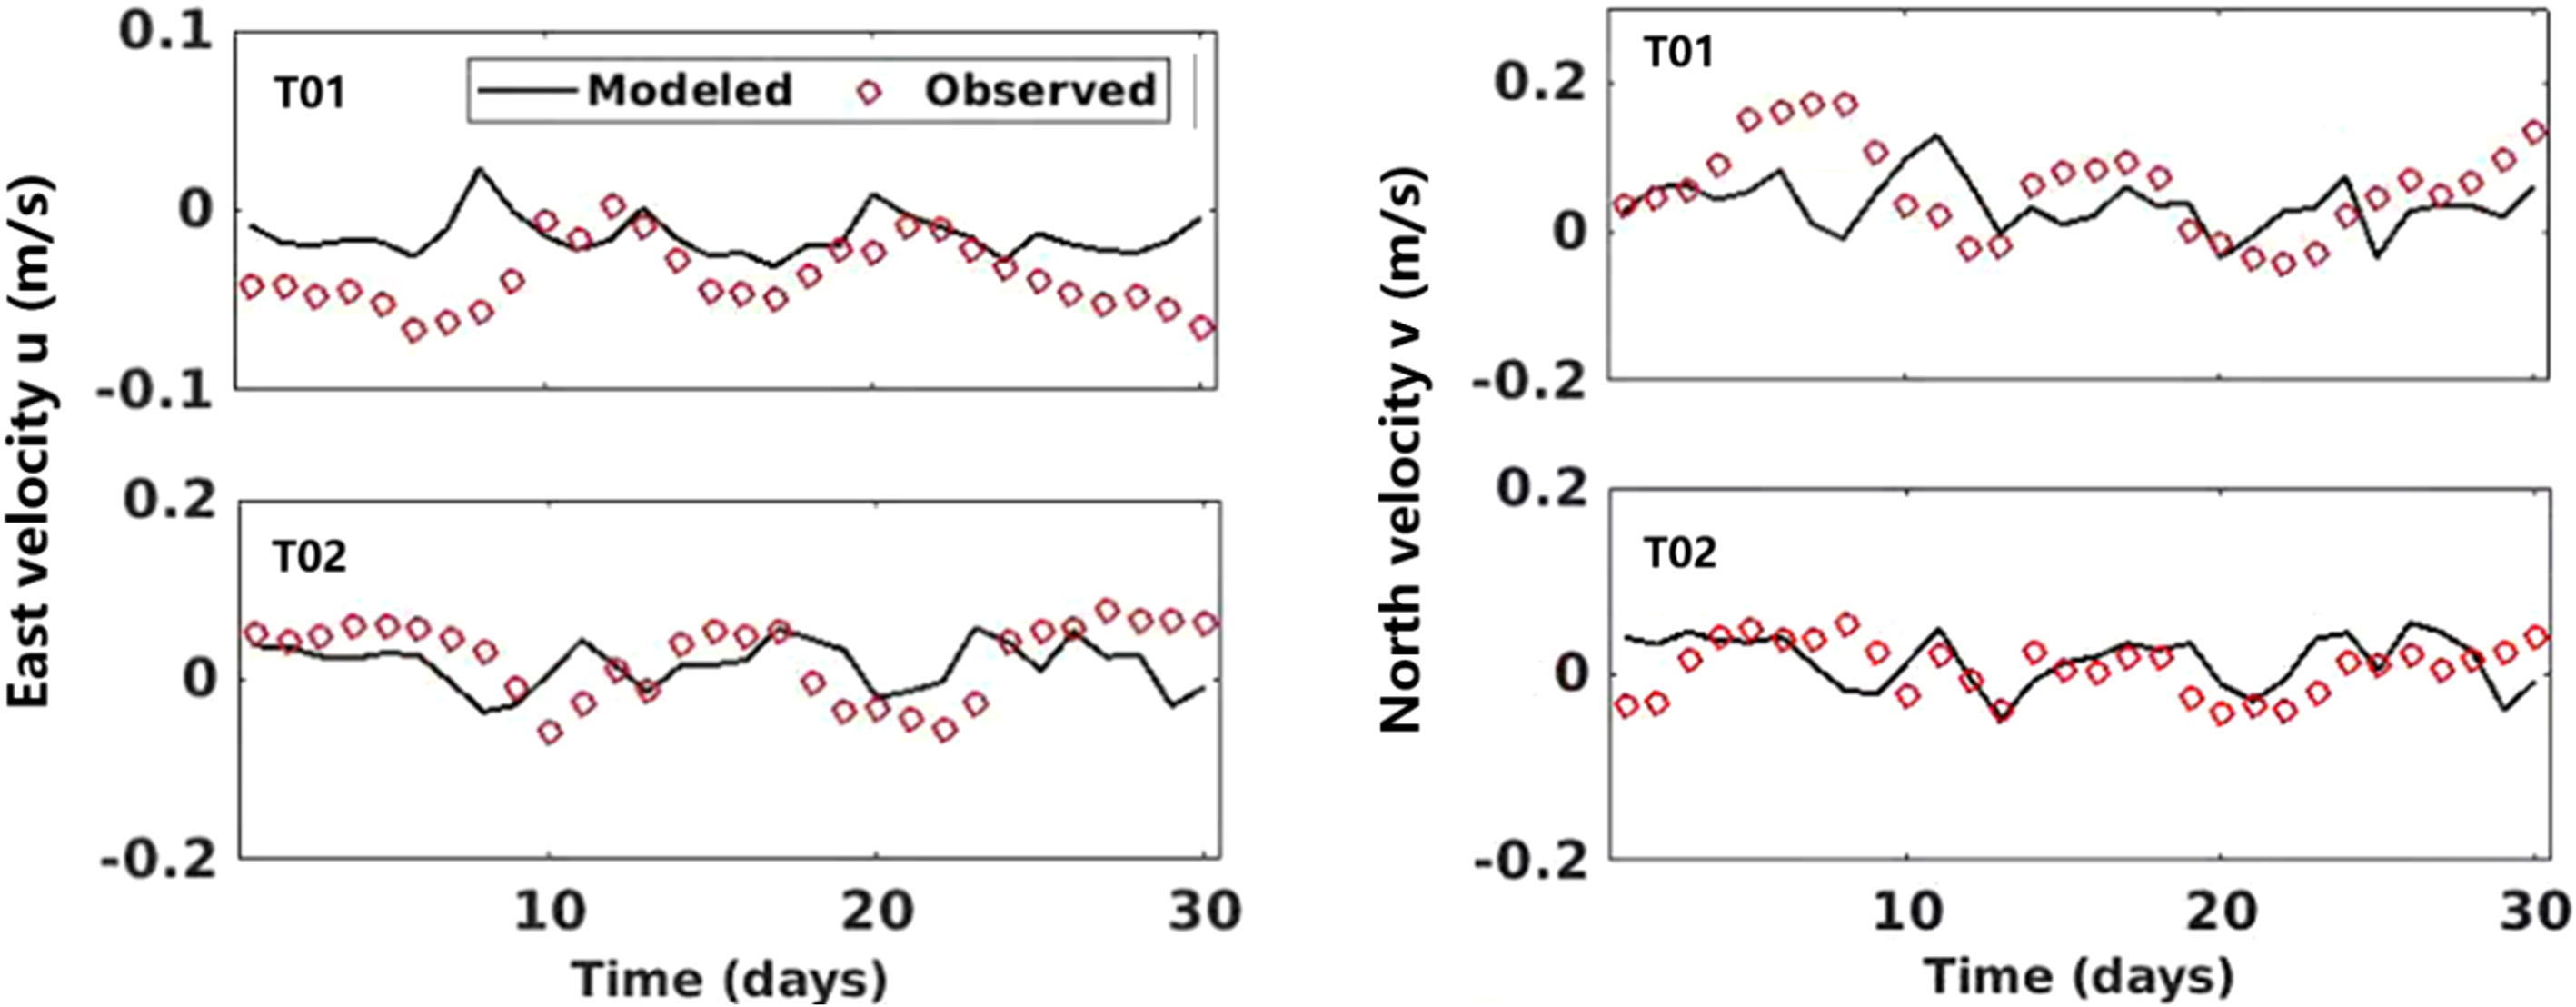
Figure 3 Comparison of the predicted and observed flow velocities (m/s) at Stations T01 and T02 (black line: modeled data; red circles: observations).
(3) Waves
The wave observations are ERA5 reanalysis data of the significant wave heights at W01 and W02, and the compared model results are shown in Figure 4. The RMSE between the observed and modeled significant wave heights is 0.1023 m, and the CC is 0.9764 (Table 1) (Figure 4). Overall, the model can accurately simulate wave variations and can be used to calculate the sediment movement caused by waves.
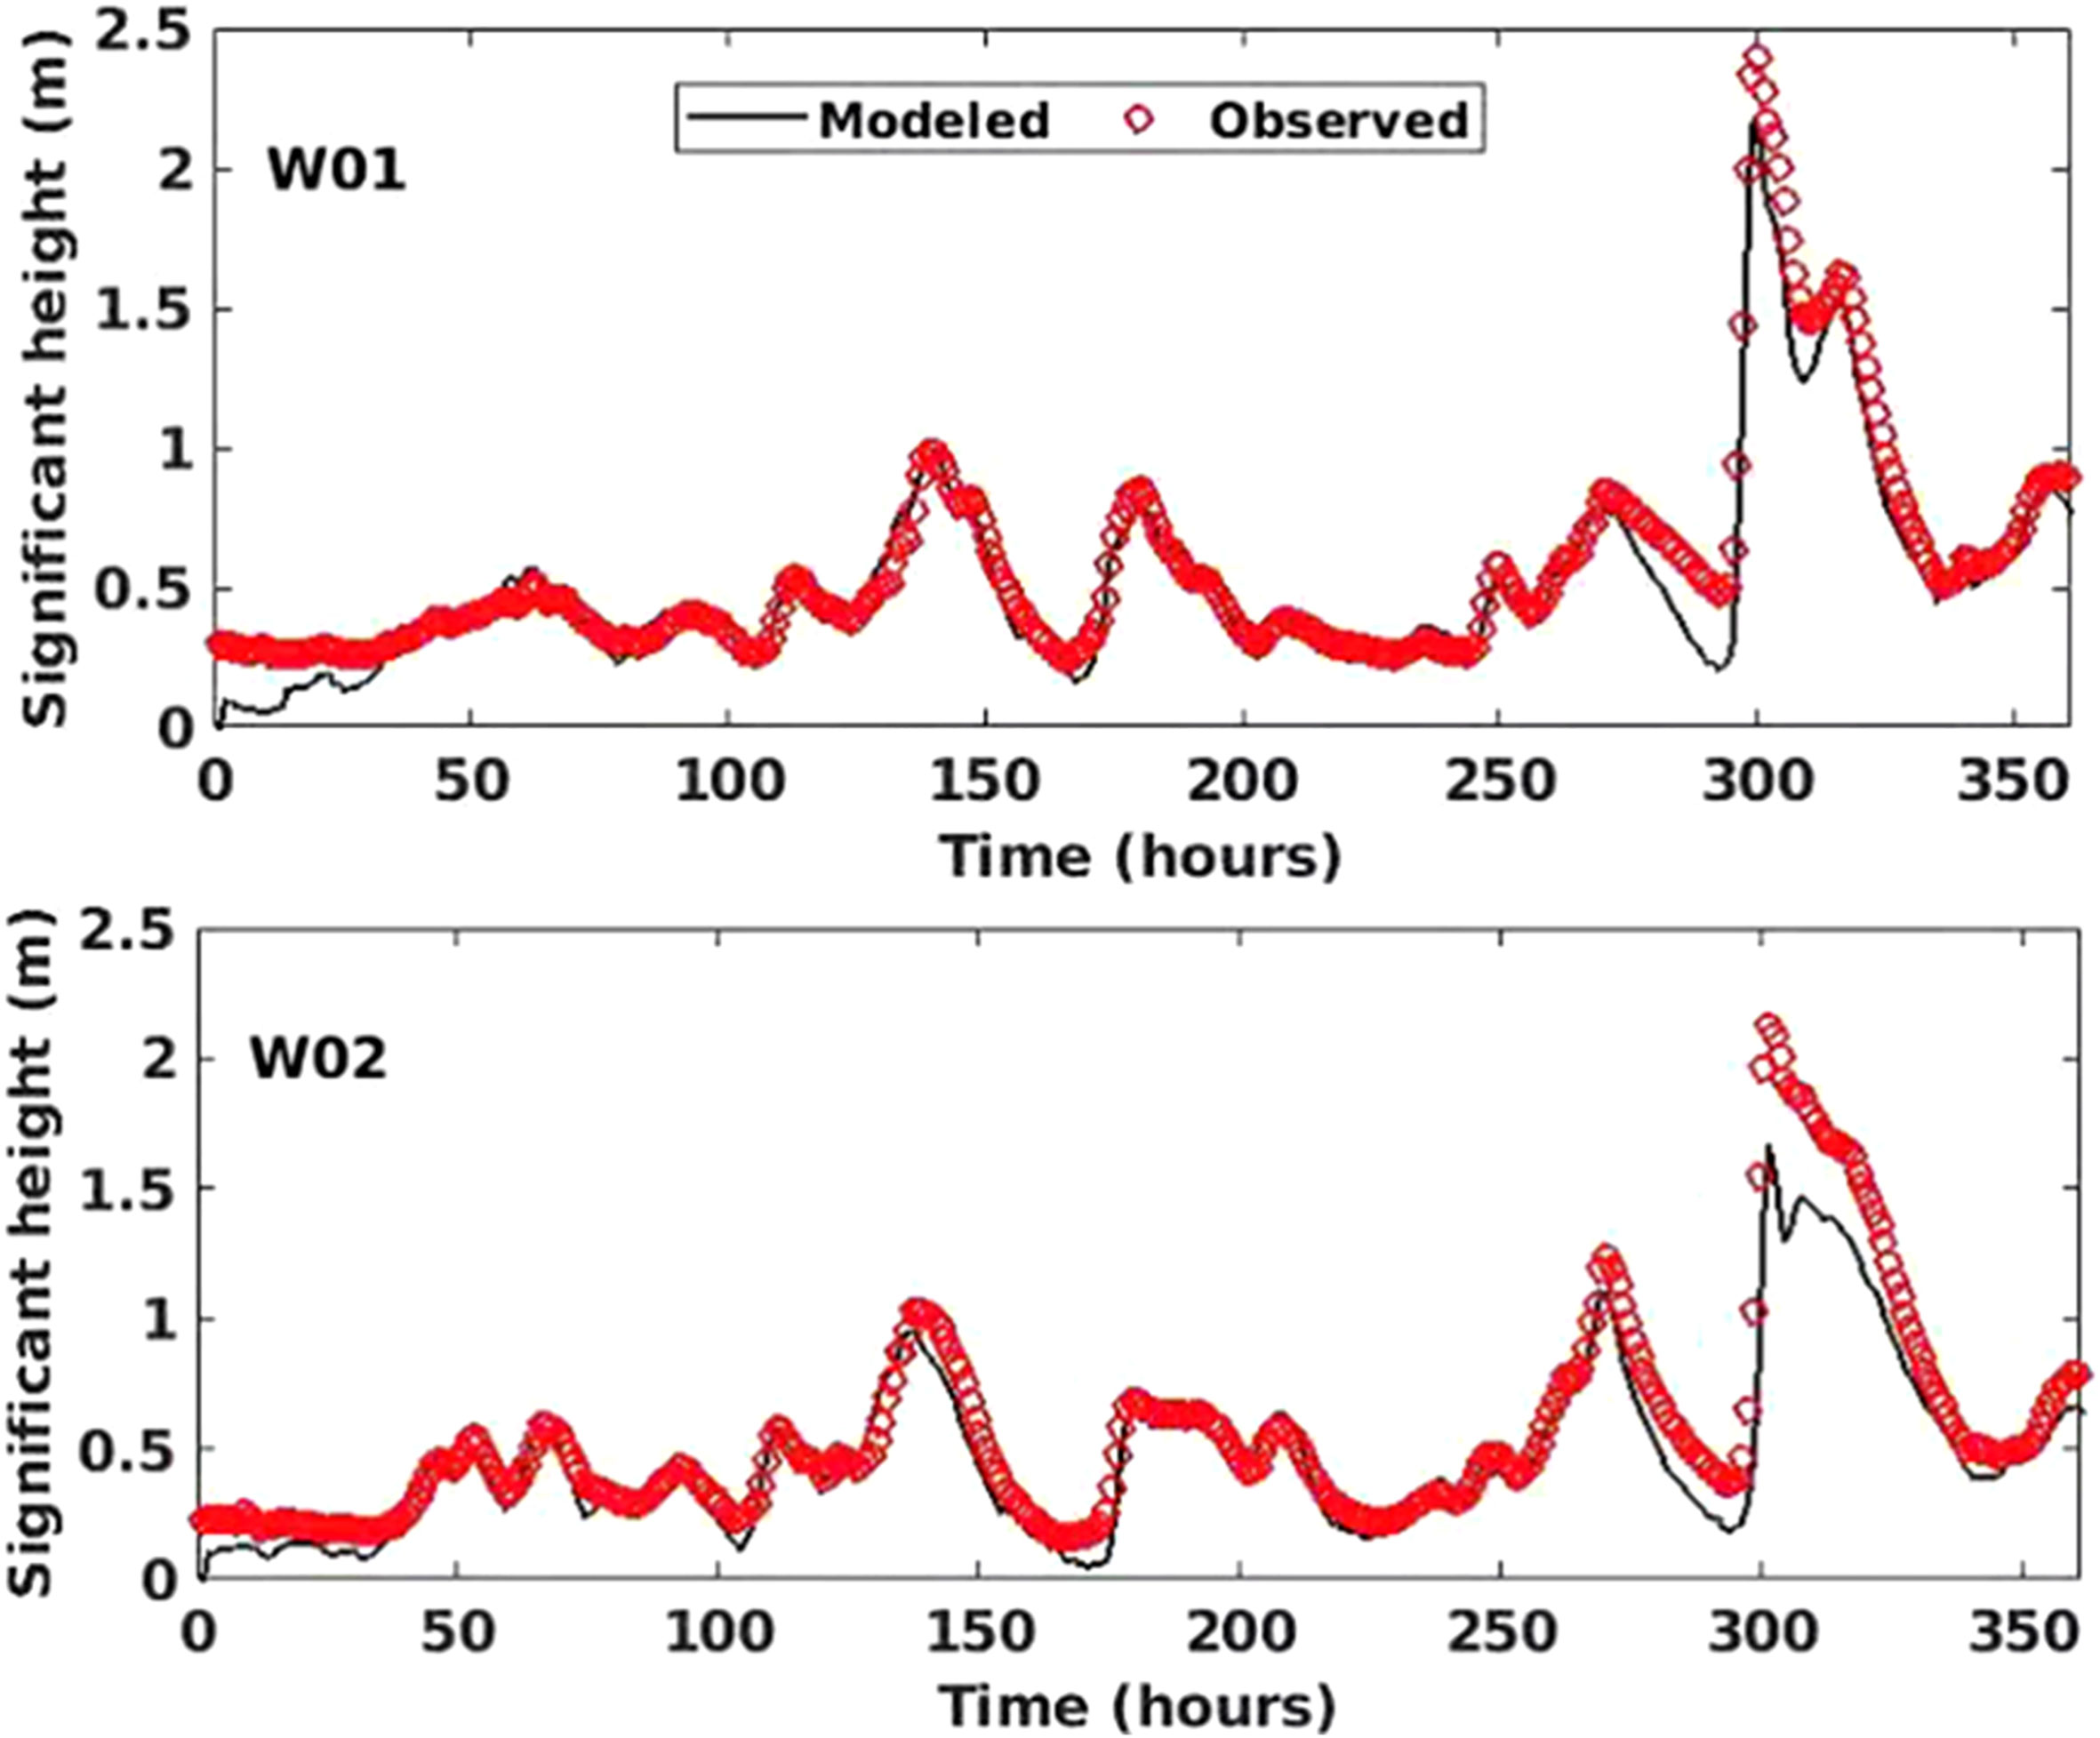
Figure 4 Comparison of predicted and observed significant wave heights (m) at Stations W01 and W02 (black line: modeled data; red circles: observations). .
(4) Temperature and salinity
The comparisons between the modeled and observed temperature and salinity at T01 and T02 are shown in Figure 5. A good representation of the temperature and salinity is observed, with an RMSE of the modeled and measured temperature of 0.1673 °C, a CC of 0.9335 for the temperature, an RMSE of the modeled and observed salinity of 0.1187 psu, and a CC of 0.9404 for salinity (Table 1). In general, the model simulates the temperature and salinity variations well.
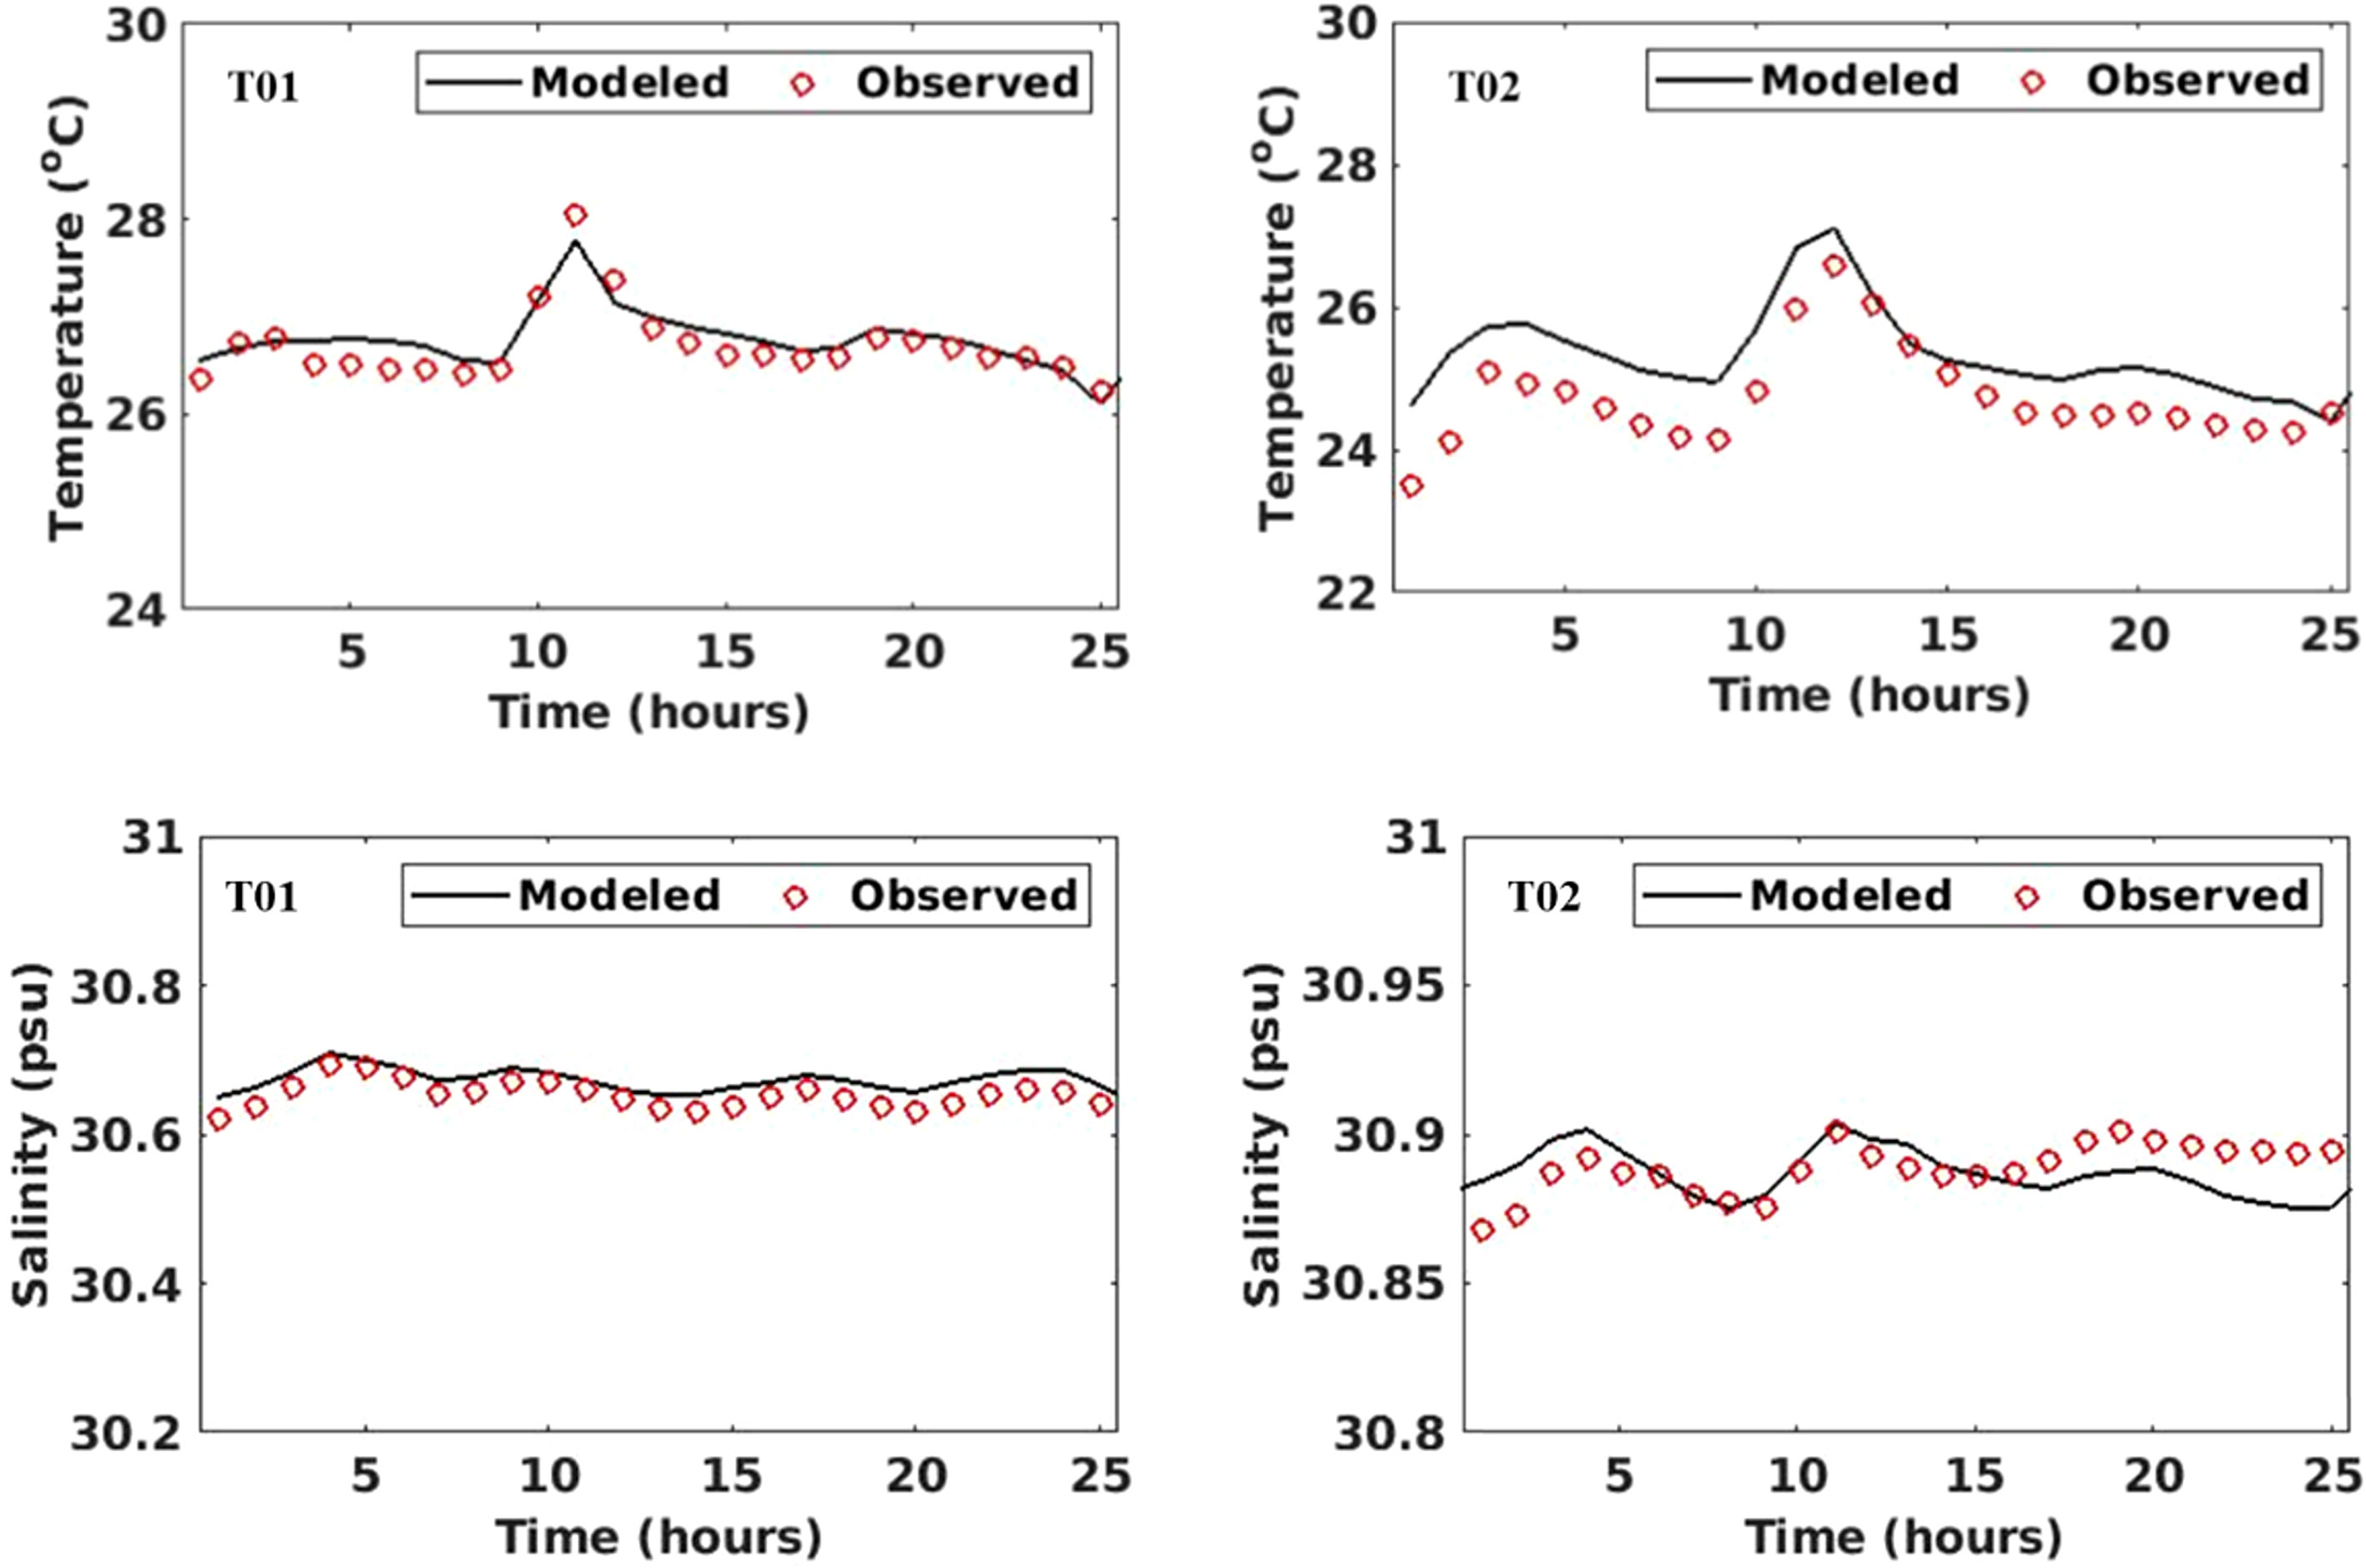
Figure 5 Comparison of the modeled and observed temperature (°C) and salinity (psu) at Stations T01 and T02 (black line: modeled data; red circles: observations).
(5) Sediment
Comparisons between the simulated and observed SSC are shown in Figure 6. The simulated SSC is consistent with that of the SSC measured by Shi (2008), with an RMSE of 0.0101 kg/m3 and a CC of 0.9818 (Table 1).
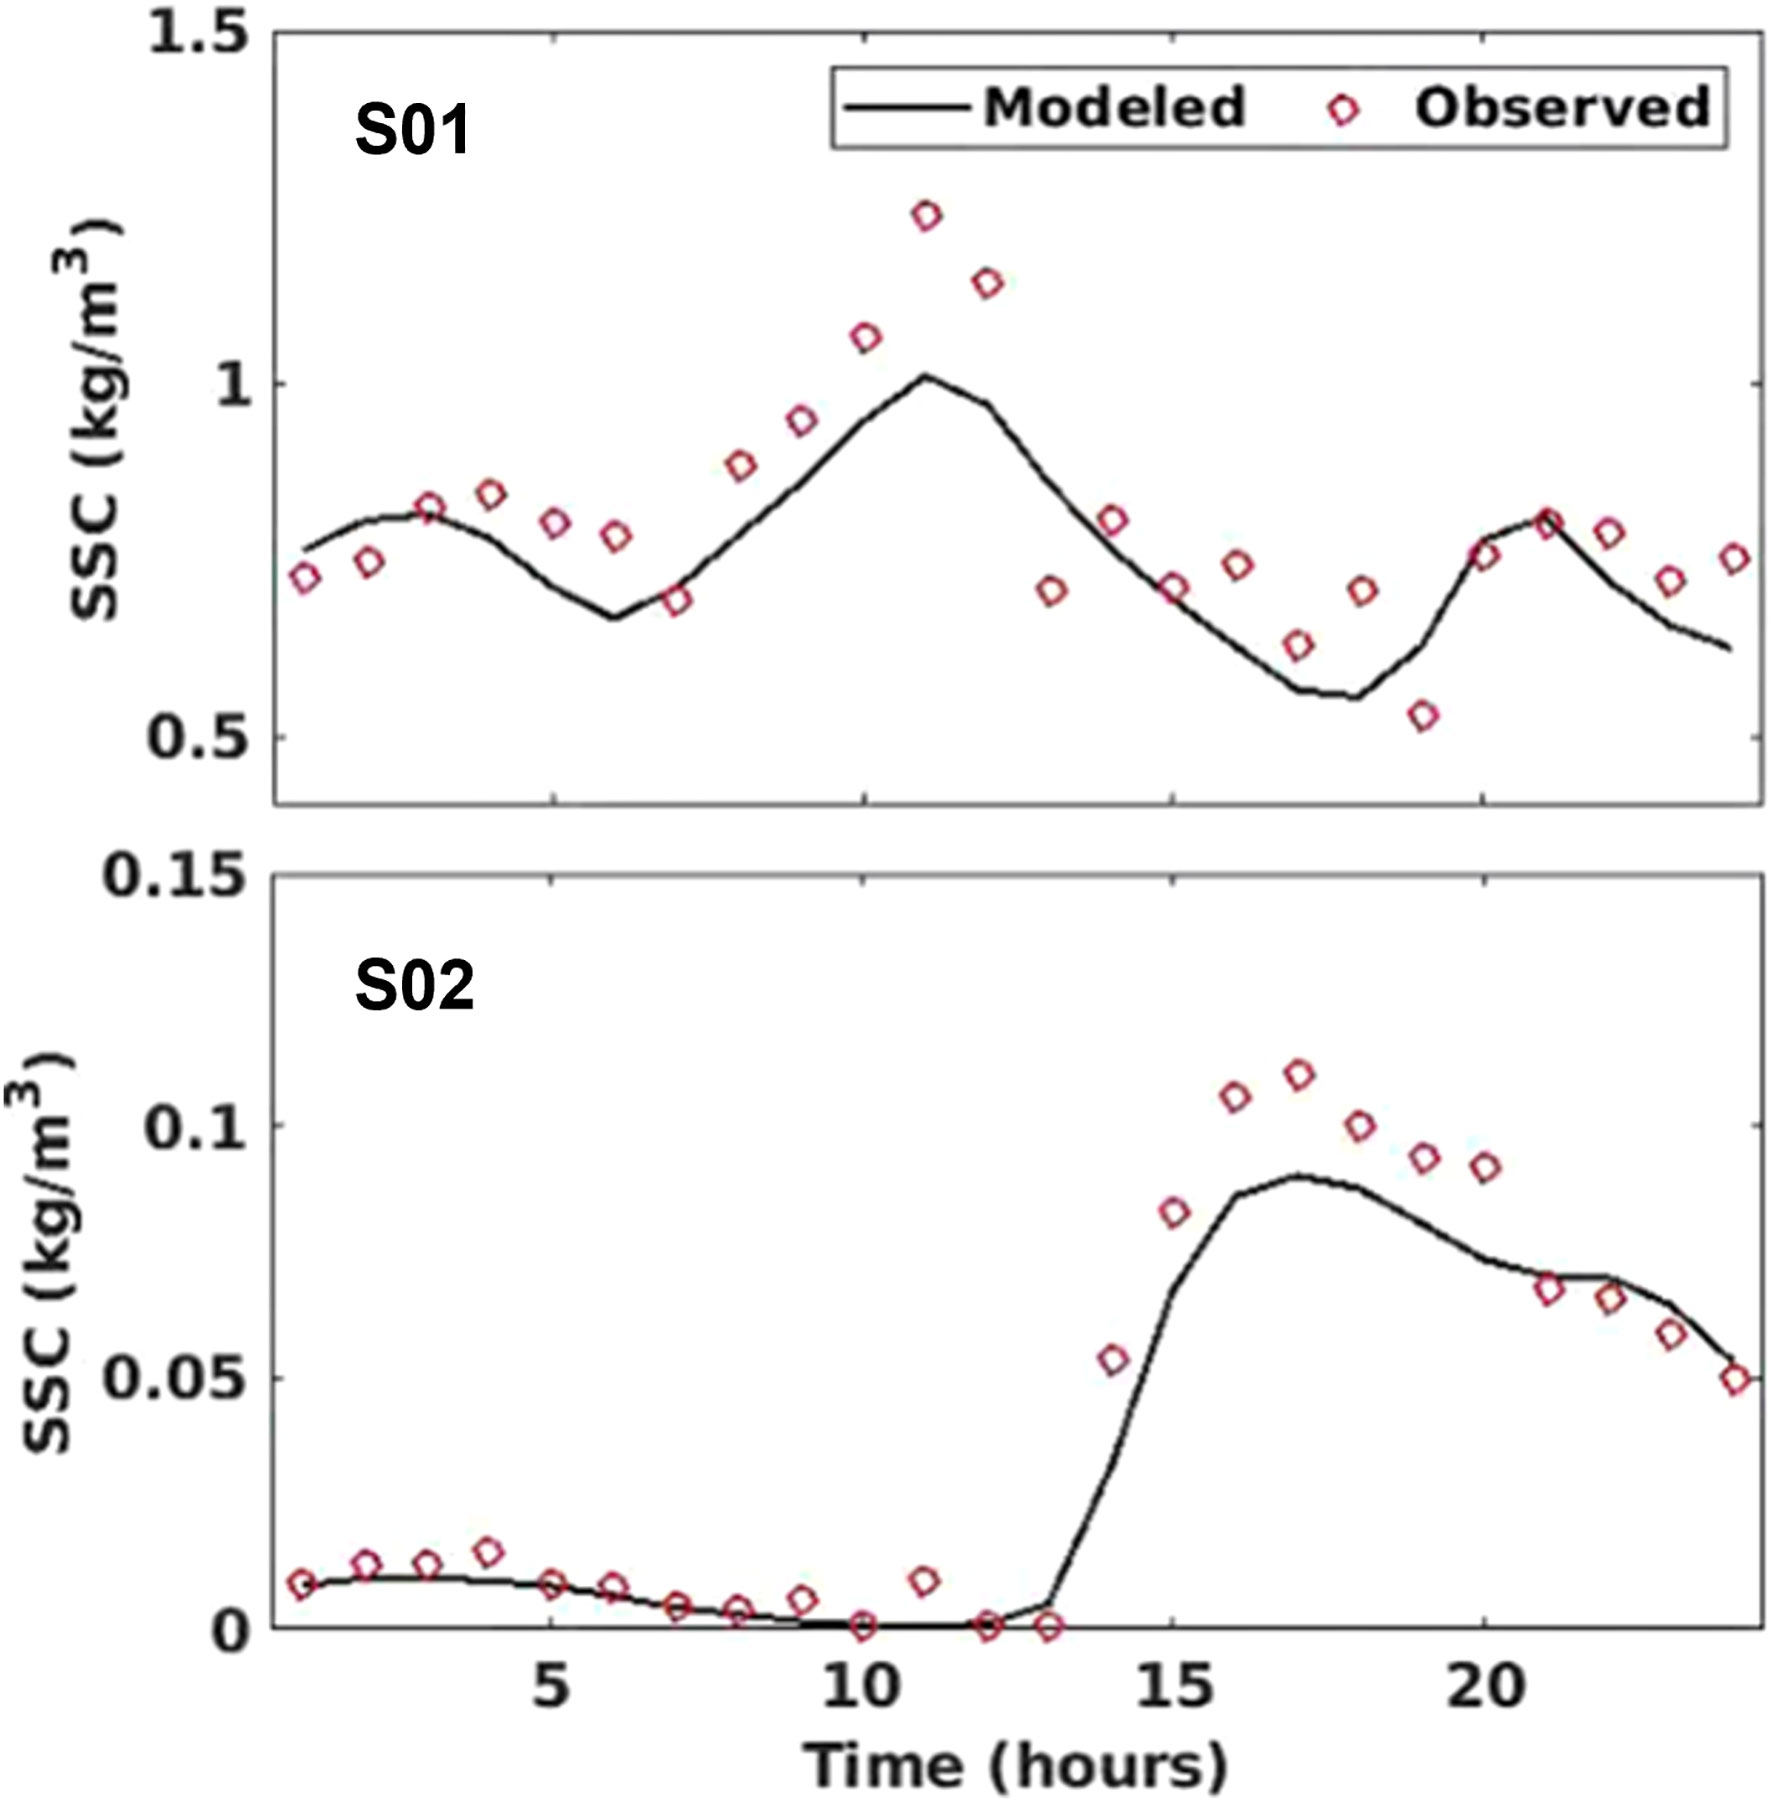
Figure 6 Comparison of predicted and observed sediment concentrations (kg m-3) at Stations T01 and T02 (black line: modeled data; red circles: observations).
3.2 Tide current and flow field
The model is run to represent the period from June 1, 2013, to July 31, 2013, for the duration of the WSRS was from June 19 to July 10, 2013. We select three periods: before the WSRS (June 08, 2013), during the WSRS (June 28, 2013) and after the WSRS (July 20, 2013) to compare the differences in hydrodynamics and suspended sediment. The tides in the YRE and offshore region are irregular, semidiurnal tides with reciprocating flows parallel to the coastline. The flow field in a tide cycle (Figure 7) shows that the tidal current flows southeastward at flood tides and northwestward at ebb tide. It is worth noting that the flood and ebb tides are for the YRE and its offshore region and are out of sync with the tidal cycles of other regions. A substantial change in the flow direction occurs at the mouth of the river due to the intense interaction between the tides and runoff. In addition, flow velocity distribution is also closely related to the terrain. The flow velocity near the YRE is 0.9~1.5 m/s. In the offshore areas, the flow velocity is approximately 0.2-0.6 m/s when the water depth is less than 5 m and approximately 0.8-1.0 m/s when the water depth is 5-10 m.
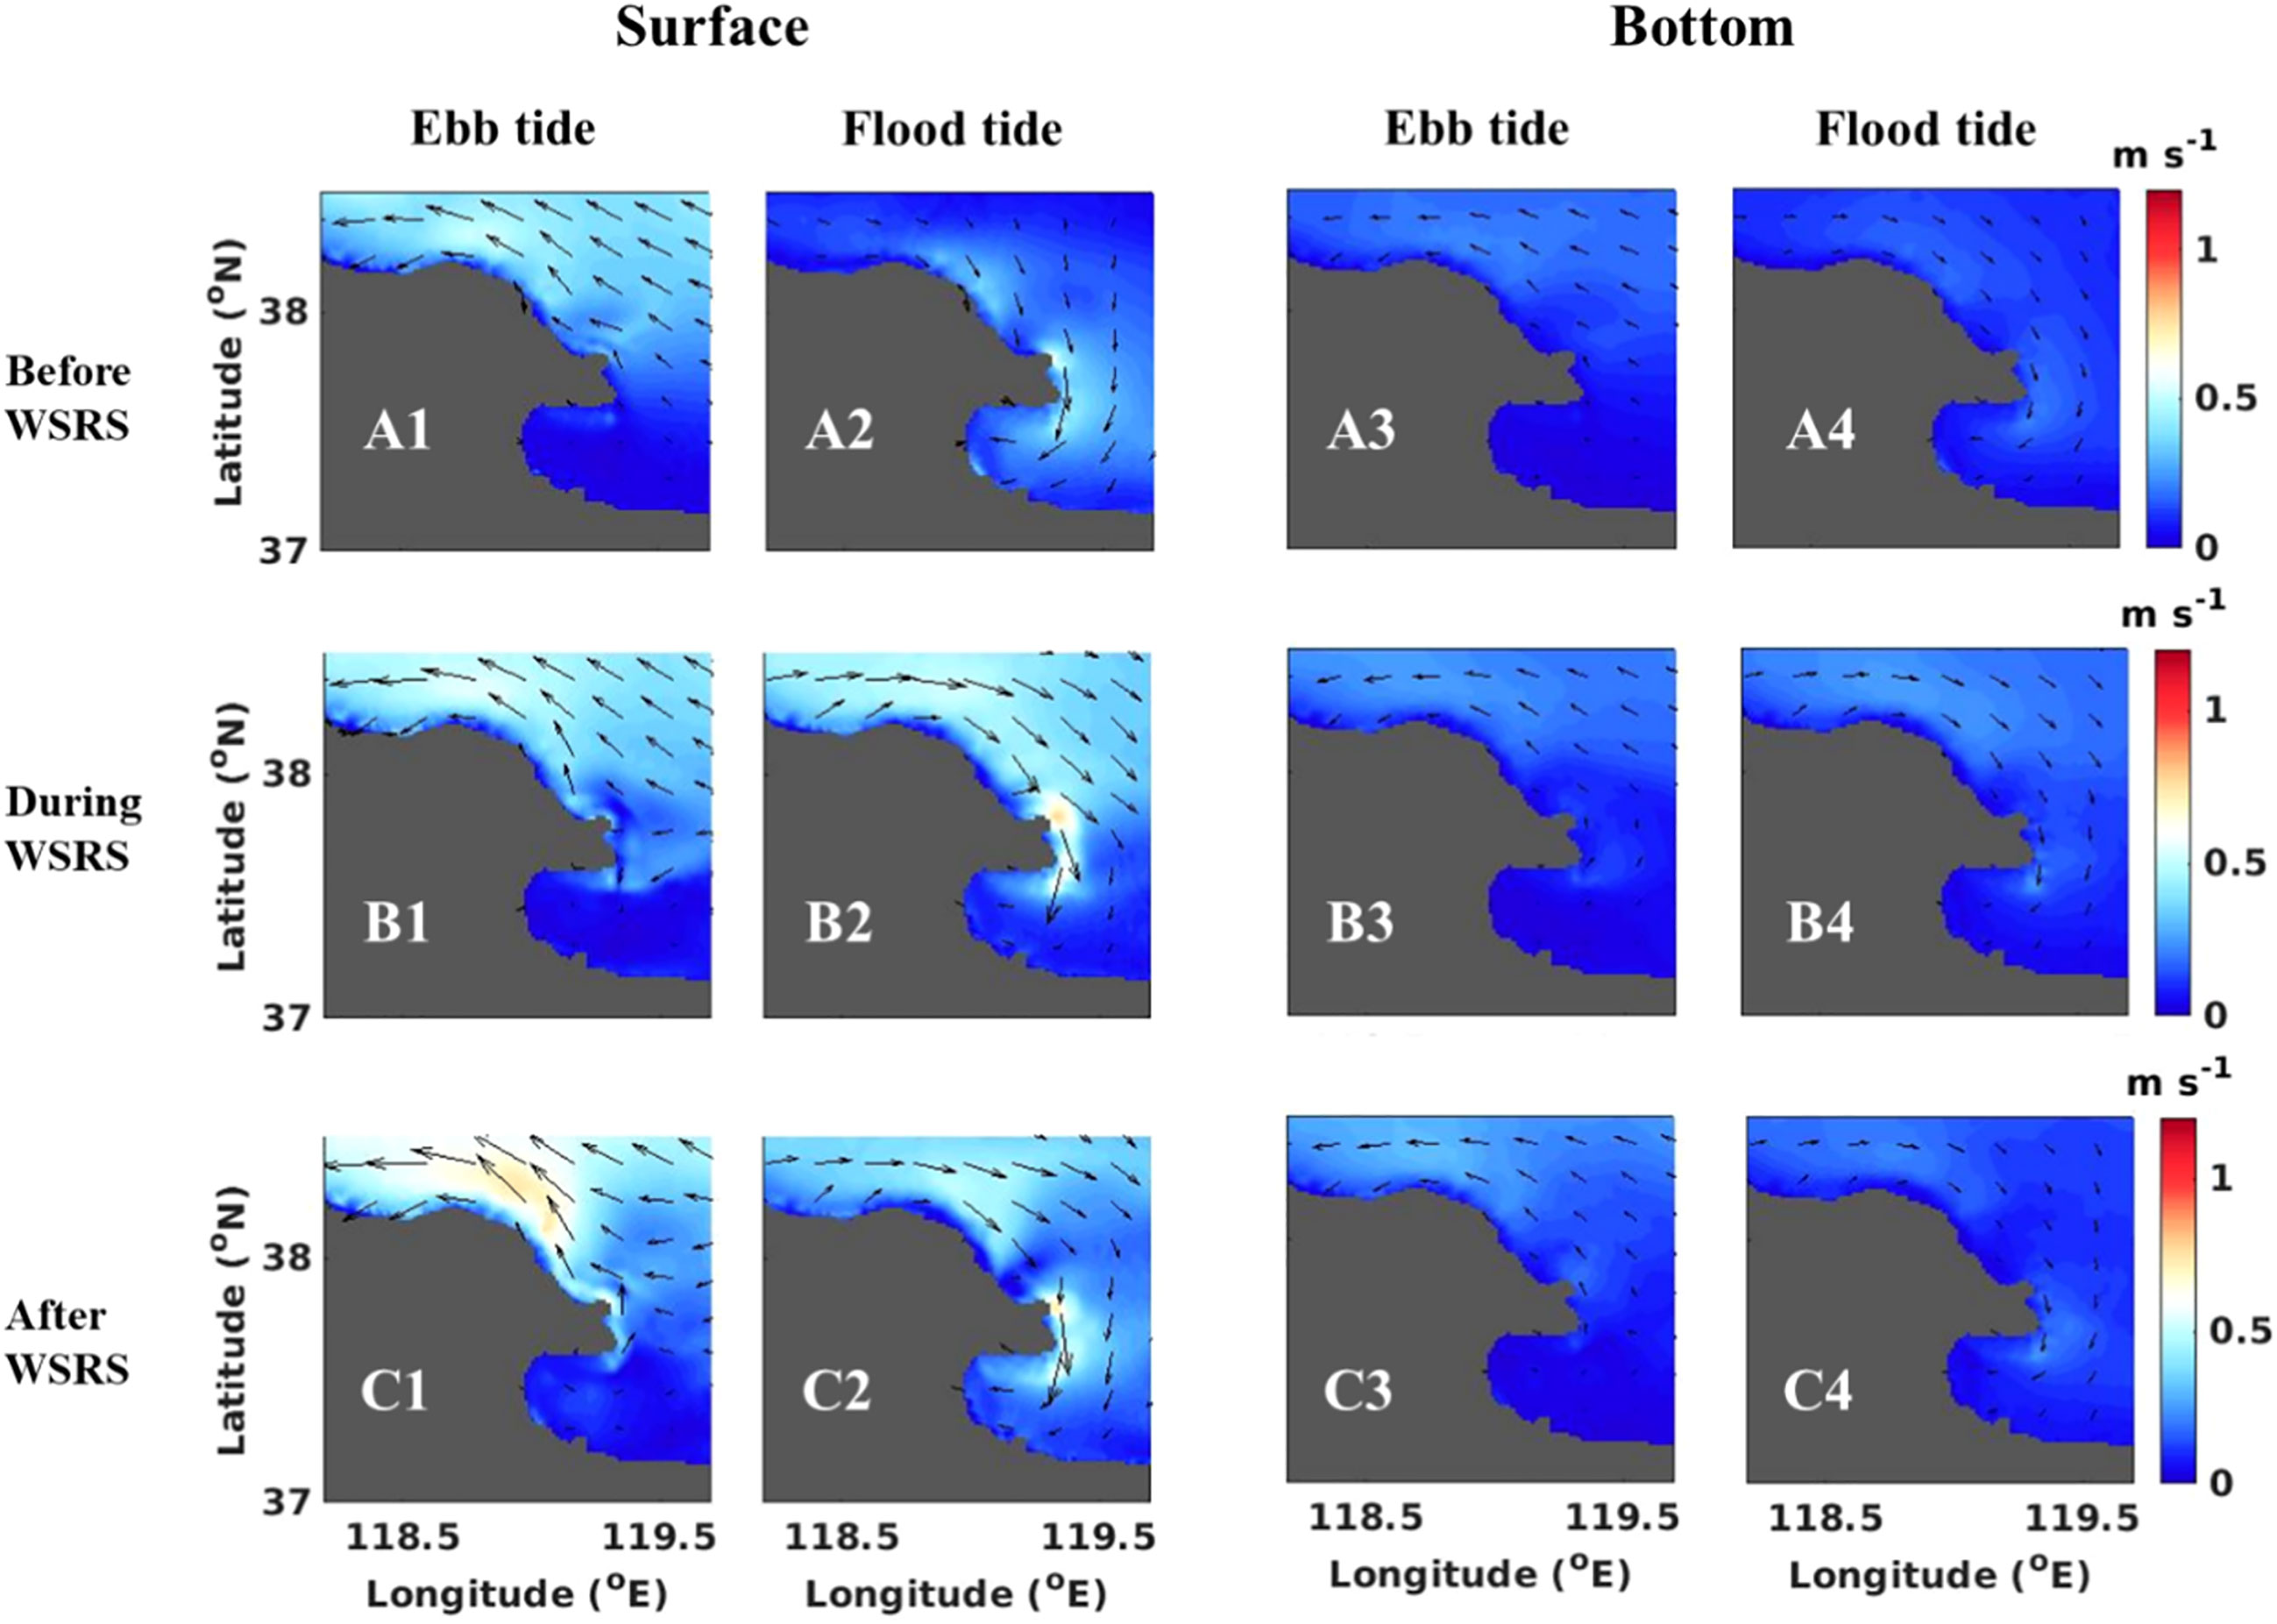
Figure 7 The flow field in the YRE, A1-A4: before the WSRS (June 08, 2013); B1-B4: during the WSRS (June 28, 2013); C1-C4: after the WSRS (July 20, 2013).
3.3 Variations in the spatiotemporal distribution of sediment
3.3.1 Horizontal distribution of suspended sediment
In areas that are close to the YRE, a high SSC zone is observed due to a large amount of sediment input from the Yellow River (Figure 8). In Bohai Bay, far from the YRE, the spatial distribution of the SSC does not change much with the flood and ebb tides, and the SSC is related to the tidal current and bathymetry. In matching the tidal current velocity distribution (Figure 7) to the SSC distributions, high SSCs are observed in areas with shallow water and a high tidal current velocity, for example, the northern and eastern parts of Liaodong Bay, the eastern part of the Liaodong Bay, and the Laotieshan Channel. The SSC is lower in areas with small tidal currents, such as Qinhuangdao and most of the central Bohai Sea.
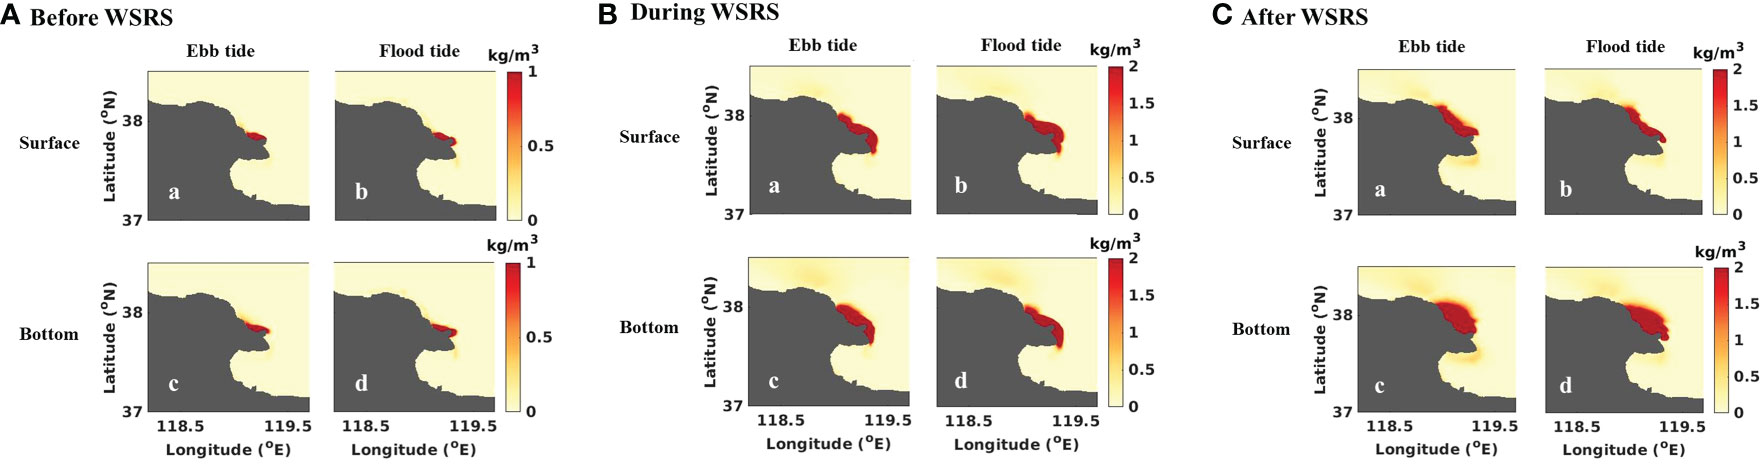
Figure 8 Sediment distribution in YRE at before WSRS (A), during WSRS (B) and after WSRS (C).
3.3.2 Sediment distribution in the YRE and its offshore region
(1) Sediment distribution before the WSRS
During the ebb tide period, the tidal current flows northwestward. The salinity distribution (Figure 9) shows that freshwater rushes into the sea and spreads northwest on the surface layer together with the tidal current, forming a small-scale freshwater tongue. The sediments spread with the freshwater as plume flows, and their distribution is very similar to that of freshwater. Most of the sediment accumulates in the estuary, forming a high SSC zone. However, the SSC of the bottom water is similar to that of the upper water, indicating that some of the sediment is deposited at the river mouth.
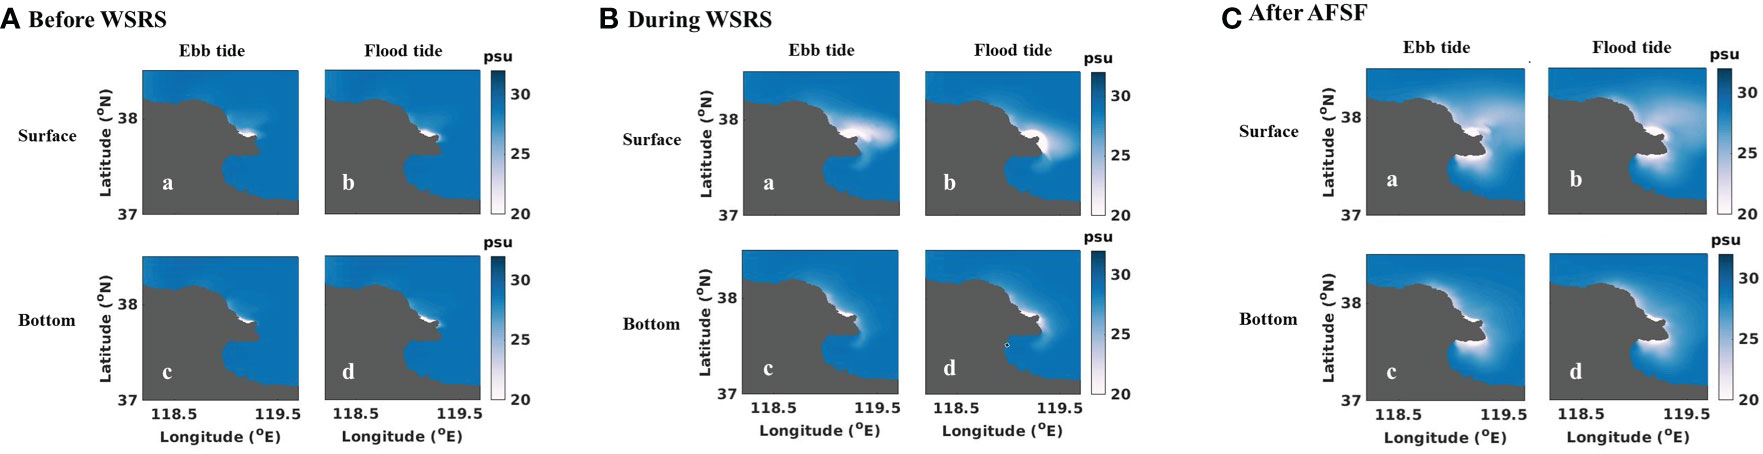
Figure 9 Salinity distribution in the YRE before the WSRS (A), during the WSRS (B) and after the WSRS (C).
In the flood tide period, the tidal current flows southeastward, and the maximum velocity area is close to the river mouth. The vertical distribution of salinity (Figure 9) shows that freshwater from the Yellow River mainly spreads on the surface. The range of the freshwater spread is significantly limited by the tidal current, and the high SSC zone is mainly concentrated 5-6 km from the river mouth. In addition, as it is controlled by the Coriolis force and flood current, the southeast outspread of the sediment is slightly larger than that of the northwest.
(2) Sediment Distribution during the WSRS
The flow field (Figure 7) shows that the discharges of the Yellow River during the WSRS are significantly higher than those before the WSRS. Freshwater rushes out of the river mouth with the sea current having little effect due to the increasing river discharge (average daily discharge of 800 to 2922 m3/s). The freshwater spreads on the surface as a plume to the northwest with the ebb tide and to the southeast with the flood tide, and the bottom is still controlled by the tidal current, forming a high SSC zone at the YRE. The sediments diffuse with freshwater; however, the SSC in the bottom layer increases significantly and is higher than that at the surface. This is because of two reasons: one is that part of the sediment is deposited at the river mouth, and the other reason is that the increasing flow velocity enhances sediment resuspension. The sediments are blocked by the tidal shear front near the coast. The blocked high-SSC water spreads along the coast with the tidal current. The southeast outspread length (20-23 km) of the sediment is slightly larger than that in the northwest (15-20 km).
(3) Sediments diffusion after the WSRS
Similar to that in the first two periods, the freshwater after the WSRS mainly diffuses on the surface and flows along the YRE coast with the tidal current. It is worth noting that the discharges after the WSRS are still high (average daily discharge of 2100 m3/s) (Figure 10), so the freshwater spreads further offshore. The sediment diffuses with the tidal current as a plume, but it does not spread as far to the southeast than it does during the WSRS because the sediment discharge rate of the Yellow River declines after the WSRS (Figure 10). The span of the high SSC in the surface water decreases compared with that before the WSRS, while the span of the high SSC in the bottom water increases. This difference is caused by the settling of more sediment to the bottom water during deposition.
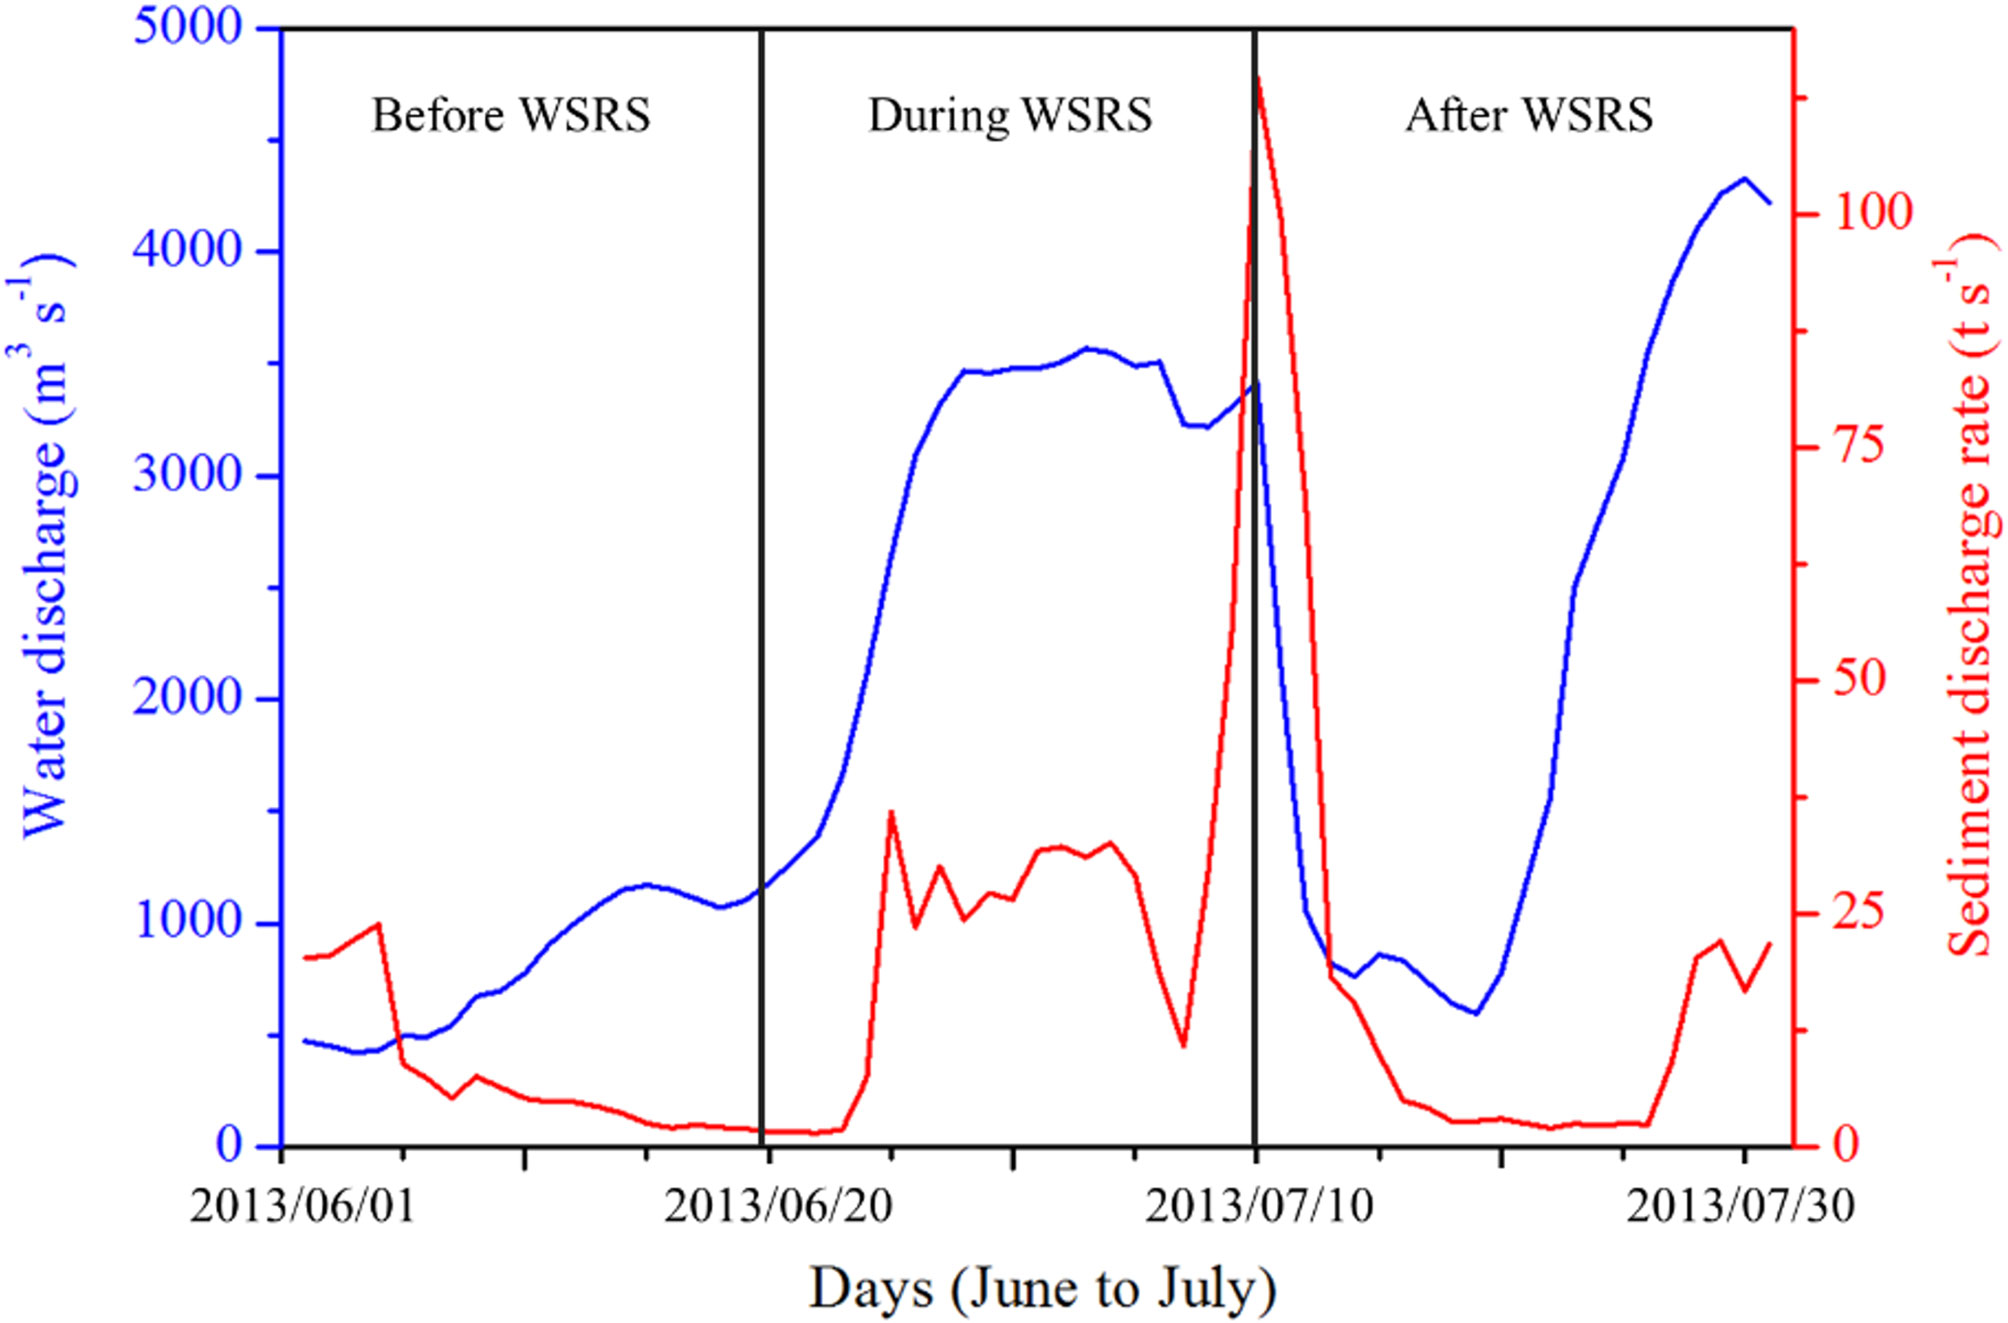
Figure 10 Daily water discharge and sediment discharge of the Yellow River at Linjin Station from June to July 2013.
4 Discussion
4.1 The dominant external forcing of sediment distribution
Tide, wave, and runoff are the most important factors affecting sediment transport. In this study, three scenarios of suspended sediment transport are considered (Table 2) to examine how external forcing factors such as runoff, tides, and waves affect the sediment distribution. The external forcing factors in each scenario are listed in Table 2. The sediment distributions in the different scenarios are shown in Figure 11.
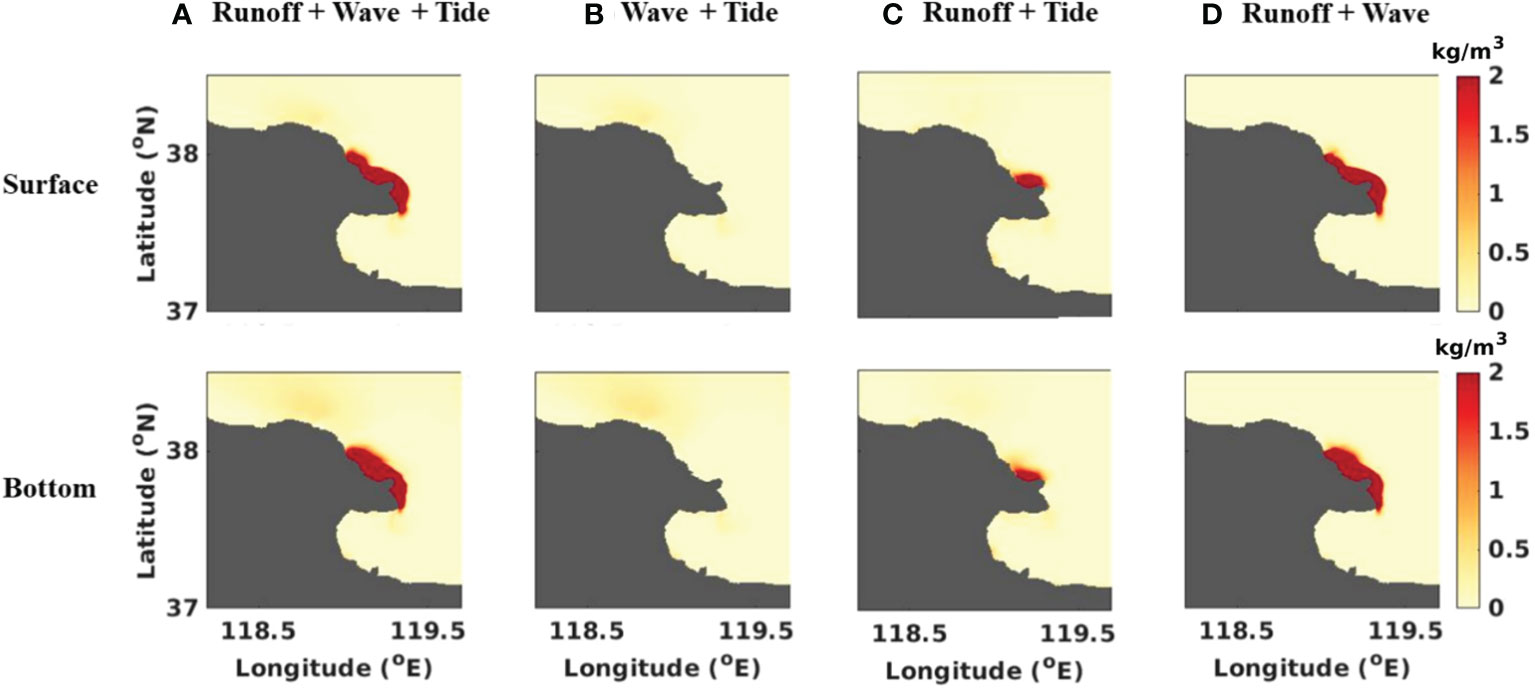
Figure 11 Sediment distribution under different forcing scenarios, (A) is scenario of runoff + tide + wave, (B) is scenario of wave + tide, (C) is scenario of runoff + tide, and (D) is scenario of runoff + wave.
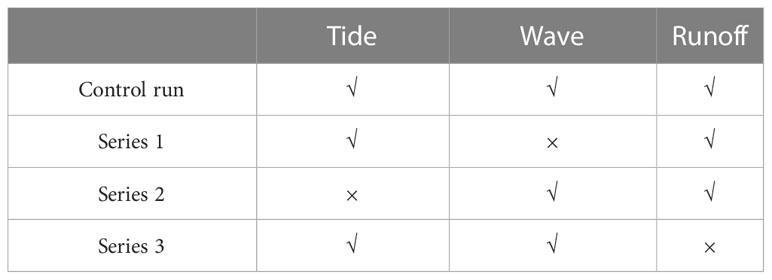
Table 2 Scenarios of different conditions.
Runoff is the most important factor contributing to the high SSC in the YRE. Tons of sediment are discharged into the YRE annually, making the YRE one of the most turbid waters in the world (Wei et al., 2016). The increasing discharge of the Yellow River increases the tidal resistance and decreases the tidal speed, tidal amplitude, and wave velocity (Ji et al., 2020). As shown in Figure 11, when considering the freshwater runoff, the distribution of sediment concentration is significantly linguliform in the YRE, and the SSC and spread range of the sediment are closely related to the discharge and sediment rate of the Yellow River, especially during the WSRS. The SSC of the YRE is significantly low in the no-runoff scenario, indicating that the Yellow River is the main sediment input (Figure 11B). In addition, it can be found in the comparison of sediment distribution between before WSRS and during WSRS (Figure 8), high SSC area is much small in before WSRS when the runoff inputs are weak. However, the impacts of runoff inputs dramatically weaken with distance from estuary for the SSCs in the 5 km and 10 km buffer areas are much lower than that in the 3 km buffer area. In particular, in the 10 km buffer area, the SSC value is generally lower than 2.5 kg/m3, while the SSC in the 3 km buffer area reaches 8 kg/m3, even during the WSRS period.
Tides can change the flow cycle mode in the YRE, resulting in different sediment transport patterns (Shan et al., 2004). The diffusion characteristics of suspended sediment in the YRE and its offshore region are controlled by the tidal current field (Xie et al., 2022). Sediment in the no-tide scenario mainly accumulates at the river mouth and diffuses toward the northwest with a small spread range (Figure 11D), then it flows along the YRE coast with the tidal current (Figure 11A). As shown in Table 3, the ratio of the bottom shear stress of the no-tide scenario to that of the runoff-wave-tide scenario dramatically declines except for at point a (a is 94.5%, b is 24.5%, c is 25%, and d is 23.8%), which is located near the YRE and is mainly affected by runoff. This indicates that the tide plays an important role in sediment suspension. In addition, the tidal shear front plays an important role in the diffusion of sediments (Yang et al., 2017). A tidal shear front, which forms due to the significant difference in hydrodynamic characteristics between the front sides (Bi et al., 2014), appears at the interface between the high sediment water and the seawater. The sediment flow to the offshore areas is blocked by the tidal shear front and is limited in the sea beyond it. Zhan et al. (2020) found that the tidal shear front also limits sediment spread along the south coast to Laizhou Bay.
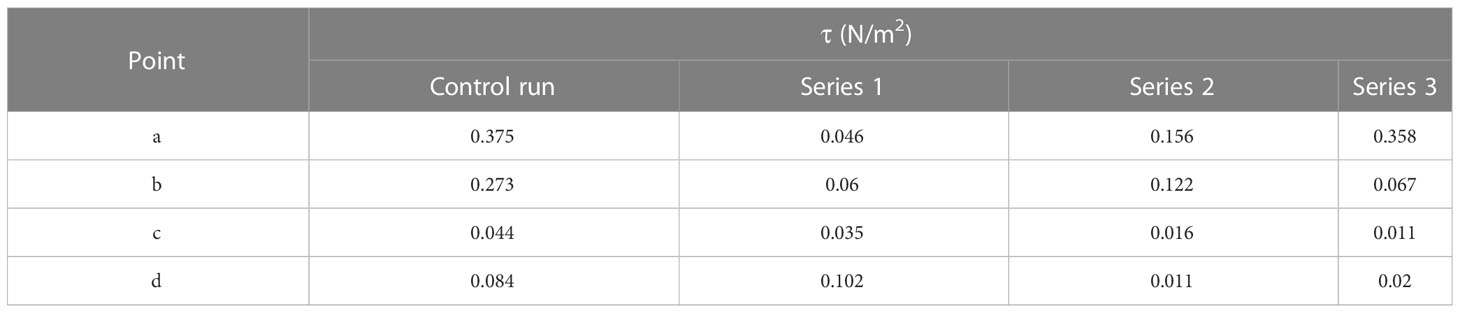
Table 3 The bottom shear stress at different points.
Waves are closely related to sediment resuspension because they induce increasing bed shear stress (Higgins Álvarez et al., 2022; Teng et al., 2015; Wen et al., 2018). Our results show that in the no-wave scenario (Figure 11C), the sediment distribution at YRE is smaller than that of the control run, and the ratio of bottom shear stress of the no-wave scenario to that of the runoff-wave-tide scenario decreases, even at point a (a is 41.6%, b is 44.7%, c is 36.4%, and d is 13.1%), which indicates that the temporal and spatial distributions of the sediment are also affected by waves. However, for the remaining areas, where the SSC is mainly affected by resuspension, the SSCs are relatively lower than that of the control case (Figure 11A). Therefore, the wave effect is a necessary factor in the sediment simulation of the YRE and its offshore region (Niu and Meng, 2017). In addition, the effect of waves is notably highly related to wind because wind-induced waves greatly increase the bottom stress, especially in areas with water depths less than 20 m where had more sediment resuspension (Zhan et al., 2020).
4.2 The effect of WSRS on sediment distribution
The SSC and sediment plume ranges in the YRE show significant differences during different periods. According to the measured data from Lijin Station, the flow discharge during the WSRS is approximately three times greater than that before the WSRS, and the sediment discharge rate is seven times greater than that before the WSRS (Figure 10). High discharge effectively scours the sediment that is deposited in the reservoir and downstream riverbed (Guo et al., 2017), and most of the sediment is transported to the YRE during the WSRS (Li et al., 2021). The high SSCs are concentrated in very limited areas close to the river mouth, and the hourly movement of the sediment plumes exhibits a similar pattern in different periods. The WSRS, which is implemented between June and September, could cause extremely high turbidity in the YRE, particularly near the river mouth. The distance from the estuary to 1 kg/m3 of the SSC contour is defined as the sediment plume length. The maximum SSC at the YRE during the WSRS is 8 kg/m3, and the sediment plume length is 15.6-22.4 km, which is much longer than that before the WSRS (5-6 km) and after the WSRS (7-14.6 km). Wang et al. (2019) showed that with the rapid increase in runoff and sediment discharge during the WSRS, the sediment plume length can reach the center of the Bohai Sea, which is consistent with the results of our study. The freshwater diffusion range can reach 119.4° E, 38.0° N (Figure 9).
Although the discharge after the WSRS is still high, the sediment rate declines (Figure 10). During the WSRS, reservoir flow effectively scours the previously-deposited sediments on the reservoir bed and the riverbed in the lower reaches, resulting in a large expanse of sediment plume transported to the estuary. Most of the sediments are flushed away, forming an armor layer of coarse-grained sediments on the riverbed (Li et al., 2021). The scouring efficiency is greatly reduced after the WSRS, causing the length of the sediment plume to decrease compared to that during the WSRS period. Although the sediment inputsof the Yellow River decreases, the range of surface sediment reduce; however, as the sediments gradually settle in the bottom layer, resulting in an increase in the area of high SSC in the bottom water.
4.3 The effect of WSRS on the topography of the YRE
Studies have shown that the land increase in the Yellow River delta from 1997 to 2018 is associated with the accumulation of sediment (Li et al., 2021). A large amount of sediment is input to the YRE during the WSRS, most of which accretes near the river mouth, which contributes to a maximum turbidity zone in the YRE (Shi, 2008). As shown in the sediment distribution (Figure 8), the SSC in the bottom layer remains at a high level, most of the sediment is directly deposited near the river mouth, and the sediment plume increases with time, especially after the WSRS. The sediment in the bottom water still increases even though the sediment input from the Yellow River declines. Sediment deposition causes an increase in the bed layer thickness at the YRE (Figure 12). These results indicate that the great intraday variations in the sediment due to the WSRS further change the land area of the Yellow River delta (Bian et al., 2013). As reported, approximately 66% of the sediment is deposited near the estuary of the Yellow River, and the remaining sediment spreads to the north and south seas with the tidal current (Wang et al., 2019).
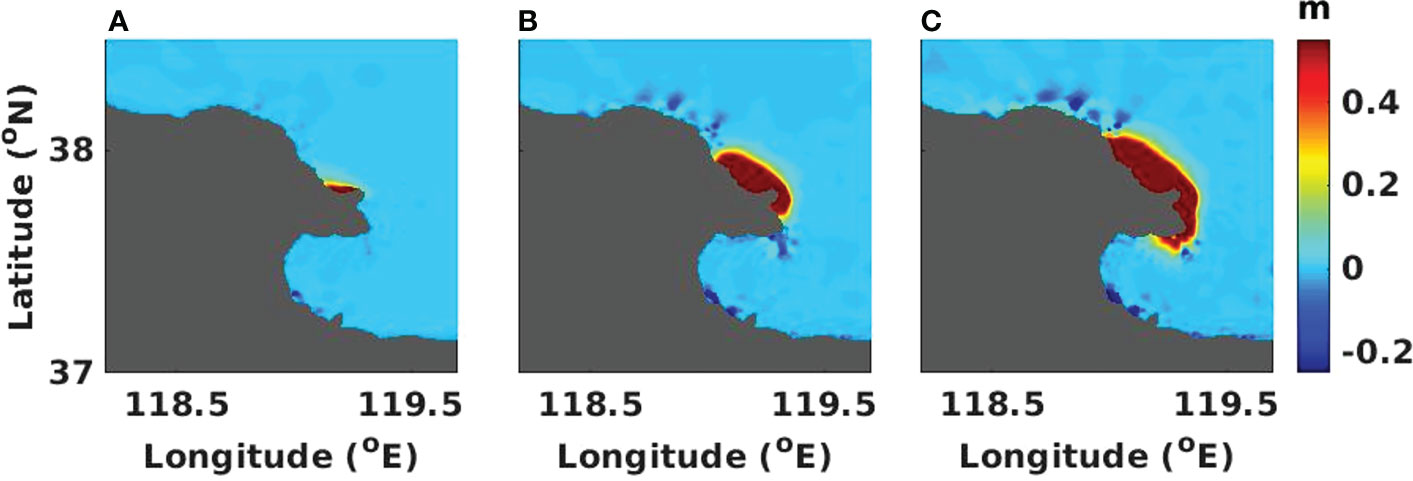
Figure 12 The accumulated delta of thickness (m) of the YRE and the offshore region, (A) is before the WSRS; (B) is during the WSRS; (C) is after the WSRS.
Except for the YRE, the spatial distribution of bottom erosion in the other areas (Figure 12) is consistent with the flow current (Figure 7), which means that areas with high current velocities show erosion. This is because the suspended sediment in these areas is mainly from resuspension (Ji et al., 2016).
Notably, compared to the early period of the WSRS from 2003 to 2007, when intense downstream riverbed scouring resulted in a rapid increase in SSC and significantly increased the land area of the Yellow River delta (Wang et al., 2007), the increase rate slowed from 2008 to 2015 (Li et al., 2019; Li et al., 2021), which may have further changed the hydrodynamic and sediment balance of the YRE and affected the topography; this should be thoroughly evaluated.
5 Conclusion
In this study, we establish a sediment model based on the coupling FVCOM-WAVE-SED, which simulates the sediment transport response to the WSRS and analyzes the factors affecting the sediment distribution in the YRE area. The general features of the model-predicted current, wave and sediment fields are validated by field observations. The roles of runoff, tides and waves on the suspended sediment distribution are well considered in the proposed model. Our results show that the sediment in the YRE diffuses in the form of plumes and are influenced by runoff, tides and waves. The sediment distribution during the WSRS exhibit substantially higher SSCs, larger plume areas, and longer plume lengths compared to the values in the other periods, which are associated with the enormous water and sediment discharge of the Yellow River. However, the sediment that is blocked by the tidal shear front moves offshore, and most of the sediment is limited at the river mouth. Although the discharge after the WSRS is high, the spread range greatly decreases due to the decreasing scouring rate. In response to the sediment variations, large amounts of sediments accrete near the river mouth and contribute to a maximum turbidity zone in the YRE. Outside of the YRE, the areas with high flow currents exhibit erosion. The results of this study are helpful to better understand the effect of the WSRS on the sediment distribution and erosion of the YRE and its offshore region and provide data for research on changes in estuarine ecosystems.
Data availability statement
The original contributions presented in the study are included in the article/supplementary material. Further inquiries can be directed to the corresponding author.
Author contributions
WJ: conceptualization, methodology, software, writing- original draft preparation, formal analysis. YY: conceptualization, validation, data analysis, supervision. All authors contributed to the article and approved the submitted version.
Funding
This study is supported by National Science Fund for Distinguished Young Scholars (52025092), the Joint Funds of the National Natural Science Foundation of China (U2243236), and the National Key Research and Development Program of China (2022YFC3202002).
Acknowledgments
We are very grateful to Lu Chang for her valuable advice to our study.
Conflict of interest
The authors declare that the research was conducted in the absence of any commercial or financial relationships that could be construed as a potential conflict of interest.
Publisher’s note
All claims expressed in this article are solely those of the authors and do not necessarily represent those of their affiliated organizations, or those of the publisher, the editors and the reviewers. Any product that may be evaluated in this article, or claim that may be made by its manufacturer, is not guaranteed or endorsed by the publisher.
References
Bertone E., Sahin O., Richards R., Roiko A. (2016). Extreme events, water quality and health a participatory Bayesian risk assessment tool for managers of reservoirs. J. Cleaner Production. 135, 657–667. doi: 10.1016/j.jclepro.2016.06.158
Bi N., Wang H., Yang Z. (2014). Recent changes in the erosion–accretion patterns of the active huanghe (Yellow river) delta lobe caused by human activities. Continental Shelf Res. 90, 70–78. doi: 10.1016/j.csr.2014.02.014
Bian C., Jiang W., Greatbatch R. (2013). An exploratory model study of sediment transport sources and deposits in the bohai Sea, yellow Sea, and East China Sea. J. Geophysical Res. Oceans 118, 5908–5923. doi: 10.1002/2013JC009116
Chang J., Lee G. H., Harris C. K., Song Y., Figueroa S.M., Schieder N.W., et al. (2020). Sediment transport mechanisms in altered depositional environments of the anthropocene nakdong estuary: A numerical modeling study. Mar. Geology 430, 106364. doi: 10.1016/j.margeo.2020.106364
Chen C., Beardsley R. C., Cowles G. (2006). An unstructured grid, finite-volume coastal ocean model (FVCOM) system. special issue entitled “Advance in computational oceanography”. Oceanography 19, 78–89. doi: 10.5670/oceanog.2006.92
Chu Z., Sun X., Zhai S., Xu K. (2006). Changing pattern of accretion/erosion of the modern Yellow River (Huanghe) subaerial delta, China: Based on remote sensing images. Mar. Geol. 227 (1), 13–30. doi: 10.1016/j.margeo.2005.11.013
Fan Y. (2019). Seabed erosion and its mechanism in the littoral area of yellow river delta (Shanghai: East China Normal University).
Higgins Álvarez A., Otero L., Restrepo J. C., Álvarez O.. (2022). The effect of waves in hydrodynamics, stratification, and salt wedge intrusion in a microtidal estuary. Front. Mar. Sci. 2022 (9). doi: 10.3389/fmars.2022.974163
Ji H., Pan S., Chen S. (2020). Impact of river discharge on hydrodynamics and sedimentary processes at yellow river delta. Mar. Geology 425, 106210. doi: 10.1016/j.margeo.2020.106210
Ji J., Wang Y., Wang X., Wang Y., Teng Y.. (2016). A numerical study of the transport process of yellow river sediment in summer. Mar. Sci. 40 (3), 118–127. doi: 10.11759/hykx20160224001
Jiang W., Su J., Yang H., Jiang H.. (2002). The relationship between distribution of suspended sediment in seawater and hydrodynamic characteristics. Acta Oceanologia Sin. 24 (S1), 212–217.
Li P., Feng A., Chen Y., Chen S.. (2010). The diffusion studies of sediment into sea during the period of yellow river water and sediment regulation. Trans. Oceanology Limnology 4, 72–78. doi: 10.3969/j.issn.1003-6482.2010.04.010
Li P., Ke Y., Bai J., Zhang S., Chen M., Zhou D., et al. (2019). Spatiotemporal dynamics of suspended particulate matter in the Yellow River Estuary, China during the past two decades based on time-series Landsat and Sentinel-2 data. Mar. Pollut. Bull 149, 110518. doi: 10.1016/j.marpolbul.2019.110518
Li P., Ke Y., Wang D., Ji H., Chen S., Chen M., et al. (2021). Human impact on suspended particulate matter in the yellow river estuary, China: Evidence from remote sensing data fusion using an improved spatiotemporal fusion method. Sci. Total Environ. 141612. doi: 10.1016/j.scitotenv.2020.141612
Li G., Sheng L. (2011). Model of water sediment regulation in yellow river and its effect. Sci. China: Technol. Sci. 54 (4), 924–930. doi: 10.1007/s11431-011-4322-3
Li C., Wang Z., Liu H., Zuo L., Lu Y., Wu P., et al. Impact of a water-sediment regulation scheme on nutrient variations at the lijin station of the yellow river. Frontiers. Environ. Sci. 2022 (10). doi: 10.3389/fenvs.2022.900508
Lu J., Qiao F., Wang X., Teng Y., Xia C.. (2011). A numerical study of transport dynamics and seasonal variability of the yellow river sediment in the bohai and yellow seas. Estuar. Coast. Shelf Sci. 95 (1), 39–51. doi: 10.1016/j.ecss.2011.08.001
Niu Q., Xia M. (2017). The role of wave-current interaction in lake erie's seasonal and episodic dynamics. J. Geophysical Research: Oceans 122 (9), 7291–7311. doi: 10.1002/2017jc012934
Pang C., Yu Y. (2013). Spatial modes of suspended sediment concentration in surface water in bohai Sea and their temporal variations. Adv. In Water Sci. 24 (5), 723–727.
Ren L., Wang M., Li C., Zhang W. (2002). Impacts of human activity on river runoff in the northern area of China. J. Hydrology. 261, 204–217. doi: 10.1016/S0022-1694(02)00008-2
Shan H., Liu Y., Xu G. (2004). Case study of microstructure transform of silt due to wave action on subaqueous slope of Yellow River Estuary. China. Chinese J. Geot. Eng. 26 (5), 654–658. doi: 10.3321/j.issn:1000-4548.2004.05.017
Shi W. (2008). 3D numerical simulation and analysis of the transportation of suspended sediment in the huanghe estuary (Qingdao: Ocean University of China). doi: 10.7666/d.y1338419
Teng Y., Yang Y., Lu J., Cui T. (2015). A numerical study of the wave effect on sediment transport and test in the bohai Sea. Acta Oceanologica Sin. 34 (5), 174–182. doi: CNKI:SUN:SEAC.0.2012-05-022
Wang H., Bi N., Saito Y., Wang Y., Sun X., Zhang J., et al. (2010). Recent changes in sediment delivery by the huanghe (Yellow river) to the sea: Causes and environmental implications in its estuary. J. Hydrology 391, 302–313. doi: 10.1016/j.jhydrol.2010.07.030
Wang N., Qiao L., Li G., Zhong Y. (2019). Numerical study on seasonal transportation of the suspended sediments in the modern yellow river mouth effected by the artificial water and sediment regulation. J. Ocean Univ. China 18, 20–30. doi: 10.1007/s11802-019-3646-7
Wang H., Yang Z., Saito Y., Liu J.P., Sun X., Wang Y., et al. (2007). Stepwise decreases of the huanghe (Yellow river) sediment load, (1950–2005): Impacts of climate change and human activities. Global Planetary Change 57 (3-4), 331–354. doi: 10.1016/j.gloplacha.2007.01.003
Warner J.c., Defne Z., Haas K., Arango H. (2013). A wetting and drying scheme for ROMS. Comput. Geosci 58, 54–61. doi: 10.1016/j.cageo.2013.05.004
Wei Y., Jiao J., Zhao G., Zhao H., He Z., Mu X., et al. (2016). Spatial-temporal variation and periodic change in streamflow and suspended sediment discharge along the mainstream of the yellow river during 1950-2013. Catena 140, 105–115. doi: 10.1016/j.catena.2016.01.016
Wen M., Shan H., Zhang S., Liu X., Jia Y. (2018). Contribution of waves and currents to sediment resuspension in the yellow river delta. Mar. Georesources Geotechnology 37, 1–7. doi: 10.1080/1064119X.2018.1452084
Wu X., Wang H., Bi N., Saito Y., Xu J.. (2020). Climate and human battle for dominance over the yellow river’s sediment discharge: From the mid-Holocene to the anthropocene. Mar. Geology 425, 106188.
Xie B., Bao R., Yin D., Zhu L., Hu R.. (2022). The spatio-temporal distribution and transport of suspended sediment in laizhou bay: Insights from hydrological and sedimentological investigations. Front. Earth Sci. 2022 (10). doi: 10.3389/feart.2022.994258
Xu B., Burnett W., Dimova N., Diao S., Mi T., Jiang X., et al. (2013). Hydrodynamics in the yellow river estuary via radium isotopes: Ecological perspectives. Continental Shelf Res. 66, 19–28. doi: 10.1016/j.csr.2013.06.018
Yang H., Li E., Zhao Y., Liang Q.. (2017). Effect of water-sediment regulation and its impact on coastline and suspended sediment concentration in yellow river estuary. Water Sci. Eng. 10 (4), 311–319. doi: 10.1016/j.wse.2017.12.009
Yang X., Sun W., Li P., Mu X., Gao P., Zhao G., et al. (2018). Reduced sediment transport in the Chinese loess plateau due to climate change and human activities. Sci. Total Environ. 642, 591–600. doi: 10.1016/j.scitotenv.2018.06.061
Yao Q., Li X., Wang M., Wang X., Gao G., Liu Y., et al. (2012). Influencing mechanism of the operation of xiaolangdi project on Flow/Sediment variation rules in yellow river delta. J. Soil Water Conserv. 26 (6), 57–62. doi: CNKI:SUN:TRQS.0.2012-06-013
Yuan B., Sun J., Lin B., Zhang F.. (2020). Long-term morphodynamics of a large estuary subject to decreasing sediment supply and sea level rise. Global Planetary Change 191, 103212. doi: 10.1016/j.gloplacha.2020.103212
Zhan C., Wang Q., Cui B., Zeng L., Dong C.. (2020). The morphodynamic difference in the western and southern coasts of laizhou bay: Responses to the yellow river estuary evolution in the recent 60 years. Global Planetary Change 187, 103138. doi: 10.1016/j.gloplacha.2020.103138
Zhang J., Li F., Lv Q., Wang Y., Yu J.. (2021). Impact of the water sediment regulation scheme on the phytoplankton community in the yellow river estuary. J. Cleaner Production 294 (7120), 126291. doi: 10.1016/j.jclepro.2021.126291
Appendix
The governing equation of FVCOM is:
Continuity equation:
Momentum equation:
Temperature equation:
Salinity equation:
Density equation:
where x, y, and z are the east, north, and vertical axes in the Cartesian coordinate system, respectively; u, v, and w are the x, y, and z velocity components (m/s), respectively; T is the temperature; S is the salinity; ρ is the density (kg/m3); ρ0 is the reference density (kg/m3); p is the air pressure; 𝜂 is the elevation of the free surface (m); 𝜉 is the elevation of the sea bottom (m); f is the Coriolis parameter; g is the gravitational acceleration; Km is the vertical eddy viscosity coefficient (m2/s); Kh is the thermal vertical eddy diffusion; and FT and FS are the thermal, and salt diffusion terms, respectively.
The governing equation of the wave action density spectrum can be written as:
where N is the wave action density spectrum, t is the time, σ is the relative frequency, θ is the wave direction, Cσ and Cθ are the wave propagation velocities in spectral space (σ, θ), Cg is the group velocity, and V is the ambient water current vector.
The equation of the suspended sediment model is:
where Ci is the sediment concentration; AH is the horizontal eddy viscosity; Kh is the thermal vertical eddy diffusion; and Wi is the settling velocity, which is specified by the user in the input file.
Keywords: FVCOM-SWAVE-SED, Yellow River Estuary, water-sediment regulation scheme, sediment transport model, sediment distribution
Citation: Jia W and Yi Y (2023) Numerical study of the water-sediment regulation scheme (WSRS) impact on suspended sediment transport in the Yellow River Estuary. Front. Mar. Sci. 10:1135118. doi: 10.3389/fmars.2023.1135118
Received: 31 December 2022; Accepted: 10 February 2023;
Published: 23 February 2023.
Edited by:
Dehai Song, Ocean University of China, ChinaReviewed by:
Yuanjian Wang, Yellow River Institute of Hydraulic Research, ChinaXiangxin Luo, Sun Yat-sen University, China
Copyright © 2023 Jia and Yi. This is an open-access article distributed under the terms of the Creative Commons Attribution License (CC BY). The use, distribution or reproduction in other forums is permitted, provided the original author(s) and the copyright owner(s) are credited and that the original publication in this journal is cited, in accordance with accepted academic practice. No use, distribution or reproduction is permitted which does not comply with these terms.
*Correspondence: Yujun Yi, eWl5dWp1bkBibnUuZWR1LmNu