Abstract
Siliceous microplankton is an effective proxy for connecting modern and past marine environments; however, radiolarians have been understudied in Prydz Bay, Eastern Antarctica. This study investigated the changes in the siliceous microbiota fluxes and radiolarian assemblages captured in a 1-year time-series sediment trap (February 2014 to February 2015, ~490 m water depth) in the polynya of Prydz Bay. The results exhibited the strong seasonality in the radiolarian assemblages and the fluxes of radiolarians, diatoms, silicoflagellates and sponge spicules, with low numbers in winter and high numbers in summer. Seasonal variations in the sea ice and plankton community were critical in these patterns. The total radiolarian flux (TRF) displayed three peaks with higher flux than the annual average TRF over the year, all of which occurred in summer. These TRF peaks were mainly driven by seasonal fluctuations of sea ice, primary productivity, grazing pressure caused by phytophagous zooplankton and resuspension of small radiolarians in the surface sediments induced by modified Circumpolar Deep Water (mCDW) intrusion onto the shelf. There were also two notable low-TRF stages, mainly related to full sea-ice coverage and high grazing pressure. Two dominant assemblages were recognized by means of Q-factor analysis. Dominant assemblage one was composed of three small-sized taxa, Antarctissa sp., Phormacantha hystrix and Plectacantha oikiskos, which could be used as a proxy for primary productivity in the Marginal Ice Zone (MIZ) in Prydz Bay. Dominant assemblage two was composed of Antarctissa strelkovi and Antarctissa denticulata, with A. strelkovi dominating. The high flux and high relative abundance of A. strelkovi marked the extension of Ice Shelf Water (ISW) to the shelf area in Prydz Bay. These findings will provide new insights and reliable proxies for modern and paleoceanographic research in the Southern Ocean.
1 Introduction
The Southern Ocean, a key area for study of the interactions between seawater, sea ice, and the atmosphere and their effects on the climate system, plays a key role in the global carbon and silicon cycles (e.g., Xiao et al., 2016; Meredith et al., 2019; Huguenin et al., 2022). In recent decades, the marine environment and ecosystem of the Southern Ocean have undergone remarkable and rapid changes, of which sea ice is a crucial variate (e.g., Schmidt et al., 2018; Meredith et al., 2019). The MIZ is the transition zone between the open (ice-free) ocean and dense pack ice, where sea-ice algae contributes to the biological pump via the seeding of sea-ice-edge blooms (Szymanski and Gradinger, 2016; Yoshida et al., 2020; Louw et al., 2022). These blooms are thought to account for approximately 50% of total primary production of MIZ, despite the composition of the phytoplankton community is still debated (Deppeler and Davidson, 2017; Louw et al., 2022).
Coastal polynyas in the waters around the Antarctica continent are also unique marine ecosystems with low ice cover and high rates of primary production due to the combination of high sunlight and high nutrients, especially iron supply (e.g., Arrigo et al., 2015; McCormack et al., 2017).These areas support critical food sources for abundant top predators, including seals, penguins, and albatross. In austral spring and summer, the surface waters of polynya and their primary producers also undergo processes experienced in the MIZ. For example, sea ice algae varies dramatically in a short period of time in response to light, temperature, pH, and nutrient and gas concentrations (Arrigo, 2017; McMinn, 2017; Yoshida et al, 2020), which in turn cause changes in the feeding strategies of phytophagous zooplankton (copepods and krill) to cope with temporally and spatially changing food availability (Yang et al., 2013). This process has an important impact on the biological pump efficiency and its seasonal variations in polynya areas (Han, 2018; Yang et al., 2019).
Prydz Bay is the largest shelf sea in Eastern Antarctica, contains one of the most productive Antarctic coastal polynyas characterized by high localized primary productivity and zooplankton abundance (Arrigo and van Dijken, 2003; Yang et al., 2019), making it a window to study the marine ecosystem, biological pump efficiency and carbon cycle of the Southern Ocean (Arrigo et al., 2015; Han et al, 2019). The coastal polynyas in Prydz Bay are also believed to be one of important sources in the formation of Antarctic Bottom Water, with supercooled water originating from the Amery Ice Shelf (AIS) and West Ice Shelf (WIS) (Shi et al., 2011; Williams et al., 2016; Ohshima et al., 2022). This supercooled water, known as Ice Shelf Water (ISW), has been studied in terms of its spatial distribution and source (e.g., Yabuki et al., 2006; Shi et al., 2011; Zheng et al., 2011; He et al., 2016), yet there is still a lack of effective indicators for the northward extension of ISW and the associated records of ice shelf expansion over a longer time scale. In this regard, radiolarians in water and sediment may provide a potential solution to this problem.
Siliceous microplankton is an important agent of organic carbon cycling in the global ocean (Matul and Mohan, 2017), with radiolarians being a key group of planktonic communities that connect the micro-food loop and ocean food web (Steineck and Casey, 1990; Suzuki and Not, 2015). Radiolarians play important roles in various marine ecosystems and have been identified as powerful tools for paleoceanographic study (Takahashi, 1991), particularly in high-latitude areas of the Antarctic Ocean that lack calcareous sediments (Abelmann and Gowing, 1997). Their wide range of biodiversity and unique ecosystem regime provide a potentiality for paleoclimate study in the Southern Ocean (Lawler et al., 2021; Lowe et al., 2022). Knowledge of radiolarian ecology is essential for paleoceanographic reconstructions (Takahashi, 1991), and the time-series moored sediment trap is an effective way to assess the production rate, seasonality and distribution pattern of radiolarians in the water column. In the past few decades, sediment traps have been widely used to observe annual and seasonal changes of radiolarians and to study their ecological significance and relationship with the marine environment in Northern Hemisphere oceans (e.g., Boltovskoy et al., 1996; Takahashi et al., 2000; Ikenoue et al., 2012; Matul and Mohan, 2017). By contrast, only a few studies have been devoted to modern radiolarians in the Southern Ocean, mainly focusing on their spatial and temporal distributions in the Atlantic sector. These studies have shown that the obvious seasonal variations of radiolarians, characterized by short-term flux pulses during the austral summer, which are linked to variations in sea-ice coverage and also affected by phytoplankton production, “scavenging” by zooplankton grazers (e.g., krill and copepods), and lateral transport (e.g., Abelmann, 1992a; Abelmann and Gowing, 1997; Suzuki and Not, 2015; Boltovskoy, 2017). Additionally, distinct differences in the species composition were observed in the neritic and pelagic environments. For example, the relative abundances of the Antarctissa denticulata/strelkovi group were 50% and 36% in the upper and lower traps in the Drake Passage, respectively, but these species rarely appeared in the traps sited in the Bransfield Strait and the Powell Basin (Abelmann, 1992b).
In Prydz Bay, previous trap-based studies have focused on particle fluxes, primary production and the biological pump, the trace element compositions, and the particulate barium flux and its relationship with export production (Sun et al., 2013; Sun et al., 2016; Han et al., 2018; Han et al., 2019). However, radiolarian fluxes and their seasonal changes in this area are still poorly understood. This paper presents the first 1-year settling flux record of radiolarians and other siliceous mircoplankton obtained from a sediment trap deployed in the polynya of Prydz Bay from February 2014 to February 2015. The specific objectives of this study are to reveal the seasonal variation of radiolarian flux and its relationship with the marine environment, and to investigate the seasonal variations of the dominant radiolarian species/assemblages and their ecological significance in Prydz Bay.
2 Regional setting
The Prydz Bay Gyre, a closed cyclonic gyre, is characterized by modern surface circulation in Prydz Bay (Figures 1A, B). It is mainly located on the shelf area and is fed by broad inflows from the northeast (Smith and Tréguer, 1994), as well as some water from the Antarctic Coastal Current, a westward current that flows along the front of the AIS and exits near Cape Darnley, bringing cold water from the WIS (Smith et al., 1984; Nunes Vaz and Lennon, 1996). The Antarctic Slope Current flows westward along the continental shelf break in the north of the bay (Smith et al., 1984; Mathiot et al., 2011). Between the Antarctic Slope Current and Antarctic Circumpolar Current, the cyclonic Antarctic Divergence Zone intrudes into the shelf and brings up the relatively warm and salty Circumpolar Deep Water (Yabuki et al., 2006; Williams et al., 2016).
Figure 1

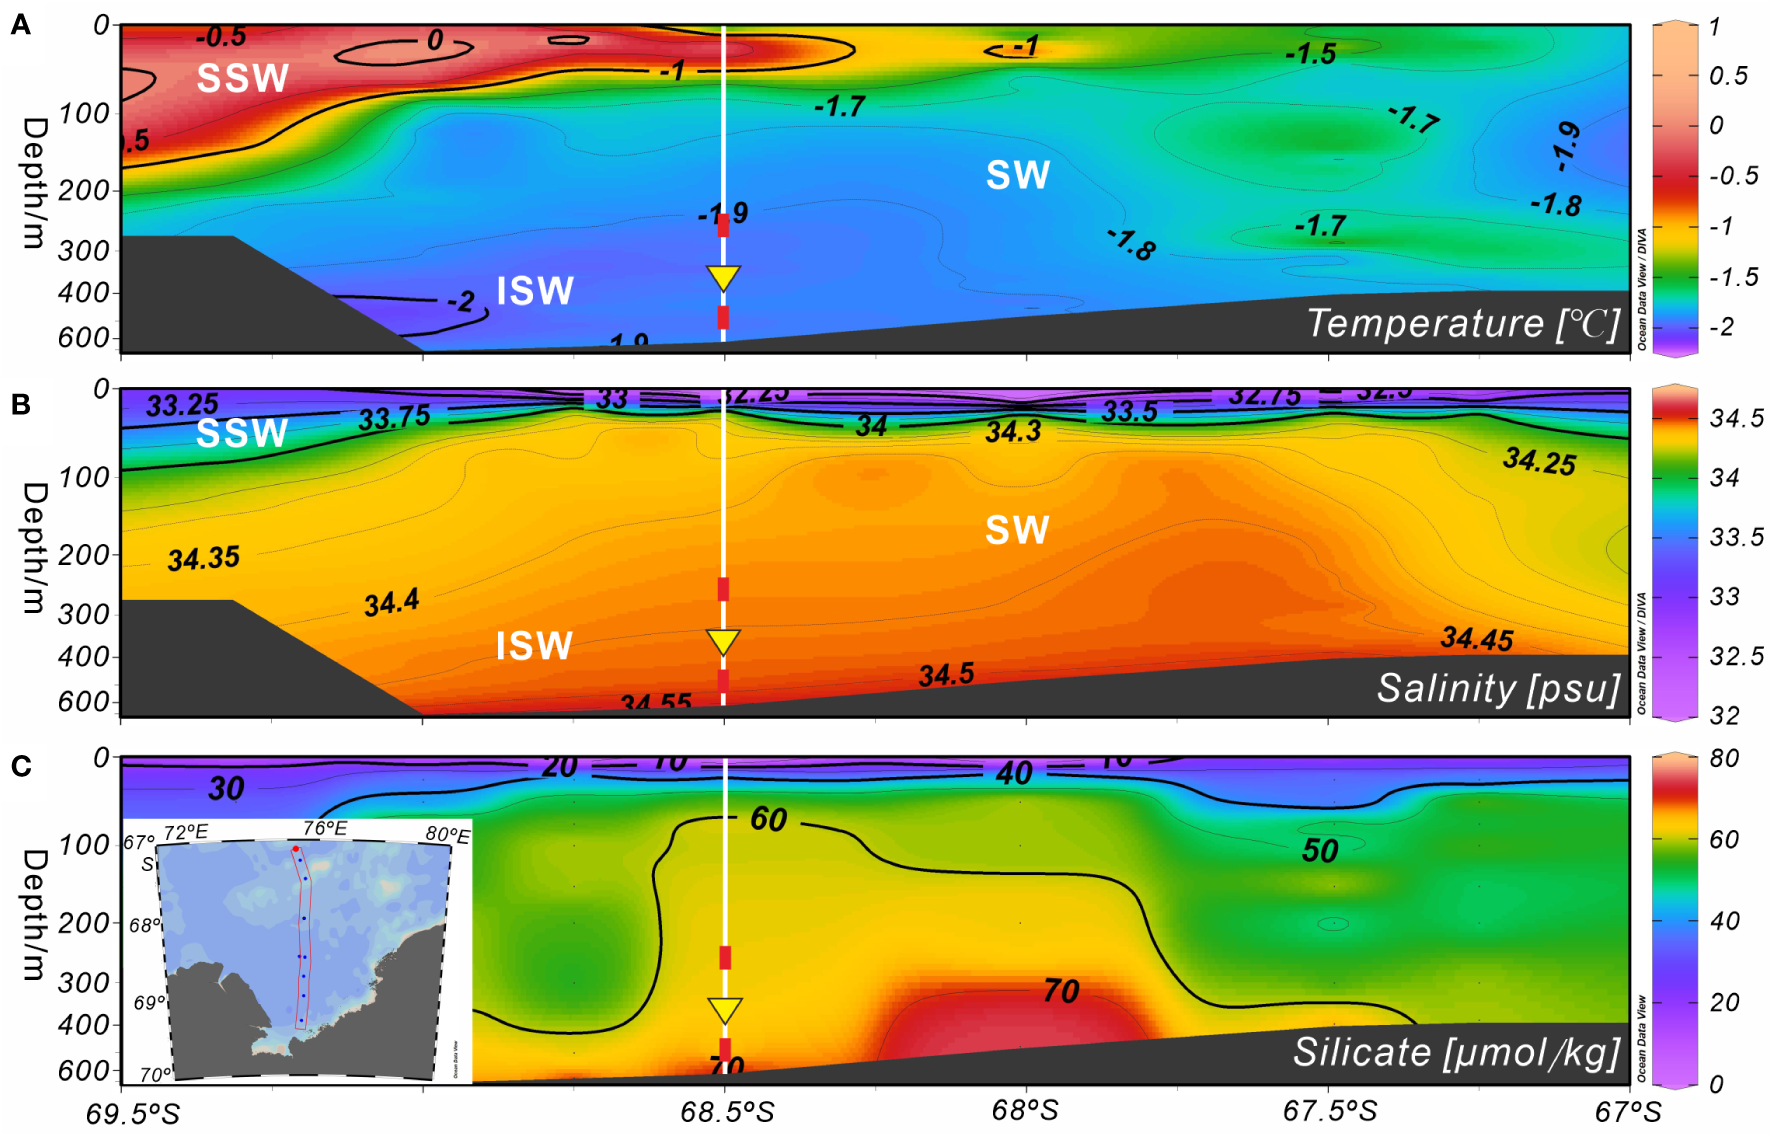
Schematic plots of the survey station and environmental setting of Prydz Bay and adjacent areas, Eastern Antarctica. (A) Schematic diagram of the Antarctic region. The light red shaded area of the closed loop represents the flow width of the ACC. (B) Station M8 (yellow five-pointed star) and modern surface circulation (arrows) in Prydz Bay. The black solid line (SS’) represents the hydrological location of section 75.5°E in (C–E). Major current systems (modified from Wu et al., 2019; Zhu et al., 2019): ACC, Antarctic Circumpolar Current; ADZ, Antarctic Divergence Zone; ASC, Antarctic Slope Current; CoC, Antarctic Coastal Current; PBG, Prydz Bay Gyre. Major geomorphic units: PC, Prydz Channel; FLB, Four Ladies Bank; FB, Fram Bank; AB, Amery Basin; AIS, Amery Ice Shelf; WIS, West Ice Shelf. (C–E) show the water masses and their temperature, salinity and silicate profiles (section 75.5°E) near Station M8. The data set representing the climatological annual mean between 1955 and 2010, were obtained from the World Ocean Atlas 2018 (https://odv.awi.de/data/ocean/world-ocean-atlas-2018). Major water masses: SSW, Summer Surface Water; WW, Winter Water; SW, Shelf Water; ISW, Ice Shelf Water; mCDW, modified Circumpolar Deep Water. White vertical solid lines indicate the location of Station M8. Red squares mark the depths at which the temperature sensors were installed, and yellow inverted triangles indicate the position of the sediment trap.
Five water masses are present around Prydz Bay (e.g., Smith et al., 1984; Yabuki et al., 2006). It has been suggested that the water mass on the shelf is relatively simple and stable, typically composed of Antarctic Surface Water, Shelf Water, modified Circumpolar Deep Water (mCDW) and ISW (Figures 1C, D) (e.g., Yabuki et al., 2006; Williams et al., 2016; Guo et al., 2019). The Antarctic Surface Water can be divided into the Summer Surface Water (SSW) and Winter Water. The SSW is spread above the seasonal thermocline of a vast area of Prydz Bay south of 62°S, with a thickness of 20 to 50 m, while the Winter Water is a thin layer of cold, salty water under the SSW, mainly occurring north of the slope (e.g., Chen et al., 2014; Guo et al., 2019). The mCDW can intrude into the shelf across Four Ladies Bank or through the Prydz Channel (Figures 1B–D) (e.g., Yabuki et al., 2006; Williams et al., 2016; Liu et al., 2018; Guo et al., 2019). The Shelf Water is the “memory” of the cold winter water (T < −1.5°C) under the SSW, while the ISW is a “supercooled” water mass formed by internal cooling beneath the ice shelves (Yabuki et al., 2006; Shi et al., 2011), and plays an important role in the marine environmental system of Prydz Bay (Smith and Tréguer, 1994; Williams et al., 2016). Recent studies have revealed that the ISW occurs mainly below the seasonal thermocline along the front of the AIS, with a maximum depth of 600 m. This water mass is divided horizontally into several discrete water cores, exhibiting temporal and spatial variations (Zheng et al., 2011). Although most of the ISW is concentrated west of 73°E, it can also be observed east of 73°E during some summers, and is believed to originate from the WIS (Zheng et al., 2011; Williams et al., 2016).
Recent studies have reported the distribution and structural characteristics of nutrients in Prydz Bay and its adjacent areas, with a generalized pattern of a “front” along the shelf edge, featuring high nutrient levels in the inner bay to the south of the front and low levels in the slope and deep sea areas to the north (e. g. Chen et al., 2017). The silicate content, which is closely related to radiolarian production, displays similar characteristics. The 50 µmol kg−1 contour of silicate on the shelf appears at approximately 50 m, and then not differing markedly with increasing depth (Figure 1E).
Chlorophyll a (chl-a) concentrations in the surface water of Prydz Bay during summer follow a similar pattern to that of nutrients, being high in the shelf area and low in the deep sea area. This pattern was confirmed by measurements obtained during cruises conducted by Chinese National Antarctic Research Expedition (e.g., Liu and Chen, 2003). Furthermore, chl-a exhibits obvious seasonal and regional changes, as demonstrated by the remote-sensing chl-a concentration data for 2014–2015 (Figure 2A). This variation is mainly controlled by the seasonal changes of sea ice, water temperature, sunlight duration and nutrient content (e.g., Sun et al., 2012).
Figure 2
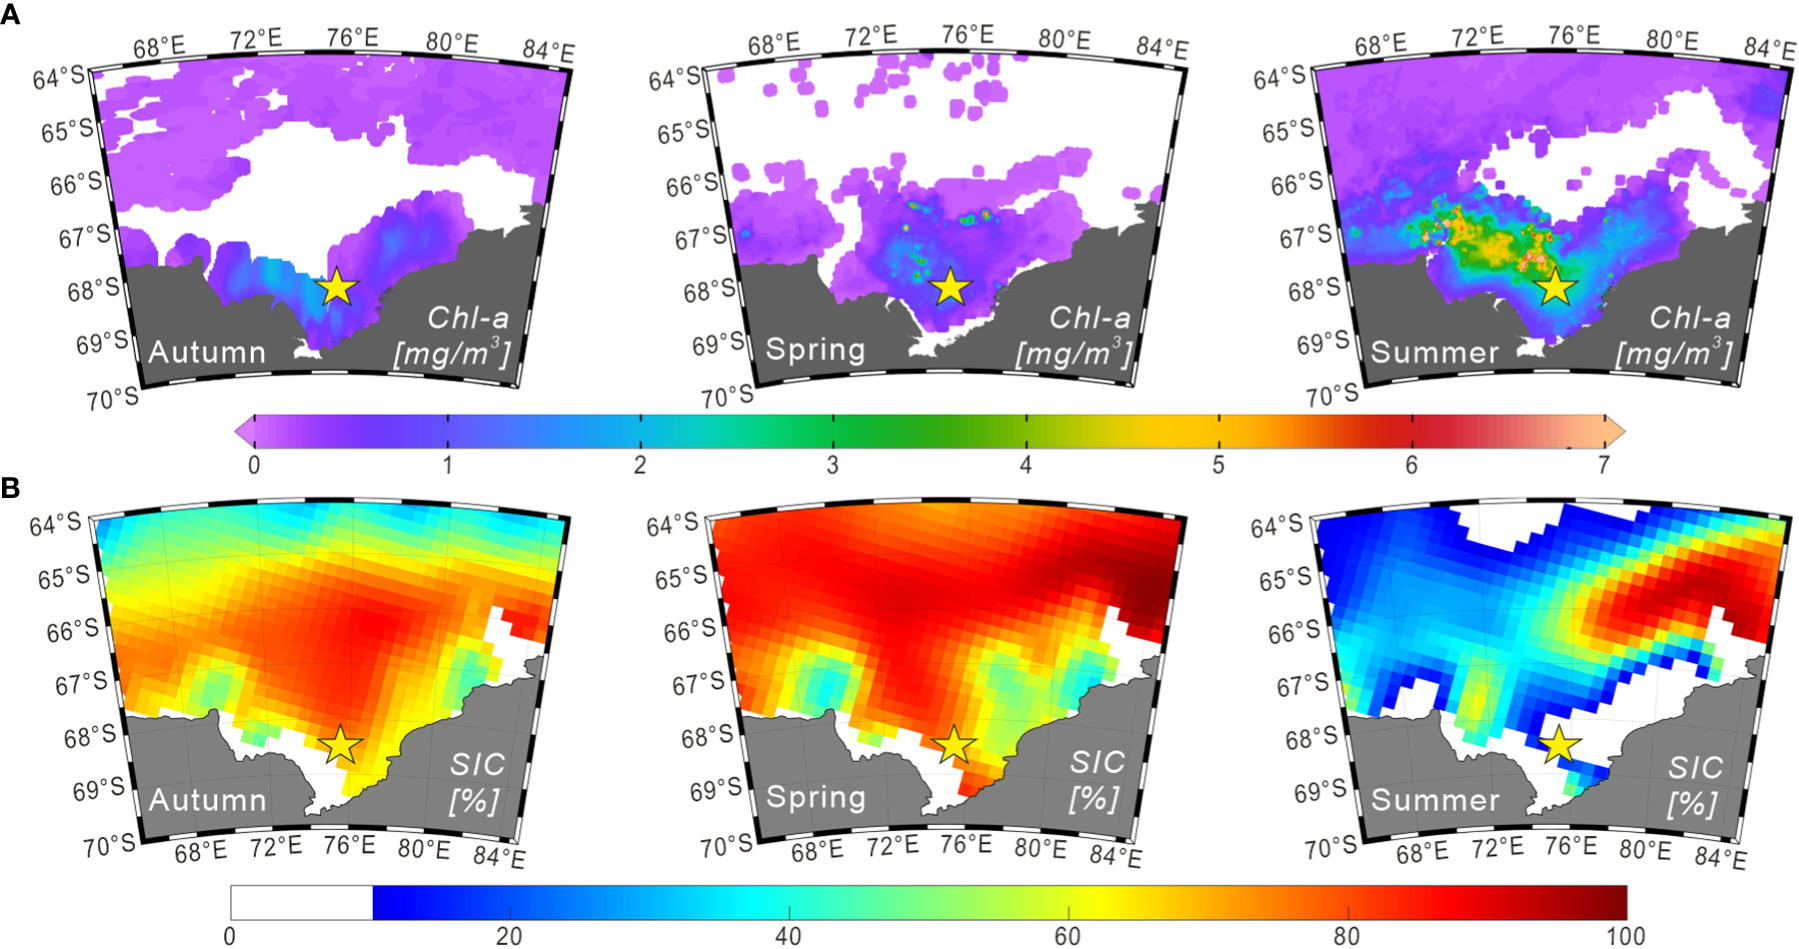
Seasonal distributions of chlorophyll a and sea-ice concentrations (2014–2015) in Prydz Bay and adjacent areas. (A) Seasonal chlorophyll a concentration data in the surface ocean derived from Aqua-MODIS products (https://oceanwatch.pifsc.noaa.gov/erddap/griddap). The durations of autumn, spring and summer were defined as March 01 to June 01, 2014; September 01 to December 01, 2014; and December 01, 2014 to March 01, 2015, respectively. (B) Seasonal sea-ice concentration data obtained from the climatology data set (2014–2015) of the National Snow and Ice Data Center (https://nsidc.org). The durations of autumn, spring and summer were defined as March–April–May, September–October–November, and December–January–February of 2014 and 2015, respectively.
Sea ice extends to approximately 57°S during winter and generally retreats back to the inner bay in summer, but some multi-year sea ice may exist in coastal areas (Figure 2B). In the austral summer, sea ice undergoes bidirectional melting because of the polynyas in Prydz Bay, retreating from north to south in the outer bay and from south to north in the inner bay (Zheng and Shi, 2011). Sea ice in Prydz Bay is reported to generally begin thawing in October, with the most rapid decrease in the sea-ice concentration (SIC) in November. This melting is primarily manifested internally within the sea ice. From December, melting is mainly observed as a decrease in sea-ice coverage area. March is the primary stage of sea-ice growth, which is characterized by rapid expansion of the sea-ice edge and increasing SIC in polynyas (Zheng and Shi, 2011; and reference therein).
3 Material and methods
3.1 Sediment trap samples
A mooring system was deployed for 1 year at Station M8 (68.49°S, 75.38°E, 620 m water depth) in Prydz Bay polynya from February 27, 2014 to February 12, 2015 (Han, 2018). This system carried a Mark78H-21 sediment trap (McLane Inc., East Falmouth, Massachusetts, USA), an RBRsolo T temperature sensor (moored at ~282 m, RBR Ltd., Ottawa, Canada) and an SBE37-SM conductivity–temperature–depth sensor (moored at ~582 m, Sea-Bird Scientific, Bellevue, Washington, USA) (Figure 1). The time-series trap with 21 rotary sample cups was installed at ~490 m water depth. The cups were filled with filtered seawater that had been pre-treated with 1.67% mercuric chloride solution to prevent degradation of organic matter by microbial activity (Han et al., 2019). Because of the differences in primary productivity and SIC in Prydz Bay during austral summer and winter, the sampling interval was set at approximately 1 week (7 to 9 days) from December to February and at half a month or 1 month (15 or 30 days) between March and November (Table S1). After recovery of the trap, all samples were sieved using a 1-mm mesh nylon sieve to remove zooplankton swimmers. Particulates < 1 mm were then divided into equal aliquots with a McLane wet sample divider (WSD-10). Radiolarian and diatom slides were produced from 19 of the samples; however, this was not possible for cups 6 and 8 due to insufficient sample size.
3.2 Slide preparation and identification
Quantitative radiolarian and diatom slides were prepared according to the methods developed based on the previous studies (Wang et al., 2006; Zhang et al., 2009; Ren et al., 2021; Ran et al., 2022). Subsamples of each aliquot (1/32 to 3/32, depending on sample amount) were treated with HCl (~10%) and H2O2 (~30%) to generate residues. The mixtures were then stirred and diluted with distilled water four times to remove excess HCl and H2O2, as well as the reaction solution. The remaining particles were collected to a constant volume of 50 or 100 mL for slides.
For each radiolarian slide, an aliquot of a known amount (1 to 40 mL, depending on the particulate content) of the residue was dropped on a cover glass (24 × 50 mm) settled in a Petri dish containing gelatin solution. For each diatom slide, an aliquowas countedt of a known amount (0.1 to 3 mL, depending on the particle content) of the residue was diluted to 20 mL and mixed with 2 mL gelatin solution, then dropped on two cover glasses (24 × 24 mm) settled in a Petri dish. After 1 h (for radiolarian slides) or 24 h (for diatom slides) of settling time, the supernatant in the dish was removed with bibulous paper. When the materials had completely dried, each cover glass was transferred onto a labeled slide. These permanent slides were mounted with NOA61 UV-sensitive glue (nD = ~1.56, Norland Products, Inc, USA).
All the radiolarians (refer to polycystine radiolarian in this paper), sponge spicules and lithogenic debris in each radiolarian slide were counted under a Leica DM 750 light microscope at ×200 magnification. Radiolarians were identified from plates in references (e.g., Petrushevskaya, 1967; Petrushevskaya, 1971; Takahashi, 1991; Abelmann, 1992a; Abelmann, 1992b; Boltovskoy, 1999; Boltovskoy et al., 2010) and an online radiolarian website (http://www.radiolaria.org). Sponge spicules were mainly identified according to two books (Boury-Esnault and Rutzler, 1997; Hooper and van Soest, 2002). Lithogenic debris (< 1 mm) was counted directly. Diatoms and silicoflagellates in each diatom slide were counted with a Motic BA410E microscope at ×400 or ×1000 magnification, and were mainly identified using the plates of Zielinski (1993). Only siliceous specimens with intact main bodies (> 2/3 shell) were counted.
3.3 Statistical data analysis
3.3.1 Total particle fluxes
The total radiolarian flux (TRF) in each sample was calculated using the following equation:
where TRF is expressed in skeletons m−2 day−1, N is the total number of radiolarians counted under the microscope, S is the area of the petri dish (mm2), n is the number of fields of vision in which radiolarians were counted under the microscope, s is the area of one field of vision (mm2), f is the proportion of the sample used for the quantitative slide, A is the area of the funnel mouth (m2) of sediment trap, and T is the duration of each sampling interval (days).
Similarly, the totals of diatom flux (TFdiatom), silicoflagellate flux (TFsilico), sponge spicule flux (TFss), lithogenic debris flux (TFlitho), and each identified radiolarian species flux (SF) in each sample were estimated using this formula.
3.3.2 Relative abundance
The relative abundance (RA) of every identified radiolarian species in each sample was calculated by the following equation:
where Na represents the number of specimens of a given radiolarian species identified in a sample, and N represents the total number of all radiolarian specimens identified in the same sample. This parameter can reflect the contribution of each species to TRF in each sample to some extent.
3.3.3 Q-mode factor analysis
Due to the limited sample material for radiolarians analysis from the sediment trap (splits of 1/32 to 3/32 of the total sample), fewer than 300 radiolarians could be counted in some samples, particularly samples collected during winter at times of low flux. Therefore, conventional Q-factor analysis, which involves selecting species with relative abundance > 2% (Wang et al., 2006), was not suitable for studying changes in radiolarian assemblages. To address this issue, two new parameters, the average contribution rate (ACR) and relative contribution rate (RCR), were introduced to screen the dominant species/assemblages of radiolarians and to reduce statistical deviation caused by insufficient sample size. They were calculated as described below.
(1) First, the average TRF and SF values for all 19 samples (i.e., annual average, 290 days in total) were calculated and referred to as TRFave. and SFave., respectively.
(2) Second, the ACR of every species through the year (ACRSF) were estimated, representing the average contribution rate of each species to all radiolarian assemblages over the year, using the following equation:
(3) Third, the RCR of every species in each sample (RCRSF) was estimated, representing the ratio of each SF in every sampling interval to TRFave., reflecting the time series variation of the contribution of each species to the total radiolarian flux. This was calculated using the following equation:
Species with ACRSF > 2% in at least one sample are identified as dominant species, and their RCRSF were analyzed by the Q-factor analysis module (CABFAC) of the PAST software (version 4.06b) (Hammer et al., 2001).
4 Results
4.1 Seasonal variation of TRF
TRF in Prydz Bay polynya from 2014 to 2015 was low in winter and high in summer, exhibiting time-series variation that was notably different from that of total mass flux (TMF) after October 2014 (Figures 3B, C). The TRFave. of 19 samples was 4070 skeletons m−2 d−1. Three radiolarian flux peaks (RFP) with high TRF (> TRFave.) were observed throughout the year, contributing 55.5% of the total annual radiolarian count (Table 1; Figure 3C). Specifically, the highest TRF of the year (30850 skeletons m−2 d−1) was observed during the first RFP period (RFP-1) in late summer to early autumn 2014 (February 27 to March 14), which was five to six times greater than the maximum values in later peaks, and represented 39.2% of total annual radiolarian count. After late March 2014, TRF decreased sharply with the rapid increase of SIC (Figures 3A, C). During autumn and winter (March 14 to September 10, 2014), the average TRF was only 2070 skeletons m−2 d−1. After October, TRF increased markedly, and the second RFP peak (RFP-2) occurred in late spring 2014 (November 9 to December 1). The average TRF during RFP-2 was approximately 5420 skeletons m−2 d−1, contributing 10.1% of the total annual radiolarian count (Table 1; Figure 3C). Subsequently, during the early summer (December 1, 2014 to January 19, 2015), there was a low-TRF stage lasting 7 weeks, with an average of only 1360 skeletons m−2 d−1, even lower than the rate in winter. From that time, TRF increased again, and the third RFP (RFP-3) occurred in mid-summer (January 19 to February 3), with an average of ca. 4850 skeletons m−2 d−1, representing 6.2% of total annual radiolarian count (Table 1; Figure 3C). In the last sampling interval of the year, TRF was approximately 3650 skeletons m−2 d−1.
Figure 3
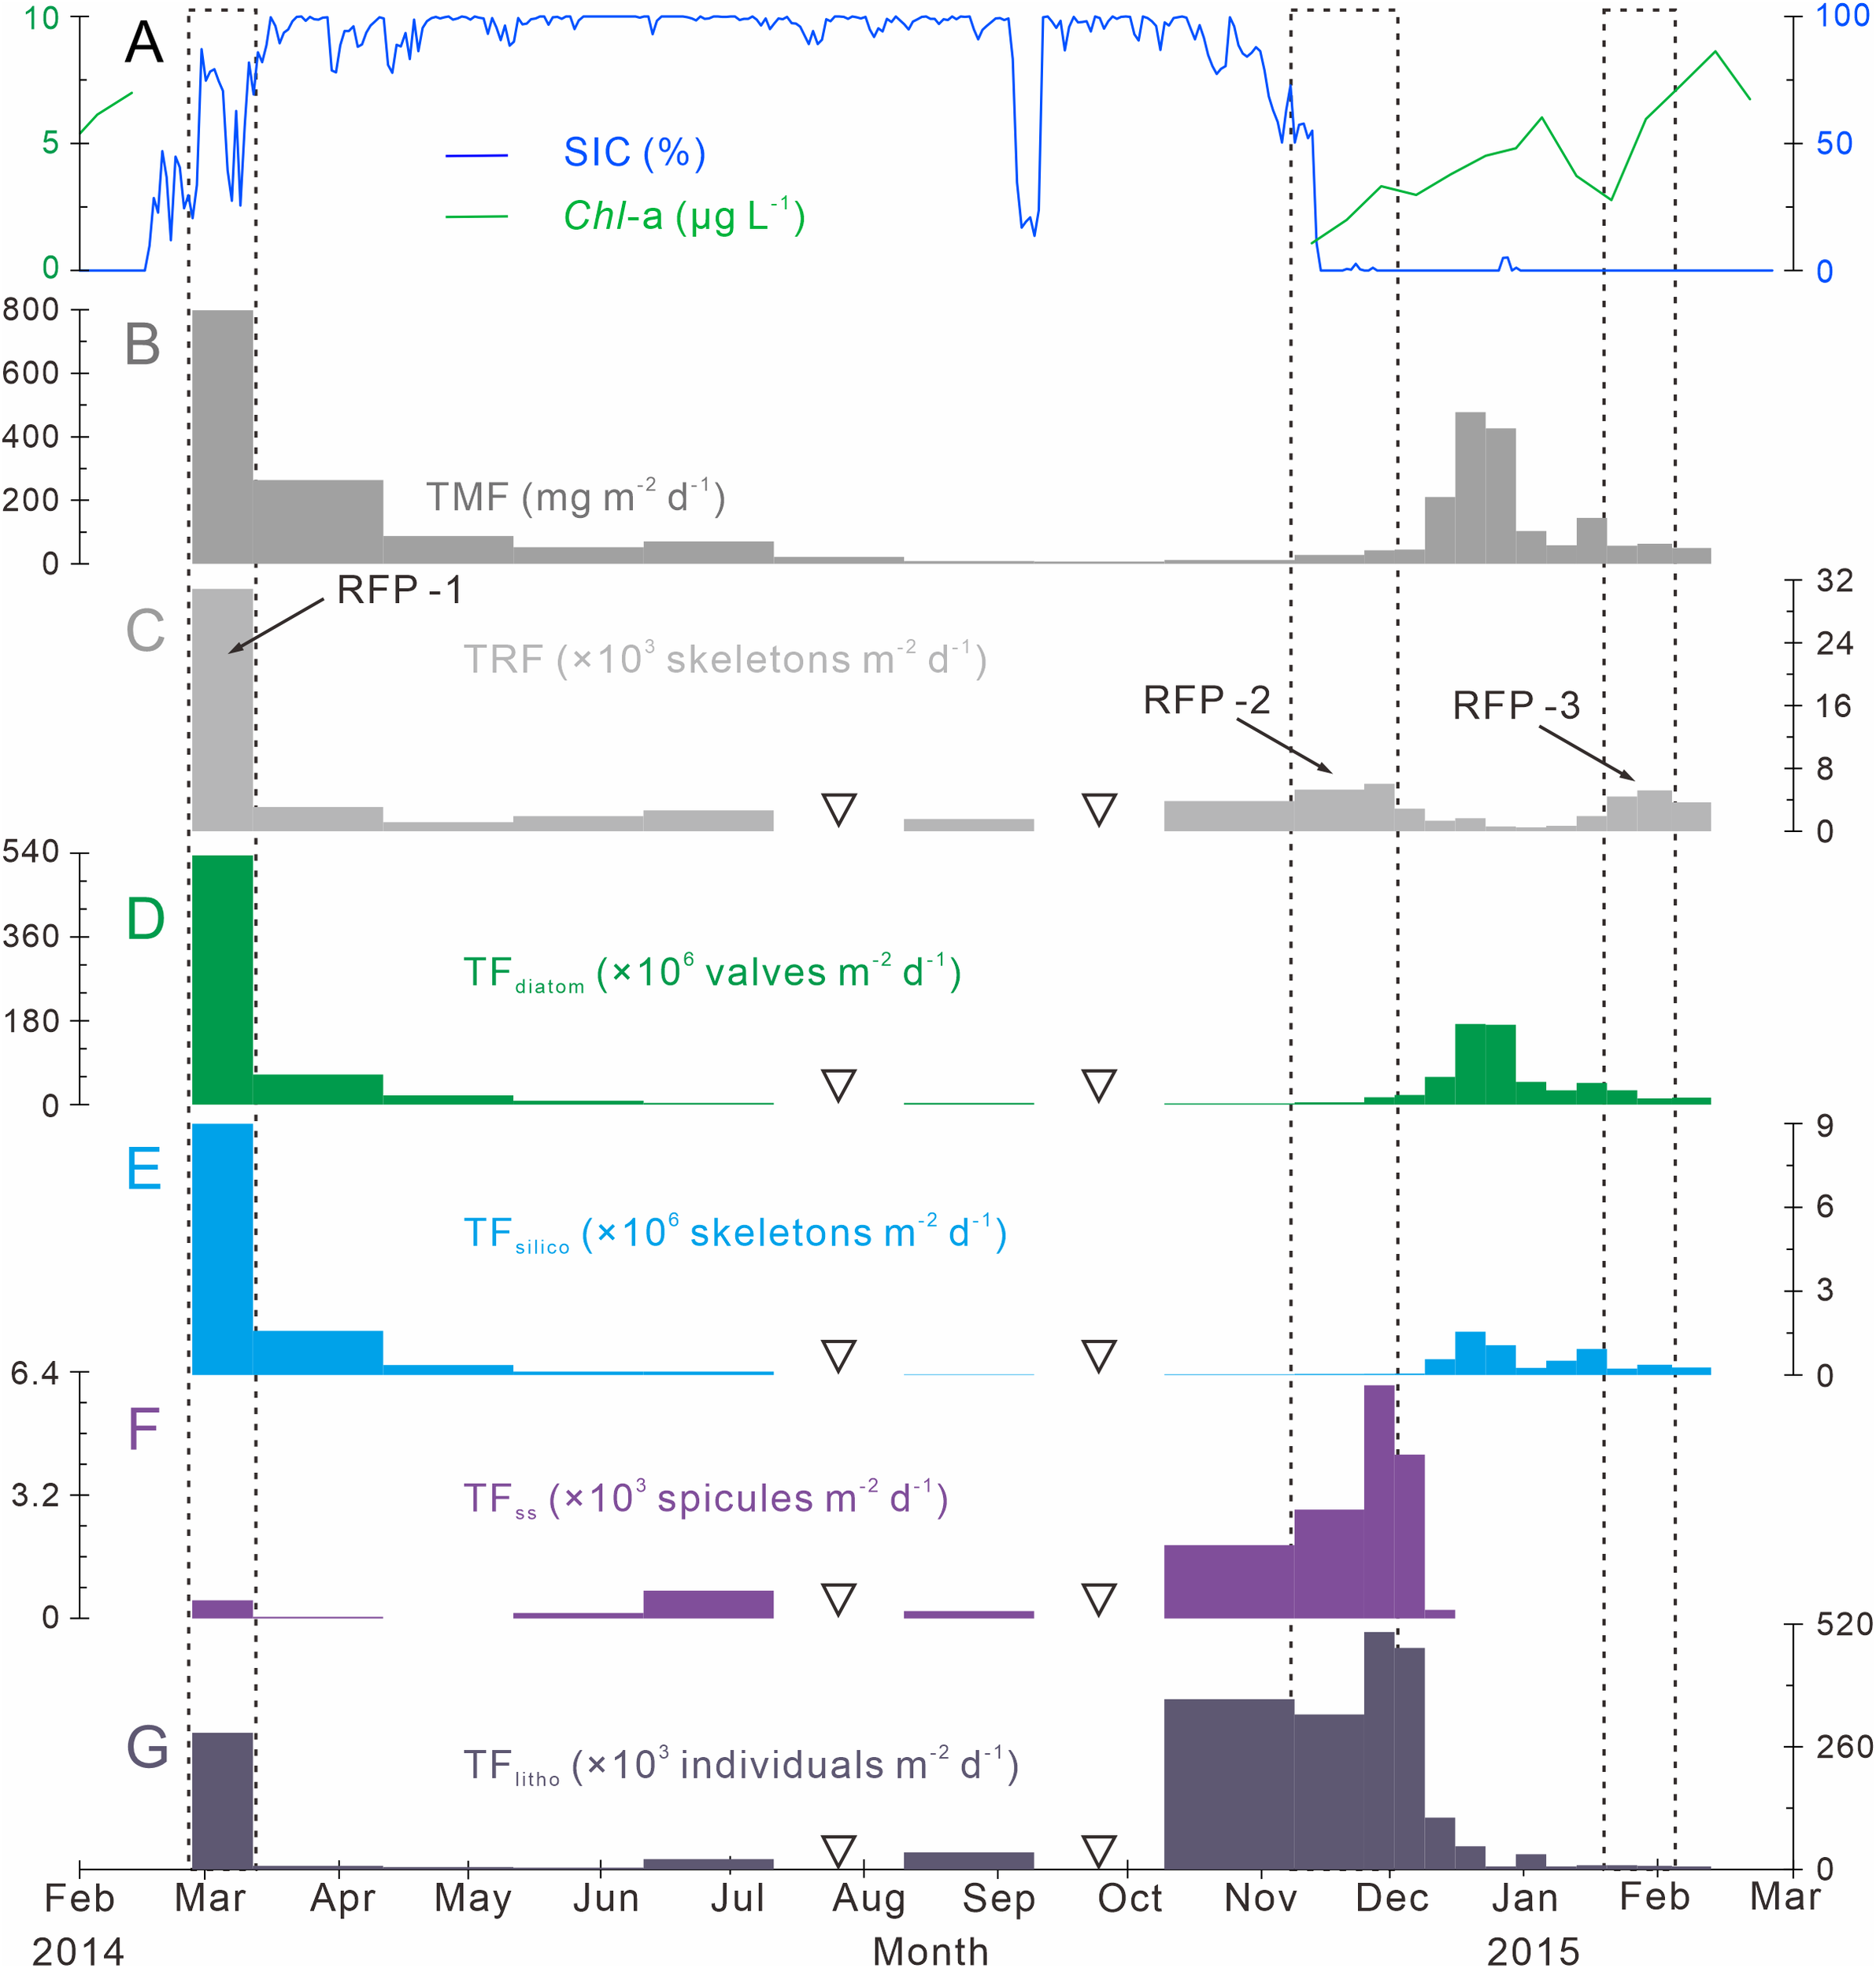
Time-series variations of particle fluxes, SIC (%) and Chl-a (μg L−1) in Prydz Bay polynya. (A) Distributions of SIC (%) and Chl-a (µg L−1). SIC data were retrieved from the University of Bremen (http://www.iup.uni-bremen.de:8084/amsr2); Chl-a data from the Aqua-MODIS products (http://hermes.acri.fr). (B) TMF, total mass flux (Han, 2018). (C) TRF, total radiolarian flux. RFP-1–3 are three radiolarian flux peaks (black dotted lines). (D) TFdiatom, total diatom flux. (E) TFsilico, total silicoflagellate flux. (F) TFss, total sponge spicule flux. (G) TFlitho, total lithogenic debris (< 1 mm) flux. The width of each bar in the histogram indicates the sampling interval, and black hollow inverted triangles mark samples that were not analyzed because the sample size was too small.
Table 1
| No. | Sampling period | Season | Total days | Sampling intervals | Ave. TRF* | Contr. rate to total Rads** | Ratio to TRFave.*** | Stage |
|---|---|---|---|---|---|---|---|---|
| 1 | 2014.02.27-03.14 | Late summer to early autumn | 15 | 1 | 30850 | 39.2% | 7.6 | RFP-1 |
| 2 | 2014.03.14-09.10 | Autumn to winter | 150 | 5 | 2070 | 26.3% | 0.5 | |
| 3 | 2014.10.10-11.09 | Early spring | 30 | 1 | 3790 | 9.6% | 0.9 | |
| 4 | 2014.11.09-12.01 | Late spring | 22 | 2 | 5420 | 10.1% | 1.3 | RFP-2 |
| 5 | 2014.12.01-2015.01.19 | Early to middle summer | 49 | 7 | 1360 | 5.7% | 0.3 | |
| 6 | 2015.01.19-02.03 | Mid-summer | 15 | 2 | 4850 | 6.2% | 1.2 | RFP-3 |
| 7 | 2015.02.03-02.12 | Late summer | 9 | 1 | 3650 | 2.8% | 0.9 | |
| 8 | 2014.02.27-2015.02.12 | Annual | 290 | 19 | 4070**** | 100% | 1 |
Seasonal variations of TRF from the trap in Prydz Bay polynya.
*Average flux of radiolarians during the sampling period (unit: skeletons m−2 d−1); note that a sampling period may contain more than one sampling interval. Ave. TRF is calculated by summing (TRF value × number of days) for all sampling intervals within the sampling period, and dividing this value by the total number of sampling days during the sampling period. The data are rounded to the nearest ten digits.
**Contribution to the total number of radiolarians, i.e., the proportion of radiolarians during the sampling period to the total number of radiolarians for the year. The contribution is calculated as Ave. TRF multiplied by the total number of sampling days, then divided by the total annual sinking radiolarians (290 days multiplied by 4070 skeletons m−2 d−1). The sum of these numbers is slightly less than 100% because of rounding during the operation.
***Ratio of the average radiolarian flux during the sampling period to TRFave., which is calculated by Ave. TRF divided by TRFave. (4070 skeletons m−2 d−1). According to this parameter, there were three radiolarian flux peaks for which this value was greater than one.
****TRFave. is calculated by the sum of TRF in each of the 19 sampling intervals multiplied by the corresponding number of sampling days, then divided by the total number of sampling days (290 days).
4.2 Seasonal variation of other particle fluxes
The time-series changes of TFdiatom and TFsilico also showed seasonality, high in summer and low in winter (Figures 3D, E), similar to TMF but different from TRF (Figures 3B, C). The annual average values were 53.6 × 10⁶ valves m−2 d−1 for TFdiatom and 0.8 × 10⁶ skeletons m−2 d−1 for TFsilico (Table 2). In detail, both diatoms and silicoflagellates exhibited flux peaks during RFP-1, which were also their highest fluxes of the year, with TFdiatom and TFsilico of approximately 535.1 × 10⁶ valves m−2 d−1 and 9.0 × 10⁶ skeletons m−2 d−1, respectively, representing 51.7% and 55.4% of the total annual counts of diatoms and silicoflagellates, respectively (Table 2). Subsequently, both types of microbiota experienced a long low-flux stage lasting 9 months, and displayed second flux peaks simultaneously with TMF in the middle of summer 2014 (December 15 to 29). During these sampling intervals, the average TFdiatom and TFsilico were 172.4 × 10⁶ valves m−2 d−1 and 1.3 × 10⁶ skeletons m−2 d−1, respectively, accounting for approximately 15.5% and 7.5% of total annual diatoms and silicoflagellates, respectively (Table 2; Figures 3D, E). Both of these fluxes were much lower than those during RFP-1.
Table 2
| No. | Particle fluxes | Annual | First flux peak | Second flux peak | |||||
|---|---|---|---|---|---|---|---|---|---|
| Ave.* | Max. | Sampling period | Ave.** | Contr. rate to total fluxes*** | Sampling period | Ave.** | Contr. rate to total fluxes*** | ||
| 1 | Diatom/×106 vales m-2 d-1 | 53.6 | 535.1 | 2014.02.27-03.14 | 535.1 | 51.7% | 2014.12.15-12.29 | 172.4 | 15.5% |
| 2 | Silicoflagellate/×106 skeletons m-2 d-1 | 0.8 | 9.0 | 2014.02.27-03.14 | 9.0 | 55.4% | 2014.12.15-12.29 | 1.3 | 7.5% |
| 3 | Sponge spine/×103 spicules m-2 d-1 | 0.7 | 6.0 | 2014.02.27-03.14 | 4.6 | 32.9% | 2014.11.09-12.08 | 3.9 | 53.8% |
| 4 | Lithogenic debris/×105 individuals m-2 d-1 | 1.1 | 5.0 | 2014.02.27-03.14 | 2.9 | 14.2% | 2014.11.09-12.08 | 4.1 | 38.2% |
Seasonal features of the fluxes of siliceous microorganisms and lithogenic debris from the trap in Prydz Bay polynya.
*Annual average flux.
**Average flux in the corresponding sampling period.
***Contribution to total fluxes, representing the proportion of particles (siliceous particles and lithogenic debris) during the corresponding sampling period to the total annual sinking fluxes. Calculations are as in Table 1.
The seasonal variation of TFss was notably different from those of other siliceous microplankton (Figures 3C–F). The annual average TFss was approximately 0.7 × 10³ spicules m−2 d−1, with a maximum of ca. 6.0 × 10³ spicules m−2 d−1 occurring from late autumn to early summer (November 24 to December 1) (Table 2; Figure 3F). Over the same period, TFlitho also exhibited the highest peak of the year, with a maximum of approximately 5.0 × 10⁵ particles m−2 d−1, and another peak occurred at the same time as RFP-1, with approximately 2.9 × 10⁵ particles m−2 d−1. The annual average TFlitho was ca. 1.1 × 10⁵ particles m−2 d−1 (Table 2; Figure 3G).
4.3 Q-mode factor analysis
Following the method outlined in section 3.3.3, 15 dominant radiolarian species were recognized with ACRSF > 2% (Figures 4B, C, 5); the sum of these ACRs was 85.2%. A Q-mode factor analysis based on the RCR values of these 15 species yielded two varimax factors (Table 3), which explained 84.3% of the total population information. Factor one was composed of three small taxa: Antarctissa sp., Phormacantha hystrix and Plectacantha oikiskos (Figures 5A–E), with ACR values of 15.0%, 13.1% and 10.6%, respectively. Factor two was composed of Antarctissa strelkovi and Antarctissa denticulata (Figures 5F–I), with ACR values of 12.4% and 2.7%, respectively. The sum of these five ACR values was 53.8% (Table 3; Figure 4C).
Figure 4
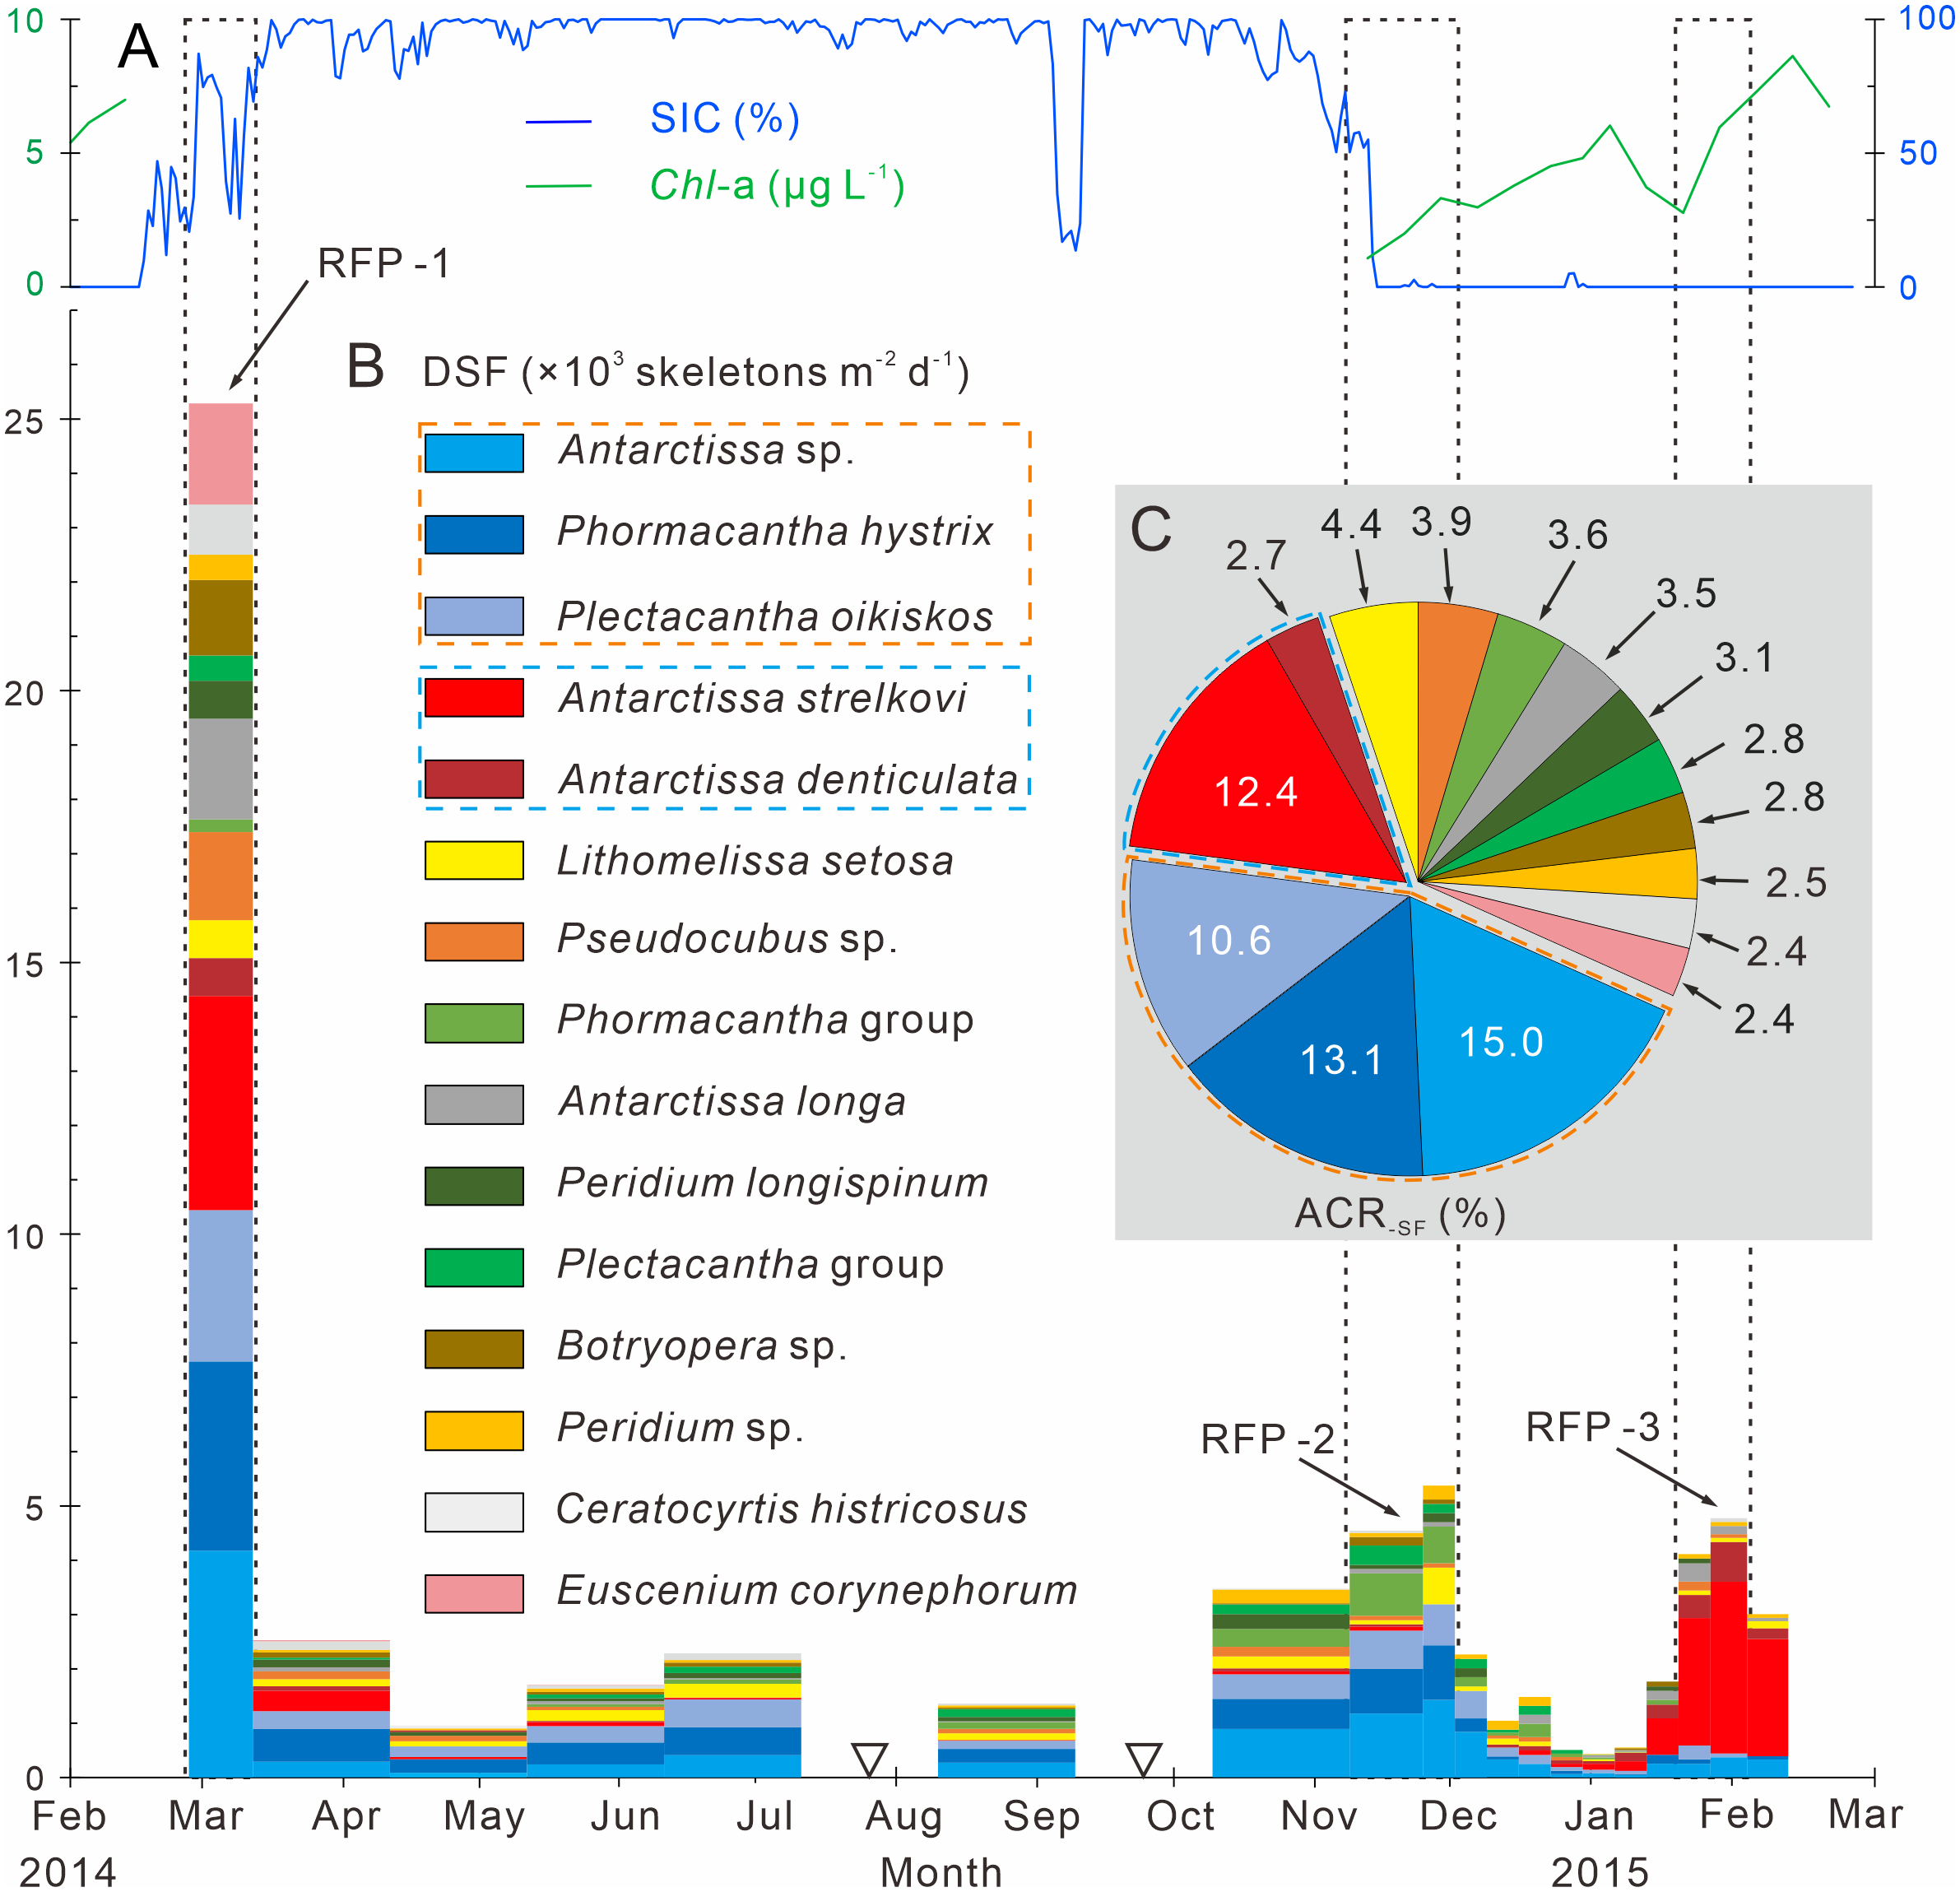
Time-series variations of the dominant species fluxes, SIC (%) and Chl-a (µg L−1) in Prydz Bay polynya. (A) SIC (%) and Chl-a (µg L−1). SIC data were retrieved from the University of Bremen (http://www.iup.uni-bremen.de:8084/amsr2); Chl-a data from the Aqua-MODIS products (http://hermes.acri.fr). (B) DSF, dominant species flux. RFP-1–3 are the three radiolarian flux peaks, (black dotted boxes). The width of each histogram box indicates the sampling interval, and black hollow inverted triangles mark samples that were not analyzed because the sample size was too small. Orange and blue dotted boxes indicate dominant assemblages one and two, respectively. (C) ACR-SF, average contribution of each species flux.
Table 3
| Specie Name | ACRSF/% | Factor 1 | Factor 2 |
|---|---|---|---|
| Antarctissa sp. | 15.0 | 2.488 | 0.305 |
| Phormacantha hystrix | 13.1 | 1.809 | 0.047 |
| Antarctissa strelkovi | 12.4 | -0.391 | 3.637 |
| Plectacantha oikiskos | 10.6 | 1.688 | 0.173 |
| Lithomelissa setosa | 4.4 | 0.792 | 0.011 |
| Pseudocubus sp. | 3.9 | 0.495 | 0.158 |
| Phormacantha group | 3.6 | 0.835 | 0.043 |
| Antarctissa longa | 3.5 | 0.170 | 0.540 |
| Peridium longispinum | 3.1 | 0.420 | 0.016 |
| Plectacantha group | 2.8 | 0.641 | -0.038 |
| Botryopera sp. | 2.8 | 0.184 | 0.202 |
| Antarctissa denticulata | 2.7 | 0.026 | 1.126 |
| Peridium sp. | 2.5 | 0.500 | 0.012 |
| Ceratocyrtis histricosus | 2.4 | 0.240 | 0.048 |
| Euscenium corynephorum | 2.4 | 0.084 | 0.115 |
ACRSF and varimax factor score matrix of dominant radiolarian species from the trap in Prydz Bay polynya.
The bold values represent the factor scores of the five dominant taxa recognized in factors 1 and 2, respectively.
Figure 5
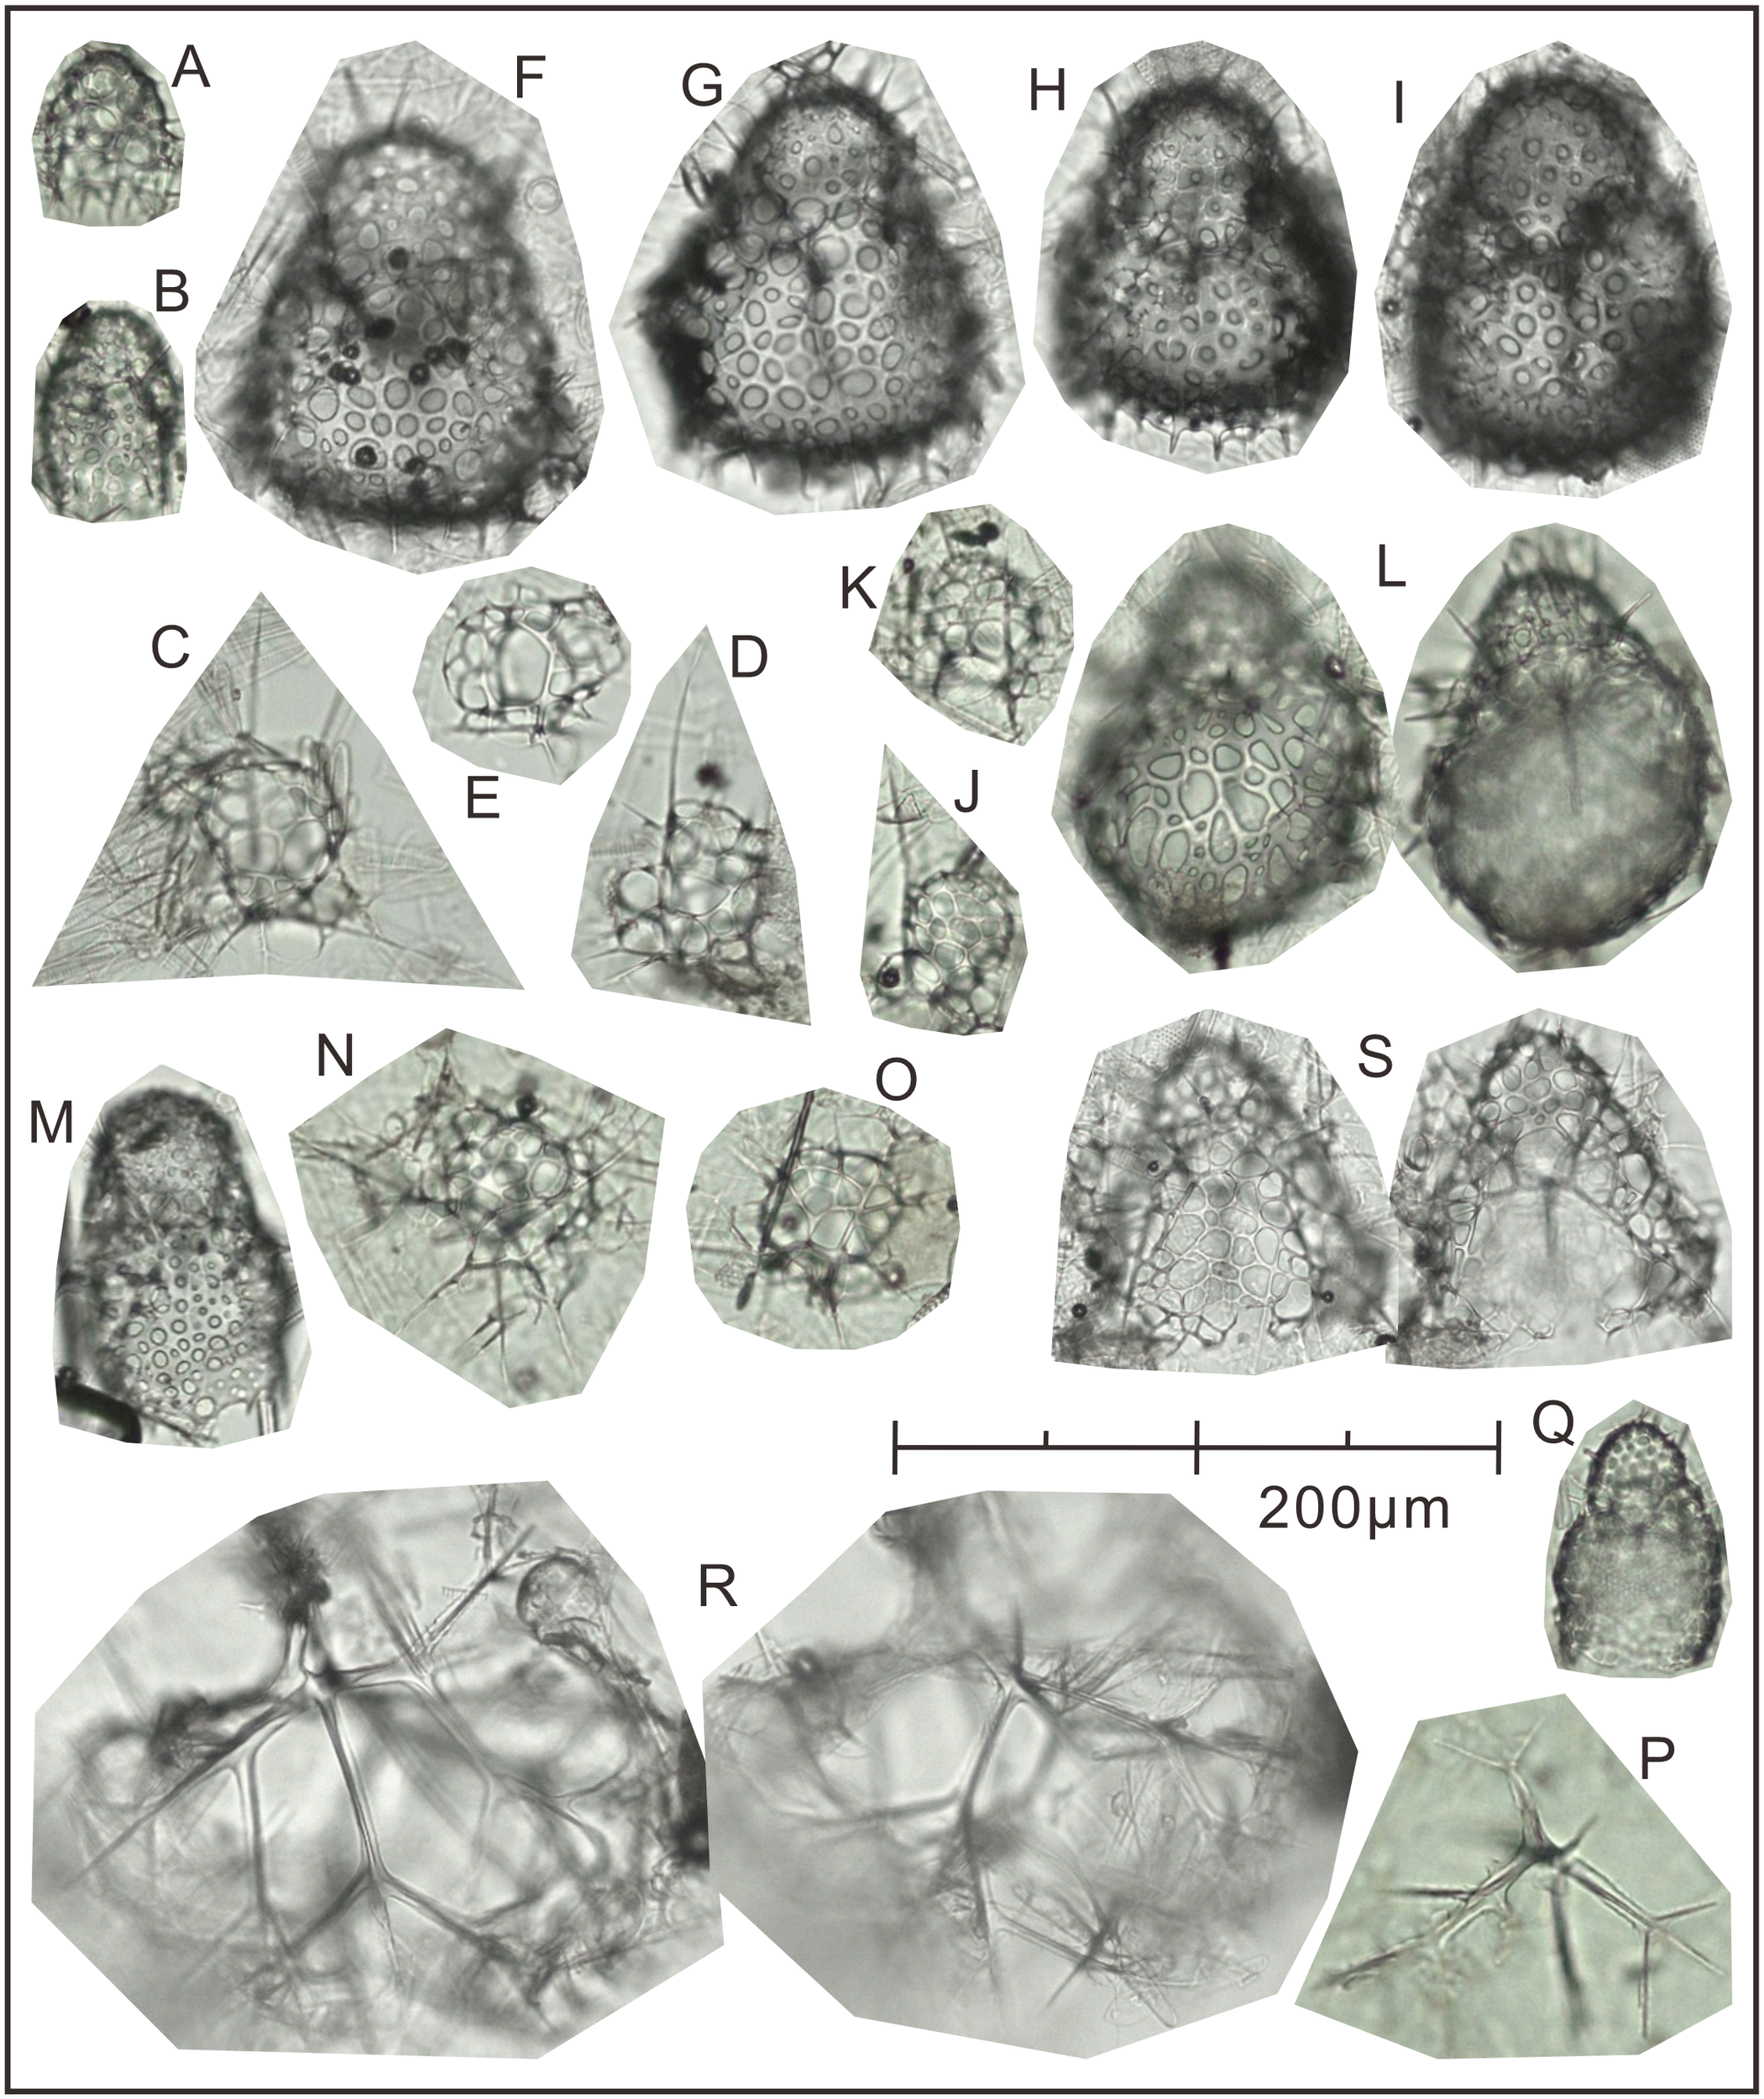
The plate of 15 dominant species identified at Station M8 in Prydz Bay polynya. (A)Antarctissa sp., Summer; (B)Antarctissa sp., Autumn; (C)Phormacantha hystrix, Summer; (D)Phormacantha hystrix, Spring; (E)Plectacantha oikiskos, Summer; (F, G)Antarctissa strelkovi, Summer; (H)Antarctissa denticulata, Summer; (I)Antarctissa denticulata, Autumn; (J)Peridium longispinum, Autumn; (K)Peridium sp., Autumn; (L)Antarctissa longa, Autumn; (M)Botryopera sp., Summer; (N)Phormacantha group, Autumn; (O)Plectacantha group, Autumn; (P)Pseudocubus sp., Autumn; (Q)Lithomelissa setosa, Spring; (R)Euscenium corynephorum, Autumn; (S)Ceratocyrtis histricosus, Summer.
4.4 Variations of the two dominant assemblages
Dominant assemblage one, i.e., factor one, was the most abundant assemblage in Prydz Bay polynya, with an annual average flux of approximately 1570 skeletons m−2 d−1. This assemblage exhibited time-series variation similar to that of TRF (Figures 3C, 4B, 6A). During RFP-1, the flux of dominant assemblage one (FDA1) reached its maximum value (10440 skeletons m−2 d−1) of the year (Figure 6A), as did the fluxes of the three small taxa of assemblage one (Figure 4B). Of these taxa, the flux of Antarctissa sp. was approximately 4180 skeletons m−2 d−1, which was also the highest flux of all radiolarian taxa, while the fluxes of P. hystrix and P. oikiskos were 3480 and 2780 skeletons m−2 d−1, respectively (Table 4; Figure 4B). From April to September, FDA1 experienced a low-flux stage similar to TRF, and then gradually increased from October and reached its second peak of the year during RFP-2 (Figure 6A). However, FDA1 and the fluxes of its three taxa during RFP-2 were markedly lower than those during RFP-1, with FDA1 of approximately 2850 skeletons m−2 d−1 and taxon fluxes of ca. 1250 skeletons m−2 d−1 (Antarctissa sp.), 880 skeletons m−2 d−1 (P. hystrix) and 720 skeletons m−2 d−1 (P. oikiskos) (Table 4; Figure 4B). From December to the following February, their fluxes exhibited a synchronous decline from peaks to low values. Although slight increases were observed during RFP-3 in mid-January 2015, they did not reach the same peak as RFP-2, and the average FDA1 was only approximately 510 skeletons m−2 d−1 (Table 4; Figure 6B).
Figure 6
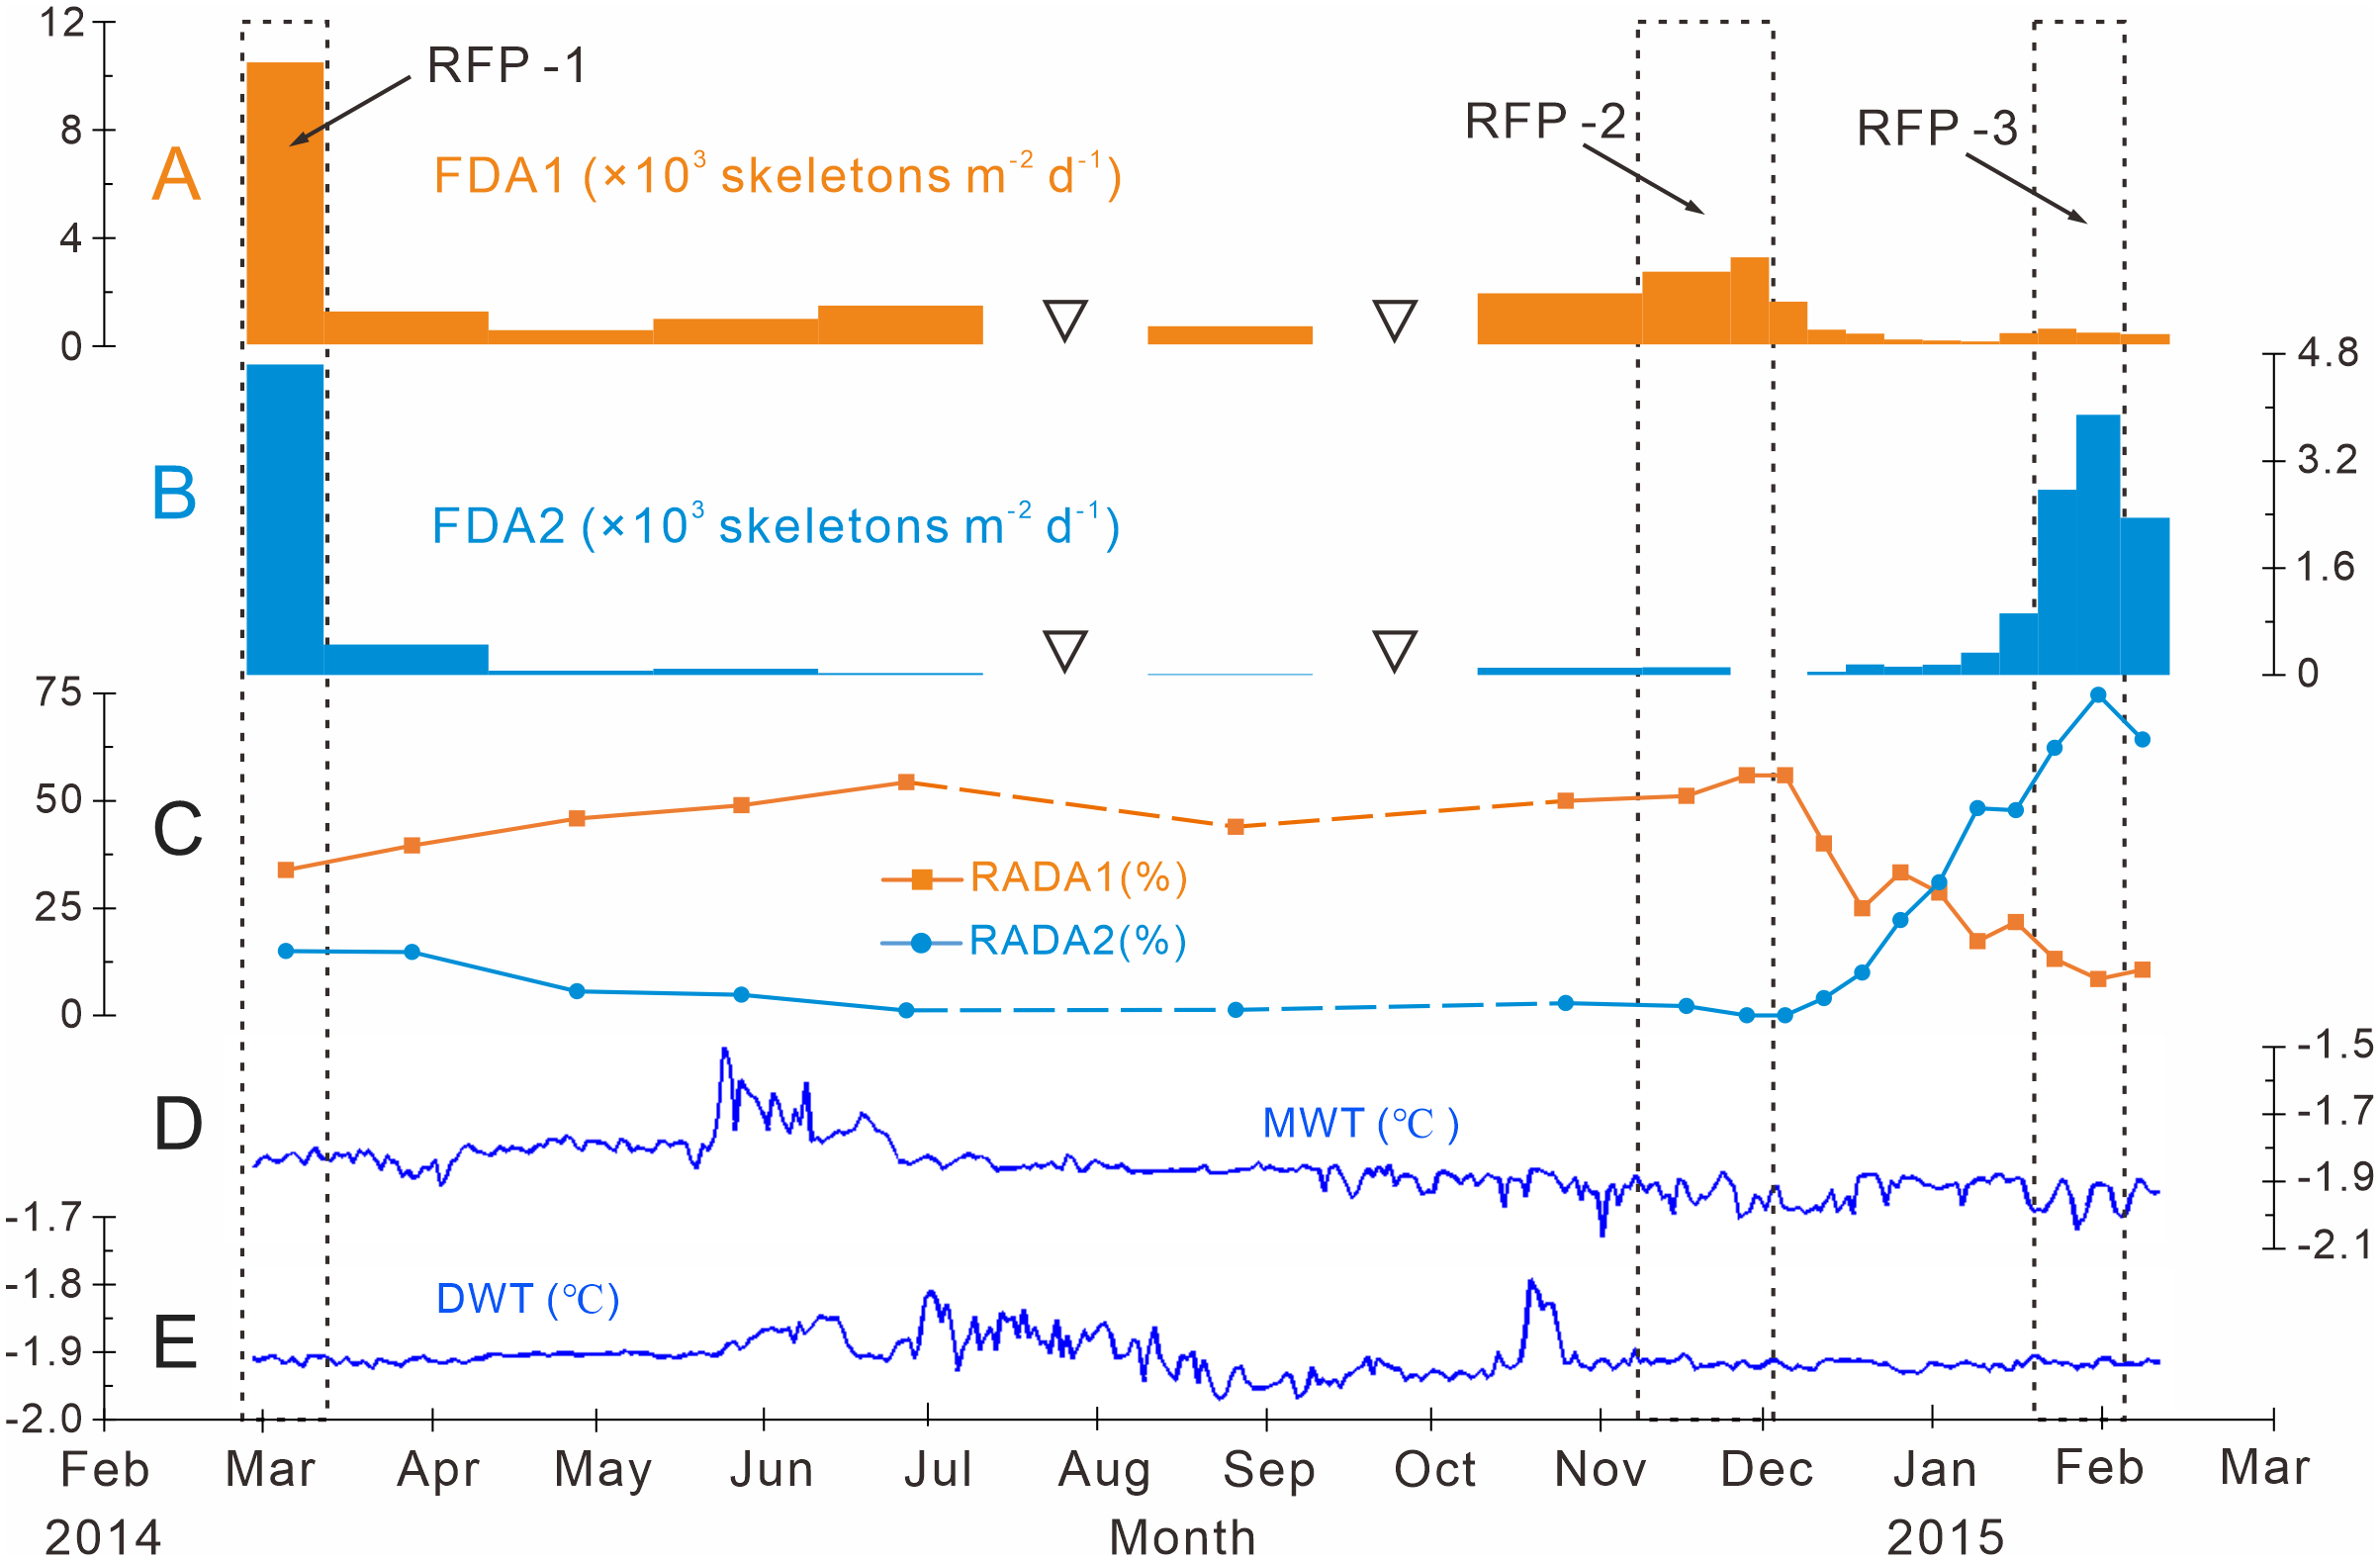
Time-series variations of the fluxes and relative abundances of the dominant assemblages with water temperatures measured at Station M8 in Prydz Bay polynya. (A) FDA1, flux of dominant assemblage one (the group of small-sized taxa). (B) FDA2, flux of dominant assemblage two. (C) RADA1, relative abundance of dominant assemblage one; RADA2, relative abundance of dominant assemblage two. (D) MWT, medium-depth water temperature recorded by a sensor moored at 282 m. (E), DWT, deep-water temperature recorded by a sensor moored at 582 m. The data sets in (D) and (E) were provided by the National Arctic and Antarctic Data Center (http://www.chinare.org.cn). The black dotted boxes indicate RFP-1–3. The width of the histogram bars indicates the sampling intervals, and the black hollow inverted triangles indicate samples that were not analyzed because the sample size was too small.
Table 4
| Sampling period | Stage | Ave. flux of dominant specie/skeletons·m-2·d-1 * | RADA1 | RADA2 | RA of A. strelkovi** | ||||
|---|---|---|---|---|---|---|---|---|---|
| Dominant assemblage one | Dominant assemblage two | ||||||||
| Antarctissa sp. | P. hystrix | P. oikiskos | A. strelkovi | A. denticulata | |||||
| 2014.02.27-03.14 | RFP-1 | 4180 | 3480 | 2780 | 3940 | 700 | 33.8% | 15.1% | 12.8% |
| 2014.11.09-12.01 | RFP-2 | 1250 | 880 | 720 | 50 | 30 | 53.5% | 1.1% | 0.7% |
| 2015.01.19-02.03 | RFP-3 | 310 | 40 | 160 | 2780 | 590 | 10.8% | 68.7% | 56.7% |
| 2014.02.27-2015.02.12 | Annual | 610 | 530 | 430 | 510 | 110 | 35.7% | 21.7% | 16.2% |
Seasonal variations of dominant species fluxes from the trap in Prydz Bay polynya.
*The average flux is calculated as in Table 1, and the data are rounded to the nearest ten digits.
**The relative abundance of A. strelkovi was estimated as described in section 3.2.2.
Dominant assemblage two, i.e., factor two, was composed of A. strelkovi and A. denticulata, showed time-series changes that were different from those of TRF (Figures 3C, 4B, 6B). The flux of dominant assemblage two (FDA2) was lower than that of FDA1 (Figures 6A, B), with an annual average value of ca. 620 skeletons m−2 d−1 (Table 4). Two peaks of FDA2 occurred during RFP-1 and RFP-3, with average values of 4640 and 3370 skeletons m−2 d−1, respectively. In the last sampling interval of the year, FDA2 reached 2350 skeletons m−2 d−1, much higher than the value of 80 skeletons m−2 d−1 during RFP-2 (Table 4; Figures 4B, 6B). In the other 13 sampling intervals, the average FDA2 was less than 150 skeletons m−2 d−1 (Figure 6B). Notably, A. strelkovi dominated this assemblage, with the flux of A. strelkovi in each sample being much higher than that of A. denticulata (Table 4; Figures 4B, C). The annual average flux of A. strelkovi was approximately 510 skeletons m−2 d−1, almost five times that of A. denticulata. The maximum flux of A. strelkovi was ca. 3940 skeletons m−2 d−1 during RFP-1, whereas the maximum for A. denticulata was only 590 skeletons m−2 d−1 in RFP-3 (Table 4; Figure 4B).
The relative abundances of the two dominant assemblages exhibited opposite trends, with obvious seasonal changes (Figure 6C). During RFP-1, the relative abundance of dominant assemblage one (RADA1) was approximately 33.8%, slightly lower than the annual average (35.7%). RADA1 maintained an upward trend and reached its maximum value (55.9%) in RFP-2, with an average value of 53.5% during that interval (Table 4). During the same period, the relative abundance of dominant assemblage two (RADA2) gradually decreased from 15.0% to 0%, averaging 1.1% during RFP-2 (Table 4; Figure 6C). Following the end of RFP-2, RADA1 decreased rapidly, reaching a minimum (8.5%) of the year by the end of RFP-3, with an average value of 10.8% during that interval. Simultaneously, RADA2 increased steeply, reaching a maximum of 74.7% in RFP-3, with an average of 68.5% (Table 4; Figure 6B).
5 Discussion
5.1 Seasonal variability of TRF and its controlling factors
5.1.1 RFP-1 during late summer 2014
In the late summer of 2014, the dramatic changes in sea ice during RFP-1 (February 27 to March 14, 2014) likely contributed to the peak in siliceous microbiota fluxes (except for TFss) at the same time as TMF (Figure 3). The daily SIC data showed that sea ice began to grow from February 17, 2014 at Station M8, with dramatic daily fluctuations and SIC was more than 80% to March 14, 2014 (Figure 3A), suggesting the rapid sea-ice gain and melting in situ during this period, rather than drifting from other area. During periods of dramatic changes in daily SIC, the coagulation of effective ballast and large amounts of organic matter (90% diatoms) had a marked effect on TMF (Han et al., 2019), consistent with the fluxes of diatoms and silicoflagellates (Figures 3D, E). The abundant organic matter was also beneficial to radiolarians, as evidenced by the notable positive correlations of the numbers of diatoms and silicoflagellates with the number of radiolarians in the trap, with correlation coefficients (R2) of 0.70 and 0.84, respectively (Table 5). However, these relationships are rapidly decoupled when the data for RFP-1 are removed (Table 5), further confirming the importance of phytoplankton to radiolarian production during RFP-1.
Table 5
| Variables | TRF | |||
|---|---|---|---|---|
| Data of RFP-1 included | Data of RFP-1 not included | |||
| R2 | p | R2 | p | |
| TFdiatom | 0.71 | 0.04 | 0.20 | < 0.01 |
| TFsilico | 0.85 | 0.05 | 0.12 | < 0.01 |
Correlations between TRF and TFdiatom, and TRF and TFsilico in the trap in Prydz Bay polynya.
Furthermore, the grazing pressure of radiolarians during RFP-1 may have been lower. Previous studies in western Antarctica suggested that at least some copepods stop feeding and become dormant in early March (Schnack-Schiel et al., 1991), and cultivation experiments in Prydz Bay have also shown that copepods mainly feed on ciliates in the shelf area near Station M8 during the late austral summer, with low consumption of the phytoplankton standing stock. Phytoplankton thus mainly supplied the predation demand of micro-zooplankton (Li et al., 2001; Yang et al., 2013). This is further supported by the lowest flux of zooplankton swimmers in the same trap in March (Yang et al., 2019), as well as 13 of 15 dominant species reaching their highest flux over the year at that time (Figure 4B). Similarly, the fluxes of two dominant assemblages both exhibited their highest values of the year at the same time (Table 4; Figures 6A, B), indicating that the radiolarian fauna had a general advantage in competition during RFP-1.
5.1.2 Low TRF during autumn to winter in 2014
The 6-month low-TRF stage in autumn and winter (late March to late September, 2014) was mainly attributed to the full sea-ice coverage in the polynya (Figures 3A, C), which reduced solar radiation and limited photosynthesis by phytoplankton below the sea ice, resulting in a shortage of food for radiolarians. Additionally, the abundance of zooplankton in the waters below the sea ice was not very low, and some zooplankton (such as krill) may have shifted their feeding strategy from herbivory during summer to omnivory during autumn and winter (Nicol et al., 2004; Yang et al., 2019), further inhibiting the production of radiolarians. This causal relationship between the low TRF and the full ice-coverage and related zooplankton activity was more prominent in autumn (mid-March to mid-May).
Following mid-May, resuspension of surface sediments caused by mCDW invasion may have been the primary cause of the increasing trend of TRF (Figures 3C, F, G, 6D, E). Previous studies have suggested that the mean current velocity at the mooring site was < 10 cm s−1 (Nunes Vaz and Lennon, 1996), making lateral advection of particulate material negligible (Yang et al., 2019). During winter, mCDW invades the shelf area near 75°E across Four Ladies Bank, and can even advance to the front of the AIS (Yabuki et al., 2006; Herraiz-Borreguero et al., 2015; Williams et al., 2016). The temperature sensor at 582 m depth on the mooring recorded two warming events in the deep water during autumn and late winter 2014 (Figure 6E), which may have been caused by mCDW invasion from the eastern Amery Basin (Herraiz-Borreguero et al., 2015). This invasion could have transported some radiolarian remains in surface sediments from Four Ladies Bank and/or the in situ seafloor into the trap. For instance, the flux and relative abundance of dominant assemblage one increased simultaneously (Figures 6A, C). This process is strongly supported by the synchronous increases of TFss and TFlitho (Figures 3F, G). Sponge spicules, the hard parts of sponges (marine sessile multicellular animals; Hooper and van Soest, 2002), can only be derived from surface sediments. Similarly, surface sediment is a main source of lithogenic debris, the other being material released into the sea from melting sea ice (Han et al., 2018).
The similar effects of resuspension and lateral transport of mCDW invasion on the radiolarian remains and lithogenic debris may be related to their close particle size. Grain size analysis showed that the surface sediments from the eastern part of Prydz Bay consist mainly of clay and fine silt (Wang et al., 2015), which is close to the three small-sized taxa of dominant assemblage one (Antarctissa sp., P. hystrix and P. oikiskos) in the trap (Figures 5A–E), generally about 50-70μm (Petrushevskaya, 1967; Nimmergut and Abelmann, 2002). Furthermore, the radiolarian results analyzed in surface sediments from Prydz Bay shelf area reveal that they also constitute a dominant assemblage (Zhang et al., in preparation). This assemblage abundance is strongly and weakly positively correlated with silt and clay content, respectively, indicating a similar distribution pattern.
Simultaneously, we observed that the mCDW invasion did not lead to a significant increase in TFdiatom and TFsilico in the trap (Figures 3D, E), despite the fact that they are abundant in surface sediments in Prydz Bay shelf. This may be attributed to the differential settling over time caused by the differences in size and mass between radiolarian and diatom. Previous studies reported that the average sedimentation rate of radiolarians in water column was < 0.1 cm s-1, which was much faster than that of diatoms and silicoflagellates (Takahashi, 1987; Liang and Ran, unpublished data). Additionally, the diatom assemblages on the shelf area tend to be smaller and less silicified (Taylor et al., 1997). This may result in the resuspended diatoms and silicoflagellates drifting in the water for a longer period of time.
It is worth noting that the temperature sensor at 282 m depth on the mooring, located above the trap (Figures 1C–E), recorded a mCDW invasion event around June 2014 (Figure 6D). The mCDW may have invaded to the shelf area through the Prydz Channel during this period (Chen et al., 2014), with a shallower invasion depth and undisturbed the surface sediments. This may be the causation of the absence of increased fluxes for radiolarian, lithogenic debris and sponge spicules around this period.
5.1.3 TRF fluctuations in spring to summer of 2014 and 2015
The rapid decoupling of TRF from TFdiatom and TFsilico during RFP-2 (November 9 to December 1, 2014) may have been related to the anomalous retreat of sea ice and resuspension of surface sediments (Figures 3A, C–G, 6E). During normal years, the melting of sea ice dumps abundant ice algae into the water, and the sinking flux of diatoms increases due to the ballast effect of lithogenic materials (Han et al., 2019), providing plentiful prey for zooplankton. However, the SIC data showed that the sea ice around Station M8 started to melt after late October 2014, and its coverage suddenly decreased from 55.1% (November 12) to 10.9% (November 13) (Figure 3A), likely due to the physical process of the sea ice “drifting” away under the effect of ocean currents or wind (Han, 2018; Han et al., 2019). This created an ice-free open water area nearly a month earlier than in previous years (Han et al., 2019), which increased the amount of solar radiation reaching the surface waters and the temperature of those waters, and enhanced the stratification of the upper ocean, elevating the photosynthetic efficiency of phytoplankton and the exploitation of nutrients (Schmidt et al., 2018). As a result, the surface primary productivity recovered quickly, as confirmed by the increase of chl-a (Figure 3A), providing abundant prey for radiolarians. Previous studies have suggested that krill and copepods, representative of the dominant zooplankton in Prydz Bay, had a low ingestion rate of phytoplankton during the early stage of sea-ice melting, because the copepods (mainly Calanoides acutus) were still in a state of dormancy under the ice, whereas the krill (mainly Euphausia crystallorophias) showed a modest preference for ciliates (Yang et al., 2013). Thus, TRF increased rapidly due to the adequate prey and lower grazing pressure during RFP-2.
In addition, a warming event lasting approximately 10 days in late October 2014 was recorded by the temperature sensor on the mooring (Figure 6E), likely related to the mCDW invasion from the eastern Amery Basin. This invasion may have caused resuspension and lateral transport of surface sediments, as occurred in the southwestern Weddell Sea (Abelmann and Gersonde, 1991), thus resulting in increased TFss, TFlitho and TRF (Figures 3C, F, G). The increased TRF was mainly contributed by the small-sized taxa such as dominant assemblage one (Figures 6A, C), which was close to the silt in the surface sediments in terms of particle size. However, resuspended diatoms and silicoflagellates may have been unable to settle into the trap in a short period due to their low settling velocity (Takahashi, 1987), as observed in the South China Sea (Liang and Ran, unpublished data).
An intriguing phenomenon during RFP-2 was that TFdiatom and TFsilico were low, and their increases were even one month later than that of TRF (Figures 3C–E), similar to the results from a trap in the southwestern Weddell Sea (Abelmann and Gersonde, 1991). This lag of TFdiatom may have been related to changes in the phytoplankton community during this period. Previous studies have suggested that there may be a phytoplankton bloom dominated by Phaeocystis and/or some naked flagellates before diatom mass production in the Southern Ocean MIZ during the early stage of sea-ice melting (e.g., Abelmann and Gersonde, 1991; Garrison et al., 2005; Dumont et al., 2009; Arrigo et al., 2014; Smith et al., 2014; van Leeuwe et al., 2018). Furthermore, there is a so-called “retention system” that is characterized by heavy copepod grazing and re-mineralization of the produced matter in the upper ocean, which decreases the downward-sinking flux (Abelmann and Gersonde, 1991; and references therein). However, more work is needed to verify whether this process is applicable to Prydz Bay. Additionally, during the anomalous retreating process of sea ice, large amounts of ice algae (including diatoms if any) sealed in the bottom of the ice were “carried” away with sea ice drift before they could be dumped into the polynya waters, resulting in the low TFdiatom, TFsilico and TMF.
Following RFP-2, another low-TRF stage lasting 7 weeks (December 1, 2014 to January 19, 2015) was observed in sharp contrast to the high TFdiatom and TFsilico (Figures 3C–E). This decoupling may have been linked to the increased grazing pressure caused by the activities of herbivorous predators (krill and copepods) in mid-summer. During this period, there was a large area of open water with high chl-a concentration in the polynya (Figures 2, 3A), and the high fluxes of phytoplankton dominated by diatoms and silicoflagellates exhibited their second peaks (Figures 3D, E). This increase in phytoplankton may have induced a rapid increase in the zooplankton biomass and daily grazing (Li and Yang, 2017), which is strongly supported by the increased abundance of zooplankton predators (krill, large copepods and small copepods) and their different types of fecal pellets in the same trap (Nicol et al., 2004; Yang et al., 2017; Yang et al., 2019). The scavenging of these predators in the water resulted in greater grazing pressure on radiolarians (Abelmann, 1992a). Additionally, the delayed settling of resuspended diatoms and silicoflagelates during RFP-2 also contributed to their subsequent high fluxes.
During RFP-3, chl-a in the surface ocean rose quickly, and TFdiatom and TFsilico were also notably higher than their values in winter and RFP-2, indicating that there could have been more prey for radiolarians (Figures 3A–E). Moreover, FDA2 and RADA2 peaked steeply, while RADA1 decreased to its lowest value, despite FDA1 being slightly higher than in the low-TRF stage. Therefore, RFP-3 may have been mainly related to the increased primary productivity and a change in the dominant radiolarian species (Figures 3A–E, 6A–C).
5.2 Ecological and environmental significance of the dominant radiolarian assemblages
5.2.1 Dominant assemblage one as a primary productivity proxy in the MIZ
The small-sized group, dominant assemblage one in the M8 trap, was composed of three taxa (Antarctissa sp., P. oikiskos and P. hystrix) (Figures 5A–E). P oikiskos and P. hystrix, which are morphologically similar, are typical bipolar species and are often treated as the P. oikiskos/P. hystrix group (Petrushevskaya, 1967; Petrushevskaya, 1971). This group is typically found in neritic coastal environments with fjord topography and steep shelves in the Southern Ocean, such as the Powell Basin and Bransfield Strait (Abelmann, 1992a; Abelmann, 1992b). In the Ross Sea, it is used to indicate a nearshore environment with high primary productivity and drastic changes in water depth and topography, and has even been used as a proxy of the MIZ with active seasonal sea-ice changes (Nishimura et al., 1997; Teng and Wang, 2019). This is consistent with reports of this group in the high latitudes of the Northern Hemisphere, where it is thought to inhabit a cold-water, highly productive neritic sea with complex terrain such as steep shelves and fjords (Jørgensen, 1905; Nimmergut and Abelmann, 2002; Abelmann and Nimmergut, 2005; Wang et al., 2006). Antarctissa sp. is rarely reported in the Southern Ocean, but is common in open water formed after sea-ice melting in the Sea of Okhotsk. This taxon is most abundant in the subsurface minimum-temperature zone (50–130 m), and is considered to be an index for the Sea of Okhotsk dichothermal layer and for the presence of pronounced summer sea-surface stratification linked to primary productivity (Nimmergut and Abelmann, 2002).
In this study, the average flux of the small-sized group was approximately 1570 skeletons m−2 d−1 (Table 4), representing 38.7% of the total annual radiolarian count (Table 3; Figures 4B, C). During RFP-1 and RFP-2, there were dramatic sea-ice changes, the flux and relative abundance of the small-sized group and its members were notably higher than the values during RFP-3 in the ice-free period (Figures 4A, B, 6A, C). Although chl-a data was missing because of rapid sea-ice fluctuations during RFP-1 (Figure 3A), TMF, TFdiatom and TFsilico all indicated that the primary productivity of the upper ocean was almost the highest of the year at that time (Figures 3A–E), which was beneficial to radiolarian fauna. After the full ice-coverage winter, sea-ice melting accelerated after October 24, 2014, resulting in the transport of fresh, cold water into the polynya and the enhanced stratification of the upper ocean. This water input was favorable for the recovery of phytoplankton primary production and for the growth of Antarctissa sp. (Nimmergut and Abelmann, 2002). During RFP-2, the SIC decreased sharply from 55.1% to 10.9% in one day, and open water then appeared in the polynya (Figure 3A). Higher sea-surface temperature and enhanced light efficiency provided the environmental basis for rapid rises in primary productivity and chl-a, which supplied rich, fresh food for Antarctissa sp., the dominant taxa feeding primarily on bacteria or relatively fresh phytoplankton debris from the high-productivity surface waters (Abelmann and Nimmergut, 2005). In the MIZ, the assemblage was composed of juveniles and small-sized taxa able to respond quickly to food availability (Swanberg and Eide, 1992; Bjørklund et al., 1998). These factors, together with the lower predation rate by zooplankton (Yang et al, 2013), the possible dominance of the existing phytoplankton community by Phaeocystis and/or naked flagellates, and the “retention system” (Abelmann and Gersonde, 1991; and references therein), created a favorable marine environment for growth of small-sized taxa. This was reflected in the second flux peak of the small-sized group and the highest value of RADA1 (55.9%) (Table 4; Figures 4B, 6A, C). Thus, this small-sized group can be used as a proxy for surface primary productivity in the MIZ in Prydz Bay.
5.2.2 Antarctissa strelkovi as a proxy for extension of cold Ice Shelf Water
Although A. strelkovi and A. denticulata (Figures 5F–I) were classified into the same assemblage by Q-factor analysis, A. strelkovi may record more representative environmental information than A. denticulata in Prydz Bay, and its seasonal variations also appear to be a stronger indication of local characteristics. The flux and average contribution rate of A. strelkovi were much higher than those of A. denticulata (Table 3; Figures 4B, C). In addition, the two species have markedly different living habits. A. strelkovi is restricted to the Antarctic Ocean and is not encountered in warm-water regions. This species is typically found in cold (< 2°C) shallow water with abundant dissolved silicate (Petrushevskaya, 1967). The results of opening/closing net samples collected from 0 to 1000 m showed that the species is restricted to the Antarctic Surface Water and has its highest loadings in the uppermost 200 m of the water (Abelmann and Gowing, 1997). In the MIZ, A. strelkovi prefers surface water shallower than 100 m, but can also migrate downward to 385 m in the shelf area (Morley and Stepien, 1985). In other words, A. strelkovi is mainly concentrated in environments with temperatures < 1.5°C and high levels of dissolved silicate (50–70 µmol L−1) (Abelmann and Gowing, 1997). Therefore, neither seawater temperature nor silicate content was the limiting factor in Prydz Bay polynya (Figure 1D). A. denticulata is also a typical dominant species in the Antarctic cold water group, and was often treated as the A. denticulata/strelkovi group in earlier studies (e.g., Abelmann, 1992a; Abelmann, 1992b; Boltovskoy, 1999; Boltovskoy et al., 2010). It is an abundant and typical species in deep-water sediments of the open ocean, with relative abundance of up to 20%–30%. However, its abundance is at most 24% in coastal areas with ice-raft deposits (Petrushevskaya, 1967) and only approximately 3%–5% in shelf areas such as Prydz Bay (Zhu et al., 2019; Zhang et al., in preparation).
Based on this information, A. strelkovi in dominant assemblage two is thought to have a greater environmental significance and highly sensitive to cold water masses in the study area. There were two peaks of the A. strelkovi flux over the year, in RFP-1 and RFP-3 (Figure 4B). The species’ relative abundance in RFP-1 (12. 8%) was much lower than that in RFP-3 (56.7%) and lower than its annual average (16.2%) (Table 4), indicating that A. strelkovi had no competitive advantage relative to other radiolarians during RFP-1. During winter, the mCDW invaded the shelf area across Four Ladies Bank and caused significant warming in the medium-depth and deep waters (Figures 6D, E), which could have caused resuspension and movement of sediment from the bank or in situ seafloor to the trap. However, this process did not change the decreasing A. strelkovi flux and relative abundance, likely due to its larger skeleton size (150-170 μm) compared to members of the small-sized group (Figures 5A–I) (Jørgensen, 1905; Petrushevskaya, 1967).
As spring and summer arrived, the surface seawater temperature and phytoplankton productivity increased due to the melting of sea ice (Figure 2B), resulting in great silicate consumption. This may have prompted A. strelkovi to migrate to the middle-deep ocean, where the temperature is lower and the silicate levels higher (Figure 7). In addition, the temperature sensor at 282 m showed that the medium-depth ocean was affected by cold water masses after mid-September 2014, particularly after mid-January 2015 (Figure 6D). In Prydz Bay, these cold waters mainly originated from the supercooled water under the ice shelf, i.e., the ISW (Figures 7A, B). The remarkable low-temperature characteristics of this water had a marked cooling effect on the waters of the shelf area. Herraiz-Borreguero et al. (2015) noted that the ISW flows into the small circulation under the AIS from the northeast and then flows out from the west. Some studies have suggested that the ISW developed in front of the AIS mainly occurs west of 73°E, while the ISW in the area east of 73°E may originate from the WIS in eastern Prydz Bay (Zheng et al., 2011; Williams et al., 2016). Notably, the flux of A. strelkovi started to rise in synchrony with cooling after September; in particular, the steep increase in the relative abundance of this species from December onward indicates sensitivity to the cooling process of the medium-depth waters (Figures 4B, 6B). More significantly and directly, the water at 282 m cooled by 0.2°C (down to as low as −2°C) during RFP-3 (January 19 to February 3 2015), which is a typical feature of ISW. At the same time, the flux and relative abundance of A. strelkovi rapidly peaked (Figures 4B, 6B), indicating that this dominant species, which prefers a cold, high-silicate environment, was notably sensitive to supercooled water from the ice shelf during periods of open water and high surface seawater temperatures in the polynya during summer. In conclusion, the high flux and high relative abundance of A. strelkovi in Prydz Bay mainly records the process of ISW invasion to the shelf area in summer.
Figure 7
Marine environmental profiles of Section 75.5°E on the shelf of Prydz Bay in late summer 2015. (A, B) Temperature and salinity profiles showing the locations of water masses. (C) Silicate profile. Major water masses: SSW, Summer Surface Water; SW, Shelf Water; ISW, Ice Shelf Water. White vertical solid lines indicate the location of Station M8, red rectangles mark the depths of the temperature sensors, and yellow inverted triangles indicate the position of the sediment trap. The data set was provided by the National Arctic and Antarctic Data Center (http://www.chinare.org.cn), and was obtained during the 31st cruise of CHINARE from February 28 to March 1, 2015.
6 Conclusions
The 1-year flux record of siliceous microplankton acquired in a time-series trap (February 2014 to February 2015, ~490 m) moored in Prydz Bay, Eastern Antarctica, highlights the strong seasonality of radiolarian, diatom, silicoflagellate and sponge spicule fluxes and radiolarian assemblages. All fluxes were low in winter and high in summer and were closely related to the particular marine environment of the study area, especially seasonal variations in sea ice and the plankton community.
Three TRF peaks (> TRFave.) were observed over the year, all in the summer season and referred as to RFP-1, RFP-2 and RFP-3. The other two notable low-TRF intervals were identified, one in winter and another in mid-summer. During RFP-1 in early March 2014 (late summer), TRF was the highest of the year, five to six times greater than those in RFP-2 (early summer 2014–2015) and RFP-3 (mid-to-late summer), coinciding with the maximum values of TFdiatom, TFsilico and TMF. This result can be attributed to the increased primary productivity and decreased grazing pressure related to the rapid fluctuation of sea ice in situ. The generally low siliceous microbiota fluxes in autumn and winter (late March to late September) were mainly constrained by the harsh environment resulting from full sea-ice coverage. The resuspension of surface sediments caused by mCDW intrusion onto the shelf played an important role in the increased radiolarian flux. Decoupling of radiolarian and siliceous phytoplankton fluxes during RFP-2 was mainly related to the abnormal sea-ice retreat in early summer of 2014–2015. The enhanced competitive advantage of the small-sized radiolarian group, the mCDW invasion and the bloom of non-diatom-dominated phytoplankton communities were also important factors. During mid-summer (December 2014 to early January 2015), radiolarians exhibited a low-flux stage lasting 7 weeks, in sharp contrast to the second flux peaks of diatoms and silicoflagellates, mainly related to the increased grazing pressure caused by the activities of herbivorous predators. RFP-3 was mainly related to the increase of surface primary productivity and a change in the dominant radiolarian assemblages.
Two dominant radiolarian assemblages were recognized by Q-factor analysis of 15 dominant radiolarian species, with markedly differences in fluxes and relative abundances. Dominant assemblage one, referred to as the small-sized group, was composed of Antarctissa sp., P. oikiskos and P. hystrix, and showed high fluxes during RFP-1 and RFP-2. Its relative abundance was greatest during RFP-2, with a preceding upward trend and a subsequent rapid decrease, suggesting that it can be used as a proxy for primary productivity in the MIZ of Prydz Bay. Dominant assemblage two was composed of A. strelkovi and A. denticulata, with A. strelkovi dominating. The flux of A. strelkovi was high during RFP-1 and RFP-3, but its relative abundance was opposite to that of the small-sized group, being lowest during RFP-1 and highest during RFP-3. This suggests that the high flux and high relative abundance of A. strelkovi may record the extension of ISW onto the shelf in Prydz Bay.
Statements
Data availability statement
The original contributions presented in the study are included in the article/Supplementary Material. Further inquiries can be directed to the corresponding authors.
Author contributions
HZ performed the analyses of sediment trap samples and wrote the first version of the manuscript, RW conceived the sample experiments, manuscript structure and revised the text, ZH performed the TMF experiments and the statistical analysis of marine environmental data, YS supported the processing and plotting of the temperature sensors data, GF performed the data processing and plotting of sea-ice concentration and chlorophyll-a, JZ and JH collected and treated the samples, JR supported the diatom identification and revised the manuscript, and JP organized the project implementation. All authors contributed to the article and approved the submitted version.
Funding
The study was financially supported by National Natural Science Foundation of China (Grant nos. 42030401, 41506223, 41976228, 42276255), Scientific Research Fund of the Second Institute of Oceanography, MNR, (Grant nos. JG2211), and National Polar Special Program “Impact and Response of Antarctic Seas to Climate Change” (Grant nos. IRASCC 01-01-02A, IRASCC 02-02).
Acknowledgments
We thank all the cruise members of cruise 30th and 31st of Chinese National Antarctic Research Expedition (CHINARE) for deployment and recovery of the mooring. We thank Chengcheng Shen and Xinfeng Dai from SIO for their valuable suggestions on the manuscript and identification of sponge spicules. Yang Guang (Institute of Oceanology, Chinese Academy of Sciences), Guijun Guo (First Institute of Oceanography, MNR) and Jiuxin Shi (Ocean University of China) are acknowledged for their analytical support and suggestions on the zooplankton data, water masses and temperature data. We also wish to thank the reviewers for their valuable comments that allowed us to improve the manuscript.
Conflict of interest
The authors declare that the research was conducted in the absence of any commercial or financial relationships that could be construed as a potential conflict of interest.
Publisher’s note
All claims expressed in this article are solely those of the authors and do not necessarily represent those of their affiliated organizations, or those of the publisher, the editors and the reviewers. Any product that may be evaluated in this article, or claim that may be made by its manufacturer, is not guaranteed or endorsed by the publisher.
Supplementary material
The Supplementary Material for this article can be found online at: https://www.frontiersin.org/articles/10.3389/fmars.2023.1135900/full#supplementary-material
References
1
AbelmannA. (1992a). Radiolarian flux in Antarctic waters (Drake passage, Powell basin, bransfield strait). Polar Biol.12, 357–372. doi: 10.1007/BF00243107
2
AbelmannA. (1992b). Radiolarian taxa from southern-ocean sediment traps (Atlantic sector). Polar Biol.12, 373–385. doi: 10.1007/bf00243108
3
AbelmannA.GersondeR. (1991). Biosiliceous particle flux in the southern ocean. Mar. Chem.35, 503–536. doi: 10.1016/S0304-4203(09)90040-8
4
AbelmannA.GowingM. M. (1997). Spatial distribution pattern of living polycystine radiolarian taxa–baseline study for paleoenvironmental reconstructions in the southern ocean (Atlantic sector). Mar. Micropaleontol.30, 3–28. doi: 10.1016/S0377-8398(96)00021-7
5
AbelmannA.NimmergutA. (2005). Radiolarians in the Sea of Okhotsk and their ecological implication for paleoenvironmental reconstructions. Deep Sea Res. Part II: Top. Stud. Oceanogr.52, 2302–2331. doi: 10.1016/j.dsr2.2005.07.009
6
ArrigoK. R. (2017). “Sea Ice as a habitat for primary producers,” in Sea Ice, Third Edition. Ed. ThomasD. N. (Chichester: John Wiley & Sons, Ltd), 352–369. doi: 10.1002/9781118778371.ch14
7
ArrigoK. R.BrownZ. W.MillsM. M. (2014). Sea Ice algal biomass and physiology in the amundsen Sea, Antarctica. Elementa: Sci. Anthropocene.2, 28. doi: 10.12952/journal.elementa.000028
8
ArrigoK. R.van DijkenG. L. (2003). Phytoplankton dynamics within 37 Antarctic coastal polynya systems. J. Geophys. Res.108 (C8), 3271. doi: 10.1029/2002JC001739
9
ArrigoK. R.van DijkenG. L.StrongA. L. (2015). Environmental controls of marine productivity hot spots around Antarctica. J. Geophys. Res.: Oceans.120, 5545–5565. doi: 10.1002/2015JC010888
10
BjørklundK. R.CorteseG.SwanbergN. R.SchraderH. J. (1998). Radiolarian faunal provinces in surface sediments of the Greenland, Iceland and Norwegian (GIN) seas. Mar. Micropaleontol.35, 105–140. doi: 10.1016/S0377-8398(98)00013-9
11
BoltovskoyD. (1999). “Radiolaria polycystina,” in South Atlantic zooplankton. Ed. BoltovskoyD. (Leiden: Backhuys Publishers), 149–212.
12
BoltovskoyD. (2017). Vertical distribution patterns of radiolaria polycystina (Protista) in the world ocean: living ranges, isothermal submersion and settling shells. J. Plankton Res.39, 330–349. doi: 10.1093/plankt/fbx003
13
BoltovskoyD.KlingS. A.TakahashiK.BjørklundK. (2010). World atlas of distribution of recent polycystina (radiolaria). Palaeontol. Electron.13, 131–142. doi: 10.1016/j.palaeo.2009.11.002
14
BoltovskoyD.OberhänsliH.WeferG. (1996). Radiolarian assemblages in the eastern tropical Atlantic: patterns in the plankton and in sediment trap samples. J. Mar. Syst.8, 31–51. doi: 10.1016/0924-7963(95)00038-0
15
Boury-EsnaultN.RutzlerK. (1997). Thesaurus of sponge morphology (Washington, D.C: Smithsonian Institution Press).
16
ChenJ. Y.HanZ. B.HuC. Y.SunW. P.ZhangH. S. (2017). Distribution and seasonal depletion of nutrients in prydz bay, Antarctica (in Chinese with English abstract). Chin. J. Polar Res.29, 327–337. doi: 10.13679/j.jdyj.2017.3.327
17
ChenH. X.LinL. N.ShiJ. X. (2014). Study on water masses in prydz bay and its adjacent sea area (in Chinese with English abstract). Acta Oceanol. Sinica.36, 1–8. doi: 10.3969/j.issn.0253-4193.2014.07.001
18
DeppelerS. L.DavidsonA. T. (2017). Southern ocean phytoplankton in a changing climate. Front. Mar. Sci.4. doi: 10.3389/fmars.2017.00040
19
DumontI.SchoemannV.LannuzelD.ChouL.TisonJ.-L.BecquevortS. (2009). Distribution and characterization of dissolved and particulate organic matter in Antarctic pack ice. Polar Biol.32, 733–750. doi: 10.1007/s00300-008-0577-y
20
GarrisonD. L.GibsonA.CoaleS. L.GowingM. M.OkolodkovY. B.FritsenC. H.et al. (2005). Sea-Ice microbial communities in the Ross Sea: autumn and summer biota. Mar. Ecol. Prog. Ser.300, 39–52. doi: 10.3354/meps300039
21
GuoG. J.ShiJ. X.GaoL. B.TamuraT.WilliamsG. D. (2019). Reduced Sea ice production due to upwelled oceanic heat flux in prydz bay, East Antarctica. Geophys. Res. Lett.46, 4782–4789. doi: 10.1029/2018gl081463
22
HammerØ.HarperD. A. T.RyanP. D. (2001). PAST: paleontological statistics software package for education and data analysis. Palaeontol. Electron.4, 9. https://palaeo-electronica.org/2001_1/past/past.pdf.
23
HanZ. B. (2018). “Biological pump” and its response to changes in sea ice in the prydz bay, East Antarctica (in Chinese with English abstract) [Doctoral dissertation] (Wuhan: China University of Geosciences).
24
HanZ. B.HuC. Y.SunW. P.ZhaoJ.PanJ. M.FanG. J.et al. (2019). Characteristics of particle fluxes in the prydz bay polynya, Eastern Antarctica. Sci. China Earth Sci.62, 657–670. doi: 10.1007/s11430-018-9285-6
25
HanZ. B.SunW. P.FanG. J.HUC. Y.PanJ. M.ZhaoJ.et al. (2018). Sinking particle fluxes during austral summer in the prydz bay polynya, Antarctica (in Chinese with English abstract). China Environ. Sci.38, 1923–1934. doi: 10.19674/j.cnki.issn1000-6923.2018.0218
26
HeW.ChengL. Q.GaoG. P. (2016). Spatial distribution and seasonal variation of ice shelf water between 2001 and 2002 at amery ice shelf, Antarctica (in Chinese with English abstract). J. Shanghai Ocean University25, 753–766. doi: 10.12024/jsou.20151201622
27
Herraiz-BorregueroL.ColemanR.AllisonI.RintoulS. R.CravenM.WilliamsG. D. (2015). Circulation of modified circumpolar deep water and basal melt beneath the amery ice shelf, East Antarctica. J. Geophys. Res.: Oceans120, 3098–3112. doi: 10.1002/2015jc010697
28
HooperJ. N. A.van SoestR. W. M. (2002). Systema Porifera: a guide to the classification of sponges (New York: Kluwer Academic/Plenum Publishers).
29
HugueninM. F.HolmesR. M.EnglandM. H. (2022). Drivers and distribution of global ocean heat uptake over the last half century. Nat. Commun.13, 4921. doi: 10.1038/s41467-022-32540-5
30
IkenoueT.TakahashiK.TanakaS. (2012). Fifteen year time-series of radiolarian fluxes and environmental conditions in the Bering Sea and the central subarctic pacific 1990–2005. Deep. Res. Part II Top. Stud. Oceanogr.61–64, 17–49. doi: 10.1016/j.dsr2/2011.12.003
31
JørgensenE. (1905). “The protist plankton and the diatoms in bottom samples. VII. radiolaria,” in Hydrographical and biological investigations in Norwegian fiords. Ed. NordgaardO. (Bergen: Bergen Museum Skrifter), 114–141. https://www.radiolaria.org/plate.php?pl_id=6.
32
LawlerK. A.CorteseG.Civel-MazensM.BostockH.CrostaX.LeventerA.et al. (2021). The southern ocean radiolarian (SO-RAD) dataset: a new compilation of modern radiolarian census data. Earth Syst. Sci. Data.13, 5441–5453. doi: 10.5194/essd-2021-148
33
LiC. L.SunS.ZhangG. T.JiP. (2001). Summer feeding activities of zooplankton in prydz bay, Antarctica. Polar Biol.24, 892–900. doi: 10.1007/s003000100292
34
LiC. L.YangG. (2017). Progress of Chinese zooplankton ecology research in prydz bay, Antarctica. Adv. Polar Sci.28, 120–128. doi: 10.13679/j.advps.2017.2.00120
35
LiuZ. L.ChenZ. Y. (2003). The distribution feature of size-fractionated chlorophyll a and primary productivity in prydz bay and its north sea area during the austral summer (in Chinese with English abstract). Chin. J. Polar Sci.14, 81–89. doi: 10.3969/j.issn.1674-9928.2003.02.001
36
LiuC. Y.WangZ. M.ChengC.WuY.XiaR. B.LiB. R.et al. (2018). On the modified circumpolar deep water upwelling over the four ladies bank in prydz bay, East Antarctica. J. Geophys. Res.: Oceans123, 7819–7838. doi: 10.1029/2018JC014026
37
LouwS. D. V.WalkerD. R.FawcettS. E. (2022). Factors influencing sea-ice algae abundance, community composition, and distribution in the marginal ice zone of the southern ocean during winter. Deep Sea Res. Part I: Oceanogr. Res. Pap.185, 103805. doi: 10.1016/j.dsr.2022.103805
38
LoweV.CorteseG.LawlerK.-A.Civel-MazensM.BostockH. C. (2022). Ecoregionalisation of the southern ocean using radiolarians. Front. Mar. Sci.9. doi: 10.3389/fmars.2022.829676
39
MathiotP.GoosseH.FichefetT.BarnierB.GalléeH. (2011). Modelling the seasonal variability of the Antarctic slope current. Ocean Sci.7, 455–470. doi: 10.5194/os-7-455-2011
40
MatulA.MohanR. (2017). Distribution of polycystine radiolarians in bottom surface sediments and its relation to summer sea temperature in the high-latitude north Atlantic. Front. Mar. Sci.4. doi: 10.3389/fmars.2017.00330
41
McCormackS.Melbourne-ThomasJ.TrebilcoR.BlanchardJ.ConstableA. (2017). “Simplification of complex ecological networks — species aggregation in Antarctic food web models,” in Proceedings of the 22nd International Congress on Modelling and Simulation, Hobart. https://mssanz.org.au/modsim2017/B3/mccormack.pdf.
42
McMinnA. (2017). Ice acidification: a review of the effects of ocean acidification on sea ice microbial communities. Biogeosciences14, 3927–3935. doi: 10.5194/bg-2017-111
43
MeredithM.SommerkornM.CassottaS.DerksenC.EkaykinA.HollowedA.et al. (2019). “Polar regions,” in IPCC special report on the ocean and cryosphere in a changing climate. Ed. PörtnerH.-O.et al (Cambridge: Cambridge University Press), 203–320. doi: 10.1017/9781009157964.005
44
MorleyJ. J.StepienJ. C. (1985). Antarctic Radiolaria in late winter/early spring weddell Sea waters. Micropaleontol.31, 365–371. doi: 10.2307/1485593
45
NicolS.VirtueP.KingR.DavenportS. R.McgaffinA. F.NicholsP. (2004). Condition of Euphausia crystallorophias off East Antarctica in winter in comparison to other seasons. Deep Sea Res. II Top. Stud. Oceanogr.51, 2215–2224. doi: 10.1016/j.dsr2.2004.07.002
46
NimmergutA.AbelmannA. (2002). Spatial and seasonal changes of radiolarian standing stocks in the Sea of Okhotsk. Deep Sea Res. I Oceanogr. Res. Pap.49, 463–493. doi: 10.1016/S0967-0637(01)00074-7
47
NishimuraA.NakasekoK.OkudaY. (1997). A new coastal water radiolarian assemblage recovered from sediment samples from the Antarctic ocean. Mar. Micropaleontol.30, 29–44. doi: 10.1016/S0377-8398(96)00019-9
48
Nunes VazR. A.LennonG. W. (1996). Physical oceanography of the prydz bay region of Antarctic waters. Deep Sea Res. I Oceanogr. Res. Pap.43, 603–641. doi: 10.1016/0967-0637(96)00028-3
49
OhshimaK. I.FukamachiY.ItoM.NakataK.SimizuD.OnoK.et al. (2022). Dominant frazil ice production in the cape darnley polynya leading to Antarctic bottom water formation. Sci. Adv.8, eadc9174. doi: 10.1126/sciadv.adc9174
50
PetrushevskayaM. G. (1967). “Radiolarians of orders spumellaria and nassellaria of the Antarctic region (from material of the soviet Antarctic expedition),” in Studies of marine fauna IV(XII): Biological reports of the soviet Antarctic expedition, (1955-1958). Eds. AndriyashevA. P.UshakovP. V. (Leningrad: Academy of Sciences of the USSR, Zoological Institute), (translated from Russian and published by Israel Program for Scientific Translations [1968]), 3, 2–186. https://www.radiolaria.org/plate.php?pl_id=31.
51
PetrushevskayaM. G. (1971). “Radiolaria in the plankton and recent sediments from the Indian ocean and Antarctic,” in The micropalaeontology of oceans. Eds. FunnellB. M.RiedelW. R. (Cambridge: Cambridge University Press), 319–329.
52
RanL. H.MaW. T.WiesnerM. G.WangY. T.ChenJ. F.ZhangL. L.et al. (2022). Sediment resuspension as a major contributor to sinking particles in the northwestern south China Sea: evidence from observations and modeling. Front. Mar. Sci.9. doi: 10.3389/fmars.2022.819340
53
RenJ.ChenJ. F.LiH. L.WiesnerM. G.BaiY. C.SicreM. A.et al. (2021). Siliceous micro- and nanoplankton fluxes over the northwind ridge and their relationship to environmental conditions in the western Arctic ocean. Deep Sea Res. Part I: Oceanogr. Res. Pap.174, 103568. doi: 10.1016/j.dsr.2021.1
54
SchmidtK.BrownT. A.BeltS. T.IrelandL. C.TaylorK. W. R.ThorpeS. E.et al. (2018). Do pelagic grazers benefit from sea ice? insights from the Antarctic sea ice proxy IPSO25. Biogeosciences15, 1987–2006. doi: 10.5194/bg-15-1987-2018
55
Schnack-SchielS.HagenW.MizdalskiE. (1991). Seasonal comparison of Caianoides acutus and Calanus propinquus (Copepoda: Calanida) in the southeastern weddell Sea, Antarctica. Mar. Eco. Prog. Ser.70, 17–27. doi: 10.3354/meps070017
56
ShiJ. X.ChengY. Y.JiaoY. T.HouJ. Q. (2011). Supercooled water in austral summer in prydz bay, Antarctica. Chin. J. Oceanol. Limnol.29, 427–437. doi: 10.1007/s00343-010-0011-5
57
SmithW. O.Jr.AinleyD. G.ArrigoK. R.DinnimanM. S. (2014). The oceanography and ecology of the Ross Sea. Annual. Rev. Mar. Sci.6, 469–487. doi: 10.1146/annurev-marine-010213-135114
58
SmithN. R.DongZ. Q.KerryK. R.WrightS. (1984). Water masses and circulation in the region of prydz bay, Antarctica. Deep Sea Res. Part A. Oceanogr. Res. Pap.31, 1121–1147. doi: 10.1016/0198-0149(84)90016-5
59
SmithN.TréguerP. (1994). “Physical and chemical oceanography in the vicinity of prydz bay, Antarctica,” in Southern ocean ecology: The BIOMASS perspective. Ed. El-SayedS. Z. (Cambridge: Cambridge University Press), 25–45.
60
SteineckP. L.CaseyR. E. (1990). “Ecology and paleobiology of foraminifera and radiolaria,” in Ecology of marine Protozoa. Ed. CapriuloG. M. (Oxford: Oxford University Press), 89–138.
61
SunW. P.HanZ. B.HuC. Y.PanJ. M. (2013). Particulate barium flux and its relationship with export production on the continental shelf of prydz bay, east Antarctica. Mar. Chem.157, 86–92. doi: 10.1016/j.marchem.2013.08.002
62
SunW. P.HanZ. B.HuC. Y.PanJ. M. (2016). Source composition and seasonal variation of particulate trace element fluxes in prydz bay, East Antarctica. Chemosphere147, 318–327. doi: 10.1016/j.chemosphere.2015.12.10
63
SunW. P.HuC. Y.HanZ. B.PanJ. M.WengH. X. (2012). Distribution of nutrients and chl a in prydz bay during the austral summer of 2011 (in Chinese with English abstract). Chin. J. Polar Res.24, 178–186. doi: 10.3724/SP.J.1084.2012.0017
64
SuzukiN.NotF. (2015). “Biology and ecology of radiolaria,” in Marine protists: Diversity and dynamics. Eds. OhtsukaS.SuzakiT.HoriguchiT.et al (Tokyo: Springer), 179–222. doi: 10.1007/978-4-431-55130-0_8
65
SwanbergN. R.EideL. K. (1992). The radiolarian fauna at the ice edge in the Greenland Sea during summe. J. Mar. Res.50, 297–320. doi: 10.1357/002224092784797674
66
SzymanskiA.GradingerR. (2016). The diversity, abundance and fate of ice algae and phytoplankton in the Bering Sea. Polar Biol.39, 309–325. doi: 10.1007/s00300-015-1783-z
67
TakahashiK. (1987). “Silicoflagellates and actiniscus: vertical fluxes at pacific and Atlantic sediment trap stations,” in Ocean biocoenosis series No.2. Ed. HonjoS. (Massachusetts: Woods Hole Oceanographic Institution), 1–35.
68
TakahashiK. (1991). “Radiolaria: flux, ecology, and taxonomy in the pacific and Atlantic,” in Ocean biocoenosis series 3. Ed. HonjoS. (Massachusetts: Woods Hole Oceanographic Institution), 1–177.
69
TakahashiK.FujitaniN.YanadaM.MaitaY. (2000). Long-term biogenic particle fluxes in the Bering Sea and the central subarctic pacific ocean 1990-1995. Deep. Res. Part II Top. Stud. Oceanogr.47, 1723–1759. doi: 10.1016/s0967-0637(00)00002-9
70
TaylorF.McMinnA.FranklinD. (1997). Distribution of diatoms in surface sediments of prydz bay, Antarctica. Mar. Micropaleontol.32, 209–229. doi: 10.1016/s0377-8398(97)00021-2
71
TengY.WangR. J. (2019). Biogenic silica and radiolarian assemblages in the surface sediments of Ross Sea, Antarctica and their implications on marine environment and ecology (in Chinese with English abstract). Acta Micropalaeontol. Sinica.36, 377–398. doi: 10.16087/j.cnki.1000-0674.2019.04.008
72
van LeeuweM.TedescoL.ArrigoK. R.AssmyP.StefelsJ.MeinersK. M.et al. (2018). Microalgal community structure and primary production in Arctic and Antarctic sea ice: A synthesis. Elementa: Sci. Anthropocen.2, 000028. doi: 10.1525/elementa.267
73
WangH. Z.ChenZ. H.WangC. J.LiuH. L.ZhaoR. J.TangZ.et al. (2015). Characteristics of grain size in surface sediments from the continental shelf, prydz bay, and implications for sedimentary environment. (in Chinese with English abstract). Chin. J. Polar Res.4, 421–428. doi: 10.13679/j.jdyj.2015.4.421
74
WangR. J.XiaoW. S.LiQ. Y.ChenR. H. (2006). Polycystine radiolarians in surface sediments from the Bering Sea green belt area and their ecological implication for paleoenvironmental reconstructions. Mar. Micropaleontol.59, 135–152. doi: 10.1016/j.marmicro.2006.02.002
75
WilliamsG.Herraiz-BorregueroL.RoquetF.TamuraT.OhshimaK. I.FukamachiY.et al. (2016). The suppression of Antarctic bottom water formation by melting ice shelves in prydz bay. Nat. Commun.7, 12577. doi: 10.1038/ncomms12577
76
WuL.WangR. J.KrijgsmanW.ChenZ. H.XiaoW. S.GeS. L.et al. (2019). Deciphering color reflectance data of a 520-kyr sediment core from the southern ocean: Method application and paleoenvironmental implications. Geochem. Geophys. Geosy.20, 2808–2826. doi: 10.1029/2019GC008212
77
XiaoW. S.EsperO.GersondeR. (2016). Last glacial - Holocene climate variability in the Atlantic sector of the southern ocean. Quat. Sci. Rev.135, 115–137. doi: 10.1016/j.quascirev.2016.01.023
78
YabukiT.SugaT.HanawaK.MatsuokaK.KiwadaH.WatanabeT. (2006). Possible source of the Antarctic bottom water in the prydz bay region. J. Oceanogr.62, 649–655. doi: 10.1007/s10872-006-0083-1
79
YangG.HanZ. B.PanJ. M.ZhouK. L.WangY. Q.LiC. L. (2019). Contribution of zooplankton faecal pellets to carbon transport of the mesopelagic layers in the polynya region of prydz bay, Antarctica. Estuar. Coast. Shelf Sci.222, 139–146. doi: 10.1016/j.ecss.2019.04.006
80
YangG.LiC. L.SunS.ZhangC. X.HeQ. (2013). Feeding of dominant zooplankton in prydz bay, Antarctica, during austral spring/summer: food availability and species responses. Polar Biol.36, 1701–1707. doi: 10.1007/s00300-013-1387-4
81
YangG.LiC. L.WangY. Q.WangY. (2017). Vertical profiles of zooplankton community structure in prydz bay, Antarctica, during the austral summer of 2012/2013. Polar Biol.40, 1101–1114. doi: 10.1007/s00300-016-2037-4
82
YoshidaK.SegerA.KennedyF.McMinnA.SuzukiK. (2020). Freezing, melting and light stress on the photophysiology of ice algae: ex situ incubation of the ice algal diatom Fragilariopsis cylindrus (Bacillariophyceae) using an ice tank. J. Phycol.56, 1323–1338. doi: 10.1111/jpy.13036
83
ZhangL. L.ChenM. H.XiangR.ZhangJ. L.LiuC. J.HuangL. M.et al. (2009). Distribution of polycystine radiolarians in the northern south China Sea in September 2005. Mar. Micropaleontol.70, 20–38. doi: 10.1016/j.marmicro.2008.10.002
84
ZhengS. J.ShiJ. ,. X. (2011). The characteristic of sea ice growth and melt in the prydz bay region, Antarctica (in Chinese with English abstract). Periodical Ocean Univ. China41, 009–016. doi: 10.16441/j.cnki.hdxb.2011.z2.002
85
ZhengS. J.ShiJ. X.JiaoY. T.GeR. F. (2011). Spatial distribution of ice shelf water in front of the amery ice shelf, Antarctica in summer. Chin. J. Ocean. Limnol.29, 1325. doi: 10.1007/s00343-011-0318-x
86
ZhuL. L.ZhangH. F.PanJ. M.HuJ.Zhu.Q. H.ZhangH. S. (2019). Radiolarian assemblages and their distribution characteristics in surface sediments of prydz bay (in Chinese with English abstract). Mar. Geol. Quat. Geol.39, 96–106. doi: 10.16562/j.cnki.0256-1492.2019010702
87
ZielinskiU. (1993). Quantitative estimation of palaeoenvironment the Antarctic surface water in the late transfer functions with diatoms [Doctoral dissertation] (Bremen: Alfred-Wegener-Institut für Polar- und Meeresforschung).
Summary
Keywords
Prydz Bay, siliceous microplankton flux, radiolarian assemblage, seasonal variation, polynya, primary productivity, Ice Shelf Water
Citation
Zhang H, Wang R, Han Z, Sun Y, Fan G, Zhao J, Hu J, Ren J and Pan J (2023) Seasonal variations of siliceous microplankton fluxes and radiolarian assemblages linked to environmental conditions in Prydz Bay polynya, Eastern Antarctica. Front. Mar. Sci. 10:1135900. doi: 10.3389/fmars.2023.1135900
Received
02 January 2023
Accepted
20 March 2023
Published
20 April 2023
Volume
10 - 2023
Edited by
Peng Lin, University of Georgia, United States
Reviewed by
Fengming Chang, Institute of Oceanology (CAS), China; Lanlan Zhang, South China Sea Institute of Oceanology (CAS), China
Updates
Copyright
© 2023 Zhang, Wang, Han, Sun, Fan, Zhao, Hu, Ren and Pan.
This is an open-access article distributed under the terms of the Creative Commons Attribution License (CC BY). The use, distribution or reproduction in other forums is permitted, provided the original author(s) and the copyright owner(s) are credited and that the original publication in this journal is cited, in accordance with accepted academic practice. No use, distribution or reproduction is permitted which does not comply with these terms.
*Correspondence: Rujian Wang, rjwang@tongji.edu.cn; Jianming Pan, jmpan@sio.org.cn
This article was submitted to Marine Biogeochemistry, a section of the journal Frontiers in Marine Science
Disclaimer
All claims expressed in this article are solely those of the authors and do not necessarily represent those of their affiliated organizations, or those of the publisher, the editors and the reviewers. Any product that may be evaluated in this article or claim that may be made by its manufacturer is not guaranteed or endorsed by the publisher.