 Juan C. Alcérreca-Huerta1
 Teresa Álvarez-Legorreta2
 Laura Carrillo3*Laura M. Flórez-Franco3
 Oscar F. Reyes-Mendoza1Joan A. Sánchez-Sánchez2
- 1Consejo Nacional de Ciencia y Tecnología-El Colegio de la Frontera Sur (CONACYT-ECOSUR), Department of Observation and Study of the Land, the Atmosphere and the Ocean, Chetumal, Mexico
- 2El Colegio de la Frontera Sur, Department of Sustainability Sciences, Chetumal, Mexico
- 3El Colegio de la Frontera Sur, Department of Observation and Study of the Land, the Atmosphere and the Ocean, Chetumal, Mexico
Coastal karst formations may remain unexplored by the global marine scientific research community. Knowledge provided by fishermen coupled with scientific research on karstic formations prompted us to explore the geomorphometric and physicochemical features of a submerged blue hole in the large tropical estuary of Chetumal Bay in the southeastern coast of the Yucatán Peninsula, Mexico. Differently from the well-known literature on cenotes in the Yucatán Peninsula, no references are made to blue holes in the region. Sampling and surveying of the blue hole were conducted in September 2021 by scuba, echosounders, CTD profilers, and the collection of water samples. This study revealed a previously unknown maximum water depth for the Taam ja’ Blue Hole, as it is now named, of 274.4 meters below sea level (mbsl), making it the second deepest known blue hole in the world. The Taam ja’ Blue Hole has a nearly circular shape at its surface, encompassing an area of ~13,690 m2. The sides of the blue hole are steep, with slopes >80° that form a large conic structure covered by biofilms, sediments, limestone, and gypsum ledges. The blue hole mouth locates at ~4.5-5.0 mbsl, at which water properties change significantly with temperature and salinity gradients of 4.9°C/m and 9.8 PSU/m, respectively. Hydrographic profiles show a stratified water column inside the blue hole consisting of a hypoxic layer (5-20 mbsl), a chemocline (50-80 mbsl), and an anoxic layer (>110 mbsl). Evaluation of anions and cations indicated that the water inside corresponds mainly to that of diluted seawater.
1 Introduction
Blue holes, submarine caves, and sinkholes are common features on coastal karst platforms around the world, including the Caribbean Sea and the Yucatán Peninsula, that they contain unique environments (Mylroie, 2008; Mylroie, 2013; van Hengstum et al., 2011; Little et al., 2021). Karstic systems are formed from the dissolution of limestone. Repeated flooding and draining of the karst lithology by sea-level oscillations during glacial and interglacial periods (van Hengstum et al., 2011; van Hengstum et al., 2019), combined with the higher salinity of coastal waters (Kambesis and Coke, 2013) enhanced the development of impressive karst formations, such as the extensive underwater cave system of ‘Sac Actun’ (Supper et al., 2009; Kambesis and Coke, 2013) or the numerous ‘cenotes’ (van Hengstum et al., 2008) along the Mexican Caribbean coast (Bauer-Gottwein et al., 2011; van Hengstum et al., 2020). Similarly, large and deep blue holes have developed worldwide, such as the Sansha Yongle Blue Hole in China (~300 m deep), the Dahab Blue Hole in Egypt (~130 m deep), and the Gozo Blue Hole in Malta (~60 m deep) (Li et al., 2018).
Blue holes in The Bahamas (Mylroie and Mylroie, 2007; Tamalavage et al., 2018; Little et al., 2021) and in the western Caribbean are also notable due to their remarkable structures, such as Dean’s Blue Hole in The Bahamas (~202 m deep) (Vimpere, 2017) or the Great Blue Hole off the coasts of Belize (~125 m deep) (Jones and Dill, 2002; Gischler et al., 2013; Schmitt et al., 2021). These karst features are relevant to marine scientific research as they represent repositories of paleoenvironmental and paleoclimate information that enhance the understanding of environmental (Husson et al., 2018) and geologic processes (van Hengstum et al., 2020), provide support for modeling the mixing zone (Bottrell et al., 1991), the connectivity of aquifers (Martin et al., 2012) and the water origin of these hydrogeologic systems (Smith et al., 2021). They offer windows into regional hydroclimate variability (Winkler et al., 2020; Wallace et al., 2021) and are galleries to observe subfossil benthic meiofauna and modern biodiversity (van Hengstum et al., 2011; Gonzalez et al., 2020; Baremore et al., 2021; Little et al., 2021).
Blue holes in the Western Caribbean have been less investigated (e.g. Gischler et al., 2013; Baremore et al., 2021; Schmitt et al., 2021), in comparison to the well-known literature on karstic structures from cenotes (inland sinkholes) in the Yucatán Peninsula (e.g. Perry et al., 2009; Bauer-Gottwein et al., 2011). However, a system of cenotes have developed near the border between Mexico and Belize with water depths in the range of 40-90 m (Perry et al., 2009; Bauer-Gottwein et al., 2011), together with submerged blue holes, reported by Carrillo et al. (2009b), with depths up to 42 m inside the shallow tropical estuary of Chetumal Bay. In September of 2021 an expedition to the location of a blue hole of unknown depth in the bay was carried out in collaboration with Jesus Artemio Poot Villa (personal communication, March 15, 2021), a local fisherman.
The information gathered revealed a maximum recorded depth of 274.4 meters below sea level (mbsl). This makes the now named Taam ja’ Blue Hole (i.e., deep water in Mayan) (TJBH) the world’s second known deepest blue hole. Submarine exploration was conducted through echo-sounding, thermohaline profiles, chemical analysis of collected water samples and scuba diving, leading to the first documentation of this geomorphologic feature. This paper aims to boost the research and to introduce to the scientific community a particularly deep blue hole in the Western Caribbean and likely the deepest known blue hole in the region.
2 Methods
2.1 Study area
Chetumal Bay is a semi-closed mesohaline tropical estuary of the Western Caribbean coast. It extends over a shared area between Mexico and Belize, with water depths of 2-5 m (Carrillo et al., 2009a) (Figure 1). It has several freshwater inlets and connections to adjacent lagoon systems and underground springs. Salinity and water temperature range between 25-32°C and 13-22 PSU, respectively (Carrillo et al., 2009b; Ruíz-Pineda et al., 2016). Microtidal conditions (<0.2 m) (Kjerfve, 1981) and restricted water exchange with the sea are present in Chetumal Bay, but a highly dynamic system develops due to wind action (Carrillo et al., 2009a; Avalos-Cueva et al., 2017).
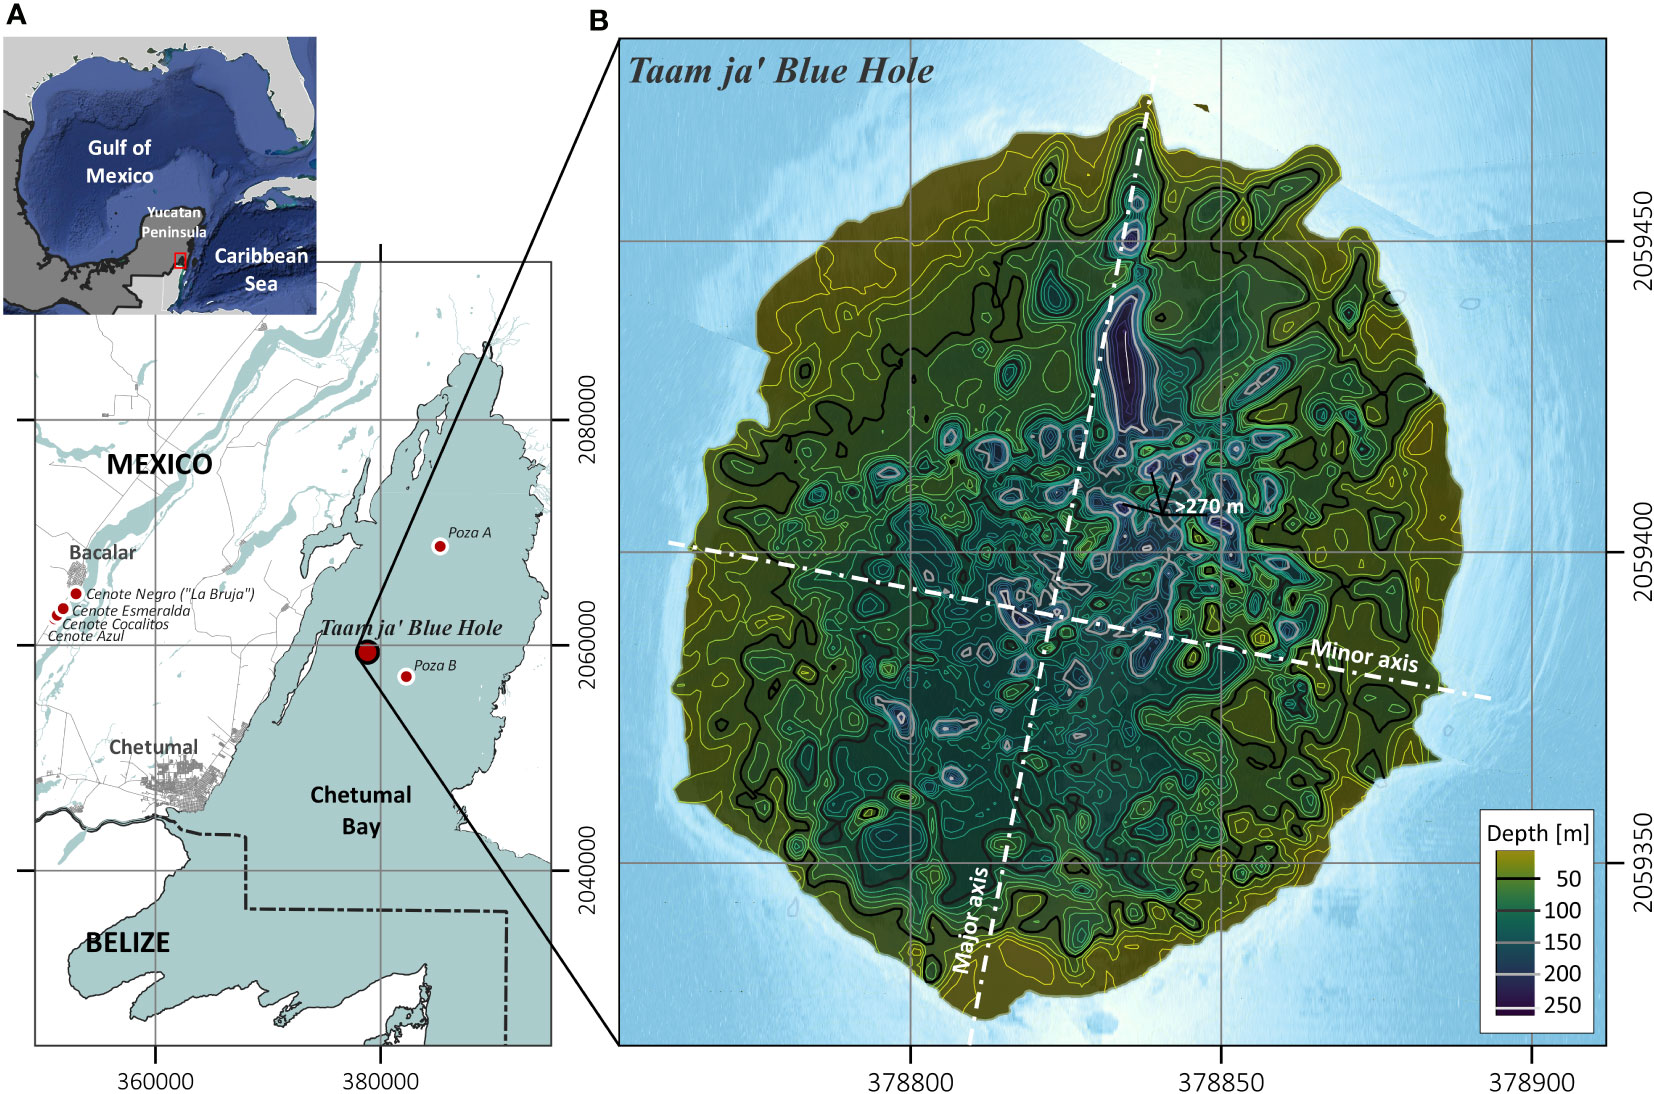
Figure 1 Location of the TJBH in the western Caribbean inside Chetumal Bay: (A) Surrounding sinkholes or cenotes along Laguna Bacalar and the reported locations for the blue holes Poza A and Poza B within Chetumal Bay (Carrillo et al., 2009b), near the Mexico and Belize border (UTM 16Q), and (B) contour levels overlapped over underwater imagery of the blue hole obtained from georeferenced raster images taken by sidescan sonar recordings.
The TJBH is located at 378823 m E, 2059390 m N (UTM 16Q) in the central portion of Chetumal Bay, where submerged coastal karstic sinkholes locally named ‘pozas’ have been reported (Carrillo et al., 2009b) (Figure 1A). Following Mylroie (2013) and Yao et al. (2020), these geomorphologic features could be recognized as blue holes since they are roughly circular and steep-walled karstic formations, open to the surface but with their depth fully developed below sea-level, and filled with water of fresh, marine and brackish chemistry.
2.2 Fieldwork and sampling techniques
Fieldwork was conducted in September 2021 by scuba, the use of echosounders, CTD profiling, and chemical water sample extraction. Diving operations were undertaken to explore the blue hole along its south−southeast side, down along the wall and up to 20 mbsl. The route followed on scuba (~200 m) was parallel to the blue hole perimeter. Images and video recording were performed using an Action Cam EV-07005 (Evorok USA).
Measurement of the TJBH bathymetry and surrounding areas was conducted by means of a Humminbird 899cxi HD SI sonar unit with an integrated GPS (Humminbird USA), a 200/83 kHz DualBeam PLUS™ sonar system and a side-scan sonar frequency of 455 kHz. This allowed for the detection of georeferenced water depths at the blue hole and for the seabed to be imaged and recorded. A fastCTD Profiler (Valeport UK) with an integrated Hyperion Valeport fluorometer (excitation: 470 nm, detection: 545 nm) was used to measure pressure, temperature, conductivity, and fluorescence along vertical profiles in the water column at a sampling frequency of 16 Hz. The profile’s location was determined by GPS with a GPSMap®78 (Garmin USA). The CTD profiles were measured up to a depth of 200 mbsl to prevent instrument damage, but no bottom was reached.
Water samples were collected in triplicate at 2, 20, 50, 80 and 110 mbsl inside the TJBH with an Alpha 1120-G42 (Wildco USA) Van Dorn sampling bottle for the analysis of chemical constituents. The depth limit for water sampling was based on the capacity of the field equipment used. Further surface water samples were collected 2 mbsl at locations 500 m to the west and east of the TJBH center. At the same depths and locations, temperature, pH, conductivity, salinity, dissolved oxygen (DO), oxidation-reduction potential (ORP), and total dissolved solids (TDS) were also measured with a multiparametric probe (Horiba U-52) previously calibrated with standard buffer solutions (Hydrion Buffer Kit), obtaining a precision of ± 0.1°C for temperature, ± 0.01 mg/L for dissolved oxygen, and ± 0.01 for pH. The samples were collected from 0.5-L polypropylene bottles previously rinsed with 15% hydrochloric acid. The samples were transported and preserved at a temperature of< 4°C until analysis (APHA, 1998).
2.3 Morphometric analyses
The orthomosaic of the TJBH resulted from merging georeferenced raster images created with SonarTRX software and side-scan sonar recordings. A digital elevation model (DEM) of 0.5 m resolution was generated through QGIS software and the interpolation of the measured georeferenced water depths. A spatial moving average low-pass filter was also applied to the interpolated DEM considering a 5 gridding node window to reduce noisy data from possible acoustic scatter of soundwaves bouncing inside the blue hole structure. Bottom profile of the TJBH was extracted from the resulting DEM with QGIS tools. Similarly, lateral projection of the blue hole was obtained with ParaView software, based on the clipping of the three-dimensional model generated with DEMto3D plugin in QGIS software. Both the surface area and volume of the TJBH were also calculated with QGIS software. The surface area (A=∑pi) was based on the summation of pixel areas (pi) from the DEM raster file within the blue hole perimeter (P), which was visually estimated from the orthomosaic generated. The total volume of the blue hole (V=∑hipi) was determined by the summation of pixel areas (0.5 x 0.5 m) multiplied by the water depth information (hi).
Morphometric indexes were described by the Gravelius coefficient (KC=0.28·P/A0.5) and the ratio (R) between the major and minor axes for assessing the circularity and elongation proportion of the blue hole (Fragoso-Servón et al., 2014). The major axis was identified by considering the longest distance between two points of the blue hole perimeter. The minor axis resulted from the longest distance perpendicular to the major axis.
2.4 Hydrochemical analyses
Parameters of chlorophyll-a (Chl-a), nitrites (NO2-), nitrates (NO3-), ammonium (NH4+), orthophosphates (PO43-) and silicates (SiO2) were determined following the methods of Strickland and Parsons (1972) and Hansen and Koroleff (1999) with a UV−visible spectrophotometer (UV-1700; Shimadzu). Total alkalinity (NMX-AA-036-SCFI-2001, 2001), total hardness as CaCO3 (NMX-AA-072-SCFI-2001, 2001) and chlorides (NMX-AA-073-SCFI-2001, 2001) were analyzed by the volumetric titration method. The turbidimetric method (NMX-AA-074-1981, 1981) was used for sulfates (SO42-), and calcium (Ca2+), magnesium (Mg2+), sodium (Na+) and potassium (K+) ions were measured by atomic absorption spectrophotometry with an AVANTA PM model GBC unit. For the analysis of chlorophyll-a, MF-Millipore cellulose membrane filters of 0.45 µm were used. For dissolved nutrients, Whatman number 42 filter paper was used, and for cations and anions, Whatman number 2 filter paper was used.
Triplicates of certified reference material for nutrients (ERA 505, 770, 693, and 698 brand WasteWatR™) were processed, obtaining recovery percentages between 95% and 105%. Based on Appelo and Postma (2005), ionic balance (IB) (eq. 1) was evaluated for the ions Ca2+, Mg2+, Na+, K+, HCO3-, SO42-, Cl- and NO3- considering a margin of error ± 5% to verify the reliability of analytical results. All reported data were within the acceptable range. A Piper diagram (Piper, 1944; Appelo and Postma, 2005) was generated from the anion and cation values to describe the physicochemical conditions in the blue hole water column.
The degree of chemical balance between water and minerals in the aquifer could be assessed through saturation indices (SI) (Yuan et al., 2017). Thus, the SI [log(Q/K)] for gypsum and anhydrite minerals were calculated using the PHREEQC software (Parkhurst, 1995), in which Q is the activity product, and K is the equilibrium constant for the reaction. An equilibrium zone of SI=0 ± 0.5 was considered due to the uncertainty in the precision of the data, where negative SI-values correspond to undersaturated water and positive SI-values to supersaturated one (Deutsch, 1997). The SO4-2/Cl- and Na+/Cl- ratios were also considered to determine the salinity and sulfate dissolution patterns with depth.
3 Results
3.1 Morphometric features
The edge of TJBH lies at a depth of ~5.0 mbsl, which is the depth of Chetumal Bay in that location (Figure 2A). Georeferenced raster images collected from sidescan sonar recordings (Figure 1B) and drone surveying (Figure 2B) identified a nearly circular shape for the mouth of the blue hole. A series of discontinuous terraces were detected at water depths<10 mbsl, near the eastern and northwestern walls of the blue hole and before developing steep and almost vertical slopes. The southwestern wall of the blue hole was the steepest, with a 10:1 slope ratio (Figure 2C).
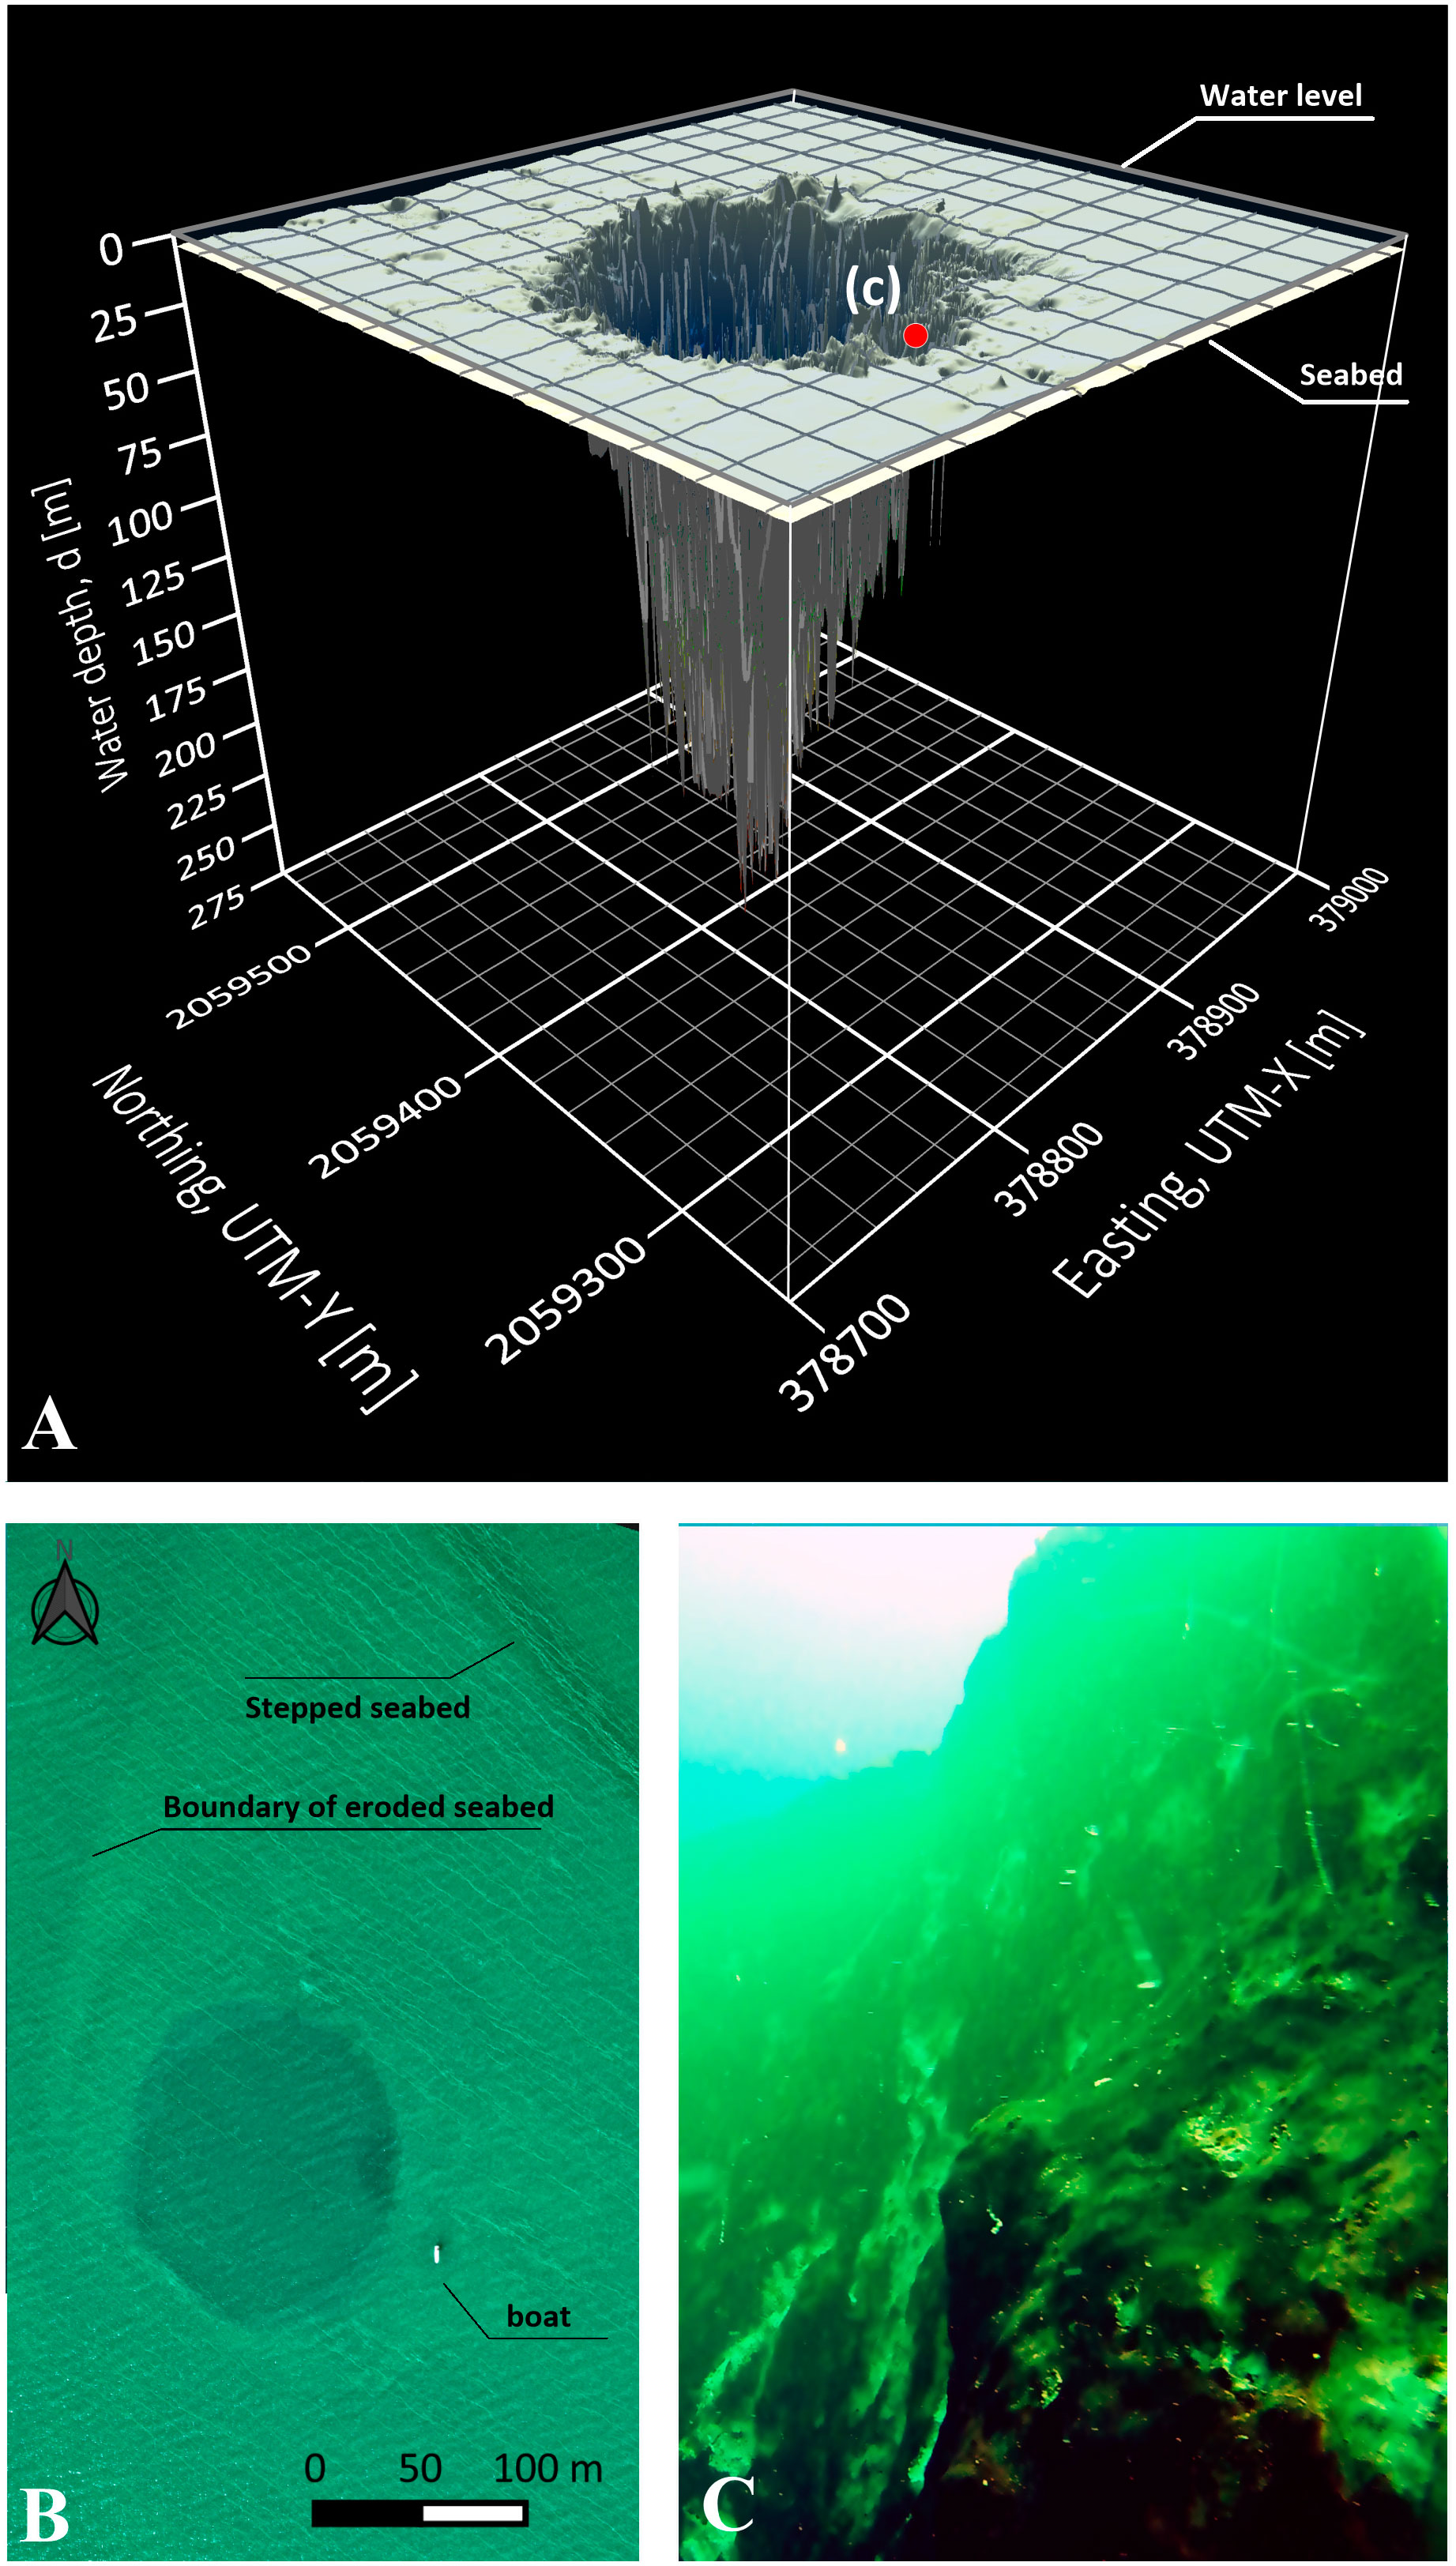
Figure 2 (A) 3D morphological map of the TJBH (UTM 16Q) starting at the seabed of Chetumal Bay (~5.0 mbsl) and descending to a depth of 274.4 m depth. (B) Aerial drone image of the blue hole, seabed features surrounding the entrance of the blue hole and size comparison with a boat (8.5 m length). (C) Subaquatic view of the mouth of the hole from 20 mbsl oriented along the southern wall (location c pointed out in panel A).
The major axis of the TJBH at ~10 mbsl was estimated to be ~151.8 m and was oriented ~10.76° clockwise from the north, similar to the main direction of geological faults in the region. The minor axis, perpendicular to the major axis, was ~124.4 m across. The surface area covered by the blue hole is ~13,690 m2 (1.4 ha) with an external perimeter of ~492.7 m. The structure of the blue hole can be described as a conic shape that is north-skewed with a volume of ~1 million m3. The maximum water depth of the blue hole exceeds 270 mbsl, with the deeper areas located mostly scattered on the northern side (Figures 1B, 2B). However, these areas are situated close to a predominantly north-south elongated area inside the blue hole that was of ~100 m2 across and where consistent depths >240 mbsl were found.
Based on the morphometric features of perimeter and area, the Gravelius coefficient (KC) or circularity index was equal to 1.179. The elongation ratio (R) between the length of the axes was 1.22. These values reflect the round-ellipsoidal surface shape of the blue hole. A scoured seabed area surrounding the blue hole was identified through aerial drone surveying (Figure 2B). This scour pattern at ~4.5 mbsl describes a ‘comet tail’ shape directed toward the NE, with its origin close to the blue hole and extending up to a bathymetric limit given by a stepped seafloor (Figure 2B).
3.2 Morphological and biological insights
Biofilms, sediments, and irregularly shaped rocky ledges of 2-3 m were identified covering the internal walls of the TJBH (Figure 3). In the water column, between 15 and 20 mbsl, a layer formed by detrital particles was noted with a general diffuse light and decreased visibility. The detritus was not uniformly distributed inside the blue hole and visibility across sections at the same water depth differed. In addition to the diffusion caused by the detrital layer, light penetration was minimal and artificial light was used.
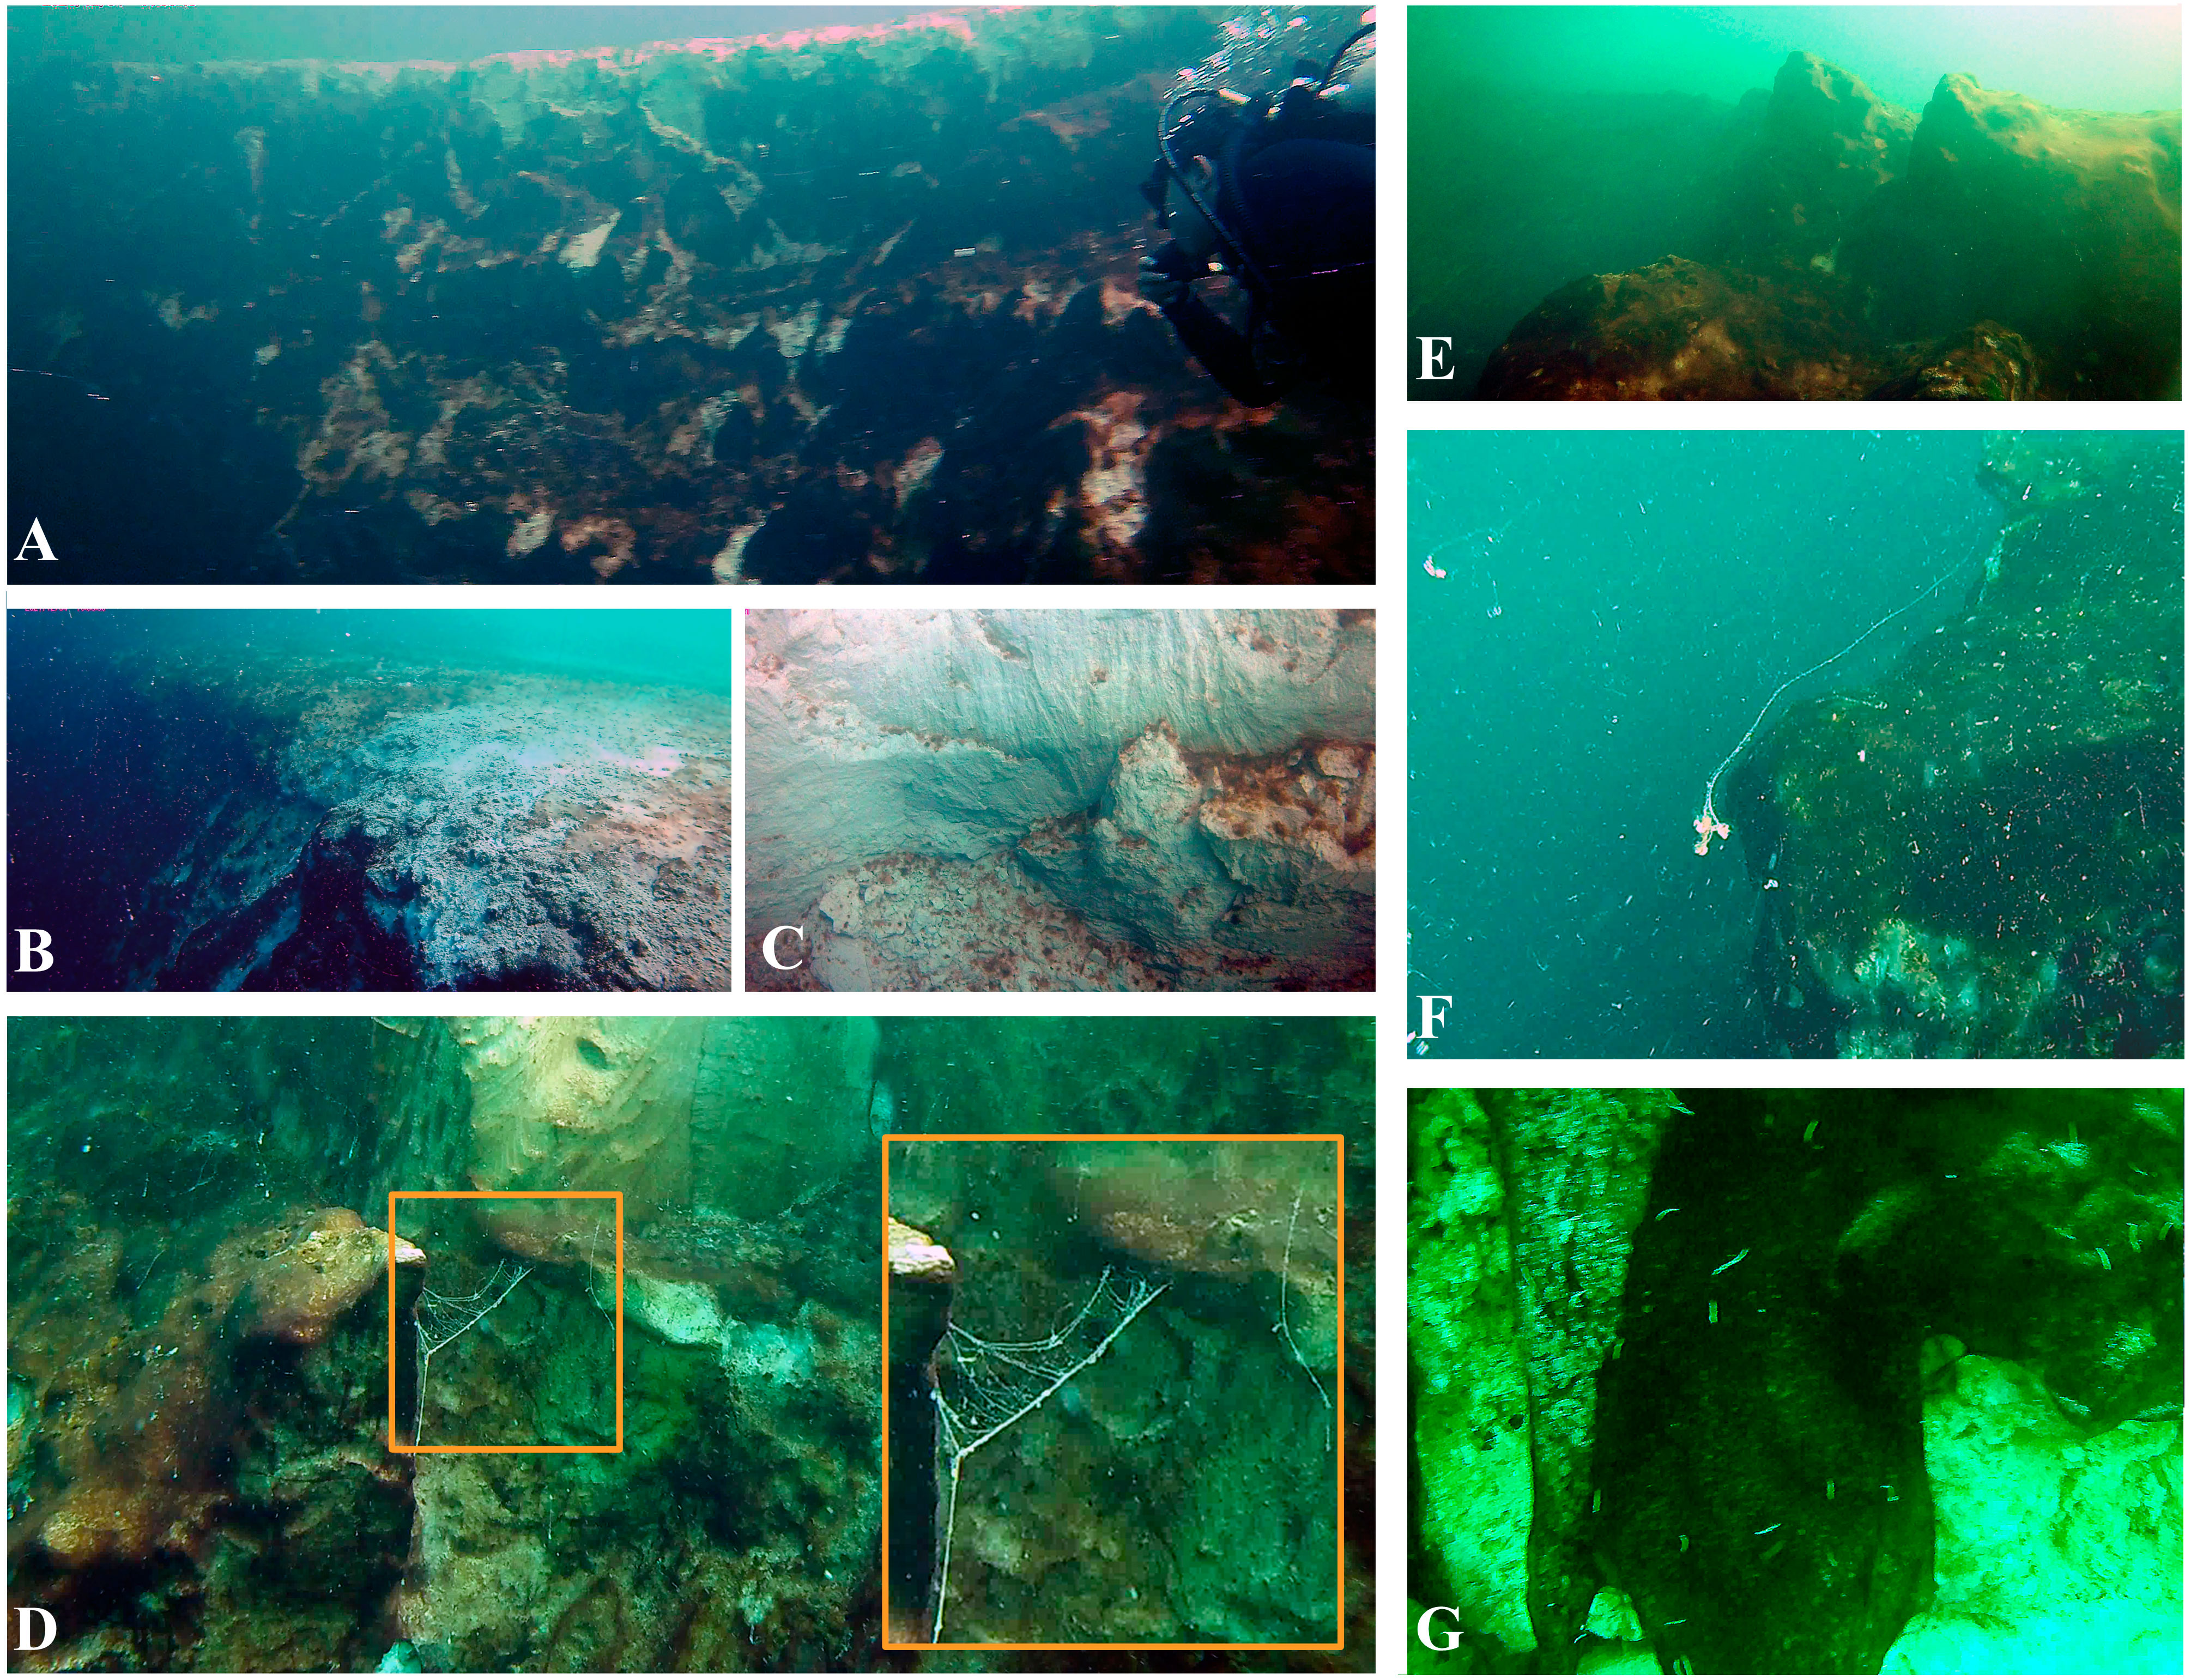
Figure 3 Insights into the morphological and biological features at the TJBH. (A, B) Entrance border at the southern wall of the blue hole surrounded by a flat limestone platform, which is part of the Chetumal Bay seabed. (C, D) Exposed white patches of limestone from rockslides are intercalated with biofilms and (E) limestone rocky ledges of 2-3 m. (D, F) Detail of mucoid filaments floating in the waters of the blue hole and attached to its walls, and (G) worms of ~0.01-0.02 m and biofilms covering exposed limestone over which dead barnacles were observed.
The walls of the blue hole were covered by a fine-grained layer (presumably gypsum) and coated by brown algal biofilms, which easily disaggregated under agitation or pressure. Over the southwestern wall, exposed white limestone areas several meters across and free of biofilms were found. These were most likely due to material slides or wall collapses as angular rock faces were noticed (Figure 3C). No caves, large fissures or crevices were identified.
Mucoid filaments of ~1 m length were observed floating inside the blue hole or attached to its walls (Figures 3D–F). These filaments had similar features to those reported in blue holes with anoxic water masses (Iwanowicz et al., 2021). Benthic fauna such as worms of ~0.01-0.02 m and exposed calcareous structures of barnacles were also detected directly lying over the algal biofilms (Figure 3G). These organisms’ structures coated areas along the first 5-10 m of the blue hole walls. Pelagic organisms were not observed during the dives.
The bottom sediment surrounding the TJBH, i.e., the Chetumal Bay seabed (Figure 3C), consists of unconsolidated sand and fine sediment normally resuspended by wind mixing processes. Turbid waters in the bay reduced visibility to between 1 to 2 m. Nevertheless, 0.5 m before reaching the seabed, a clear differentiation between the waters of Chetumal Bay and that of the blue hole was noticed, improving the visibility (5-6 m) and coinciding with the pycnocline location.
3.3 Hydrogeochemical characteristics of the water inside the blue hole
Significant variations in salinity and temperature were identified inside the blue hole through vertical CTD profiling (Figure 4). Profiles measured 500 m to the east, west, north, and south of the blue hole are also compared in Figure 4C. Salinity increased with water depth, ranging from 13.99 PSU at the water surface to 22.65 PSU at 192 mbsl. Simultaneously, the water temperature decreased from 30.0 to 24.7°C. The identification of boundaries (clines) between water layers with different physical properties was clearly revealed by the vertical profiles and their gradients (Figure 4D). The maximum temperature and salinity gradients (i.e., the thermocline and halocline) depicted a variation of 4.9°C/m and 9.8 PSU/m, respectively, and both were found at 4.5 mbsl and close to the depth of the Chetumal Bay seabed. These depths also coincided with the change in visibility observed during dive operations. These gradients described a boundary that separates the water properties inside the blue hole from those from Chetumal Bay estuary.
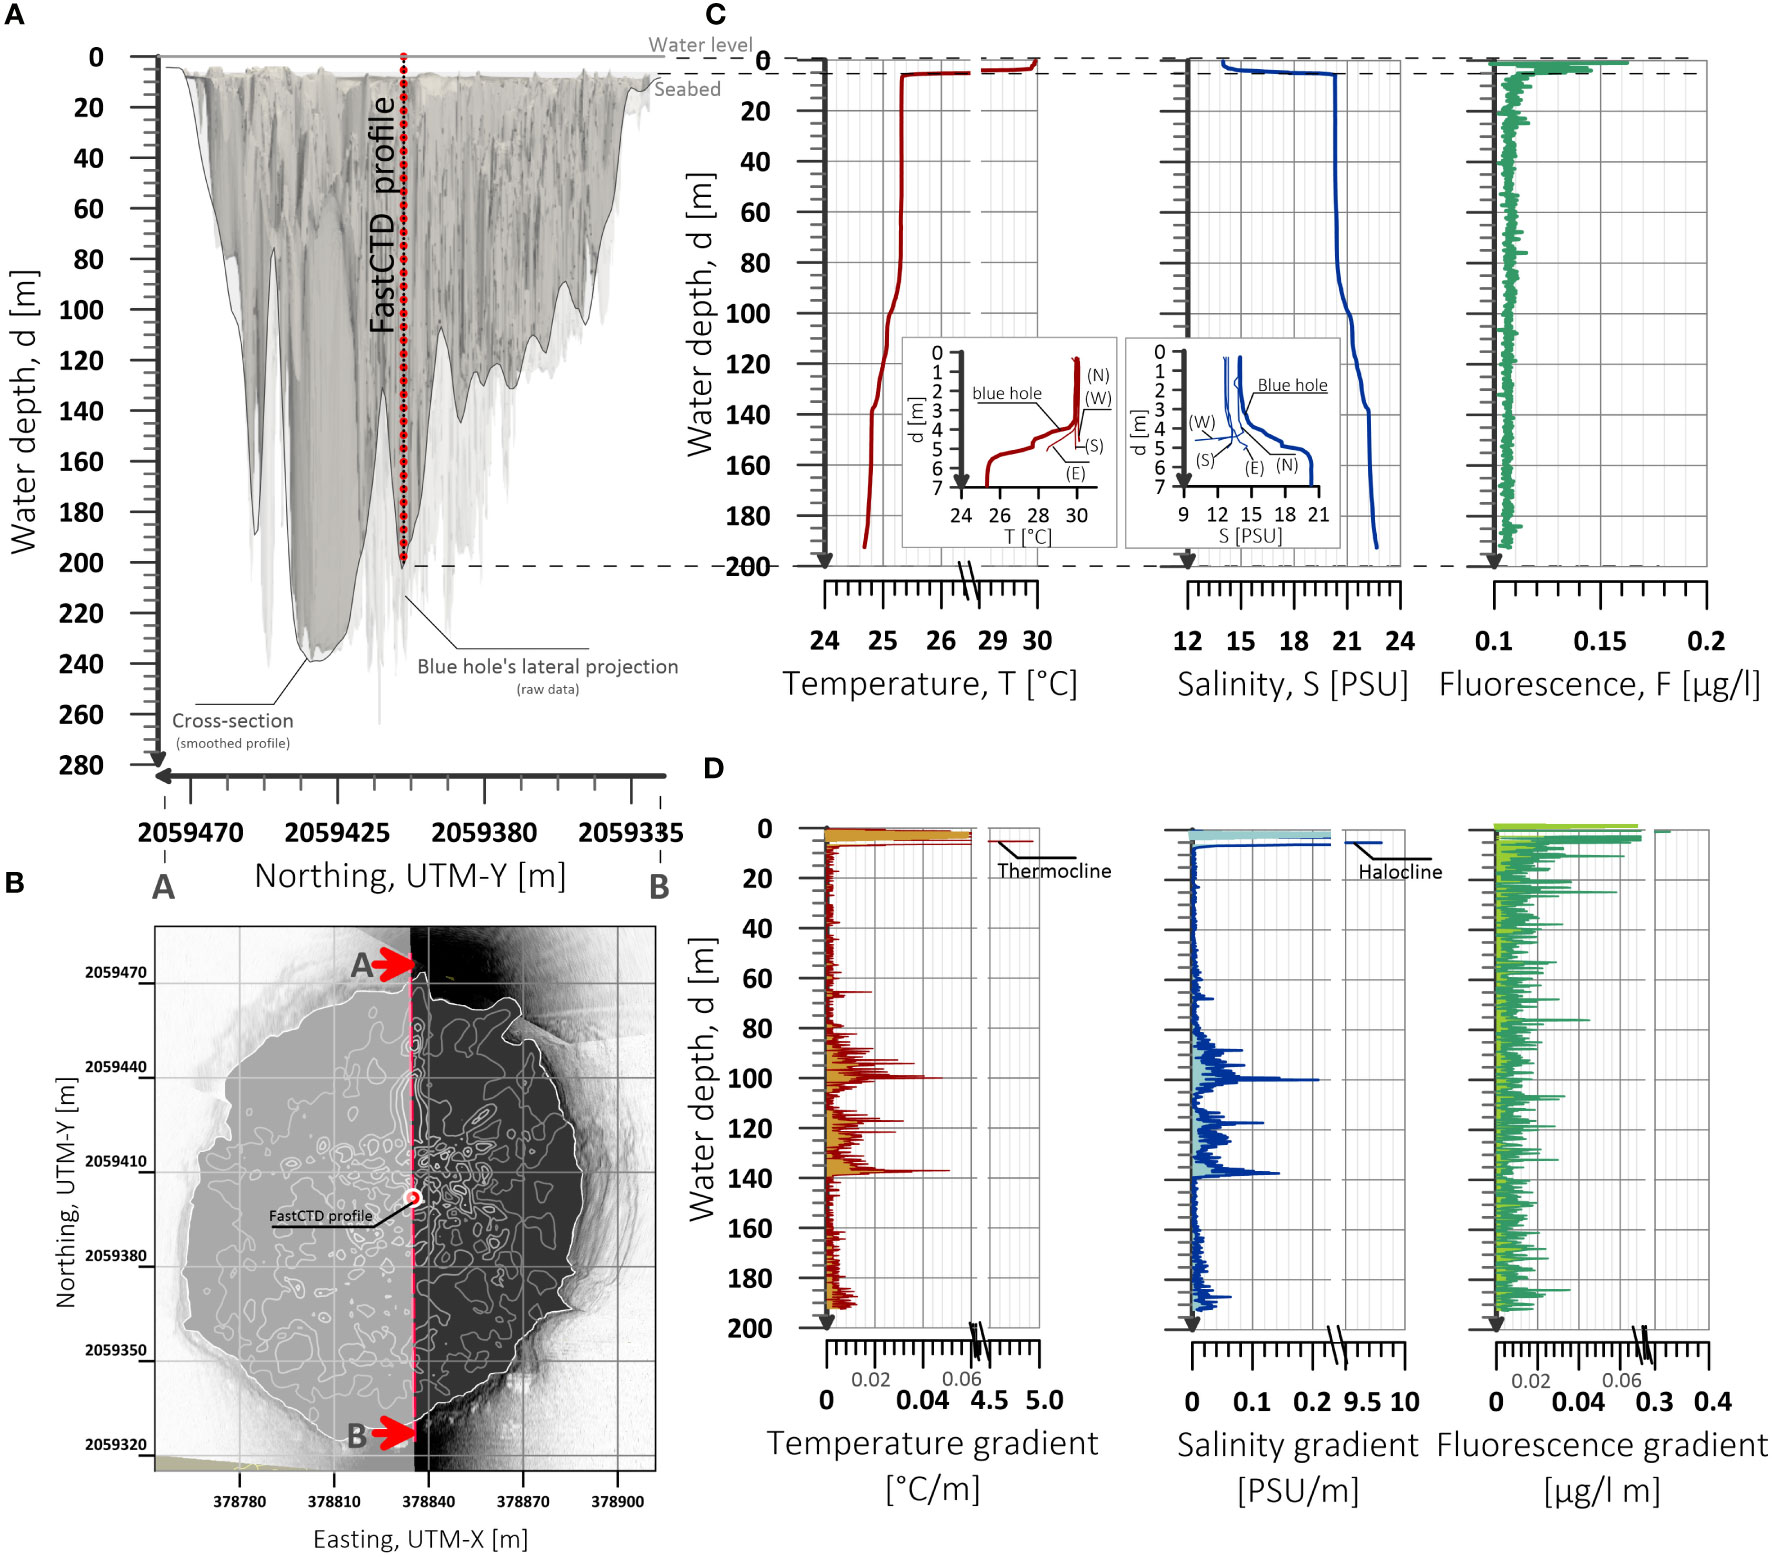
Figure 4 (A, B) Location of the measured vertical profile with a Valeport FastCTD profiler. Bottom profile over a north-south cross section at 378835.5 m E (UTM 16Q) and 3D lateral projection of the TJBH are also shown in (A) considering the filtered DEM and raw data, respectively. (C) Profiles of temperature, salinity, and fluorescence down to 192.48 mbsl and comparisons with temperature and salinity vertical profiles measured 500 m north (N), south (S), east (E) and west (W) of the blue hole center. (D) Vertical gradients of the physical properties as a function of the water depth.
Thermoclines and haloclines were also noticed at 99.3 and 136.9 mbsl, where the gradients were 0.03-0.04°C/m and 0.11-0.19 PSU/m. Despite not being of the same magnitude as those observed close to the entrance of the blue hole, these gradients are related to an almost continuous rate of change of the physical properties as a function of the depth, with the temperature decreasing while salinity increased (Figure 4C). In contrast, water layers at depths of 4.5-80.9 and 139.5-185.7 mbsl had average gradients of<0.003°C/m and<0.005 PSU/m, reflecting homogeneous conditions with almost no changes in temperature and salinity. These gradients are below the accuracy error provided by the CTD instrument (i.e. ± 0.01°C and ±0.014 PSU).
Surrounding the TJBH, vertical temperature profiles depicted similar features with depth (Figure 4C). The mean temperature was 29.8°C ± 0.53, including measurements at the blue hole center. However, changes in the temperature profile below 3.7 mbsl are similar to the profile collected east of the blue hole, depicting a continuous temperature decrease greater than 1.5°C. In terms of salinity, the northern profile had similar values to those at the blue hole center, with 13.83 PSU ± 0.16. The western, southern and eastern profiles recorded salinity values of 12.6-13.25 PSU. However, changes in the eastern profile below 3.7 mbsl, where the salinity increases (> 1.2 PSU), are analogous to those at the blue hole center (Figure 4C). Therefore, the physical properties of temperature and salinity in the northeastern surrounding area seem to be more strongly influenced by the blue hole conditions and possibly related to the orientation of the scour pattern shown in Figure 2B.
Fluorescence measurements, herein considered as a proxy for fluorescent organic matter inside the water column, reached their maximum in the surface layer at 1.0 m with 0.163 µg/L. These values decreased continuously with depth (Figure 4C), with values >0.12 µg/L observed in the upper 5 m of the water column above the limit provided by the thermocline and halocline. Below that depth, fluorescence showed homogeneous conditions down to the bottom of the measured profile (Figure 4D).
The vertical distribution and concentration of additional hydrogeochemical parameters at water depths of 2, 20, 50, 80, and 110 m are described in Figure 5A and Table 1. Total dissolved solids (TDS) increased from 15.77 g/L at the surface to 20.30 g/L at 110 m. In contrast, the concentration of dissolved oxygen (DO) was 7.22 mg/L at the surface. The DO concentration inside the blue hole rapidly decreased with depth, reaching 3.54 mg/L at 20 m depth and 1.93 mg/L at 110 m depth. The same vertical distribution was observed with pH, where the highest value of 8.13 occurred in surface water, decreasing with depth to 6.94 within the anoxic layer at 110 m. In addition, oxidation-reduction potential (ORP), which describes the redox state of the water, was positive in the surface water above the blue hole mouth (216.4 mV) and negative inside the blue hole, with values from -49 mV at 20 m depth to -137 mV at 110 m depth.
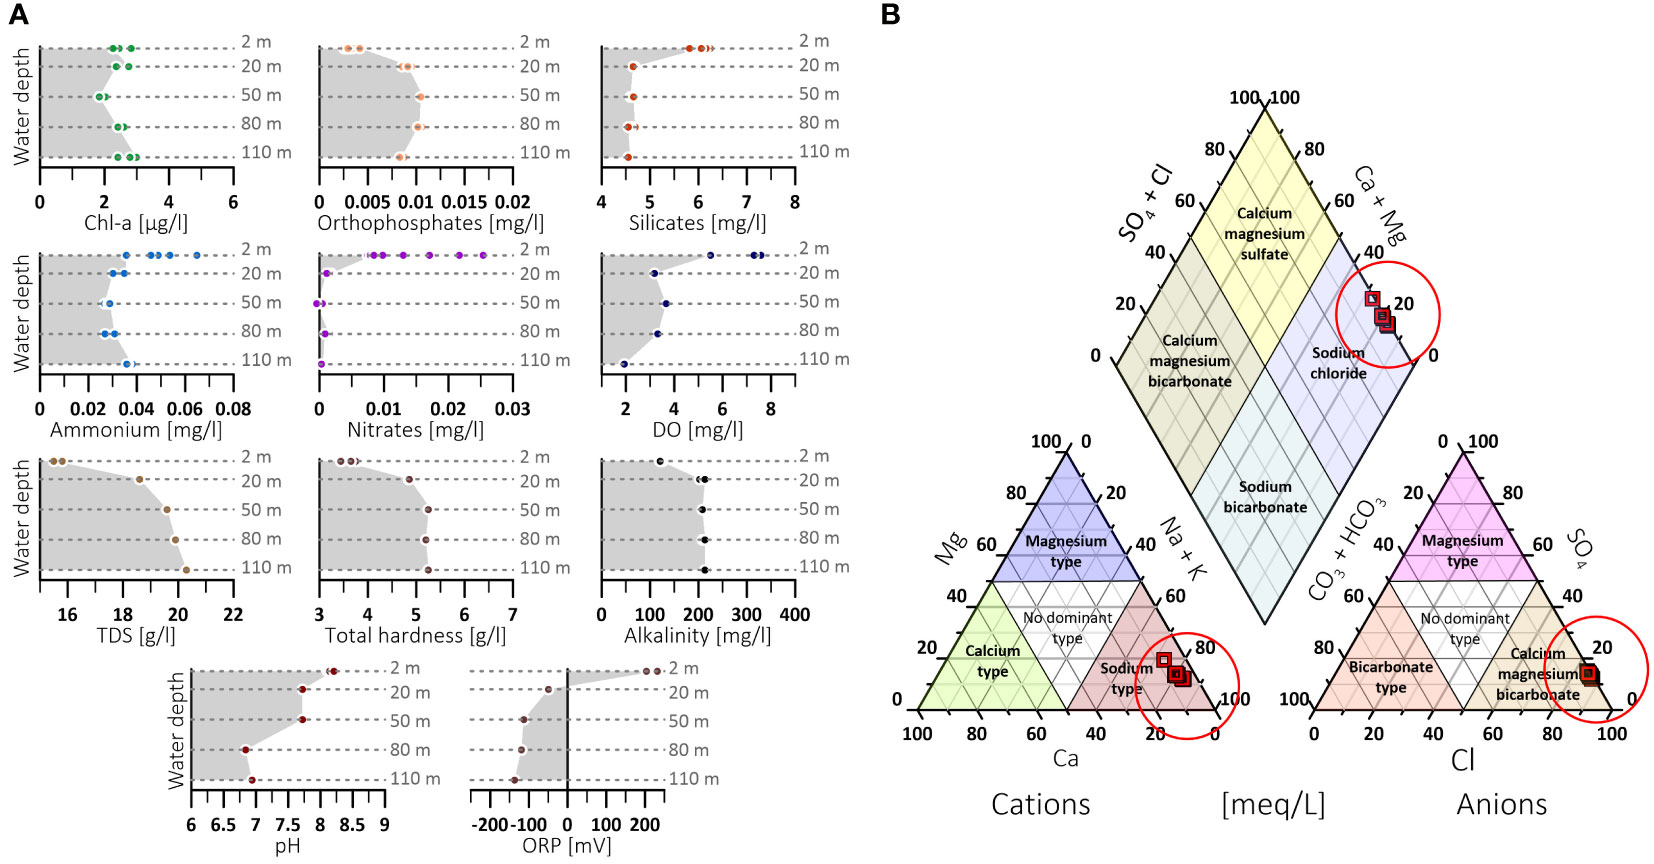
Figure 5 Hydrochemical data from water samples. (A) Concentrations of chlorophyll-a (Chl-a), orthophosphates, silicates, ammonium, nitrates, dissolved oxygen, total dissolved solids (TDS), total hardness, and alkalinity at different water depths (2, 20, 50, 80, and 110 m). (B) Piper diagram for classifying the ionic composition of collected water samples into hydrochemical facies and the dominant presence of anions and cations (see also Table 1).
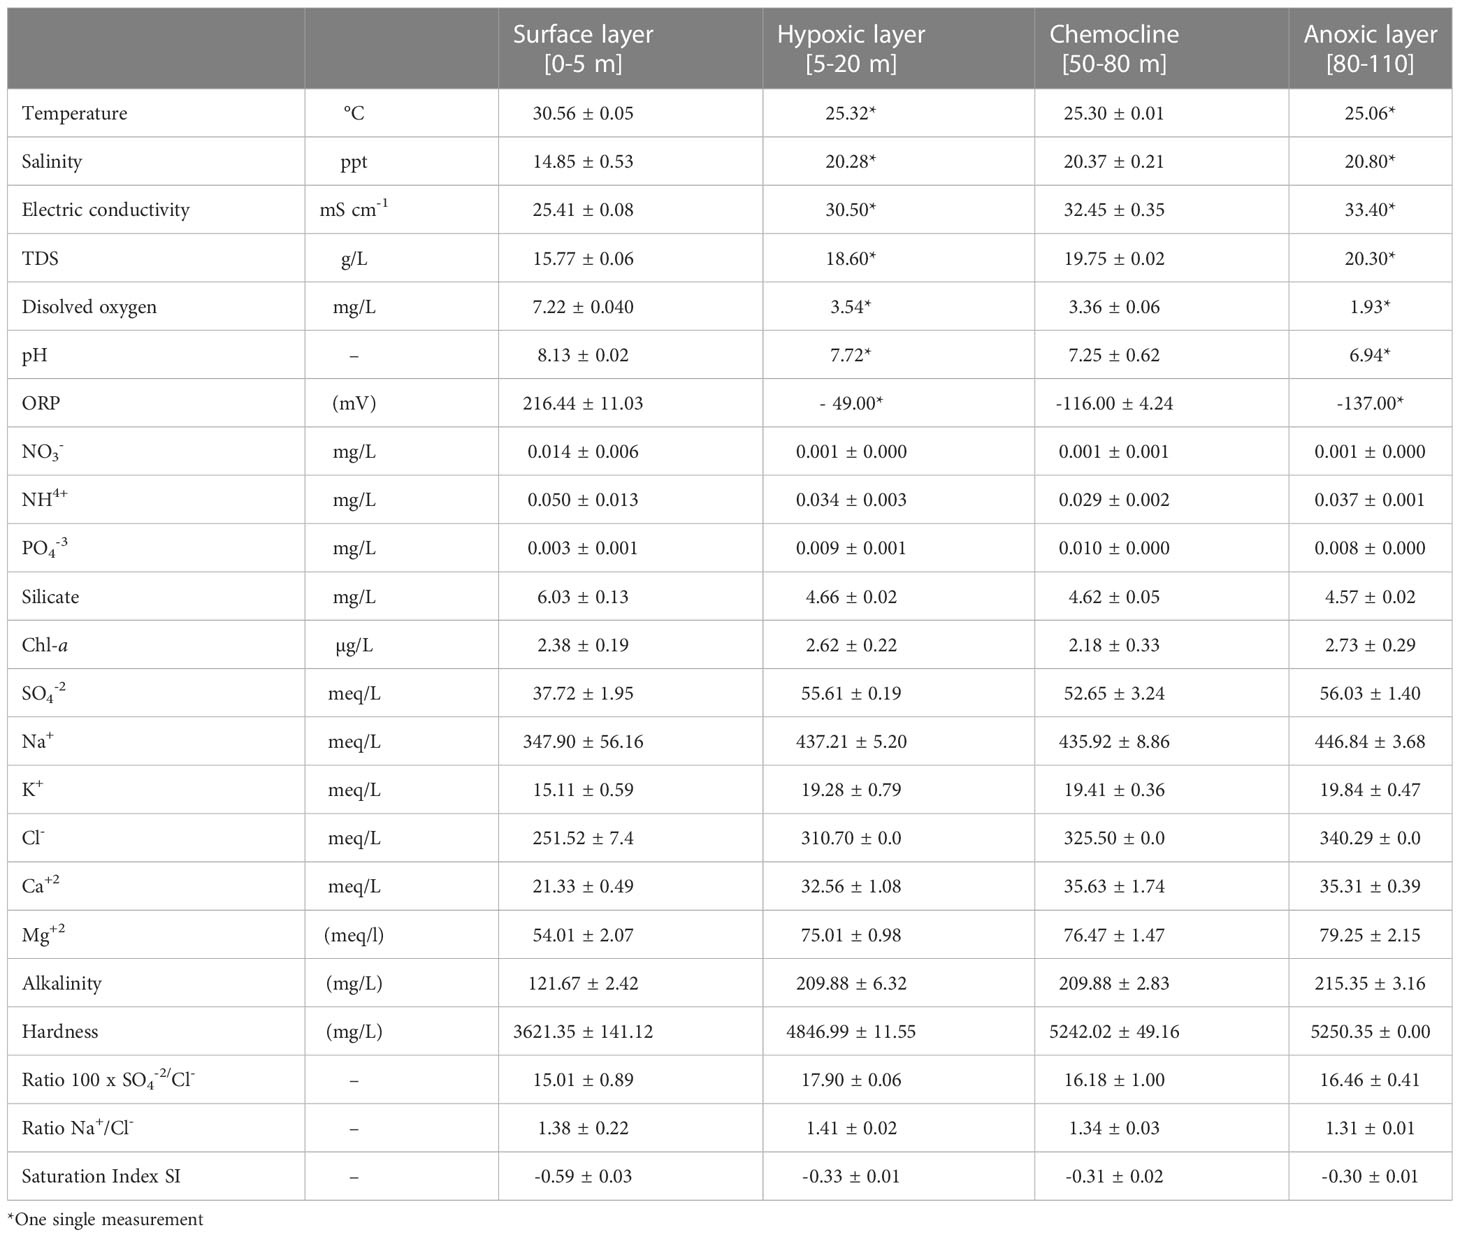
Table 1 Physicochemical parameters of water at the different layers of the TJBH.
Regarding nutrients, the highest concentrations of nitrates NO3- (0.014 mg/L) and ammonium NH4+ (0.050 mg/L) were recorded in the surface water above the blue hole, while almost no nitrite NO2- was detected. Inside the TJBH, NH4+ was the dominant form of dissolved inorganic nitrogen (>97%), where the highest value of 0.037 mg/L was recorded at 110 m depth. NO3- presented a concentration of 0.001 mg/L throughout the water column, and NO2- was undetectable. In contrast, the concentration of orthophosphate, PO43- was low in the surface water at 0.003 mg/L but increased with depth within the blue hole up to 0.010 mg/L at 80 m depth and then decreased further to 0.008 mg/L at 110 m depth. The opposite occurred with silicates, SiO3-2, where the highest concentration of 6.03 mg/L was recorded in the surface water, and then it decreased with depth to 4.57 mg/L at 110 m (Table 1). Chlorophyll-a presented a multimodal behavior, with a high concentration at 20 m depth (2.62 µg/L ± 0.22), which decreased at 50 m (1.90 µg/L ± 0.11) and reached its maximum value at 110 m depth (2.73 µg/L ± 0.29).
All anions and cations evaluated presented lower concentrations in the surface water but increased inside the blue hole with respect to depth, and the same was observed with alkalinity and hardness (Figure 5A, Table 1). The Piper diagram (Figure 5B) categorizes these parameters and indicates that the water inside the blue hole corresponds to the sodium-chlorinated type, characterized by the primary influence of seawater, with SO42- and Mg+2 enrichment corresponding to depth.
Cluster analysis of the evaluated physicochemical variables revealed three layers of stratification within the TJBH (Figure 6A, Table 1). The first corresponds to a hypoxic layer that lies primarily between water depths of 5 m and 20 m, in which an increase in salinity and a decrease in temperature, dissolved oxygen and pH were recorded. The second is the chemocline that occurs between depths of 50 m and 80 m and constitutes a mixing zone due to the difference between the upper hypoxic layer and the lower nearly anoxic layer, as particularly seen in the measured concentrations of ammonium, orthophosphates, sulfates, sodium, and chlorophyll-a. The third is an anoxic layer that extends to a depth of 110 m, characterized by low concentrations of DO and phosphates and an increase in ammonium and chlorophyll-a (Table 1).
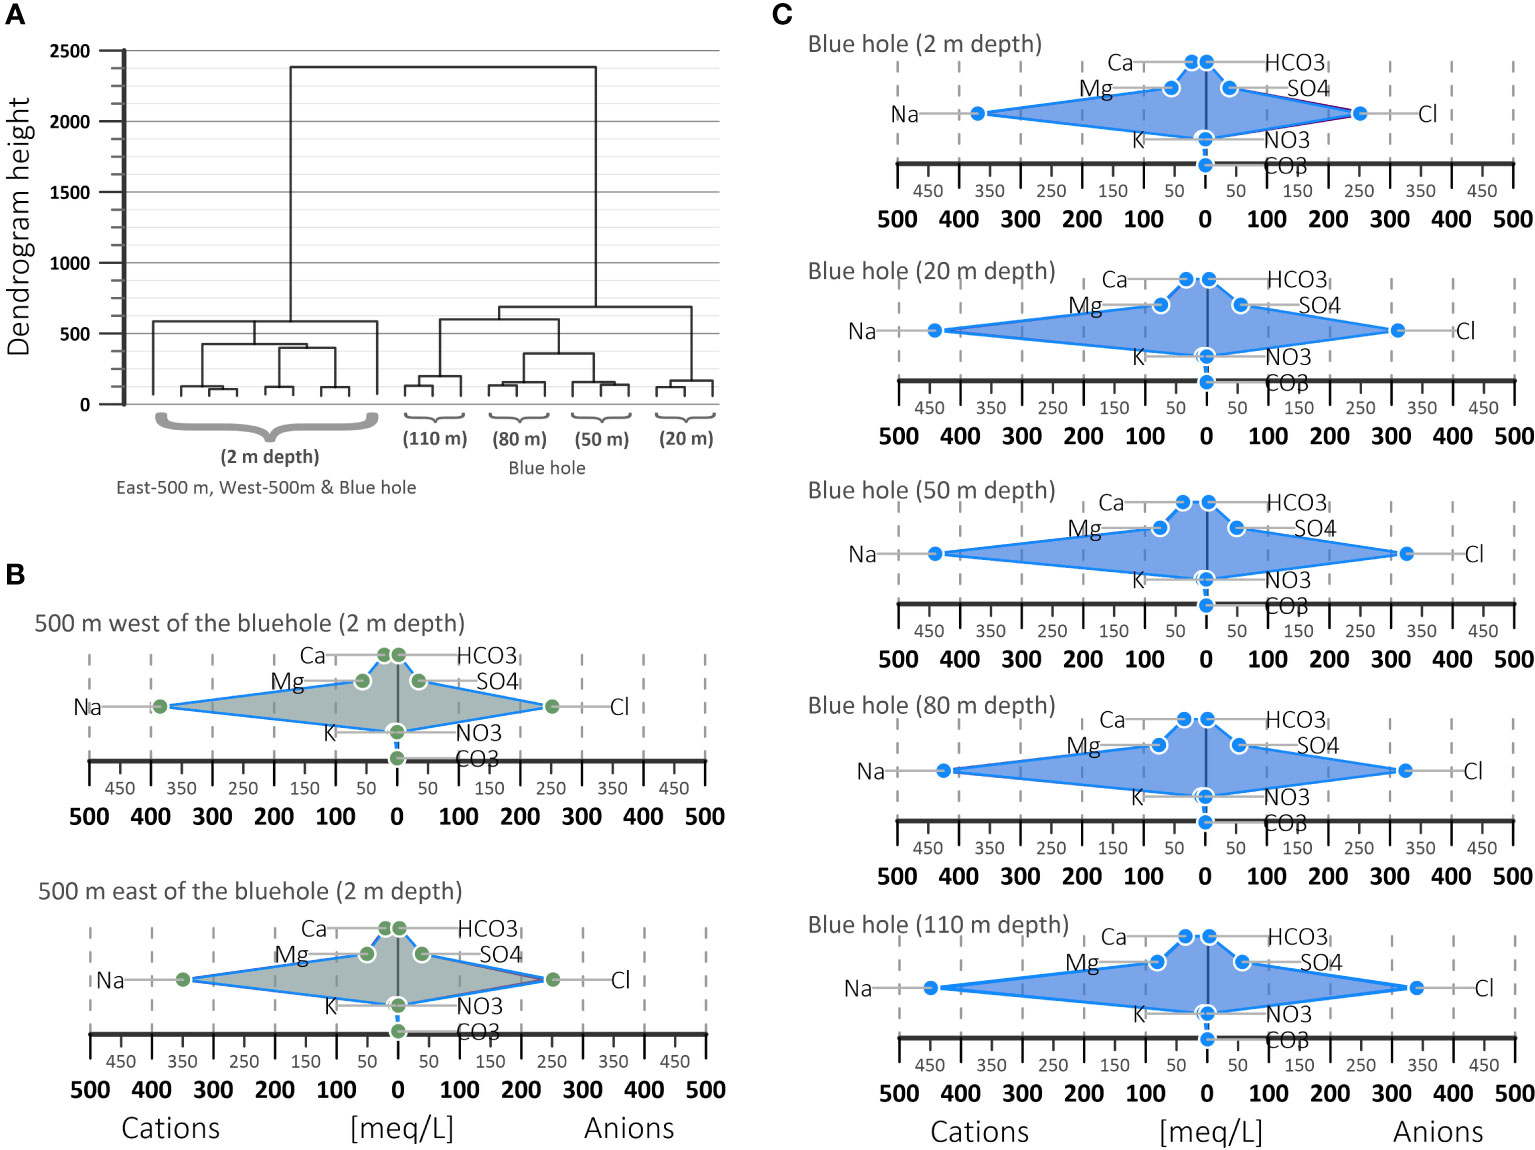
Figure 6 Dendrogram describing the clustering of water samples with similar chemical features as a function of the water depth (A). Stiff diagrams of ionic composition at 500 m west and east from the center (B), as well as 2, 20, 50, 80 and 110 m depth at the center of the blue hole (C).
In addition to the stratification given by the physicochemical variables, stiff diagrams of ionic composition (Figures 6B, C) were developed to represent the equivalent concentrations of cations (Ca2+, Mg2+, Na+, K+) and anions (HCO3-, SO42-, Cl-, NO3-, CO32-) of water samples. An increase in the concentrations of sulfate and calcium ions with respect to depth in TJBH was noticed, which could be due to the dissolution of gypsum that results in high levels of both ions (Figure 6C). This result coincides with reported dissolved and mineralized gypsum contents in groundwater (almost saturated in sulfates) in the southeast portion of the Yucatán Peninsula and northeastern Belize (Perry et al., 2002; Perry et al., 2019; Perry et al., 2021). Increasing ionic concentrations, for Na+, Cl-, as a function of the water depth were also noticed, coinciding with the increase on salinity. The dissolution capacity is confirmed in this study with the values given by the saturation index (SI), which indicate that the water is undersaturated with respect to gypsum/anhydrite (Table 1).
The TJBH is also characterized by high sulfate concentration (52.65-56.03 meq/L) and high ratios of sulphate and chlorine, 100 x SO4-2/Cl- (16.18-17.90). The increase in salinity with depth in the blue hole would indicate that the primary water source is seawater, but vertical and horizontal water fluxes should be measured. This water source is confirmed by the vertical salinity profile (Figure 4C) but also by the values obtained from the ratios 100 x SO4-2/Cl- and Na+/Cl- (Table 1), close to those for seawater of 10.3 and 1.17, respectively (Perry et al., 2002).
4 Discussion and concluding remarks
The research resulted in the discovery of the second known deepest blue hole formation worldwide, with maximum recorded water depths of 274.4 mbsl. The development of an exceptionally deep blue hole inside the shallow tropical Chetumal Bay is noteworthy and likely associated with glacio-eustatic changes (Siddall et al., 2003; Raymo et al., 2011; Rohling et al., 2021) in the Yucatan Caribbean coast (Kambesis and Coke, 2016), where intermediate type between flank-margin and epigenetic continental karst systems are developed (Smart et al., 2006). The obtained high concentrations and ratios of sulphate and chlorine are representative of the Evaporite Region, which is geomorphologically distinctive due to restricted permeability (Perry et al., 2002). This region extends from the southeastern Yucatán Peninsula to the border with Belize, where the TJBH is located.
The results represent the first research on the TJBH that, without being exhaustive, allowed for the exploration of its geomorphometric and physicochemical features. Stratification based on temperature and chemical characteristics over the water column of the TJBH was found to be similar to that described for the Sansha Yongle Blue Hole (SYBH) in China (Bi et al., 2018; Xie et al., 2019) or the Amberjack Blue Hole in the Gulf of Mexico (Patin et al., 2021); i.e. decreasing temperature and increasing salinity with depth, as well as the development of an anoxic deep water layer (at depths >80 mbsl). It is expected that each submerged blue hole might develop particular features along the water column according to surface surrounding waters and their existing or absent groundwater connections. For instance, the TJBH surface salinity values are representative of the brackish conditions of the Chetumal Bay estuary, while salinity values at deep layers inside the TJBH showed that the main water source is seawater. Nevertheless, the anoxic conditions in deep layers of the TJBH reflect the lack of 1) wind-driven mixing, 2) photosynthetic processes and 3) groundwater circulation. This may led to speculate that saline water in deep layers of the TJBH could represent marine inundations during the rising Holocene sea, as described for the Great Blue Hole of Belize (Gischler et al., 2013). However, the origin and geological evolution of the TJBH deserves further investigation.
Bi et al. (2018) described that the distribution of biogeochemical elements could be controlled not only by physical properties such as temperature and salinity but also by biological and geochemical processes (e.g., photosynthesis, respiration, redox reactions). This could be the case for the distribution of DO in the TJBH, whose high concentration in the surface water layer might occur due to the dissolution of atmospheric oxygen and photosynthetic activity favored by wind-mixing processes, whereas the decrease in DO in the lower water layers would probably occur by predominant organic matter decomposition and respiration processes. Simultaneously, organic carbon oxidation processes and organic matter mineralization by heterotrophic bacteria favoring water acidification (Xie et al., 2019) could be responsible for the pH decrease with depth in the TJBH (Table 1).
The maximum value of chlorophyll-a and TDS was recorded inside the TJBH below 110 m depth, where the lowest value of DO was obtained. According to Bi et al. (2018), this could be caused by an enrichment of particles containing chlorophyll-a or the production of chlorophyll-a by cyanobacteria under anaerobic and aphotic conditions. In the TJBH, detrital particles containing chlorophyll-a could be retained at the thermo- and haloclines developed around the 110 m depth (Figure 4), thus increasing the chlorophyll-a values or the bacterial production processes (microbial layer), as similarly described in Björnerås et al. (2020) for the blue holes in The Bahamas. Other authors also describe that bacterial and primary production significantly contributes to the high variability in biogeochemical characteristics and food webs inside blue holes (Macalady et al., 2008; Gonzalez et al., 2011; Xie et al., 2019; Björnerås et al., 2020). Low or undetectable concentrations of NO3- and NO2- inside the TJBH could be due to denitrification and anammox processes (reduction of NO2- to N2), similar to the nitrogen cycle described by Xie et al. (2019) for the SYBH. Additionally, the levels of NH4+, representing more than 97% of the DIN (dissolved inorganic nitrogen), result from ammonification processes in the blue hole.
Further studies should be conducted, including the analysis of the microbial diversity and hydrogen sulfide measurements, since the reduction of sulfates is among the main metabolic pathways in karstic aquifers. Suspended solids, turbidity, photosynthetically active radiation (PAR), biological components, and sediment analysis are also suggested to allow the identification of the biogeochemical processes concerning the stratification of blue holes (Xie et al., 2019; Björnerås et al., 2020; He et al., 2020; Patin et al., 2021). Isotopes could be explored to identify the age and further features of the water (Bottrell et al., 1991) and the sediment deposits (van Hengstum et al., 2020) inside the TJBH. XRD data could also provide a more detailed analysis of the mineralogical composition of the karst structure. Measurements from remotely operated vehicles (ROVs) or multibeam systems are also required to obtain more accurate 3D topographic data and to identify possible interactions between the morphometry, the hydrobiochemical and geological features of the region (Li et al., 2018; Gonzalez et al., 2020). Moreover, monitoring of the temporal changes in the physicochemical and biological features inside the TJBH is needed to understand the possible variability in biogeochemical processes and to explore the water exchange with the surrounding estuary of Chetumal Bay.
The close location of the TJBH to the coasts of Mexico and Belize would inevitably imply an increase of local and foreign visitors, the development of economic activities, and very probably of environmental pressure. Regulatory measures might be required although the blue hole forms part of the state reserve Sanctuary of Manatee. Currently, the local population is not aware of the existence of the TJBH. Therefore, the authors encourage the scientific community to explore, monitor, and broaden the research of the TJBH to settle an adequate basis for responsible social appropriation in the near future.
Data availability statement
The datasets presented in this article are not readily available because the data belong to a project funded by the authors. Once published, Data eventually will be shared on the institutional data reservoir. Requests to access the datasets should be directed to Dr. LC,bGNhcnJpbGxvQGVjb3N1ci5teA==.
Author contributions
Conceptualization, JA-H, TA-L, and LC; Data curation, JA-H, LF-F, OR-M, and JS-S; Formal analysis, JA-H, LF-F, and JS-S; Funding, JA-H and TA-L; Investigation, JA-H, TA-L, LC, LF-F, OR-M, and JS-S; Methodology, JA-H, TA-L, LC, LF-F, and OR-M, and JS-S; Project administration, JA-H, TA-L, and LC; Resources, TA-L and LC; Software, LF-F and JS-S; Supervision, JA-H, TA-L, and LC; Validation, TA-L and LC; Visualization, JA-H; Writing original draft, JA-H, TA-L, OR-M, and JS-S; Writing review and editing, JA-H, TA-L, and LC. All authors contributed to the article and approved the submitted version.
Funding
The first author personally funded fieldwork expenses during the field survey. The APC fees were personally funded by the authors. The fourth author acknowledges the CONACYT Mexican Scholarship Program (Grant to CVU 1111960) for the funding of postgraduate studies.
Acknowledgments
The support of the COBIA Team for their navigation services, and to Mr. Jesús Artemio Poot Villa for guidance to the location of the TJBH, is gratefully acknowledged. Recognition is given to the CONACYT (National Council for Science and Technology of Mexico) program ‘Investigadoras e Investigadores por México’ (Project 761).
Conflict of interest
The authors declare that the research was conducted in the absence of any commercial or financial relationships that could be construed as a potential conflict of interest.
Publisher’s note
All claims expressed in this article are solely those of the authors and do not necessarily represent those of their affiliated organizations, or those of the publisher, the editors and the reviewers. Any product that may be evaluated in this article, or claim that may be made by its manufacturer, is not guaranteed or endorsed by the publisher.
References
APHA (1998). Standard methods for the examination of water and waste water. 20th Ed (Washington D.C., USA: American Public Health Association).
Appelo C. A. J., Postma D. (2005). Geochemistry, groundwater and pollution. 2nd Ed. Eds. Appelo C. A. J., Postma D. (London, UK: CRC Press).
Avalos-Cueva D., Palacios-Hernandez E., Carrillo L., Gonzalez-Vivanco L. A. (2017). Numerical models as tools to understand the dynamics in bays: Case of study chetumal bay, quintana roo. Rev. RA XIMHAI 13, 267–290.
Baremore I. E., Graham R. T., Burgess G. H., Castellanos D. W. (2021). Movements and residency of Caribbean reef sharks at a remote atoll in Belize, central America. R. Soc Open Sci. 8, 1–16. doi: 10.1098/rsos.201036
Bauer-Gottwein P., Gondwe B. R. N., Charvet G., Marín L. E., Rebolledo-Vieyra M., Merediz-Alonzo G. (2011). Review : The yucatán peninsula karst aquifer , Mexico. Hydrogeol. J. 19, 507–524. doi: 10.1007/s10040-010-0699-5
Bi N., Fu L., Chen H., Liu R., Chen L., Liu Q., et al. (2018). Hydrographic features of the yongle blue hole in the south China Sea and their influential factors. Chin. Sci. Bull. 63, 2184–2186. doi: 10.1360/N972017-01329
Björnerås C., Škerlep M., Gollnisch R., Herzog S. D., Ekelund Ugge G., Hegg A., et al. (2020). Inland blue holes of the Bahamas – chemistry and biology in a unique aquatic environment. Fundam. Appl. Limnol. 194, 95–106. doi: 10.1127/fal/2020/1330
Bottrell S. H., Smart P. L., Whitaker F., Raiswell R. (1991). Geochemistry and isotope systematics of sulphur in the mixing zone of Bahamian blue holes. Appl. Geochemistry 6, 97–103. doi: 10.1016/0883-2927(91)90066-X
Carrillo L., Palacios-Hernández E., Ramírez A. M., Morales-Vela B. (2009a). “Características hidrometeorológicas y batimétricas,” in El Sistema ecológico de la bahía de chetumal / corozal: costa occidental del mar caribe. Eds. Espinoza-Avalos J., Islebe G., Hernández-Arana H. A. (Chetumal, Mexico: ECOSUR), 12–20.
Carrillo L., Palacios-Hernández E., Yescas M., Ramírez-Manguilar A. M. (2009b). Spatial and seasonal patterns of salinity in a large and shallow tropical estuary of the western caribbean. Estuaries Coasts 32, 906–916. doi: 10.1007/s12237-009-9196-2
Fragoso-Servón P., Bautista F., Frausto O., Pereira A. (2014). Characterization of karst depressions (shape, size and density) at 1:50,000 scale and the associated type of flood in the state of quintana roo, Mexico. Rev. Mex. Cienc. Geológicas 31, 127–137.
Gischler E., Anselmetti F. S., Shinn E. A. (2013). Seismic stratigraphy of the blue hole (Lighthouse reef, Belize), a late Holocene climate and storm archive. Mar. Geol. 344, 155–162. doi: 10.1016/j.margeo.2013.07.013
Gonzalez B. C., Iliffe T. M., Macalady J. L., Schaperdoth I., Kakuk B. (2011). Microbial hotspots in anchialine blue holes: initial discoveries from the Bahamas. Hydrobiologia 677, 149–156. doi: 10.1007/s10750-011-0932-9
Gonzalez B. C., Martínez A., Olesen J., Truskey S. B., Ballou L., Allentoft-Larsen M., et al. (2020). Anchialine biodiversity in the Turks and Caicos islands: New discoveries and current faunal composition. Int. J. Speleol. 49, 71–86. doi: 10.5038/1827-806X.49.2.2316
Hansen H. P., Koroleff F. (1999). Methods of seawater analysis. Eds. Grasshoff K., Kremling K., Ehrhardt (Wiley M. Weinheim, Federal Republic of Germany: WILEY-VCH Verlag GmbH). doi: 10.1002/9783527613984
He P., Xie L., Zhang X., Li J., Lin X., Pu X., et al. (2020). Microbial diversity and metabolic potential in the stratified sansha yongle blue hole in the south China Sea. Sci. Rep. 10 5949. doi: 10.1038/s41598-020-62411-2
Husson L., Pastier A., Pedoja K., Elliot M., Paillard D., Authemayou C., et al. (2018). Reef carbonate productivity during quaternary Sea level oscillations. Geochemistry Geophys. Geosystems 19, 1148–1164. doi: 10.1002/2017GC007335
Iwanowicz D. D., Jonas R. B., Schill W. B., Marano-Briggs K. (2021). Novel microbiome dominated by arcobacter during anoxic excurrent flow from an ocean blue hole in andros island, the Bahamas. PloS One 16, e0256305. doi: 10.1371/journal.pone.0256305
Jones A. T., Dill R. F. (2002). “Great blue hole of lighthouse reef atoll, Belize, central America: deep technical diving to collect sea-level records,” in Caribbean Geology: into the third millenium. Ed. Jackson T. A. (Kingston, Jamaica: University of the Wast Indies).
Kambesis P. N., Coke J. G. (2013). “Overview of the controls on eogenetic cave and karst development in quintana roo, Mexico,” in Coastal karst landforms. Eds. Lace M. J., Mylroie J. E. (New York, London: Springer). doi: 10.1007/978-94-007-5016-6_16
Kambesis P. N., Coke I. V. (2016). The Sac Actun system, Quintana Roo, Mexico. Boletín Geológico Minero 127 (1), 177–192.
Kjerfve B. (1981). Tides of the Caribbean Sea. J. Geophys. Res. Ocean. 86, 4243–4247. doi: 10.1029/JC086iC05p04243
Li T., Feng A., Liu Y., Li Z., Guo K., Jiang W., et al. (2018). Three-dimensional (3D) morphology of sansha yongle blue hole in the south China Sea revealed by underwater remotely operated vehicle. Sci. Rep. 8, 17122. doi: 10.1038/s41598-018-35220-x
Little S. N., van Hengstum P. J., Beddows P. A., Donnelly J. P., Winkler T. S., Albury N. A. (2021). Unique habitat for benthic foraminifera in subtidal blue holes on carbonate platforms. Front. Ecol. Evol. 9. doi: 10.3389/fevo.2021.794728
Macalady J. L., Dattagupta S., Schaperdoth I., Jones D. S., Druschel G. K., Eastman D. (2008). Niche differentiation among sulfur-oxidizing bacterial populations in cave waters. ISME J. 2, 590–601. doi: 10.1038/ismej.2008.25
Martin J. B., Gulley J., Spellman P. (2012). Tidal pumping of water between Bahamian blue holes, aquifers, and the ocean. J. Hydrol. 416–417, 28–38. doi: 10.1016/j.jhydrol.2011.11.033
Mylroie J. E. (2008). Late quaternary sea-level position : Evidence from Bahamian carbonate deposition and dissolution cycles. Quat. Int. 183, 61–75. doi: 10.1016/j.quaint.2007.06.030
Mylroie J. E. (2013). “Coastal karst development in carbonate rocks,” in Coastal karst landforms coastal research library. Eds. Lace M. J., Mylroie J. E. (Dordrecht: Springer Netherlands), 77–109. doi: 10.1007/978-94-007-5016-6_4
Mylroie J. R., Mylroie J. E. (2007). Develepment of the carbonate island karst model. J. Cave Karst Stud. 69, 59–75.
NMX-AA-036-SCFI-2001 (2001). Análisis de agua- determinación de acidez y alcalinidad en aguas naturales, residuales y residuales tratadas- método de prueba (Mexico: y Fomento Industrial, Dirección General de Normas).
NMX-AA-072-SCFI-2001 (2001). Análisis de agua - determinación de dureza total en aguas naturales, residuales y residuales tratadas - método de prueba (Mexico: Secretaría de Economía, Dirección General de Normas).
NMX-AA-073-SCFI-2001 (2001). Análisis de agua - determinación de cloruros totales en aguas naturales, residuales y residuales tratadas - método de prueba (Mexico: Secretaría de Economía, Dirección General de Normas).
NMX-AA-074-1981 (1981). Análisis de agua - determinación del ión sulfato: México (Mexico: Secretaría de Comercio y Fomento Industrial, Dirección General de Normas).
Parkhurst D. L. (1995). User’s guide to PHREEQC, a computer program for speciation, reaction-path, advective-transport, and inverse geochemical calculations. Water-Resources Investig. 143. doi: 10.3133/wri954227
Patin N. V., Dietrich Z. A., Stancil A., Quinan M., Beckler J. S., Hall E. R., et al. (2021). Gulf of Mexico blue hole harbors high levels of novel microbial lineages. ISME J. 15, 2206–2232. doi: 10.1038/s41396-021-00917-x
Perry E. C., Leal-Bautista R. M., Velázquez-Olimán G., Sánchez-Sánchez J. A., Wagner N. (2021). Aspects of the hydrogeology of southern campeche and quintana roo, Mexico. Boletín la Soc Geológica Mex. 73, A011020. doi: 10.18268/BSGM2021v73n1a011020
Perry E., Paytan A., Pedersen B., Velazquez-Oliman G. (2009). Groundwater geochemistry of the Yucatan peninsula, Mexico: Constraints on stratigraphy and hydrogeology. J. Hydrol. 367, 27–40. doi: 10.1016/j.jhydrol.2008.12.026
Perry E. C., Velazquez-Oliman G., Leal-Bautista R. M., Dunning N. (2019). The icaiche formation: Major contributor to the stratigraphy, hydrogeochemistry and geomorphology of the northern yucatán peninsula, Mexico. Boletín la Soc Geológica Mex. 71, 741–760. doi: 10.18268/BSGM2019v71n3a7
Perry E., Velazquez-Oliman G., Marin L. (2002). The hydrogeochemistry of the karst aquifer system of the northern Yucatan peninsula, Mexico. Int. Geol. Rev. 44, 191–221. doi: 10.2747/0020-6814.44.3.191
Piper A. M. (1944). A graphic procedure in the geochemical interpretation of water-analyses. Trans. Am. Geophys. Union 25, 914–923. doi: 10.1029/TR025i006p00914
Raymo M. E., Mitrovica J. X., O’Leary M. J., DeConto R. M., Hearty P. J. (2011). Departures from eustasy in pliocene sea-level records. Nat. Geosci. 4, 328–332. doi: 10.1038/ngeo1118
Rohling E. J., Yu J., Heslop D., Foster G. L., Opdyke B., Roberts A. P. (2021). Sea Level and deep-sea temperature reconstructions suggest quasi-stable states and critical transitions over the past 40 million years. Sci. Adv. 7, 1–18. doi: 10.1126/sciadv.abf5326
Ruíz-Pineda C., Suárez-Morales E., Gasca R. (2016). Copépodos planctónicos de la bahía de chetumal, caribe mexicano: variaciones estacionales durante un ciclo anual. Rev. Biol. Mar. Oceanogr. 51, 301–316. doi: 10.4067/S0718-19572016000200008
Schmitt D., Gischler E., Walkenfort D. (2021). Holocene Sediments of an inundated sinkhole: facies analysis of the “Great blue hole”, lighthouse reef, Belize. Facies 67, 10. doi: 10.1007/s10347-020-00615-8
Siddall M., Rohling E. J., Almogi-Labin A., Hemleben C., Meischner D., Schmelzer I., et al. (2003). Sea-Level fluctuations during the last glacial cycle. Nature 423, 853–858. doi: 10.1038/nature01690
Smart P. L., Beddows P. A., Coke J., Doerr S., Smith S., Whitaker F. F. (2006). Cave development on the Caribbean coast of the Yucatan peninsula, quintana roo, Mexico. Spec. Pap. Geol. Soc Am. 404, 105–128. doi: 10.1130/2006.2404(10
Smith M. E., Wynn J. G., Scharping R. J., Moore E. W., Garey J. R., Onac B. P. (2021). Source of saline groundwater on tidally influenced blue holes on San Salvador island, Bahamas. Hydrogeol. J. 29, 429–441. doi: 10.1007/s10040-020-02266-z
Strickland J. D. H., Parsons T. R. (1972). A practical handbook of seawater analysis (Ottawa, Canada: Fisheries Research Board of Canada).
Supper R., Motschka K., Ahl A., Bauer-Gottwein P., Gondwe B., Alonso G. M., et al. (2009). Spatial mapping of submerged cave systems by means of airborne electromagnetics: an emerging technology to support protection of endangered karst aquifers. Near Surf. Geophys. 7, 613–627. doi: 10.3997/1873-0604.2009008
Tamalavage A. E., van Hengstum P. J., Louchouarn P., Molodtsov S., Kaiser K., Donnelly J. P., et al. (2018). Organic matter sources and lateral sedimentation in a Bahamian karst basin (sinkhole) over the late Holocene: Influence of local vegetation and climate. Palaeogeogr. Palaeoclimatol. Palaeoecol. 506, 70–83. doi: 10.1016/j.palaeo.2018.06.014
van Hengstum P. J., Cresswell J. N., Milne G. A., Iliffe T. M. (2019). Development of anchialine cave habitats and karst subterranean estuaries since the last ice age. Sci. Rep. 9, 1–10. doi: 10.1038/s41598-019-48058-8
van Hengstum P. J., Reinhardt E. G., Beddows P. A., Huang R. J., Gabriel J. J. (2008). Thecamoebians (Testate amoebae) and foraminifera from three anchialine cenotes in Mexico: Low salinity (1.5 - 4.5 psu) faunal transitions. J. Foraminifer. Res. 38, 305–317. doi: 10.2113/gsjfr.38.4.305
van Hengstum P. J., Scott D. B., Gröcke D. R., Charette M. A. (2011). Sea Level controls sedimentation and environments in coastal caves and sinkholes. Mar. Geol. 286, 35–50. doi: 10.1016/j.margeo.2011.05.004
van Hengstum P. J., Winkler T. S., Tamalavage A. E., Sullivan R. M., Little S. N., MacDonald D., et al. (2020). Holocene Sedimentation in a blue hole surrounded by carbonate tidal flats in the Bahamas: Autogenic versus allogenic processes. Mar. Geol. 419. doi: 10.1016/j.margeo.2019.106051
Vimpere L. (2017). Stratigraphy and sedimentology of quaternary carbonate units around and within Dean's blue hole, Long siland, Bahamas. Master Thesis. Geneva, Switzerland: Faculty of Science, Department of Earth Sciences, University of Genova. pp. 117.
Wallace E., Donnelly J., van Hengstum P., Winkler T., Dizon C., LaBella A., et al. (2021). Regional shifts in paleohurricane activity over the last 1500 years derived from blue hole sediments offshore of middle Caicos island. Quat. Sci. Rev. 268, 107126. doi: 10.1016/j.quascirev.2021.107126
Winkler T. S., van Hengstum P. J., Donnelly J. P., Wallace E. J., Sullivan R. M., MacDonald D., et al. (2020). Revising evidence of hurricane strikes on abaco island (The Bahamas) over the last 700 years. Sci. Rep. 10, 16556. doi: 10.1038/s41598-020-73132-x
Xie L., Wang B., Pu X., Xin M., He P., Li C., et al. (2019). Hydrochemical properties and chemocline of the sansha yongle blue hole in the south China Sea. Sci. Total Environ. 649, 1281–1292. doi: 10.1016/j.scitotenv.2018.08.333
Yao P., Wang X. C., Bianchi T. S., Yang Z. S., Fu L., Zhang X. H., et al. (2020). Carbon cycling in the world’s deepest blue hole. J. Geophys. Res. Biogeosciences 125, 1–19. doi: 10.1029/2019JG005307
Keywords: coastal karst, underwater geomorphometry, physicochemical characterization, water column stratification, Yucatán Peninsula, Chetumal Bay
Citation: Alcérreca-Huerta JC, Álvarez-Legorreta T, Carrillo L, Flórez-Franco LM, Reyes-Mendoza OF and Sánchez-Sánchez JA (2023) First insights into an exceptionally deep blue hole in the Western Caribbean: The Taam ja’ Blue Hole. Front. Mar. Sci. 10:1141160. doi: 10.3389/fmars.2023.1141160
Received: 10 January 2023; Accepted: 14 February 2023;
Published: 23 February 2023.
Edited by:
Elinor Andrén, Södertörn University, SwedenReviewed by:
Peter J. van Hengstum, Texas A&M University at Galveston, United StatesEberhard Gischler, Goethe University Frankfurt, Germany
Copyright © 2023 Alcérreca-Huerta, Álvarez-Legorreta, Carrillo, Flórez-Franco, Reyes-Mendoza and Sánchez-Sánchez. This is an open-access article distributed under the terms of the Creative Commons Attribution License (CC BY). The use, distribution or reproduction in other forums is permitted, provided the original author(s) and the copyright owner(s) are credited and that the original publication in this journal is cited, in accordance with accepted academic practice. No use, distribution or reproduction is permitted which does not comply with these terms.
*Correspondence: Laura Carrillo, bGNhcnJpbGxvQGVjb3N1ci5teA==