 Tyler A. Helble1*
 Regina A. Guazzo1
 Ian N. Durbach2,3
 Cameron R. Martin1
 Gabriela C. Alongi4
 Stephen W. Martin4
 E. Elizabeth Henderson1
- 1Naval Information Warfare Center Pacific, San Diego, CA, United States
- 2Centre for Research into Ecological and Environmental Modelling, School of Mathematics and Statistics, University of St Andrews, St Andrews, United Kingdom
- 3Centre for Statistics in Ecology, the Environment, and Conservation, University of Cape Town, Cape Town, South Africa
- 4National Marine Mammal Foundation, San Diego, CA, United States
Behavioral responses to sonar have been observed in a number of baleen whales, including minke whales (Balaenoptera acutorostrata). Previous studies used acoustic minke whale boing detections to localize and track individual whales on the U.S. Pacific Missile Range Facility (PMRF) in Kaua ‘i, Hawai‘i before, during, and after Navy training activities. These analyses showed significant changes in central North Pacific minke whale distribution and swimming behavior during Navy sonar events. For the purposes of contextualizing changes in animal movement relative to Navy sonar, we expanded on this research to examine the natural variation in minke whale movement when Navy sonar was not present. This study included 2,245 acoustically derived minke whale tracks spanning the years 2012–2017 over all months that minke whales were detected (October–May). Minke whale movement was examined relative to calling season, day of the year, hour of day, wind speed, calling state (nominal or rapid), and distance to the nearest calling conspecific. Hidden Markov models were used to identify two kinematic states (slower, less directional movement and faster, more directional movement). The findings indicate that minke whales were more likely to travel in a faster and more directional state when they were calling rapidly, when other vocalizing minke whales were nearby, during certain times of the day and calling seasons, and in windier conditions, but these changes in movement were less intense than the changes observed during exposure to Navy sonar, when swim speeds were the fastest. These results start to put behavioral responses to Navy sonar into an environmental context to understand the severity of responses relative to natural changes in behavior.
1 Introduction
Minke whales (Balaenoptera acutorostrata) in the central North Pacific produce acoustic boing calls that were first described by Wenz (1964). Minke whales are rarely seen during visual surveys, and the boing sound was not positively identified as originating from the minke whale until 2005 (Rankin and Barlow, 2005). The purpose of the boing call is unknown, although it has been theorized to be related to breeding, as the calls are produced seasonally in warm temperate waters that are typically associated with breeding grounds for baleen whales (Martin et al., 2015). The U.S. Navy’s Pacific Missile Range Facility (PMRF) located off the coast of Kaua’i, Hawai‘i, provides a unique opportunity to study minke whale acoustic behavior. PMRF’s extensive hydrophone array allows for the ability to detect, localize, and track baleen whales, including minke whales, that vocalize on the range. Previous studies have shown that minke whales in this area produce boing calls with a strong bimodal call rate (Thompson and Friedl, 1982; Martin et al., 2022). Most of the time, minke whales call at a nominal call rate with a mean of one call every 6.85 min (σ = 2.54 min), but sometimes minke whales call at a rapid call rate with a mean of one call every 0.63 min (σ = 0.36 min) (Martin et al., 2022). Martin et al. (2022) also demonstrated that the minke call rate is related to the distance to the nearest calling conspecific, with animals more likely to call rapidly when they are closer. However, the relationship between this boing calling behavior and kinematic behavior has not previously been studied in detail.
Understanding normal swimming behavior and the factors that influence it can help contextualize behavioral changes related to anthropogenic activity. Since minke whales are cosmopolitan, swimming behavior has been collected around the world for whales in a variety of circumstances, however most studies have had low sample sizes. In North Atlantic feeding areas, minke whales have been observed swimming between 0.3–6.8 m/s (Blix and Folkow, 1995; Heide-Jørgensen et al., 2001; Christiansen et al., 2014) and it has been suggested that their most efficient swimming speed is between 2.5–7.0 m/s (Blix and Folkow, 1995; Christiansen et al., 2014). In the study with the largest sample size, the average swimming speed for undisturbed minke whales was 1.6 m/s (n=57, however, like many other studies, these speeds were measured during focal follows which might have influenced behavior) (Christiansen et al., 2014). Minke whales that were presumably migrating in the western North Atlantic swam at an average speed of 1.4 m/s (n=13) with relatively straight tracks (Risch et al., 2014). A single minke whale sighted in Hawaiian waters swam with an average speed of 1.6 m/s (Rankin and Barlow, 2005). However, minke whales have been observed to increase their swimming speed when whale watching boats are close (Christiansen et al., 2014) and sustain maximum swimming speeds of 8.3 m/s for up to an hour when chased by killer whales (Orcinus orca) (Ford et al., 2005).
Previous studies have shown that minke whales change their swimming behavior in response to Navy sonar. A small study of two tagged individuals off southern California and Norway showed that these minke whales avoided ships producing mid-frequency active sonar (MFAS) (Kvadsheim et al., 2017). At PMRF, during periods of Navy training with MFAS, calling minke whales decreased their spatial density (Martin et al., 2015), redistributed away from the area of ship activity (Harris et al., 2019), and swam faster and more directed away from the area with ships producing sonar (Durbach et al., 2021). In the most extensive study, more than 600 minke whales were detected, localized, and tracked on PMRF before, during, and after Navy MFAS during February training events in three different years (Durbach et al., 2021). Before and after sonar, minke whales on PMRF were more likely to be in a state characterized by slow, undirected swimming with an average speed of 0.8 m/s, but during sonar, minke whales were more likely to transition to a state characterized by fast and more directed swimming with an average speed of 2.4 m/s, move away from the sonar source, and/or cease to call (Durbach et al., 2021).
Passive acoustic monitoring has been conducted using the PMRF range hydrophones since 2002. Since 2006, recordings have been collected for at least a few days almost every month, and between 2012–2017 the hydrophone configuration remained the same, allowing for consistent minke whale observations throughout all seasons and in a variety of environmental conditions (see Figure 3 in Martin et al., 2022). This sampling regime provides the ability to observe changes in minke whale swimming behavior for the duration of the season they are present in Hawai’i and on the range, not just during Navy MFAS training events. Most Navy sonar behavioral response studies (BRS) of marine mammals are short-duration events with baseline observation of whale behavior on the order of hours (or at most days) before, during, and after exposure (e.g. Southall et al., 2012; Southall et al., 2016; Durbach et al., 2021). Often, temporary suction cup tags are used to record whale swimming behavior around the exposure event, limiting the amount of baseline data that can realistically be acquired due to both the difficulty of placing tags and the total amount of time that a tag can remain on a whale. Acoustic-only observations over multiple seasons and years on PMRF during periods without training therefore provide a unique opportunity to contextualize minke whale swimming behavior in their natural environment.
The goal of this work was to describe normal shifts in minke whale behavior in order to contextualize behavioral changes observed during Navy MFAS. Martin et al. (2022) analyzed minke whale tracks generated from boing calls recorded between 2012–2017 within a limited focal area at PMRF and demonstrated that these minke whales changed their calling behavior as a function of distance to the nearest calling conspecific. In this paper, we use the same 509 tracks (from 36,033 boing calls) to investigate the variation in minke whale swimming behavior over a variety of temporal variables (calling season, day of the year, hour of day), an environmental variable (wind speed), and minke whale behavioral variables (calling state and distance to the nearest conspecific). In the same way that Durbach et al. (2021) tested two behavioral states relative to periods before, during, and after Navy MFAS, hidden Markov models (HMMs) were used to identify two kinematic states from these tracks (slower, less directional movement, and faster, more directional movement). We then examined the linkages between these two kinematic states and the associated temporal, environmental, and behavioral variables. This paper summarizes the kinematic behavior of minke whales recorded at PMRF and compares the resulting behavior to that observed during Navy training exercises.
2 Methods
2.1 Study area and data description
Acoustic data were collected over 599 recording days at PMRF off the coast of Kaua’i, Hawai’i from August 2012 to July 2017 (recording effort shown in Figure 3 of Martin et al., 2022). The recordings originated from 47 bottom-mounted hydrophones spanning a grid approximately 20 km to the east-west and 58 km to the north-south (Figure 1), with depths ranging from 650 m to 4,700 m. The recording period between August 2012 and July 2017 was chosen because the broadband hydrophone array configuration was consistent over this time period. Full bandwidth data were recorded every month during this recording period (with the exception of December 2016) at a 96 kHz sampling rate with 16-bit samples. Additional recordings were added starting in August 2014 at a 6 kHz sampling rate to increase the monitoring duration while retaining the relevant frequency bands for baleen whale detection. Continuous data collected at the 96 kHz sample rate typically had a maximum duration of 1.9 days, while data collected at the 6 kHz sample rate had a maximum duration of 10.9 days. No recordings during U.S. Navy training activities were included in the analysis and only two out of the 509 focal tracks started within 24 hours after the last MFAS transmission from a multiday February training event (Martin et al., 2022). Track kinematic results from this study are discussed in relation to the track kinematics from behavioral responses of minke whales during U.S. Navy training exercises in February 2014, 2015, and 2017 (Durbach et al., 2021).
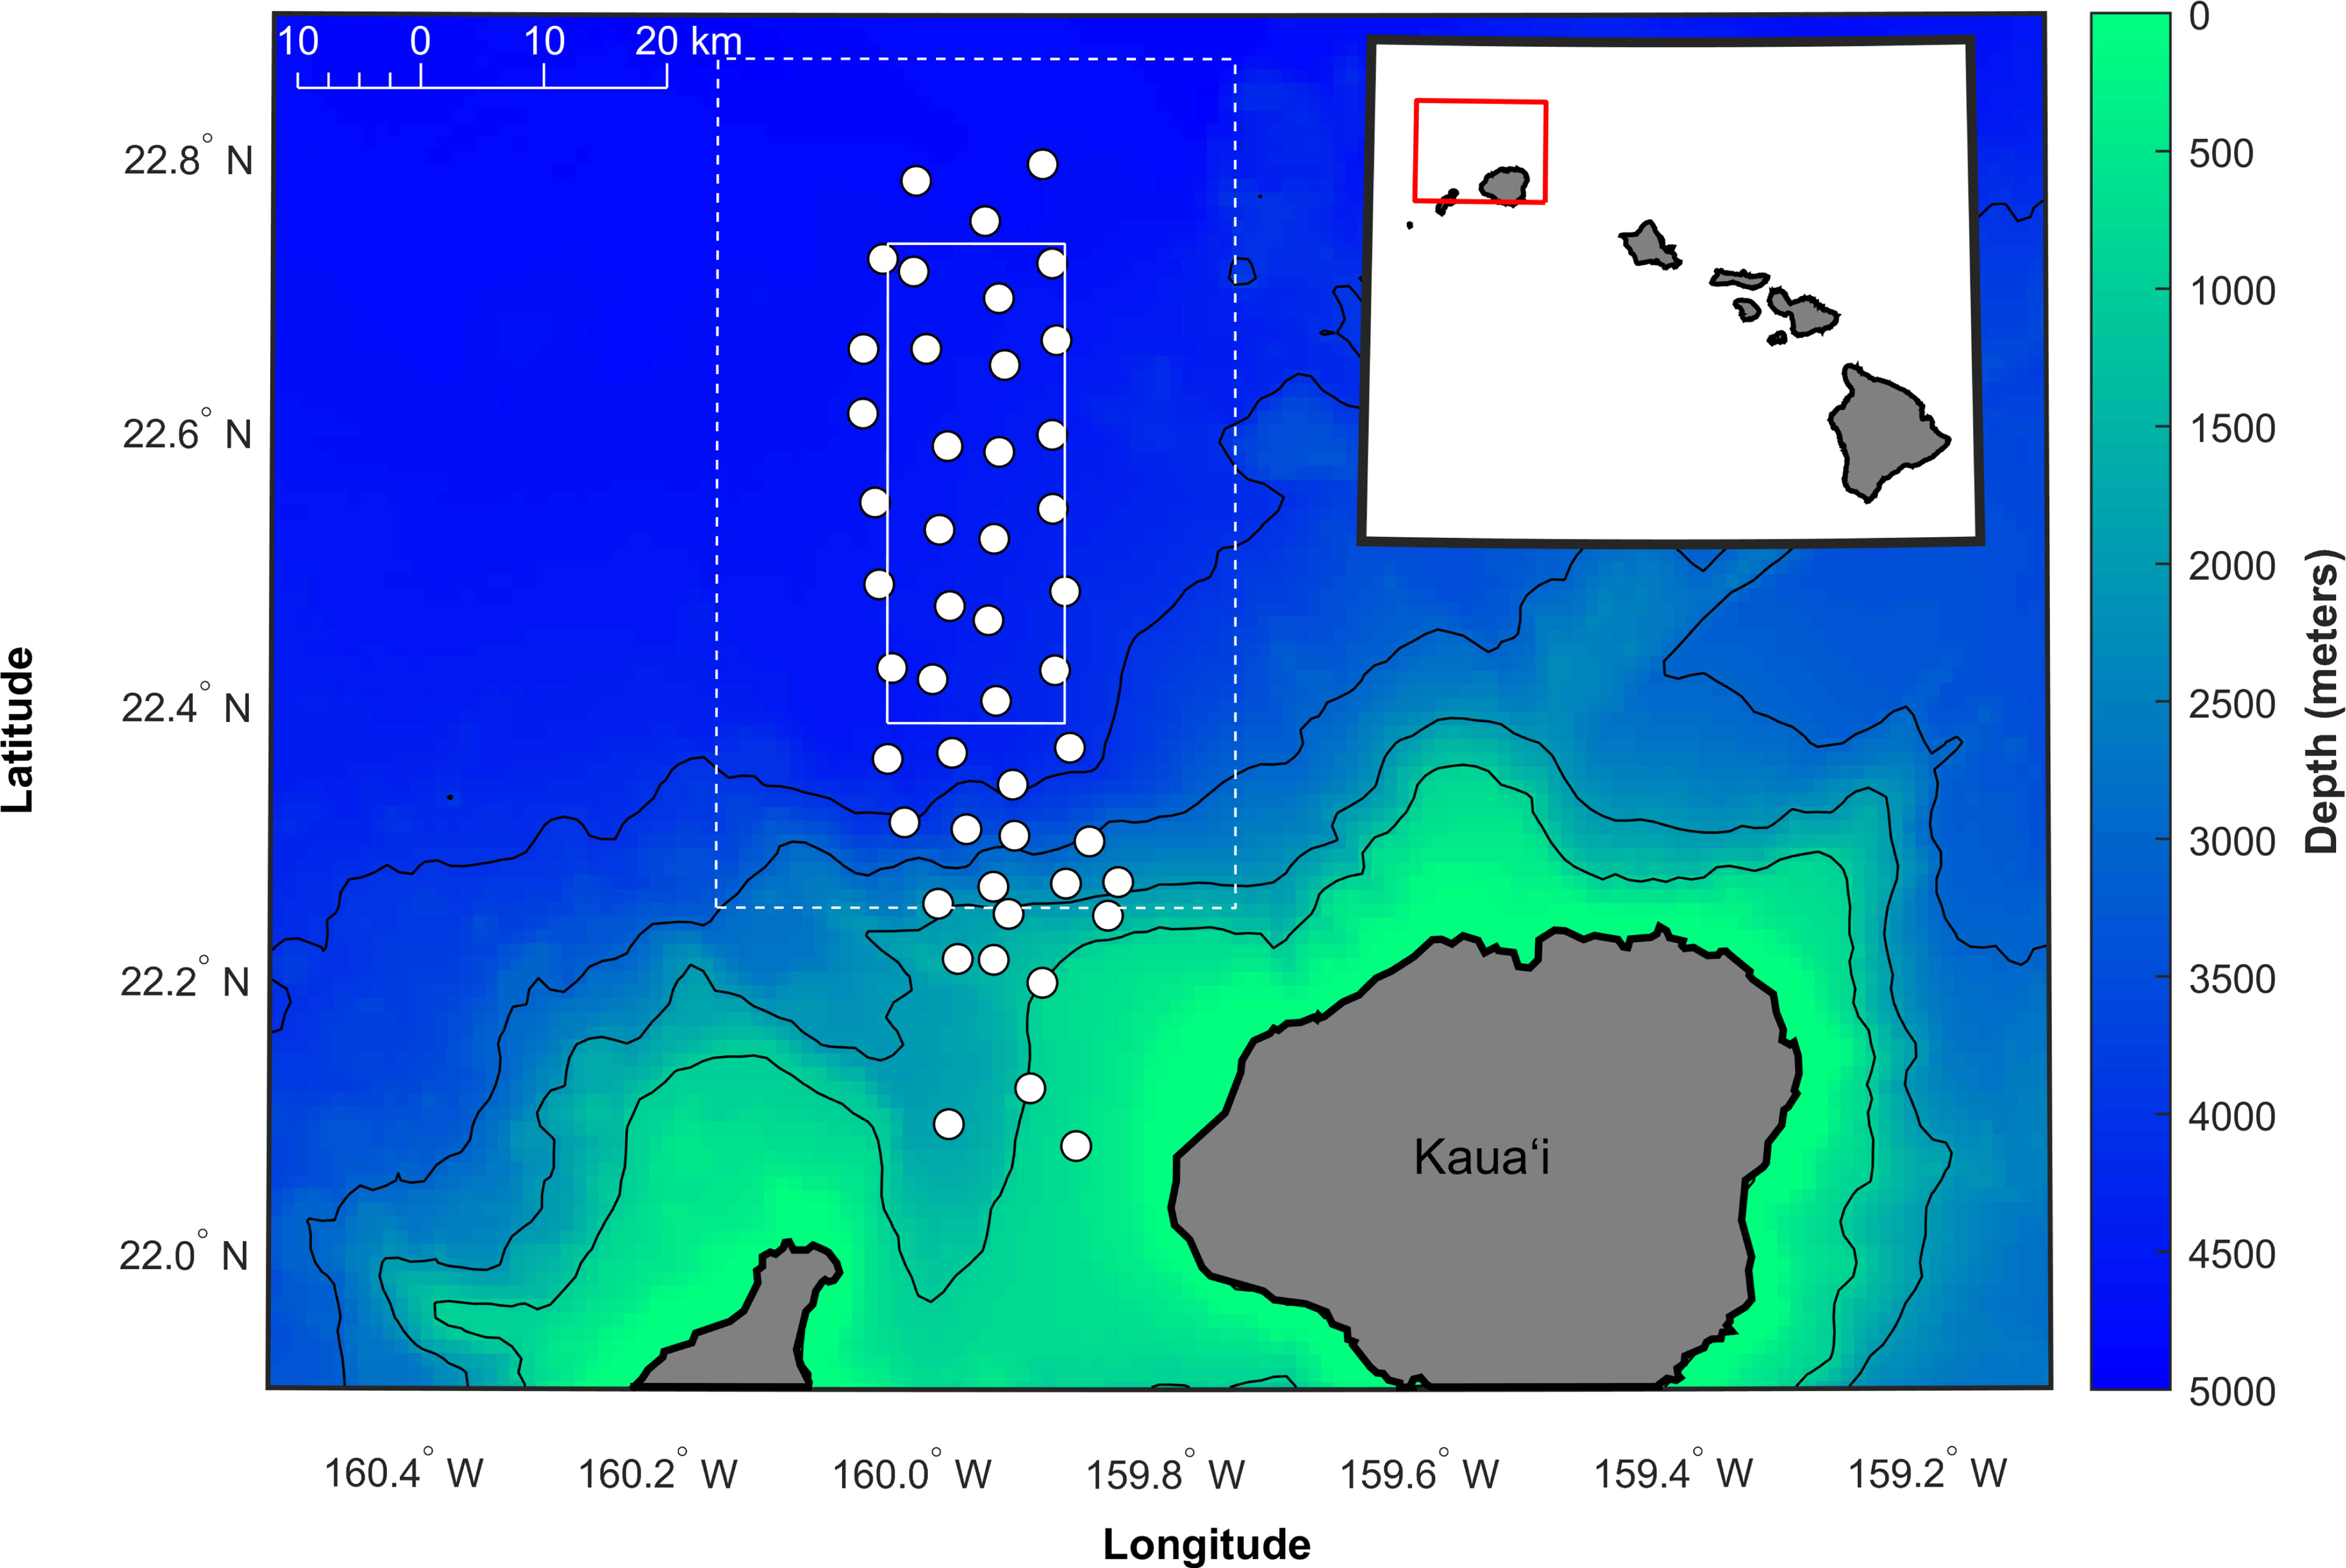
Figure 1 Map of the approximate locations of the 47 hydrophones used in this analysis (white circles) at the Pacific Missile Range Facility (PMRF) off Kaua‘i, Hawai‘i, as shown by the red box in the inset map. The focal study area of the array extends approximately 16 km to the east-west and 39 km to the north-south (boundaries shown by solid white box). The total study area extends 15 km outside the focal area and is shown with a dashed white box. Depth contours are every 1,000 m (1 km spatial resolution, Hawai‘i Mapping Research Group, The School of Ocean and Earth Science and Technology, the University of Hawai‘i at Mānoa, http://www.soest.hawaii.edu/hmrg/multibeam/bathymetry.php).
Track segments within the 624 km2 focal study zone, shown as the inner solid rectangular area of Figure 1, were designated as focal tracks. As in Martin et al. (2022), only minke whale tracks or segments of tracks that were located within the smaller focal area were included as focal tracks in order to ensure that vocalizing conspecifics within a 15 km range (to the edge of the total study area) would be detected, localized, and tracked in all observed noise conditions. While tracking is possible well beyond the focal area, selecting only the portions of tracks within the focal area allows the distance to the nearest calling conspecific to be calculated without ambiguity (more details in subsection 2.4). The distance to the nearest conspecific is an important metric, as it was shown in Martin et al. (2022) to greatly influence minke whale calling behavior, and an initial informal analysis of individual tracks from that study indicated that the distance to the nearest conspecific might also influence minke whale kinematics. This initial observation prompted the in-depth investigation in this paper.
2.2 Detection, classification, localization, and tracking
PMRF recordings were used to detect, classify, localize, and track central North Pacific minke whale boing calls. The dataset and resulting tracks are identical to those described in detail by Martin et al. (2022), and the methods for obtaining the tracks are described in Section 2 of Martin et al. (2022), and thus are only briefly described here.
The minke whale boing call detection and classification process operated in multiple stages. In the first stage, the near-continuous wave portion of the call was detected by measuring whether the energy in the detection band (1,320–1,450 Hz) exceeded a long-term spectral average noise estimate in the same band for more than 0.8 sec. In the second stage, a spectral correlation was computed in order to locate the onset time of the frequency modulated portion of the call; this was used as the measured time of arrival (TOA) in the model-based localization algorithm. This localization algorithm for data processing was previously described by (Martin et al. 2022; Martin et al. 2015) and is briefly described here. To localize calls, the measured TOAs were used as the onset times for automatic detections on multiple hydrophones; these were subtracted from each other to calculate measured time difference of arrivals (TDOAs). Modeled TDOAs were calculated from theoretical source locations. The weighted least square error between measured and modeled TDOAs was minimized, such that only localizations with a weighted least square error value of less than or equal to 0.075 s were used in this analysis.
An automatic tracking algorithm described by Klay et al. (2015) spatially and temporally grouped localized calls into individual tracks by recursively examining distance and time between successive candidate localizations (e.g., Harris et al., 2019; Helble et al., 2020; Durbach et al., 2021). The algorithm is tuned for each species being tracked. The following user-defined values were applied to minke whale tracks: a track had to be composed of 12 or more localizations, a localization solution required automatic detections from 8 or more hydrophones, the distance between subsequent localizations had to be less than or equal to 0.06 decimal degrees in both latitude and longitude (approximately 6.7 km), and the maximum time allowed between any two localizations before terminating a track was set to 40 min.
2.3 Categorizing swimming behavior
HMMs were used to categorize the swimming behavior of minke whales. Because whale locations were only calculated at the time of each vocalization, the original tracks were not sampled at a constant rate, which is required for this analysis to avoid oversampling speed and heading when whales are calling rapidly. Therefore, new tracks were generated that were sampled every 5 min using the crawlWrap function of the R package momentuHMM (McClintock and Michelot, 2018), a wrapper for the continuous-time random walk (CRAWL) model of Johnson et al. (2008). Measurement errors with a standard deviation of 60 m in the x and y directions were assumed, as this is the estimated localization accuracy at PMRF within the focal study area (Helble et al., 2015; Martin et al., 2015; Harris et al., 2019; Helble et al., 2020). A single best-fitting track was fitted to these localizations, and then speed and turning angle were extracted for each 5 min interval. These methods were similar to those used for minke whales by Durbach et al. (2021) and for fin whales by Guazzo et al. (2021).
Each 5 min interval was categorized into a behavioral state based on the whale’s turning angle and speed for that interval. The number of states and the sampling interval were chosen based on prior knowledge of the minke whales in Hawaiian waters. Durbach et al. (2021) found that minke whale swimming behavior could be categorized into two states — a slower, less directed travel state and a faster, more directed travel state. Following model fitting, the Viterbi algorithm was used to group each 5 min interval into one of these two behavioral states (Langrock et al., 2012; McClintock and Michelot, 2018). Minke whale step length (distance covered in each 5 min interval) and turning angles were used as state variables in HMMs, with the probability of transitioning between states modeled as a function of predictor variables hypothesized to influence minke whale swimming behavior. HMMs are fitted by numerical maximization of the likelihood, requiring the specification of initial starting values for all parameters. Step length was modeled using a gamma distribution and turning angle was modeled as a wrapped Cauchy distribution. We used initial step length values of 252 m for the Slow State and 708 m for the Faster State with standard deviations of 159 and 390 m, respectively, and initial turning angle values centered around 0°with a concentration parameter of 0.18 for the Slow State and 0.52 for the Faster State [where a concentration parameter of 0 would indicate random turning and 1 would indicate traveling in a straight line (Bacheler et al., 2019)]. These initial values were chosen to coincide with the step lengths (mean, SD) and mean angular concentrations found for the two behavioral states in Durbach et al. (2021), but the final results were not sensitive to initial value selection (initial values were adjusted by ±25% and the best models did not change). The Akaike information criterion (AIC) (Akaike, 1974) and similarly the AIC weights (Burnham and Anderson, 2002) were used to rank the models. Statistical analysis was conducted using the momentuHMM package (v 1.4.3, McClintock and Michelot, 2018) in R (v 4.0.3, R Core Team, 2020).
Some additional track metrics were calculated from the temporally smoothed tracks to understand the general kinematic behavior of calling minke whales. Mean speed for each track was calculated by averaging the speeds from each of the 5 min intervals. The average heading of each track was calculated by averaging the unit vectors for each 5 min interval and then calculating the heading of the result. Finally, the directivity index of each tracked whale was measured by dividing the straight-line distance between the first and last points by the cumulative distance summed over all the 5 min intervals. To calculate straight-line distance and heading, the shape of Earth was approximated with the WGS-84 reference ellipsoid (Decker, 1986).
2.4 Relationship between swimming behavior and independent variables
The predictor variables hypothesized to cause minke whales to change their swimming behavior included calling season, day of the year, hour of day, wind speed, their bimodal calling state (rapid or nominal), and distance to the nearest conspecific. Each 5 min section of the track was categorized as either nominal calling (three or fewer calls in the last 5 min), or rapid calling (more than 3 calls in the last 5 min). In practice, it was not difficult to categorize the calling state, as the two calling states had little overlap (see Figure 4 in Martin et al., 2022). Transitions between kinematic behavioral states were modeled as a function of these two calling states.
To test the effect of distance to the nearest calling conspecific, the transition probabilities between kinematic behavioral states were modeled as a function of the nearest calling conspecific in four categorical distances: 0–5 km, 5–10 km, 10–15 km, and 15+ km. The tracks and categorical distances in this study are identical to the those in Martin et al. (2022), and so the process for obtaining the distances is only summarized here. The map in Figure 1 shows a solid boxed rectangular area that represents the focal study area, and a larger dashed rectangular area that represents the total study area, which includes the focal area. For every localized and tracked call within the focal area, the closest localized call from another track in the larger total study area within the past 30 min was identified. The straight-line horizontal distance between the focal track’s call and the conspecific track’s call was measured; this was classified as the distance to the “nearest neighbor”. If there were no other tracks within the study area and 30 min time window, then the nearest neighbor for the focal track was assigned to the 15+ km category, as it was assumed that there were additional minke whales present outside the study area. We did not search for nearest neighbors beyond 15 km because the probability of detection beyond this distance may vary with noise conditions (Helble et al., 2020). By grouping nearest neighbor distances into categories, observations from all tracks in the focal area could be maintained without assuming an arbitrarily large nearest neighbor distance value for those localizations without a detectable nearest neighbor in the study area. The 5 km distance bins were chosen as they were small enough to see changes in kinematic behavior across distances, but large enough to ensure robust sample sizes with small confidence intervals for each category. For the HMM analysis, a nearest neighbor category was needed for each 5 min interval in the CRAWL tracks. We searched for the closest call in time along the same focal track and assigned that nearest neighbor category to the 5 min interval.
During initial analysis of the data, it was noted that there were very few instances of whales vocalizing within close distances to conspecifics. If whales are randomly distributed with respect to the focal animal, the probability that they would be in any given region is proportional to the area of that region. In the simple scenario where there are only two whales in a circular area of 15 km radius (a focal animal at the center and its nearest neighbor) the probability that the nearest neighbor is in a given range bin (0–5 km, 5–10 km, or 10–15 km) from the focal animal is
where and are the maximum and minimum radii of the bin, respectively. These predicted probabilities were multiplied by the total number of 5 min intervals in our dataset. In the more complex scenario where there are more than two whales within a 15 km radius, but the whales are still randomly distributed with respect to each other, then the probability of the nearest neighbor being closer will increase. However, if the whales actively avoid each other or cease calling at closer distances, then the number of vocally active whales as a function of distance would be less than expected due to chance. To test this hypothesis, we plotted the expected distribution of a single nearest neighbor as a function of distance and the measured distribution of nearest neighbors for the closest three categorical distances. Note that the 15+ km distance bin was not included in this analysis because the area in that bin is infinite. We also performed a chi-square goodness of fit test to determine if the differences between the expected and observed counts were significantly different.
To test the effect of various temporal variables, transition probabilities between kinematic behavioral states were modeled as a function of calling season (defined as the time from October–May across two calendar years when calling minke whales are recorded on PMRF), days since October 1 of each calling season (reset each calling season), and hour of day. An initial assessment of the dataset indicated that sunrise could be an important indicator for kinematic behavioral state, and so the hours of day were also binned into 4 categories — night, dawn, day, and dusk. For dawn and dusk categories, the bins were set to be 2 hours in length, centered at the time of sunrise and sunset, respectively, for the date the track occurred. Day was defined as the time between the sunrise and sunset categories, and night was defined as the time between the sunset and sunrise categories. Hour of the day was also modeled using a continuous circular function employing sine and cosine terms, assuming the whale kinematic behavior might have a circadian rhythm.
Transitions between kinematic behavioral states were also modeled as a function of estimated wind speed. Wind speed measurements in this area were not available, so, as a proxy, we used modeled ocean surface wind speeds (at 10 m elevation) with a 6 km spatial grid resolution (Hitzl et al., 2014; Hitzl et al., 2020). These wind speeds were averaged over the PMRF area every hour from October–May 2012–2017. Since the minke whale track analysis was done in 5 min intervals, the hourly wind speed closest in time was assigned to each 5 min interval. Wind speed delays, from no delay up to a 24 hour delay, were tested in 1 hour increments under the assumption that the minke whales might not be responding to present wind speeds, but rather the resulting changes in wave height and sea state caused by earlier wind speeds.
3 Results
Between August 2012 and July 2017, 2,245 individual minke whale tracks were observed in the total study area containing a total of 223,732 minke whale boings, from 599 days of acoustic recording effort on PMRF (recording effort and detections shown in Figure 3 of Martin et al., 2022). The 2,245 minke whale tracks were first analyzed by Martin et al. (2022), and the same tracks were used in this study for the nearest neighbor analysis. Of the 2,245 total tracks, 509 were located within the smaller focal area at least part of the time and are considered “focal tracks.” The subset of focal tracks contained 36,033 localized calls.
A manual review of 5% of the tracks was conducted by Martin et al. (2022), and so was not repeated for this study. The manual review process noted an average missed localization rate of 4.6%, and further analysis verified that this miss rate did not significantly affect the ability to identify periods of nominal or rapid calling. This missed localization rate is very low, and sporadically missed calls do not impact the overall track kinematics measured from the CRAWL model.
Minke whale spatial distributions were significantly different than would be expected if they were randomly distributed with respect to a focal animal (chi-square goodness of fit test, p<<0.001). Fewer 5 min intervals had calling conspecifics located within the first 10 km of a focal animal and more 5 min intervals had calling conspecifics located 10–15 km away from a focal animal than expected if the animal positions were not dependent on each other (Figure 2).
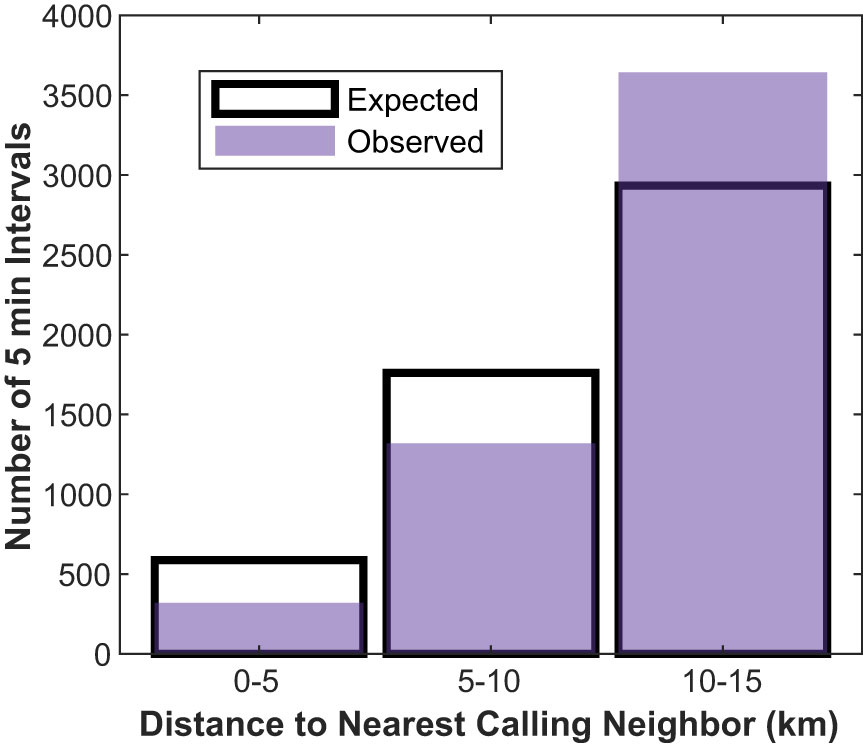
Figure 2 The observed (purple) and expected (black) spatial distributions of a nearest calling conspecific with respect to a focal animal, grouped into 5 km bins. The counts are in units of the number of 5 min intervals of the CRAWL tracks, aggregated over all seasons. Expected values were calculated assuming a random distribution of the nearest neighbor with respect to the focal animal (Equation 1).
Track kinematics were modeled for the portions of the 509 focal tracks that occurred within the focal study area. Overall, vocalizing minke whales on PMRF traveled along fairly direct paths with little turning (Figure 3). The whales favored traveling toward the west (circular mean of average track headings = 275.1°). The mean of the mean track speeds was 1.3 m/s with a standard deviation of 1.0 m/s. The median directivity index was 0.75 and the mode was between 0.9 and 1 (data bin width of 0.1 units, see histogram in Figure 3). Neither speed, heading, nor directivity index showed apparent trends as a function of days since October 1, but the relationship between whale swimming behavior and time was analyzed further with the HMMs.
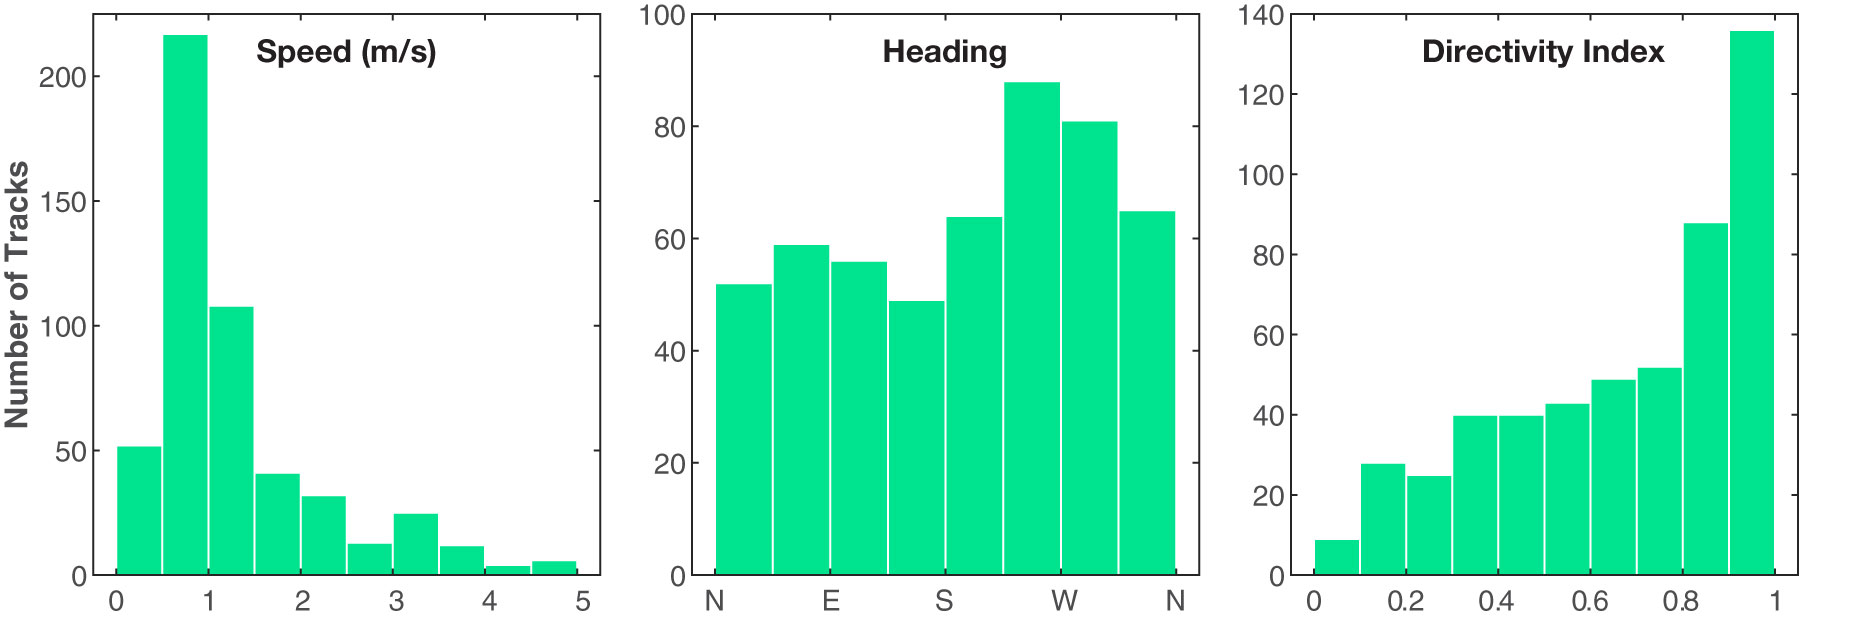
Figure 3 Histograms of the average speed (m/s), average heading, and directivity index (straight-line distance traveled divided by the total distance traveled) for each minke whale track.
The CRAWL tracks, spaced at even 5 min intervals, fit the original tracks well and, while infrequent, helped eliminate spurious localizations (Figure 4). Each of the 5 min intervals was categorized into kinematic behavioral state using the Viterbi algorithm, with 67% of the intervals categorized as the Slow State and 33% of the intervals categorized as the Faster State. The average speed for whales in the Slow State was 0.5 m/s and the average speed for whales in the Faster State was 1.9 m/s (Table 1 and Figure 5). These values were stable across all fitted models (less than 2% variability). The distribution of speed and turning angle for the two states can be seen in Figure 5. Three example tracks are shown in Figure 4 to illustrate the methods and are marked in black for the Slow State and blue for the Faster State. Because minke whale swimming behavior is complex, no three tracks can summarize the trends from all 509 focal tracks.
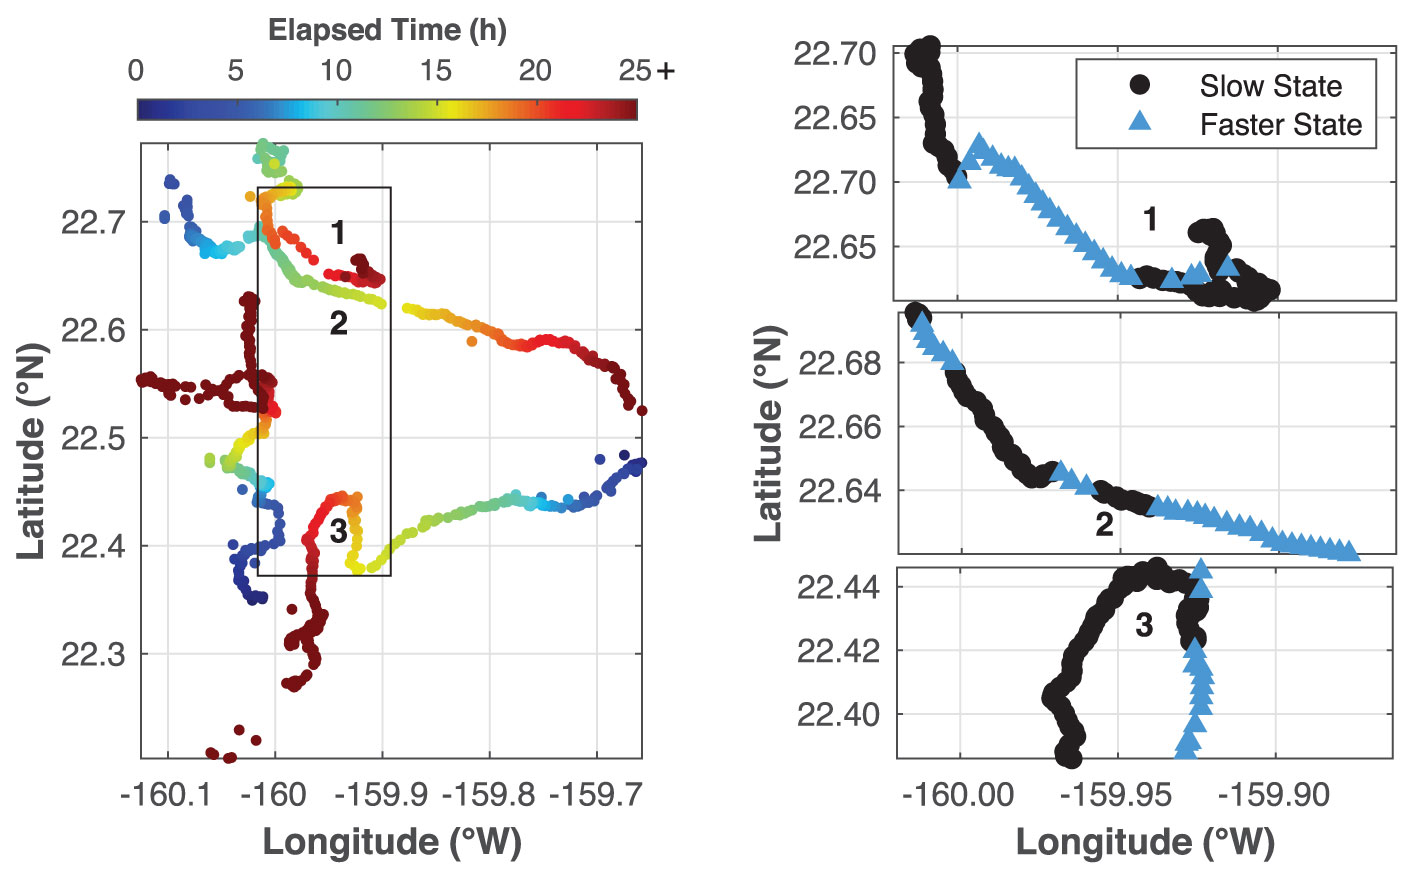
Figure 4 Four example minke whale tracks are shown using the original tracks (before CRAWL processing) for a 36 hour period as the whales traversed the range (left plot), with the boxed area indicating the focal study area. The sections of the tracks that are within the focal area are shown to the right for three of the tracks, with numbers 1–3 marking the three tracks in both plots. The west-most track is not shown in the right panel because the whale was moving in and out of the focal area. These positions are estimates of the original positions in evenly-spaced 5 min intervals derived from the CRAWL model with colors indicating kinematic state derived from the HMM model (“Slow State” in black and “Faster State” in blue).
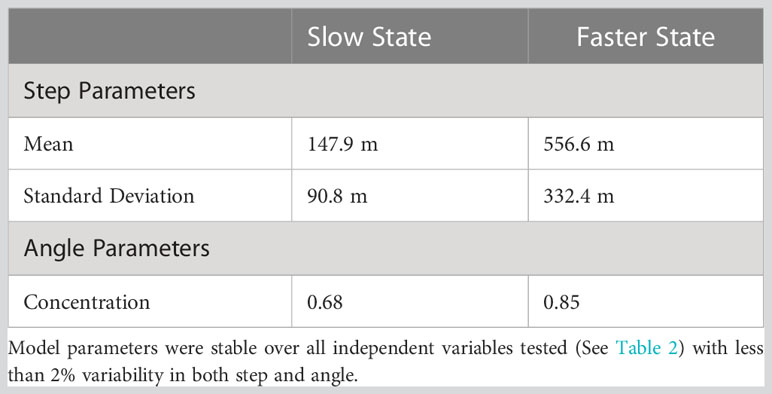
Table 1 Model parameters with 5 min steps for the delayed wind model (highest ranking AIC).
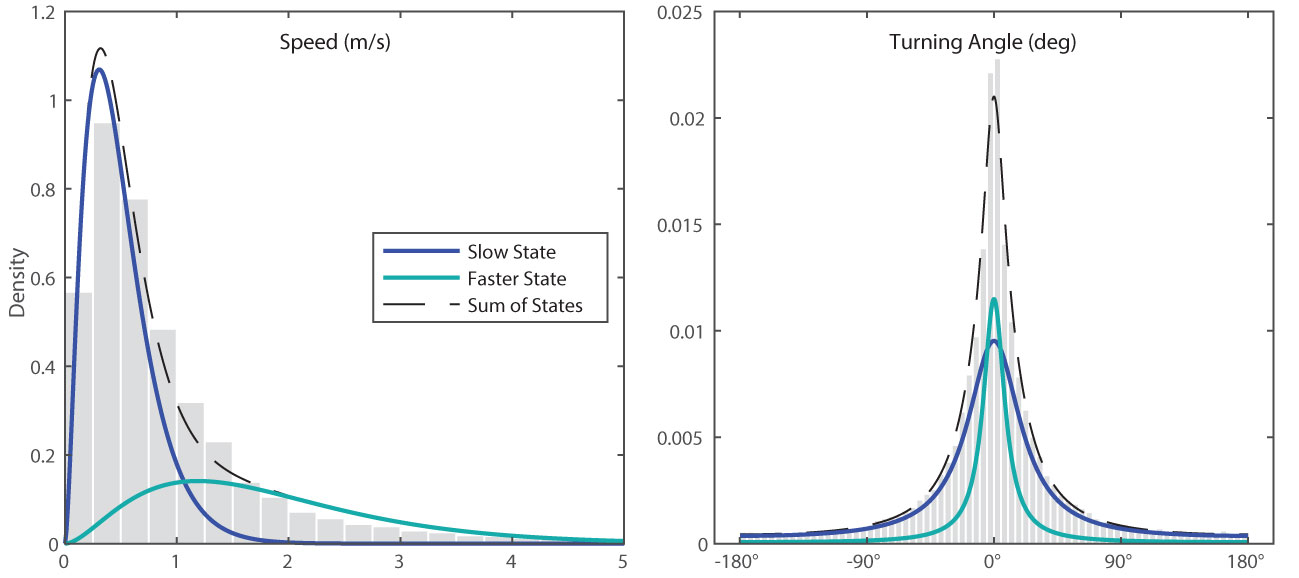
Figure 5 Distributions of the observed variables measured in 5 min intervals for the minke whale CRAWL tracks normalized by the probability density function. The gray histograms show the observed values normalized by the area of each bar, the blue curves show the probability density function of the Slow State, the teal curves show the probability density function of Faster State, and the black dashed lines show the sum of two states. The kinematic states were estimated using a hidden Markov model.
Six different independent variables were tested (with one variable tested two different ways) that we hypothesized might influence minke whale swimming behavior (Figure 6). The covariates tested in order of the AIC of each model were delayed wind speed, hour of day (categorical and continuous), calling state, calling season, distance to the nearest conspecific, and days since October 1 (Table 2). The number of days since October 1 had a Δ AIC of 1 compared to the null model and was therefore not explored further. The stationary state probability models for the six best models tested can be seen in Figure 7.
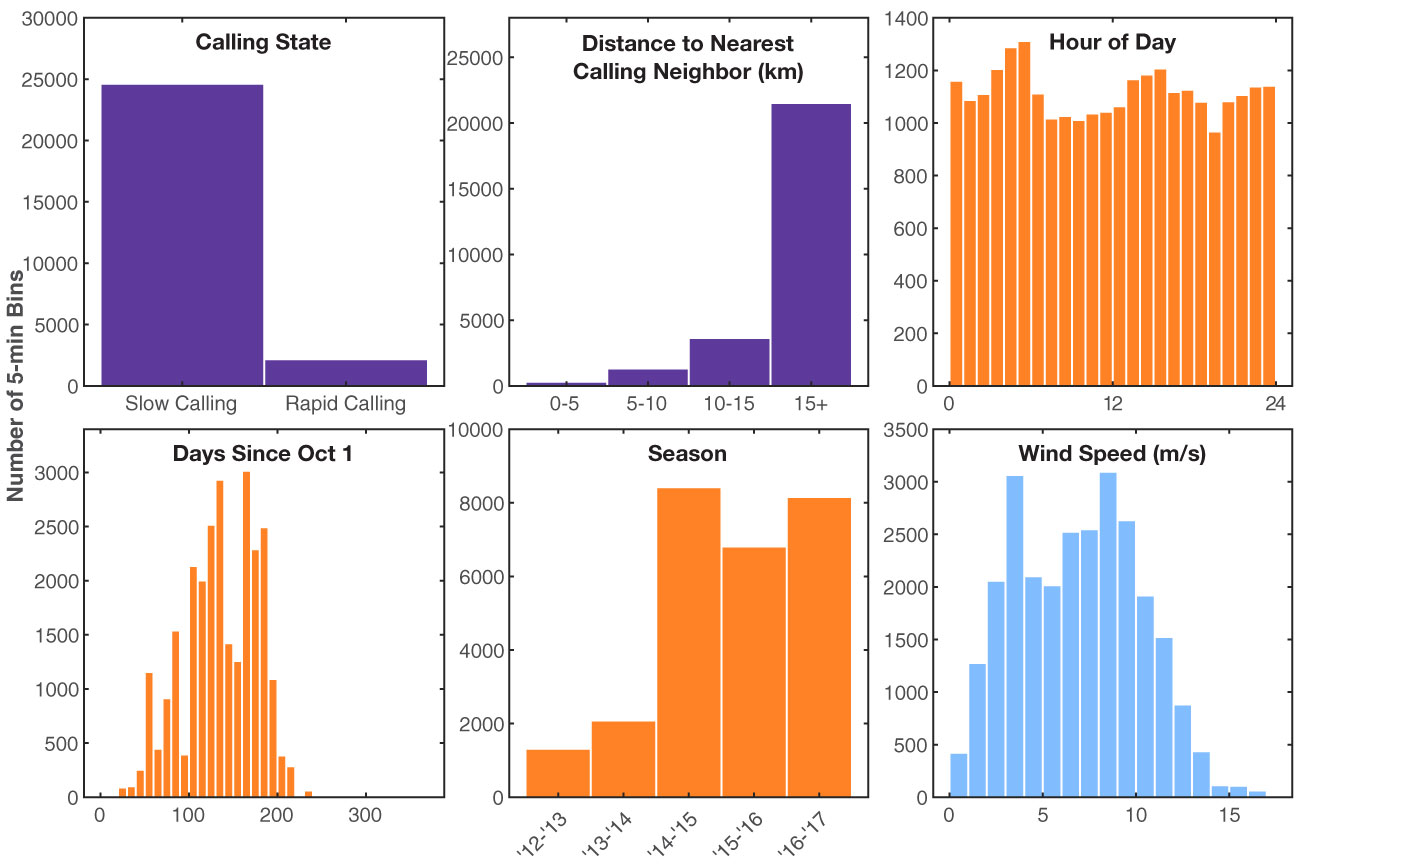
Figure 6 Histograms of the independent variables observed during minke whale tracks. The y-axis counts are the number of 5 min bins. Minke behavioral variables are shown in purple, time variables are shown in orange, and the environmental variable is shown in blue. Hour of day is in local Hawaii Standard Time.
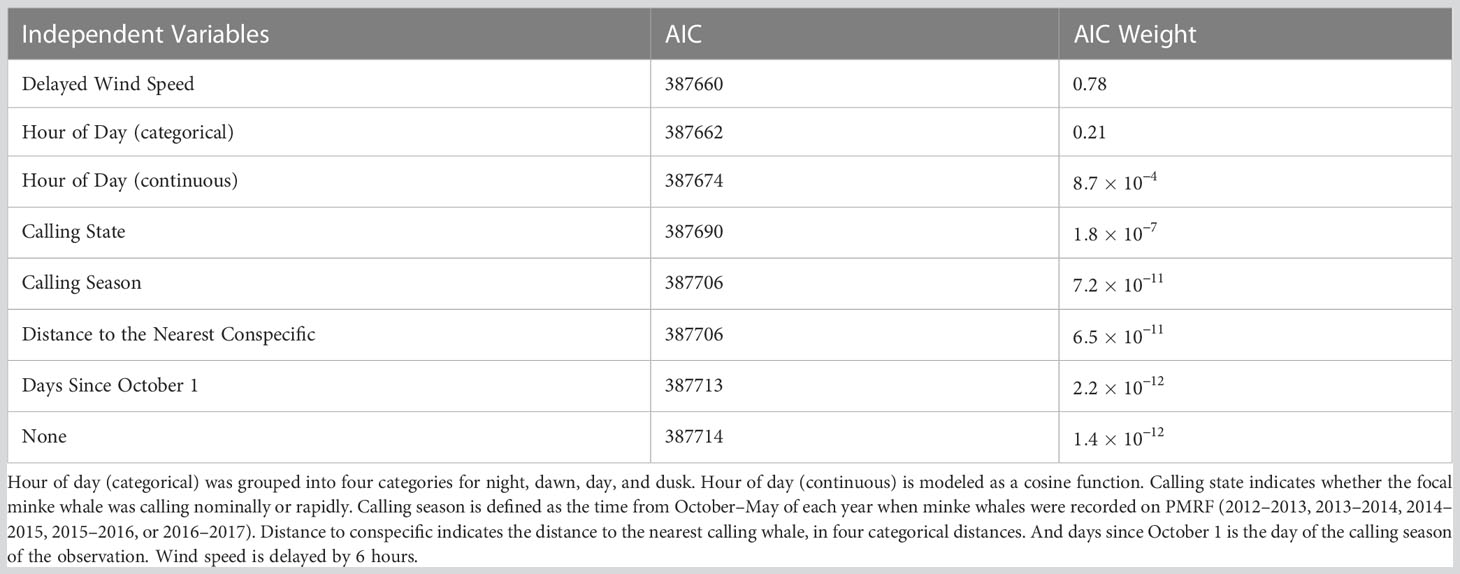
Table 2 Models used to explain vocalizing minke whale swimming behavior, ranked by the Akaike information criterion (AIC) and AIC weights.
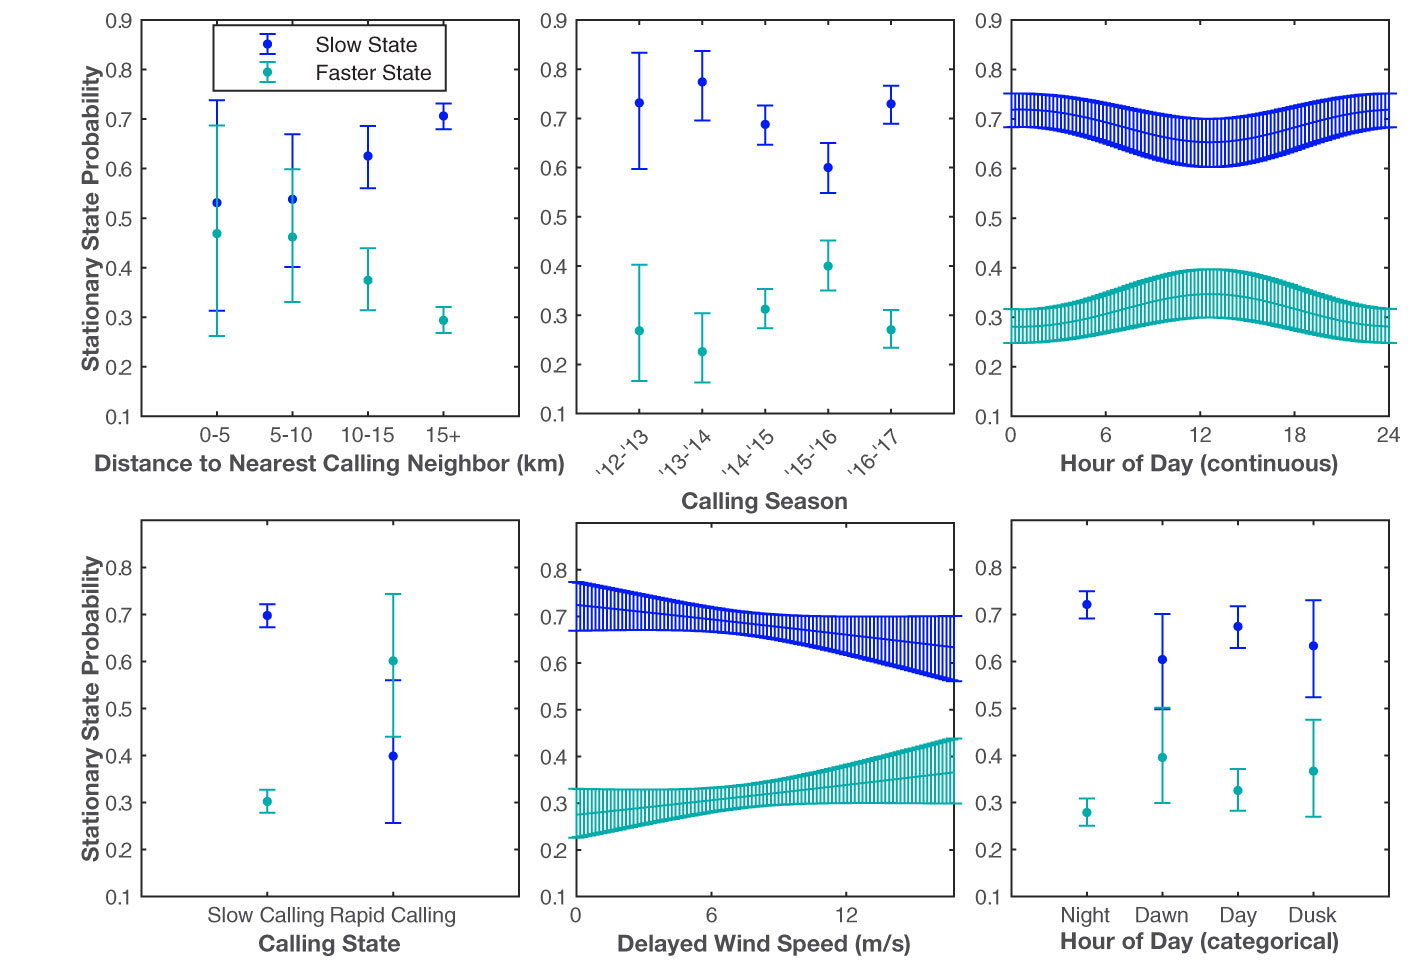
Figure 7 The probability of a 5 min observation being in the Slow State or the Faster State based on the independent variable tested. The blue and teal curves show the stationary state probabilities of the Slow State and the Faster State, respectively. The error bounds show the 95% confidence intervals.
The change in the stationary state probabilities as a function of the covariates tested was less pronounced for the temporal variables tested. There is a slight indication that whales may be more likely to swim slower at night, but the change in swimming behavior using the categorical method (Night, Dawn, Day, Dusk) was overall unremarkable. The model that used a cosine function with a period of 24 hours to model hour of day as a continuous variable was lower ranking (higher AIC score) than the model that used the categorical method, with little change in kinematic behavior over the 24 hour cycle. There was some variability in the minke whale kinematic state as a function of calling season, with the probability of 5 min observations in the Faster State being the greatest during the 2015–2016 calling season.
The change in the stationary state probability as a function of the environmental covariate tested was also minimal for the delayed wind speed, although the AIC score ranked the best of all the models tested. A wind speed time delay of 6 hours resulted in the model with the best AIC score. As the wind speed increased, the likelihood of a whale being in the Faster State increased slightly and the likelihood of a whale being in the Slow State decreased.
While the models with calling state and distance to the nearest conspecific ranked poorly according to AIC, the magnitude of the change in expected stationary state probabilities as a function of the covariates tested was the greatest for these two behavioral variables. If a minke whale was calling rapidly, the likelihood of it being in the Slow State decreased, and the likelihood of it being in the Faster State increased. As the distance to the nearest conspecific decreased, the likelihood of the focal animal being in the Slow State decreased and the likelihood of it being in the Faster State increased.
4 Discussion
The information presented in this study provides important baseline behavior useful for contextualizing effects of anthropogenic activity, which, on PMRF, is often due to Navy training and testing. Minke whale swimming speeds observed on PMRF were within the speed ranges reported when minke whales were undisturbed in feeding areas and along migratory pathways (Blix and Folkow, 1995; Heide-Jørgensen et al., 2001; Christiansen et al., 2014; Risch et al., 2014), however the data described here cover more time and include a larger sample size than the previous studies. The aggregated tracks were generally directional while whales transited the focal area of the range, and similar in directionality to minke whales that were presumed to be migrating in the western North Atlantic (Risch et al., 2014). However, directionality (and to some degree speed) comparisons should be approached with caution as they can also be biased by the size of the study area, sampling frequency, and the accuracy of localizations.
Durbach et al. (2021) analyzed minke whale kinematics at PMRF before, during, and after Navy MFAS activity during multiday training events in February 2014, 2015, and 2017 (3 of the 5 seasons from this analysis) using a similar framework. A Slow State (mean = 0.84 m/s), and a Fast State (mean = 2.36 m/s) were observed, with the Fast State occurring 75% of the time Navy sonar was active. For periods when sonar was not present during that study, the Slow State occurred approximately 67% of the time and the Fast State 33% of the time (Figure 3 in Durbach et al., 2021). These values from the limited time when sonar was not present in Durbach et al. (2021) were similar to the proportions of the two states found in our study, which contained tracks covering the full season of minke whale presence on PMRF when sonar was not present. The findings presented here therefore reinforce the initial findings by Durbach et al. (2021) suggesting that Navy sonar plays a crucial role in driving minke whales into a faster behavioral state. Martin et al. (2022) showed that minke whale calling state was strongly related to the distance to the closest calling conspecific. Specifically, minke whales were more likely to call rapidly when another vocalizing minke whale was nearby. We expanded on this previous study and found that the distance to the nearest calling conspecific and the focal minke whale’s calling state strongly influenced that minke whale’s kinematic state when tested independently. Whales calling rapidly had a 60% probability of being in the Faster State, and focal animals within 5 km of calling conspecifics had just under a 50% probability of being in the Faster State. However, neither of these scenarios reached the 75% probability of being in the Fast State during times of Navy sonar. While the Slow State observed in this study was slower than the Slow State of the sonar study (mean = 0.5 m/s versus 0.8 m/s), the difference between the Faster State in this study and the Fast State in the sonar study was even greater (mean = 1.9 m/s versus 2.4 m/s). Since these two studies were performed in the same region and during overlapping seasons, we are able to directly compare swimming behavior of acoustically active animals. Taken together, these results suggest the minke whales are both more likely to be in a faster behavioral state in the presence of MFAS, and, on average, swim even faster in that state compared to their undisturbed fast swimming behavior.
Ideally, the dataset collected before, during, and after MFAS transmissions described by Durbach et al. (2021) could be combined with the dataset presented here, allowing for models with more than two states to be evaluated in which the presence of Navy MFAS, temporal variables, environmental variables, and behavioral variables (e.g., information on the minke calling state and distance to the nearest conspecifics) could be included as both independent and interacting variables. For example, it is plausible that a 3-state model might be more representative of minke whale kinematic behavior — a slow, indirect movement when sonar or conspecifics are not present, a faster more directed movement in the presence of conspecifics, and a fast, avoidance behavior found in the presence of Navy sonar. However, there are significant challenges with evaluating the combined dataset. For example, to accurately measure distances to the nearest conspecific, the study area must be restricted to the focal study area shown in Figure 1. When Navy training occurs, this area is also where much of the Navy MFAS activity is centered, and minke whales calling in this region often go completely silent due to the close proximity of the sonar sources, while the whales that continue to vocalize move 20–50 km away from this area (Harris et al., 2019).
The research presented here combined with conclusions found in Martin et al. (2022) suggests that calling minke whales may be territorial, as they call rapidly when in close proximity to other calling conspecifics, and they also swim faster with more directional travel. This behavior is likely used in part to maintain spacing among calling individuals, as there were fewer observations of calling minke whales in close proximity to each other than would be expected by random distribution (Figure 2). Due to the limitations of passive acoustic observations, we cannot say for certain whether the whales in close proximity to one another call less often, move away from conspecifics, or some combination of the two. Regardless, the observed increase in speed and directionality at closer distances indicates that the whales are aware of other calling conspecifics and may change their kinematic behavior as a result of other whales’ behavior. Aside from establishing territory, the minke boing call could serve multiple purposes, and is also likely important for mating as discussed in detail in Martin et al. (2022).
Whale swimming behavior might vary from one season to the next. There was some evidence that the 2015–2016 season had a higher stationary state probability for the Faster State, indicating a larger proportion of 5 min observations were categorized as being in the Faster State. Our initial hypothesis was that the years with a greater proportion of time in the Faster State would be more likely to have higher densities of acoustically active minke whales, since the chances of whales being in closer proximity to one another would increase during times with more whales on the range. However, the acoustic densities were very similar across all observed years (Martin et al., 2023). Therefore, we do not have an explanation for the slight differences in the two behavioral states between calling seasons. While we were able to test six independent variables as predictors for behavioral state, there are countless other variables that likely influence swimming behavior between calling seasons.
Wind speed was not a strong indicator of the two behavioral states, but there was a slight preference for minke whales to swim faster with an increase in delayed wind speed. It is possible that higher wind speeds result in greater surface current speeds that could assist the whales in swimming faster. It is also possible that windier weather (and thus higher sea states) could motivate the minke whales into a faster behavioral state to limit the amount of time spent in these rougher open ocean conditions. An increase in wind speed also results in higher noise conditions in minke whale calling frequencies. Helble et al. (2020) demonstrated that minke whales increase their call source level in higher noise conditions but do not fully compensate for these conditions, effectively limiting the acoustic detection distances to conspecifics. Perhaps minke whales take a more defensive posture by swimming faster and more directional when their acoustic space is limited.
Models in which state transition probabilities depended on either delayed wind speed or hour of day (categorical) ranked higher by AIC (78% and 21% AIC weights respectively), but inspection of the effect of covariates on the probability of being in either movement state (Figure 7) suggested that the magnitude of these effects was fairly weak, and less than the magnitude of the effect of distance to nearest calling neighbor and calling state, even though they had less AIC support. This disparity occurs because although whales are more likely to be in the Faster movement state while rapid calling or if calling conspecifics are nearby, the number of observations where this happens is dwarfed by the more common conditions (nominal calling rate, no calling conspecifics nearby, Figure 6). The AIC is calculated from the likelihood of the observed data (i.e. the step lengths and turning angles of all whales), with each observation contributing towards the likelihood. Covariates that influence behavior but only affect a small number of observations, may cause relatively little improvement in the likelihood, and so be unattractive from the perspective of model selection criteria like the AIC.
In comparison to fin whales (Balaenoptera physalus), which are present on the PMRF range during the same time of year, minke whales had similar average speeds but their speed distribution had a stronger right tail (Guazzo et al., 2021). As a result, the faster state for the minke whales (mean speed of 1.9 m/s) was faster than the fast state for the fin whales (mean speed of 1.5 m/s) when using the same statistical methods (Guazzo et al., 2021). Both species favored traveling toward the west, which has also been observed with Bryde’s whales (Balaenoptera edeni) and humpback whales (Megaptera novaeangliae) in Hawaiian waters (Baker and Herman, 1981; Helble et al., 2016; Guazzo et al., 2021; Henderson et al., 2022). Fin whale kinematic state was also related to calling rate, but fin whales were more likely to be in a slow swimming state when they were calling at a faster rate, while minke whales were more likely to be in a faster swimming state when they were calling rapidly. Clark et al. (2019) speculated that higher cue rates were more energetically expensive for fin whales. We would expect that the energetic expense of calling would be similar for minke whales and fin whales since they are closely related, although they do have very different call types and calling rates. Since we do not see the same pattern, we hypothesize that either vocalizing is less energetically expensive than suggested, or calling rapidly is so important for minke whales that they do it despite the cost. More work should be done investigating the relationship between cue rate, swimming speeds, and energetic costs in other species and in other areas.
The PMRF range is a unique study location that allows for tracking vocally active marine mammals with high effort through all seasons and over a large (∼70×45 km) area. However, we are unable to study how whales behave when they are not vocally active. Since some species make sex-specific calls, tracking only vocally active whales may eliminate a whole demographic of whales. Other researchers have used biologging tags to measure kinematic and acoustic behavior of whales. In a recent study, Casey et al. (2022) tagged 16 Antarctic minke whales (Balaenoptera bonaerensis) with video logging tags and investigated the relationship between vocalizations and whale behavior. These Antarctic minke whales were producing certain calls more commonly during daytime versus nighttime, when foraging versus non-foraging, and when in visual distance from other conspecifics versus when conspecifics were not visible (Casey et al., 2022). Unlike the passive acoustic tracking at PMRF, these tags allowed for capturing behavior of whales regardless of their vocalization state and observing conspecifics even if they were not vocalizing. However, tagging studies have much smaller sample sizes and are generally performed during good weather. In addition, since sound travels much farther than light underwater, whales are likely influenced by conspecifics at a much greater range than what can be captured on video. Passive acoustic tracking and tagging allow for the investigation of different questions and so both of these methods can complement each other when trying to better understand these protected marine species.
In conclusion, the PMRF range provides a unique opportunity to measure minke whale kinematic behavior with much larger sample sizes than any previous study. Although these swimming speeds are within the same range as swimming speeds reported previously, the sample size and spatial and temporal coverage included in this analysis have likely now established a distribution of swim speeds for vocalizing and undisturbed minke whales. Despite our large study area and sample size, rapid calling and close encounters between minke whales were rare and could be easily missed with fewer observations. Evidence presented here suggests that these behaviors could be rare because vocalizing minke whales actively maintain greater distances from one another than if they were randomly distributed on the range. Minke whales were more likely to swim faster and more directional when they were calling rapidly or in close proximity to other calling conspecifics. However, the increase in swimming speeds during these scenarios occurred less often and with less intensity than the increase in speeds observed during Navy MFAS exposure. While they were significant from the standpoint of model selection criteria, the environmental and time variables tested were associated with smaller changes in stationary state probabilities than the behavioral variables tested (calling state and distance to nearest calling conspecific). Minke whale swimming behavior is complex and undoubtedly influenced by many variables that we were unable to investigate. However, this study provides important baseline behavior useful for contextualizing the effects of anthropogenic activity and can be used as a model for investigating baseline behavior in other species.
Data availability statement
The datasets presented in this study can be found in online repositories. The names of the repository/repositories and accession number(s) can be found below: https://seamap.env.duke.edu/dataset/2190.
Ethics statement
Ethical review and approval was not required for the animal study because this study was conducted using passive acoustic monitoring of wild animals with underwater microphones (i.e. hydrophones) and has no impact on animals’ lifecycle.
Author contributions
CM, SM, and EH collected the data. GA processed the data. SM developed the initial tracking algorithm and CM tuned the tracking algorithm for minke whale boings. TH, RG, and ID wrote the R-code necessary for the HMM statistical analysis. TH and RG analyzed the data. TH, RG, and EH wrote the draft manuscript. TH, RG, ID, CM, GA, SM, and EH discussed the results and contributed to the final manuscript. All authors contributed to the article and approved the submitted version.
Funding
This research was supported by the Office of Naval Research (Code 322, Award Number N0001422WX01263), Commander, U.S. Pacific Fleet (Code N465JR, Award Number N0007023WR0EP8F), and tool development necessary for this analysis was supported by the U.S. Navy’s Living Marine Resources Program (Award Number N0002520WR0141R).
Acknowledgments
The authors would like to thank Yi-Leng Chen and Feng Hsiao who provided the modeled wind speeds. The authors thank the personnel at PMRF, especially Eliseo Boloson, Mike Dick, Jim Hager, Robin Higuchi, Bryson Kurokawa, Jon Winsley, and Jeffrey Yates, for obtaining recordings of acoustic data, as without the acoustic data this type of analysis would not be possible.
Conflict of interest
Although the primary analysis for this paper used data collected during the absence of U.S. Navy training, we discuss the similarities and differences between the behaviors during our time periods and time periods with Navy sonar. TH, RG, CM, and EH are Navy employees and GA and SM are Navy contractors. All funding for this research came from the U.S. Navy.
The remaining author declares that the research was conducted in the absence of any commercial or financial relationships that could be construed as a potential conflict of interest.
Publisher’s note
All claims expressed in this article are solely those of the authors and do not necessarily represent those of their affiliated organizations, or those of the publisher, the editors and the reviewers. Any product that may be evaluated in this article, or claim that may be made by its manufacturer, is not guaranteed or endorsed by the publisher.
References
Akaike H. (1974). A new look at the statistical model identification. IEEE Trans. Automatic. Control. 19, 716–723. doi: 10.1109/tac.1974.1100705
Bacheler N. M., Michelot T., Cheshire R. T., Shertzer K. W. (2019). Fine-scale movement patterns and behavioral states of gray triggerfish Balistes capriscus determined from acoustic telemetry and hidden Markov models. Fish. Res. 215, 76–89. doi: 10.1016/j.fishres.2019.02.014
Baker C. S., Herman L. M. (1981). Migration and local movement of humpback whales (Megaptera novaeangliae) through Hawaiian waters. Can. J. Zool. 59, 460–469. doi: 10.1139/z81-067
Blix A. S., Folkow L. P. (1995). Daily energy expenditure in free living minke whales. Acta Physiol. Scand. 153, 61–66. doi: 10.1111/j.1748-1716.1995.tb09834.x
Burnham K. P., Anderson D. R. (2002). Model selection and multimodal inference. 2 edn (Springer-Verlag New York). doi: 10.1007/b97636
Casey C. B., Weindorf S., Levy E., Linsky J. M. J., Cade D. E., Goldbogen J. A., et al. (2022). Acoustic signalling and behaviour of Antarctic minke whales (Balaenoptera bonaerensis). R. Soc. Open Sci. 9, 211557. doi: 10.1098/rsos.211557
Christiansen F., Rasmussen M. H., Lusseau D. (2014). Inferring energy expenditure from respiration rates in minke whales to measure the effects of whale watching boat interactions. J. Exp. Mar. Biol. Ecol. 459, 96–104. doi: 10.1016/j.jembe.2014.05.014
Clark C. W., Gagnon G. J., Frankel A. S. (2019). Fin whale singing decreases with increased swimming speed. R. Soc Open Sci. 6, 180525. doi: 10.1098/rsos.180525
Decker B. L. (1986). “World geodetic system 1984,” in Presented at fourth international geodetic symposium on satellite positioning (Austin, Texas).
Durbach I. N., Harris C. M., Martin C., Helble T. A., Henderson E. E., Ierley G., et al. (2021). Changes in the movement and calling behaviour of minke whales (Balaenoptera acutorostrata) in response to navy training. Front. Mar. Sci. 8. doi: 10.3389/fmars.2021.660122
Ford J. K. B., Ellis G. M., Matkin D. R., Balcomb K. C., Briggs D., Morton A. B. (2005). Killer whale attacks on minke whales: prey capture and antipredator tactics. Mar. Mamm. Sci. 21, 603–618. doi: 10.1111/j.1748-7692.2005.tb01254.x
Guazzo R. A., Durbach I. N., Helble T. A., Alongi G. C., Martin C. R., Martin S. W., et al. (2021). Singing fin whale swimming behavior in the central North Pacific. Front. Mar. Sci. 8. doi: 10.3389/fmars.2021.696002
Harris C. M., Martin S. W., Martin C., Helble T. A., Henderson E. E., Paxton C. G. M., et al. (2019). Changes in the spatial distribution of acoustically derived minke whale (Balaenoptera acutorostrata) tracks in response to navy training. Aquat. Mamm. 45, 661–674. doi: 10.1578/am.45.6.2019.661
Heide-Jørgensen M. P., Nordøy E. S., Øien N., Folkow L. P., Kleivane L., Blix A. S., et al. (2001). Satellite tracking of minke whales (Balaenoptera acutorostrata) off the coast of northern Norway. J. Cetacean. Res. Manage. 3, 175–178.
Helble T. A., Guazzo R. A., Martin C. R., Durbach I. N., Alongi G. C., Martin S. W., et al. (2020). Lombard Effect: minke whale call source levels vary with natural variations in ocean noise. J. Acoust. Soc Am. 147, 698–712. doi: 10.1121/10.0000596
Helble T. A., Henderson E. E., Ierley G. R., Martin S. W. (2016). Swim track kinematics and calling behavior attributed to Bryde’s whales on the Navy’s Pacific Missile Range Facility. J. Acoust. Soc Am. 140, 4170–4177. doi: 10.1121/1.4967754
Helble T. A., Ierley G. R., D’Spain G. L., Martin S. W. (2015). Automated acoustic localization and call association for vocalizing humpback whales on the Navy’s Pacific Missile Range Facility. J. Acoust. Soc. Am. 137, 11–21. doi: 10.1121/1.4904505
Henderson E. E., Deakos M., Aschettino J., Englehaupt D., Alongi G. (2022). Behavior and inter-island movements of satellite-tagged humpback whales in Hawai’i, USA. Mar. Ecol. Prog. Ser. 685, 197–213. doi: 10.3354/meps13976
Hitzl D. E., Chen Y.-L., Hsiao F. (2020). Wintertime easterly and southeasterly airflow in the ‘Alenuihāhā channel, Hawaii. Mon. Wea. Rev. 148, 1337–1362. doi: 10.1175/mwr-d-19-0042.1
Hitzl D. E., Chen Y.-L., Nguyen H. V. (2014). Numerical simulations and observations of airflow through the ‘Alenuihāhā channel, Hawaii. Mon. Wea. Rev. 142, 4696–4718. doi: 10.1175/mwr-d-13-00312.1
Johnson D. S., London J. M., Lea M.-A., Durban J. W. (2008). Continuous-time correlated random walk model for animal telemetry data. Ecology 89, 1208–1215. doi: 10.1890/07-1032.1
Klay J., Mellinger D. K., Moretti D. J., Martin S. W., Roch M. A. (2015) Advanced methods for passive acoustic detection, classification, and localization of marine mammals (Arlington, VA: Tech. rep., Office of Naval Research). Available at: https://www.onr.navy.mil/reports/FY15/mbklay.pdf (Accessed 22 January 2020).
Kvadsheim P. H., DeRuiter S., Sivle L. D., Goldbogen J., Roland-Hansen R., Miller P. J. O., et al. (2017). Avoidance responses of minke whales to 1–4 kHz naval sonar. Mar. pollut. Bull. 121, 60–68. doi: 10.1016/j.marpolbul.2017.05.037
Langrock R., King R., Matthiopoulos J., Thomas L., Fortin D., Morales J. M. (2012). Flexible and practical modeling of animal telemetry data: hidden Markov models and extensions. Ecology 93, 2336–2342. doi: 10.1890/11-2241.1
Martin C. R., Guazzo R. A., Helble T. A., Alongi G. C., Durbach I. N., Martin S. W., et al. (2022). Minke whales call rapidly when calling conspecifics are nearby. Front. Mar. Sci. 9. doi: 10.3389/fmars.2022.897298
Martin C. R., Henderson E. E., Martin S. W., Alongi G. A., Guazzo R. A., Helble T. A., et al. (2023). FY22 annual report on pacific missile range facility marine mammal monitoring (San Diego, CA: Technical report, Naval Information Warfare Center Pacific).
Martin S. W., Martin C. R., Matsuyama B. M., Henderson E. E. (2015). Minke whales (Balaenoptera acutorostrata) respond to navy training. J. Acoust. Soc Am. 137, 2533–2541. doi: 10.1121/1.4919319
McClintock B. T., Michelot T. (2018). momentuHMM: R package for generalized hidden Markov models of animal movement. Methods Ecol. Evol. 9, 1518–1530. doi: 10.1111/2041-210x.12995
Rankin S., Barlow J. (2005). Source of the North Pacific “boing” sound attributed to minke whales. J. Acoust. Soc Am. 118, 3346–3351. doi: 10.1121/1.2046747
R Core Team (2020). R: A language and environment for statistical computing (Vienna, Austria: R Foundation for Statistical Computing). Available at: https://www.R-project.org/.
Risch D., Siebert U., Van Parijs S. M. (2014). Individual calling behaviour and movements of North Atlantic minke whales (Balaenoptera acutorostrata). Behaviour 151, 1335–1360. doi: 10.1163/1568539x-00003187
Southall B. L., Moretti D., Abraham B., Calambokidis J., DeRuiter S. L., Tyack P. L. (2012). Marine mammal behavioral response studies in southern California: advances in technology and experimental methods. Mar. Technol. Soc. J. 46, 48–59. doi: 10.4031/mtsj.46.4.1
Southall B. L., Nowacek D. P., Miller P. J. O., Tyack P. L. (2016). Experimental field studies to measure behavioral responses of cetaceans to sonar. Endanger. Species. Res. 31, 293–315. doi: 10.3354/esr00764
Thompson P. O., Friedl W. A. (1982). A long term study of low frequency sounds from several species of whales off Oahu, Hawaii. Cetology 45, 1–19.
Keywords: minke whale (Balaenoptera acutorostrata), kinematics, swimming speed, behavior, boing vocalization, Navy sonar, passive acoustic monitoring, marine ecology
Citation: Helble TA, Guazzo RA, Durbach IN, Martin CR, Alongi GC, Martin SW and Henderson EE (2023) Minke whales change their swimming behavior with respect to their calling behavior, nearby conspecifics, and the environment in the central North Pacific. Front. Mar. Sci. 10:1148987. doi: 10.3389/fmars.2023.1148987
Received: 20 January 2023; Accepted: 13 March 2023;
Published: 11 April 2023.
Edited by:
Rebecca Dunlop, The University of Queensland, AustraliaReviewed by:
Ilse Catharina Van Opzeeland, Alfred Wegener Institute Helmholtz Centre for Polar and Marine Research (AWI), GermanyDavid Moretti, Naval Undersea Warfare Center (NUWC), United States
Copyright © 2023 Helble, Guazzo, Durbach, Martin, Alongi, Martin and Henderson. This is an open-access article distributed under the terms of the Creative Commons Attribution License (CC BY). The use, distribution or reproduction in other forums is permitted, provided the original author(s) and the copyright owner(s) are credited and that the original publication in this journal is cited, in accordance with accepted academic practice. No use, distribution or reproduction is permitted which does not comply with these terms.
*Correspondence: Tyler A. Helble, dHlsZXIuYS5oZWxibGUuY2l2QHVzLm5hdnkubWls