 Yebao Wang
 Peipei Du
 Baijing Liu3
- 1School of Ocean, Yantai University, Yantai, China
- 2Institute of Agricultural and Rural Modernization, Weifang University, Weifang, China
- 3School of Resources and Environmental Engineering, Ludong University, Yantai, China
The protection of coastal tourist attractions under oil spill stress requires a more detailed vulnerability assessment approach. In this study, an assessment model for estimating the vulnerability of coastal tourist attractions to oil spills along the Bohai Sea’s coastlines was developed, natural environmental and socioeconomic data were collected, and a geographic information system (GIS) was used. As many as 26 factors were selected for the vulnerability analysis of typical tourist destinations in the littoral area. All of the factors were grouped into different categories according to a pressure-state-response (PSR) framework (pressure parameters, state parameters, and response parameters), and a different rank of importance was assigned to each factor via the analytical hierarchy process. The comprehensive analysis results were calculated and visualized using GIS. The results show that the state and response together strongly affected the vulnerability of the various coastal tourist attractions, while the pressure had less effect on the vulnerability. There were obvious spatial variations among the different coastal tourist destinations. Overall, the coastal tourist attractions surrounding the Bohai Sea were characterized by a high oil spill pressure, high sensitivity, low emergency response capabilities, and high vulnerability. This study provides a reference for vulnerability assessment of tourist destinations under oil spill stress, provides a scientific decision-making basis for the protection of coastal tourist destinations, and is conducive to promoting the healthy development of the coastal tourism industry.
1 Introduction
There is a huge environmental pollution risk from spilled oil in coastal zones because of the various exploration, production, refining, and transportation activities that are taking place all over the world (Bhardwaj and Bhaskarwar, 2018; Zhang et al., 2019). Although the amount of oil spilled is declining under the background of the increasing world oil trade volume in recent years (Chen et al., 2019), the risk posed by oil spills continuously persists (Mittal et al., 2021). Thus, the environmental, human health, and socioeconomic consequences caused by spills cannot be ignored, and efficient prevention and mitigation measures are greatly needed.
Effective risk management such as emergency plans is an important guarantee for oil spill prevention and mitigation. As an indicator to measure the degree to which a system is susceptible to and is unable to cope with adverse effects (McCarthy et al., 2001), vulnerability has been prevalently used in many research fields such as development economics, disaster-related studies, and climate change-related studies (Bera et al., 2019). When planning an oil spill response, the assessment of the oil spill vulnerability is a fundamental issue as it is one of the key components of risk determination (Castanedo et al., 2009). Hence, to mitigate oil spill hazards, it is necessary to assess the vulnerability of the disaster-prone coastal environments under oil spill stress (Nelson et al., 2018) as coastal areas have been the most affected by oil spills historically.
Scholars began to analyze the vulnerability of the coastal areas under the threat of oil spills a long time ago (Gundlach and Hayes, 1978). Until recently, related research has remained an active topic in the field of oil spill research, and it has played an important role in the protection of coastal areas in different regions (Fattal et al., 2010; Singkran, 2013; Balogun et al., 2021; Câmara et al., 2021). Various industries in coastal areas have been adversely affected by marine oil spills historically, such as fisheries, recreation facilities, shipping, and agriculture. One of the most noticeable and widely scrutinized effects of oil pollution is its influence on tourist attractions (Garza-Gil et al., 2006).
As one of the largest and fastest growing economic sectors in the world (Meyer and Meyer, 2015), the revenue from the tourism industry contributes positively to the growth rate of the gross domestic product (GDP) per capita (Sokhanvar et al., 2018). Coastlines receive millions of visitors every year all over the world for recreational activities such as swimming and surfing. In China, coastal tourism has progressively become a focus of growth in its marine economic development. In 2021, the added value of China’s coastal tourism industry was 1529.7 billion Chinese yuan (CNY) (MNR, 2021). In addition, some coastal attractions have significant ecological value and are vulnerable to oil spills. Therefore, it is of great significance to understand the vulnerability of the coastal tourist attractions under oil spill stress. Related research has received extensive attention from researchers (Student et al., 2020; Yu et al., 2021).
However, vulnerability is a fuzzy concept and lacks a universal framework or definition (Pelling, 2003). In this context, the indicator system is currently the most widely used method in vulnerability assessment. In this method, representative indicators are selected to form an indicator system, weights are assigned to the factors, and finally, a vulnerability assessment model is constructed to measure the vulnerability of regions facing disaster-causing events.
The purpose of this study was to describe a methodological framework for vulnerability assessment of the coastal attractions under oil spill stress in detail to support the sustainable development of coastal tourism. A vulnerability assessment model for coastal tourist attractions was developed based on an integrated framework of pressure-state-response (PSR), and the Bohai Sea, China, was taken as a case study. The model was then used to identify the spatial differences in the vulnerability of the coastal tourist attractions surrounding the Bohai Sea. The results of this study provide a basis for scientific decision-making to support oil spill prevention and mitigation.
2 Data and methods
2.1 Study area
The Bohai Sea is a semi-enclosed sea and is connected to the open sea by the Bohai Strait. The north, west, and south sides are adjacent to Liaoning Province, Hebei Province, and Tianjin Municipality and Shandong Province, respectively. Due to the busy maritime transportation and intensive oil exploitation, the Bohai Sea area has been deeply troubled by oil spill accidents, and the oil spill risk in this area has also been of continuing concern to researchers (Yu et al., 2018; Guo et al., 2019). To respond to spill accidents as quickly as possible, the Bohai Sea has been divided into seven response zones by the Maritime Safety Administration (MSA). For ease of description, these regions are numbered 1 through 7 in this paper (Figure 1A). In addition, the Bohai Sea is densely covered with various tourism resources, and thus, these coastal tourist attractions are vulnerable to the threat of oil spill disasters.
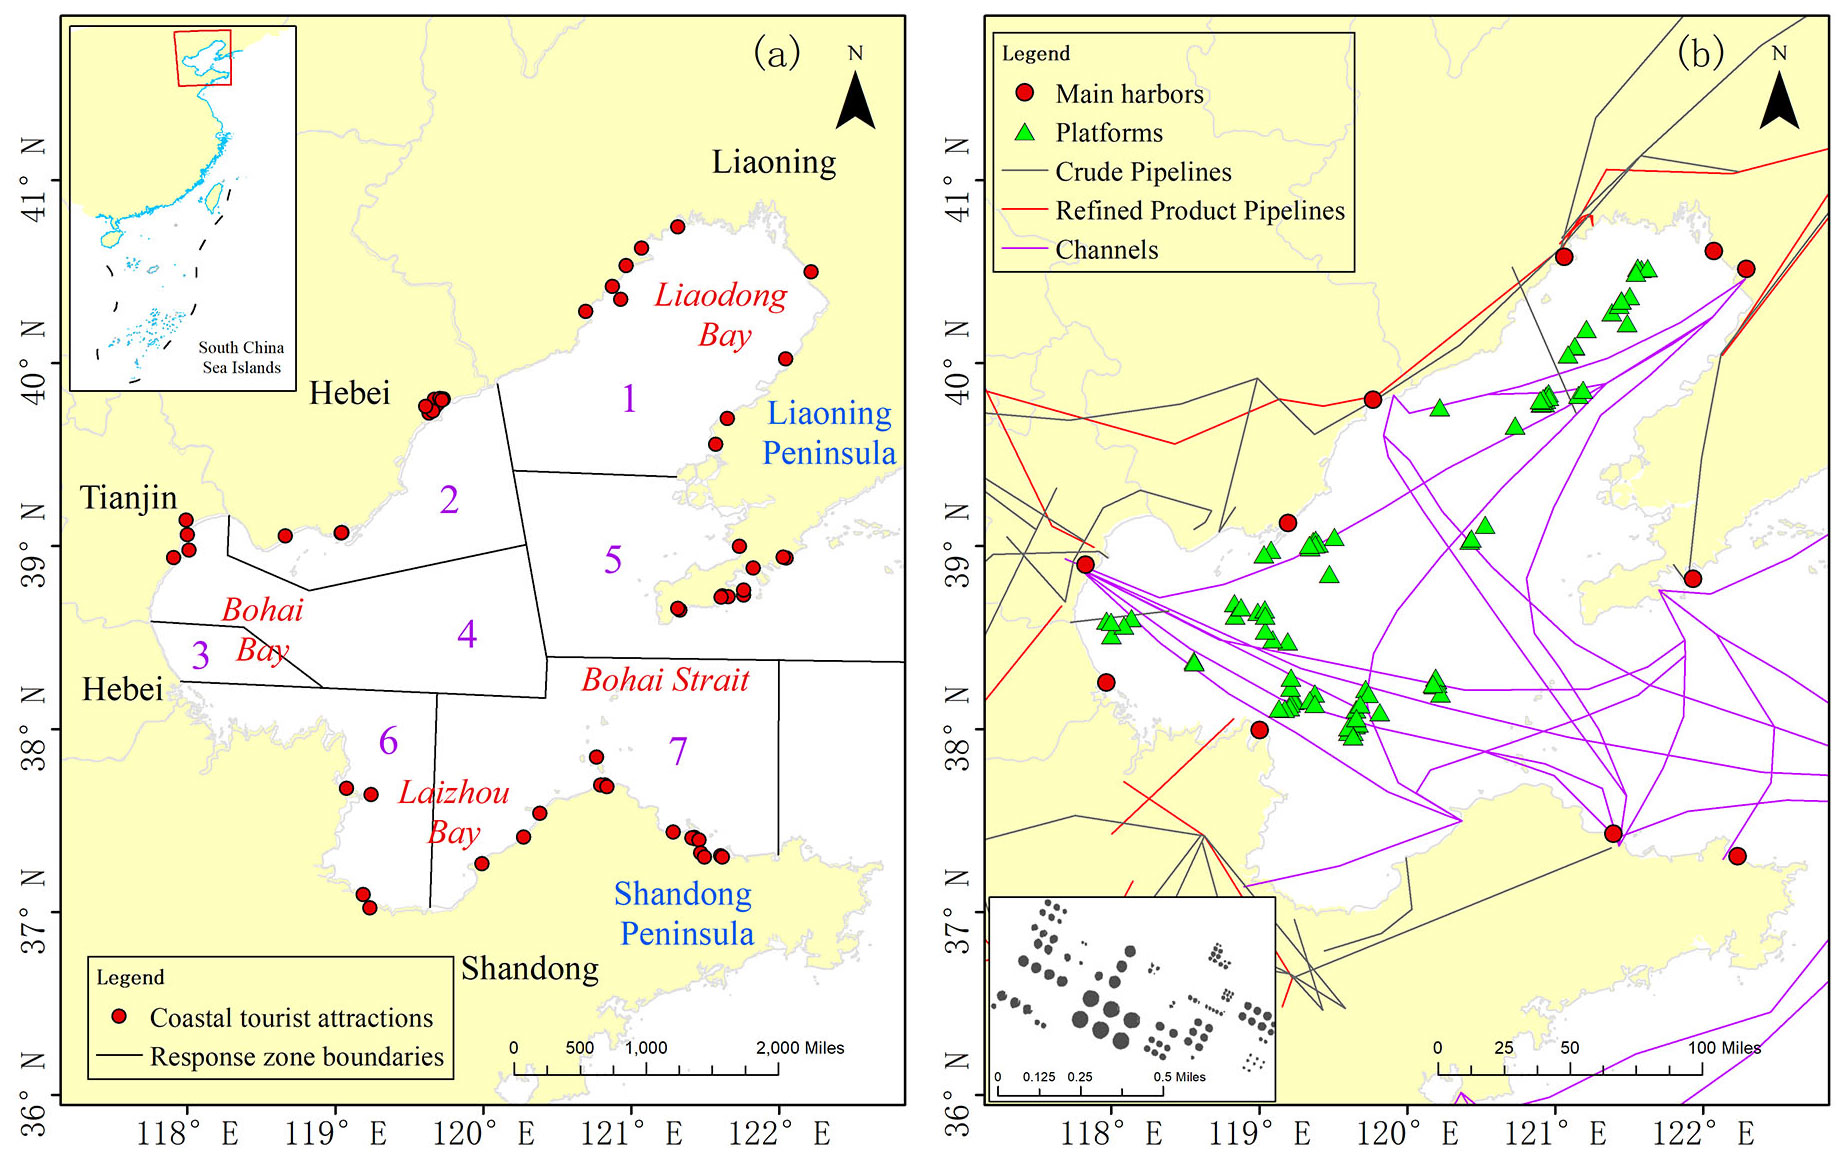
Figure 1 (A) Map showing the locations of the Bohai Sea and coastal tourist attractions. (B) The sources of the oil spill risk within and around the Bohai Sea. Some of the selected oil tanks in Tianjin Port are shown in the lower left corner of the image. The amount of ship data information is too large and would cover the other information, so it is not shown here.
The tourist attractions in China were divided into five levels according to their quality, from high to low: 5A, 4A, 3A, 2A, and 1A. Among them, level 5A is the highest level, and it represents China’s world-class boutique tourist attractions. Since the Ministry of Culture and Tourism of China (MCT) implemented dynamic management for tourist attractions above level 1A, the adjustment has changed irregularly, and the MCT does not announce the list of adjustments, which created difficulties in our statistical analysis. Advantageously, the local bureau of culture and tourism announces their local tourist attractions above level 1A on their official website for the convenience of tourists who intend to visit. In this study, all 65 publicly available coastal tourist attractions above level 1A were compiled by visiting the website of each local culture and tourism bureau of Liaoning Province, Hebei Province, Tianjin Municipality, and Shandong Province. Furthermore, the obtained data were verified using Google Maps, and the locations of the tourist attractions were plotted on the map (Figure 1A). Since the data from the local official websites were updated from time to time, and there was no unified time for updating, the most recently released data were used to conduct the statistical analysis.
2.2 Assessment indices
The PSR framework was first proposed by Canadian researchers in the 1970s, and then was used to explain the interactions between multiple factors. In the PSR model, the pressure (P) usually represents the damage to and disturbance of the system by external factors, the state (S) represents the current state of the system under pressure, and the response (R) is the action taken by the system when it faces risk and pressure. In the context of this study, the fundamental principle of the PSR model is that human activities related to oil exert a negative influence (pressure) on the environment. In response to pressure, the stakeholders take action to respond, which in turn, reduces the pressure and changes the state of the environment (Lu et al., 2022). In this study, based on a PSR vulnerability assessment framework, the assessment indicators were decomposed into pressure indices, state indices, and response indices. (1) The pressure of the coastal tourist attractions under oil spill stress was represented by the multiple oil spill risk sources, which were densely distributed in the Bohai Sea (Figure 1B) and greatly increased the pressure on the coastal tourist attractions under the threat of oil spills. Oil storage tanks, pipelines, oil production platforms, ships, and channels were chosen to represent the sources of the oil spill risk. (2) The state of the coastal tourist attractions was reflected by the environment (including the natural environment and social environment) in which the coastal tourist attractions were located. (3) The response of the coastal tourist attractions under oil spill stress was reflected by their oil spill response capability. The detailed indices are described in Tables 1, 2, 3. The selected indicators have positive and negative impacts on the vulnerability: a positive impact (+) means that the vulnerability increases as the evaluation index value increases, and a negative impact (−) means that the vulnerability increases as the evaluation index value decreases.
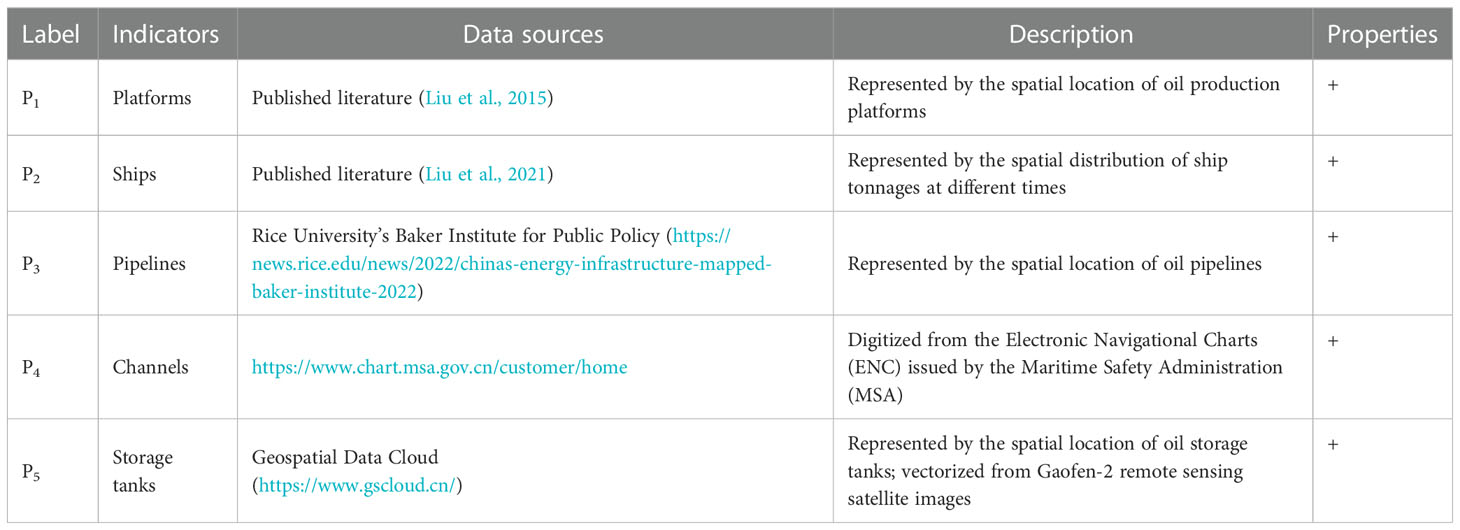
Table 1 Pressure indicators (after Wang et al., 2023).
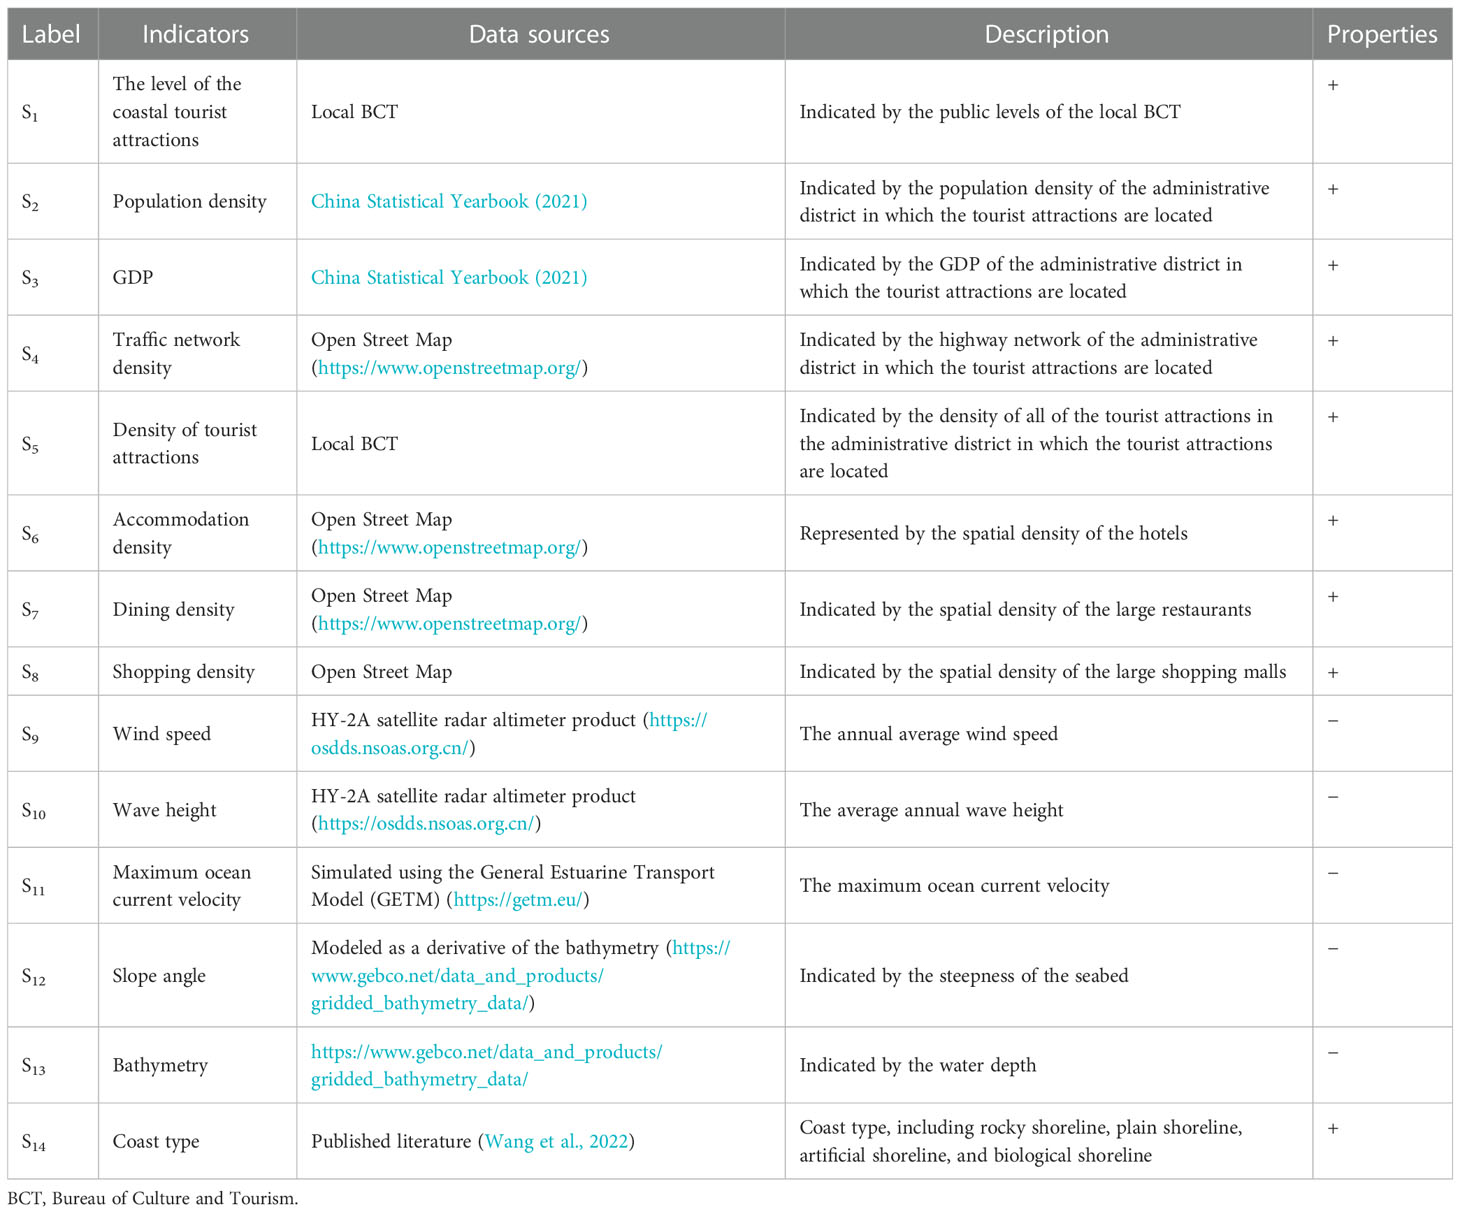
Table 2 State indicators.
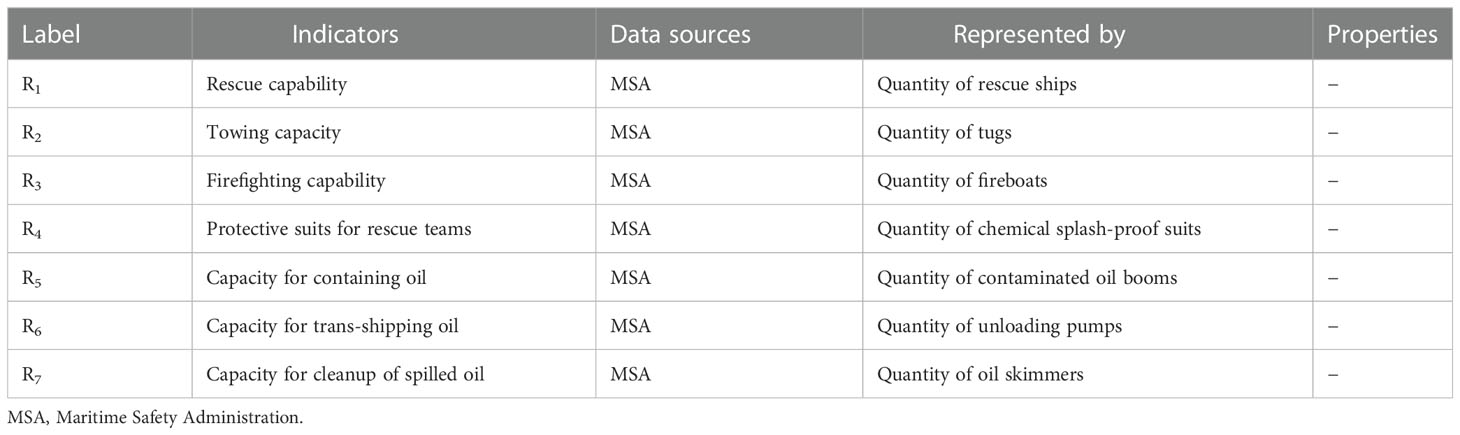
Table 3 Response indicators (after Wang et al., 2018a).
2.3 Assessment methods
2.3.1 Weight determination
In this study, the weight of each indicator was determined using the analytical hierarchy process (AHP). The AHP is a multi-criteria decision-making method used to analyze a complex problem with multiple conflicting and subjective criteria, and it has been widely used in the field of vulnerability assessment (Dandapat and Panda, 2017; Kumar et al., 2021). The purpose of the AHP is to combine qualitative and quantitative analyses to obtain the relative weight of each indicator. It has several advantages such as simplicity, versatility, and a high accuracy. The steps of the AHP can be summarized as follows.
(1) Building the hierarchical model: According to the PSR framework, the target of vulnerability assessment is divided into three layers: the objective layer, the criterion layer, and the index layer. The objective layer is the vulnerability assessment objective itself; the criterion layer encompasses the pressure, state, and response; and the index layer includes the 26 indicators listed above.
(2) Constructing the judgment matrix: The indicators are compared to one another according to experts’ suggestions within the same layer. The scale of the relative importance intensity of each indicator ranges from 1 to 9. Then, the pairwise judgment matrix is created.
(3) Determining the weight: For the judgment matrix, the maximum eigenvalue (Eq. (1)) and its corresponding eigenvector are calculated. The weights of the indicators are represented by the eigenvector:
where is the maximum eigenvalue, n is the dimension of the matrix, A is the judgment matrix, and W is the eigenvector.
(4) Consistency check: The consistency ratio (CR) is defined as the ratio of the consistency index (CI) to the random consistency index (RI):
The CI can be directly calculated from the preference matrix as follows:
where RI is the random consistency index (Table 4), and CR is the consistency ratio.
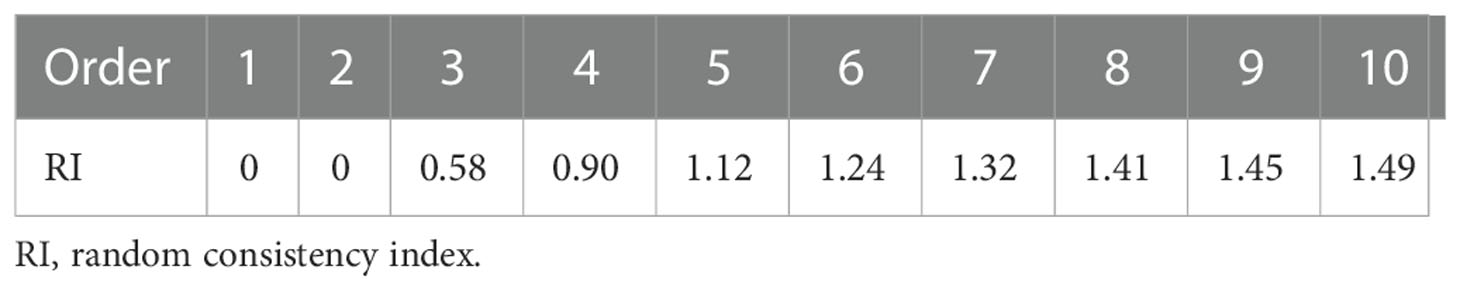
Table 4 RI values (Ishizaka and Labib, 2011).
2.3.2 Data processing
To assess the vulnerability of the coastal tourist attractions to oil spills, a total of 26 indicators were considered and processed (Figure 2). For the pressure indicators, buffer analysis was performed on the structures, including storage tanks, pipelines, platforms, and channels. The buffer distances were assigned empirically based on the reported spheres of influence of historical accidents: 35 km for oil pipelines and oil tanks, 29 km for platforms, and 27 km for channels, which has been shown to be feasible and effective in a previous study (Wang et al., 2023). The vessel tonnages for ships were converted from the Automatic Identification System data, which were sampled every 3 days, and the data for the first minute of each hour of each day were selected as representative. Additional details have been described by Liu et al. (2021).
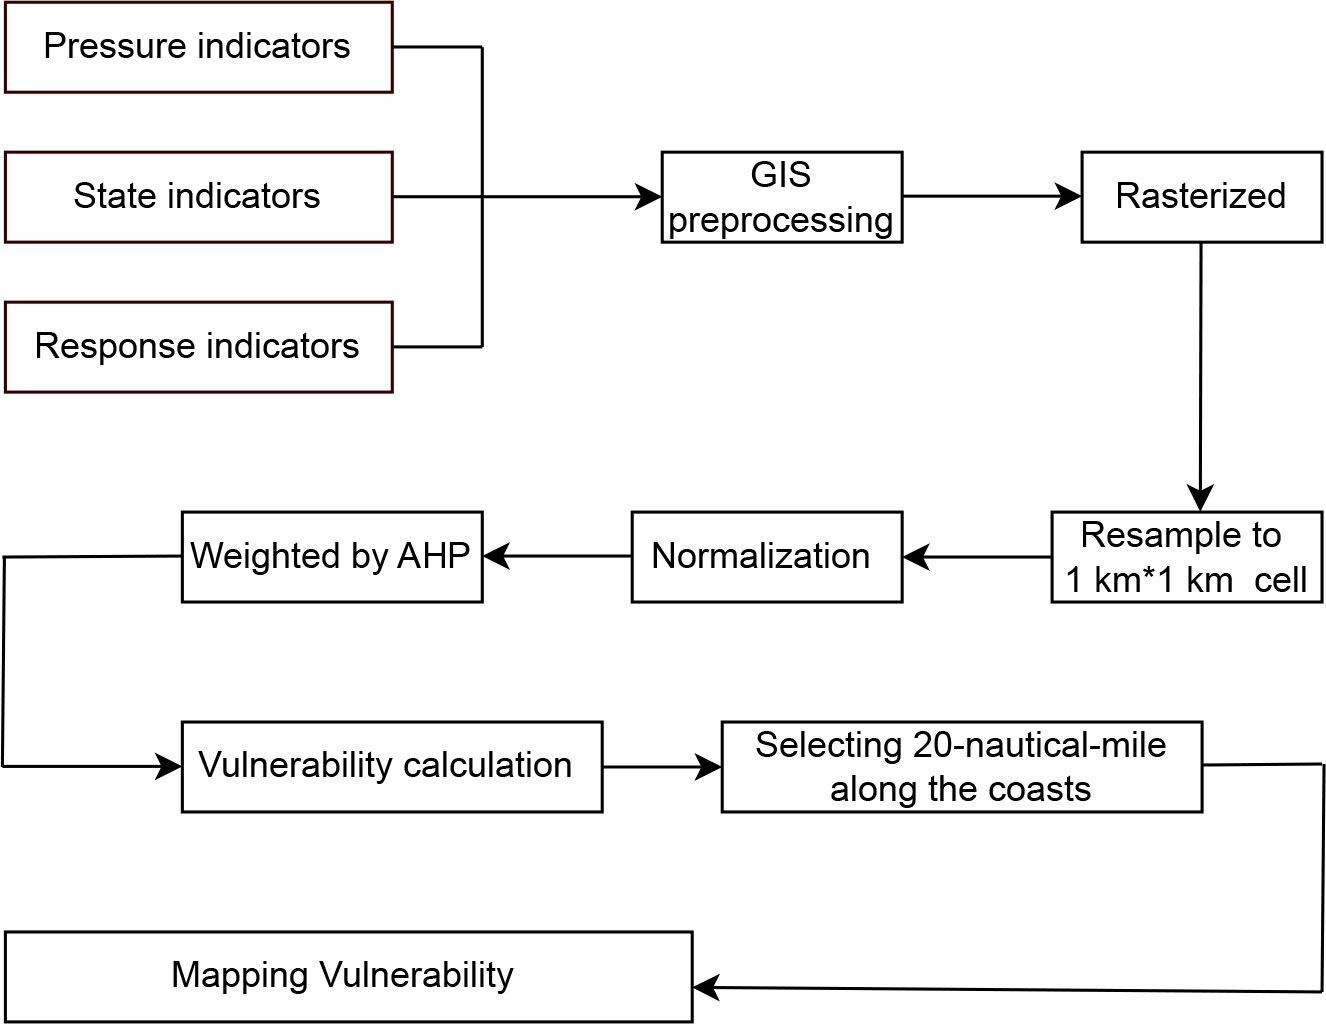
Figure 2 Technology roadmap.
All of the indicators needed to be normalized for comprehensive analysis. For state indicator S1, the normalization values were assigned directly according to the level. The values of levels 5A, 4A, 3A, 2A, and 1A were set to 100, 80, 60, 40, and 20, respectively. (S2-7): The population density, GDP, traffic network density, density of tourist attractions, accommodation density, and shopping density were stored as shapefile data, which were directly imported into the geographic information system (GIS), and kernel density analysis was performed. To facilitate the joint calculation and analysis of the ocean and land indicators, the land indicators were extended to the ocean via inverse distance weighting (IDW) interpolation. (S8-12): The wind, wave, maximum ocean current velocity, slope angle, and bathymetry data were imported into the GIS and converted to raster data. (S13): The values of the biological, artificial, plain, and rocky shorelines were set to 100, 75, 50, and 25, respectively.
For the response indicators, the emergency equipment was located in the key harbors surrounding the Bohai Sea. Their locations and quantity data were stored in point shapefiles. IDW interpolation was used to convert the spatially discrete data into spatially continuous data.
2.3.3 Vulnerability assessment model
To eliminate the cross-resource effect among the different indicators, all of the above preprocessed indicator data were converted into raster data using 1000 m × 1000 m cells in GIS, and the individual positive indicators were then normalized using the following formula:
The individual negative indicators were normalized using the following formula:
In Equations (4) and (5), N is the normalized value for each indicator, x is the true value of the cell, i is the cell identifier, Min is the minimum value of each indicator, and Max is the maximum value of each indicator.
After data processing was conducted using a GIS tool, a vulnerability assessment model for the coastal tourist attractions under oil spill stress was constructed:
where P, S, and R are the values of the pressure, state, and response, respectively; n is the number of indices for the pressure, state, or response; Ni is the normalized value of index i; and Wi is the weight of index i. The vulnerability was calculated using the following formula:
where V is the vulnerability, P is the pressure, S is the state, and R is the response.
In this study, the values of the integrated pressure, integrated state, integrated response, and vulnerability were divided into five grades (extremely low, relatively low, medium, relatively high, and extremely high) using the quantile distribution method to facilitate a clear representation of the spatial differentiation.
3 Results
3.1 Synthetic weights
The indicator weight determines the contribution of each indicator to the vulnerability assessment results. Through analysis of the different indicator weights, the relatively important indicators and the less important indicators can be clarified to provide a reference for decision-making and to reduce vulnerability. Of the 26 indicators considered, two had weights of less than 0.02 (Table 5). Of these two indicators, one was a pressure indicator (pipelines), and the other was a state indicator (population density). In contrast, the indicators that were assigned the two highest weights were associated with the response. In particular, the capacity for containing oil and the capacity for cleaning up spilled oil were the two indicators that contributed the most to reducing the vulnerability of the coastal tourist attractions.
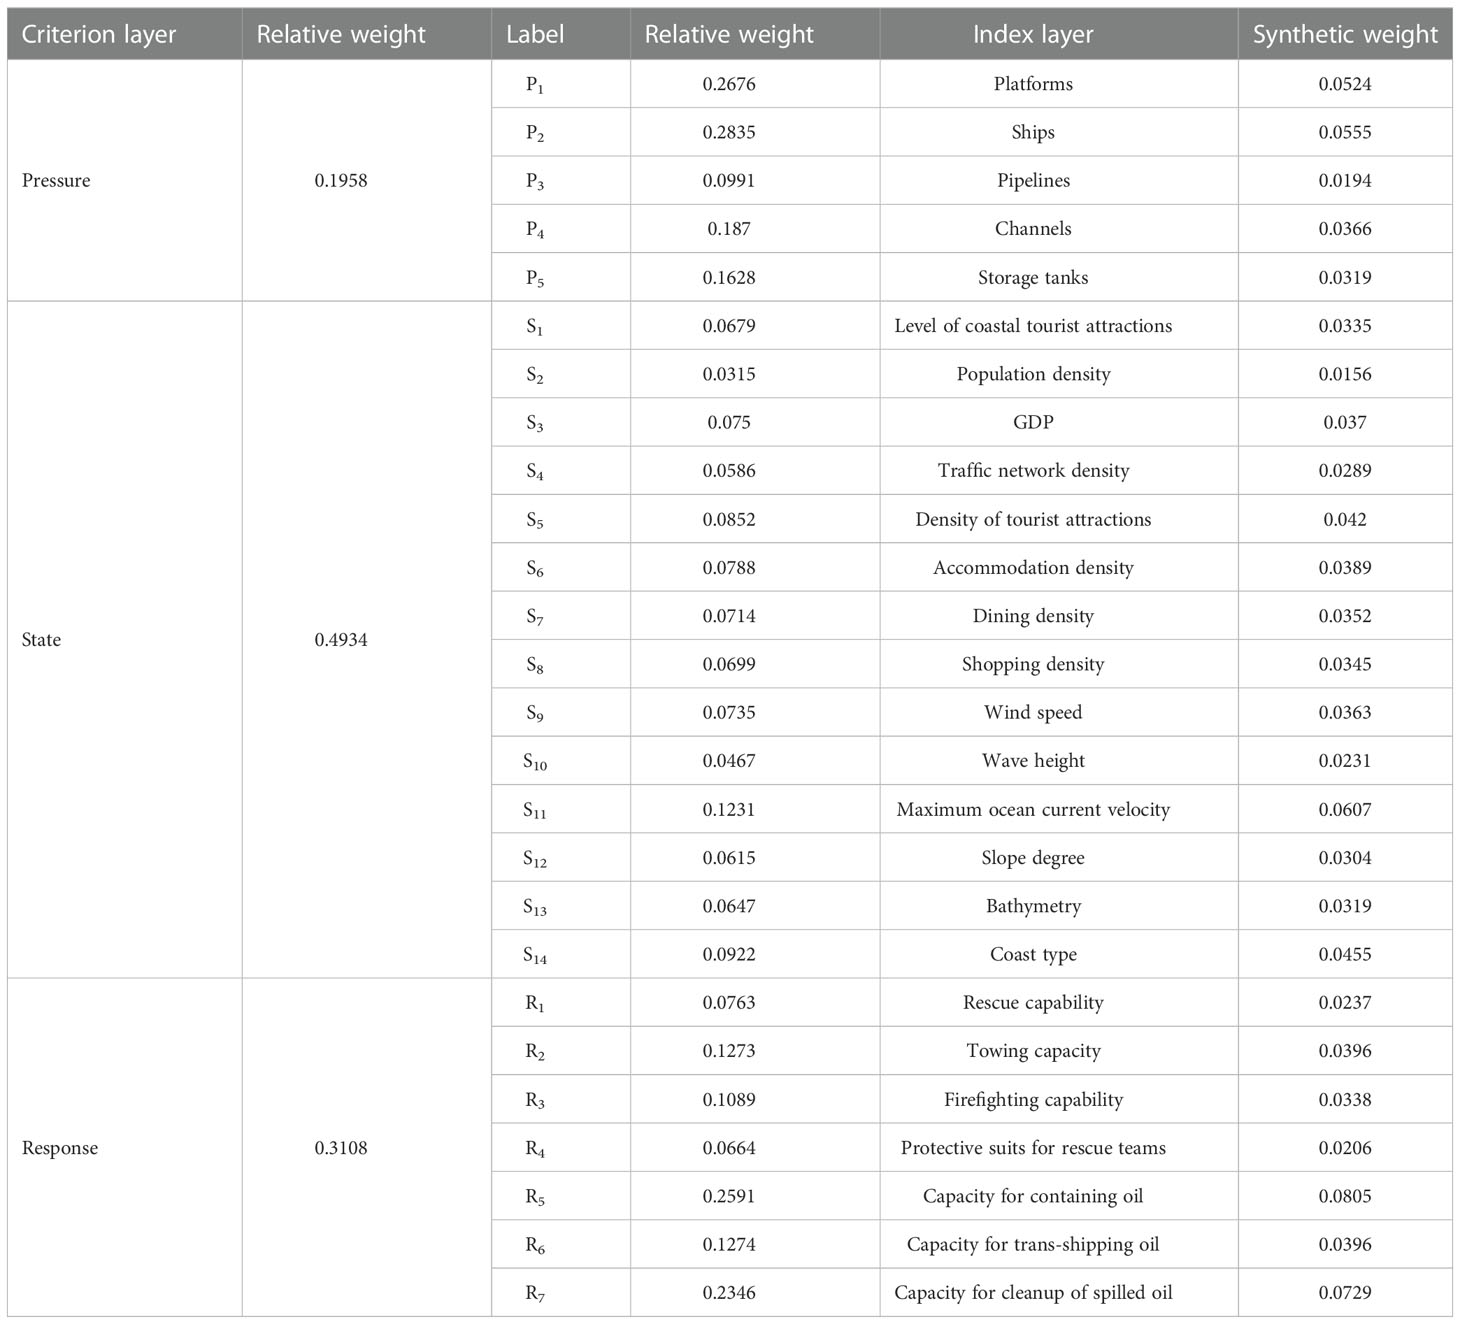
Table 5 Weight distributions of all of the indicators.
3.2 Spatial variations in vulnerability
In this study, the coastal tourist attractions were threatened by oil spills from the direction of the ocean. Therefore, along the coastline, a 20-nautical-mile buffer zone was set from the shoreline for display and analysis purposes. The integrated pressure, state, response, and vulnerability under an oil spill varied along the coastal lines, and thus, the vulnerability of the coastal tourist attractions exhibited spatial variations. To specifically and quantitatively describe these variations, the results were described from the perspective of the seven response zones, and the normalized values of the integrated pressure, state, response, and vulnerability were divided into five grades based on the quantile distribution: extremely high, relatively high, medium, relatively low, and extremely low. The areas of each grade in each response zone were determined (Figure 3), and the relative proportions of these areas to the total areas of the response zones were calculated.
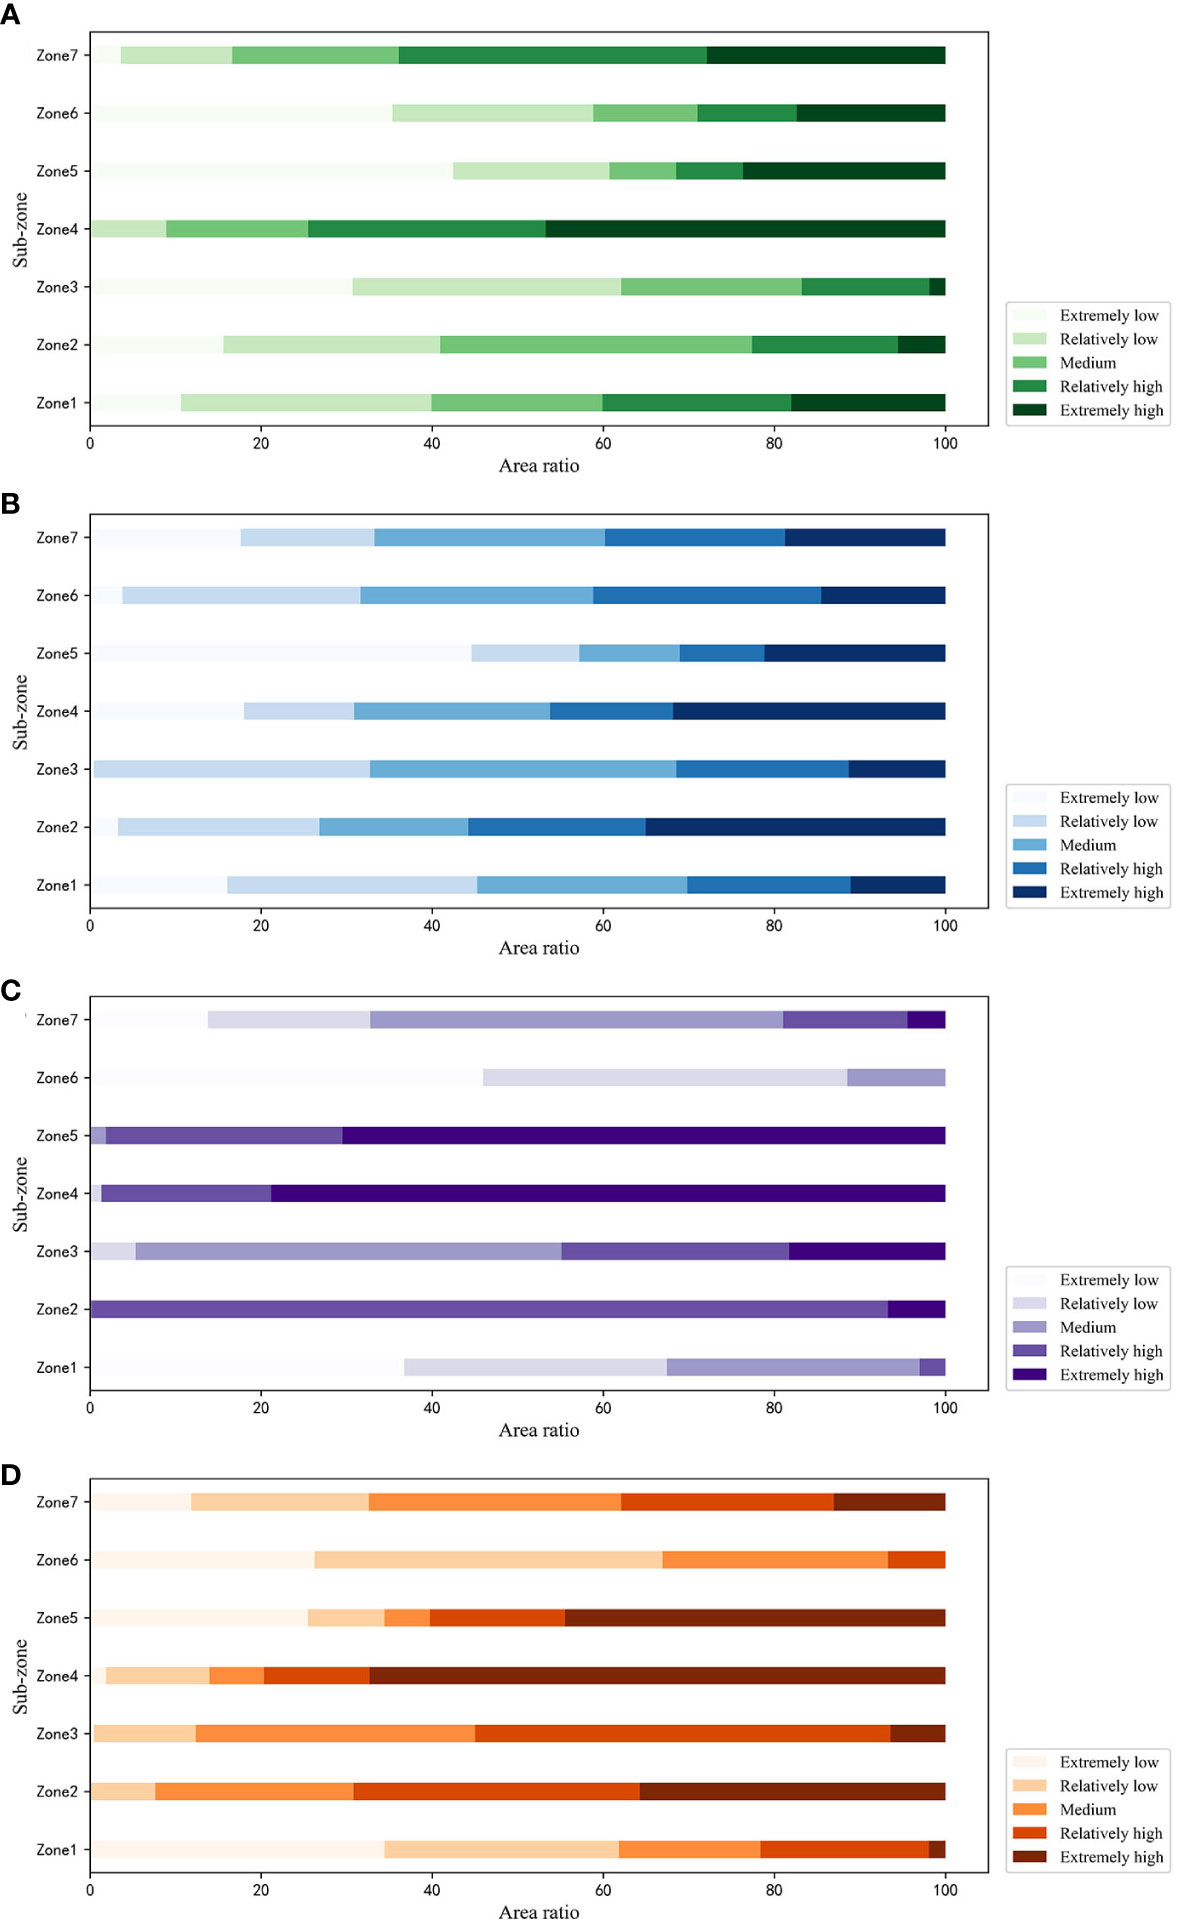
Figure 3 Area proportions in Zones 1–4: (A) pressure, (B) state, (C) response, and (D) vulnerability.
3.2.1 Pressure
The individual pressures from five types of oil spill resources were identified based on GIS spatial analysis and visualization. Then, the integrated pressure was calculated by synthesizing the five types of pressure metrics and was visualized in GIS through combination with the weighted calculations (Figure 4). Except that there were no selected coastal tourist destinations on the coast of response zone 3, the destinations in the other six response zones all faced medium or greater oil spill pressure. It can be seen from Figure 3 that among all the 65 coastal tourist attractions, 55 faced greater than medium-level pressure, accounting for 85% of the total coastal tourist attractions. Taking response zone 7 as an example, 12 of the 17 coastal tourist attractions were under extremely high oil spill pressure, so these coastal tourist attractions were located in a typical high oil spill exposure area.
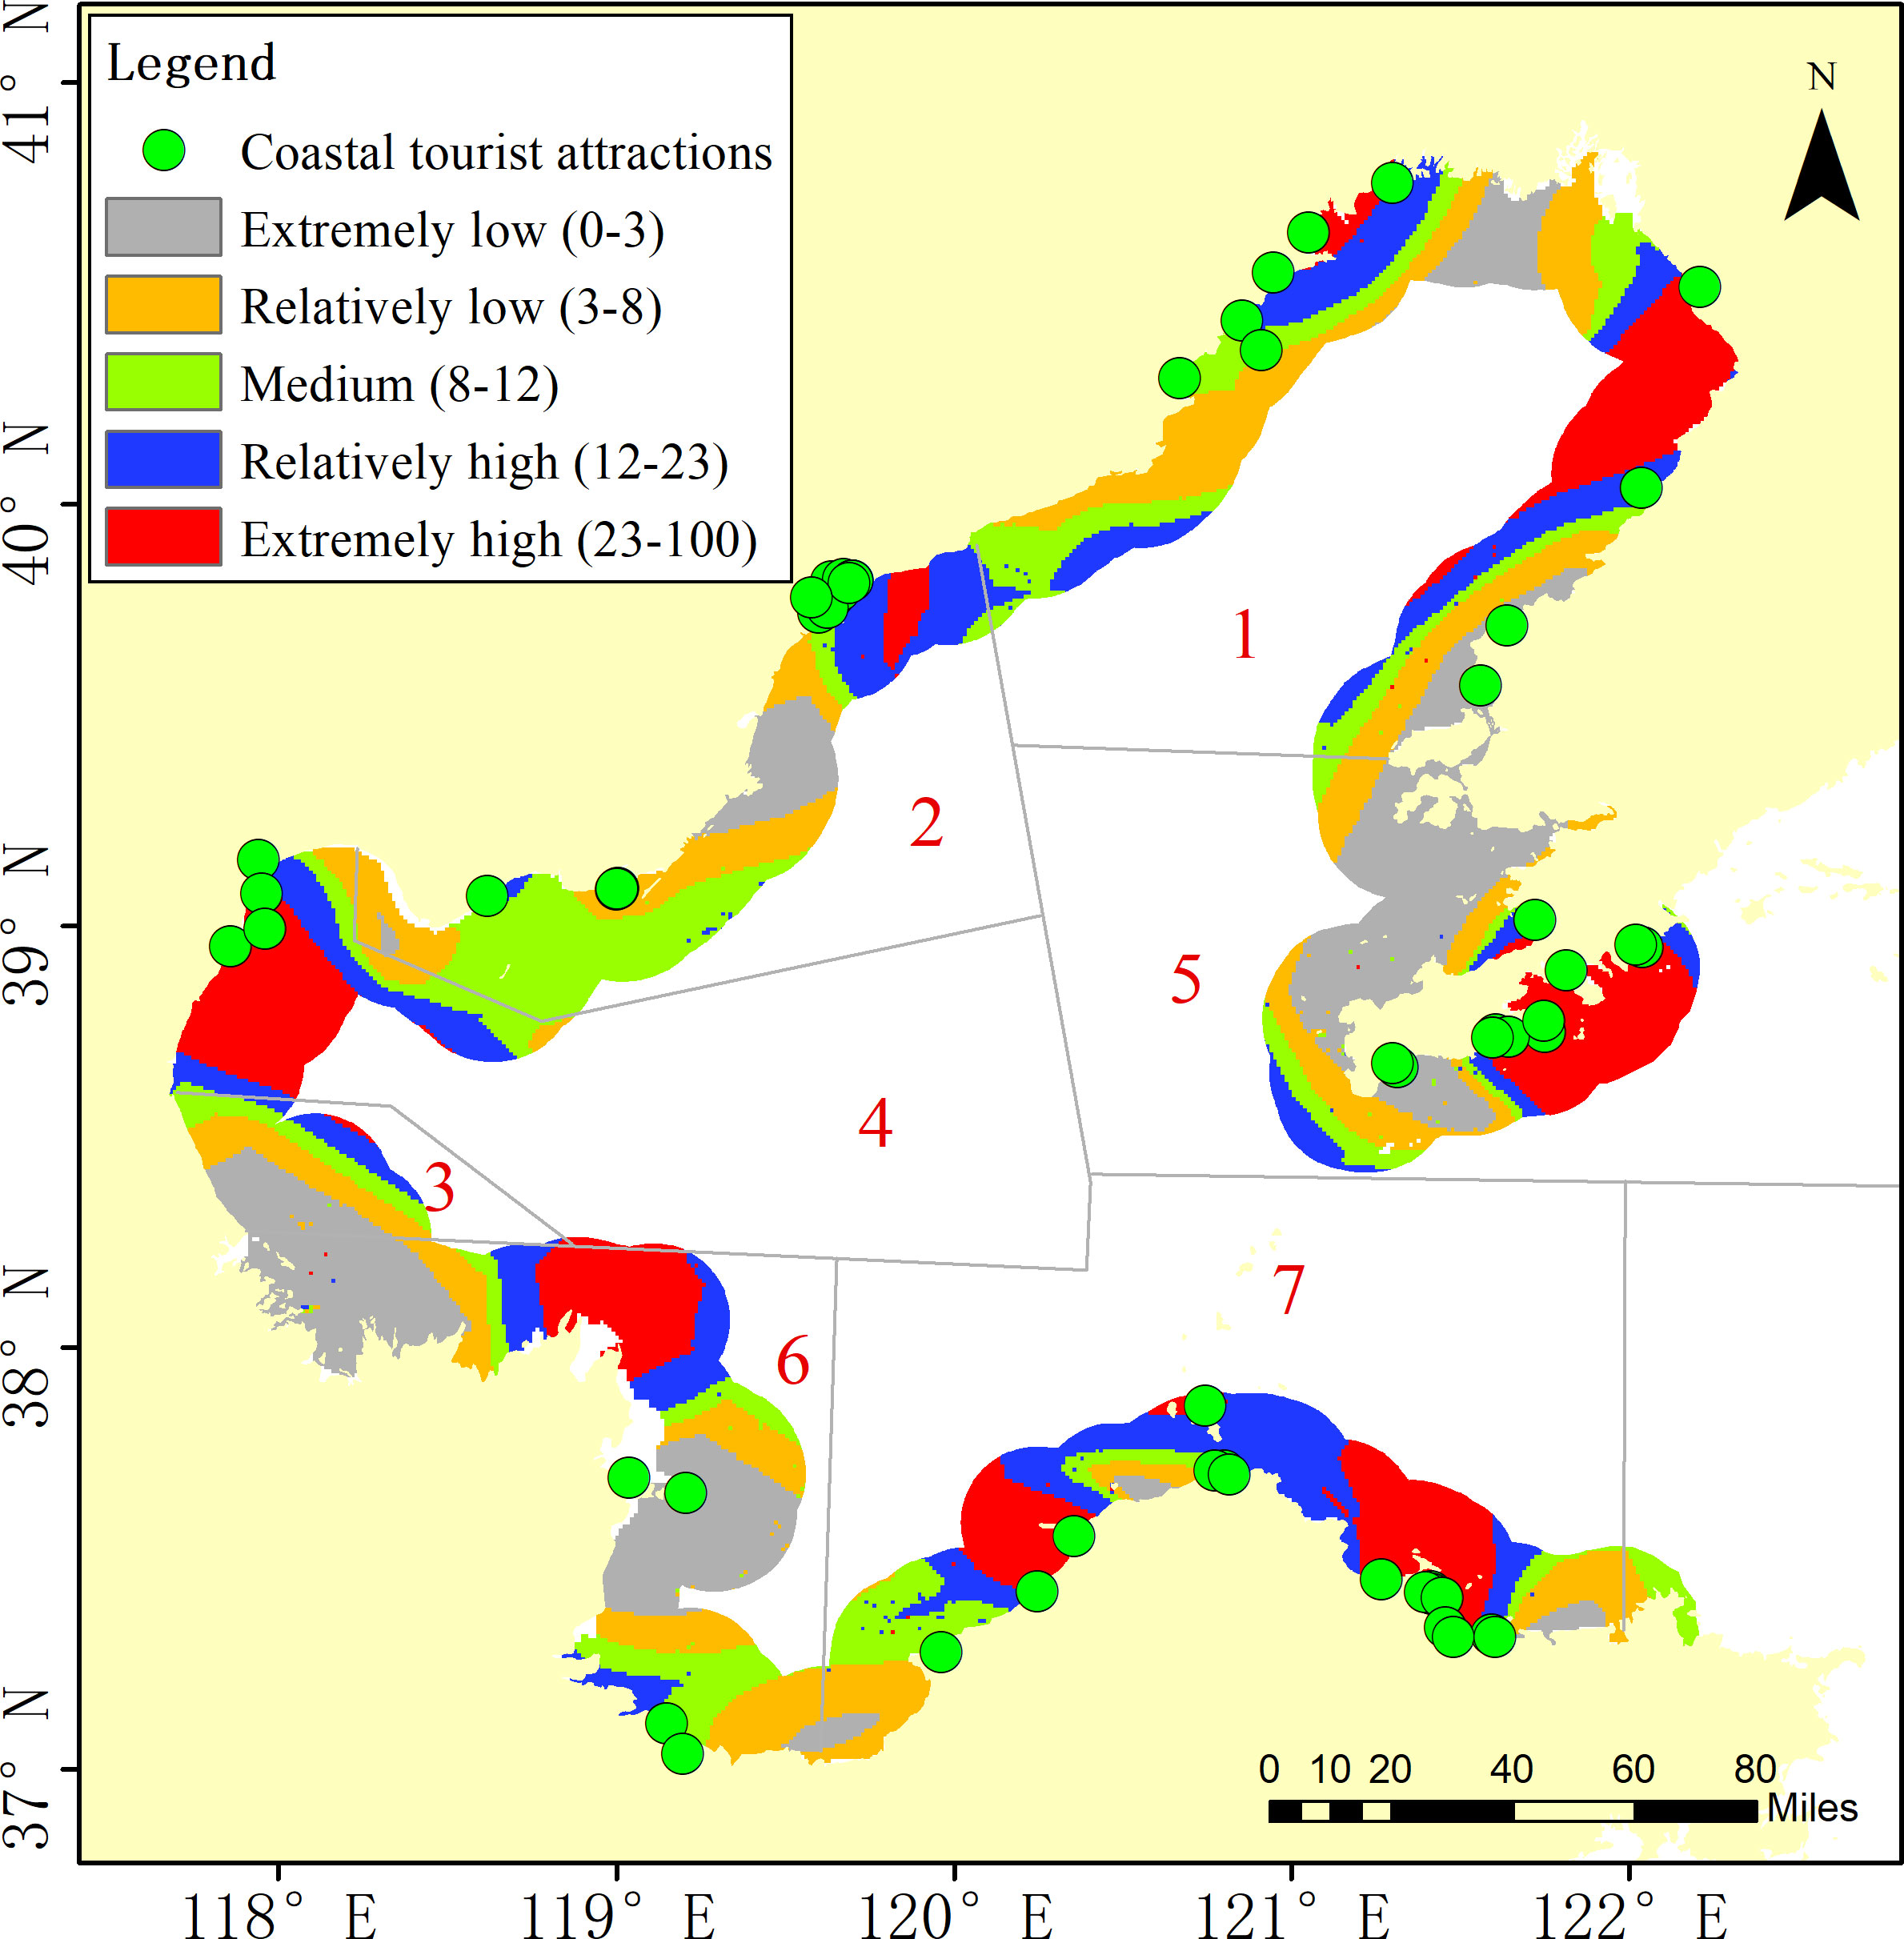
Figure 4 Spatial variations in the integrated pressure from oil spills.
3.2.2 State
After GIS spatial analysis and visualization, the state of each index was identified. By overlaying the weighted calculations on the spatial analysis results, the state resulting from the integrated state spatial pattern of the coastal tourist attractions under oil spill stress was attained (Figure 5), which is represented by the different colors in the sea area near the coastal tourist attractions in Figure 4. The state is a reflection of the sensitivity of the tourist attractions under the pressure of oil spills. Thus, from the spatial pattern of the integrated state, it was found that 50 coastal tourist attractions had an extremely high sensitivity, seven had a relatively high sensitivity, and none of the tourist attractions had an extremely low sensitivity.
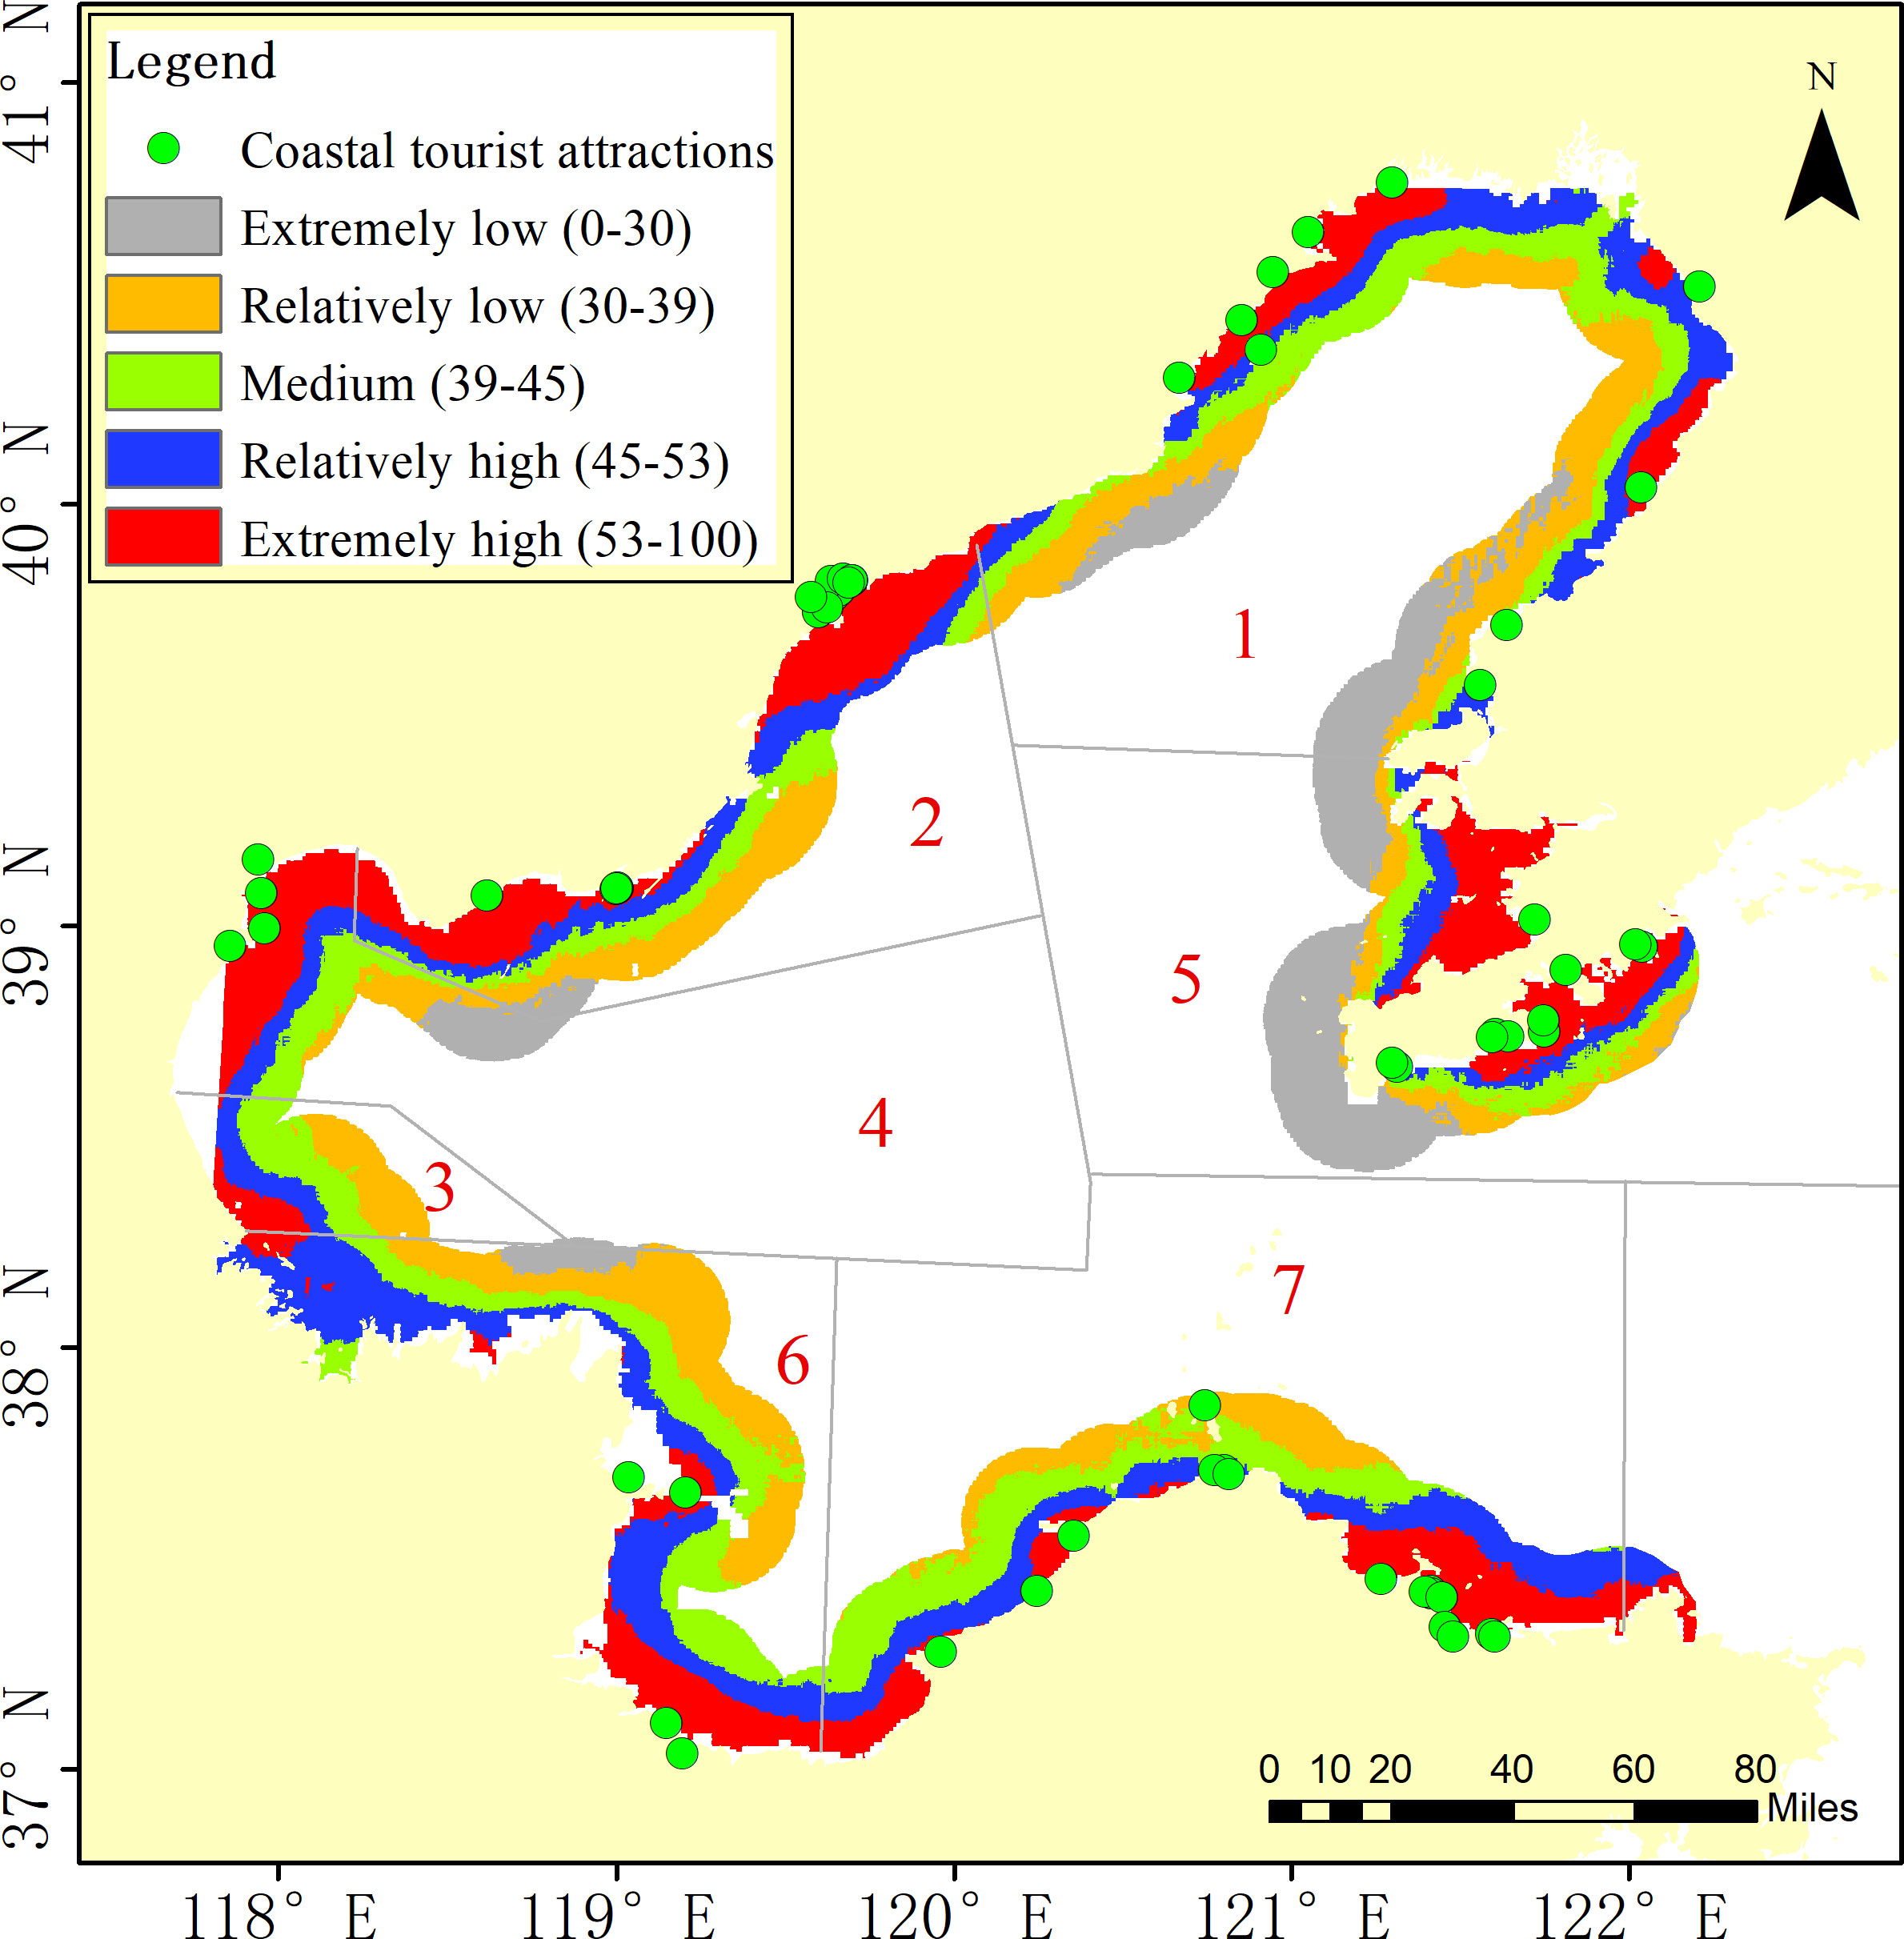
Figure 5 Spatial variations in the integrated state.
3.2.3 Response
The response of each index was identified, and then, the weighted results and spatial overlay analysis were used to calculate the integrated response capacity. The spatial patterns of the integrated response capacity (Figure 6) showed that all of the tourist attractions located in response zone 1 had a below medium oil spill response capability. Furthermore, all of the coastal attractions located in response zone 2 had a relatively high response capability, and all of the coastal attractions located in response zones 4 and 5 had extremely high response capabilities. In zones 6 and 7, the response capability was distributed non-uniformly.
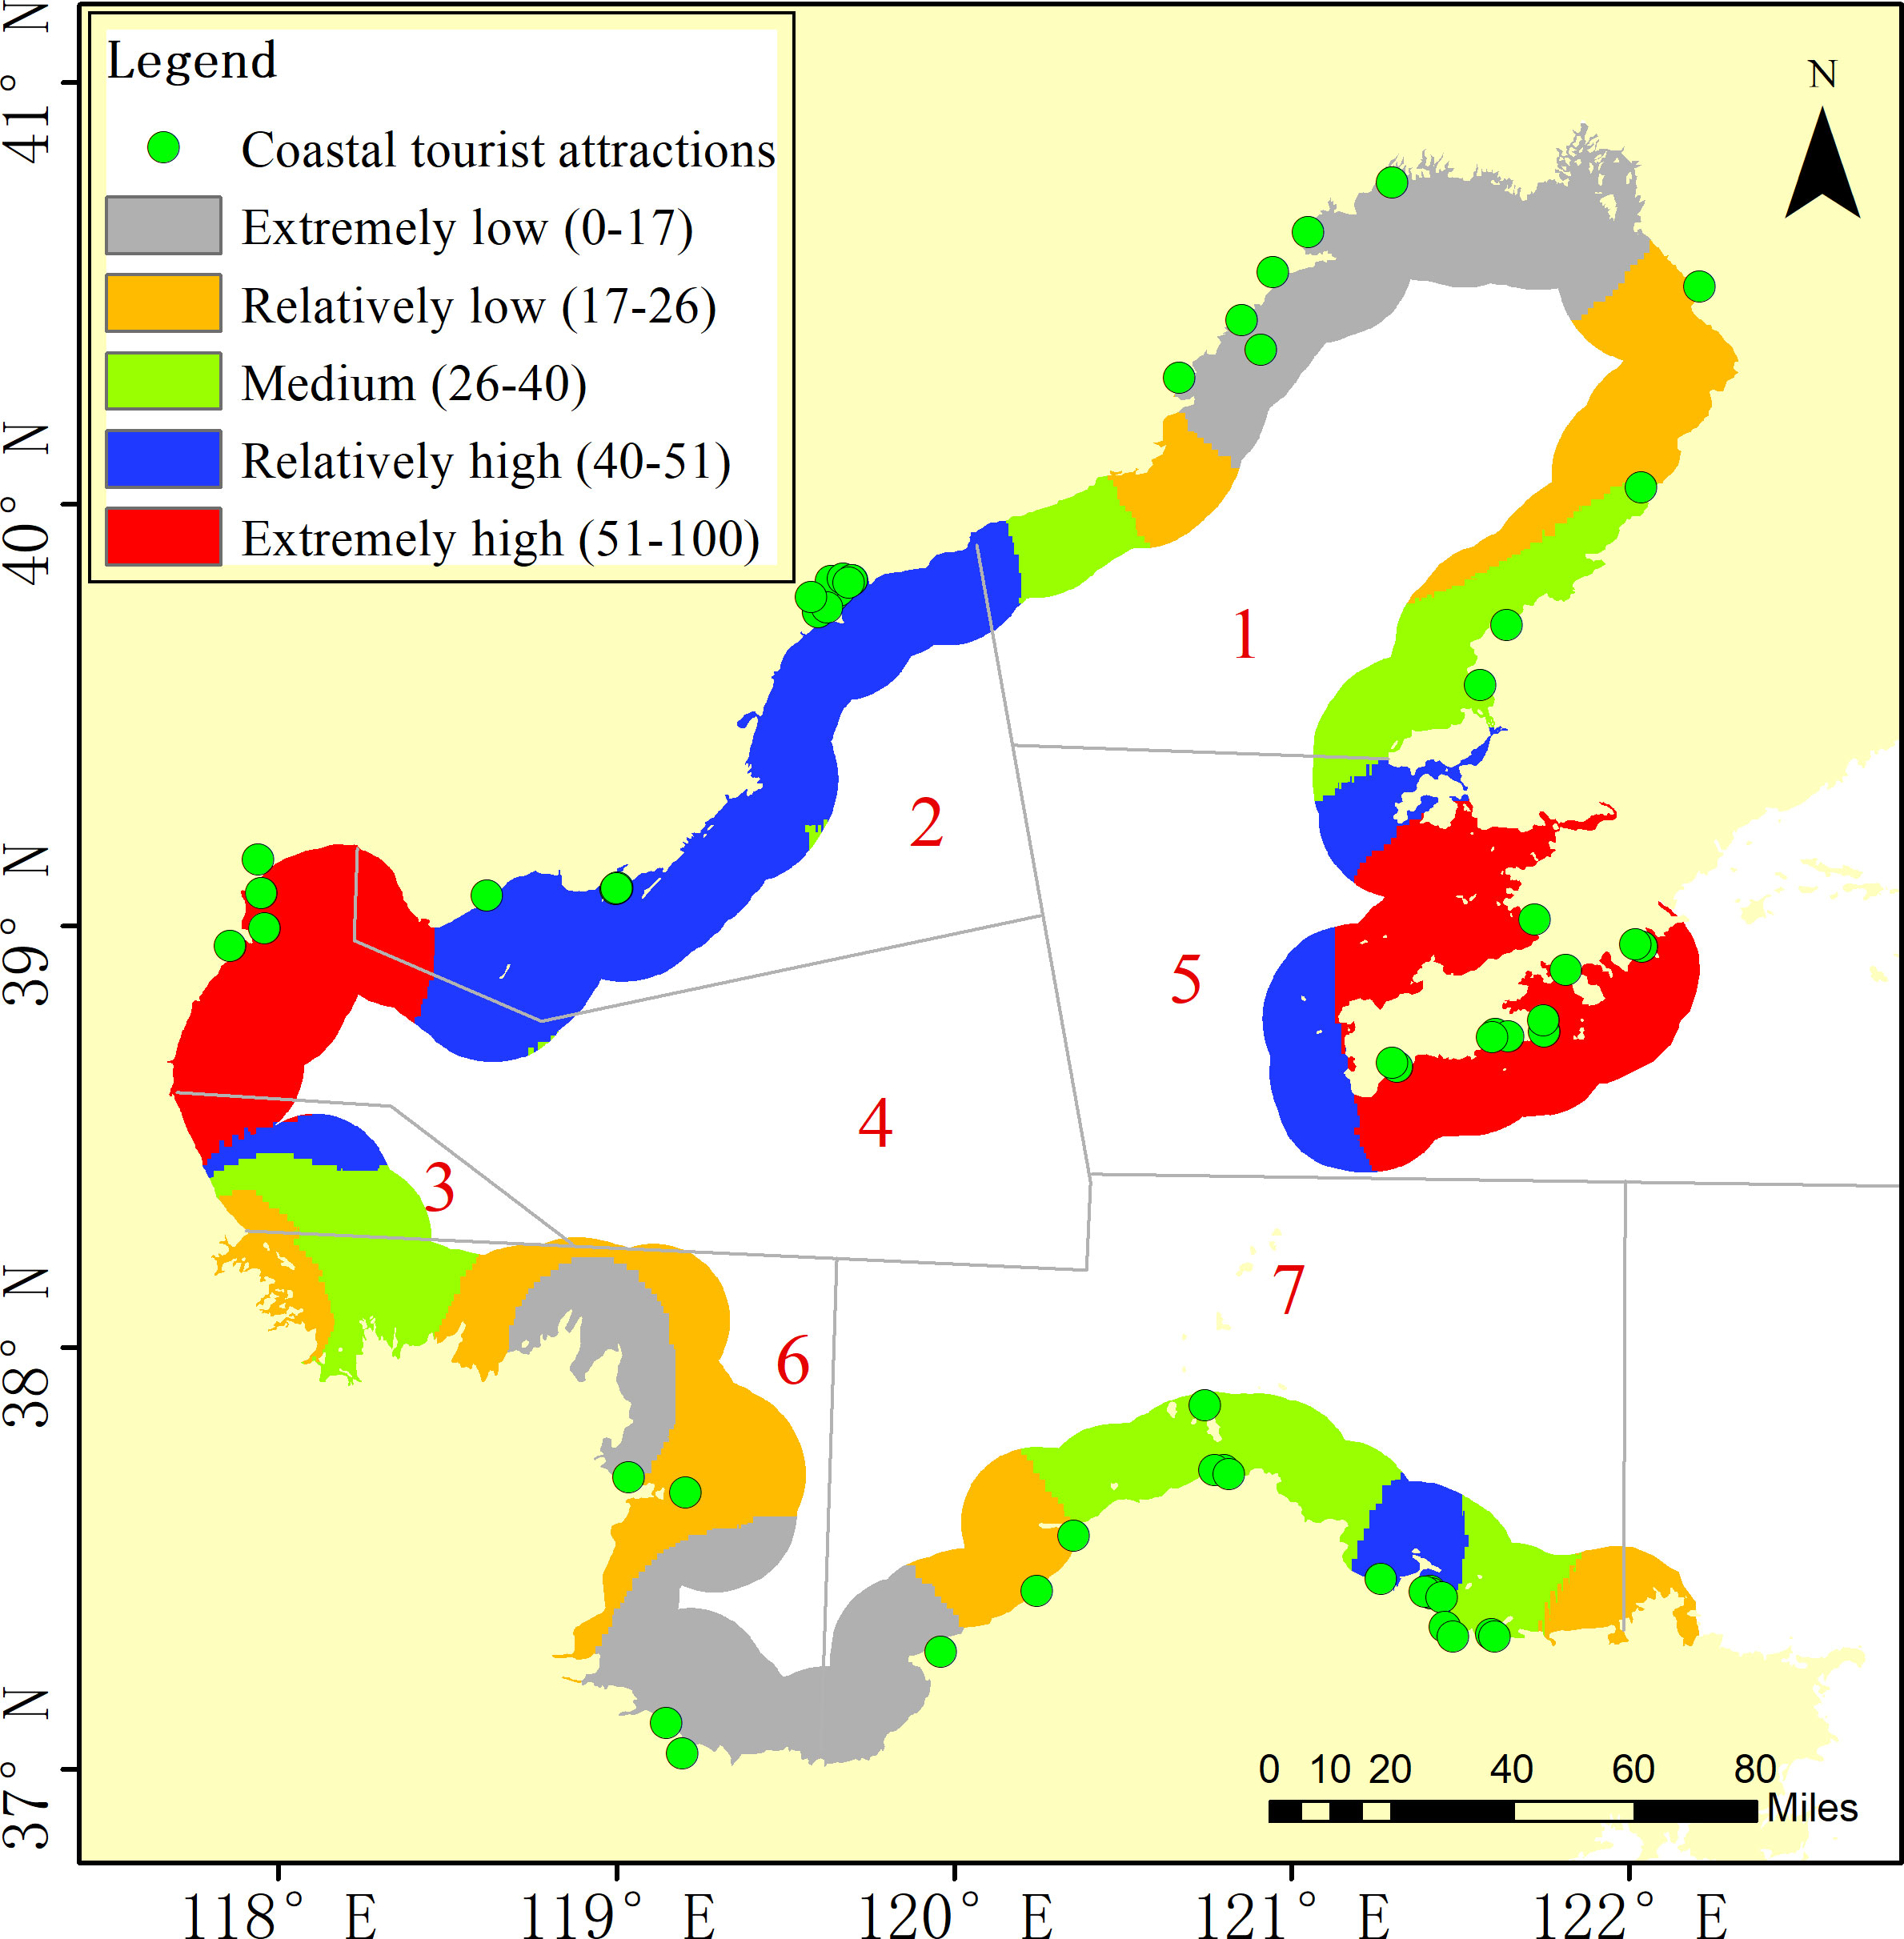
Figure 6 Spatial variations in the integrated response.
3.2.4 Vulnerability
The vulnerability of the coastal tourism destinations in the different response zones exhibited obvious spatial differences under oil spill stress. Overall, 31 of all 65 coastal tourist attractions exhibited extremely high vulnerability to oil spills in the Bohai Sea. In contrast, only two coastal tourist attractions exhibited extremely low vulnerability to oil spills. Specifically, as shown in Figure 7, response zones 4, 5, and 7 are more worthy of attention, as all of the coastal tourist attractions in these zones were above the relatively high sensitivity range. In response zone 1, 30% of the coastal tourist attractions had an extremely high vulnerability, while 74% of the coastal tourist attractions in response zone 2 had a relatively high vulnerability. In terms of geographical location, the tourist attractions located near the Liaodong Peninsula and on the west side of the Bohai Bay exhibited a significant vulnerability to oil spill stress.
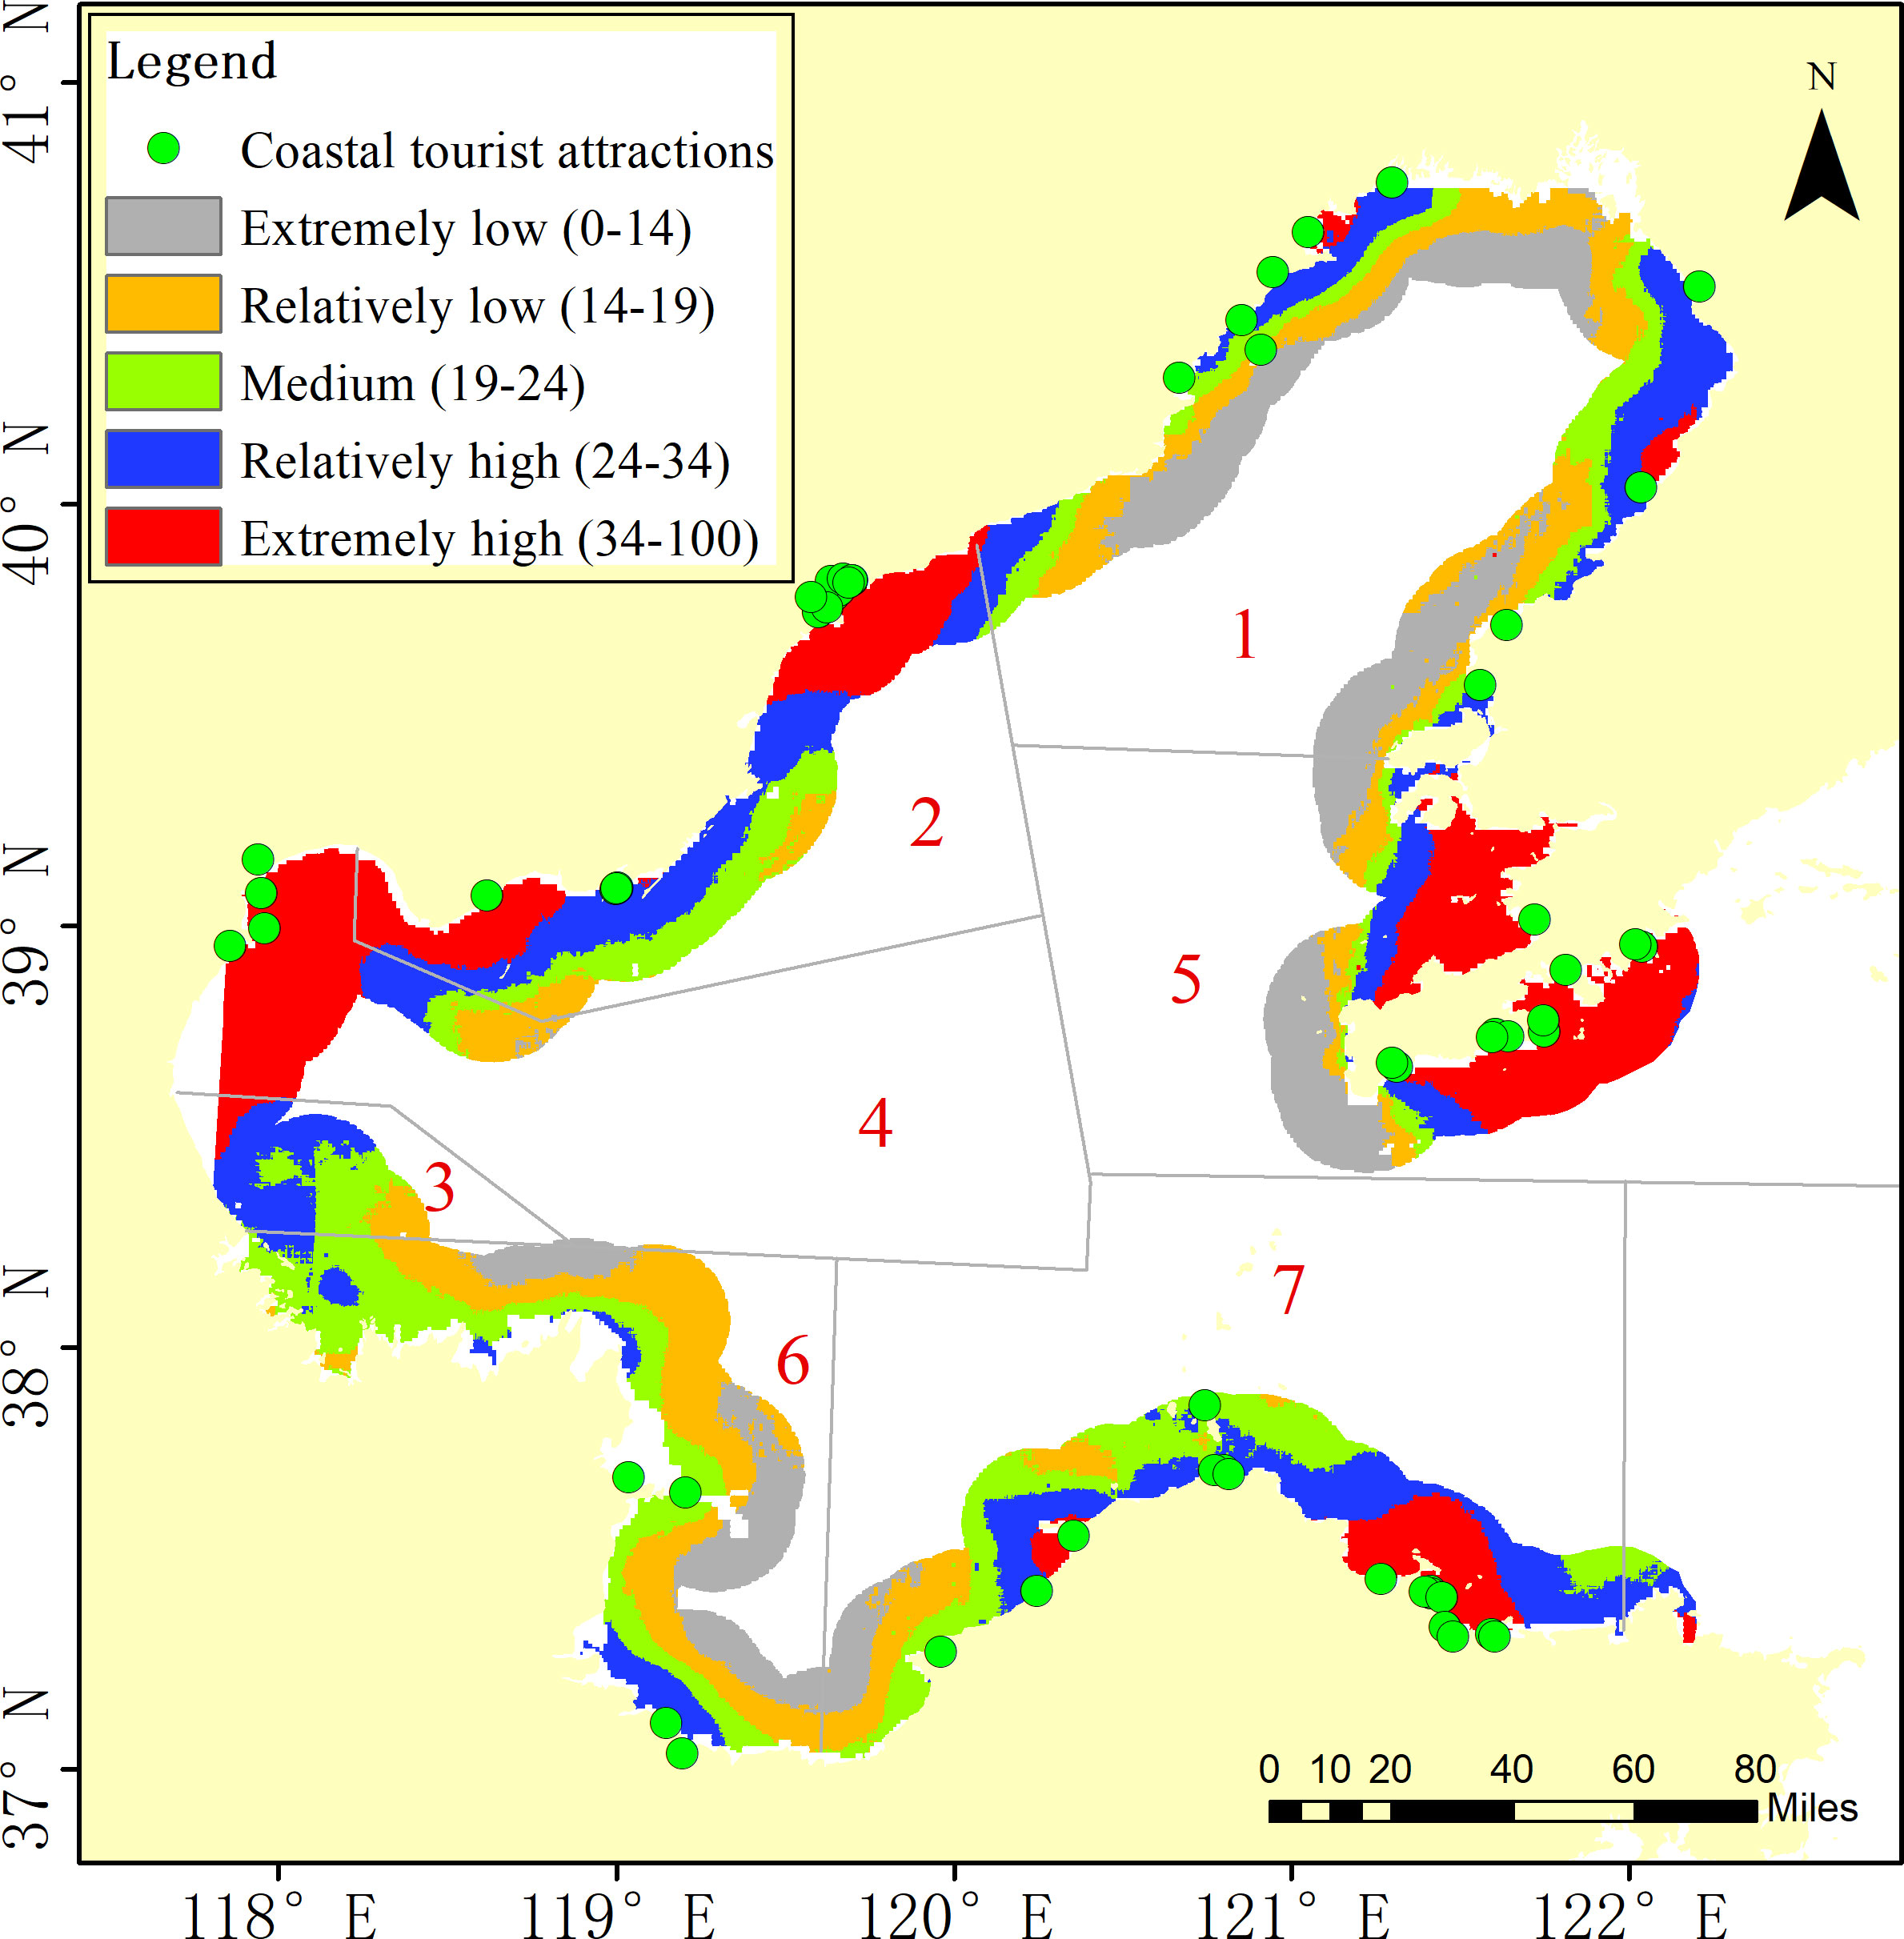
Figure 7 Spatial variations in the integrated vulnerability of the coastal tourist attractions.
4 Discussion
4.1 Indicator analysis
This section explains in detail the reasons for and rationality of the selection for each indicator.
For pressure: The sources of oil spills are usually from oil well blowout, marine vessel accidents (oil tankers and vessels of all types and sizes), and pipeline spills (Chilvers et al., 2021). In addition, the risk of collision in the shipping channels increases gradually with the progressive development of marine traffic, and vessels are more likely to collide with oil pipelines and oil platforms in a waterway (Yasseri and Prager, 2005; Mujeeb-Ahmed et al., 2018). Moreover, historically, there have been accidents in the Bohai Sea due to the explosion of coastal oil storage tanks, resulting in heavy marine oil spill pollution (Dalian New Port oil spill event) (Guo et al., 2016). Therefore, in this study, all of the risk sources in the Bohai Sea, including ships, channels, oil production platforms, oil storage tanks, and pipelines, were taken into account.
For state: The state indicators include land-related indicators and marine-related indicators. (S1) The perceived service quality can determine a tourist attraction’s reputation, which is a major variable influencing the choice to visit an attraction as famous areas tend to have higher demands (de Castro et al., 2015). As was previously mentioned, the quality of tourist attractions in China has been evaluated and divided into five levels by the provincial bureaus of culture (BCT). The evaluation right of the BCT is authorized by the National Tourist Attraction Quality Rating Committee, and the evaluation criteria are in accordance with the national standards of the Administrative Measures for the Quality of Tourist Scenic Areas, which is a measure of the quality of tourist attractions. (S2-3) Visitation tends to be higher in the most populated regions (de Castro et al., 2015). Therefore, the more densely populated the area is, the higher the sensitivity of the tourist attractions to pollution is. Similarly, regions with a higher GDP have a stronger consumption power and thus are more vulnerable. (S4) Road and infrastructure development is positively related to tourism benefits (Kanwal et al., 2020). In particular, high-speed railways have profoundly altered the spatial pattern of China’s urban tourism (Wang et al., 2018b). In addition, after an oil spill accident, a more developed traffic infrastructure is more conducive to the allocation of emergency facilities, which indirectly improves the response of the region. (S5) China’s tourism industry has exhibited a trend toward agglomeration, which has had an important effect on tourism efficiency (Li and Liu, 2022). Therefore, the denser the tourism resources are, the greater the impact on the tourist destinations in the community is after the coastal tourist attractions are affected by an oil spill disaster. (S6-8) Because social media has a wide reach, accommodation, dining, and shopping activities are three important factors during the travel decision-making process (Liu et al., 2020). After nearby tourist attractions are polluted by oil spills, tourists will avoid visiting them, and these three types of infrastructure-intensive areas will be implicated. (S9-11) Oil slicks move horizontally on the sea surface under the forces of the wind, waves, and currents (Reed et al., 1999). High wind speeds, wave heights, and current velocities are conducive to the movement of oil spills on the sea surface and are the decisive factors in determining the direction of oil spill movement. In this study, the annual average data were used to represent the general conditions of the wind, waves, and currents. (S12-13) The slope angle of the seafloor has significant effects on the persistence of spilled oil (Depellegrin and Pereira, 2016), while the bathymetry can influence the circulation of water masses and determine the oil spill distribution (Gille et al., 2004). A steeper slope and deeper water result in a stronger water exchange capacity, which lowers the sensitivity of resources to an oil spill (Castanedo et al., 2009). (S14) The types of coasts in China were roughly divided into four categories: rocky, plain, artificial, and biological shorelines. Their sensitivities to oil spills increase in this order (Wang et al., 2022). Therefore, in this study, different values were assigned to the types of shorelines according to their sensitivities.
Response: Oil spill response capabilities generally include conventional cleanup methods (e.g., mechanical cleanup methods, chemical methods, and natural degradation) and alternative/advanced cleanup methods (e.g., bioremediation, in situ burning, and new oil-absorbing magnetic material) (Ventikos et al., 2004). Given the fragile ecological environment and large population density in the Bohai Sea area, mechanical methods are generally chosen as the primary response option for combating oil spills (Wang et al., 2018a). These measures require combat ships (rescue ships, tugs, and fireboats) (Li et al., 2019; Zhang, 2021) and salvage-related equipment (protective clothing, booms, skimmers, and pumps) (Mansdorf, 1992; Ye et al., 2021). The configuration of the above facilities can represent the adaptability of coastal tourist areas to oil spill disasters.
In summary, the above indicators selected in this study are quite representative. However, considering that the coastal tourism industry has obvious spatial spillover effects (that is, it has a strong industrial correlation with the catering, accommodation, entertainment, transportation, commerce, and other industries), it was difficult to include all of the industry indicators related to tourism in this study. For example, in a coastal tourist destination, there are also tourist service facilities such as bars, bathing and changing rooms, storage for small items, and parking lots. The damage caused by oil spill pollution to coastal tourist attractions will affect the operation of these service facilities and cause loss of income, but these factors cannot be listed one by one.
4.2 Methodological analysis
Generally, vulnerability assessment methods include the following four categories: disaster loss data methods, vulnerability curve methods, simulation modeling methods, and vulnerability multi-indicator methods (Nasiri et al., 2016). In oil spill-related research, the occurrence of oil spill accidents is random and lacks statistical laws, so disaster loss data methods are not suitable. The reliability of vulnerability curve methods is lower than that of the other types of methods because vulnerability curve methods are not applicable to other regions, and no published vulnerability curves for oil spills could be found. Simulation modeling methods have little validity in data-scarce situations. Thus, multi-indicator analysis is considered to be the most suitable method currently.
Given this, many comprehensive evaluation models, such as the vulnerability scoping diagram (VSD) model, the driver-pressure-state-impact-response (DPSIR) model, and the PSR model, have been used in vulnerability assessment (Jiang et al., 2021). This study demonstrates that it is feasible to use a PSR framework to conduct vulnerability analysis of the coastal areas under oil spill stress. However, there are still some specific technical details that need to be discussed further.
First, for the pressure indicators, GIS buffer analysis was conducted, and the buffer distances were determined empirically from the influence scope of historical accidents, which undoubtedly lead to a certain degree of subjectivity. Second, for the state indicators, the impact of oil spills on the tourism industry exhibited seasonality, and the greatest impact often occurred during the peak tourist season. When an oil spill occurs in a sensitive summer month, the damage caused by the oil spill is much higher than that caused by an oil spill accident in a non-sensitive winter month. The wind, wave, and current indicators used in this study were all based on annual average data, which cannot reflect the seasonal variations in the vulnerability. In addition, the determination of the weights was conducted using the AHP, which inevitably involves a certain degree of subjectivity.
4.3 Analysis of results
The coastal tourist attractions around the Bohai Sea, China, analyzed in this study (zones 1–7) exhibited obvious spatial variations in their vulnerability to oil spill stress. (1) From the pressure results, it can be concluded that nearly 85% of the coastal tourist attractions faced medium or greater oil spill pressure. (2) It can be seen from the status results that 77% of the coastal tourist attractions were in an extremely sensitive state, and nearly 11% of the coastal tourist attractions were in a relatively sensitive state under oil spill stress. (3) It can be seen from the response results that approximately half of the coastal tourist attractions were below the medium emergency capacity range. (4) It is particularly noteworthy that almost all of the areas in response zones 2, 4, and 5 exhibited extremely high vulnerability under oil spill pressure, and thus, the vulnerability in other zones cannot be ignored either. Our comprehensive analysis suggests that of the coastal tourist attractions examined, only two attractions had the lowest integrated vulnerability to oil spill stress. Overall, although spatial differences existed, the coastal tourist attractions surrounding the Bohai Sea were characterized by a high oil spill pressure, high sensitivity, low emergency response capabilities, and high vulnerability.
Taking this result as a reference, to ensure the safety of coastal tourist areas under the threat of oil spills and considering the ease of deployment and quick response of oil spill emergency facilities in the future, equipment depots should be built in areas that are highly vulnerable. This is to ensure that when oil spills occur, emergency forces will be able to respond quickly so that coastal tourist areas will be affected as little as possible.
4.4 Current risks posed by oil spills to Chinese coastal tourist attractions
Mainland China has an 18,000 km long coastline, while the islands in China have a total coastline of 14,000 km. There are more than 1500 coastal tourist attractions nationwide. According to the 2021 China Marine Economic Statistical Bulletin, among all of the marine industries in China, coastal tourism is the industry with the largest output value (1529.7 billion CNY), accounting for 44.92% of the entire marine industry (3405 billion CNY). In addition, among the 26 major tourist cities in China, 12 are coastal cities. It can be seen that coastal tourism plays an important role in China’s national economy. In the past 18 years, coastal tourism in China has experienced significant growth: its output value increased from 203.1 billion CNY in 2005 to 1808.6 billion CNY in 2019. In 2020, due to the outbreak of COVID-19, its output value decreased sharply to 1392.4 billion CNY, followed by a rebound to 1529.7 billion CNY in 2021, exhibiting a trend of rapid recovery (MNR, 2019–2021).
Figure 8A shows the annual output value of coastal tourism from 2005 to 2021 in China. The impact of inflation has been removed from the values in Figure 7A by considering Consumer Price Index (CPI). In this context, the sustainable development of coastal tourism in China has been negatively affected by many external factors; among them, marine disasters, such as red tides, green tides, and oil spills, are one of the important disturbance factors. In particular, recent oil spills have gradually aggravated marine environmental problems, posing a great threat to coastal tourism in China.
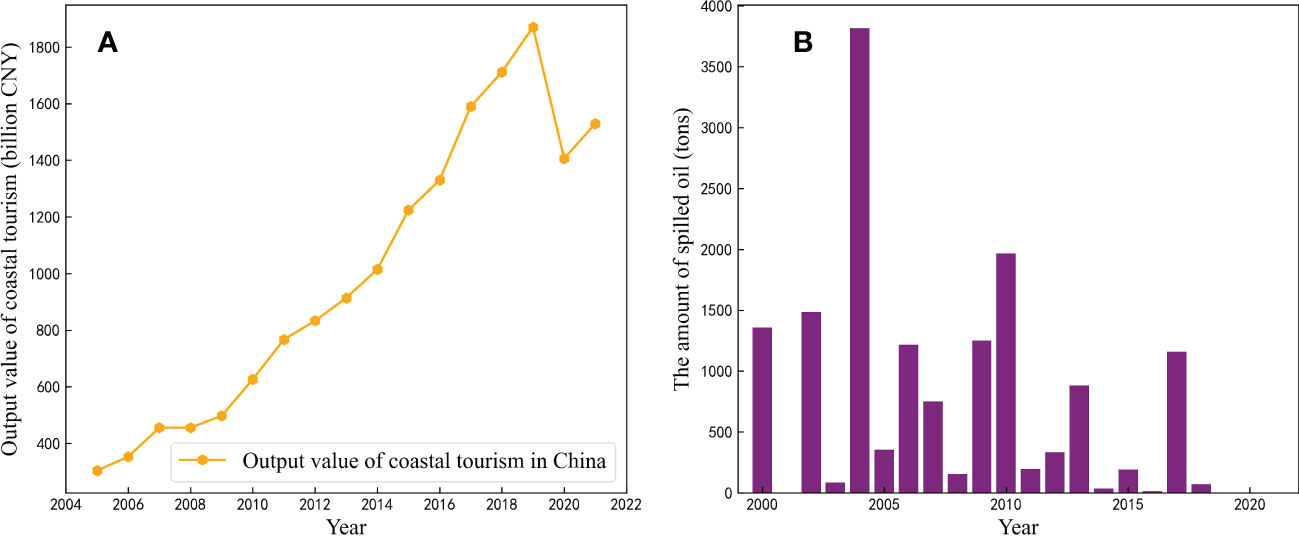
Figure 8 (A) Annual output value of coastal tourism from 2005 to 2021 in China. (B) The volume of oil spilled annually from 2000 to 2021 (data for 2001 missing).
In response to potential oil spill accidents, the Chinese government has taken various measures for oil spill preparedness and response, including building upon the legal and institutional framework, developing oil spill emergency response plans, establishing expert consultation groups, and strengthening the oil spill monitoring capacity. These measures have played an important role in reducing oil spill accidents for a long time. According to the statistics of the China Marine Environmental Quality Bulletin (2000) issued by the State Oceanic Administration and the China Marine Ecological Environment Status Bulletin (2002–2021) issued by the Ministry of Ecology and Environment, the volume of oil spilled into the sea has generally decreased since 2000 (Figure 8B). Despite this, due to the high hazard of oil spill pollution, the potential damage caused by oil spills cannot be underestimated in the foreseeable future.
The damage to tourism caused by oil spills can be roughly divided into ecological damage, economic damage, and social damage. Therefore, how to alleviate the crisis faced by the coastal tourism industry under the threat of oil spills is an important problem. From the perspective of the PSR model, the pressure from oil spill infrastructure and the state of coastal tourist destinations cannot be reduced in the short term, thus enhancing the ability to respond to oil spill disasters is a top priority. The oil spill response ability can be increased by improving preparedness and countermeasures and minimizing the potential damage by ensuring a timely and coordinated response. The spatial variation of the results obtained in this study can be used as a reference to deploy oil spill emergency facilities more effectively and to improve emergency response capabilities. In addition, to deal with the crisis faced by the coastal tourism industry, researchers have proposed that efforts should be made by three sectors: the government, the coastal tourism industry, and individual businesses (Ritchie and Jiang, 2019). A comprehensive engagement framework that includes the participation of all of the relevant stakeholders would help support the sustainable development of the coastal tourism industry.
5 Conclusions
Marine oil spills are a common problem faced by major maritime countries around the world, and they pose a serious threat to the sustainable development of coastal tourism. To minimize the negative impacts of oil spills on coastal tourist attractions, appropriate preparedness and response measures must be developed based on vulnerability assessments.
In this study, the spatial variations in the vulnerability of the coastal tourist attractions to oil spill stress were assessed by taking the Bohai Sea area as a case study. Multiple sources of data, including pressure, state, and response data, were used in this study, and a PSR vulnerability assessment framework and a GIS-based method were developed. A comparison of the spatial differentiation in seven management zones showed that there were obvious spatial variations in the vulnerability of the coastal tourist attractions to oil spill stress. Furthermore, the comparison results showed that although vulnerabilities vary both between and within sub-zones, the coastal tourist attractions surrounding this region as a whole were characterized by a high oil spill pressure, high sensitivity, low emergency response capability, and high vulnerability. Hence, the results of this study provide a reference for further studies aiming to mitigate the effects of oil spills on the coastal tourism industry. Further study is necessary to determine the degree to which preparedness and response improvements increase the response ability.
Data availability statement
The original contributions presented in the study are included in the article/supplementary material. Further inquiries can be directed to the corresponding author.
Author contributions
YW designed and performed the research, analyzed the data, and wrote the paper. PD, BL, and CC collected the data. All authors contributed to the article and approved the submitted version.
Funding
This work was financially supported by the Natural Science Foundation of Shandong Province (Youth Program) (grant number: ZR2022QD020).
Conflict of interest
The authors declare that the research was conducted in the absence of any commercial or financial relationships that could be construed as a potential conflict of interest.
Publisher’s note
All claims expressed in this article are solely those of the authors and do not necessarily represent those of their affiliated organizations, or those of the publisher, the editors and the reviewers. Any product that may be evaluated in this article, or claim that may be made by its manufacturer, is not guaranteed or endorsed by the publisher.
References
Balogun A. L., Yekeen S. T., Pradhan B., Yusof K. B. W. (2021). Oil spill trajectory modelling and environmental vulnerability mapping using GNOME model and GIS. Environ. pollut. 268, 115812. doi: 10.1016/j.envpol.2020.115812
Bera S., Das A., Mazumder T. (2019). A multi-objective framework for multidimensional vulnerability assessment–case of a coastal district of West Bengal, India. J. Environ. Manage. 249, 109411. doi: 10.1016/j.jenvman.2019.109411
Bhardwaj N., Bhaskarwar A. N. (2018). A review on sorbent devices for oil-spill control. Environ. pollut. 243, 1758–1771. doi: 10.1016/j.envpol.2018.09.141
Câmara S. F., Pinto F. R., da Silva F. R., de Oliveira Soares M., De Paula T. M. (2021). Socioeconomic vulnerability of communities on the Brazilian coast to the largest oil spill (2019–2020) in tropical oceans. Ocean Coast. Manage. 202, 105506. doi: 10.1016/j.ocecoaman.2020.105506
Castanedo S., Juanes J. A., Medina R., Puente A., Fernandez F., Olabarrieta M., et al. (2009). Oil spill vulnerability assessment integrating physical, biological and socio-economical aspects: Application to the cantabrian coast (Bay of Biscay, Spain). J. Environ. Manage. 91 (1), 149–159. doi: 10.1016/j.jenvman.2009.07.013
Chen J., Zhang W., Wan Z., Li S., Huang T., Fei Y. (2019). Oil spills from global tankers: Status review and future governance. J. cleaner production 227, 20–32. doi: 10.1016/j.jclepro.2019.04.020
Chilvers B. L., Morgan K. J., White B. J. (2021). Sources and reporting of oil spills and impacts on wildlife 1970–2018. Environ. Sci. pollut. Res. 28 (1), 754–762. doi: 10.1007/s11356-020-10538-0
Dandapat K., Panda G. K. (2017). Flood vulnerability analysis and risk assessment using analytical hierarchy process. Modeling Earth Syst. Environ. 3 (4), 1627–1646. doi: 10.1007/s40808-017-0388-7
de Castro E. V., Souza T. B., Thapa B. (2015). Determinants of tourism attractiveness in the national parks of Brazil. Parks 21 (2), 51–62.
Depellegrin D., Pereira P. (2016). Assessing oil spill sensitivity in unsheltered coastal environments: A case study for Lithuanian-Russian coasts, south-eastern Baltic Sea. Mar. pollut. Bull. 102 (1), 44–57. doi: 10.1016/j.marpolbul.2015.12.005
Fattal P., Maanan M., Tillier I., Rollo N., Robin M., Pottier P. (2010). Coastal vulnerability to oil spill pollution: The case of noirmoutier island (France). J. Coast. Res. 26 (5). doi: 10.3389/fmars.2020.560012
Garza-Gil M. D., Surís-Regueiro J. C., Varela-Lafuente M. M. (2006). Assessment of economic damages from the prestige oil spill. Mar. Policy 30 (5), 544–551. doi: 10.1016/j.marpol.2005.07.003
Gille S. T., Metzger E. J., Tokmakian R. (2004). Topography and ocean circulation. Oceanography 17, 47–54. doi: 10.5670/oceanog.2004.66
Gundlach E. R., Hayes M. O. (1978). Vulnerability of coastal environments to oil spill impacts. Mar. Technol. Soc. J. 12 (4), 18–27.
Guo W., Wu G., Jiang M., Xu T., Yang Z., Xie M., et al. (2016). A modified probabilistic oil spill model and its application to the dalian new port accident. Ocean Eng. 121, 291–300. doi: 10.1016/j.oceaneng.2016.05.054
Guo W., Zhang S., Wu G. (2019). Quantitative oil spill risk from offshore fields in the bohai Sea, China. Sci. total Environ. 688, 494–504. doi: 10.1016/j.scitotenv.2019.06.226
Ishizaka A., Labib A. (2011). Review of the main developments in the analytic hierarchy process. Expert Syst. Appl. 38 (11), 14336–14345. doi: 10.1016/j.eswa.2011.04.143
Jiang Y., Shi B., Su G., Lu Y., Li Q., Meng J., et al. (2021). Spatiotemporal analysis of ecological vulnerability in the Tibet autonomous region based on a pressure-state-response-management framework. Ecol. Indic. 130, 108054. doi: 10.1016/j.ecolind.2021.108054
Kanwal S., Rasheed M. I., Pitafi A. H., Pitafi A., Ren M. (2020). Road and transport infrastructure development and community support for tourism: The role of perceived benefits, and community satisfaction. Tourism Manage. 77, 104014. doi: 10.1016/j.tourman.2019.104014
Kumar M., Kalra N., Singh H., Sharma S., Rawat P. S., Singh R. K., et al. (2021). Indicator-based vulnerability assessment of forest ecosystem in the Indian Western Himalayas: An analytical hierarchy process integrated approach. Ecol. Indic. 125, 107568. doi: 10.1016/j.ecolind.2021.107568
Li S., Grifoll M., Estrada M., Zheng P., Feng H. (2019). Optimization on emergency materials dispatching considering the characteristics of integrated emergency response for large-scale marine oil spills. J. Mar. Sci. Eng. 7 (7), 214. doi: 10.3390/jmse7070214
Li Z., Liu H. (2022). How tourism industry agglomeration improves tourism economic efficiency? Tourism Economics 28 (7), 1724–1748. doi: 10.1177/1354816621100911
Liu B., Gong M., Wu X., Liu X. (2021). A comprehensive model of vessel anchoring pressure based on machine learning to support the sustainable management of the marine environments of coastal cities. Sustain. Cities Soc. 72, 103011. doi: 10.1016/j.scs.2021.103011
Liu X., Mehraliyev F., Liu C., Schuckert M. (2020). The roles of social media in tourists’ choices of travel components. Tourist Stud. 20 (1), 27–48. doi: 10.1177/1468797619873
Liu X., Meng R., Xing Q., Lou M., Chao H., Bing L. (2015). Assessing oil spill risk in the Chinese bohai Sea: A case study for both ship and platform related oil spills. Ocean Coast. Manage. 108, 140–146. doi: 10.1016/j.ocecoaman.2014.08.016
Lu X., Lu J., Yang X., Chen X. (2022). Assessment of urban mobility via a pressure-State-Response (PSR) model with the IVIF-AHP and FCE methods: A case study of Beijing, China. Sustainability 14 (5), 3112. doi: 10.3390/su14053112
Mansdorf S. Z. (1992). Personal protective equipment: Hazardous materials spill response. Prof. Saf. 37 (12), 16.
McCarthy J. J., Canziani O. F., Leary N. A., Dokken D. J., White K. S. (Eds.) (2001). Climate change 2001: impacts, adaptation, and vulnerability: Contribution of working group II to the third assessment report of the intergovernmental panel on climate change Vol. Vol. 2 (Cambridge University Press).
Meyer D. F., Meyer N. (2015). The role and impact of tourism on local economic development: A comparative study and leisure. Afr. J. Phys. Health Education Recreation Dance 21 (1.1), 197–214. doi: 10.10520/EJC172415
Mittal H. V. R., Langodan S., Zhan P., Li S., Knio O., Hoteit I. (2021). Hazard assessment of oil spills along the main shipping lane in the red Sea. Sci. Rep. 11 (1), 1–14. doi: 10.1038/s41598-021-96572-5
MNR (Department of Marine Strategic Planning and Economics, Ministry of Natural Resources) (2021). China Marine economic statistical bulletin, 2019, 2020. (Beijing: Department of Marine Strategic Planning and Economics, Ministry of Natural Resources).
Mujeeb-Ahmed M. P., Seo J. K., Paik J. K. (2018). Probabilistic approach for collision risk analysis of powered vessel with offshore platforms. Ocean Eng. 151, 206–221. doi: 10.1016/j.oceaneng.2018.01.008
Nasiri H., Mohd Yusof M. J., Mohammad Ali T. A. (2016). An overview to flood vulnerability assessment methods. Sustain. Water Resour. Manage. 2 (3), 331–336. doi: 10.1007/s40899-016-0051-x
Nelson J. R., Grubesic T. H., Sim L., Rose K. (2018). A geospatial evaluation of oil spill impact potential on coastal tourism in the gulf of Mexico. Computers Environ. Urban Syst. 68, 26–36. doi: 10.1016/j.compenvurbsys.2017.10.001
Pelling M. (2003). “Social vulnerability in the city,” in The vulnerability of cities: Natural disasters and social resilience. Ed. Pelling M. (London: Earthscan), 46–67.
Reed M., Johansen Ø, Brandvik P. J., Daling P., Lewis A., Fiocco R., et al. (1999). Oil spill modeling towards the close of the 20th century: overview of the state of the art. Spill Sci. Technol. Bull. 5 (1), 3–16. doi: 10.1016/S1353-2561(98)00029-2
Ritchie B. W., Jiang Y. (2019). A review of research on tourism risk, crisis and disaster management: Launching the annals of tourism research curated collection on tourism risk, crisis and disaster management. Ann. Tourism Res. 79, 102812. doi: 10.1016/j.annals.2019.102812
Singkran N. (2013). Classifying risk zones by the impacts of oil spills in the coastal waters of Thailand. Mar. pollut. Bull. 70 (1-2), 34–43. doi: 10.1016/j.marpolbul.2013.02.004
Sokhanvar A., Çiftçioğlu S., Javid E. (2018). Another look at tourism-economic development nexus. Tourism Manage. Perspect. 26, 97–106. doi: 10.1016/j.tmp.2018.03.002
Student J., Lamers M., Amelung B. (2020). A dynamic vulnerability approach for tourism destinations. J. Sustain. Tourism 28 (3), 475–496. doi: 10.1080/09669582.2019.1682593
Ventikos N. P., Vergetis E., Psaraftis H. N., Triantafyllou G. (2004). A high-level synthesis of oil spill response equipment and countermeasures. J. hazardous materials 107 (1-2), 51–58. doi: 10.1016/j.jhazmat.2003.11.009
Wang Y., Du P., Liu J., Chen C. (2023). Spatial variation of coastal wetland vulnerability to oil spill stress in the bohai Sea. Front. Mar. Sci. 9, 2648. doi: 10.3389/fmars.2022.1073906
Wang Y., Liu X., Yu X., Zheng X. (2018a). Assessing response capabilities for responding to ship-related oil spills in the Chinese bohai Sea. Int. J. Disaster Risk Reduction 28, 251–257. doi: 10.1016/j.ijdrr.2018.02.040
Wang Y., Liu X., Zhang C., Liu M., Xing Q. (2022). Assessing resource sensitivity to oil spill pollution in china’s coastal waters. Int. J. Environ. Sci. Technol. 19 (7), 6091–6098. doi: 10.1007/s13762-021-03522-9
Wang D. G., Niu Y., Qian J. (2018b). Evolution and optimization of china’s urban tourism spatial structure: A high speed rail perspective. Tourism Manage 64, 218–232. doi: 10.1016/j.tourman.2017.08.010
Yasseri S. F., Prager J. (2005). “Protection of pipelines in shipping lanes,” in International conference on offshore mechanics and Arctic engineering, (Halkidiki, Greece). vol. Vol. 41979. , 377–384.
Ye X., Chen B., Lee K., Storesund R., Li P., Kang Q., et al. (2021). An emergency response system by dynamic simulation and enhanced particle swarm optimization and application for a marine oil spill accident. J. Cleaner Production 297. doi: 10.1016/j.jclepro.2021.126591
Yu X., Xu H., Wang S. (2021). Vulnerability assessment and spatiotemporal differentiation of provinces tourism economic system based on the projection pursuit clustering model. Discrete Dynamics Nat. Soc. 2021, 1–12. doi: 10.1155/2021/4330728
Yu F., Xue S., Zhao Y., Chen G. (2018). Risk assessment of oil spills in the Chinese bohai Sea for prevention and readiness. Mar. pollut. Bull. 135, 915–922. doi: 10.1016/j.marpolbul.2018.07.029
Zhang B. (2021). “Research on the multifunctional oil spill recovery rescue ship,” in IOP conference series: Earth and environmental science, vol. Vol. 680. (IOP Publishing), 012114. doi: 10.1088/1755-1315/680/1/012114
Keywords: coastal tourist attractions, vulnerability assessment, oil spill, Bohai Sea, geographic information system
Citation: Wang Y, Du P, Liu B and Chen C (2023) Vulnerability assessment of coastal tourist attractions to oil spill stress based on a pressure-state-response framework: A case study of the Bohai Sea, China. Front. Mar. Sci. 10:1155291. doi: 10.3389/fmars.2023.1155291
Received: 31 January 2023; Accepted: 03 March 2023;
Published: 17 March 2023.
Edited by:
Andrew James Manning, HR Wallingford, United KingdomReviewed by:
Chao Chen, Zhejiang Ocean University, ChinaChuanyuan Wang, Yantai Institute of Coastal Zone Research, Chinese Academy of Sciences (CAS), China
Copyright © 2023 Wang, Du, Liu and Chen. This is an open-access article distributed under the terms of the Creative Commons Attribution License (CC BY). The use, distribution or reproduction in other forums is permitted, provided the original author(s) and the copyright owner(s) are credited and that the original publication in this journal is cited, in accordance with accepted academic practice. No use, distribution or reproduction is permitted which does not comply with these terms.
*Correspondence: Yebao Wang, eWViYW93YW5nX3l0dUAxNjMuY29t