 Matías Pizarro-Koch1,2,3*
 Oscar Pizarro3,4,5
 Boris Dewitte5,6,7,8
 Ivonne Montes9,10
 Aurélien Paulmier11
 Véronique Garçon11
 Hector Hito Sepulveda4
 Andrea Corredor-Acosta12
 Catalina Aguirre1,2,13,14Marcel Ramos7,8
- 1Escuela de Ingeniería Civil Oceánica, Facultad de Ingeniería, Universidad de Valparaíso, Valparaíso, Chile
- 2Millennium Nucleus Understanding Past Coastal Upwelling Systems and Environmental Local and Lasting Impacts (UPWELL), Coquimbo, Chile
- 3Millennium Institute of Oceanography, Concepción, Chile
- 4Department of Geophysics, University of Concepcion, Concepcion, Chile
- 5CECI, Université de Toulouse, CERFACS/CNRS, Toulouse, France
- 6Centro de Estudios Avanzados en Zonas Áridas (CEAZA), Coquimbo, Chile
- 7Departamento de Biología Marina, Facultad de Ciencias del Mar, Universidad Católica del Norte, Coquimbo, Chile
- 8Centro de Ecología y Manejo Sustentable de Islas Oceánicas, Universidad Católica del Norte, Coquimbo, Chile
- 9Instituto Geofísico del Perú, Lima, Peru
- 10Universidad de Ingeniería y Tecnología (UTEC), Lima, Peru
- 11Laboratoire d’Études en Géophysique et Océanographie Spatiales (LEGOS), Université de Toulouse, CNRS/IRD/UT3/CNES, Toulouse, France
- 12Centro FONDAP de Investigación en Dinámica de Ecosistemas Marinos de Altas Latitudes (IDEAL), Valdivia, Chile
- 13Center for Climate and Resilience Research (CR)2, Santiago, Chile
- 14Centro de Observación Marino para Estudios de Riesgos del Ambiente Costero (COSTAR), Valparaíso, Chile
Oxygen minimum zones (OMZs) are extended oceanic regions for which dissolved oxygen concentration is extremely low. They are suspected to be expanding in response to global warming. However, currently, the mechanisms by which OMZ varies in response to climate variability are still uncertain. Here, the variability of the subtropical OMZ off central Chile of a regional coupled physical–biogeochemical regional model simulation was analyzed for the period 2000–2008, noting that its fluctuations were significant despite the relatively weak amplitude of the El Niño/Southern Oscillation (ENSO). In particular, the interannual variability in the OMZ volume (OMZVOL, defined as the volume with dissolved oxygen concentration (DO) ≤ 45μM) was approximately 38% larger than that of the seasonal cycle, with maximum and minimum anomalies of OMZVOL taking place during two cold La Niña (LN) years (2001 and 2007). The model analyses further reveal that these anomalies resulted from a combined effect of changes in (1) the oxygen-poor waters poleward transport by the Peru–Chile undercurrent (PCUC), (2) the intensity of quasi-zonal jets influencing the transport of water to and from the OMZ, and (3) the zonal DO transport related to mesoscale eddy activity. Specifically, the interannual variability of the PCUC modulated primarily the DO contents of the OMZ core [(DO) ≤ 20μM] and secondarily the OMZVOL, while cross-shore DO transport by the zonal jets and the eddy fluxes played a major role in ventilating and shaping the offshore extent of the OMZ. When the OMZVOL was maximum (minimum), the PCUC transport was slightly increased (reduced), which was associated with a reduction (increase) in the ventilation of the OMZ through negative (positive) anomalies of zonal advection and DO eddy fluxes. Our results demonstrate that significant natural interannual variability in the subtropical OMZ off Chile originates from the interplay between oceanic equatorial teleconnection (PCUC transport) and local non-linear dynamics (the zonal jets and mesoscale eddies).
1 Introduction
In the present and projected global warming scenario, both model and observations indicate that the ocean is currently losing oxygen (Bopp et al., 2013; Schmidtko et al., 2017; Grégoire et al., 2021) and the deoxygenation trend will continue through the twenty-first century (e.g., Bindoff et al., 2019). This condition involves negative effects on marine ecosystems and the biogeochemical cycles (e.g., carbon, nitrogen, and many others) in regions where dissolved oxygen (DO) concentration is already low (Keeling et al., 2010; Breitburg et al., 2018; Pitcher et al., 2021), such as the oxygen minimum zones (OMZ) formed in Eastern Boundary Upwelling Systems (EBUS) (Karstensen et al., 2008; Paulmier and Ruiz-Pino, 2009; Garçon et al., 2019). Consensus among simulations participating in the Coupled Model Intercomparison Project (CMIP) has remained low in terms of the oxygen long-term trend in the OMZs (Cabré et al., 2015; Oschlies et al., 2018; Kwiatkowski et al., 2020), pointing out the limitations of the global low-resolution Earth System Model simulations in accounting for the non-linear upwelling dynamics in EBUS (Gruber, 2011) and a certainly important role of natural climate variability in these regions.
The sparse observational data suggests that natural climate variability in oxygen is certainly obscuring the long-term trend associated with external forcing of anthropogenic sources (Frölisher et al., 2009; Gilbert et al., 2010; Long et al., 2016; Graco et al., 2017; Ito et al., 2017). Therefore, a better understanding of the drivers related to the OMZ variability at the range of frequencies associated with basin-scale natural climate modes, such as the ENSO, is needed (Frischknecht et al., 2015; Mogollón and Calil, 2017; Espinoza-Morriberón et al., 2019). Among the EBUS experiencing a significant variability of the OMZ associated with the interannual to decadal timescales, the Humboldt Current System (HCS) is an archetype. This system is under the influence of the tropical Pacific climate variability through the efficient oceanic teleconnections pathways at different timescales (Pizarro et al., 2002; Ramos et al., 2008; Dewitte et al., 2012; Vergara et al., 2017; Sprintall et al., 2020). In addition, the HCS hosts one of the most intense and relatively shallow OMZ in the world (Huyer et al., 1987; Fuenzalida et al., 2009; Albert et al., 2010), which makes it an ideal laboratory for a better understanding of the OMZ climate variability despite the scarcity in long-term data sets (García-Reyes et al., 2015; Breitburg et al., 2018). Moreover, due to the large latitudinal extent of the OMZ in the HCS (from the equator to the subtropical region ~40°S), several physical and biogeochemical mechanisms interact heterogeneously over its spatial and temporal variability (Paulmier et al., 2006; Pitcher et al., 2021), which also undergo significant natural climate variability at a wide range of frequencies from intraseasonal to interannual and decadal time scales (Duteil et al., 2018; Duteil, 2019). Currently, a greater focus has been placed on the ENSO-OMZ relationship in the Northern HCS (Peruvian coast) from both observations (Gutiérrez et al., 2008; Graco et al., 2017; José et al., 2019) and model simulations (Mogollón and Calil, 2017; Espinoza-Morriberón et al., 2019), but less is known about the interannual fluctuations of the OMZ in the subtropical HCS off the Chilean coasts.
Previous modeling studies have shown the importance of the advective and eddy cross-shore (mainly zonal in our study region) fluxes in the seasonal variability of the OMZ off Peru and Chile. For example, Bettencourt et al. (2015) showed two key roles of the mesoscale eddies at the oceanic OMZ boundary between 380 and 600 m depth off Peru. On the one hand, the trajectory and mean position of the turbulent fluxes delimit and maintain the OMZ boundaries, and on the other hand, the high-frequency variability of these fluxes injects DO into the OMZ, being larger than the mean advective flux. Subsequently, Vergara et al. (2016) suggested the existence of distinct seasonal regimes for the ventilation of the Peruvian OMZ by eddies at its boundaries, whereas Espinoza-Morriberón et al. (2019) showed the impact of the enhanced mesoscale variability over the OMZ ventilation during the warm ENSO phase through the interaction between the horizontal and vertical eddy fluxes. Along with these mechanisms, the Peru–Chile undercurrent (PCUC) has been recognized as the main poleward transport pathway of the oxygen depleted Equatorial Subsurface Water (ESSW) mass along the Peruvian and Chilean coasts, extending southward the OMZ (e.g., Wooster & Gilmartin, 1961; Silva and Neshyba, 1979; Silva et al., 2009). Therefore, the variability of the OMZ features is associated with the PCUC variability (e.g., Hormazábal et al., 2006). Pizarro-Koch et al. (2019) showed a close relationship between the variability of the PCUC transport with the seasonal cycle of the OMZ in the extra-tropical region, where an intense southward transport by the PCUC is related to a larger OMZ volume off central Chile. However, this modulation is not homogeneous alongshore due to simultaneous processes, such as disturbances in the PCUC transport by the meridionally alternating jets [so-called striations; cf., Belmadani et al. (2017)] and mesoscale eddy activity. The latter suggests that these zonal jets and the mean eddy flux also shape the offshore boundary of the OMZ modulating its cross-shore extension, even when they are lower than the mean seasonal flux. In this study, we analyze the interannual fluctuations of the OMZ volume of the subtropical HCS off central Chile (30°S–38°S) in a regional simulation of a coupled physical–biogeochemical model. This simulation was analyzed in a previous study focusing on the seasonal cycle (Pizarro-Koch et al., 2019). This latter study showed that the seasonal variations of the OMZ off Central Chile can be interpreted as resulting from the interplay of mean and (mesoscale) eddy‐induced transports of DO. We extend here the analysis to the investigation of interannual fluctuations first observing that they are as large as that of the seasonal cycle despite a relatively low variance in tropical forcing over the period of study (2000–2008). Our motivation is thus to better understand the mechanisms associated with natural variability in the OMZ volume. Natural variability refers here to changes not linearly related to ENSO, which manifests in this simulation as opposite variations in OMZ volume during two cold La Niña years (2001 and 2007). This marked asymmetry is in response to ENSO forcing calls for revisiting this simulation (Pizarro-Koch et al., 2019) focusing on interannual timescales. This also complements previous studies that focused on the response of the OMZ to warm El Niño events (Mogollón and Calil, 2017; Garçon et al., 2019).
The rest of the paper is organized as follows: In Section 2, we present a brief description of the coupled model setup and its validation and details in the methods and diagnostics. In Section 3, we diagnosed processes (DO budget, PCUC transport fluctuations, and eddy flux) behind the interannual variability of the subtropical OMZ contrasting in particular the years 2001 and 2007. Finally, discussion and concluding remarks are presented in Section 4.
2 Model description and methods
2.1 Model
2.1.1 High-resolution coupled physical–biogeochemical regional model setup
The Regional Ocean Model System (ROMS) AGRIF version of the hydrodynamical model was used and coupled to the BioEBUS biogeochemical model. ROMS is a split-explicit (i.e., the barotropic and baroclinic momentum equations are resolved separately using different time steps), free surface oceanic model, which solves the rotating primitive equations, based on the Boussinesq approximation and the hydrostatic vertical momentum balance (Shchepetkin and McWilliams, 2003; Shchepetkin and McWilliams, 2005; Penven et al., 2006). ROMS is discretized using curvilinear coordinates in the horizontal and terrain-following (or sigma levels) coordinate transformations in the vertical. BioEBUS is a nitrogen-based biogeochemical model derived from the N2P2Z2D2 model of Koné et al. (2005), specially developed for EBUS (Gutknecht et al., 2013). BioEBUS provides an estimate of 10 nitrogen state variables associated with six compartments, having two size classes for phytoplankton (small—flagellate, large—diatoms), zooplankton (small—ciliates, large—copepods), and detritus (small and large size). Furthermore, four other compartments include dissolved organic nitrogen (DON) and three dissolved inorganic nitrogen (DIN) compartments represented by nitrate (NO3−), nitrite (NO2−), and ammonium (NH4+). In addition to nitrification, BioEBUS considers specific microbial OMZ processes interacting within the DIN pool, such as denitrification and anammox. Initial and boundary conditions for nitrate and DO are provided by the CARS-2009 climatology (Dunn and Ridgway, 2002; Ridgway et al., 2002). For NO2−, NH4+, and DON, the initial and lateral boundary conditions are established using constant (in time) profiles similar to those described by Koné et al. (2005). The reader is referred to Gutknecht et al. (2013) for more detailed information about the BioEBUS biogeochemical model.
The configuration used in this study (hereafter referred to as PCCC12) is based on the hydrodynamical solution of Dewitte et al. (2012) coupled to the BioEBUS model setup of Montes et al. (2014). This latter study tuned the BioEBUS model so as to realistically simulate the OMZ off Peru [see also Bettencourt et al. (2015)]. The parameter values of the model are provided in Appendix A of Montes et al. (2014). The model domain extends from the North Equatorial Pacific (12°N) to eastern South Pacific (40°S), and from the South American coast to 95°W, with 37 sigma levels and a horizontal resolution of 1/12°. The model was originally run for 50 years (1958–2008); however, here, we use only the last 9 years (2000–2008), which corresponds to the period when there is a larger confidence in the realism of the atmospheric forcing. The latter is based on the statistical downscaling of the low-resolution (2.5° × 2.5°) NCEP‐NCAR dataset using QuikSCAT data that covers the period 2000–2008, implying a better skill of the statistical model for that period (Goubanova et al., 2011; Cambon et al., 2013). PCCC12 has been also analyzed extensively over that period, indicating that it is skillful in simulating many aspects of the mean and seasonal circulation and OMZ (Vergara et al., 2016; Vergara et al., 2017; Pizarro-Koch et al., 2019). The following provides new material to evaluate the realism of the simulation for interannual timescales.
2.1.2 Model validation
We focus here on the validation of the model variability at interannual timescale over the period 2000–2008 considering that the model simulation was previously validated for the mean circulation and seasonal cycle (Dewitte et al., 2012; Vergara et al., 2016; Vergara et al., 2017; Pizarro-Koch et al., 2019; Conejero et al., 2020). We take advantage of a monthly ship-based time series of DO from the University of Concepcion at 36°30′S over the continental shelf (~90 m depth) for the period 2003–2008 (see Sobarzo et al. (2007) and Escribano et al. (2012) for more details) and current observations from the subsurface mooring located over the continental slope at 30°S. From this mooring, two Aanderaa current meters (RCM 8) at 220 and 480 m depth were used. Finally, satellite‐derived (level‐3 products of the Moderate Resolution Imaging Spectro‐radiometer‐MODIS‐Aqua mission) sea surface temperature (SST) and chlorophyll‐a (Chl‐a) concentration available from the National Aeronautics and Space Administration Jet Propulsion Laboratory PO.DAAC (https://podaac.jpl.nasa.gov/) are used (see Appendix).
The results of the comparison between model and observations indicate that the model simulates with some realism both the amplitude and the pattern of the observed SST (see Figures A1A, B) and Chl‐a (see Figures A1D, E) variability, although there is a tendency for the model to have a lower variability, which is more pronounced for primary production than for SST. Figure A2 indicates that the model has also some skill in simulation DO variability. The correlation between observed and model oxycline depth reaches in particular 0.60 (p< 0.05). The variability of the model and observation has also a comparable amplitude, although the model tends to yield a weaker value (see Table A1). The statistics for meridional current are provided in Tables A1, indicating that the model has also some skill in accounting for the interannual variations in the circulation. In particular, at the depth corresponding to the PCUC core (220m), the correlation between model and observation reaches 0.48 (p<0.05). This complementary validation with respect to previous works supports the expectation that the model can account for fluctuations of the OMZ characteristics at interannual timescales.
2.2 Methods
2.2.1 DO budget analysis
The evolution of the DO in BioEBUS is determined by the advection–diffusion equation (Gutknecht et al., 2013). In this regard, the DO budget is performed at interannual timescales by estimating the anomalies (deviation from the mean climatology) of the tendency terms in Equation (1) for the rate of DO change.
On the right-hand side, the first three terms represent DO advection (with the velocity vector); and are the horizontal and vertical eddy diffusion coefficient, respectively [is equal to 100 m2s−1 in our model, and is calculated based on the K-profile parameterization mixing scheme; Large et al. (1994)]. Note that the hydrodynamic model also has numerical diffusion associated with inherent spurious diapycnal mixing of the numerical scheme, so that is empirically adjusted. The (sources minus sinks) term includes all biogeochemical processes considered by the model that act as sources and sinks, in this case, for DO. The total physical term (named PHYS below) is the summed up of the advective term (ADV = ) and the horizontal () and vertical () mixing, hereafter called Hmix and Vmix, respectively. Note that ADV also contains diffusion (through numerical diffusion) and non-linear advection that can be interpreted as mixing (like that generated by mesoscale eddies), so that Hmix is not the “full” mixing that is taking place in the model (cf., Vergara et al., 2017). The ADV can also be represented separately through its contributions related to the different components as: the zonal (Xadv = −u∂(DO)/∂x), meridional (Yadv = −v∂(DO/∂y) and vertical (Zadv = −w∂(DO)/∂z) advection, where u, v, and w are the zonal, meridional, and vertical velocity components, respectively.
2.2.2 Estimation of the subtropical OMZ volume and PCUC transport
The OMZ volume (hereafter OMZVOL) was estimated following the methodology by Pizarro-Koch et al. (2019), choosing the water volume with a DO level limit ≤ 45 μM (~1 ml L−1) between 30°S and 38°S. This threshold is used, since it characterizes the hypoxic waters (e.g., Naqvi et al., 2010), which impact mostly the ecosystems far from the anoxic center of the ESP-OMZ off Peru. Here, the variability of the OMZ was analyzed using the OMZVOL and the mean DO inside this volume (OMZ intensity, denoted by OMZDO). In our analysis, both OMZVOL and OMZDO monthly anomaly time series were low-pass filtered using a 7-month running mean.
The transport associated with the Peru–Chile undercurrent (hereafter PCUCTR) was estimated through spatially averaging the southward flow (only velocities with absolute values higher than 0.02 m s−1) in a rectangular box with a cross-shelf extension spanning from the coast to ~100 km and between 80 and 800 m depth (vertical extension). This corresponds approximately to the location of the mean PCUC in the range of latitudes corresponding to our region of interest (see Figure 3 in Pizarro-Koch et al., 2019). The southward flow corresponds here to the negative meridional component of the currents. The PCUC anomalies were 7-month low-pass filtered similarly as the OMZ time series described above. In addition, the mean DO inside the region encompassed by the mean position of the PCUC (for values of mean meridional velocity higher than −0.02 m s−1) was also estimated. It is referred to hereafter as PCUCDO.
2.2.3 Remote and local forcing
Since the remote equatorial forcing is composed of Kelvin waves having different characteristics (vertical structure, energy, and phase speed), it is important to consider the waves that have the most energy with clear propagating characteristics. In the far eastern Pacific, these correspond to the wave of the gravest vertical modes (1–3) (Dewitte et al., 1999). We thus derive the contribution of the Kelvin waves of the first three baroclinic modes to sea level anomalies based on a vertical mode decomposition of the SODA Reanalysis. The method consists in projecting the pressure and zonal current fields onto the vertical modes derived from the mean vertical stratification at each grid point along the equator. We further projected the obtained quantities on the theoretical meridional structures of the equatorial waves in order to derive the equatorial Kelvin waves’ amplitude (in equivalent sea level). Here, we will consider a time series of the Kelvin wave amplitude at 90°W along the equator for the summed-up contribution of the first three baroclinic modes, which corresponds to the longitude of the open boundary of the regional model.
The zonal (Taux) and meridional (Tauy) wind stress (hereafter ZWS and MWS, respectively) are from the model forcing, which is based on the Fairall et al. (2003) bulk parameterization using wind speed as inputs. Interannual variability of the wind stress was estimated in a coastal band spanning 210 km. In addition, the wind stress curl (hereafter WSC) was estimated in this coastal band excluding the five grid points close to the coast due to the limitation of the QuickSCAT data to account realistically for the wind drop-off (Astudillo et al., 2017).
2.2.4 Estimation of the DO eddy fluxes
In order to further interpret the processes at work, we estimated the DO eddy fluxes. In particular, the mean non-linear advection that is part of PHYS can be interpreted as the divergence of the DO eddy flux. The latter corresponds to the flux associated to the interannual fluctuations in DO and currents. It writes as follows: , where the tilde refers to monthly mean anomalies relative to the climatological seasonal cycle.
We also estimated the mesoscale DO eddy flux that is associated with mesoscale eddy activity assumed to be dominated by energy in the range of frequencies higher than ~3 months. These fluxes can also be experienced interannual variations, which is estimated as the covariance between horizontal velocity fluctuations (u’, v’) and DO’, i.e., ⟨u′DO′⟩3‐m and ⟨v′DO′⟩3‐m, where “⟨⟩3‐m” stands for a 3‐month moving average, and the prime refers to the intraseasonal anomalies calculated as the departure from 3-month running mean of the total fields like in Pizarro-Koch et al. (2019).
2.2.5 ENSO indices
Over the period of interest, ENSO variability can be characterized by an index accounting for Central Pacific SST variability. This index, named the C index, is obtained from the decomposition in Empirical Orthogonal Function (EOF) of the SST anomalies in the tropical Pacific (120°E–80°W; 11°S–11°N) following Takahashi et al. (2011). SST is from HadISST v1.1. data set (Rayner et al., 2003). The C index accounts for both warm CP El Niño events (C>0) and La Niña events (C<0). Defining CP events when the C index in DJF is above 1 (1 standard deviation), one finds two CP El Niño (03/2002, 05/2004) and three La Niña events (1999/2000, 2000/2001, and 2007/2008). Note that an El Niño event also took place in 2006/2007, but this event had its peak SST in the eastern Pacific and was classified as an Eastern Pacific (EP) El Niño event (Yu et al., 2012). To characterize the variability in the region of influence of this type of event, we will use the E index that is obtained similarly as the C index [see Takahashi et al. (2011)]. Despite the relatively low variance of the E index over the period of interest, it still informs on equatorial Kelvin wave activity in the eastern Pacific because SST is sensitive to vertical advection processes there. Note that any historical ENSO indices can be approximated by the linear combination of the E and C indices (Takahashi et al., 2011). In particular, the ONI index (SST anomalies averaged over the region (170°W–120°W; 5°S–5°N) can be approximated by 0.52E + 0.62C through bilinear regression analysis. The mechanisms modulating the OMZ at ENSO timescales are numerous (Pitcher et al., 2021), so that the interpretation of the relationship between the ENSO indices and the OMZ metrics defined here is not straightforward. Still, we find a significant correlation between them and the C index in particular, with the C index ahead by a few months, confirming the key role of CP El Niño and La Niña variability in modulating the OMZ properties over this period.
3 Results
3.1 Variability of the subtropical OMZ (a study case: 2001 versus 2007)
The 9-year (2000–2008) mean value of the subtropical OMZVOL off central Chile (30°S–38°S) was ~4.5×10⁴ km3, with a thickness and offshore extension decreasing southward (Figures 1A, B). The core of the OMZ in this region was located over the continental slope centered at ~300 m depth (see shading blue color Figure 1B), and the mean OMZDO for the whole period was 32 μM. The OMZDO time series showed a large variability and was significatively anti-correlated with the OMZVOL at 95% confidence level (Figure 1C; r =−0.62 at 3-months lag) with the OMZDO ahead of the OMZVOL by 3 months. The OMZVOL time series also showed an interannual variability during the study period with maximum and minimum values during 2001 and 2007, respectively (Table 1; Figure 1C). Even though changes related to the ENSO cycles—in both the model and observed ENSO indices—were weak during 2000–2008 with a standard deviation of about 0.6°C, meanwhile, the historical series (1950–2020) of the ONI index showed a slightly larger standard deviation (0.8°C). During 2000–2008, the interannual changes in the OMZVOL were larger than those associated with the typical seasonal variability (Figure 2A; Table 1). In particular, the OMZVOL in 2001 is 38% larger than the mean value. Two other relative maxima with positive anomalies were observed in 2006 and 2008, but< 5% over the mean value. In fact, the OMZVOL showed mostly negative anomalies during the period 2003–2008 with a minimum during 2007 that was 23% smaller than the mean value. The OMZ 3D structure during these 2 years (2001 and 2007) with maximum/minimum anomalies is shown in Figures 2B, C, which illustrates the drastic change in OMZVOL when these years are compared, being 3 (1.7) times larger in 2001 than in 2007 when a threshold of 20 (45) μM is used (Table 1).
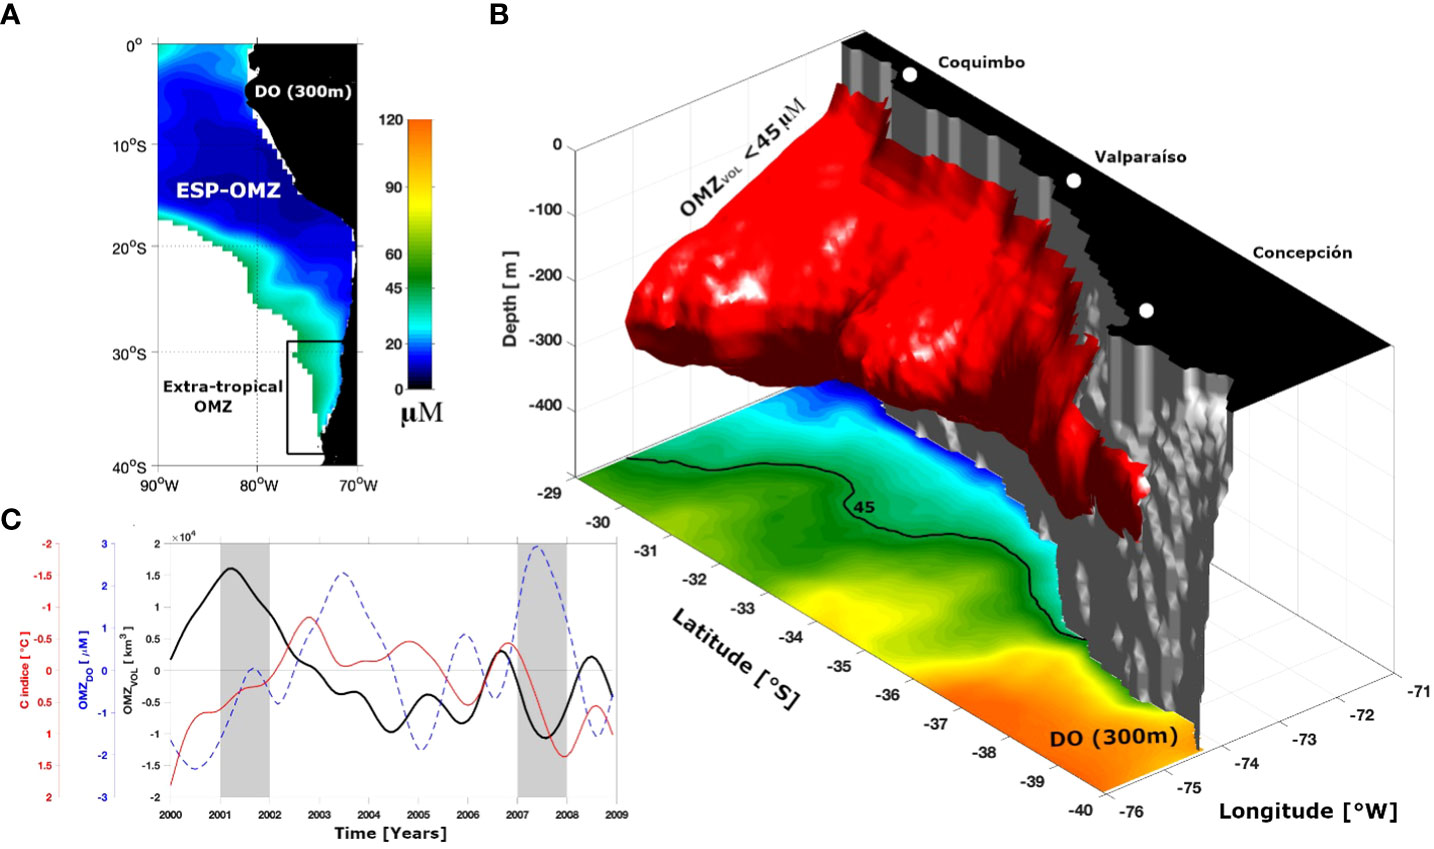
Figure 1 Climatological mean of the dissolved oxygen (DO) at 300 m depth in the eastern South Pacific Oxygen Minimum Zone (ESP-OMZ) obtained from CARS 2009 climatology (A). The area of study defined here such as the extra-tropical region of ESP-OMZ is located between 30°S - 38°S and 76° W – and the coast (black square). A 3-D annual mean volume of the extra-tropical OMZ modeled defined here as the region with 9-year (2000-2008) mean DO < 45 μM (red isosurface) (B). The shading color represents the spatial DO distribution modeled at 300m depth. The interannual anomalies of the OMZ volume (black line; OMZVOL), the DO within OMZ (blue dashed line; OMZDO) obtained from the model, and the Central El Niño indice (C indice; red line) (C). The shaded area corresponds to the years 2001 and 2007.
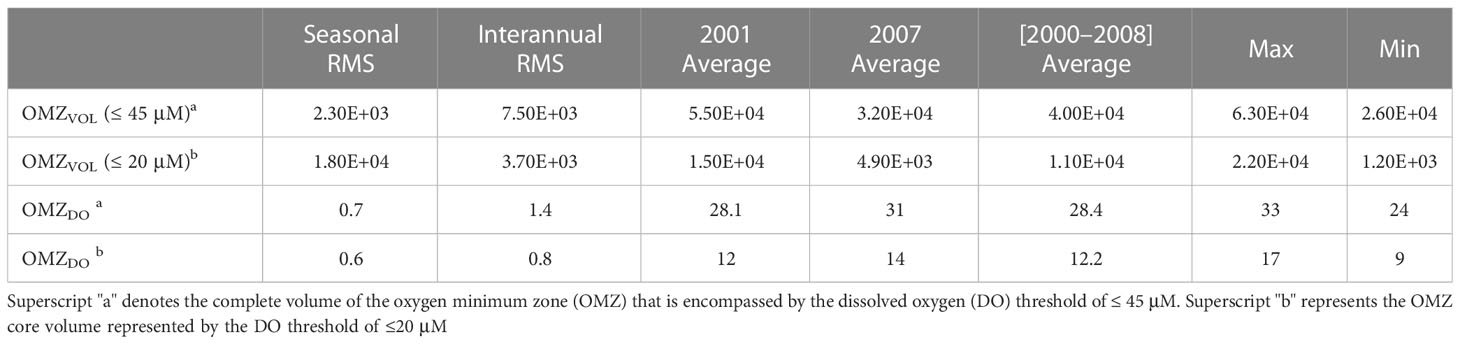
Table 1 Root mean square (RMS) and descriptive statistics of the seasonal and interannual variability of the OMZVOL (in km3) and OMZDO (µM).
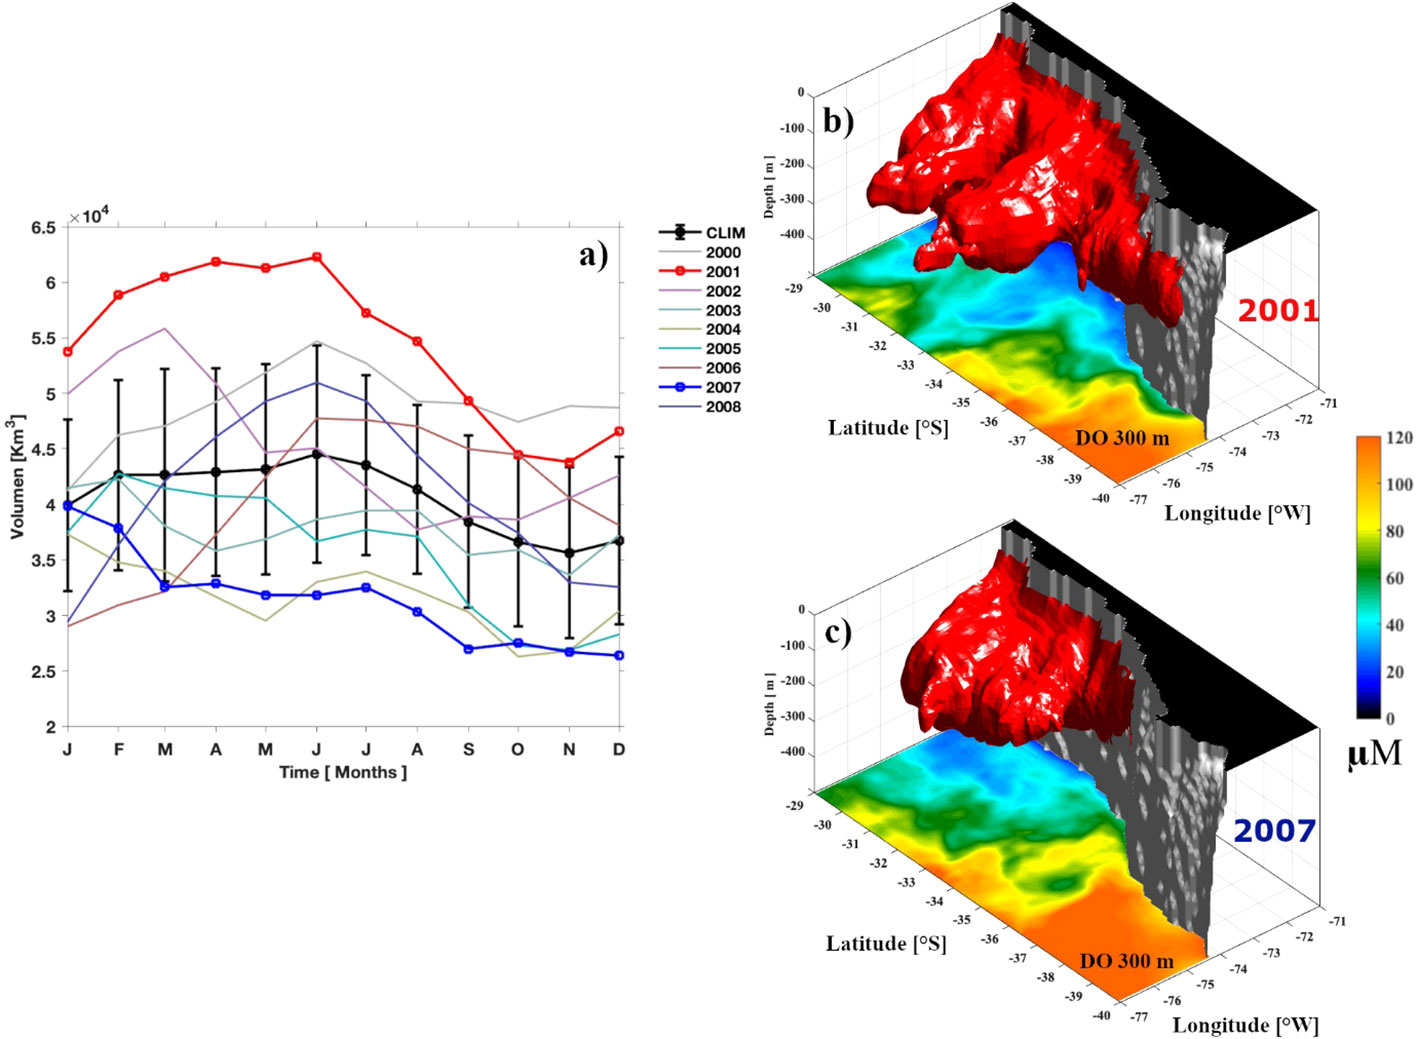
Figure 2 Seasonal cycles (black square-line) and monthly time series between of the extratropical OMZ volume between 2000-2008 years (A). The 2001 and 2007 years are represented by red and blue square-line, respectively. The climatological seasonal cycle and its standard deviation of the volume are shown by black square-line and error bar. Panels (B, C) show 3-D distributions of the annual mean extratropical OMZ volume for the years 2001 and 2007, respectively, represented by red isosurfaces.
With regards to the water column structure, T-S-DO diagram and alongshore sections of averaged DO over the first 80 km from the coast for 2001 and 2007 are presented in Figures 3A–D, along with their difference in Figure 3F. Together with this, the water masses proportion (in %) as a function of latitude from the surface to 1,500 m depth was also estimated following the definition by Silva et al. (2009) (Figure 3G). The larger differences in DO concentration were observed in the core of the OMZ and around the upper oxycline, mainly south of 34°S. During 2007, the ESSW showed a reduced proportion inside the OMZ—consistent with a large increase of OMZDO observed this year—particularly important south of 34°S, while the AAIW and SAAW showed an increase (Figure 3G). In contrast, in 2001, when the OMZVOL was much larger (and OMZDO relatively low; Figure 2B), the proportions of the water masses showed only slight changes compared to their mean values. Figure 1C also shows that some fluctuations of the OMZ_DO are not related to changes in the OMZ_VOL, suggesting internal redistribution of DO (below<45 µM).
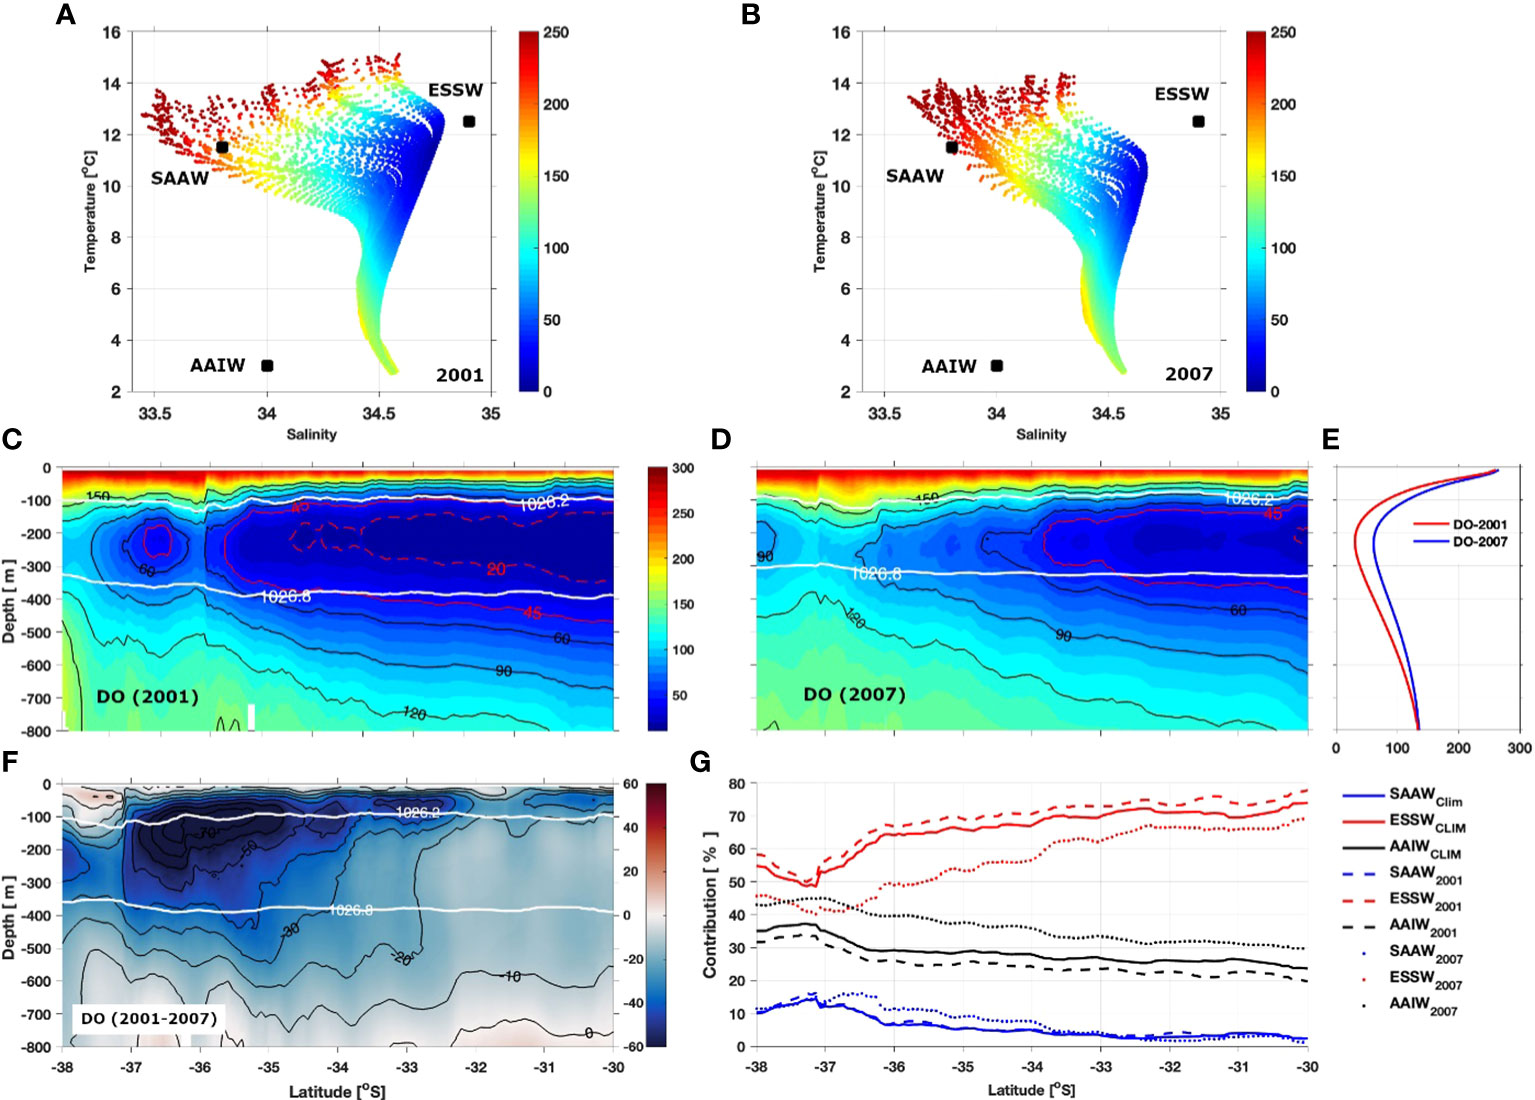
Figure 3 T‐S‐DO diagrams obtained from a meridional section during 2001 (A) and 2007 (B) for the coastal band (Only water encompassing the region within the first 80 km from the coast and from the surface to 1500 m depth in the whole domain were considered). Annual mean of the DO meridional section during 2001 (C) and 2007 (D). The vertical mean of the DO sections (E) and the difference between both periods (F). Background color in (μM) and the isopycnals of 1026.2 and 1026.8 kgm−3 are shown overlaid in white. Water masses percentage estimated between 1026.2 and 1026.8 kgm−3 isopycnals (G). The water masses are Subantarctic Water, (SAAW; 11.5°C, 33.8), Equatorial Subsurface Water (ESSW; 12.5°C, 34.9) and Antarctic Intermediate Water (AAIW; 3°C, 34). The water mass and their thermohaline indices (T, S) indicated above were obtained from Silva et al., 2009 and were used here to compute the water mass proportions.
3.2 DO budget analysis
To analyze the drivers of DO inside the OMZ off central Chile, we used the advection-diffusion Equation (1). Here, we followed a similar methodology as in Pizarro-Koch et al. (2019) who analyzed the seasonal variability for the same region. Table 2 shows the average values and the RMS values for the different terms that make up this equation for the entire period (2000–2008). The different terms were averaged inside the mean volume conforming the OMZ (i.e., the fixed volume with a mean DO value lower than 45 μM, as shown in Figure 2B). The anomalies of the different terms for the mean OMZVOL involved in the balance (1) are shown in Figure 4. It is worth mentioning that a linear regression indicates a slight negative (positive) trend of the DO rate of change (DO) of ~ −1.62 m s−1 μM (1µM) observed during the studied period (2000−2008; Figure 4A), which may be related to low-frequency variability like, e.g., decadal changes (not analyzed in this study). According to the physical terms, the three components of advective anomalies are of the same order of magnitude (Figure 4B), whereas the terms involving small-scale (subgrid) mixing are lower by two orders of magnitude (Figure 4C). This implies that PHYS anomalies, which represent all the physical terms in Equation (1), are mainly dominated by the advection terms (ADV) and is significantly (95% confidence) correlated with them (particularly, the correlations between PHYS and each of the advection anomalies components are: r = 0.64 with Xadv, r = -0.51 with Yadv, and r = 0.77 with Zadv). Additionally, PHYS anomalies (dashed red line in Figure 4B) is highly correlated (r = 0.8) with ∂DO/∂t at zero lag (red line in Figure 4A). The horizontal advection terms, Xadv and Yadv (magenta and blue lines, respectively in Figure 4B), are inversely correlated (r=-0.9) compensating each other and suggesting that over this period, the Zadv anomalies largely govern PHYS anomalies. Note that this does not imply that horizontal advection is not important for explaining DO variability along a vertical section or at particular depths within the OMZ (see Section 3.4).
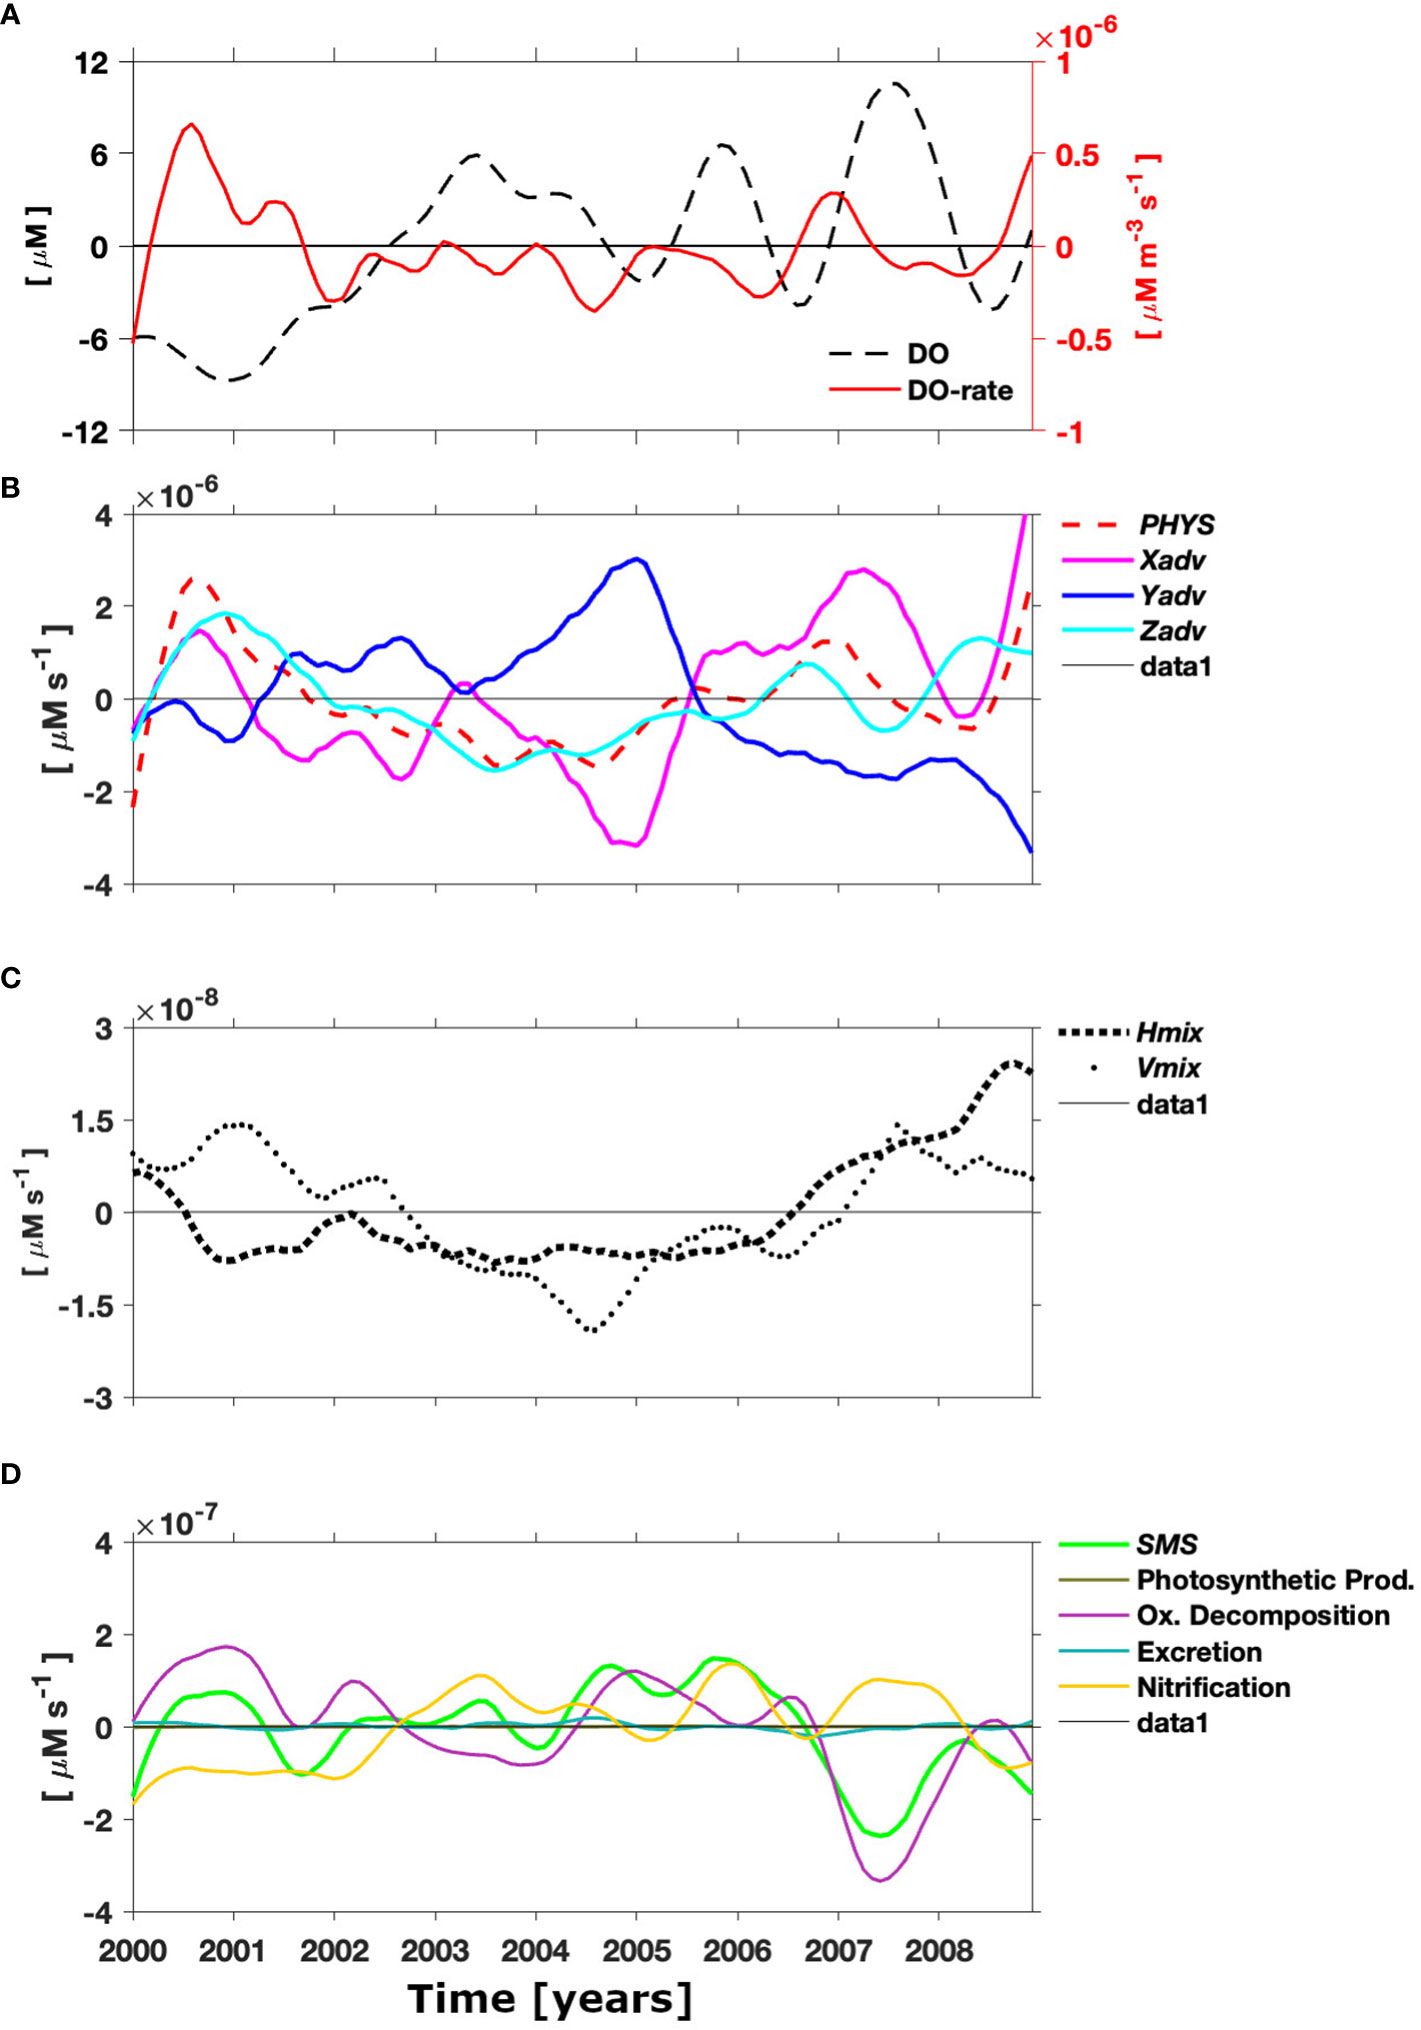
Figure 4 Interannual DO budget within the mean OMZ volume (see Figure 1B). Interannual anomalies of DO and DO rate of change (∂DO/∂T) (A). The different terms of the right-hand side of Equation (1) are also shown (B) the physical term (PHYS red dashed line) is the summed-up contribution of advection and mixing. The advection term (ADV) is composed, in turn, by zonal (Xadv, magenta line), meridional (Yadv, blue line), and vertical (Zadv, cyan line) advections. The mixing terms are the summed-up contribution of the horizontal diffusion (Hmix; gray line) and vertical diffusivity (Vmix, dark green line) (C). The biogeochemical fluxes (SMS, light green line) represent the “source-minus-sink” contribution to the DO rate of change due to biogeochemical processes; among them are photosynthetic production (dark-green line), oxic decomposition (dark-magenta line), excretion (skyline), and nitrification (yellow line) (D).
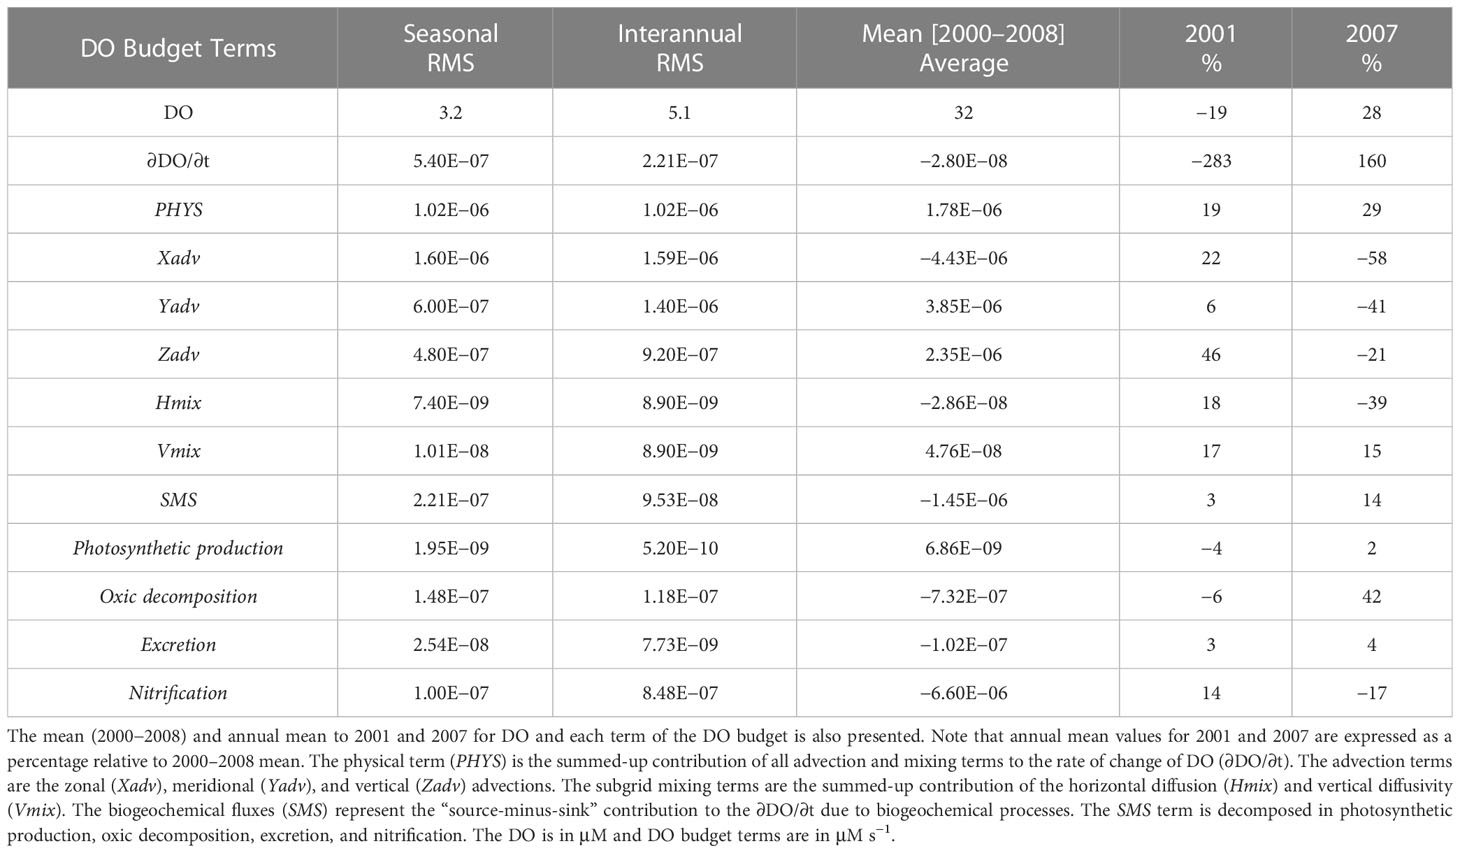
Table 2 Root mean square (RMS) of the seasonal and interannual variability of the DO concentration and the different terms of the DO budget in a fixed volume defined as the region with 9‐year (2000–2008) mean DO ≤ 45 μM, as shown in Figure 1B.
During 2001, PHYS anomalies were slightly positive, while in 2007, they were slightly negative. In both cases the previous year (i.e., 2000 and 2006), PHYS showed positive anomalies, while Xadv term showed an inverse phase during 2000 (negative anomalies) and 2007 (positive anomalies). Due to the different terms involved in the balance being spatially averaged in the whole OMZ volume, there is little difference between 2001 and 2007 regarding the magnitude of these terms, although both years show large differences in OMZVOL. On the other hand, interannual anomalies of the SMS was less than that of PHYS with an RMS value reaching 5.8 × 10⁻⁸ μM s−1, which contribute approximately 30% of the DO rate of change (∂DO/∂t). The main processes that governed the SMS term were the oxic decomposition and nitrification processes (Figure 4D). Only a large negative anomaly of oxic decomposition processes was observed during 2007 associated with the contraction of the OMZ. For comparison, the RMS of the seasonal cycle for all the above terms and their mean values for 2001 and 2007 years are indicated in Table 2. Additionally, Figure 5 shows the seasonal evolution of OMZDO and DO rate of change (∂DO/∂T) during 2001 and 2007, which are contrasted with the climatological seasonal cycle. We also display the evolution of the PHYS and SMS terms. Consistently, both PHYS and ∂DO/∂t time series show similar seasonal variability, which emphasizes the prominent role of physical processes in controlling the averaged seasonal variability of DO inside the OMZ. Overall, PHYS shows a larger (smaller) annual and semi-annual amplitude of the seasonal cycle in 2001 (2007) with respect to the climatological mean, with a maximum during the austral winter season (Figure 5C). Meanwhile, the SMS shows a similar magnitude for both years (2001 and 2007) and climatological mean, but during 2001, a phase shift by 2 months of the seasonal cycle was observed (Figure 5D).
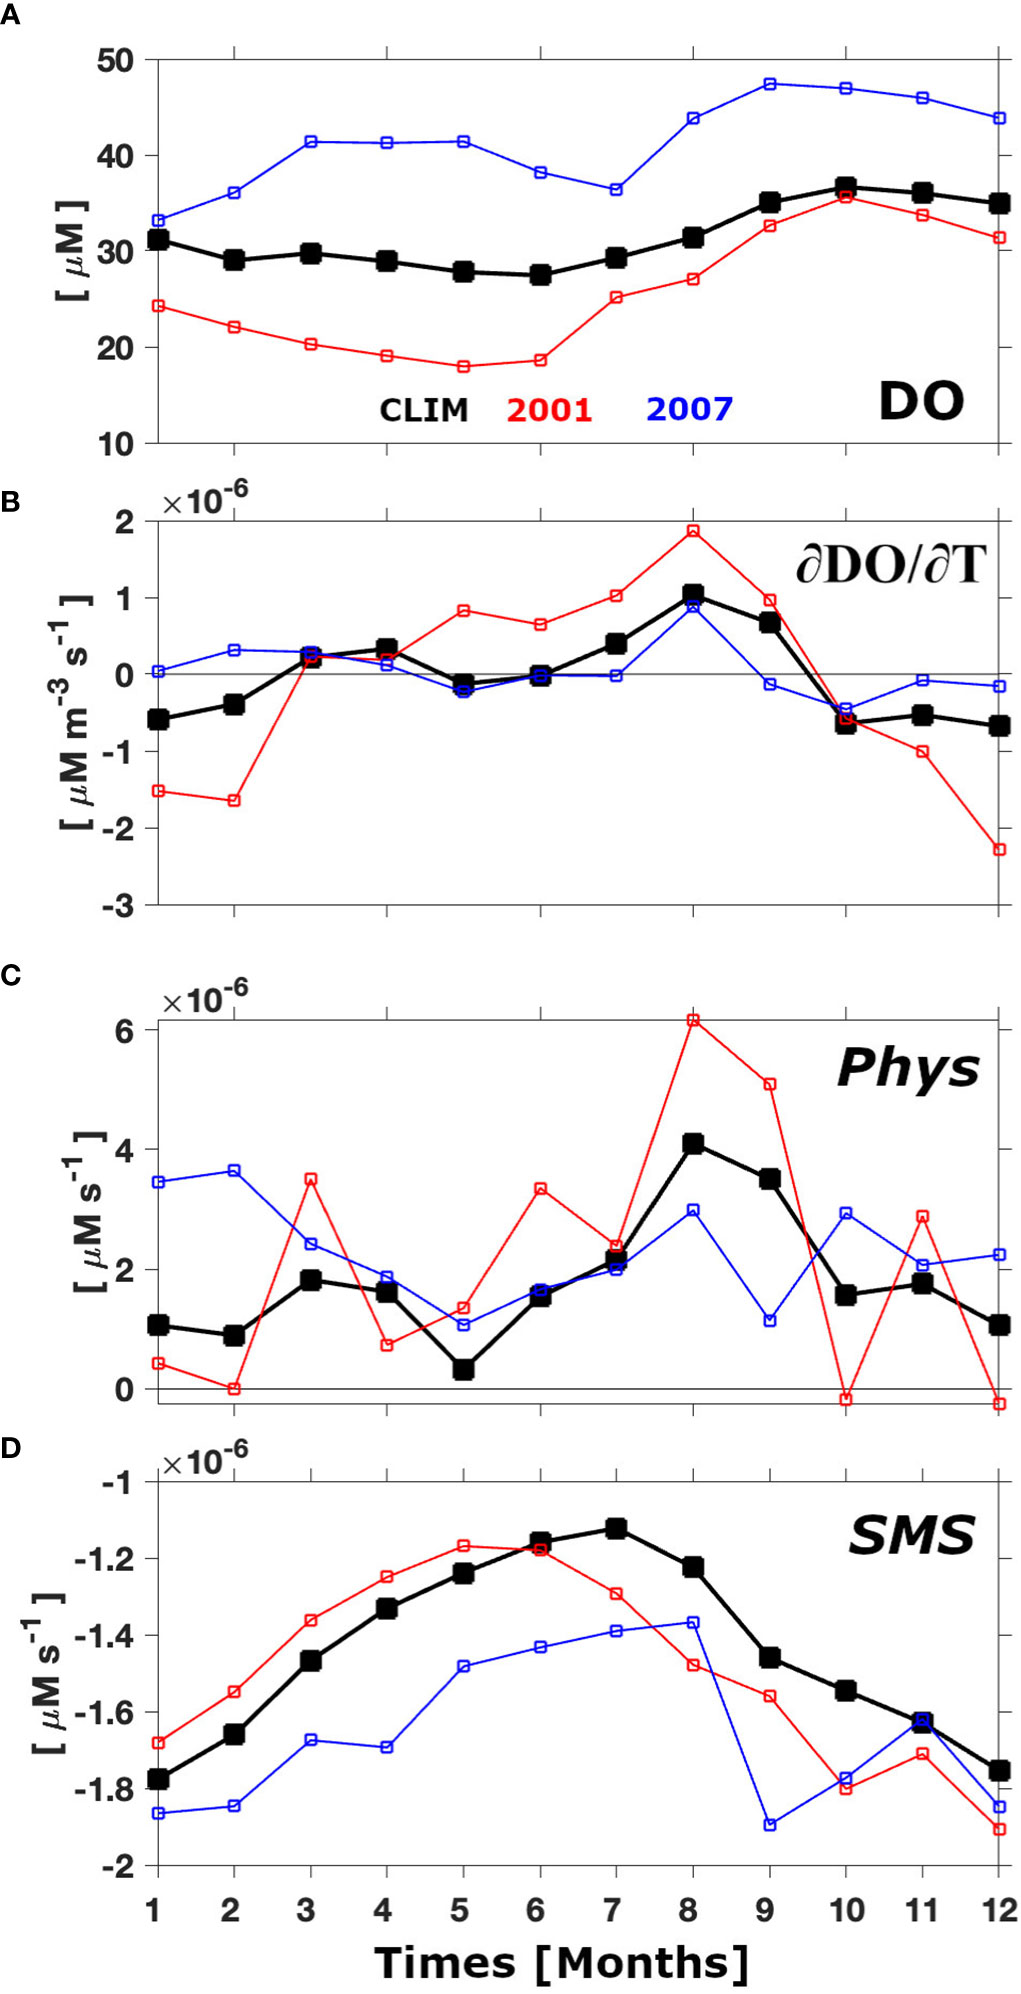
Figure 5 Seasonal cycle of OMZDO (A) and DO rate of change (B); (∂DO/∂T) during 2001 (red line) and 2007 (blue line) CLIM correspond to the climatology seasonal cycle (in this case, the OMZ is considered as fixed volume defined as the region with 9-year (2000-2008) mean DO ≤ 45 μM; see Figure 1B). The seasonal DO Budget is represented by the summed-up contribution of PHYS (C) and SMS (D). PHYS is the summed-up contribution of advection plus mixing, and SMS represents the “source-minus-sink” contribution to the ∂DO/∂T due to biogeochemical processes; among them are photosynthetic production, oxic decomposition, excretion, and nitrification.
3.3 Physical OMZ drivers
In this section, we analyze the physical drivers described by Pizarro-Koch et al. (2019) for the seasonal cycle of the OMZ in order to evaluate if they operate at interannual timescales and if they can explain the asymmetry of the response of the OMZ between the two La Niña events of 2001 and 2007. These include the poleward flow (i.e., Peru–Chile undercurrent) that represents the conduit by which the OMZ off Chile is connected to the tropical OMZ off Peru, the local wind forcing (meridional wind stress (MWS) and wind stress curl (WSC)), and the equatorial Kelvin forcing. In addition, the DO transport associated with mesoscale activity (i.e., the eddy fluxes and zonal jets) with the OMZ extent will also be evaluated.
3.3.1 Peru–Chile undercurrent
First, the PCUCTR and PCUCDO anomalies at different latitudes were assessed (see Figure 6). In general, for the entire period, a reduction in PCUCTR was associated with an increase in PCUCDO (r = −0.6, significant at 95% confidence level) with the larger changes in PCUCTR between 2004 and 2008 over the entire region. In particular, a significant weakening (positive anomalies) of the PCUCTR was observed during 2007, consistent with the minimum OMZVOL and the increase in PCUCDO. In contrast, a slight increase in the PCUCTR during 2001 was observed to be associated with a negative anomaly of PCUCDO (Figure 6). The Pearson’s correlation between PCUCTR and OMZVOL was rather small with a maximum value for correlation of −0.4 (significant at 95% confidence level) reached at 3−4 months lags (PCUCTR ahead OMZVOL), while the magnitude of the correlation between PCUCTR and OMZDO peaked at 0.75 at 3–4 months lags (significant at the 95% confidence level), indicating that the PCUCTR variability plays a more important role over the OMZDO than over the whole OMZVOL. Note that using a threshold of DO< 20 μM for accounting for the OMZ core, the correlation between the OMZVOL20 (OMZDO20) and the PCUCTR increases to r = −0.6 (r = 0.8) at zero-lag and becomes significant at the 95% confidence level. These results indicate that the PCUC modulates the OMZ mostly over the continental slope, where the PCUC and OMZ cores are located, but its fluctuations cannot explain the variability of the whole OMZ volume.
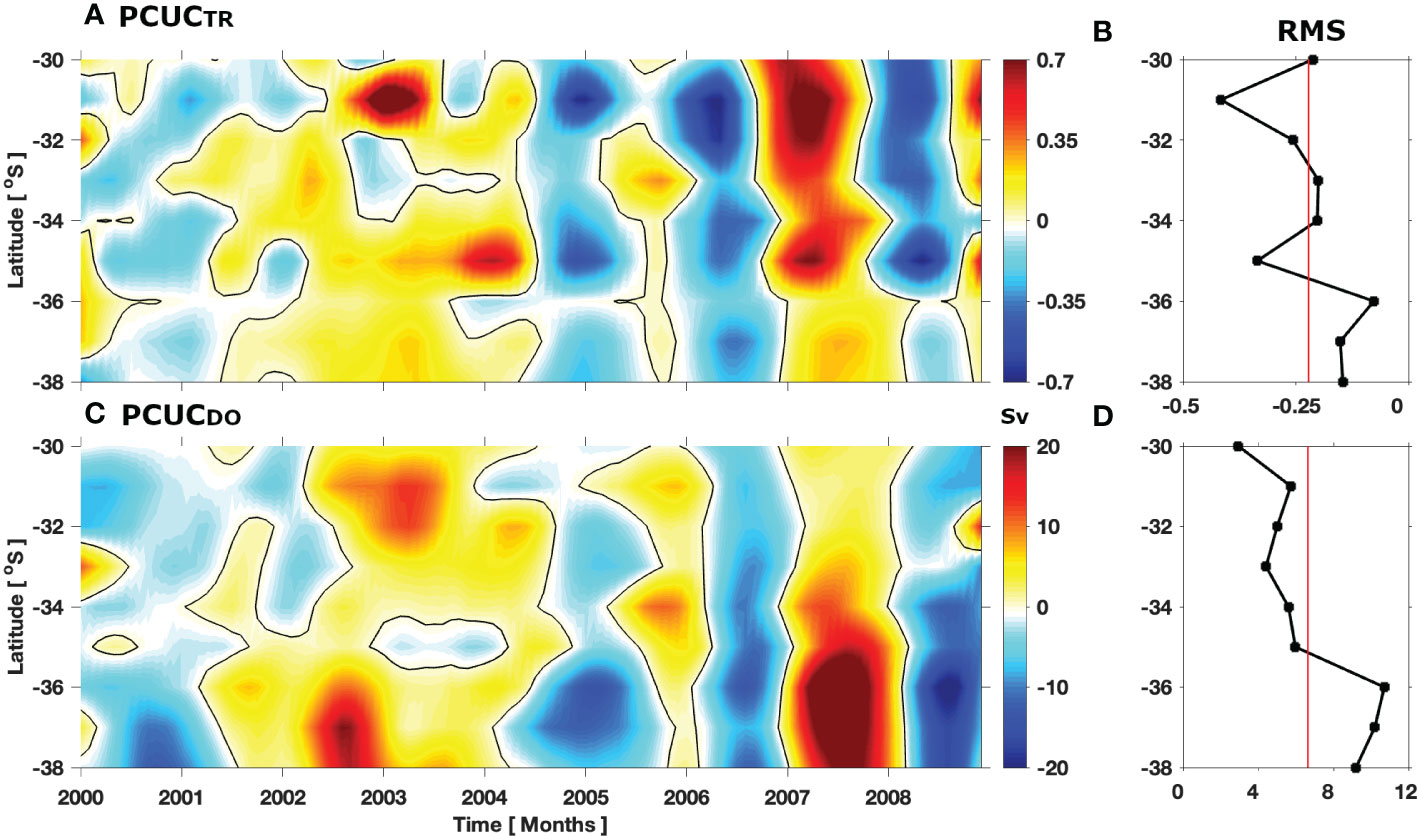
Figure 6 Interannual anomalies of the alongshore southward transport associated to the PCUC modeled (in Sv, 1 Sv = 106 m3s−1) (A) and mean DO inside the PCUC defined by the isopleth of −0.02 m s−1 in the first 100 km from the coast and between 80 and 800 m depth (C). Positive anomalies in PCUCTR and PCUCDO indicate a weakening of the PCUC and ventilation, respectively. The root mean square (RMS) of the interannual variability of PCUCTR and PCUCDO is shown in panels (B, D), respectively. Note that for panel (A), positive (negative) values indicate weak (strong) southward transport.
We now consider three metrics associated with local and remote forcings of the PCUC: the equatorial Kelvin wave (EKW) and the local wind forcing accounted for here by MWS and WSC. Using a multilinear regression analysis, we assess the relationship between the PCUC variability and these forcings in an alongshore-average (between 30° and 38°S) cross-shore section (see time series in Figure 7A). In the multilinear regression analysis, the PCUCTR is the predictand, whereas the local forcings (MWS and WSC) and remote forcing (EKW) are the predictor variables taken at zero lag. The results indicate that the PCUCTR variability is dominantly accounted for by MWS having the largest contribution of 40% (r2 = 0.43), compared to 22% and 19% for EKW and WSC, respectively. This series can be interpreted as the coastal sea level (or pycnocline depth near the coast) variability, which for very low frequency (interannual periods) varies in phase along the coast of South America (e.g., Pizarro et al., 2001). These fluctuations then propagate offshore as a long Rossby wave. Then, when the coastal EKW series is decreasing after a maximum we can expect that the maximum has propagated offshore, generating an eastward pressure gradient force which is in geostrophic balance with a northward flow, that is with a weakening of the PCUC. This weakening of the PCUC after a maximum in the EKW series is consistent with that observed in Figure 7A. There, the current was weaker in 2007 (positive PCUCTR anomalies, black line) several months after the maximum of the EKW series (red line). The negative correlation between EKW and PCUCTR indicates that the PCUC is ahead of EKW, within about only 3-month. These results may be influenced for relatively high-frequency fluctuations when the interannual variability is weaker or the impact of atmospheric ENSO teleconnection over the PCUCTR over this period. During 2001 associated with a slightly strengthened PCUCTR, the WSC showed a weak amplitude and MWS anomalies reached values around -0.01 N m2 while these atmospheric forcings were twice larger during 2007. Contrary, the EKW showed smaller anomalies (upwelling) during 2007 than 2001 (Figure 7). In summary, the interannual variability of the PCUCTR results from both equatorial and local forcing and both can be modulated by the ENSO cycles. Longer simulations are required to clarify the PCUCTR dynamics at interannual time scales and how it is locally and remotely modulated. This case study focused on 2 peculiar events suggests that the PCUCTR dynamics at interannual time scales could also act as a driver of the low-frequency OMZ variability.
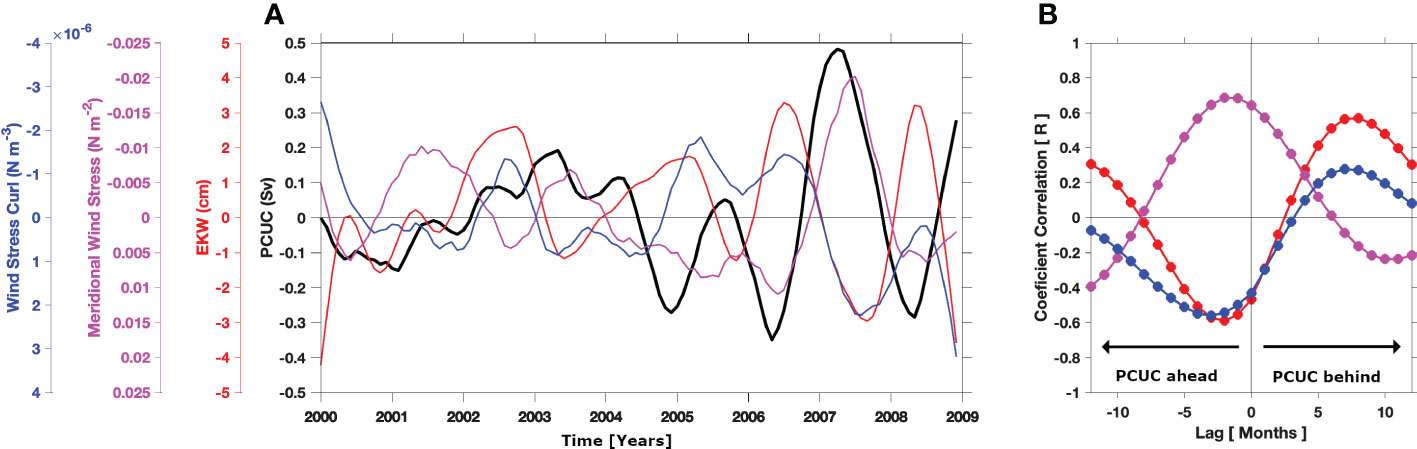
Figure 7 (A) Interannual anomalies of the alongshore mean PCUC transport modeled (black line; in Sv, 1 Sv = 106 m3 s−1). Additionally Equatorial Kelvin Wave at 90°W; −0.25°S (EKW in cm; red line), meridional wind stress (MWS in N m−2; magenta line), and wind stress curl (WSC in N m−3, blue line). (B) Lagged correlation between PCUC anomalies and EKW, MWS, and WSC, respectively. Note that lag is in months.
3.3.2 Eddy and advective oxygen fluxes
The meridional and zonal components of the DO fluxes in the oxygen minimum layer—averaged between the isopycnal surfaces 26.6 and 26.8 kg m−3—are shown in Figure 8. The spatial structure of the meridional component DO-eddy fluxes (hereafter, MEF) and DO-advective flux (hereafter, MAF) shows high spatial coherence with a predominant southward flux (negative) in a coastal band (Figures 8A–F). However, the MAFs represented approximately ~88% of alongshore DO fluxes with mean (maximum) value approximately 1 (4) m s−1 μM near the slope. Overall, during 2001, MEF and MAF showed a similar spatial pattern than that observed in mean conditions. Meanwhile, during 2007, MEF and MAF had a large bias respect to the annual mean, both in magnitude and direction. On the other hand, we observe that the zonal component of the DO-eddy fluxes (hereafter, ZEFs) was lower than the mean DO-advective fluxes (hereafter, ZAFs), but still with amplitudes of the same order of magnitude (Figures 8G–L). Over the whole study region, the spatial structure of ZEFs showed a predominant eastward (positive) flux being a ventilating mechanism for the OMZ (Figure 8G), while in ZAFs, meridionally confined bands of positive (onshore) and negative (offshore) flux can be observed. These bands may be related to the presence of meridionally alternating zonal jets or striations observed in the eastern South Pacific (cf., Belmadani et al., 2017). The location and intensity of these ZAF bands changed between 2001 and 2007, which was more pronounced and intense during 2007 (Figures 8J–L). Specifically, during 2001, when the OMZVOL was maximum, the spatial annual mean of the ZAFs decreased ~30% compared with the 9-year mean (2000–2008), whereas during 2007, when the OMZVOL was minimum, the ZAF values were slightly higher and positive (onshore flux) than climatological mean.
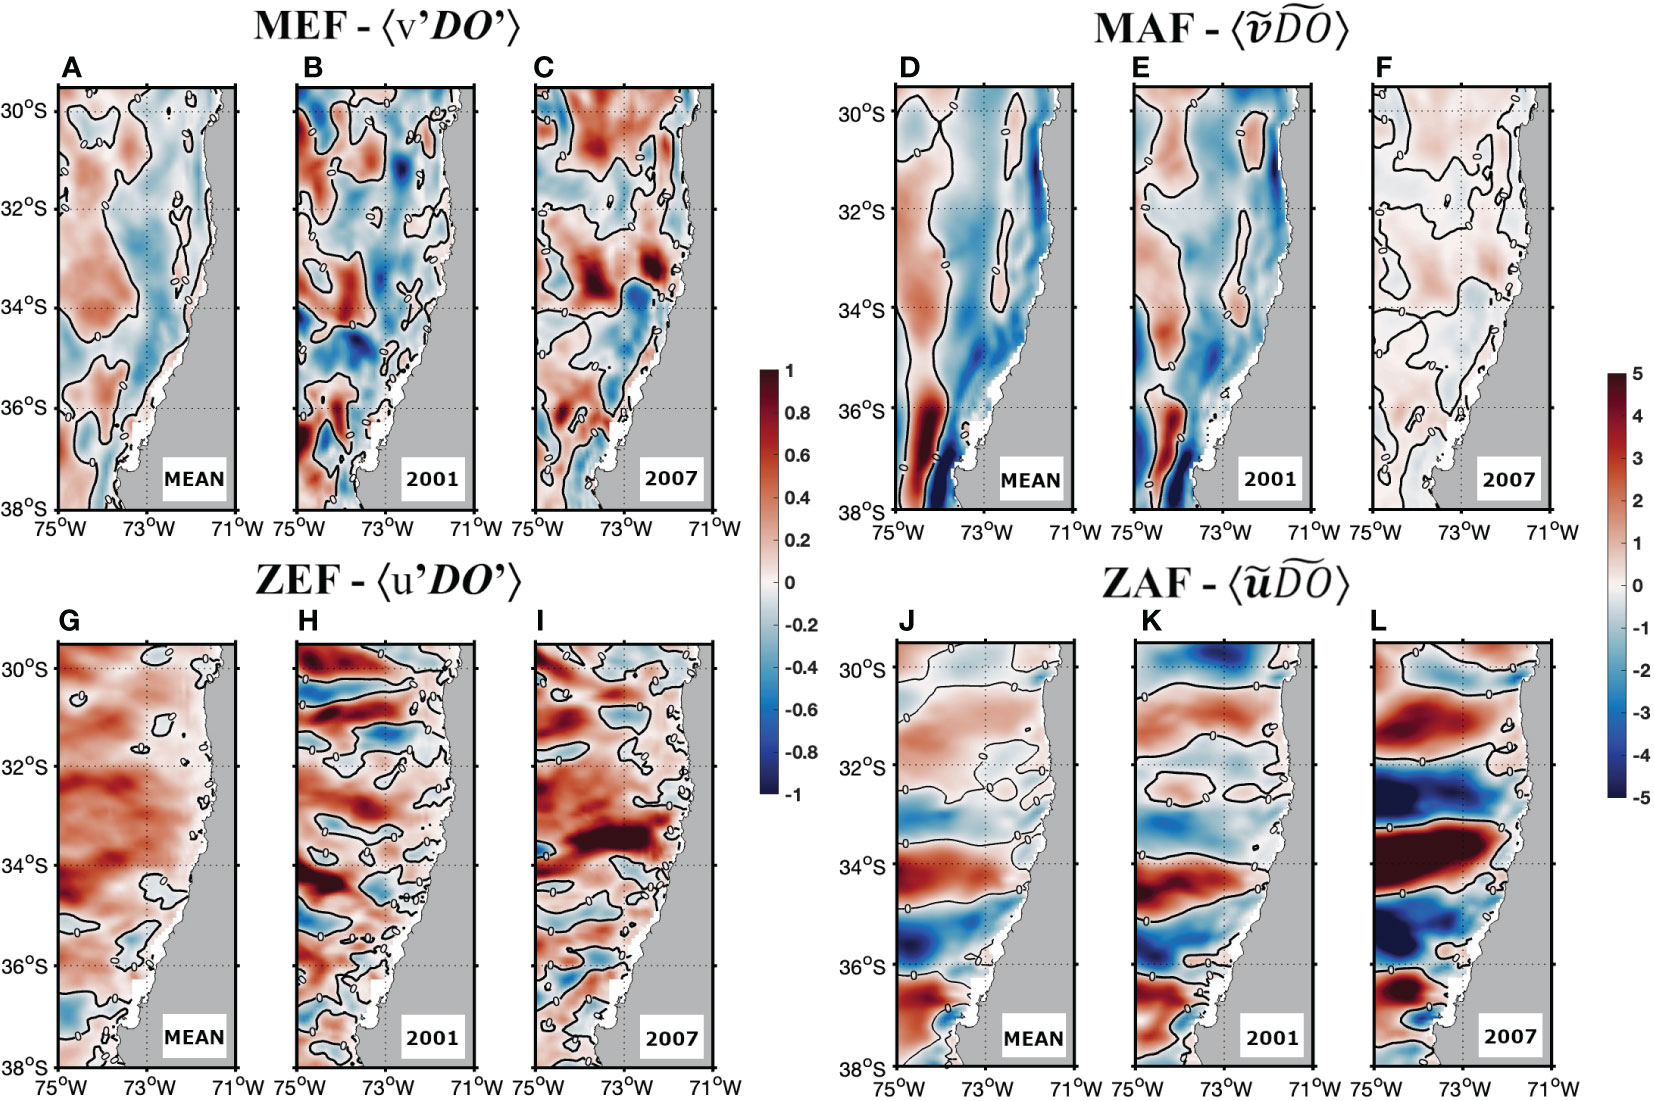
Figure 8 Climatological and annual mean DO Fluxes in 2001 and 2007 integrated between the 26.4 and 26.8 kg m−3 Isopycnals. The meridional (zonal) eddy fluxes are depicted in panels (A–C, G–I), while the meridional (zonal) advective fluxes are depicted in panels (D–F, J–L). The magnitude of fluxes is represented by the background color (in m s−1 μM). Note that positive (negative) values indicate east (west) and north (south) direction.
The OMZ oceanic boundary was evaluated through a meridional section with a center at 74°W, spanning a depth range of 50–500 m, for the annual means of 2001 and 2007. The cross-shore component of both ZEF and ZAFs were analyzed (see Figure 9) integrated between 50–500 m depth and its vertical mean section. It is worth mentioning that ZAFs and ZEFs were of the same order of magnitude during both years (2001 and 2007), but the spatial patterns of the DO fluxes were different (Figures 9A, B). Overall, ZAFs showed marked positive (onshore) and negative (offshore) bands along the section with maximum values approximately ~5 m s−1 μM between 50 and 150m depth and negative net fluxes upper ~300m. Meanwhile, ZEF is mainly positive between 50 to 500 m depth, indicating the ventilation role over the oceanic OMZVOL. In this sense, the large positive advective transport of DO (ZAFs) locate between 35.5°S and 37.5°S could be contributing to the ventilation of the southern part of the OMZ and to the associated reduction of the OMZVOL observed during 2007 (Figures 2C, 3B). In contrast, during 2001, the mean ZEF was reduced (Figure 9B) mainly between 200 and 500m depth, showing that changes in the ZEF are consistent with the reduction (increase) in the whole OMZ volume.
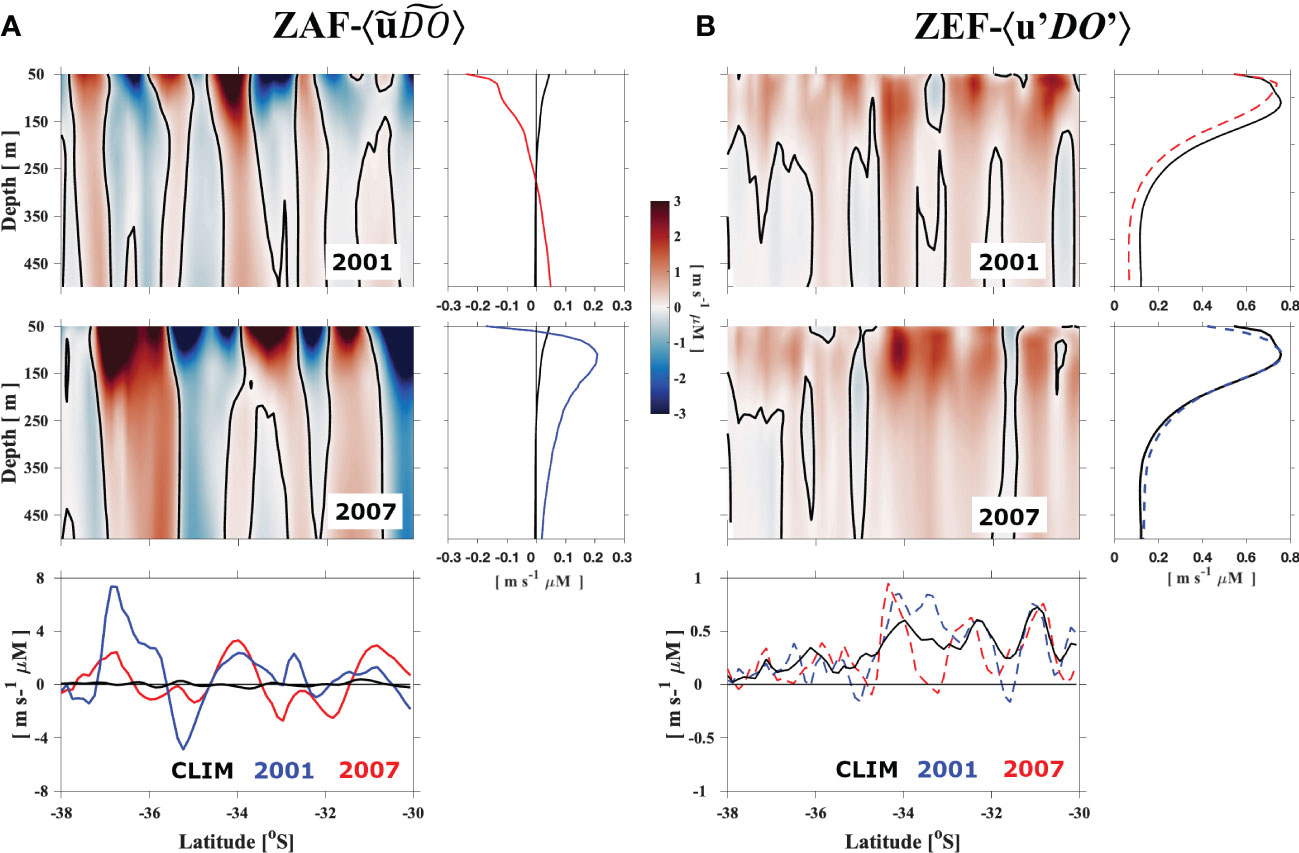
Figure 9 Annual mean of the zonal DO transport along meridional section at 74°W between 30° and 38°S during 2001 and 2007 periods represented separately by the sum between the mean zonal advective fluxes (ZAF; A) and the zonal mesoscale eddy fluxes (ZEF; B). The shading color represented eastward (red) and westward (blue) flux (in m s−1 μM). The inset at the right and bottom of each main panel shows the vertical mean section and integrated between 50–500m depth, respectively. Note that the black line represent the climatological mean, respectively.
In summary, during 2007, the PCUC transport decreased significantly, leading to a reduced southward oxygen-poor water, which also involves weak MEFs. Simultaneously, the zonal currents (ZAFs) and mesoscale turbulence DO fluxes (ZEFs) increased eastward (to the coast) transporting oceanic oxygen-rich water to the OMZ. These anomalies of the eddy fluxes seem to be responsible for the rapid reduction in OMZVOL and the increasing OMZDO observed during 2007. In contrast, during 2001, while the PCUCTR and MEFs had values close to their climatological mean, the ZEFs that contribute to ventilating the OMZ were abnormally smaller than its mean value; meanwhile, the ZAFs were slightly negative, indicating a large westward (offshore) DO transport.
4 Discussion and concluding remarks
In this work, we have focused on understanding the opposite response of OMZ metrics [i.e., OMZ volume (OMZVOL) and intensity (OMZDO)] during two cold events in the tropical Pacific in a high-resolution coupled physical/biogeochemical model simulation. These two metrics are shown to be moderately anti-correlated between them, i.e., lower values of OMZDO are not necessarily related to larger values of OMZVOL and vice versa, suggesting a combination of processes controlling the DO budget and its internal re-distribution within DO 45 µM isopleth. Our motivation was also to evaluate if processes controlling OMZ variability at seasonal timescales (Pizarro-Koch et al., 2019) can also operate at interannual timescales, observing furthermore that the OMZ variability over the period of interest (2000–2008) was as large as that of the seasonal cycle despite the relatively low ENSO variance (i.e., absence of extreme events). The analysis reveals that a distinct feature of the two cold events is that the first one (2001) marks the late stage of evolution of La Niña, while the latter marks the onset of a cold event in 2007. In particular, the 2001 La Niña belongs to a prolonged cool period (~3 years) that followed the strong 1997/1998 EP El Niño, so that the OMZ has been anomalously replenished with deoxygenated waters during 1999 and 2000. On the other hand, the 2007 La Niña followed the weak 2006 mixed-type El Niño, implying that the OMZ is close to its climatological state when the 2007 La Niña event starts to develop. Our results indicate that this opposite response can be understood in terms of the interplay of both local and remote oceanic processes including the southward transport of oxygen-poor waters (mainly ESSW) through the PCUC and the subsurface mesoscale circulation.
In 2007, the abnormal southerly position of the South Pacific Subtropical High resulted in increased equatorward alongshore winds off central Chile, intensifying the coastal upwelling and cooling of the entire shelf water column (Schneider et al., 2017). As a consequence, the PCUC experienced a substantial reduction in the presence of large positive anomalies of MWS and an intense negative WSC, which were in phase with the passage of a downwelling intraseasonal EKW, a remote forcing mechanism. This anomalous weakening of the PCUC led to an increase in the DO content inside the OMZ, a marked decline of the OMZVOL, and changes over the ESSW distribution in the study region. Concurrently, an increase in the DO fluxes was observed in the cross-shore direction across the oceanic boundary of the OMZ, primarily attributable to the intensification of the meridional alternating zonal jets in the eastward direction (DO advection) and, secondarily, to the eddy fluxes. In contrast, during 2001, a positive anomaly of the OMZVOL was observed; however, it was not directly related to an increase in the PCUCTR. In general, the poleward transport exhibited a minimum (negative) anomaly during the year 2000, while during 2001, it approached the 9-year (2000–2008) mean state. In terms of local forcings, the MWS and WSC were small, while the remote forcing (EKW) exhibited a weaker amplitude compared to that in 2007 and out-of-phase with the PCUCTR. In addition, the cross-shore DO advection was associated with large negative fluxes transporting oxygen-poor waters westward (offshore) together with an expanding OMZVOL. Furthermore, the zonal DO eddy fluxes, which permanently contribute to ventilate the OMZ, were abnormally low.
Accordingly, the present study suggests the interannual variability of the PCUC primarily modulates the DO contents (intensity) of the OMZ core and secondarily the whole OMZVOL. Thus, indirectly, the PCUC through its instabilities plays a key role promoting the generation of subsurface mesoscale eddies (Colas et al., 2012; Thomsen et al., 2016; Frenger et al., 2018; Contreras et al., 2019), impacting the cross-shore DO transport represented by the zonal jets and the eddy fluxes, which are important in ventilating and shaping the offshore extent of the OMZVOL (Pizarro-Koch et al., 2019). In addition, the role of the subsurface mesoscale circulation is important to explain the large interannual OMZ variations found in this study, even when the mesoscale circulation off Central Chile is not linearly modulated by ENSO (Conejero et al., 2020). Therefore, the interplay between the PCUC dynamics and the mesoscale activity may significantly contribute to modulate the interannual intrinsic variability of the OMZ off central Chile regardless to ENSO dynamics.
Although the impacts of ENSO on ocean temperature and productivity have been investigated extensively in previous studies (Barber and Chavez, 1983; Philander, 1983; Escribano et al., 2004; McPhaden, 2012), their effects on the OMZ have only recently received more attention, as demonstrated by a limited number of studies comprising both observational (Morales et al., 1999; Escribano et al., 2004) and modeling approaches (Llanillo et al., 2013; Mogollón and Calil, 2017; Espinoza-Morriberón et al., 2019). Despite this, previous studies related to OMZ-ENSO have focused on strong EP events near to the Peruvian coast (Graco et al., 2017; Mogollón and Calil, 2017; Espinoza-Morriberón et al., 2019) with a main focus on biogeochemical processes and nutrient cycling and the general response of the OMZ characteristics to strong ENSO events. Therefore, this study is the first to characterize changes in the physical mechanisms controlling the spatiotemporal variability of the southern tip eastern Pacific OMZ during two moderate cold La Niña events. In this sense, our results have implications for understanding the natural variability of the OMZ off Chile, highlighting the importance of the PCUC not only for the southward transport (advect) of deoxygenated waters from the Peru upwelling system but also in the ability to modulate the eddy subsurface activity along the coast through baroclinic instabilities, inducing DO eddy fluxes. Both processes are influenced by the tropical variability, but having a stochastic component considering the PCUC dynamics is partly controlled by local winds.
The weak ENSO amplitude over 2000–2008 can be understood in terms of the sole occurrence of CP El Niño and La Niña, or mixed-type events (2006) that have a much weaker amplitude than extreme EP El Niño events of 1982–1983 and 1997–1998. The CP events are associated with a weaker oceanic teleconnection than the strong EP El Niño (Dewitte et al., 2012) but can modulate significantly the upwelling favorable winds off Chile south of 30°S through atmospheric teleconnection during the development of ENSO (Cai et al., 2020; Dewitte et al., 2023). This explains the overall large correlation between the C index and the OMZ metrics and the direction of the phase-lagged relationship (C index ahead OMZ metrics) (see Table 3). It is worth mentioning that for this period the PCUC transport was also highly correlated with the E index near lag zero (not shown), suggesting that the equatorial oceanic teleconnection is also operating despite the relatively weak amplitude of the E index. This can be understood in terms of the efficient propagation of intraseasonal Kelvin waves along the coast (Clarke and Shi, 1991).
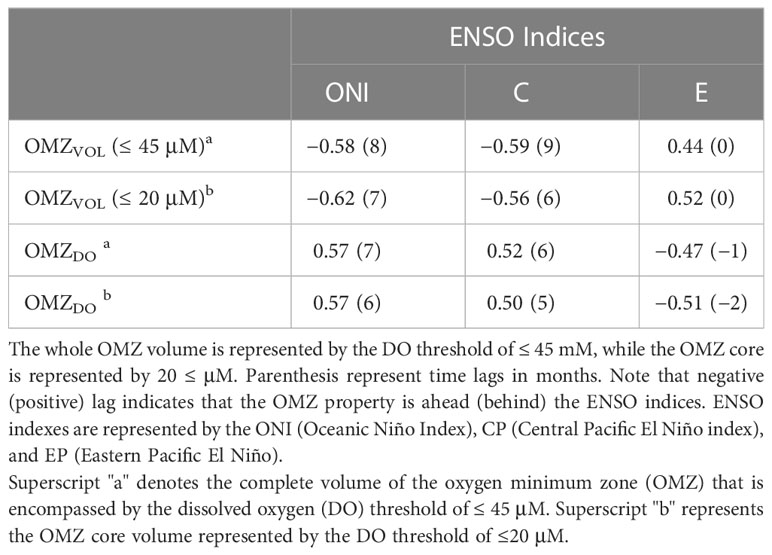
Table 3 Maximum lag correlation between the ENSO indexes and both OMZVOL and OMZDO.
Our results have implications for understanding the natural variability of the OMZ off Chile, and we now discuss perspectives of this work. First, we note the key role of the PCUC dynamics for understanding the OMZ interannual variability off Central Chile even during a period of low ENSO variance. While this is alike to what takes place at seasonal timescale (Pizarro-Koch et al., 2019), it also suggests that the details in the oceanic and atmospheric teleconnections during weak to moderate ENSO events certainly matters to drive the OMZ variability. In particular, the PCUC cannot only transport (advect) deoxygenated waters from the Peru upwelling systems, but it has also the ability to modulate eddy activity along the coast through baroclinic instabilities, inducing DO eddy flux. Both processes are influenced by tropical variability, but they also have a stochastic component considering that the PCUC dynamics is partly controlled by local winds, implying the natural variability in the OMZ core evidenced here. While our analysis supports such a hypothesis for the source of OMZ natural variability, the relatively short span of the simulation used here is certainly a limitation to reach a firm conclusion in this respect. As a perspective, we thus plan to run the model for repeated periods of low ENSO variance to further document the non-linear relationship between the OMZ volume and La Niña events suggested here. Documenting the physical forcing of the subtropical OMZ off Chile during low-amplitude ENSO forcing has thus relevance for extending our view of the diversity in mechanisms at work in OMZ.
Data availability statement
ROMS model code is available at https://www.croco-ocean.org/. Raw model data are available upon request through BD and processed data files presented in this paper are available upon request through the corresponding author. The University of Concepcion and the “Fondo de Investigación Pesquera” (FIP; MOBIO‐BIO program) provided in situ data. MODIS‐Aqua SST and chlorophyll satellite data are available at http://oceancolor.gsfc.nasa.gov; AVISO for altimeter products (http://marine.copernicus.eu); CARS for climatological data (www.marine.csiro.au/~dunn/cars2009/). Data used for model validation are freely available under request to the Chilean National Center for Hydrographic and Oceanographic Data (Centro Nacional de Datos Hidrográficos y Oceanográficos de Chile; http://www.shoa.cl/n_cendhoc/).
Author contributions
Conceptualization: MP-K, BD and OP. Modelling setup: VG, BD, IM and AP. Data and statistical analysis: MP-K, BD, OP, HS, AC-A, CA and MR. Manuscript writing, MP-K. with input from all co-authors. All authors contributed to the article and approved the submitted version.
Funding
This work was funded by the Chilean Agency for Research and Development (FONDECYT Postdoctoral Project No. 3220768. This study was carried out under FONDECYT projects 1181872 led by OP. This study received support from FONDECYT 1190276 (led by BD), FONDECYT 1140845 (led by MR) and FONDECYT 11171163 (led by CA), Millennium Nucleus Understanding Past Coastal Upwelling Systems and Environmental Local and Lasting Impacts (UPWELL), Coquimbo, Chile, Anillo BiodUCCT ATE220044, Millennium Institute of Oceanography, Chile (ICM grant IC 120019), COPAS Coastal (FB210021), ANID (Anillo Eclipse ACT210071 and Concurso de Fortalecimiento al Desarrollo Científico de Centros Regionales 2020-R20F0008), and CRN3070-IAI (US National Science Foundation; grant GEO-11280040). MP-K thanks the financial support for internships at LEGOS and IGP from the REDOC.CTA (Red Doctoral en Ciencia, Tecnología y Ambiente, University of Concepción, Chile) and CONICYT, respectively. BD acknowledges support from the French National program LEFE (Les Enveloppes Fluides et l’Environnement), the CE2COAST project, and the EU H2020 FutureMares project (Theme LC-CLA-06-2019, Grant Agreement No. 869300). This work was granted access to the HPC resources of CALMIP supercomputing center at the Toulouse University under the allocations 2019-1044.
Conflict of interest
The authors declare that the research was conducted in the absence of any commercial or financial relationships that could be construed as a potential conflict of interest.
Publisher’s note
All claims expressed in this article are solely those of the authors and do not necessarily represent those of their affiliated organizations, or those of the publisher, the editors and the reviewers. Any product that may be evaluated in this article, or claim that may be made by its manufacturer, is not guaranteed or endorsed by the publisher.
References
Albert A., Echevin V., Lévy M., Aumont O. (2010). Impact of nearshore wind stress curl on coastal circulation and primary productivity in the Peru upwelling system. J. Geophys. Res. 115 (C12). doi: 10.1029/2010jc006569
Astudillo O., Dewitte B., Mallet M., Frappart F., Rutllant J. A., Ramos M., et al. (2017). Surface winds offPeru-Chile: observing closer to the coast from radar altimetry. Remote Sens. Environ. 191, 179–196. doi: 10.1016/j.rse.2017.01.010
Barber R. T., Chavez F. P. (1983). Biological consequences of El ni~no. Science 222 (4629), 1203–1210. doi: 10.1126/science.222.4629.1203
Belmadani A., Concha E., Donoso D., Chaigneau A., Colas F., Maximenko N. A., et al. (2017). Striations and preferred eddy tracks triggered by topographic steering of the background flow in the eastern south pacific. J. Geophys. Res.-Oceans 122, 2847–2870. doi: 10.1002/2016JC012348
Bettencourt J. H., López C., Hernández-García E., Montes I., Sudre J., Dewitte B., et al. (2015). Boundaries of the Peruvian oxygen minimum zone shaped by coherent mesoscale dynamics. Nat. Geosci. 8, 937–940. doi: 10.1038/ngeo2570
Bindoff N. L., Cheung W. W. L., Kairo J. G., Arístegui J., Guinder V. A., Hallberg R., et al. (2019). “Changing ocean, marine ecosystems, and dependent communities,” in IPCC special report on the ocean and cryosphere in a changing climate. Eds. Pörtner H.-O., Roberts D.C., Masson-Delmotte V., Zhai P., Tignor M., Poloczanska E., et al (Cambridge, UK and New York, NY, USA,: Cambridge University Press). pp. 447–587. doi: 10.1017/9781009157964.007
Bopp L., Resplandy L., Orr J. C., Doney S. C., Dunne J. P., Gehlen M., et al. (2013). Multiple stressors of ocean ecosystems in the 21st century: projections with CMIP5 models. Biogeosciences 10, 6225–6245. doi: 10.5194/bg-10-6225-2013
Breitburg D., Levin L. A., Oschlies A., Grégoire M., Chavez F. P., Conley D. J., et al. (2018). Declining oxygen in the global ocean and coastal waters. Science 359 (6371), eaam 7240. doi: 10.1126/science.aam7240
Cabré A., Marinov I., Bernardello R., Bianchi D. (2015). Oxygen minimum zones in the tropical pacific across CMIP5 models: mean state differences and climate change trends. Biogeosciences 12, 5429–5454. doi: 10.5194/bg-12-5429-2015
Cai W., McPhaden M. J., Grimm A. M., Rodrigues R., Taschetto A. S., Garreaud R., et al. (2020). Climate impacts of the El niño–southern oscillation on south America. Nat. Rev. Earth Environ. 1, 215–231. doi: 10.1038/s43017-020-0040-3
Cambon G., Goubanova K., Marchesiello P., Dewitte B., Illig S., Echevin V. (2013). Assessing the impact of downscaled winds on a regional ocean model simulation of the Humboldt system. Ocean Model. 65, 11–24. doi: 10.1016/j.ocemod.2013.01.007
Clarke A. J., Shi C. (1991). Critical frequencies at ocean boundaries. J. Geophys. Res. 96 (C6), 10731–10738. doi: 10.1029/91JC00933
Colas F., McWilliams J. C., Capet X., Kurian J. (2012). Heat balance and eddies in the Peru-Chile current system. Climate Dyn. 39, 509–529. doi: 10.1007/s00382-011-1170-6
Conejero C., Dewitte B., Garçon V., Sudre J., Montes I.. (2020). ENSO diversity driving low-frequency change in mesoscale activity off Peru and Chile. Sci. Rep. 10 (1), 1–13. doi: 10.1038/s41598-020-74762-x
Contreras M., Pizarro O., Dewitte B., Sepulveda H. H., Renault L. (2019). Subsurface mesoscale eddy generation in the ocean off central Chile. J. Geophys. Res. Oceans 124 (8), 5700–5722. doi: 10.1029/2018JC014723
Dewitte W., Chiappetta A., Azmi A., Witters E., Strnad M., Rembur J., et al. (1999). Dynamics of cytokinins in apical shoot meristems of a day-neutral tobacco during floral transition and flower formation. Plant Physiol. 119 (1), 111–122. doi: 10.1104/pp.119.1.111
Dewitte B., Concha E., Saavedra D., Pizarro O., Martinez- Villalobos C., Gushchina D., et al. (2023). The ENSO-induced south pacific meridional mode. Front. Climate 4, 1080978. doi: 10.3389/fclim.2022.1080978
Dewitte B., Vazquez-Cuervo J., Goubanova K., Illig S., Takahashi K., Cambon G., et al. (2012). Change in El niño flavours over 1958– 2008: implications for the long-term trend of the upwelling off Peru. Deep Sea Res. Part II: Topical Stud. Oceanogr. 77-80, 143–156. doi: 10.1016/j.dsr2.2012.04.011
Dunn J. R., Ridgway K. R. (2002). Mapping ocean properties in regions of complex topography. Deep Sea Res. I Oceanogr. Res. 49 (3), 591–604. doi: 10.1016/S0967-0637(01)00069-3
Duteil O. (2019). Wind synoptic activity increases oxygen levels in the tropical pacific ocean. Open Access Geophys. Res. Lett. 46, (5). doi: 10.1029/2018GL081041
Duteil O., Oschlies A., Böning C. W. (2018). Pacific decadal oscillation and recent oxygen decline in the eastern tropical pacific ocean. Open Access Biogeosci. (BG) 15, 7111–7126. doi: 10.5194/bg-15-7111-2018
Escribano R., Daneri G., Farías L., Gallardo V. A., González H. E., Gutiérrez D., et al. (2004). Biological and chemical consequences of the 1997–1998 El niño in the Chilean coastal upwelling system: a synthesis. Deep Sea Res. Part II: Topical Stud. Oceanogr. 51 (20-21), 2389–2411. doi: 10.1016/j.dsr2.2004.08.011
Escribano R., Hidalgo P., Fuentes M., Donoso K. (2012). Zooplankton time series in the coastal zone off Chile: variation in upwelling and responses of the copepod community. Prog. Oceanogr. 97-100, 174–186. doi: 10.1016/j.pocean.2011.11.006
Espinoza-Morriberón D., Echevin V., Colas F., Tam J., Gutierrez D., Graco M., et al. (2019). Oxygen variability during ENSO in the tropical south Eastern pacific. Front. Mar. Sci. 5, 1638. doi: 10.3389/fmars.2018.00526
Fairall C. W., Bradley E. F., Hare J. E., Grachev A. A., Edson J. B.. (2003). "Bulk parameterization of air–sea fluxes: updates and verification for the COARE algorithm.". J. Climate 16 (4), 571–591. doi: 10.1175/1520-0442(2003)016<0571:BPOASF>2.0.CO;2
Frenger I., Bianchi D., Sührenberg C., Oschlies A., Dunne J., Deutsch C., et al. (2018). Biogeochemical role of subsurface coherent eddies in the ocean: tracer cannonballs, hypoxic storms, and microbial stewpots. Global Biogeochem. Cycles 32, 226–249. doi: 10.1002/2017GB005743
Frischknecht M., Münnich M., Gruber N. (2015). Remote versus local influence of enso on the california current system. J. Geophys. Res.: Oceans 120 (2), 1353–1374. doi: 10.1002/2014JC010531
Fuenzalida R., Schneider W., Garces J., Bravo L., Lange C. (2009). Vertical and horizontal extension of the oxygen minimum zone in the eastern south pacific ocean. Deep Sea Res. Part II: Topical Stud. Oceanogr. 56, 992–1003. doi: 10.1016/j.dsr2.2008.11.001
Frölisher T., Joos F., Plattner G.-K., Steinacher M., Doney S. C. (2009). Natural variability and anthropogenic trends in oceanic oxygen in a coupled carbon cycle-climate model ensemble. Global Biogeochem. Cy. 23, GB1003. doi: 10.1029/2008GB003316
García-Reyes M., Sydeman W. J., Schoeman D. S., Rykaczewski R. R., Black B. A., Smit A. J., et al. (2015). Under pressure: climate change, upwelling, and eastern boundary upwelling ecosystems. Front. Mar. Sci. 2, 109. doi: 10.3389/fmars.2015.00109
Garçon V., Dewitte B., Montes I., Goubanova K. (2019). “Land-Sea-Atmosphere interactions exacerbating ocean deoxygenation in Eastern boundary upwelling systems (EBUS),” in Ocean deoxygenation: everyone’s problem- causes, impacts, consequences and solutions, gland, vol. 562 . Eds. Laffoley D., Baxter J. M. (Switzerland: IUCN), 155–170.
Gilbert D., Rabalais N. N., Díaz R. J., Zhang J. (2010). Evidence for greater oxygen decline rates in the coastal ocean than in the open ocean. Biogeosciences 7, 2283–2296. doi: 10.5194/bg-7-2283-2010
Goubanova K., Echevin V., Dewitte B., Codron F., Takahashi K., Terray P., et al. (2011). Statistical downscaling of sea-surface wind over the Peru–Chile upwelling region: diagnosing the impact of climate change from the IPSL-CM4 model. Climate Dyn. 36 (7–8), 1365–1378. doi: 10.1007/s00382-010-0824-0
Graco M., Purca S., Dewitte B., Castro C. G., Moron O., Ledesma J., et al. (2017). The OMZ and nutrients features as a signature of interannual and low frequency variability off the Peruvian upwelling system. Biogeosciences 14, 4601–4617. doi: 10.5194/bg-14-4601-2017
Grégoire M., Garçon V., Garcia H., Breitburg D., Isensee K., Oschlies A., et al. (2021). A global ocean oxygen database and atlas for assessing and predicting deoxygenation and ocean health in the open and coastal ocean. Front. Mar. Sci. 8. doi: 10.3389/fmars.2021.724913
Gruber N. (2011). Warming up, turning sour, losing breath: ocean biogeochemistry under global change. Philos. Trans. R. Soc. A: Mathematical Phys. Eng. Sci. 369 (1943), 1980–1996. doi: 10.1098/rsta.2011.0003
Gutiérrez D., Enríquez E., Purca S., Quipúzcoa L., Marquina R., Flores G., et al. (2008). Oxygenation episodes on the continental shelf of central Peru: remote forcing and benthic ecosystem response. Prog. Oceanogr. 79, 177–189. doi: 10.1016/j.pocean.2008.10.025
Gutknecht E., Dadou I., Le Vu B., Cambon G., Sudre J., Garçon V., et al. (2013). Coupled physical/biogeochemical modeling including O2-dependent processes in Eastern boundary upwelling systems: application in the benguela. Biogeosciences 10 (1), 1–22. doi: 10.5194/bg-10-1-2013
Hormazábal S., Shaffer G., Silva N., Navarro E. (2006). The perú-Chile undercurrent and the oxygen minimum zone variability off central Chile. Gayana 70 (1), 37–45. doi: 10.4067/S0717-65382006000300009
Huyer A., Smith R. L., Paluszkiewicz T. (1987). Coastal upwelling off Peru during normal and El niño times 1981–1984. J. Geophys. Res.: Oceans 92 (C13), 14297–14307. doi: 10.1029/JC092iC13p14297
Ito T., Minobe S., Long M. C., Deutsch C. (2017). Upper ocean O2 trends: 1958–2015. Geophys. Res. Lett. 44 (9), 4214–4223. doi: 10.1002/2017GL073613
José Y. S., Stramma L., Schmidtko S., Oschlies A. (2019). ENSO-driven fluctuations in oxygen supply and vertical extent of oxygen-poor waters in the oxygen minimum zone of the Eastern tropical south pacific. Biogeosci. Discussions. [preprint], 1–20. doi: 10.5194/bg-2019-155
Karstensen J., Stramma L., Visbeck M. (2008). Oxygen minimum zones in the eastern tropical atlantic and pacific oceans. Prog. Oceanography 77, 331–350. doi: 10.1016/j.pocean.2007.05.009
Keeling R. F., Körtzinger A., Gruber N. (2010). Ocean deoxygenation in a warming world. Annu. Rev. Mar. Sci. 2, 199–229. doi: 10.1146/annurev.marine.010908.163855
Koné V., Machu E., Penven P., Garçon V., Freon P., Demarcq H. (2005). Modeling the primary and secondary productions of the southern benguela upwelling system: a comparative study through two biogeochemical models. Global Biogeochem. Cycles 19, GB4021. doi: 10.1029/2004GB002427
Kwiatkowski L., Torres O., Bopp L., Aumont O., Chamberlain M., Christian J. R., et al. (2020). Twenty-first century ocean warming, acidification, deoxygenation, and upper-ocean nutrient and primary production decline from CMIP6 model projections. Biogeosciences 17 (13), 3439–3470. doi: 10.5194/bg-17-3439-2020
Large W., McWilliams J. C., Doney S. (1994). Oceanic vertical mixing: a review and model with a nonlocal boundary layer parame- terization. Rev. Geophys. 32, 363–403. doi: 10.1029/94RG01872
Llanillo P. J., Karstensen J., Pelegrí J. L., Stramma L. (2013). Physical and biogeochemical forcing of oxygen and nitrate changes during El Niño/El viejo and la Niña/La vieja upper-ocean phases in the tropical eastern south pacific along 86° W. Biogeosciences 10, 6339–6355. doi: 10.5194/bg-10-6339-2013
Long M. C., Deutsch C., Ito T. (2016). Finding forced trends in oceanic oxygen. Global Biogeochem. Cycles 30 (2), 381–397. doi: 10.1002/2015GB005310
McPhaden M. J. (2012). A 21st century shift in the relationship between ENSO SST and warm water volume anomalies. Geophys. Res. Lett. 39 (9). doi: 10.1029/2012GL051826
Mogollón R., Calil P. H. R. (2017). On the effects of ENSO on ocean biogeochemistry in the northern Humboldt current system (NHCS): a modeling study. J. Mar. Syst. 172, 137–159. doi: 10.1016/j.jmarsys.2017.03.011
Montes I., Dewitte B., Gutknecht E., Paulmier A., Dadou I., Oschlies A., et al. (2014). High-resolution modeling of the Eastern tropical pacific oxygen minimum zone: sensitivity to the tropical oceanic circulation. J. Geophys. Res. Oceans 119, 5515–5532. doi: 10.1002/2014JC009858
Morales C. E., Hormazábal S., Blanco J. L. (1999). Interannual variability in the mesoscale distribution of the depth of the upper boundary of the oxygen minimum layer off northern Chile (18–24S): implications for the pelagic system and biogeochemical cycling. J. Mar. Res. 57, 909–932. doi: 10.1357/002224099321514097
Naqvi S. W. A., Bange H. W., Farias L., Monteiro P. M. S., Scraton M. I., Zhang J. (2010). Marine hypoxia/anoxia as a source of CH4 and N2O. Biogeosciences 7, 2159–2190. doi: 10.5194/bg-7-2159-2010
Oschlies A., Brandt P., Stramma L., Schmidtko S. (2018). Drivers and mechanisms of ocean deoxygenation. Nat. Geosci. 11 (7), 467–473. doi: 10.1038/s41561-018-0152-2
Paulmier A., Ruiz-Pino D. (2009). Oxygen minimum zones (OMZs) in the modern ocean. Prog. Oceanogr. 80 (3–4), 113–128. doi: 10.1029/j.pocean.2008.08.001
Paulmier A., Ruiz-Pino D., Garçon V., Farias L. (2006). Maintaining ofthe east south pacific oxygen minimum Zone(OMZ) off chile. Geophys.l Res. Lett. 33, L20601. doi: 10.1029/2006GL026801
Penven P., Debreu L., Marchesiello P., McWilliams J. C. (2006). Evaluation and application of the ROMS 1-way embedding procedure to the central california upwelling system. Ocean Model. 12 (1-2), 157–187. doi: 10.1016/j.ocemod.2005.05.002
Philander S. G. H. (1983). El Nino southern oscillation phenomena. Nature 302 (5906), 295–301. doi: 10.1038/302295a0
Pitcher G. C., Aguirre-Velarde A., Breitburg D., Cardich J., Carstensen J., Conley D. J., et al. (2021). System controls of coastal and open ocean oxygen depletion. Prog. Oceanogr. 197, 102613. doi: 10.1016/j.pocean.2021.102613
Pizarro O., Clarke A. J., Van Gorder S. (2001). El Niño sea level and currents along the South American coast: comparison of observations with theory. J. Phys. Oceanogr. 31, 1891–1903. doi: 10.1175/1520-0485(2001)031<1891:ENOSLA>2.0.CO;2
Pizarro O., Shaffer G., Dewitte B., Ramos M. (2002). Dynamics of seasonal and interannual variability ofthe Peru-Chile undercurrent. Geophys. Res. Lett. 29 (12), 1581. doi: 10.1029/2002GL014790
Pizarro-Koch M., Pizarro O., Dewitte B., Montes I., Ramos M., Paulmier A., et al. (2019). Seasonal variability of the southern tip of the oxygen minimum zone in the Eastern south pacific (30°-38°S): a modeling study. J. Geophys. Res. Oceans. 124, 8574–8604. doi: 10.1029/2019JC015201
Ramos M., Dewitte B., Pizarro O., Garric G. (2008). Vertical propagation of extratropical rossby waves during the 1997–1998 El nin ˜o off the west coast of south America in a medium-resolution OGCM simulation. Geophys. Res. Lett. 113, C08041. doi: 10.1029/2007JC004681
Rayner N. A. A., Parker D. E., Horton E. B., Folland C. K., Alexander L. V., Rowell D. P., et al. (2003). Global analyses of sea surface temperature, sea ice, and night marine air temperature since the late nineteenth century. J. Geophys. Res.: Atmos. 108, D14. doi: 10.1029/2002JD002670
Ridgway K. R., Dunn J. R., Wilkin J. L. (2002). Ocean interpolation by four-dimensional least squares -application to the waters around Australia, j. atmos. Ocean. Tech. 19 (9), 1357–1375. doi: 10.1175/1520-0426(2002)019<1357:OIBFDW>2.0.CO;2
Schmidtko S., Stramma L., Visbeck M. (2017). Decline in global oceanic oxygen content during the past five decades. Nature 542, 335–339. doi: 10.1038/nature21399
Schneider W., Donoso D., Garcés-Vargas J., Escribano R. (2017). Water-column cooling and sea surface salinity increase in the upwelling region off central-south Chile driven by a poleward displacement of the south pacific high. Prog. Oceanogr. 151, 38–48. doi: 10.1016/j.pocean.2016.11.004
Shchepetkin A. F., McWilliams J. C. (2003). A method for computing horizontal pressure-gradient force in an oceanic model with a nonaligned vertical coordinate. J. Geophys. Res. Oceans 108 (C3). doi: 10.1029/2001JC001047
Shchepetkin A., McWilliams J. C. (2005). The regional oceanic modeling system (ROMS): a split-explicit, free-surface, topography- following- coordinate oceanic model. Ocean Model. 9, 347–404. doi: 10.1016/j.ocemod.2004.08.002
Silva N., Neshyba S. (1979). On the southernmost extension of the Peru-Chile undercurrent. Deep Sea Res. Part I. Oceanogr. Res. Pap. 26, 1387–1393. doi: 10.1016/0198-0149(79)90006-2
Silva N., Rojas N., Fedele A. (2009). Water masses in the Humboldt current system: properties, distribution, and the nitrate deficit as a chemical water mass tracer for equatorial subsurface water off Chile. Deep Sea Res. Part II: Topical Stud. Oceanogr. 56, 1004–1020. doi: 10.1016/j.dsr2.2008.12.013
Sobarzo M., Bravo L., Donoso D., Garcés-Vargas J., Schneider W. (2007). Coastal upwelling and seasonal cycles that influence the water column over the continental shelf off central Chile. Prog. Oceanogr. 75, 363–382. doi: 10.1016/j.pocean.2007.08.022
Sprintall J., Cravatte S., Dewitte B., Du Y., Gupta A. S. (2020). ENSO oceanic teleconnections. El Niño South. Oscillation changing Climate 4, 337–359. doi: 10.1002/9781119548164.ch15
Takahashi K., Montecinos A., Goubanova K., Dewitte B. (2011). ENSO regimes: reinterpreting the canonical and modoki El niño. Geophys. Res. Lett. 38, L10704. doi: 10.1029/2011GL047364
Thomsen S., Kanzow T., Colas F., Echevin V., Krahmann G., Engel A. (2016). Do submesoscale frontal processes ventilate the oxygen minimum zone off peru? Geophys. Res. Lett. 43 (15), 8133–8142. doi: 10.1002/2016GL070548
Vergara O., Dewitte B., Montes I., Garçon V., Ramos M., Paulmier A., et al. (2016). Seasonal variability of the oxygen minimum zone off Peru in a high-resolution regional coupled model. Biogeosciences 13, 4389–4410. doi: 10.5194/bg-13-4389-2016
Vergara O., Dewitte B., Ramos M., Pizarro O. (2017). Vertical energy flux at ENSO time scales in the subthermocline of the southeastern pacific. J. Geophys. Res. Oceans 122. doi: 10.1002/2016JC012614
Yu J. Y., Zou Y., Kim S. T., Lee T. (2012). The changing impact of el nino on US winter temperatures. Geophys. Res. Lett. 39 (15). doi: 10.1029/2012GL052483
Appendix A: model validation
In this section, we provide additional validation of the model variability at interannual timescales to complement previous studies (Dewitte et al., 2012; Vergara et al. 2016, 2017; Pizarro-Koch et al. 2019; Conejero et al., 2020). The oxycline depth (in m), the subsurface meridional current variability (PCUC in cm s−1 and the coastal upwelling associated with cold water (SST in °C), and high primary production (Chl-a in mg m−3) were compared between the model and the observations.
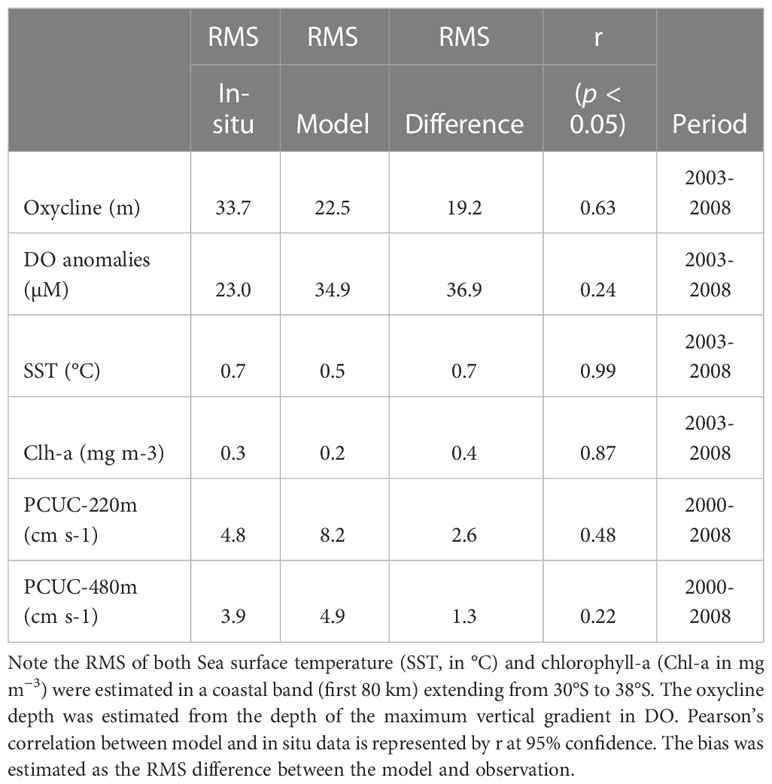
TABLE A1 Root mean square (RMS) for interannual anomalies of the oxygen (in μM) averaged from surface to 60 m depth, oxycline depth (in m) over the continental shelf at ~36.5°S, meridional current (PCUC; 30°S) at 220 m and 480 m (in cm s−1) for both model and in-situ data.
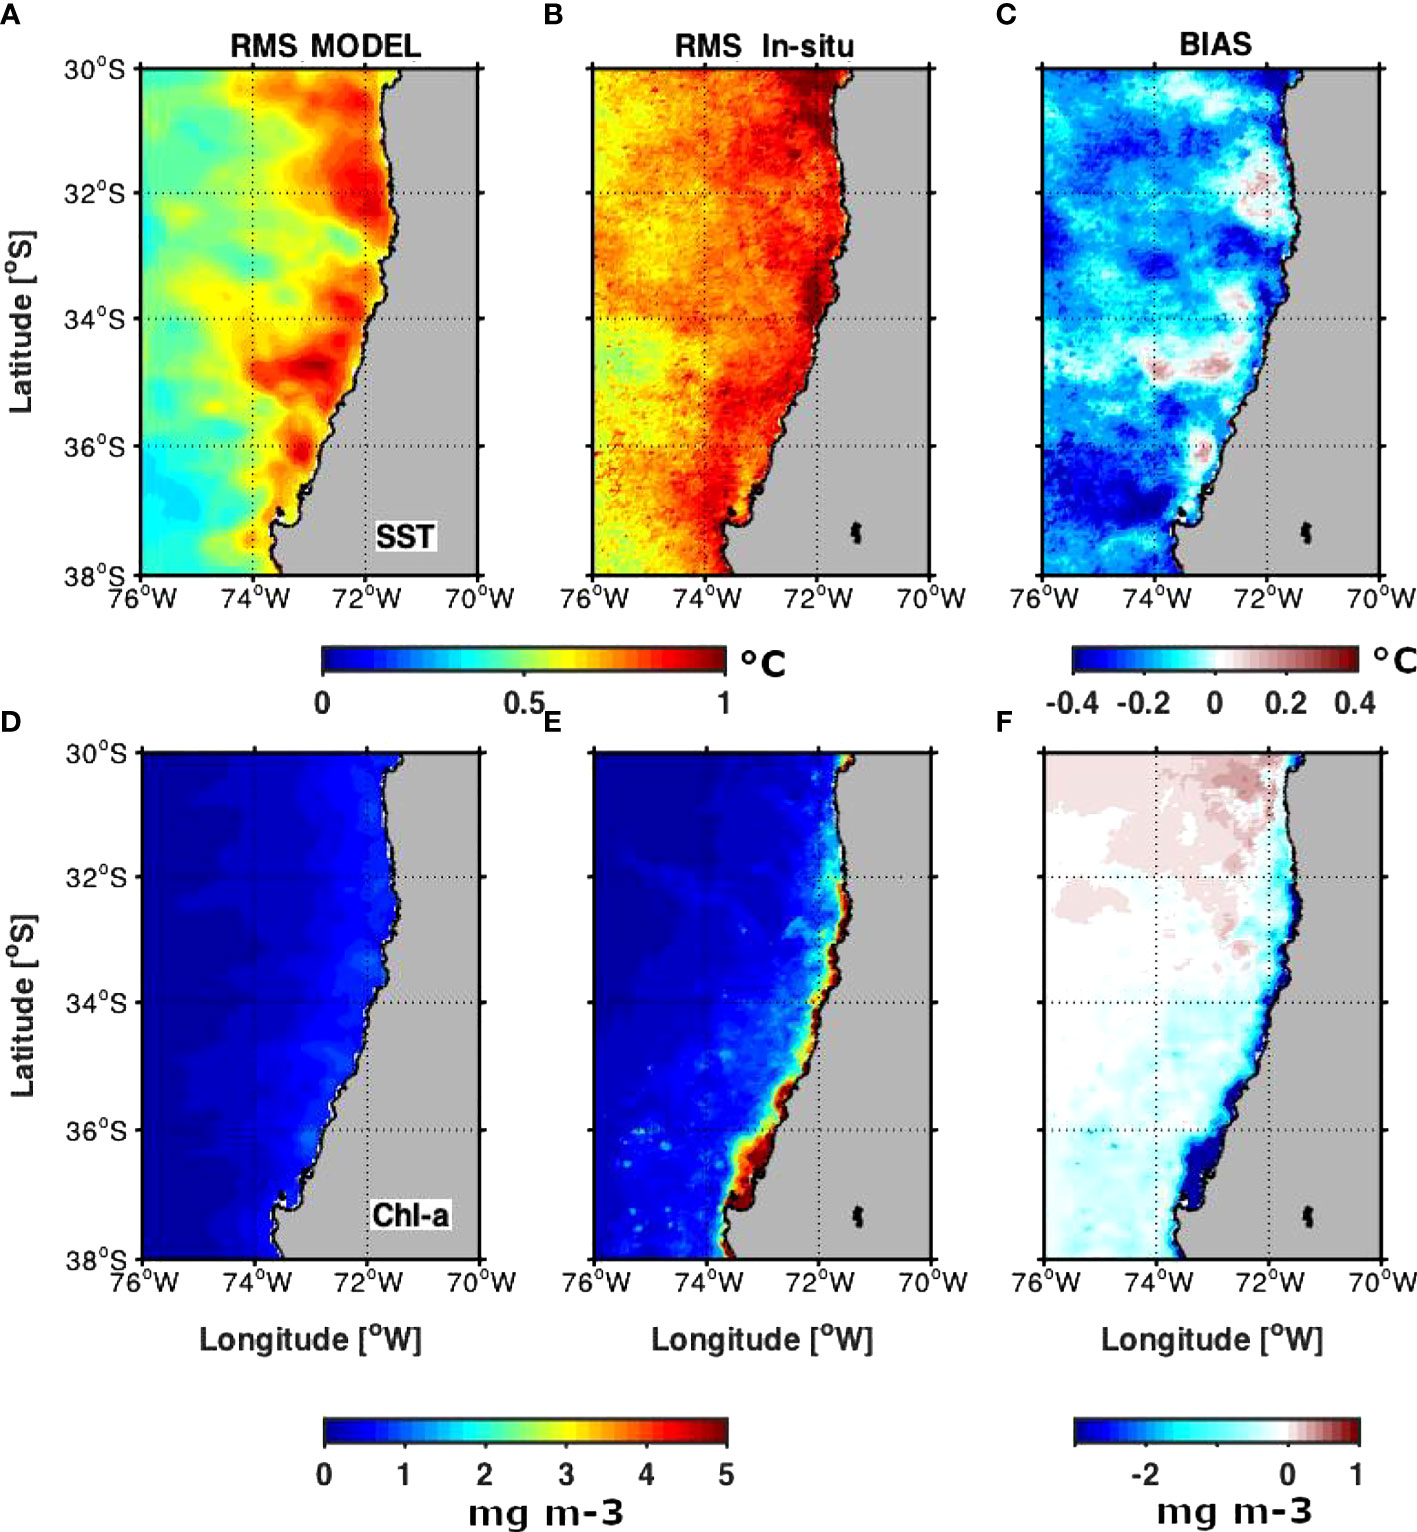
Figure A1 Root mean square (RMS) of the interannual anomalies of Sea Surface Temperature (SST in °C) for both model (A) and MODIS-Aqua (B) based on the 2003-2008 period. The RMS values of chlorophyll-a (Chl-a in mg m-3) are displayed in panels (D, E), respectively. The bias of SST (C) and Chl-a (F) represent the difference between RMS modeled and in-situ observation.
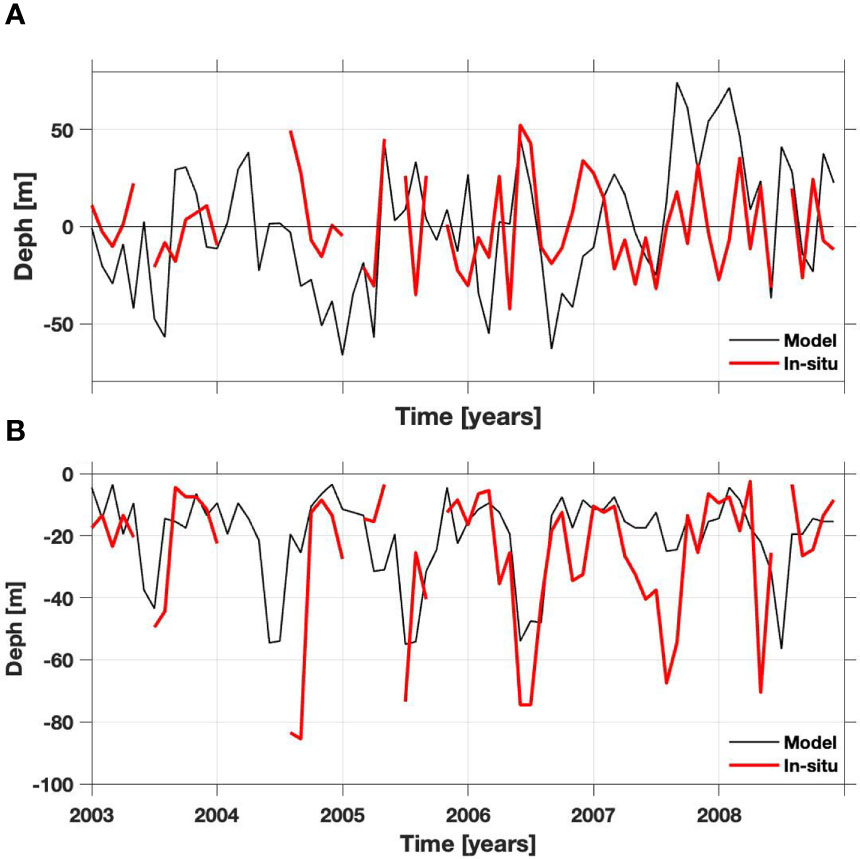
Figure A2 Interannual anomalies of the oxygen (DO in μM) averaged from surface to 60 m depth (A) and oxycline depth (in m) variability over the continental shelf at ~36.5°S (B; based from a monthly ship-based time series from the University of Concepcion at 36°30′S over the continental shelf (~90 m depth) for the period 2003–2008 (see Sobarzo et al. (2007) and Escribano et al. (2012) for more details) for both model (black line) and in situ data (red line). The oxycline depth (B) was estimated from the maximum vertical DO gradient.
Keywords: subtropical Eastern Pacific, oxygen minimum zone, ENSO (El Niño/Southern Oscillation), Peru-Chile undercurrent, mesoscale eddy flux
Citation: Pizarro-Koch M, Pizarro O, Dewitte B, Montes I, Paulmier A, Garçon V, Sepulveda HH, Corredor-Acosta A, Aguirre C and Ramos M (2023) On the interpretation of changes in the subtropical oxygen minimum zone volume off Chile during two La Niña events (2001 and 2007). Front. Mar. Sci. 10:1155932. doi: 10.3389/fmars.2023.1155932
Received: 01 February 2023; Accepted: 16 May 2023;
Published: 04 July 2023.
Edited by:
Sudheesh Valliyodan, Central University of Kerala, IndiaReviewed by:
Jianing Wang, Chinese Academy of Sciences (CAS), ChinaDamian L. Arévalo-Martínez, Radboud University, Netherlands
Copyright © 2023 Pizarro-Koch, Pizarro, Dewitte, Montes, Paulmier, Garçon, Sepulveda, Corredor-Acosta, Aguirre and Ramos. This is an open-access article distributed under the terms of the Creative Commons Attribution License (CC BY). The use, distribution or reproduction in other forums is permitted, provided the original author(s) and the copyright owner(s) are credited and that the original publication in this journal is cited, in accordance with accepted academic practice. No use, distribution or reproduction is permitted which does not comply with these terms.
*Correspondence: Matías Pizarro-Koch, bWF0aWFzcGl6YXJyb0B1ZGVjLmNs