 Xuemei Xu1
 Hong Chen
- 1State Environmental Protection Key Laboratory of Coastal Ecosystem, National Marine Environmental Monitoring Center, Dalian, China
- 2College of Environment Science and Engineering, Dalian Maritime University, Dalian, China
Understanding the characteristics of the aragonite saturation state (Ωarag) is necessary for assessing impacts of ocean acidification, especially in coastal oceans. Based upon surveys conducted in August and October 2022, the distribution and controlling processes of Ωarag were investigated in the North Yellow Sea near the Yalu River estuary. Surface water Ωarag values exhibited substantial variations of 1.14 to 3.79 for the input of river-diluted water and community production, whereas bottom water Ωarag values ranged from 1.82 to 2.40 in August. In addition, surface water Ωarag was further reduced to 1.07–2.37 in October due to the combined effects of seawater temperature decreasing and the upwelling of bottom water with low Ωarag values, while Ωarag values lowed to 1.04–2.14 in bottom water. Considerably low Ωarag values during summer and autumn in nearshore areas, especially in the Yalu River estuary, were resulted from the input of river-diluted water, while the net community respiration and remineralization induced the low bottom water Ωarag values in offshore areas. We suggest that integrated and multidisciplinary studies are required to quantify the trends and dynamics of acidification and its synergistic effects on the marine ecosystem in estuarine and coastal oceans.
1 Introduction
The aragonite saturation state of seawater (Ωarag) is crucial for many marine organisms to form calcium carbonate (CaCO3) skeletons and shells; for example, Ωarag > 3.0 is required for the optimal growth of corals (Yamamoto et al., 2012; Eyre et al., 2018). Declines in Ωarag are detrimental to many marine calcifying organisms and ecosystems (Fabry et al., 2008; Jin et al., 2015; Ravaglioli et al., 2020). Coastal oceans are highly productive marine ecosystems, sustaining numerous commercially valuable resources (Gattuso et al., 1998). However, impacted by multiple natural and anthropogenic processes, such as CO2 uptake (Doney et al., 2009; IPCC, 2021), seawater temperature changes (Jiang et al., 2019; Xue et al., 2021), net community respiration and remineralization (Zhai et al., 2014b; Xu et al., 2016a; Xu et al., 2018; Li et al., 2022), upwelling of CO2-enriched waters (Feely et al., 2008), and river input (Salisbury et al., 2008; Zhai et al., 2015), coastal acidification may occur more rapidly than that in the open ocean, with considerable variability and complexity (Cai et al., 2011; Chou et al., 2013; Xiong et al., 2020; Li and Zhai, 2021). For example, seawater Ωarag is projected to be undersaturated in the nearshore areas of California within the next 30 years, threatening seafloor habitats (Gruber et al., 2012). Therefore, ascertaining the characteristics of seawater Ωarag is essential and to better understand the controlling processes in productive coastal oceans.
The North Yellow Sea (NYS) is a semi-enclosed shallow sea in the western North Pacific that is surrounded by rapidly developing and highly populated regions. However, the NYS suffers from seasonal acidification with low Ωarag values of 1.0–1.5 mainly caused by the net community respiration and remineralization, whereas net community calcification is terminated when the Ωarag value reaches a critical threshold of 1.5–1.6 (Li and Zhai, 2019). The nearshore areas in the NYS, especially in the Yalu River estuary, are major and expanding marine aquaculture zones, sustaining numerous commercially valuable resources, and comprise one of the ecosystems most susceptible to ocean acidification (Zhai, 2018). Observations of nearshore areas are important to obtain the characteristics of seawater Ωarag and understand controlling processes and future influences on marine calcifying organisms and coastal ecosystems (Xue et al., 2017; Li and Zhai, 2021).
Two field surveys were conducted in August and October 2022 to ascertain the characteristics of seawater Ωarag and explore how river water dilutions act with seawater temperature changes and biological processes to affect seawater Ωarag in the NYS. This research has important implications in furthering our understanding of seawater Ωarag dynamics in river-dominated coastal areas and its potentially negative effects on marine organisms and coastal productive marine ecosystems.
2 Materials and methods
2.1 Study area
The NYS is characterized by a temperate climate, with a rain-bearing southwest monsoon from June to September and a strong northeast monsoon from November to March (Chen, 2009). The Yellow Sea Cold Water Mass (YSCWM) develops from late spring to autumn, resulting in a seasonally changing thermocline (Xu et al., 2016b). The NYS is fed by several rivers along the coastline (e.g., the Yalu River, with an annual runoff and sediment discharge of >30 billion m3 and 113 × 104 t, respectively) (Liu, 2013). This discharge of urban, industrial, and agricultural wastewater along the Yalu River negatively impacts the estuary environment (Zhao et al., 2011). Intensifying eutrophication and algal blooms are often observed in the NYS (Lin et al., 2008; State Oceanic Administration of China, 2021), leading to seasonal acidification (Zhai et al., 2014b; Zhai et al., 2015; Xu et al., 2018) with the variations of bottom water Ωarag increasing by a factor of 4–7 from spring to summer and autumn over the past 40 years (Li et al., 2022). Therefore, regulated by both terrigenous material importation and oceanic dynamics, the spatial and seasonal variability of hydrological and biogeophysical properties of the NYS are considerably complex.
2.2 Sampling and analytical methods
Two field surveys were conducted on 10–26 August and 11–24 October 2022 (from 44 sampling stations) (Figure 1), undertaken during the summer and flood season and autumn, respectively. During each survey, seawater temperature and salinity were recorded with a calibrated conductivity, temperature, depth (CTD) recorder (SBE 911, Sea-Bird Electronics Inc., USA). Water samples were collected to determine dissolved oxygen (DO), dissolved inorganic carbon (DIC), and total alkalinity (TAlk) at one to four different depths (depending on water depth and thermocline) using a rosette sampler fitted with 8-L Niskin bottles and mounted with CTD units.
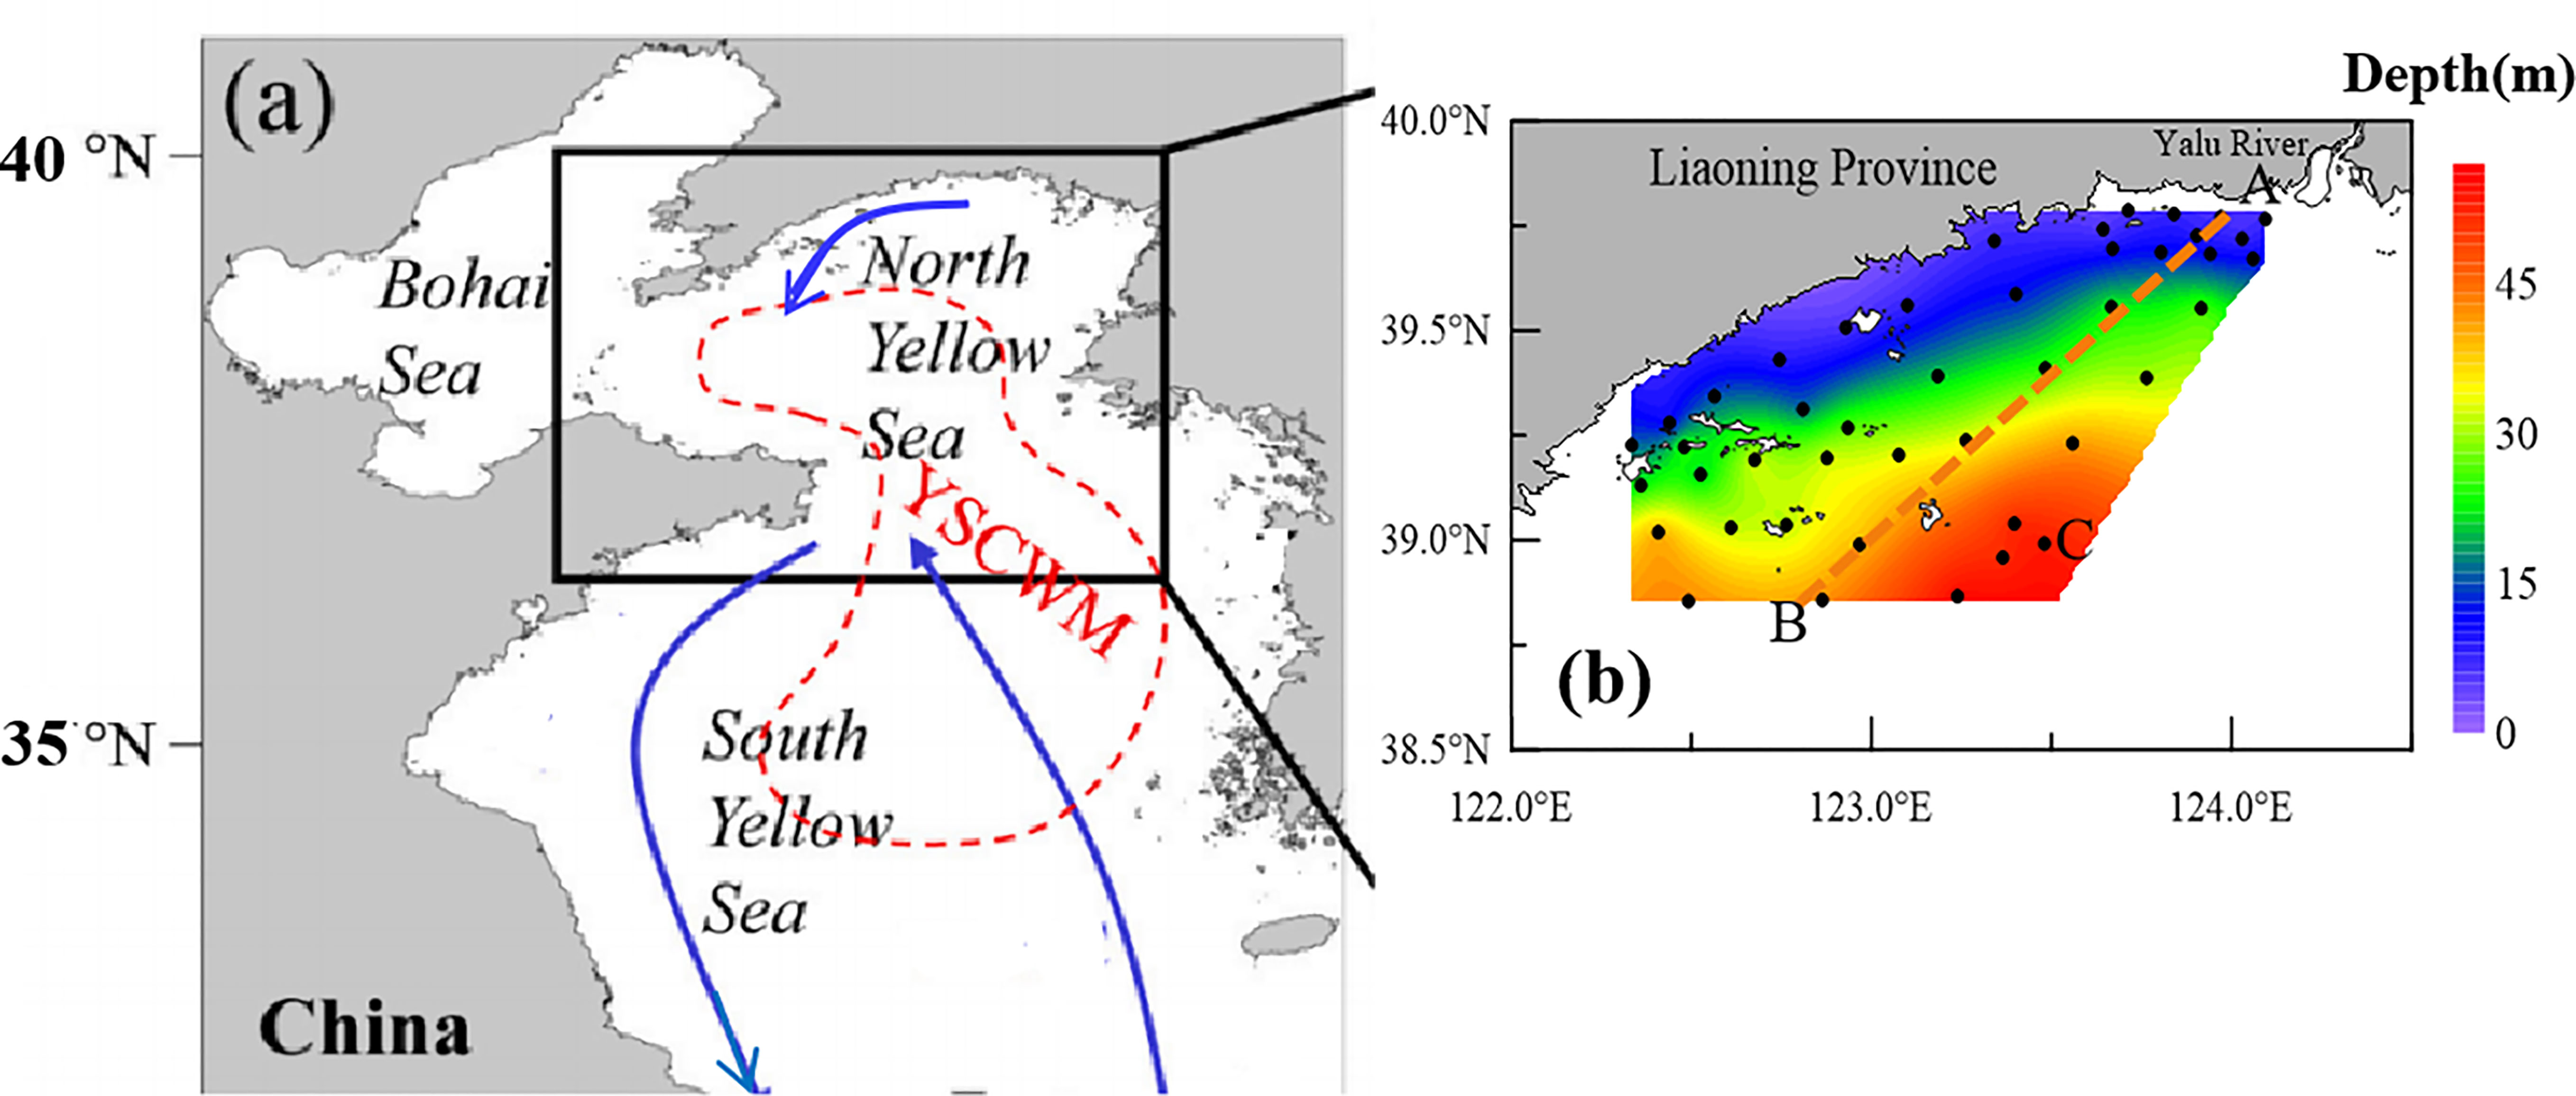
Figure 1 Study area and sampling stations. (A) Relative location of the study area in the China coastal seas. Arrows denote major currents in the coastal seas during the northeast monsoon season (Zang et al., 2003; Chen, 2009),The summertime Yellow Sea Cold Water Mass (YSCWM) is indicated by a red dashed outline (Li and Zhai, 2021). (B) Study area within the frame in (A); black dots denote the stations investigated, and orange line indicates the section AB.
The DO samples were collected, fixed, and titrated aboard following the Winkler procedure. The uncertainty in DO data was estimated to be<0.5% (Zhai et al., 2014b). DO saturation (DO%) was computed from the measured O2 concentrations divided by the O2 concentration at saturation with the atmosphere based on the equation of Benson and Krause (1984).
The DIC and TAlk samples were unfiltered (Zhai et al., 2014a; Xu et al., 2018) and stored in bottles (Huang et al., 2012), then preserved at room temperature after the addition of saturated HgCl2. The samples were allowed to settle before measurement. DIC was measured using a total inorganic carbon analyzer based on infrared detection (AS-C3, Apollo SciTech, Inc., USA). TAlk was determined by Gran titration based on an alkalinity titrator (AS-ALK2, Apollo SciTech, Inc., USA). The DIC and TAlk measurements were both calibrated against certified reference materials from A.G. Dickson’s laboratory for quality assurance at a precision level of ±2 μmol kg−1 (Cai et al., 2004; Dickson et al., 2007).
2.3 Calculation of apparent oxygen utilization
Apparent oxygen utilization (AOU) was calculated by subtracting the measured DO from the air-equilibrated DO, with AOU > 0 indicating net community respiration and AOU< 0 indicating net biological production.
2.4 Calculation of Ωarag from DIC and TAlk
Based on the CO2SYS.xls v. 24 (Pelletier et al., 2015), an updated version of the original CO2SYS. EXE (Lewis and Wallace, 1998), seawater Ωarag was calculated using
The dissociation constants for H2CO3 and were those calculated by Millero et al. (2006) and Dickson (1990), respectively. The Ksp values for aragonite were taken from Mucci (1983).
2.5 Estimation of temperature effects on the variability of Ωarag
Based on the assumption of reaching transient air–sea CO2 equilibrium, the temperature effects on seawater Ωarag (ΔΩarag-tem) were obtained following the works of Jiang et al. (2015; 2019) and Xue et al. (2020; 2021) as
where pCO2 is the mean atmospheric CO2, obtained from the Tae-ahn Peninsula station (126.1°E, 36.7°N; data from NOAA/ESRL’s Global Monitoring Division, http://www.esrl.noaa.gov/gmd/). Thus, the variation of Ωarag caused by the processes excluding temperature is given by
2.6 Two-end member water mixing model
Seawater salinity S is a conservative parameter in the two-end member water mixing model and was estimated using
where dw and sw denote the river-diluted water and seawater, respectively, and the mixing ratio f of seawater with river-diluted water was estimated using (Fry, 2002)
The end-member values of the river-diluted water and NYS seawater are summarized in Table 1.
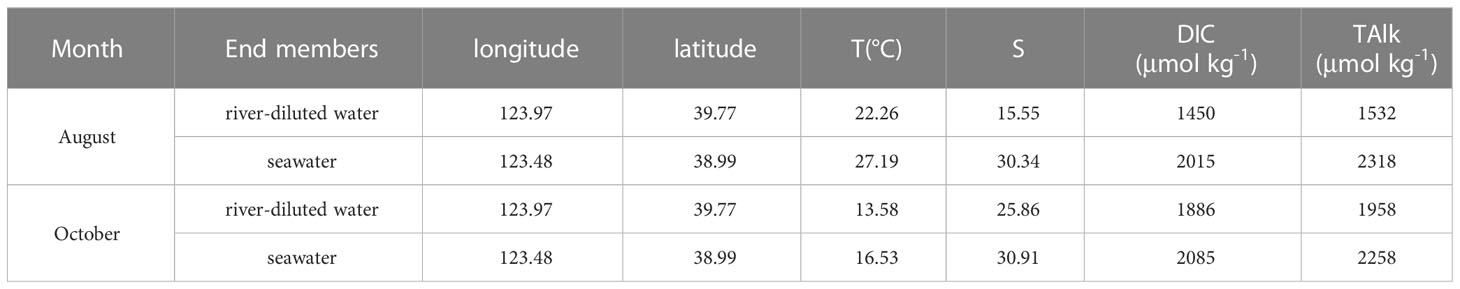
Table 1 Summary of end-member values in the two end-member model.
The theoretical mixed value of TAlk (TAlkmix), DIC (DICmix) and Ωarag (Ωarag-mix) were estimated using
2.7 Estimation of biological effects on seawater Ωarag
The contributions of biological processes to DIC (ΔDICbio) were defined as follows (Zhai et al., 2015):
Negative ΔDICbio values indicate net DIC removal from net primary production. Positive ΔDICbio values denote accumulation of metabolic CO2 by net community respiration and remineralization, as the possible impacts of limited vertical mixing and gas exchange across the seasonal thermocline are ignored in this study.
3 Results
3.1 Environmental setting
In August, surface water temperature ranged from 21.79°C to 27.45°C (Figure 2A), whereas bottom water exhibited a substantially greater variation (13.53°C–23.72°C) and a low-temperature area in offshore areas (Figure 2B). From this we can conclude that the influence of the YSCWM causes a thermocline in offshore areas, with the largest gradient (12.78°C) between surface and bottom waters recorded at the station located at 38.9°N, 123.2°E (Figure 3A). In October, seawater temperatures were 12.19°C–17.40°C and 12.04°C–18.00°C in surface and bottom waters, respectively (Figures 2C, D), which are lower than those found in summer. Because of the retreat of the YSCWM and strengthened vertical mixing in autumn, the thermocline became weaker, with a smaller temperature gradient (3.39°C) between surface and bottom waters than that found in summer (Figure 3B).
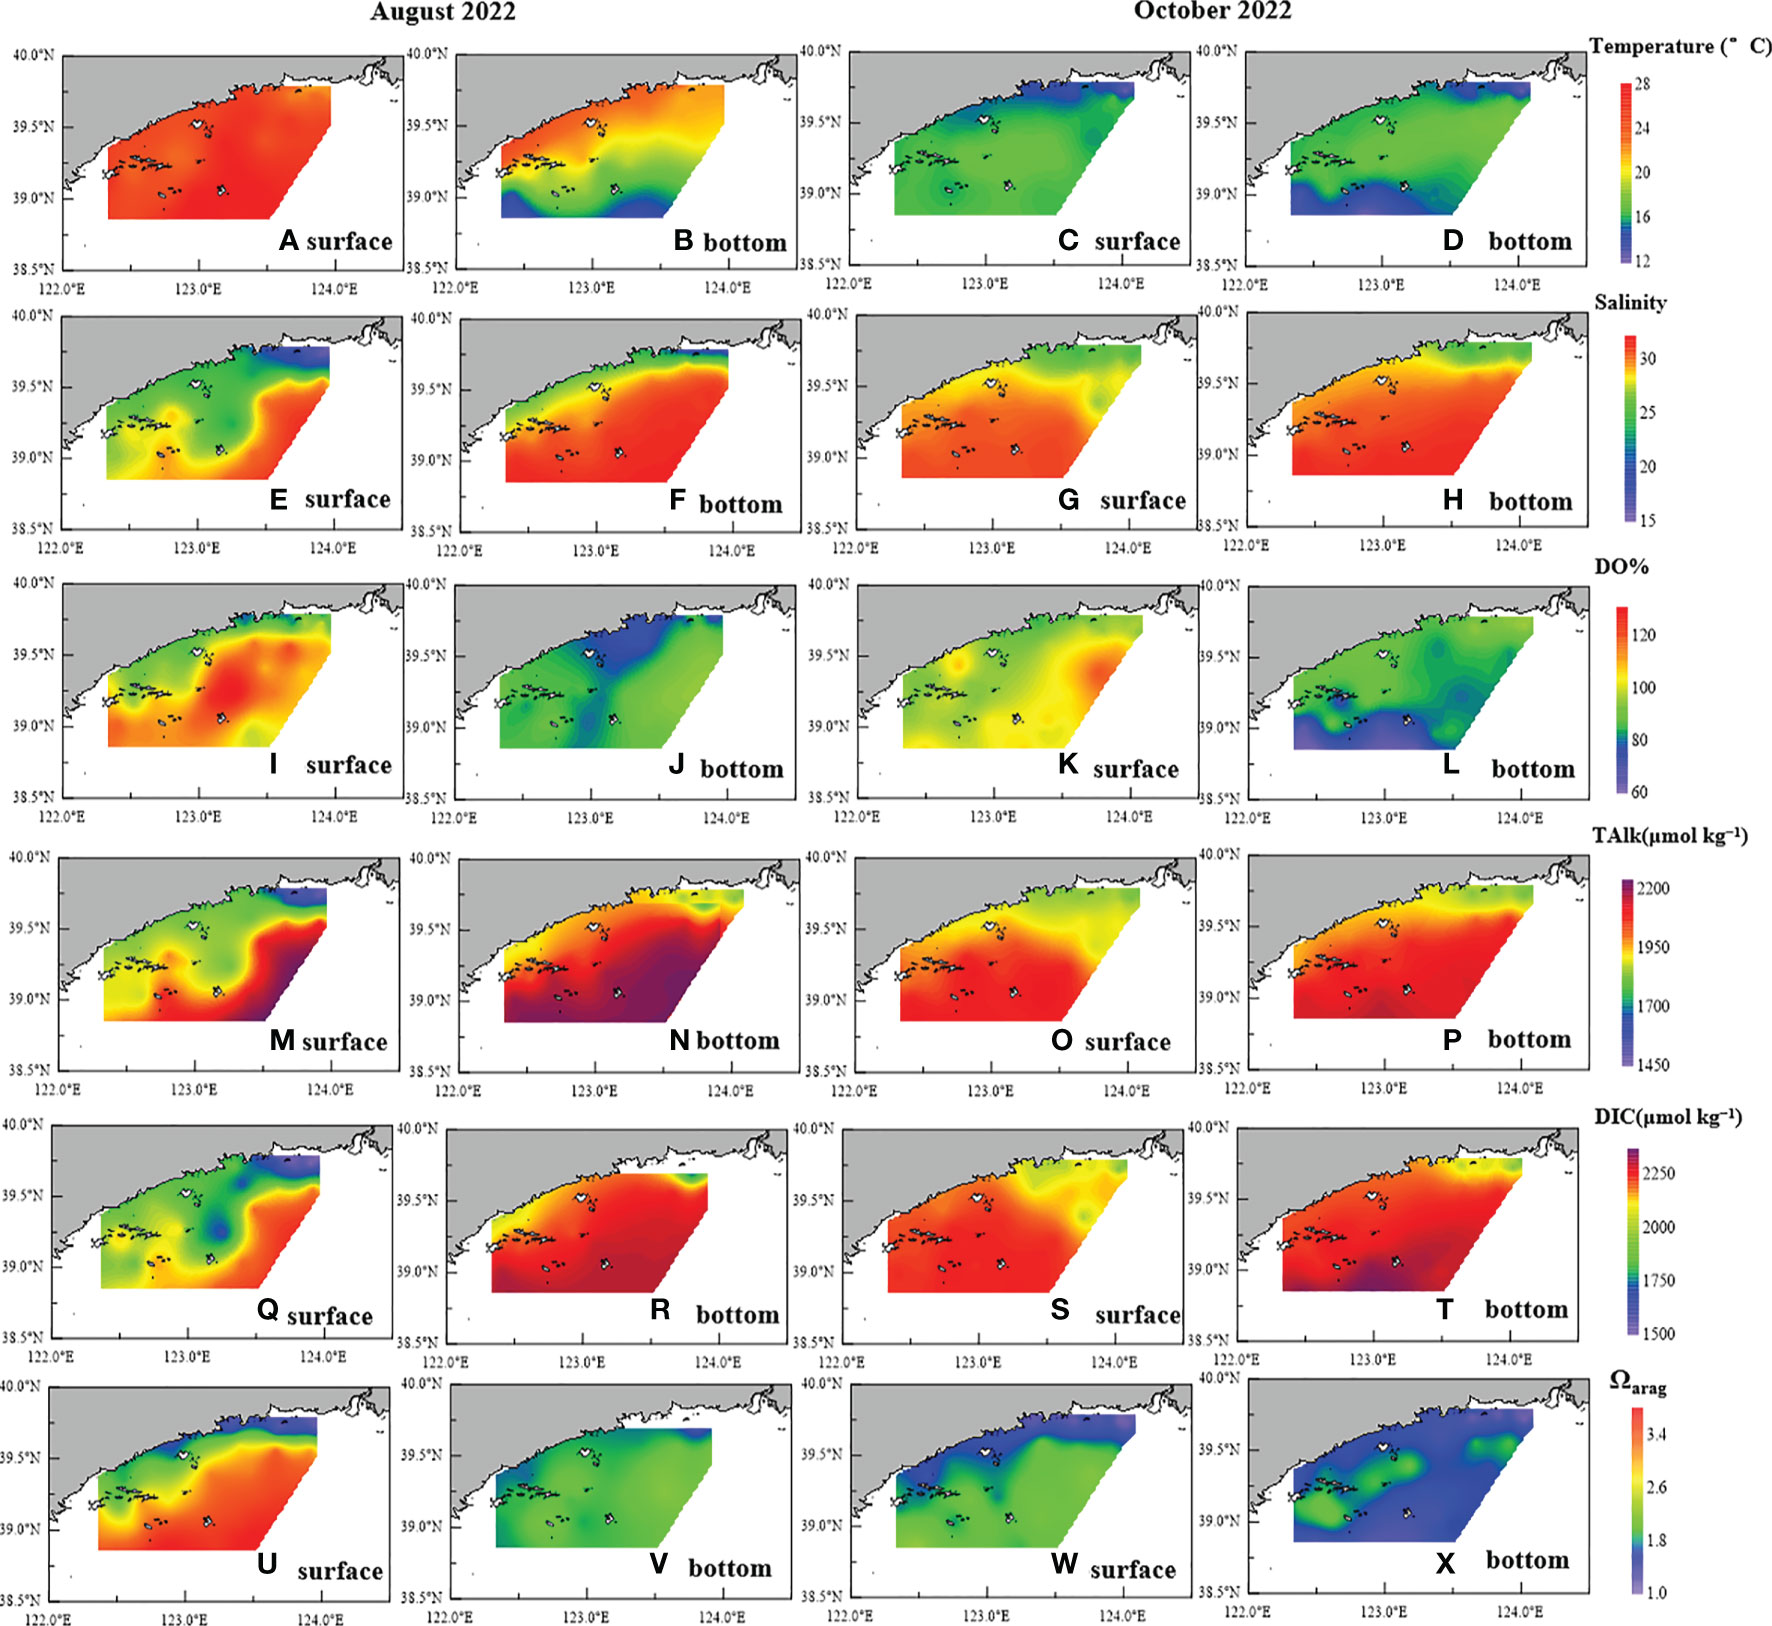
Figure 2 Distributions of (A–D) temperature, (E–H) salinity, (I–L) DO%, (M–P) TAlk, (Q–T) DIC, and (U–X) Ωarag in surface and bottom waters in (A, B, E, F, I, J, M, N, Q, R, U, V) August and (C, D, G, H, K, L, O, P, S, T, W, X) October 2022.
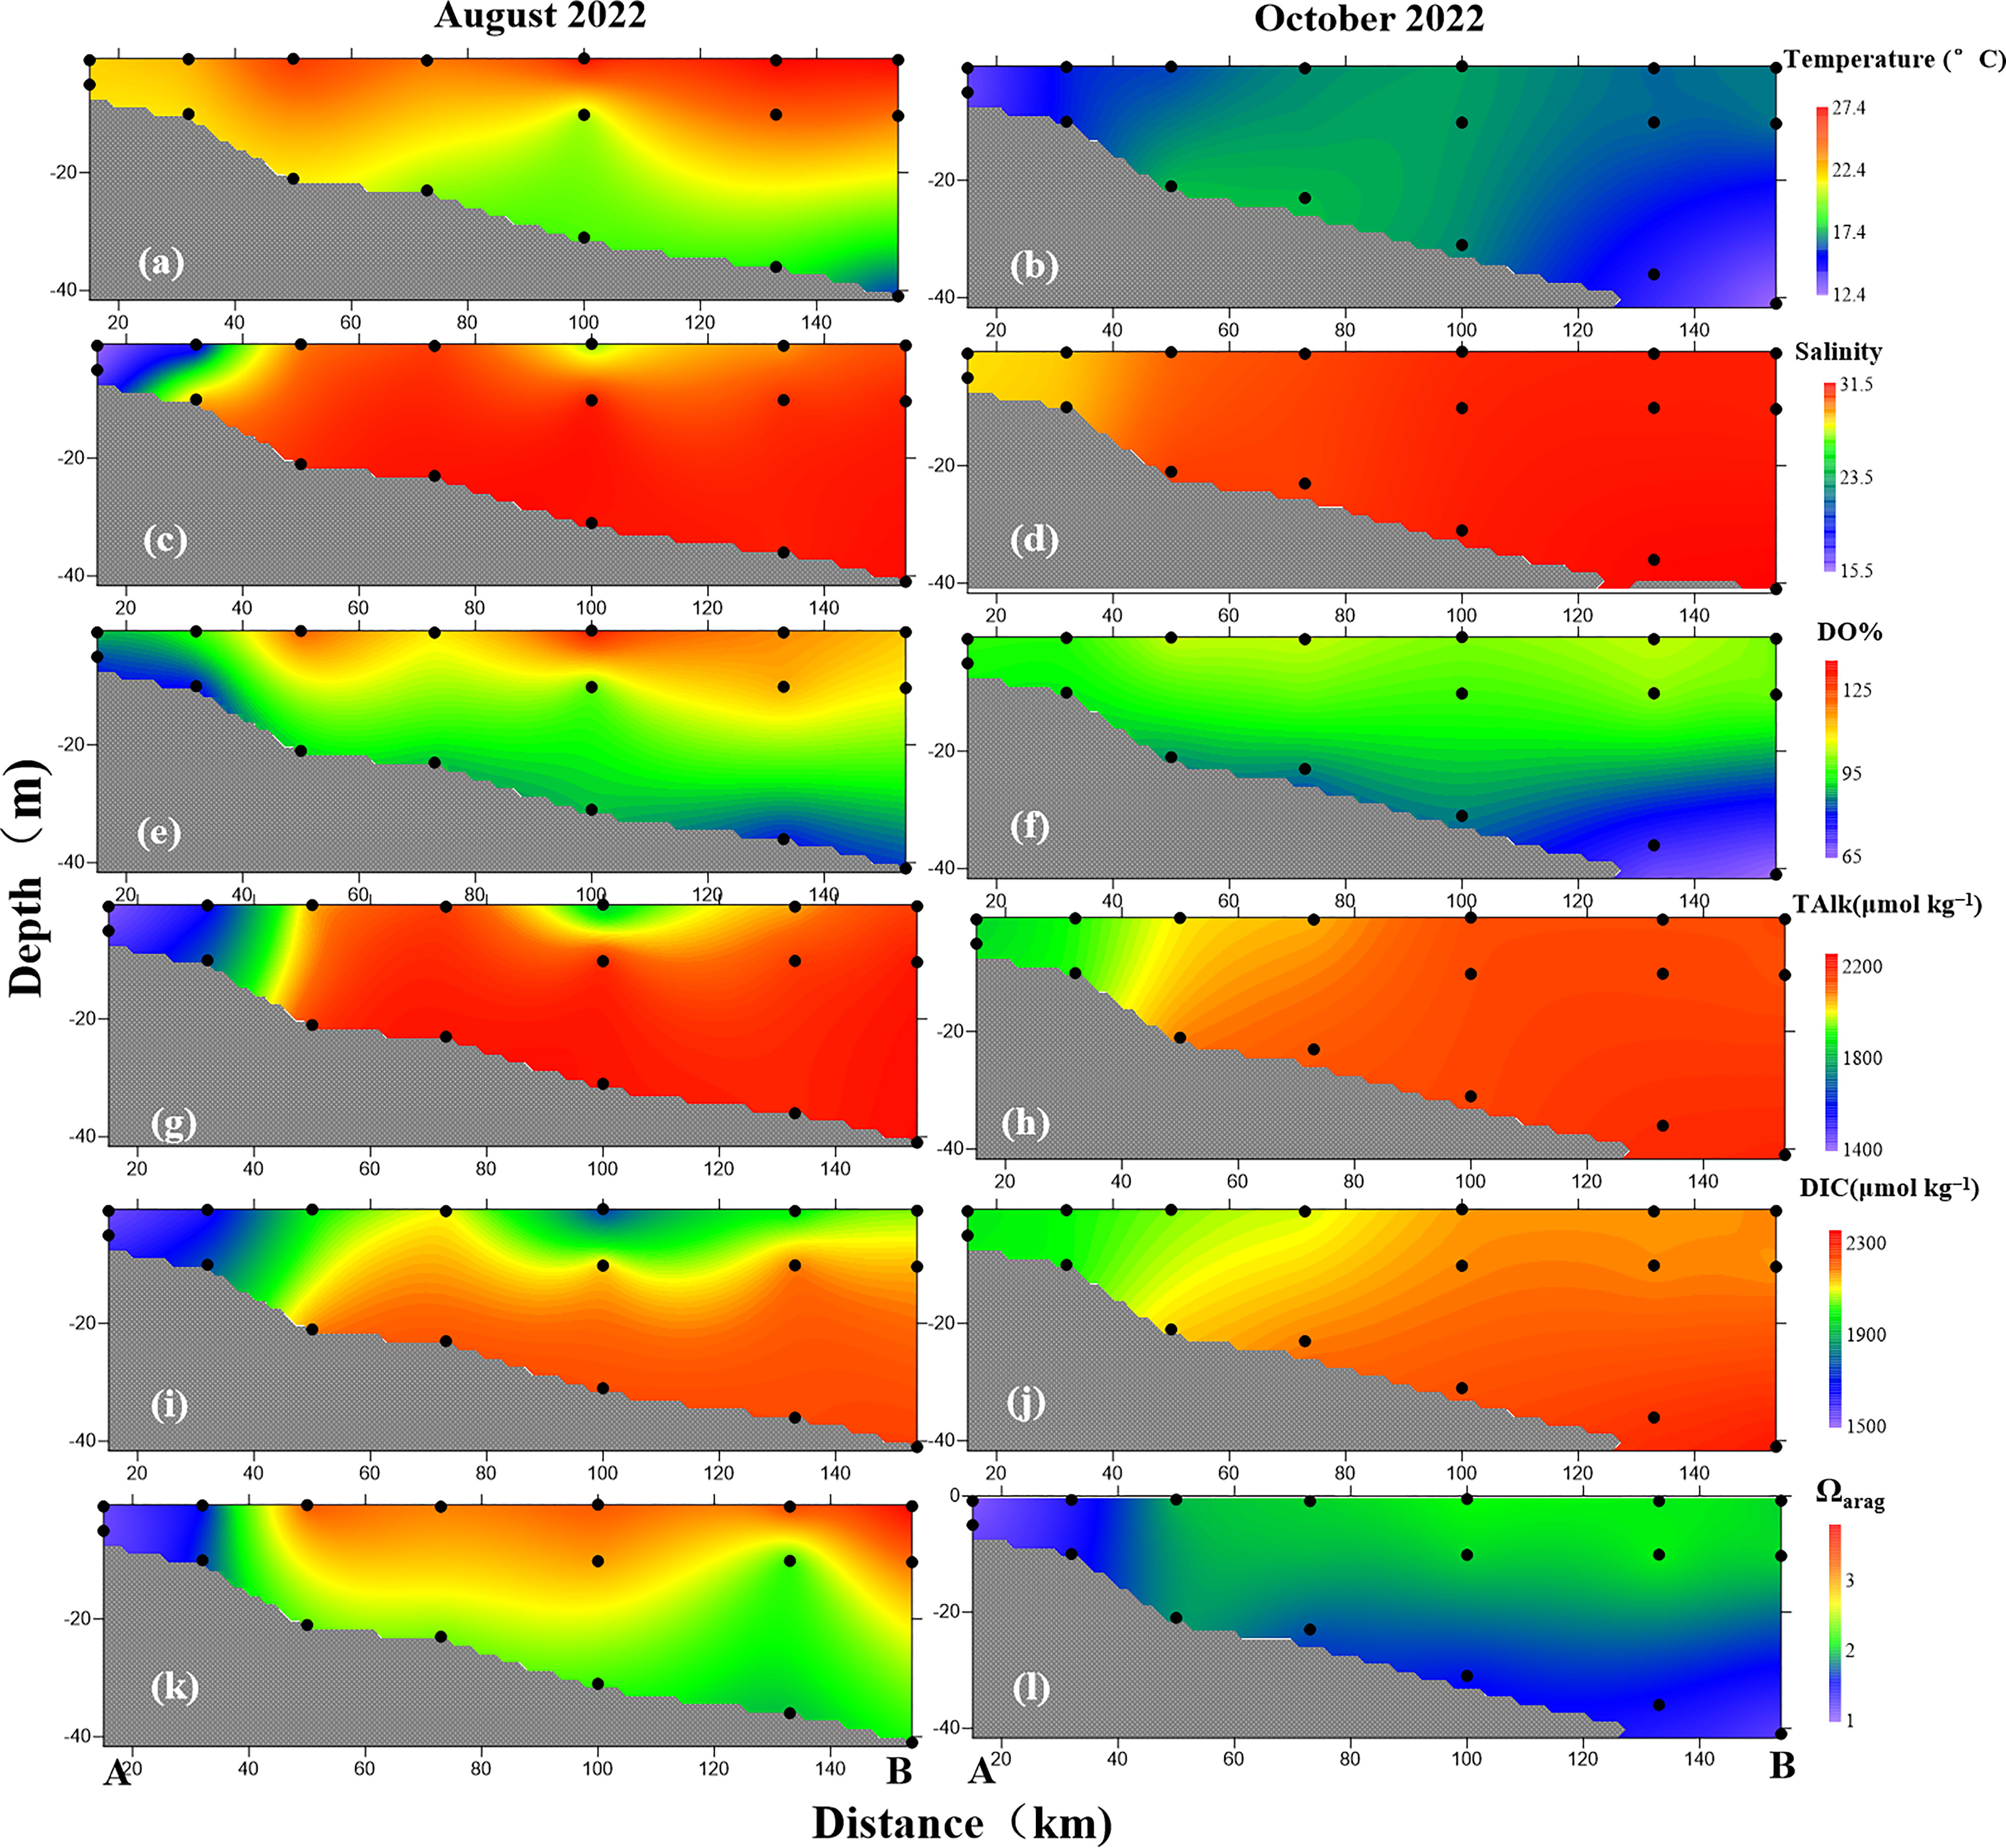
Figure 3 Depth profiles of (A, B) water temperature, (C, D) salinity, (E, F) DO%, (G, H) DIC, (I, J) TAlk. and (K, L) Ωarag along section AB in (A, C, E, G, I, K) August and (B, D, F, H, J, L) October 2022.
Seawater salinity exhibited substantially greater variations of 15.48–30.65 and 16.38–31.62 in surface and bottom waters, respectively, in August, whereas low salinity was found in nearshore areas, especially in the Yalu River estuary (Figures 2E, F) (Xu et al., 2023). In contrast, smaller variation and higher values of salinity in surface water (24.28–31.01) and bottom water (24.28–31.56) were observed in October (Figures 2G, H). A weak halocline appeared in August (Figure 3C) but disappeared in October (Figure 3D). According to the hydrological characteristics of section AB (Figures 3A–D), the water structure shifted from a vertically well-mixed water column with low salinity in the nearshore areas influenced by the input of river-diluted water to a stratified water body with low bottom water temperature in offshore areas because of the YSCWM.
3.2 Dissolved oxygen
The highest DO% value of 133% in offshore areas and a low-oxygen (79%) area along the coast were observed in surface water in August (Figure 2I). However, bottom water was undersaturated with DO% values of 70%–95% (Figure 2J), while the DO stratification gradually strengthened from nearshore to offshore areas (Figure 3E). In October, sea surface DO% ranged from 86% to 120%, while bottom water DO% was further reduced to its lowest value of 62% in offshore areas (Figures 2L, 3F), corresponding to low seawater temperature. In autumn, the YSCWM sank into the Yellow Sea trough and the organic matter decomposition in bottom water consumed oxygen continuously, resulting in a further decrease in seawater DO (Xu et al., 2018).
3.3 Carbon system parameters
In August, TAlk values in the water column ranged from 1532 μmol kg−1 (with a salinity of 15.55 located at 39.8°N, 124.0°E) to 2351 μmol kg−1 (with a salinity of 31.54 located at 39.0°N, 123.4°E) (Figures 2M, N). Low TAlk values were observed in surface water of nearshore areas because of the input of river-diluted water (e.g., the Yalu River; Xu et al., 2018). High TAlk values were found in bottom water of offshore areas because of the influence of the YSCWM (Yuan et al., 2008; Xu et al., 2018). However, the TAlk depth profile exhibited a smaller variation compared of those of the other parameters (Figure 3G). In October, seawater TAlk exhibited a small variation of 1894–2337 μmol kg−1, while TAlk was lower in the Yalu River estuary than in offshore areas (Figures 2O, P, 3H).
In August, seawater DIC ranged from 1450 μmol kg−1 (with a salinity of 15.55 located at 39.8°N, 124.0°E) to 2182 μmol kg−1 (with a salinity of 31.61 located at 38.9°N, 122.5°E). The distribution of seawater DIC was similar to that of seawater TAlk (Figures 2Q, R), while DIC stratification was observed in offshore areas (Figure 2R), having the largest gradient (295 μmol kg−1) between surface and bottom waters located at 38.9°N, 122.5°E. In October, seawater DIC had relatively high values (Figures 2S, T) of 1822–2211 μmol kg−1, whereas the DIC depth profile exhibited less variation, with the highest DIC values recorded at the station located at 38.9°N, 122.9°E in bottom water of an offshore area (Figure 3J).
Surface water Ωarag had a substantial variation of 1.14 to 3.79, whereas bottom water Ωarag ranged from 1.82 to 2.40, which is lower than that of surface water in August (Figures 2U, V). Spatially, low Ωarag was found in nearshore areas, especially in the Yalu River estuary, while high Ωarag was observed in surface water of offshore areas (Figure 2U). In October, surface water Ωarag was lower than that in summer, with values of 1.07–2.37 (Figure 2W), and bottom water Ωarag was further reduced to 1.04–2.14 (Figures 2X), with the lowest values observed in the bottom water of offshore areas, corresponding to low DO and high DIC values. Overall, long periods of low Ωarag values were observed in nearshore areas and bottom water of offshore areas during summer and autumn, and these were considerably lower than those found in the open ocean (Ωarag 2.0–4.2) at the same latitude (Jiang et al., 2015).
4 Discussion
4.1 Effect of seawater temperature on seasonal variation in Ωarag
Seawater temperature is an important factor affecting the distribution of seawater Ωarag (Xu et al., 2016a; Xu et al., 2018; Jiang et al., 2019; Xue et al., 2021). In this study, surface water Ωarag was high in August and low in October, which is consistent with the variations in seawater temperature (Figures 2, 3). There was a positive relationship between seawater Ωarag and temperature (with Ωarag = 0.45T – 8.66, R2 = 0.76, and n = 46 in August and Ωarag = 0.23T – 1.86, R2 = 0.65, and n = 53 in October) (Figure 4A). In addition, ΔΩarag-tem was calculated according to Equation (2) (Jiang et al., 2019; Xue et al., 2020) at an average seawater temperature of 19°C during the two surveys by keeping DIC, TAlk, and S constant to further quantify the effects of temperature on seawater Ωarag. The results show that ΔΩarag-tem ranged from −0.84 to 0.42, which is about −24%–45% of the absolute Ωarag values, with relatively high values found in offshore areas in August. Furthermore, the Ωarag-Nontem values were 0.97–2.98 and 1.43–2.57 in August and October, respectively, which are closer to each other, in contrast to the Ωarag values (Figure 4A). Overall, seawater temperature had an important influence on the seasonal variability of surface water Ωarag, especially in offshore areas. This finding is in agreement with those of Jiang et al. (2015; 2019) and Xue et al. (2020; 2021). However, it is worth noting that surface water Ωarag-Nontem had a considerably wide range of variations, especially in August, and ΔΩarag-tem values were relatively low in nearshore areas, while bottom water Ωarag values deviated considerably from Ωarag–T lines, suggesting that other factors are in play; that is, the dilution effect of riverine water discharge may also affect the distributions of Ωarag (Salisbury et al., 2008; Sunda and Cai, 2012), especially in nearshore areas.
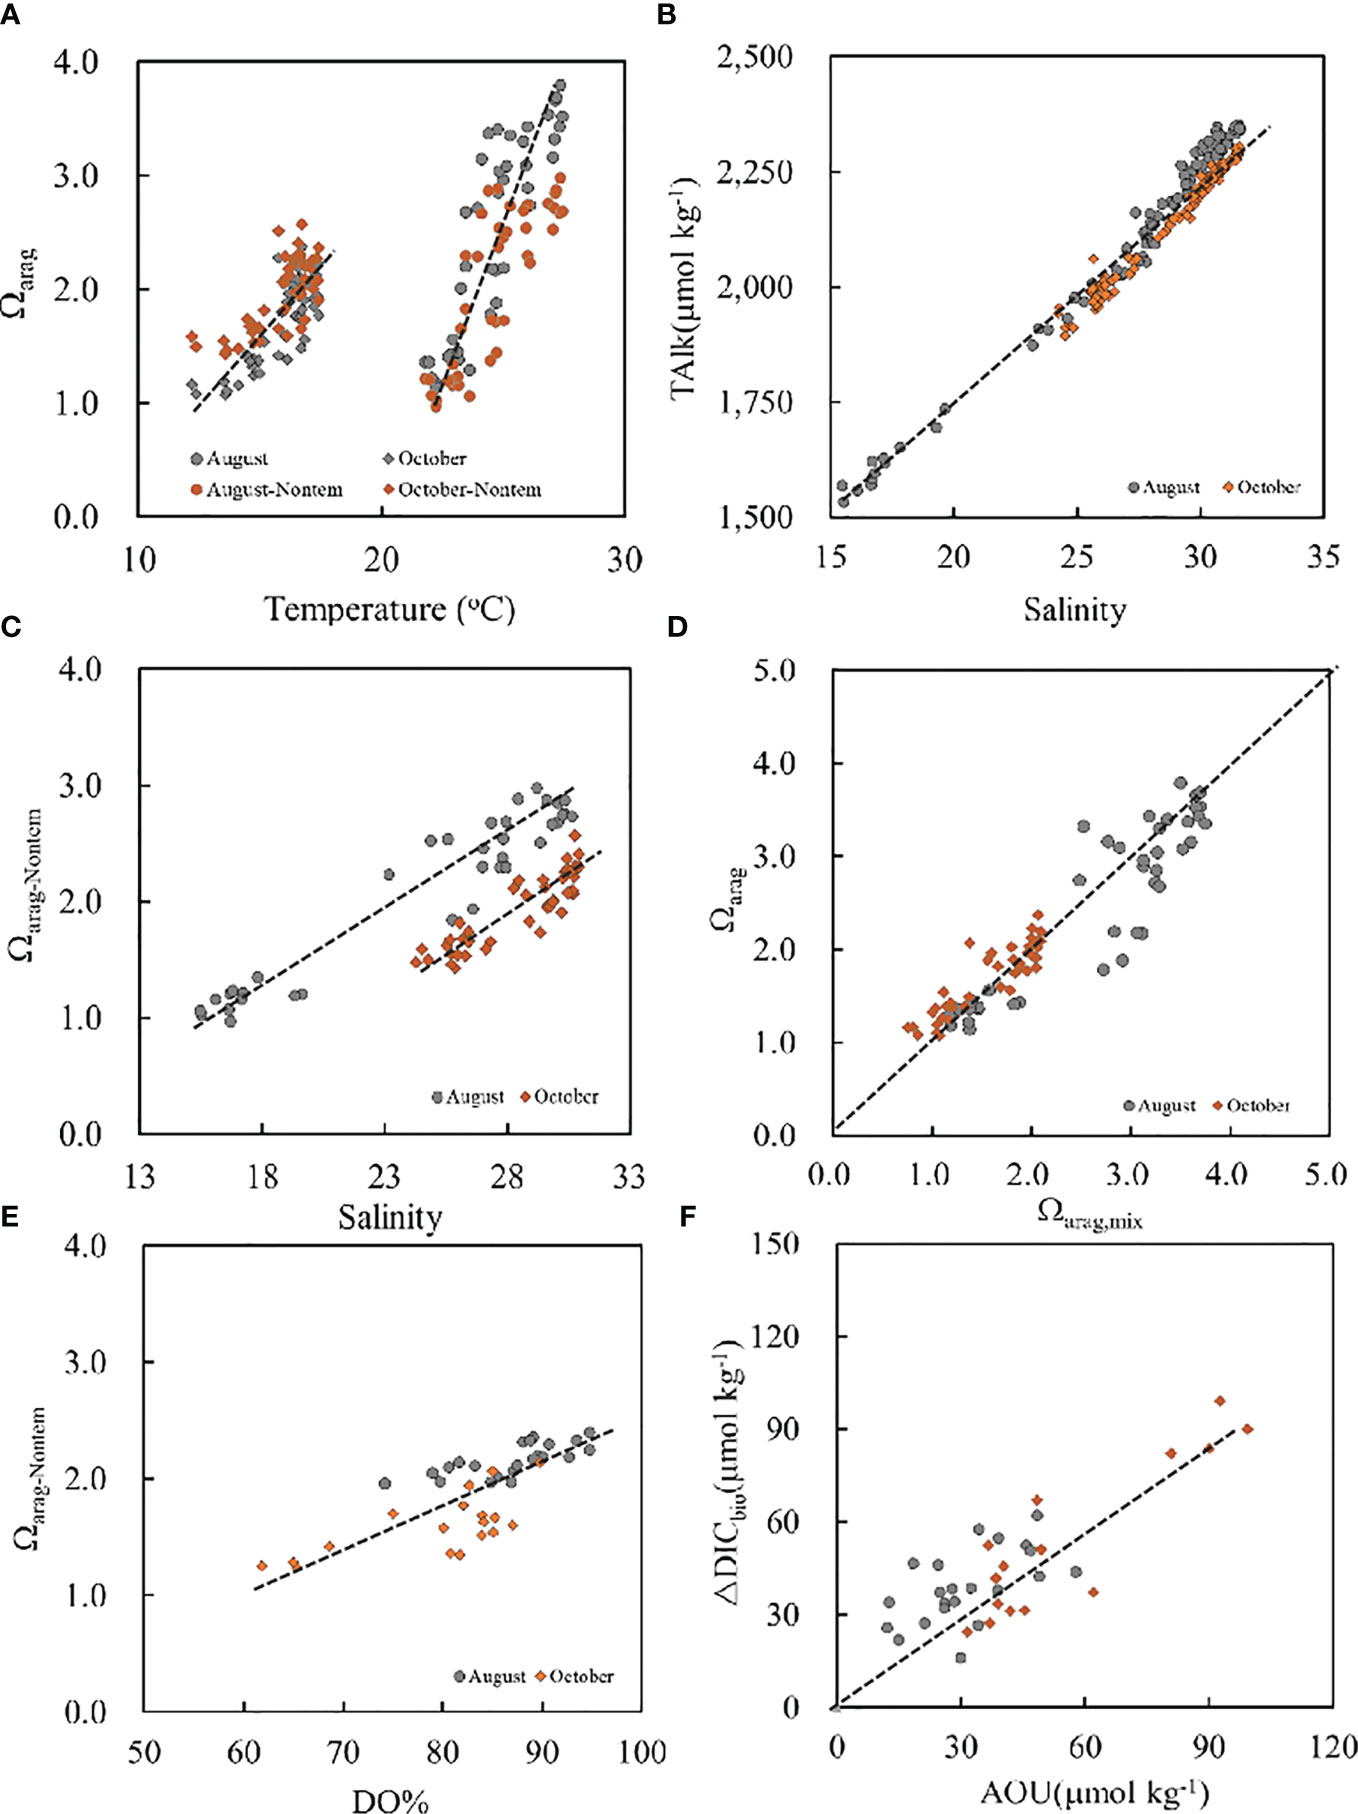
Figure 4 Ωarag versus (A) temperature and versus (D) Ωarag,mix, (B) TAlk versus salinity, (C) Ωarag-Nontem versus salinity and versus (E) DO%, and (F) ΔDICbio versus AOU. The dashed line in (F) is the modeled relationship between ΔDICbio and AOU calculated from the Redfield equation.
4.2 Dominant effects of river-diluted water input on low Ωarag in nearshore areas
River-diluted water input not only decreases salinity but also decreases TAlk and DIC, thereby diminishing Ωarag values because most of the world’s largest rivers have lower Ωarag values than those observed in seawater (Salisbury et al., 2008; Jiang et al., 2010; Sunda and Cai, 2012). Here, the effects of river-diluted water input on the variability of Ωarag were examined through both a qualitative analysis and a two-end member water mixing model. Seawater TAlk, a conservative parameter, versus salinity had a very tight linear relationship (with TAlk = 50.7S + 705, R2 = 0.96, and n = 215) (Figure 4B), especially in low-salinity nearshore areas, indicating that obvious water mixing was controlled by nearly two end members (Zhai et al., 2015). The intercept of the TAlk–S equation (705 μmol kg−1) was consistent with the TAlk value (740 μmol kg−1) of the Yalu River (Zhang, 1997). The conservative TAlk value should be 2327 μmol kg−1 at a salinity of 32 based on the TAlk–S equation, which was virtually consistent with the NYS TAlk values (2290 ± 25 μmol kg−1) (Zhai et al., 2014b), indicating that water characteristics in the study area were mainly controlled by the mixing of the NYS and the diluted water from the Yalu River. During summer and autumn, low seawater Ωarag values of 1.14–1.56 in August and 1.04–1.57 in October were observed in nearshore areas, where salinity ranged from 15.55 to 19.64 and from 24.28 to 27.31, respectively. There was a positive relationship between surface water Ωarag-Nontem and salinity values (with Ωarag-Nontem = 0.12S − 0.92, R2 = 0.92, and n = 46 in August and Ωarag-Nontem = 0.12S – 1.64, R2 = 0.79, and n = 53 in October) (Figure 4C). Furthermore, based on the two-end member water mixing model, stations A (40.0°N, 124.0°W) and C (39.0°N, 123.5°W) were selected as the river-diluted water end member and the NYS end member, respectively, to investigate the effects of the mixing of river-diluted water with seawater on the distribution of Ωarag. The results show that most surface water Ωarag values were close to the calculated Ωarag,mix values, which were distributed around the 1:1 line (Figure 4D), especially in nearshore areas, indicating the important effects of the mixing of river-diluted waters with seawater on the distribution of Ωarag in the study area. The river-diluted water with low Ωarag values, especially in the Yalu River, substantially decreased the seawater Ωarag. In addition, low Ωarag values were also observed in subsurface water associated with high salinity, especially in offshore areas, suggesting another controlling factor; that is, the net community respiration and remineralization may also lead to coastal Ωarag decline (Zhai et al., 2014b; Xu et al., 2016a; Xu et al., 2018).
4.3 Low bottom water Ωarag in offshore areas induced by net community respiration and remineralization
Most bottom water Ωarag values were low, corresponding to low seawater temperature and undersaturated DO values (Figures 2, 3), especially in offshore areas. In addition, there was a positive relationship between the bottom water Ωarag-Nontem and DO% data in offshore areas (Figure 4E), indicating that Ωarag decreased while DO was consumed and oxygen-consuming processes might dominate these waters. In contrast to TAlk, seawater DIC is a nonconservative parameter, which is subject to photosynthesis (related to an increase in Ωarag) and net respiration and remineralization (related to a decrease in Ωarag). To characterize the influence of net community respiration and remineralization on seawater Ωarag, the differences (ΔDICbio) between measured DIC values and predicted DIC values (DICmix) based on the two-end member water mixing model were calculated following Equation (9), with positive values indicating the addition of DIC and decline of Ωarag. The results show that ΔDICbio values varied greatly (16–62 μmol kg−1 in August and 24–99 μmol kg−1 in October), indicating that most bottom water DIC, apart from conservative water mixing, was controlled by metabolic processes in offshore areas. Metabolic processes will result in not only DIC oversaturation but also DO depletion, which can be roughly estimated by using the traditional Redfield equation (Redfield et al., 1963). When local hydrological dynamics cannot enable a water mass to ventilate to the atmosphere, metabolic CO2 will accumulate, resulting in a decrease in seawater Ωarag in subsurface waters. In this study, seawater ΔDICbio versus AOU ranged around the Redfield ratio (Figure 4F), denoting that net respiration and remineralization served as one of the key processes maintaining both DO depletion and DIC oversaturation, which was the driving force accounting for the observed low bottom water Ωarag in offshore areas. Furthermore, water stratification persisted until October as a result of the influence of the YSCWM, providing more time for net respiration and remineralization to induce DIC addition in subsurface waters, leading to a lower Ωarag in October than in August, as reported by Xu et al. (2016a).
5 Summary and implications
The distribution and dynamics of seawater Ωarag in the NYS near the Yalu River estuary were investigated, and distinct spatial and seasonal variations were found. Low Ωarag values were observed in nearshore areas during summer and autumn, which ranged from 1.14–1.56 and 1.04–1.57 associated with quite low salinity in summer and autumn, respectively, because of the input of river-diluted water, especially the Yalu River. Bottom water Ωarag values were 1.82–2.40 and further reduced to 1.24–2.14 from summer to autumn in offshore areas due to the effects of net community respiration and remineralization. Considerably low Ωarag values in the study area, compared to those in the open ocean (Ωarag 2.0–4.2) at the same latitude, will have negative effects on marine organisms and ecosystems, with potentially large economic consequences. Therefore, integrated and multidisciplinary studies are required to quantify the trends and dynamics of acidification and its synergistic effects on marine organisms and ecosystems in estuarine and coastal ocean regions.
Data availability statement
The original contributions presented in the study are included in the article/supplementary material. Further inquiries can be directed to the corresponding authors.
Author contributions
HC and JH conceived this study. XX conducted to methodology, software, analysis, writing – original draft, visualization. YH made substantial contribution to data curation, writing – review and editing. ZH and XW performed the field surveys and analyzed the data set. All authors contributed to the article and approved the submitted version.
Funding
This work was jointly supported by the National Key Research and Development Program of China (2017YFA0603003) and National Natural Science Foundation of China (41206060). We thank New Bridge Translation Co., Ltd. (Guangzhou, China) for assistance with English.
Acknowledgments
Special thanks to the editor and reviewers for their useful comments and constructive suggestions.
Conflict of interest
The authors declare that the research was conducted in the absence of any commercial or financial relationships that could be construed as a potential conflict of interest.
Publisher’s note
All claims expressed in this article are solely those of the authors and do not necessarily represent those of their affiliated organizations, or those of the publisher, the editors and the reviewers. Any product that may be evaluated in this article, or claim that may be made by its manufacturer, is not guaranteed or endorsed by the publisher.
References
Benson B. B., Krause D. (1984). The concentration and isotopic fractionation of oxygen dissolved in fresh water and seawater in equilibrium with the atmosphere. Limnol. Oceanogr. 29, 620–632. doi: 10.4319/lo.1984.29.3.0620
Cai W. J., Dai M. H., Wang Y. C., Zhai W. D., Huang T., Chen S. T., et al. (2004). The biogeochemistry of inorganic carbon and nutrients in the pearl river estuary and the adjacent northern south China Sea. Cont. Shelf Res. 24, 1301–1319. doi: 10.1016/j.csr.2004.04.005
Cai W. J., Hu X. P., Huang W. J., Murrell M. C., Lehrter J. C., Lohrenz S. E., et al. (2011). Acidification of subsurface coastal waters enhanced by eutrophication. Nat. Geosci. 4, 766–770. doi: 10.1038/ngeo1297
Chen C.-T. A. (2009). Chemical and physical fronts in the bohai, yellow and East China seas. J. Mar. Syst. 78, 394–410. doi: 10.1016/j.jmarsys.2008.11.016
Chou W. C., Gong G. C., Hung C. C., Wu Y. H. (2013). Carbonate mineral saturation states in the East China Sea: present conditions and future scenarios. Biogeosciences 10, 6453–6467. doi: 10.5194/bg-10-6453-2013
Dickson A. G. (1990). Standard potential of the reaction: AgCl(s) + 1/2H2(g) = ag(s) + HCl(aq), and the standard acidity constant of the ion HSO4- in synthetic sea water from 273.15 to 318.15 K. J. Chem. Thermodyn. 22, 113–127. doi: 10.1016/0021-9614(90)90074-Z
Dickson A. G., Sabine C. L., Christian J. R. (2007). Guide to best practices for ocean CO2 measurements. PICES. (Sidney: North Pacific Marine Science Organization), 1–191.
Doney S. C., Fabry V. J., Feely R. A., Kleypas J. A. (2009). Ocean acidification: the other CO2 problem. Annu. Rev. Mar. Sci. 1, 169–192. doi: 10.1146/annurev.marine.010908.163834
Eyre B. D., Cyronak T., Drupp P., De Carlo E. H., Sachs J. P., Andersson A. J. (2018). Coral reefs will transition to net dissolving before end of century. Science 359, 908–911. doi: 10.1126/science.aao1118
Fabry V. J., Seibel B. A., Feely R. A., Orr J. C. (2008). Impacts of ocean acidification on marine fauna and ecosystem processes. ICES J. Mar. Sci. 65, 414–432. doi: 10.1093/icesjms/fsn048
Feely R. A., Sabine C. L., Hernandez-Ayon J. M., Ianson D., Hales B. (2008). Evidence for upwelling of corrosive a’cidified’ water onto the continental shelf. Science 320, 1490–1492. doi: 10.1126/science.1155676
Fry B. (2002). Conservative mixing of stable isotopes across estuarine salinity gradients: a conceptual framework for monitoring watershed influences on downstream fisheries production. Estuaries 25, 264–271. doi: 10.1007/BF02691313
Gattuso J. P., Frankignoulle M., Wollast R. (1998). Carbon and carbonate metabolism in coastal aquatic ecosystems. Annu. Rev. Ecol. Sys. 29 (1), 405–434. doi: 10.1146/annurev.ecolsys.29.1.405
Gruber N., Hauri C., Lachkar Z., Loher D., Frölicher T. L., Plattner G. K. (2012). Rapid progression of ocean acidification in the California current system. Science 337, 220–223. doi: 10.1126/science.1216773
Huang W. J., Wang Y. C., Cai W. J. (2012). Assessment of sample storage techniques for total alkalinity and dissolved inorganic carbon in seawater. Limnol. Oceanogr. Methods 10, 711–717. doi: 10.4319/lom.2012.10.711
IPCC (2021). “Climate change 2021: the physical science basis,” in Contribution of working group I to the sixth assessment report of the intergovernmental panel on climate change (Cambridge and New York: Cambridge University Press).
Jiang L. Q., Cai W. J., Feely R. A., Wang Y., Guo X., Gledhill D. K., et al. (2010). Carbonate mineral saturation states along the U.S. East Coast. Limnol. Oceanogr. 55, 2424–2432. doi: 10.4319/lo.2010.55.6.2424
Jiang L. Q., Carter B. R., Feely R. A., Lauvset S. K., Olsen A. (2019). Surface ocean pH and buffer capacity: past, present and future. Sci. Rep. 9, 18624. doi: 10.1038/s41598-019-55039-4
Jiang L. Q., Feely R. A., Carter B. R., Greeley D. J., Gledhill D. K., Arzayus K. M. (2015). Climatological distribution of aragonite saturation state in the global oceans. Global Biogeochem. Cycles 29, 1656–1673. doi: 10.1002/2015GB005198
Jin P., Wang T. F., Liu N. N., Dupont S., Beardall J., Boyd P. W., et al. (2015). Ocean acidification increases the accumulation of toxic phenolic compounds across trophic levels. Nat. Commun. 6, 8714. doi: 10.1038/ncomms9714
Lewis E., Wallace D. W. R. (1998). Program developed for CO2 system calculations. ORNL/CDIAC-105 (Oak Ridge, Tennessee: Carbon Dioxide Information Analysis Center, Oak Ridge National Laboratory, US Department of Energy).
Li C. L., Yang D. Z., Zhai W. D. (2022). Effects of warming, eutrophication and climate variability on acidification of the seasonally stratified north yellow Sea over the past 40 years. Sci. Total Environ. 815, 152935. doi: 10.1016/j.scitotenv.2022.152935
Li C. L., Zhai W. D. (2019). Decomposing monthly declines in subsurface water pH and aragonite saturation state from spring to autumn in the north yellow Sea. Cont. Shelf. Res. 185, 37–50. doi: 10.1016/j.csr.2018.11.003
Li C. L., Zhai W. D. (2021). Mechanism-based deduction of subsurface aragonite saturation state in a semi-enclosed and seasonally stratified coastal sea. Mar. Chem. 232, 103958. doi: 10.1016/j.marchem.2021.103958
Lin F. A., Lu X. W., Luo H., Ma M. H. (2008). History, status and characteristics of red tide in bohai Sea. Mar. Environ. Sci. 27, 1–5.
Liu C. Z. (2013). A brief analysis of the resource development and its positive and negative effects of Yalu river in modern China (in Chinese). [Master’s thesis]. Jilin: Jilin University of China.
Millero F. J., Graham T. B., Huang F., Bustos-Serrano H., Pierrot D. (2006). Dissociation constants of carbonic acid in seawater as a function of salinity and temperature. Mar. Chem. 100, 80–94. doi: 10.1016/j.marchem.2005.12.001
Mucci A. (1983). The solubility of calcite and aragonite in seawater at various salinities, temperatures, and one atmosphere total pressure. Am. J. Sci. 283, 780–799. doi: 10.2475/ajs.283.7.780
Pelletier G. J., Lewis E., Wallace D. W. R. (2015). CO2SYS.XLS: a calculator for the CO2 system in seawater for Microsoft Excel/VBA, version 24 (Olympia, Washington: Washington State Department of Ecology).
Ravaglioli C., Lardicci C., Pusceddu A., Arpe E., Bianchelli S., Buschi E., et al. (2020). Ocean acidification alters meiobenthic assemblage composition and organic matter degradation rates in seagrass sediments. Limnol. Oceanogr. 65, 37–50. doi: 10.1002/lno.11246
Redfield A. C., Ketchum B. H., Richards F. A. (1963). “The influence of organisms on the composition of seawater,” in The Sea, vol. 2 . Ed. Hill M. N. (New York: John Wiley and Sons), 26–77.
Salisbury J., Green M., Hunt C. W., Campbell J. (2008). Coastal acidification by rivers: a threat to shellfish? EOS Trans. Am. Geophys. Union 89, 513–528. doi: 10.1029/2008EO500001
State Oceanic Administration of China. (2021). Bulletin of marine environmental status of China in 2020. Available at: http://www.mee.gov.cn/hjzl/sthjzk/jagb/ (Accessed May 27, 2022).
Sunda W. G., Cai W. J. (2012). Eutrophication induced CO2-acidification of subsurface coastal waters: interactive effects of temperature, salinity, and atmospheric pCO2. Environ. Sci. Technol. 46, 10651–10659. doi: 10.1021/es300626f
Xiong T. Q., Wei Q. S., Zhai W. D., Li C. L., Wang S. Y., Zhang Y., et al. (2020). Comparing subsurface seasonal deoxygenation and acidification in the yellow Sea and northern East China Sea along the north-to-South latitude gradient. Front. Mar. Sci. 7, 686. doi: 10.3389/fmars.2020.00686
Xu X. M., Zang K. P., Huo C., Zheng N., Zhao H. D., Wang J. Y., et al. (2016a). Aragonite saturation state and dynamic mechanism in the southern yellow Sea, China. Mar. pollut. Bull. 109, 142–150. doi: 10.1016/j.marpolbul.2016.06.009
Xu X. M., Zang K. P., Wang X. M., Xing Q. H., He Z. C., Chen H., et al. (2023). Distributions, influencing factors and fluxes of dissolved methane in the eastern part of liaodong peninsula in the north yellow Sea in spring. Mar. Environ. Sci. 42 (1), 22–28. doi: 10.12111/j.mes.2022-x-0203
Xu X. M., Zang K. P., Zhao H. D., Zheng N., Huo C., Wang J. Y. (2016b). Monthly CO2 at A4HDYD station in a productive shallow marginal sea (Yellow Sea) with a seasonal thermocline: controlling processes. J. Mar. Syst. 159, 89–99. doi: 10.1016/j.jmarsys.2016.03.009
Xu X. M., Zheng N., Zang K. P., Huo C., Zhao H. D., Mu J. L., et al. (2018). Aragonite saturation state variation and control in the river-dominated marginal BoHai and yellow seas of China during summer. Mar. pollut. Bull. 135, 540–550. doi: 10.1016/j.marpolbul.2018.07.032
Xue L., Cai W. J., Jiang L. Q., Wei Q. S. (2021). Why are surface ocean pH and CaCO3 saturation state often out of phase in spatial patterns and seasonal cycles? Glob. Biogeochem. Cycles 35, GB006949. doi: 10.1029/2021GB006949
Xue L., Cai W. J., Sutton A. J., Sabine C. (2017). Sea Surface aragonite saturation state variations and control mechanisms at the gray’s reef time-series site off Georgia, USA, (2006–2007). Mar. Chem. 195, 27–40. doi: 10.1016/j.marchem.2017.05.009
Xue L., Yang X., Li Y., Li L., Jiang L. Q., Xin M., et al. (2020). Processes controlling sea surface pH and aragonite saturation state in a large northern temperate bay:Contrasting temperature effects. J. Geophys. Res.: Biogeosci 125, JG005805. doi: 10.1029/2020JG005805
Yamamoto S., Kayanne H., Terai M., Watanabe A., Kato K., Negishi A., et al. (2012). Threshold of carbonate saturation state determined by CO2 control experiment. Biogeosciences 9, 1441–1450. doi: 10.5194/bg-9-1441-2012
Yuan D., Zhu J., Li C., Hu D. (2008). Cross-shelf circulation in the yellow and East China seas indicated by MODIS satellite observations. J. Mar. Syst. 70, 134–149. doi: 10.1016/j.jmarsys.2007.04.002
Zang J. Y., Tang Y. X., Zou E. M., Lie H. J. (2003). Analysis of yellow Sea circulation. Chin. Sci. Bull. 48, supplement, 12–20. doi: 10.1007/BF02900935
Zhai W. D. (2018). Exploring seasonal acidification in the yellow Sea. Sci. China Earth Sci. 61, 647–658. doi: 10.1007/s11430-017-9151-4
Zhai W. D., Chen J. F., Jin H. Y., Li H. L., Liu J. W., He X. Q., et al. (2014a). Spring carbonate chemistry dynamics of surface waters in the northern East China Sea: water mixing, biological uptake of CO2, and chemical buffering capacity. J. Geophys. Res. Oceans 119, 5638–5653. doi: 10.1002/2014JC009856
Zhai W. D., Zang K. P., Huo C., Zheng N., Xu X. M. (2015). Occurrence of aragonite corrosive water in the north yellow Sea, near the yalu river estuary, during a summer flood. Estuar. Coast. Shelf Sci. 166, 199–208. doi: 10.1016/j.ecss.2015.02.010
Zhai W. D., Zheng N., Huo C., Xu Y., Zhao H. D., Li Y. W., et al. (2014b). Subsurface pH and carbonate saturation state of aragonite on the Chinese side of the north yellow Sea: seasonal variations and controls. Biogeosciences 11, 1103–1123. doi: 10.5194/bg-11-1103-2014
Zhang J. (1997). “Impact of drainage basin weathering upon riverine chemistry (in Chinese),” in Biogeochemical studies of major Chinese estuaries e element transfer and environment. Ed. Zhang J. (Bei Jing, FL: China Ocean Press), 1–15.
Keywords: coastal acidification, aragonite saturation state, dynamic mechanism, North Yellow Sea, Yalu river estuary, river input
Citation: Xu X, Hu Y, He Z, Wang X, Chen H and Han J (2023) Processes controlling the aragonite saturation state in the North Yellow Sea near the Yalu River estuary: contrasting river input effects. Front. Mar. Sci. 10:1158896. doi: 10.3389/fmars.2023.1158896
Received: 04 February 2023; Accepted: 07 June 2023;
Published: 26 June 2023.
Edited by:
Qingzhen Yao, Ocean University of China, ChinaReviewed by:
Fajin Chen, Guangdong Ocean University, ChinaChristopher Sabine, University of Hawaii, United States
Copyright © 2023 Xu, Hu, He, Wang, Chen and Han. This is an open-access article distributed under the terms of the Creative Commons Attribution License (CC BY). The use, distribution or reproduction in other forums is permitted, provided the original author(s) and the copyright owner(s) are credited and that the original publication in this journal is cited, in accordance with accepted academic practice. No use, distribution or reproduction is permitted which does not comply with these terms.
*Correspondence: Hong Chen, aGNoZW5Abm1lbWMub3JnLmNu; Jianbo Han, amJoYW5Abm1lbWMub3JnLmNu