 Yanyan Kang
 Jun Lei
 Minjing Wang2
- 1College of Oceanography, Hohai University, Nanjing, China
- 2Observation and Research Station of East China Coastal Zone, Ministry of Natural Resources, Nanjing, China
- 3College of Hydrology and Water Resources, Hohai University, Nanjing, China
The topographic evolution of tidal flats is critical for local ecological conservation, coastal zone management, and physical oceanographic studies. However, obtaining this knowledge is often challenging due to the lack of frequently updated topographic data over large areas. With the explosion of remotely sensed data, the waterline method has become the most operational method for tidal flat topography acquisition. In this study, digital elevation models (DEMs) of the tidal flats around Tongzhou Bay on the Jiangsu coast were constructed using the waterline method for three periods (2013, 2015, and 2017) before and after the construction of phase I of the reclamation project. Furthermore, the topographic evolution characteristics were analyzed from four aspects: contours, area changes, erosion–deposition distribution, and typical cross-sections. The results showed that: 1) During the 5 years from 2013 to 2017, the overall tidal flat area (500 km2) of Tongzhou Bay on the Jiangsu coast had been in a state of deposition, with a total siltation thickness of 0.19 m. 2) The reclamation activities affected the topography of the tidal flats quickly, but the recovery was also rapid. During the implementation of the project (in 2015), the area of the tidal flats above the −2-m contour was rapidly reduced by 20 km2 but rapidly recovered to the pre-project level after the completion of the project (in 2017). 3) The reclamation project directly affected the distribution of erosion and siltation. Outside the seawall on the east side of the Yaosha sand ridge, the 0-m contour expanded rapidly to the outer sea, reaching more than 250 m/year. 4) The sandbars in Tongzhou Bay on the Jiangsu coast generally had a southward-moving trend. Over the past 40 years, the Yaosha sand ridge had shifted southward by 2,500 m and the Lengjiasha sand ridge by more than 5,000 m. This study provides a remote sensing solution for the topographic evolution of large tidal flats under the influence of human reclamation activities.
1 Introduction
Tidal flats are located between the high water and low water on springs and are inundated periodically during spring–neap tidal cycles. They play an important role in improving coastal protection, increasing potential land, and conserving biodiversity (Macreadie et al., 2019; Cao et al., 2020). However, in recent years, human intervention and modification of tidal flat areas have become more and more intense, especially in reclamation projects (Blum and Roberts, 2009; Ma et al., 2019; Zhao et al., 2020). The topographic evolution of tidal flats under the pressure of reclamation activities has become an important research area (Wang et al., 2012; Murray et al., 2019). In the case of Tongzhou Bay on the Jiangsu coast, for example, reclamation has continued in recent years for the purpose of seaport construction (Li et al., 2021). Extremely rapid changes have been occurring in the mudflat topography. Monitoring the evolution of tidal flats, especially before and after reclamation activities, is of great significance for scientific management and ecological restoration of the coastal zone (Kim et al., 2021).
Repeated cross-sectional measurements currently comprise the most common and direct method to study changes in the topography (Gong et al., 2017). However, tidal flats are recognized as “difficult areas” for field measurements, attributed to the harsh natural environment and the large human and material costs (Tseng et al., 2017). Remote sensing technology has gradually become an important tool for tidal flat monitoring due to its outstanding advantages, including wide coverage, fast acquisition, and multi-frequency observation. Among such methods, the waterline method is currently recognized as the most operable (Mason et al., 2010; Wang et al., 2019; Tong et al., 2020). The waterline method uses image processing techniques to detect the geo-registered location of the waterline (the boundary between land and ocean) from remotely sensed images. It then superimposes the height of the waterline relative to the mean sea level at the corresponding location. These heights are given using a hydraulic tidal model, or the nearest tidal observatory. Based on multiple images obtained over a range of tidal and surge heights, it is possible to create a set of waterlines of heights within the intertidal zone from which a gridded digital elevation model (DEM) can be interpolated. The waterline method was first proposed by Mason et al. (1995) and applied to the Humber/Wash area on the UK east coast. The waterline method has the advantage of being able to extend the spatial and temporal scales and support the construction of historical topography. It is widely used around the world, such as on the Wadden coast in Northern Europe (Heygster et al., 2010; Li et al., 2014), the Holderness coast in England (Mason et al., 2010; Yang et al., 2022), Arcachon and Veys Bays in France (Anthony et al., 2008; Salameh et al., 2020; Derion et al., 2022), Gomso Bay in the Republic of Korea (Ryu et al., 2008; Lee et al., 2011; Xu et al., 2016), the Hsiang-Shan wetland in Taiwan (Tseng et al., 2017), and the Jiangsu coast in China (Liu et al., 2012; Liu et al., 2013; Kang et al., 2017; Kang et al., 2020; Wang et al., 2019). However, previous studies have mostly focused on the construction of high-precision DEMs of the tidal flats (Kang et al., 2017), while the analysis of the evolution of tidal flat topography was insufficient. In particular, how does the topography of tidal flats evolve under the influence of sudden external factors (e.g., reclamation activities)? Quantitative analysis of the duration and extent of the impact of reclamation activities needs to be further carried out.
The purpose of this study was to analyze the topographic evolution of tidal flats under the pressure of reclamation activities based on remote sensing. Tongzhou Bay on the Jiangsu coast is the ideal study area because of its large-scale tidal flats and ongoing reclamation activities. Based on multi-source and multi-temporal remote sensing images, DEMs of the tidal flats in Tongzhou Bay, Jiangsu coast, were constructed at different times using the waterline method. Based on these sequential DEMs, the contour changes, area changes, erosion and deposition distribution, and typical section changes were analyzed using geographic information system (GIS) spatial analysis tools. The timing and extent of the impact of the reclamation activities on the tidal flats were elaborated on in more detail. Compared with a previous assessment using a small number of sporadic sections, this study shows the changes in the topography of the large tidal flats before and after the reclamation project, which is important for a macroscopic grasp of the changes in tidal flat topography and the sustainable use of the port.
2 Study area and datasets
2.1 Study area
Tongzhou Bay is located on the southern flank of the radial sand ridges (RSRs) in the Southern Yellow Sea. The water depth of Tongzhou Bay is between 0 and 30 m and the surrounding area includes two sand ridges and three tidal channels: the Yaosha and Lengjiasha sand ridges and the Sanshahong, Wangcanghong, and Xiaomiaohong tidal channels (Figure 1). Of these, Yaosha is the largest sandbar exposed on the southern flank of the RSRs, with an exposed area of 280 km2 at low tide. Lengjiasha extends out to the sea, providing good water depth conditions for building a port. The Yaosha sand ridge isolates Xiaomiaohong from the deep channels of Wangcanghong and Sanshahong in the north, making Xiaomiaohong a relatively independent tidal channel system.
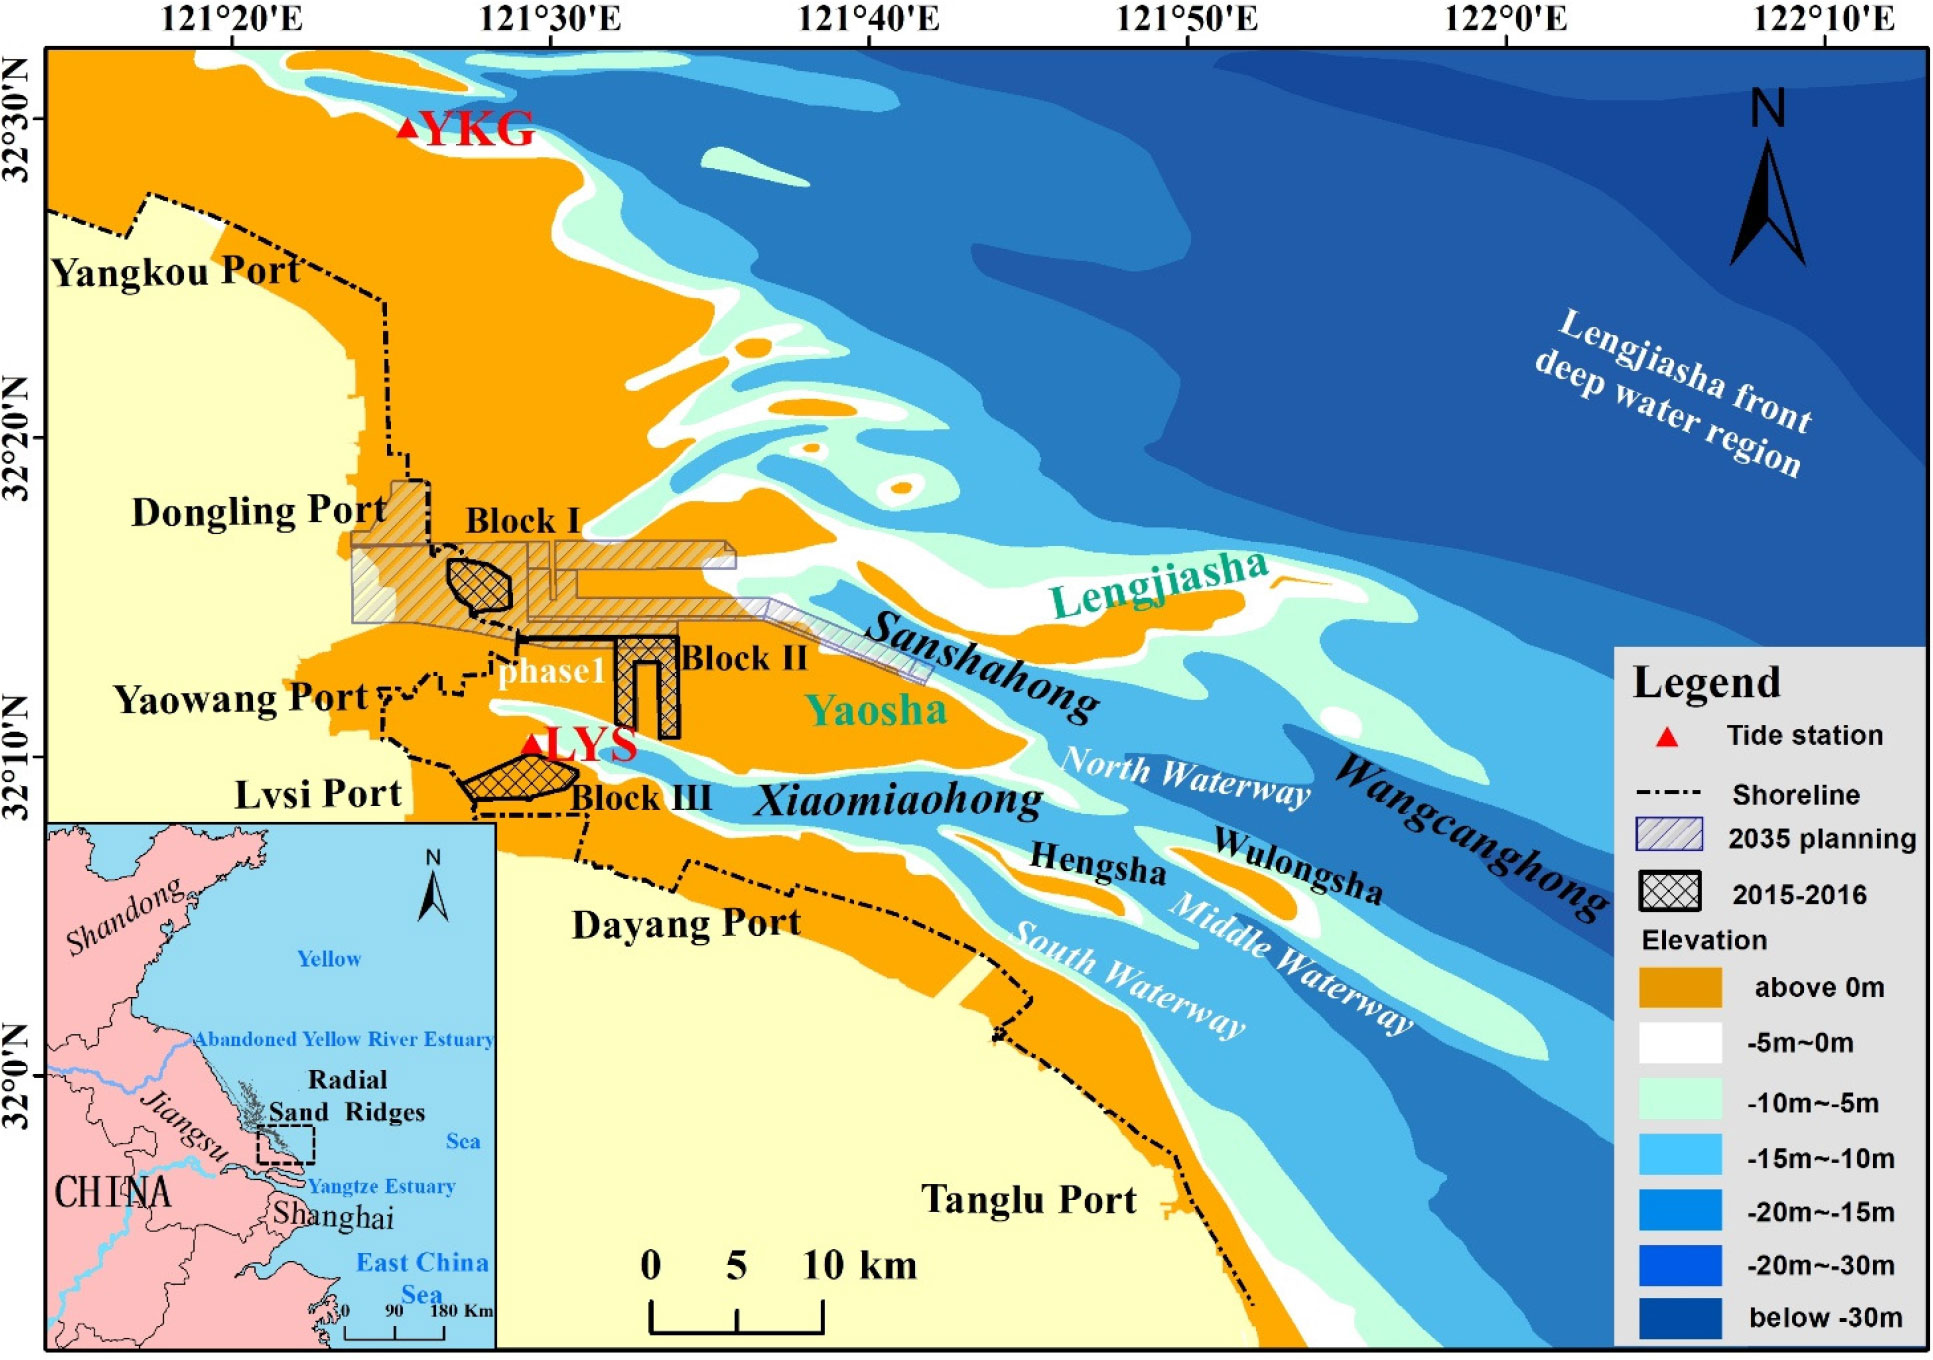
Figure 1 Location and topographic map of Tongzhou Bay.
The tidal nature of the sea area is a regular half-day tide, with a maximum tidal range of 7.31 m. The flow velocity is large in the deep channels and small in the shallows. The average flow velocity at high and low tides in the 10-m-deep trough area is 0.6–0.8 m/s, locally up to 1.0–1.2 m/s, while the average flow velocity in the shallow beach area above 0 m is only 0.2–0.4 m/s. The flow direction of Sanshahong and Xiaomiaohong is mainly WNW (up) and ESE (down), both of which have obvious reciprocal flow characteristics. The open waters to the north of Lengjiasha and the relatively open floodway of Wangcanghong show certain rotational flow characteristics. The wave direction is SE, with a frequency of 11.42%, the average effective wave height is 0.68 m, and the corresponding wave period is 3.7 s. Wind and waves have a greater influence on the sand content of the sea, and the average suspended sand concentration of the vertical line in winter is 0.2–0.4 kg/m3, which is higher than that in the summer. The grain size of the sandbar and the submerged sand ridge is coarse, with a median grain size of more than 0.1 mm. Deep troughs and open deep-water areas are finer grained, which are dominated by clayey chalk with a grain size of less than 0.03 mm.
According to the “Tongzhou Bay Port Area Planning Scheme (2017–2030),” a total of approximately 37.3 km of port shoreline with a port area of approximately 48.8 km2 will be constructed in Tongzhou Bay. The first phase of the port pond (relying on the Xiaomiaohong channel) is mainly for the construction of berths of less than 50,000 tons in the south. The northern port area (relying on the tidal channel at the front edge of Lengjiasha) is mainly used for the construction of berths of more than 100,000 tons. Port construction has an irreversible impact on tidal flats. This study has taken the first phase of the Tongzhou Bay project as an example to study the changing characteristics of the surrounding tidal flats before and after the project. The first phase of the reclamation included three blocks, as shown in Figure 1. Block I is located near Dongling Port, north of Yaosha, and was completed in 2016. Block II is located on the ridge of Yaosha sand ridge, completed in 2016, and has a long guide dike constructed from west to east. This is a harbor pond dependent on Xiaomiaohong. Block III is located near Lvsi Port, also a near-shore ponding, and was completed in 2015.
2.2 Datasets
The waterline method was used for the construction of the DEMs of the tidal flats in Tongzhou Bay. Two different types of data were used in this study: remote sensing images and measured tide level data. The remote sensing images were used to extract these waterlines, while the tide level data were used to assign elevations to the waterlines.
2.2.1 Remote sensing images
In order to construct the tidal flat topography of the study area, factors such as the coverage area, temporal resolution, and spatial resolution were taken into account when selecting remote sensing images. The HJ-1 charge-coupled device (CCD) and Landsat operational land imager (OLI) series images with a spatial resolution of 30 m were selected as the data source for the monitoring of tidal flat topography over a large area (Figure 2). “HJ-1” is a Chinese Earth observation system specifically used for environmental and disaster monitoring, with two optical satellites (HJ-1A and HJ-1B) successfully launched on September 6, 2008. The two CCD cameras on both the A and B satellites are identical in design and jointly completed the ground mowing width of 700 km, with an image resolution of 30 m and four spectral bands of push and scan imaging. Landsat 8, the eighth satellite of the U.S. Landsat program, was successfully launched on February 11, 2013, carrying the OLI, which consists of nine bands with a spatial resolution of 30 m and a panchromatic band with a spatial resolution of 15 m. In order to maintain the consistency of the spatial resolution of the remote sensing images from different sources, multispectral images with a 30-m spatial resolution were used here for the extraction of these waterlines. The images shown in Table 1 were strictly selected for their good quality, which can be easily used for geometric correction and waterline information extraction.
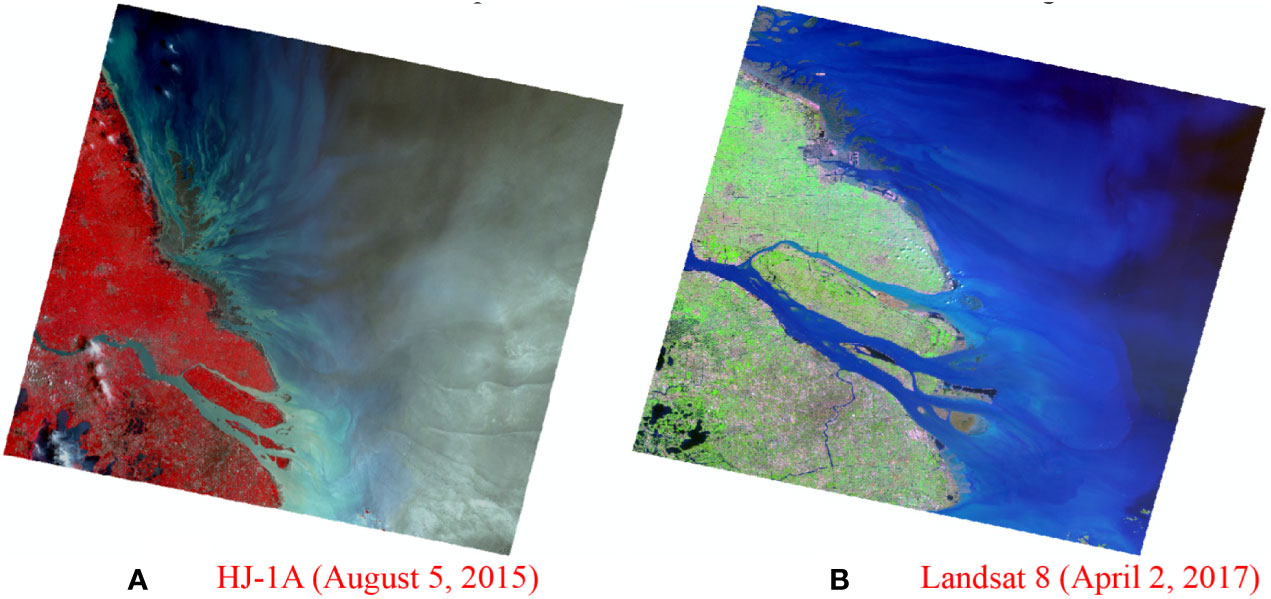
Figure 2 Remote sensing images from different sources. (A) HJ-1A (August 5, 2015). (B) Landsat 8 (April 2, 2017).
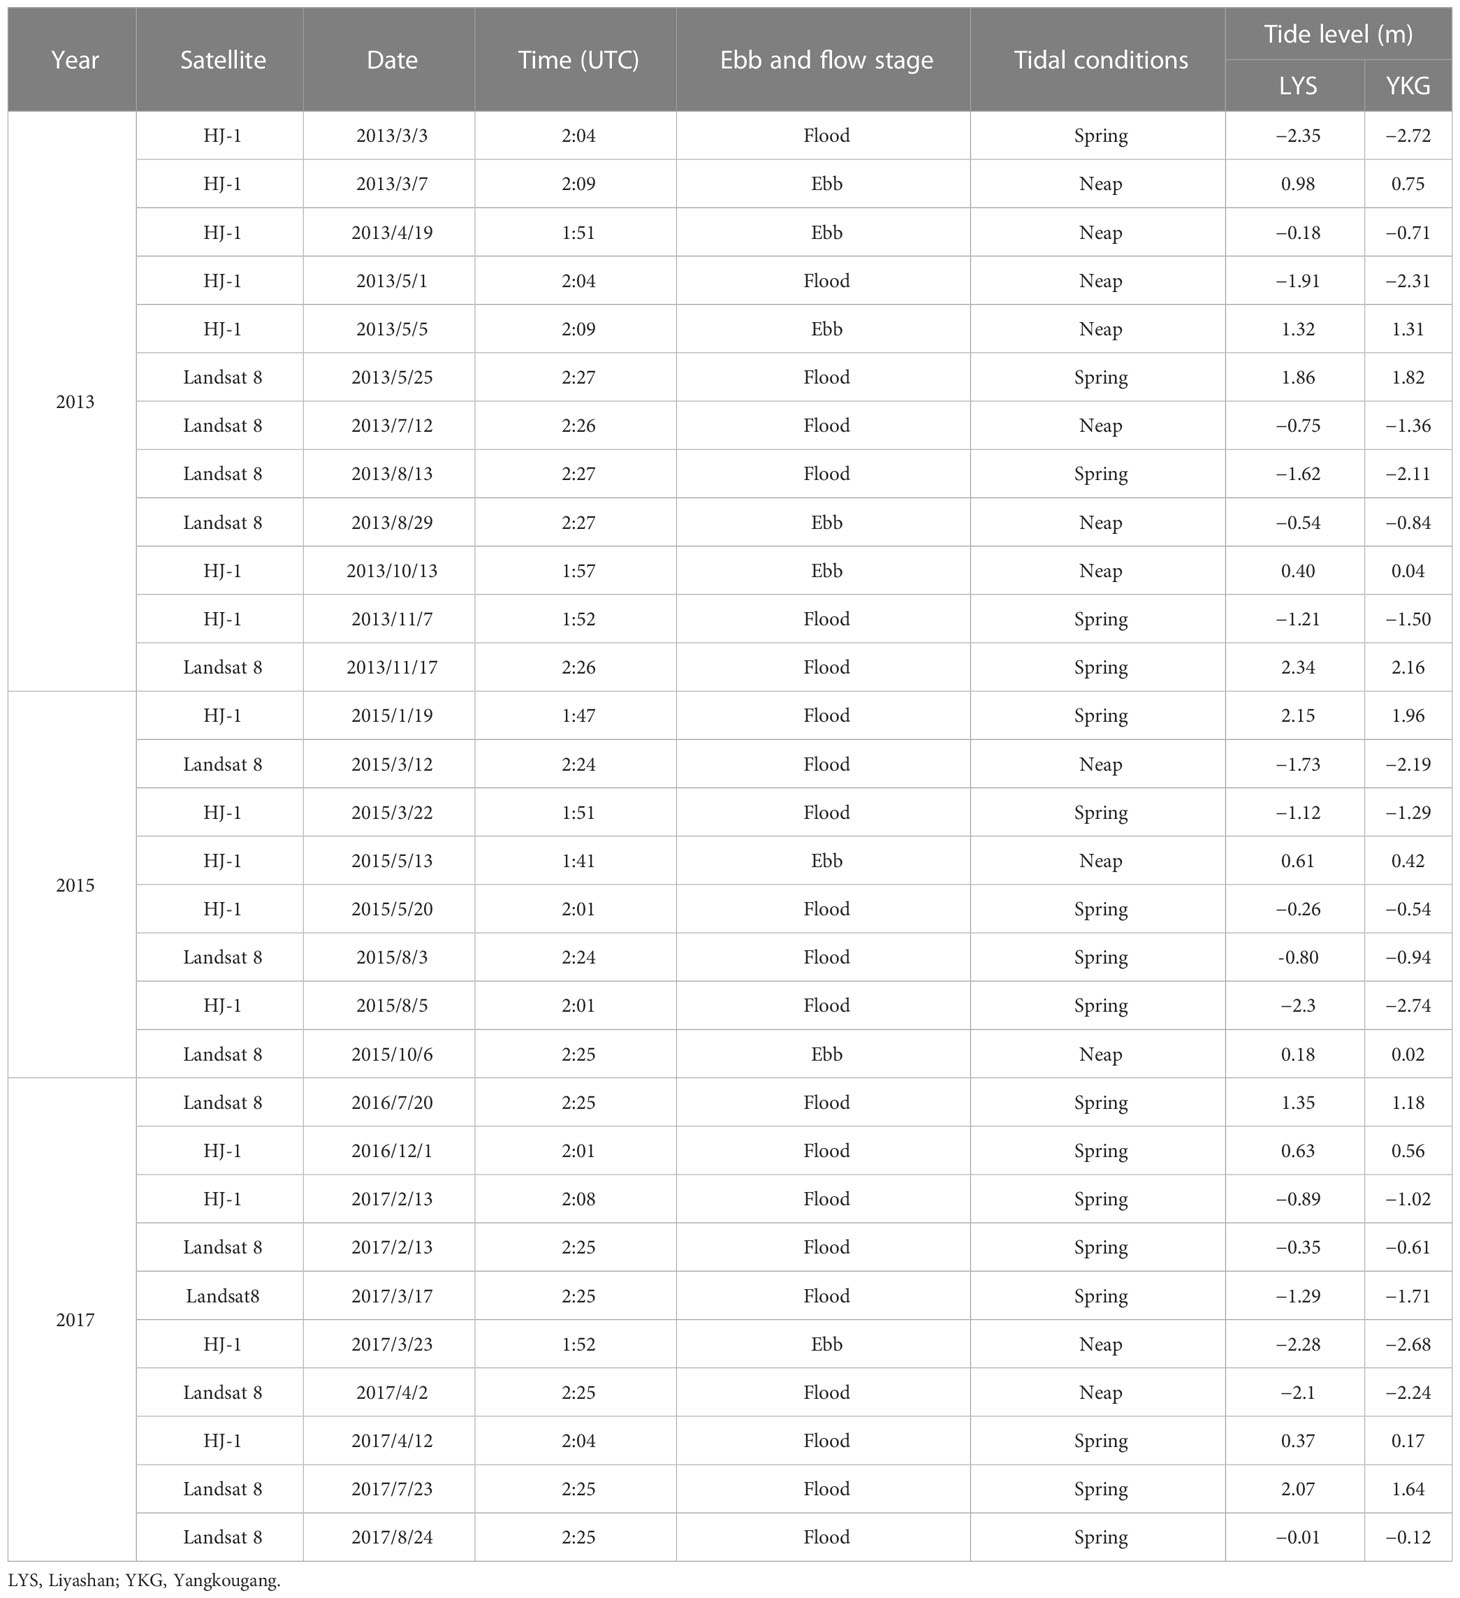
Table 1 Remote sensing images under different tidal conditions.
2.2.2 Tide level data
The measured tide level data provided the data basis for the elevation assignment of the waterlines. The tide level data were obtained from two actual tide level measurement stations in Tongzhou Bay: Yangkougang (YKG) and Liyashan (LYS). The tide level stations are characterized by a stable observation platform and reliable tide level records. Data were collected continuously every 5 min during a fixed period, each acquisition time was 3 s, with a data error of 1 mm. The measured tide level data provided the data basis for the elevation assignment of the waterlines.
3 Methodology
In this study, three DEMs of the tidal flats in Tongzhou Bay were constructed based on the waterline method using satellite images in different tide conditions. The trends of the topography before and after the reclamation project (phase I) were analyzed using these DEMs. The method can be divided into three steps: waterline extraction, tide level assignment and DEM construction, and topographic change analysis.
3.1 Waterline extraction from satellite images
Waterlines are usually extracted using human–computer interaction interpretation and object-oriented image classification. The former has the highest accuracy, but relies on operator experience; the latter is more automated but is more complicated and less generalized to develop rules. In this study, the two were combined to extract waterlines from remote sensing images. Firstly, the object-oriented image segmentation method was used to segment the image and output the vector data, which selected a feature band of an image to analyze the change in the spectral digital number (DN) value from land to sea and then extracted the water’s edge based on the changing curve of the DN value. The object-oriented spatial feature extraction module—Feature Extraction (ENVI FX)—of ENVI software (ITT, 2009) was used in this step. First, the image was divided into segments. The real-time preview window was used to assign an appropriate scale level according to different areas (35–45 in this study). Second, a merge step was utilized to combine small segments into groups. A merge level of 85–97 was used in this step (Kang et al., 2017). Finally, by adjusting the image synthesis band, the vector boundary display color, and other parameters, the vector editing tool based on visual interpretation was used for waterline extraction. After testing, this method can reduce the workload of manual outlining; moreover, it can reduce the error arising from classification rules. The “remotely sensed waterline” combinations for 2017 are shown in Figure 3.
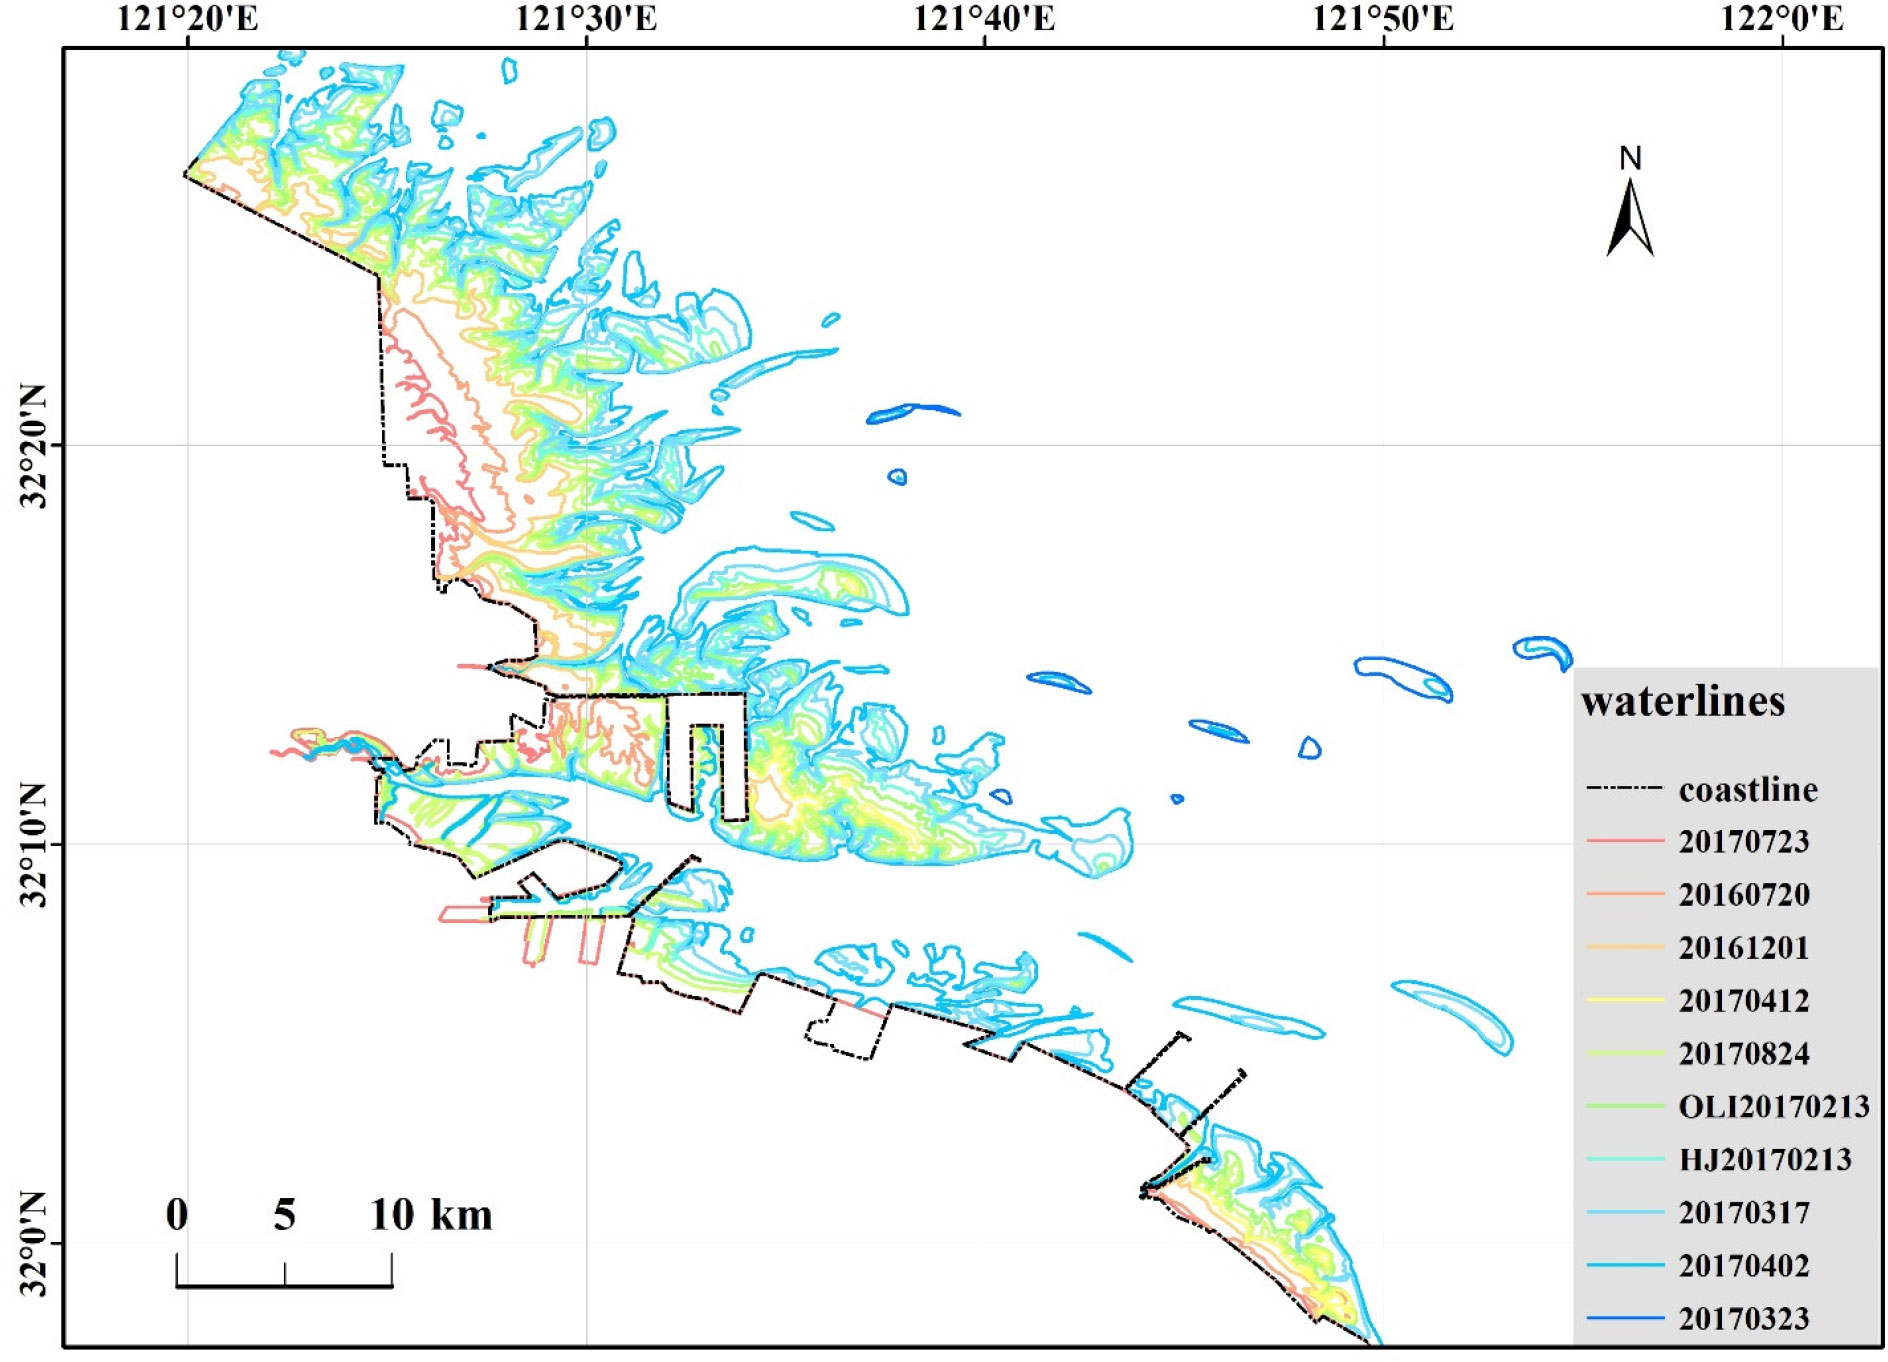
Figure 3 Waterline combinations of the tidal flats in Tongzhou Bay under different tidal conditions (2017 as an example).
3.2 Tide level assignment and DEM construction
For each point of a “remotely sensed waterline,” the elevation should be the tide level value at that time. At the moment of remote sensing image acquisition, the elevation was assigned to each point on the waterline using the inverse distance weight (IDW) interpolation method based on the tide levels of the two stations (YKG and LYS in Figure 1). All the waterlines at different tide levels were assigned using this method.
Based on these assigned waterlines, a DEM was constructed using spatial interpolation. In this study, the ANUDEM (Australian National University digital elevation model) method was used for DEM construction. Water is the main erosion factor in geomorphic formation; therefore, high land (local maxima) coexists with tidal creeks (local minima), resulting in a connected tidal creek pattern. ANUDEM uses this knowledge of surfaces and imposes constraints on the interpolation process, which greatly reduces the depression data errors in the DEM and significantly improves the quality of the DEM in terms of hydrological features. The interpolation method is a recursive finite element difference interpolation technique to fit a spline surface. This method was embedded in the “Topo to Raster” tool in ArcGIS software (ESRI, 2014). The parameter settings were as follows: maximum iterative time, 45; roughness coefficient, 0.5; and grid size, 30 m.
The index comparison parameters of the mean absolute error (MAE) and the root mean square error (RMSE) of elevation were used to evaluate the accuracy of the DEM results obtained by the waterline method, which were calculated based on the following formulas:
where MAE and RMSE are the error evaluation parameters of the DEMs and and are the simulated and measured elevation values, respectively.
3.3 Topographic change analysis based on DEMs
Influenced by the reclamation project (phase I) and tidal dynamics, the morphology of the tidal flats in Tongzhou Bay changed significantly between 2013 and 2017. A simple superimposed comparative analysis based on remote sensing images was not sufficient; therefore, we used four different indicators to monitor the evolution of the tidal flats. Based on sequential DEMs, the “contour change,” “area change,” “erosion and deposition distribution,” and “typical section change” were described using GIS spatial analysis tools.
3.3.1 Contour change
The evolution trends of coastal mudflats can be judged by comparing multiple contour lines of different heights. The superposition of different contours can visualize the erosion and siltation status at the overall level to a certain extent. In this study, contours of −2, −1, 0, and 1 m were extracted based on the DEMs, and the planar change characteristics of the topography were analyzed by superimposing different contours.
3.3.2 Area change
Erosion and deposition at different elevations can be quantified based on the variation of the area enclosed by different contours. Based on the constructed DEMs of the tidal flats, the areas above the different contours were calculated using GIS spatial analysis tools, and the characteristics of erosion and deposition were analyzed by comparison. In addition, considering the spatial distribution of Tongzhou Bay, the study area was divided into four parts, and the statistics and variation of the tidal flat area were analyzed separately.
3.3.3 Erosion and deposition distribution
The spatial and temporal distributions of erosion and siltation are important indicators to elaborate the evolution of the tidal flats. Using GIS spatial analysis tools, the DEMs of different periods were phase subtracted to obtain specific locations and specific values of erosion and deposition. Furthermore, the change characteristics of the different areas were analyzed.
3.3.4 Typical section change
Setting typical sections to examine the specific elevation curve changes is an important indicator to study the evolution of the mudflats. In this study, 12 typical sections were set in the tidal flats of Tongzhou Bay. Based on the DEM, the elevation values of each point on the different sections were then extracted, and the elevation change curves of the sections were drawn. The elevation changes in the typical sections from 2013 to 2017 were compared and analyzed.
4 Results
4.1 Tidal flat DEMs
Based on the waterline method, three DEMs of the tidal flats in Tongzhou Bay from 2013 to 2017 were obtained. The results are shown in Figure 4 and rendered with the same color gradient. The spatial resolution of the DEM results was 50 m, while the elevation values ranged from −3 to 3 m. The accuracy of DEMs is crucial for subsequent analysis. In this study, four measured sections from 2013 and 2015 were used to evaluate the accuracy of the constructed DEMs. As shown in Figure 5, the MAE and RMSE were calculated, with the results shown in Table 2. The results for MAE and RMSE were 0.38 and 0.32 m, respectively. Considering the vast and complex topography of the tidal flat areas, although the accuracy of the DEMs constructed using the waterline method was lower than that of traditional field surveys, their large area synchronization and low cost make DEMs an important data source for studying topographic changes.
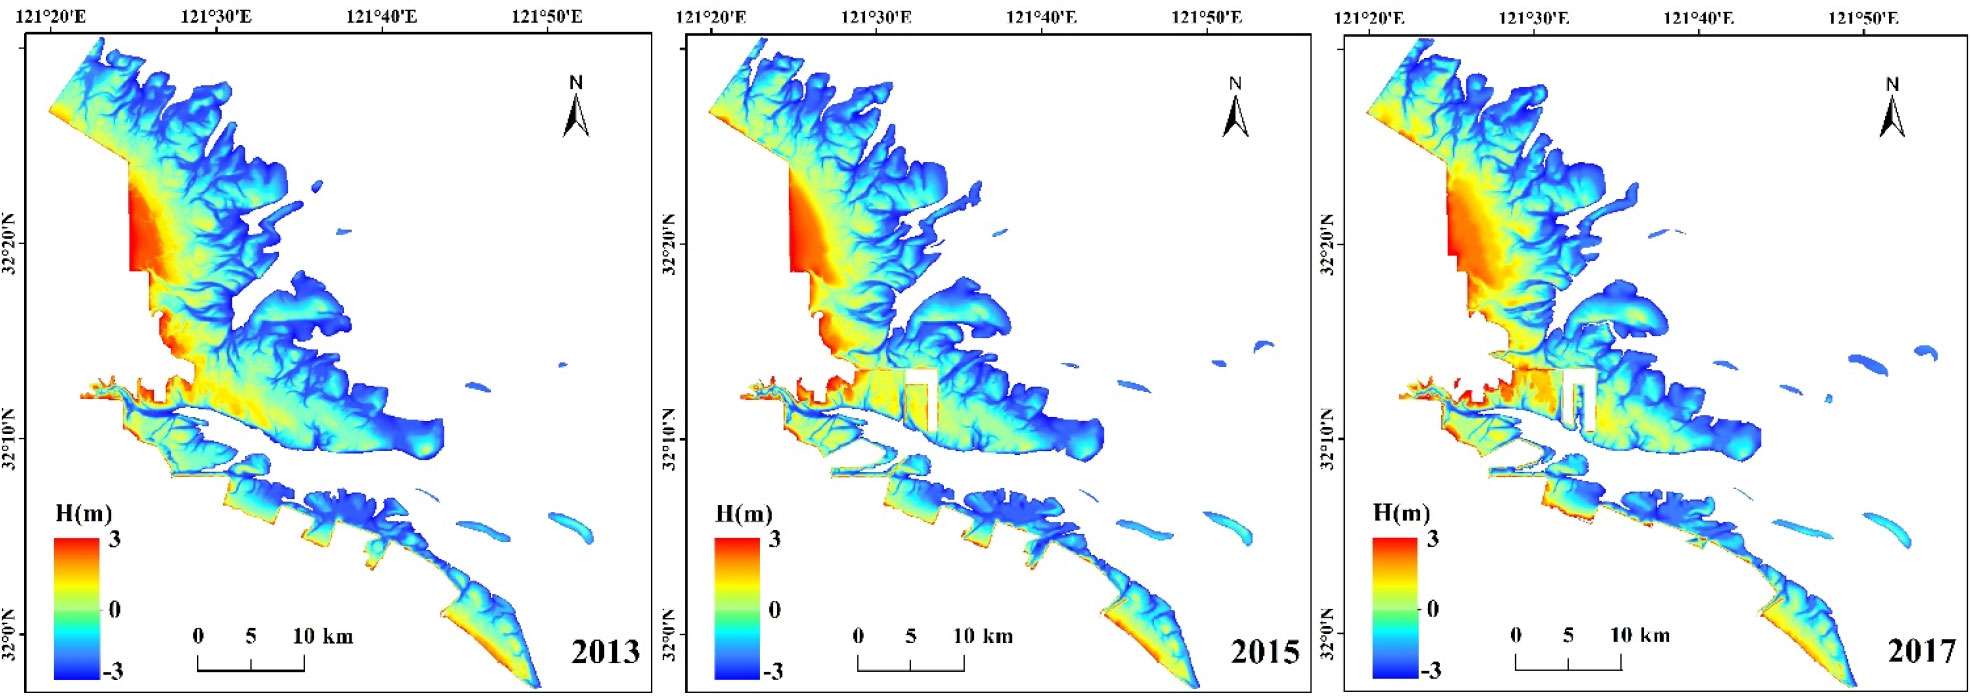
Figure 4 Results of the digital elevation models (DEMs) constructed for the Tongzhou Bay tidal flats.
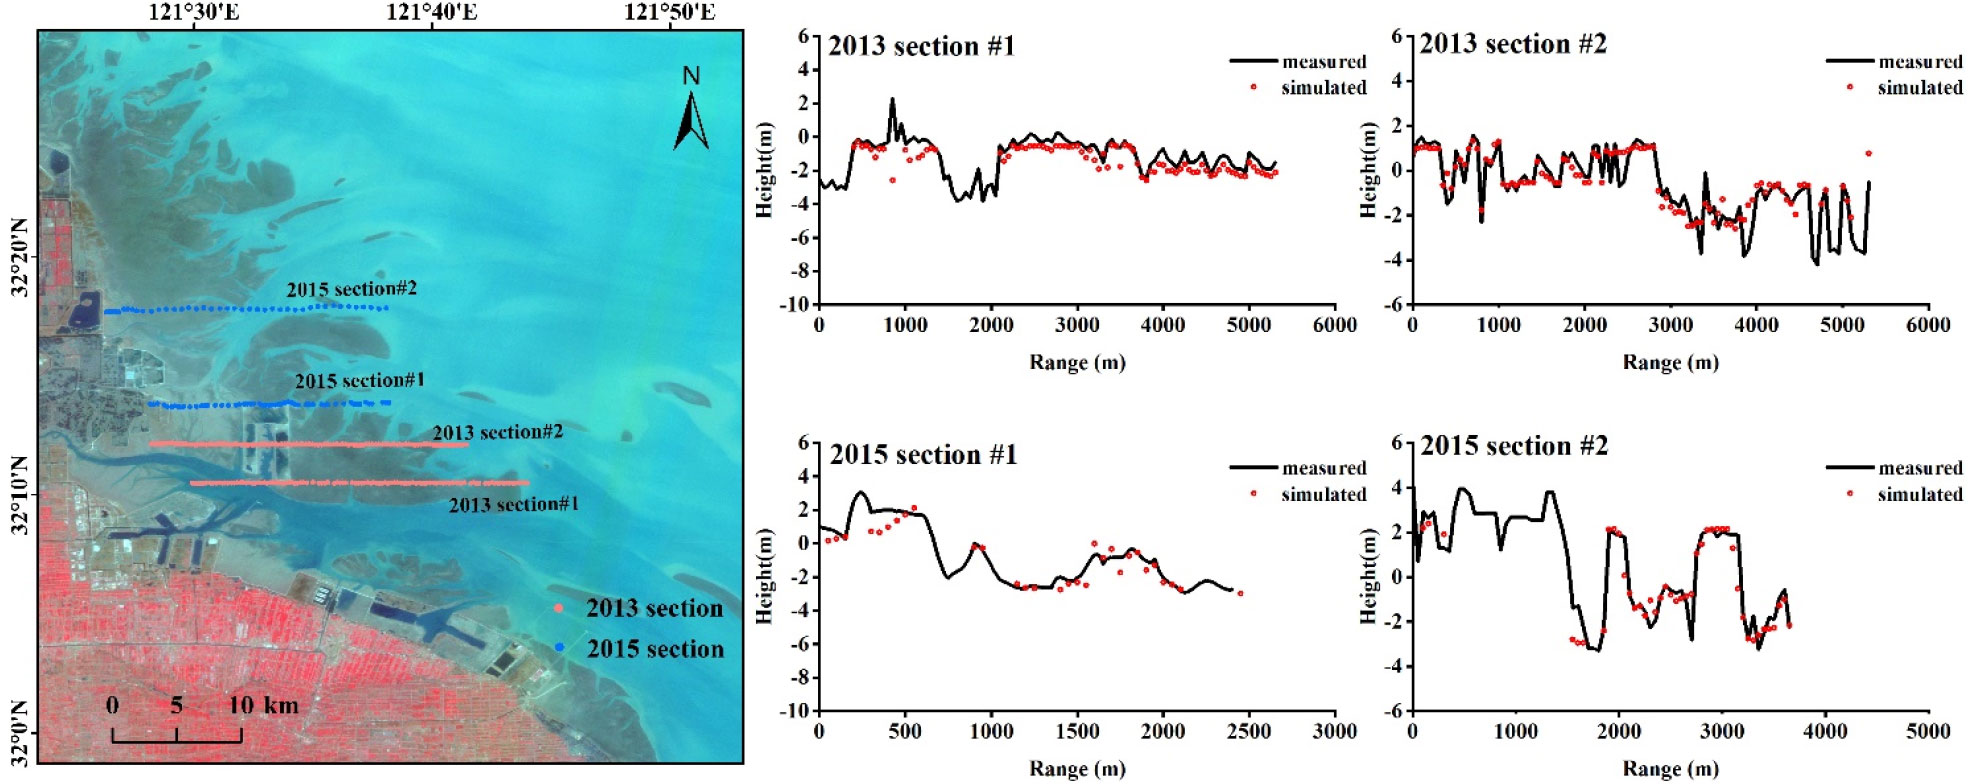
Figure 5 Comparison of four measured and simulated results based on the waterline method.
Table 2 Elevation error calculation table for the four sections (in meters).
4.2 Contour change analysis
The −2-, −1-, 0-, and 1-m contours were extracted based on the DEMs of the three phases of the mudflats. GIS spatial analysis tools were used to analyze the changes in the contours. The results were described separately as follows.
The situation of the −2-m contour is shown in Figure 6A. In Dongling Port–Dayang Port and the northern part of the Yaosha and Lengjiasha outcrop areas, the main change was displayed near the reclamation area, and the −2-m contour moved seaward with a movement rate of approximately 100 m/year. Outside the shore of Dayang Port, the −2-m contour expanded seaward, indicating sediment accumulation in this area. In addition, the −2-m lines were gradually exposed in 2015 and 2017 in the sandbar outside the shore, especially in the submerged sandbar part of Lengjiasha, indicating the deposition in this area.
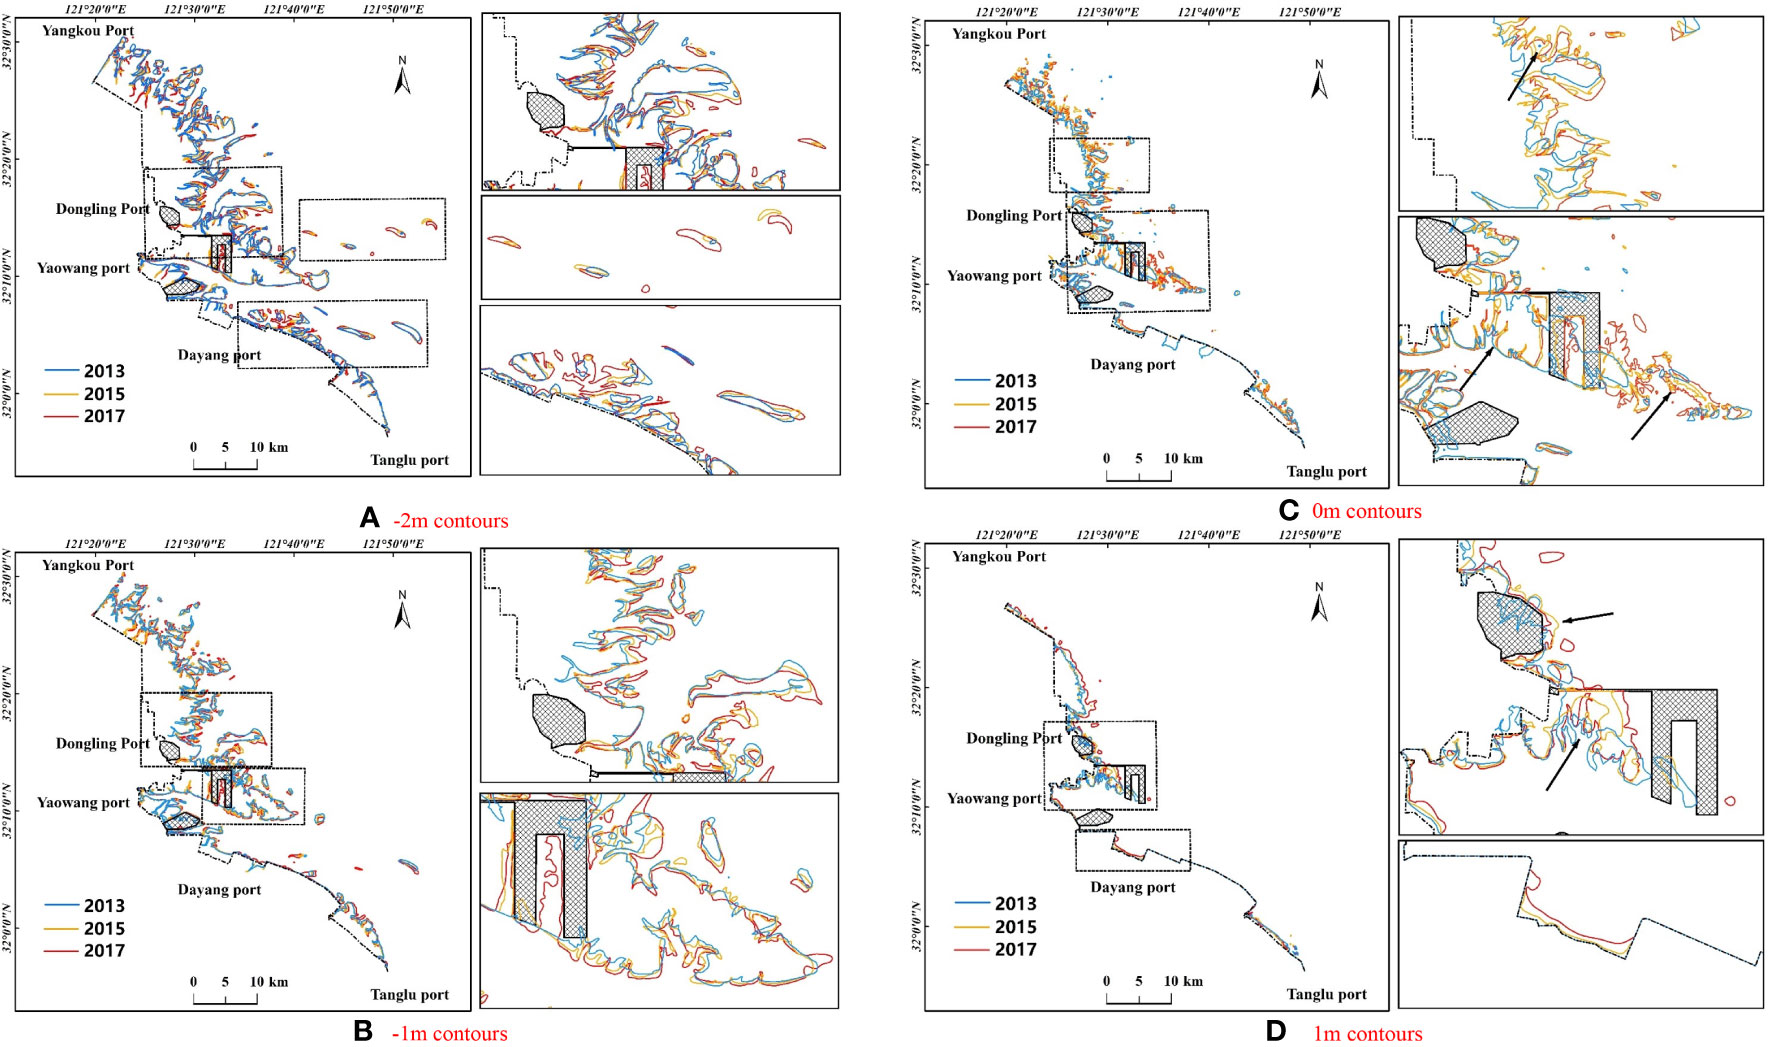
Figure 6 Contour overlay map of the tidal flats around Tongzhou Bay. (A) −2-m contours. (B) −1-m contours. (C) 0-m contours. (D) 1-m contours.
The change of the −1-m contour is shown in Figure 6B. In Yangkou Port–Dongling Port and the northern part of Yaosha, the −1-m contour moved seaward with a movement rate of approximately 150 m/year. The exposed tidal flats of Lengjiasha moved southward. Inside the phase I polder, a tidal trench was formed for scouring, and outside, particularly in the south of the Yansha, especially after the polder project, the −1-m line expanded seaward, moving at a rate of approximately 100 m/year. The other areas did not change much.
The situation of the 0-m contour is shown in Figure 6C. The 0-m lines all expanded seaward, and the whole area was in a sedimentary state. In Yangkou Port–Dongling Port and the northern part of Yaosha, the 0-m contour line moved seaward during the 2013–2015 period and tended to stabilize in 2015–2017. Sediment deposition occurred on the east side of the polder embankment, with the 0-m line expanding rapidly seaward at a rate of 250 m/year or more.
The 1-m contours are shown in Figure 6D. The 1-m lines showed an overall trend of seaward expansion. Between Yangkou Port and Dongling Port, there was little change from 2013 to 2015, but the 1-m line advanced seaward significantly from 2015 to 2017. The root of the perimeter dike in phase I tended to be deposited, and the distribution of the 1-m lines showed a trend of expansion. Between Yaowang Port and Dayang Port, the side near the shore showed a deposition trend, but the north side of Tanglu Port did not change much.
4.3 Area change statistics
The study area was divided into four parts according to the geographical location and the change of tidal flats: the northern, central, and southern parts (black dashed line, Figure 7) and the offshore sandbar (red dashed line, Figure 7). The change of the tidal flat area in each part was determined based on the contour data. The statistical results are shown in Table 3.
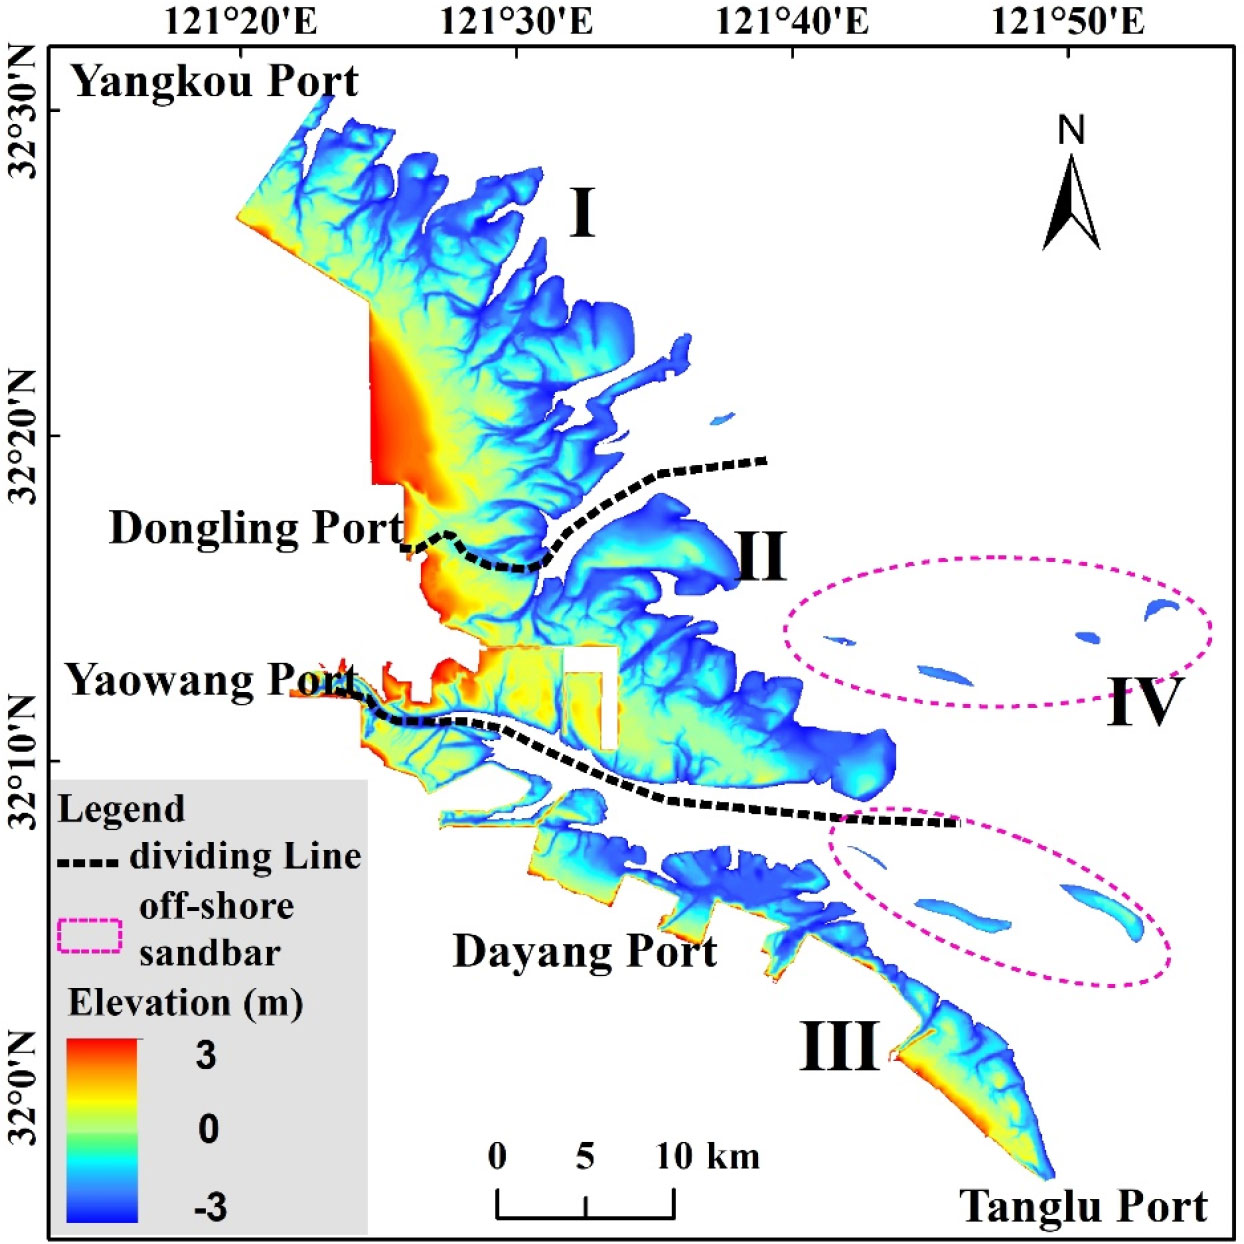
Figure 7 Area zoning map of the tidal flats in Tongzhou Bay.
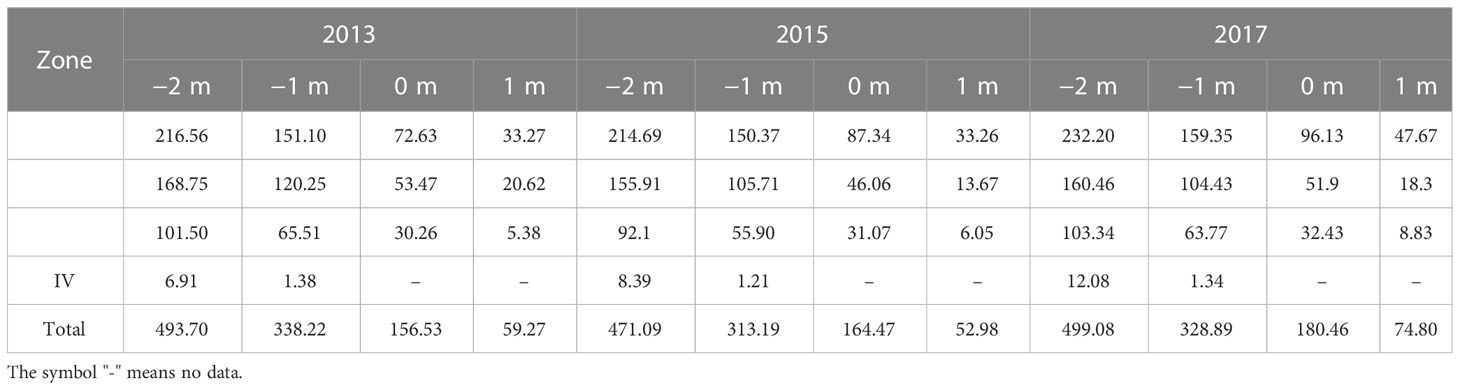
Table 3 Area zoning statistical results in Tongzhou Bay (in square kilometers).
As displayed in Table 3, the total area of the tidal flats above the −2-m contour first decreased and then increased, from 493.70 km2 in 2013 to 471.09 km2 in 2015, to 499.08 km2 in 2017. During the 5 years from 2013 to 2017, a total of three blocks were reclaimed in Tongzhou Bay (Figure 1). Specifically, the reclamation was completed in 2015–2016, and the three blocks occupied a total of approximately 30 km2. Therefore, the decrease in 2015 compared to that in 2013 was mainly due to the implementation of the reclamation project. After the construction, there was a significant increase in 2017 compared to 2015, indicating that the mudflats were more adaptable to the reclamation project, and the sea area as a whole still shows a deposition pattern.
From Yangkou Port to Dongling Port (Figure 8A), compared to that in 2013, the change in area above the −2-, −1-, and 1-m lines in 2015 was not significant, with an increase in area above the 0-m line. Compared to 2015 and 2013, the area increased in 2017, with a significant increase above 0 and 1 m.
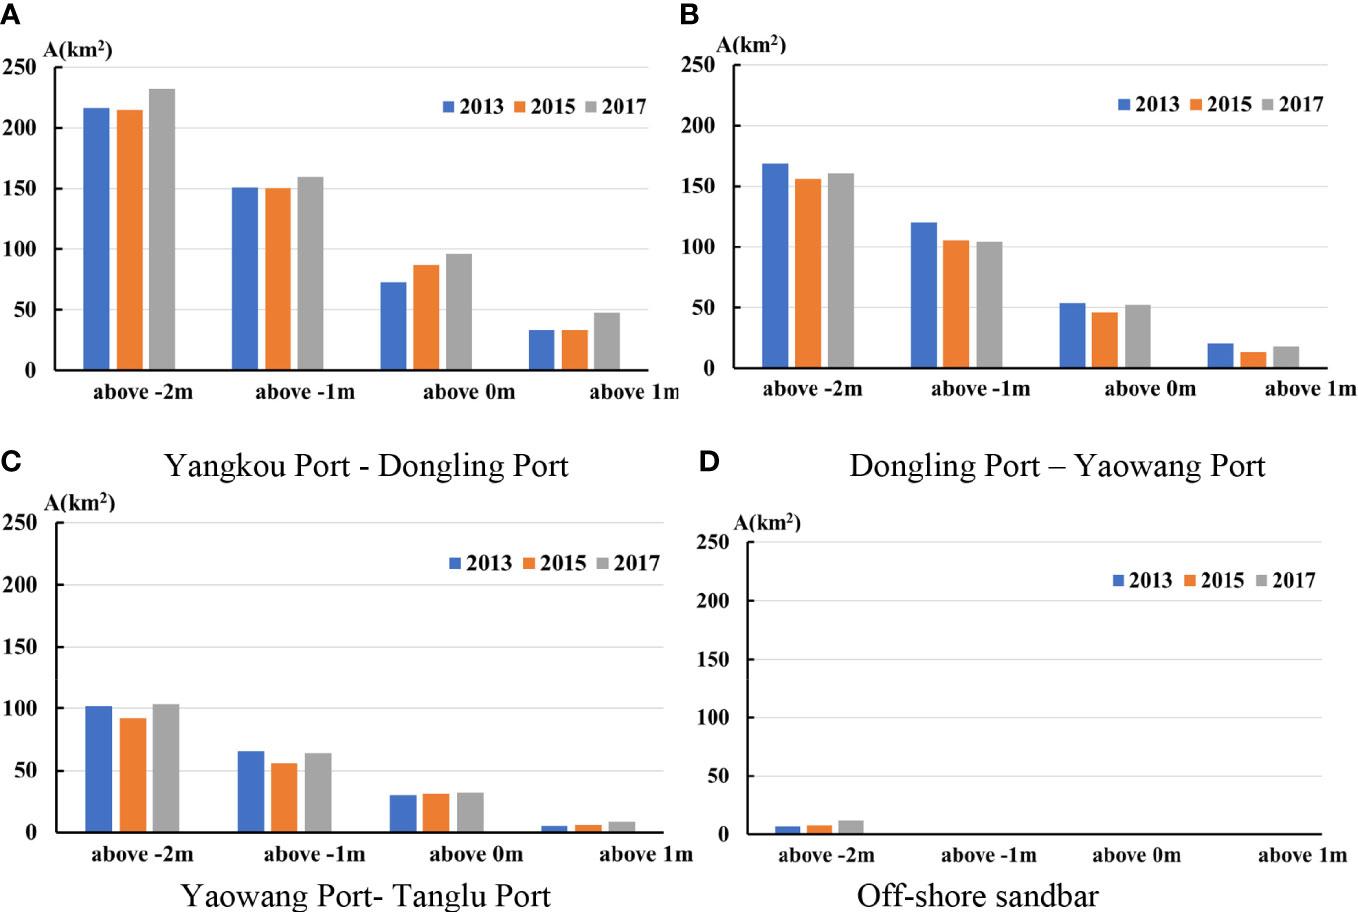
Figure 8 Statistical map of the area above the different contours of the tidal flats in Tongzhou Bay. (A) Yangkou Port–Dongling Port. (B) Dongling Port–Yaowang Port. (C) Yaowang Port–Tanglu Port. (D) Offshore sandbar.
From Dongling Port to Yaowang Port (Figure 8B), the core area of Tongzhou Bay Port, two blocks were reclaimed in the last 5 years, with a combined area of approximately 20 km2. Although the area decreased due to the impact of reclamation, the tidal flats were deposited and the area increased during 2015–2017.
From Yaowang Port to Tanglu Port (Figure 8C), the south side of the Xiaomiaohong tidal channel showed a deposition trend, and although it was affected by one polder, the area rebounded rapidly. The area above −2 and −1 m in 2017 had been the same as that in 2013, but the 0- and 1-m areas increased significantly.
The offshore sandbanks are mainly located off the two sand ridges of Lengjiasha and Yaosha (Figure 8D). From 2013 to 2017, the change in the three sandbars outside Yaosha was not obvious. However, the exposed part of the submerged sandbar in Lengjiasha gradually increased, and there was an obvious trend of a southward shift.
4.4 Distribution of erosion and deposition
The results obtained using DEM two-by-two subtraction are shown in Figure 9. The total area of the perennial exposed mudflat between Yangkou Port and Tonglu Port is approximately 600 km2, and it is in a constant state of deposition.
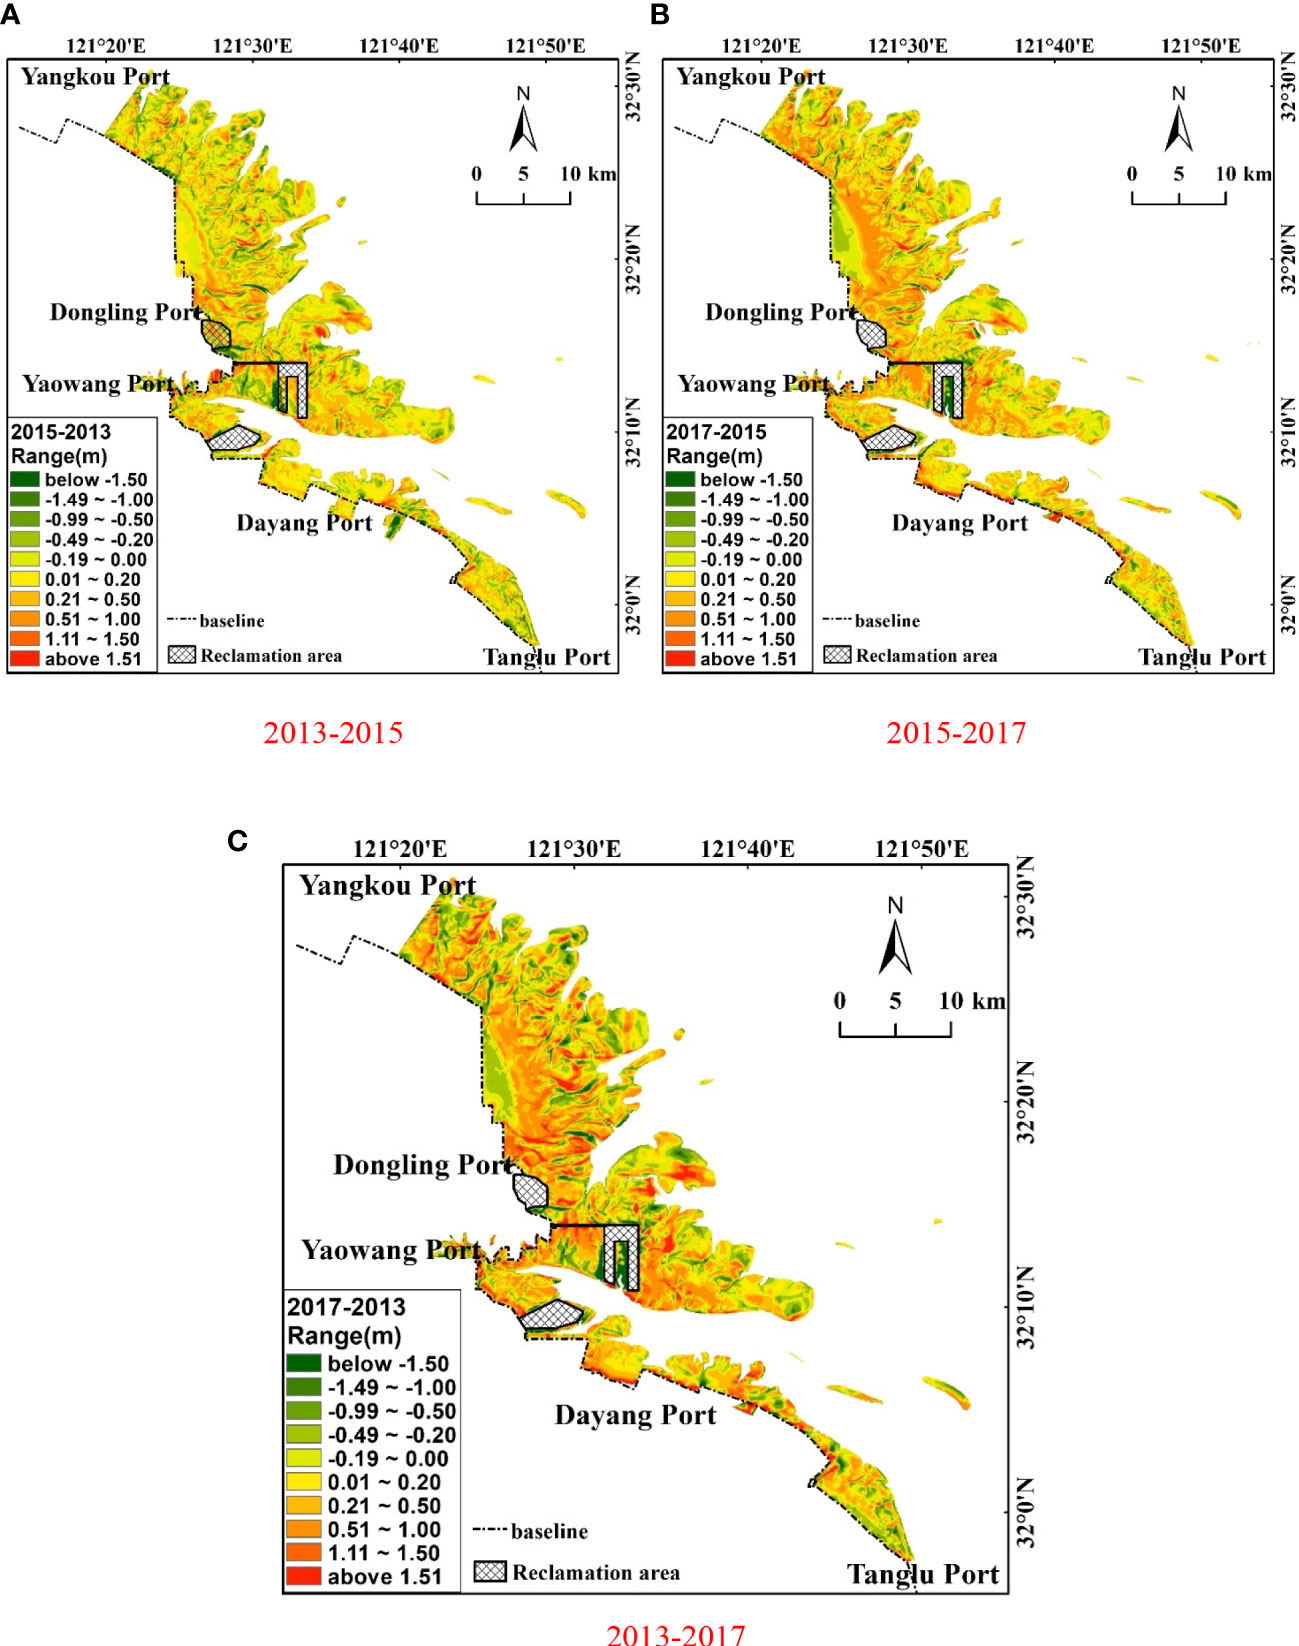
Figure 9 Spatial distribution of erosion and deposition in Tongzhou Bay. (A) 2013–2015. (B) 2015–2017. (C) 2013–2017.
As shown in Figure 9A, compared with 2013, the tidal flats were slightly deposited in 2015, and the average value of deposition was 0.015 m/year. Between Yangkou Port and Dongling Port, erosion and deposition were balanced, with slight erosion in the upper intertidal zone and deposition in the lower intertidal zone. Between Dongling Port and Yaowang Port, the topographic change was mainly influenced by the first phase of the Tongzhou Bay project. During this period under construction, deposition existed outside the polder dike, while erosion was obvious in the area under construction. Between Yaowang Port and Dayang Port, deposition was present in the northern part of the newly enclosed seawall (Figure 9). From Dayang Port to Tanglu Port, slight erosion was observed, especially near Tanglu Port. Overall, there was a trend of edge erosion and central deposition in the Yaosha–Lengjiasha sand ridge.
As shown in Figure 9B, compared with 2015, phase I of the Tongzhou Bay reclamation project was completed in 2017, and the overall tidal flats were deposited with a mean value of 0.08 m/year. Between Yangkou Port and Dongling Port, the upper part of the intertidal zone continued to erode and deposit in the lower part of the intertidal zone. Between Dongling Port and Yaowang Port, the main deposition area was located on the north side of the Xiaomiaohong tidal channel and on both sides of the seawall of the reclamation project. Between Yaowang Port and Dayang Port, the northern part of the newly enclosed seawall continued to be deposited under the influence of the reclamation project. From Dayang Port to Tanglu Port, siltation occurred in the upper part of the intertidal zone.
As shown in Figure 9C, the overall mudflat deposition averaged 0.19 m in 2013–2017. There are three polders in the area, with obvious deposition near Dongling Port, on both sides of the phase I polders, and on the south side of Xiaomiao Hong. In addition, near Dayang Port, the construction of the guide dike caused deposition, but the mudflats on the north side of Tanglu Port were less affected.
4.5 Elevation changes in typical sections
A total of 12 typical cross-sections were set up in the study area, as shown in Figure 10. Specifically, the elevation of section 1 increased by 0.28 m in 2013–2015 and by 0.22 m in 2015–2017. The elevation of section 2 was basically balanced, with a mean value of −0.03 m slightly scoured in 2013–2015 and deposited 0.1 m on average in 2015–2017. Section 3 deposited 0.17 m on average in 2013–2015 and 0.25 m in 2015–2017.
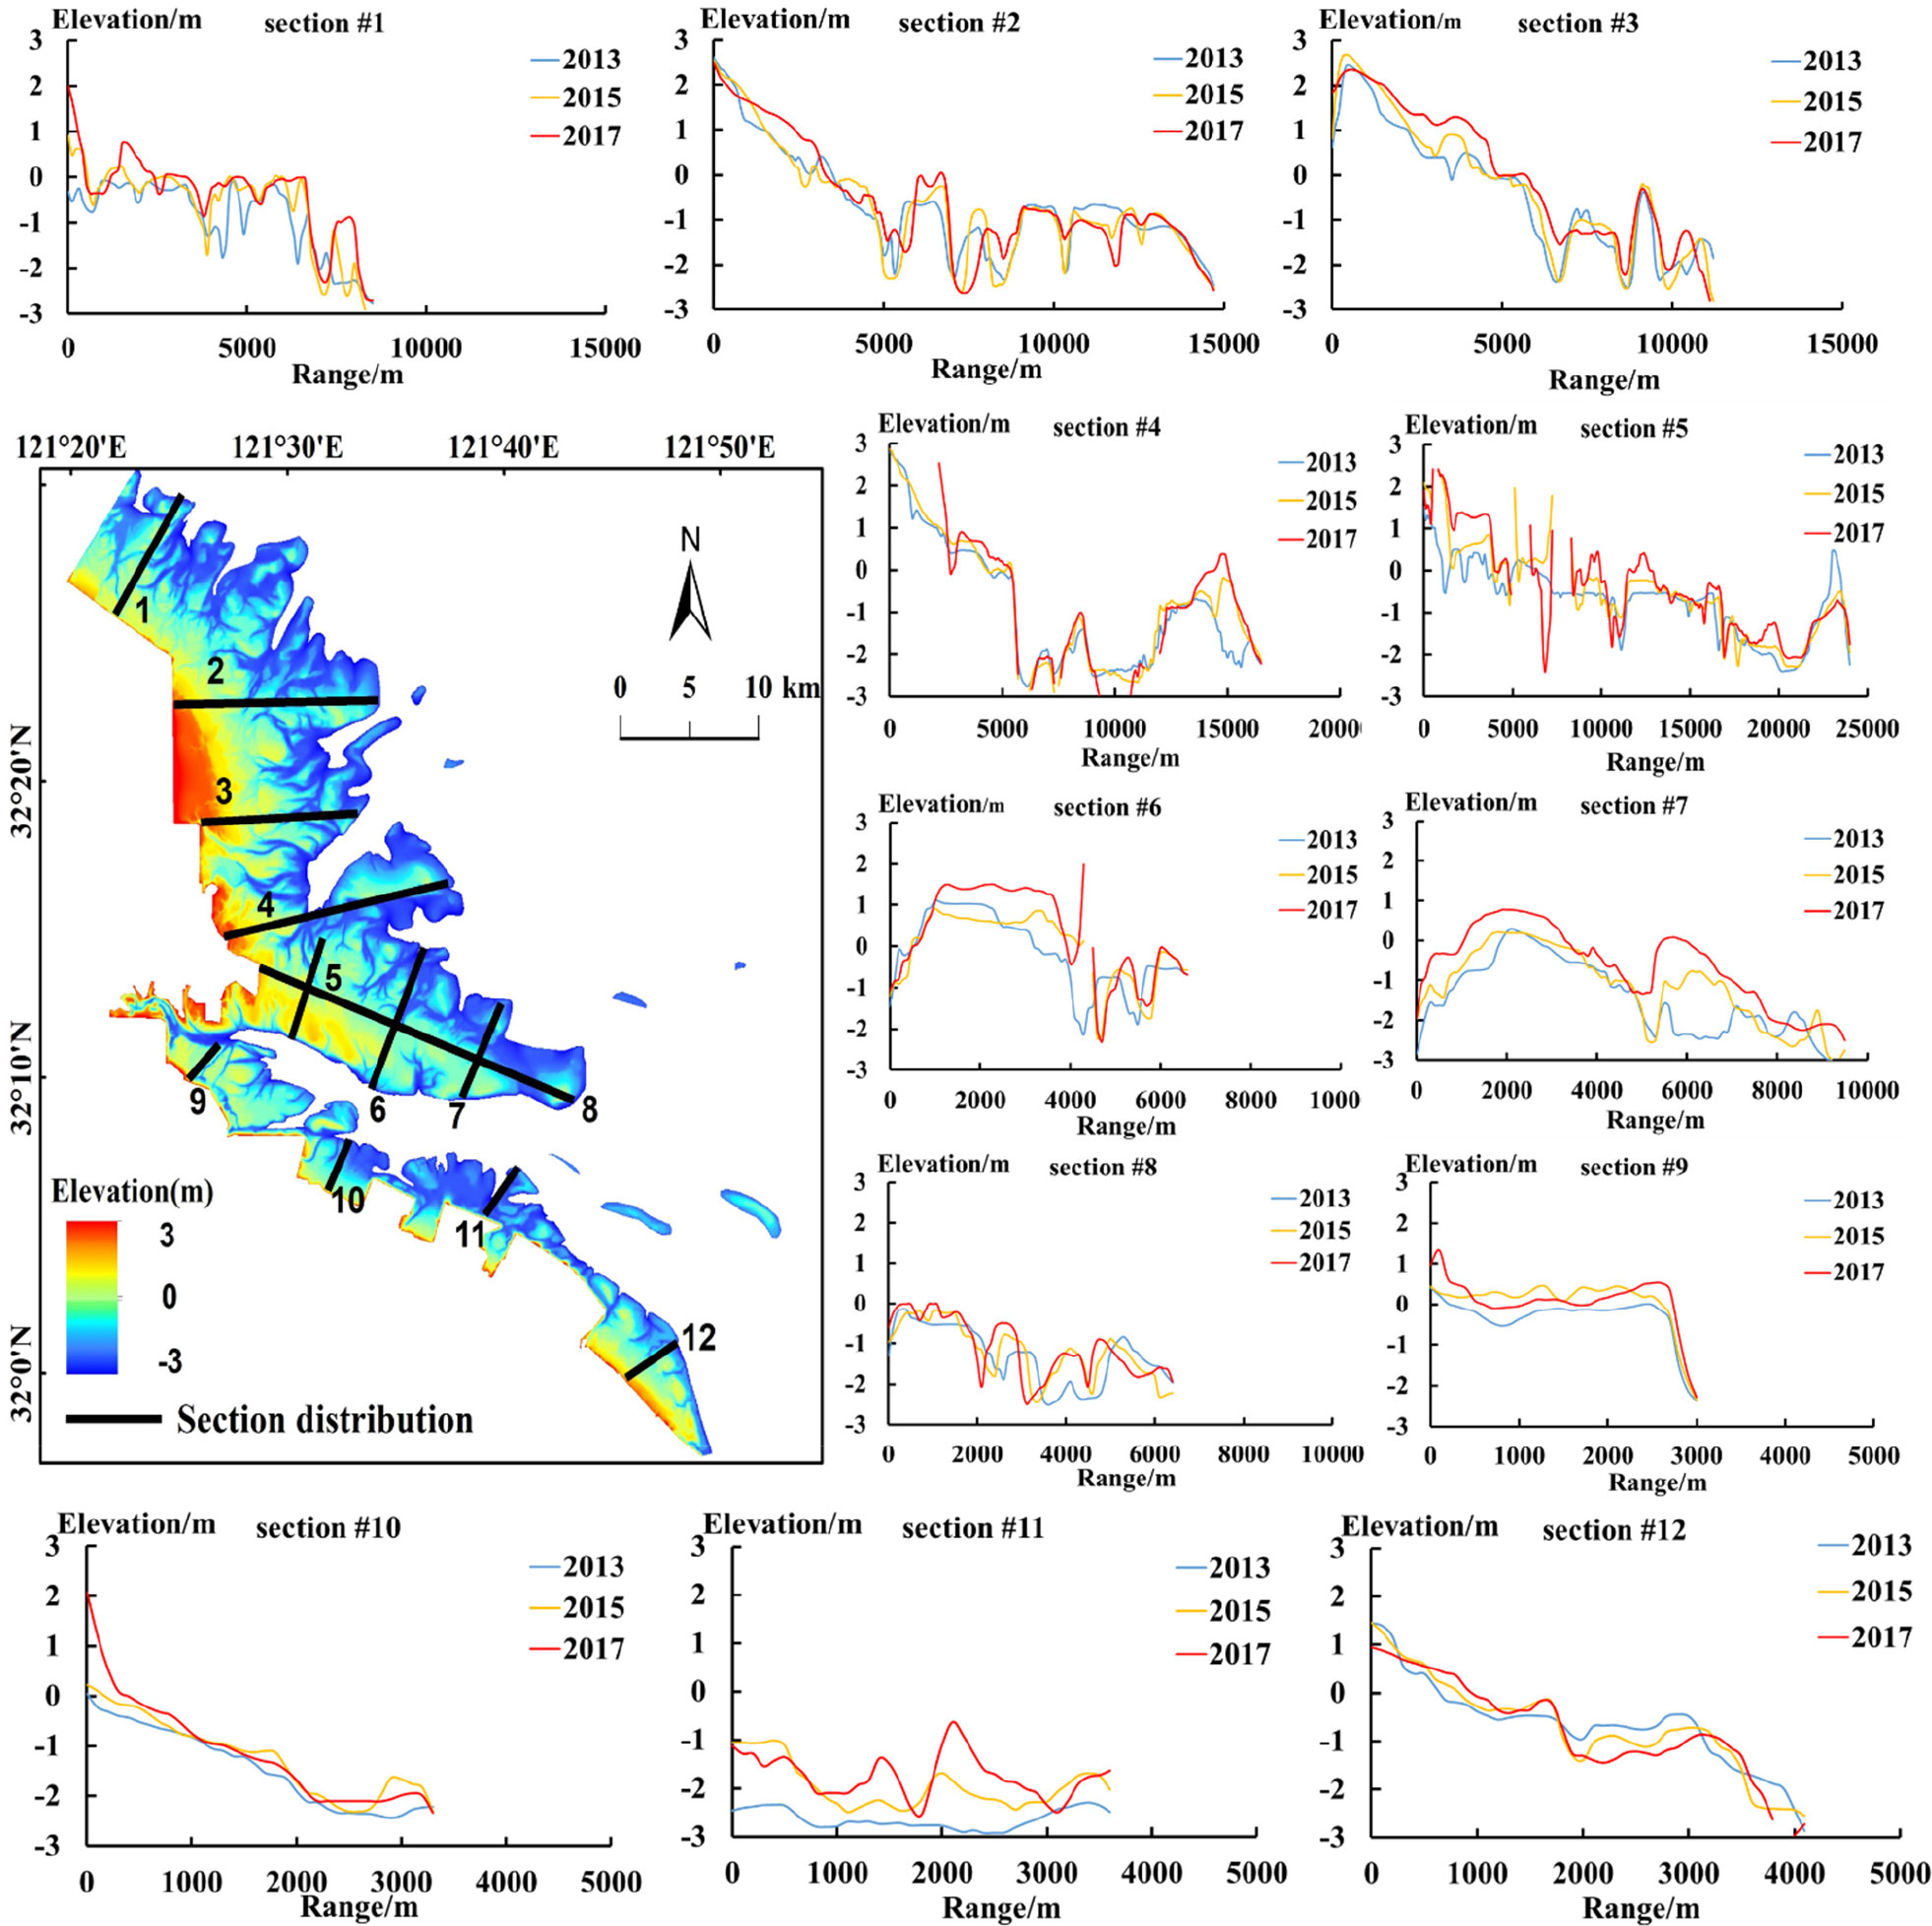
Figure 10 Distribution of the tidal shoal sections and elevation comparison curves in Tongzhou Bay.
A total of five cross-sections (nos. 4–8) were located in the core Yaosha–Lengjiasha area around Tongzhou Bay. Section 4 was located outside of Dongling Port, north of the Yaosha sand ridge, with significant sediment deposition. It had an average increase of 0.22 m in elevation from 2013 to 2015 and 0.18 m from 2015 to 2017. Section 5 crossed the whole Yaosha, and the sediment siltation was obvious at the root of the polder embankment, with a maximum rise of 1 m and an average value of 0.2 m. At the same time, tidal creeks were formed in the middle and west sides of Tongzhou Bay phase I, eroding the mudflats. Sections 6 and 7 were located on both sides of the polder project, and both had obvious siltation, with maximum siltation of 1 m on the west side and 0.8 m on the east side. Section 8 was far away from phase I of the project, and the change was not large, with only a slight siltation of 0.1 m.
Sections 9–12 were located on the south side of the Xiaomiao tidal channel in the Tongzhou Bay area, the line of Yaowang Port–Dayang Port–Tanglu Port. In the past 5 years, along section 9, the tidal flats showed deposition in 2015 and erosion in 2017. Sections 10 and 11, compared to those in 2013, had average siltation values of 0.21 and 0.65 m, respectively, in 2017. Section 12 was located on the north shore beach of Tanglu Port. This section was less affected by the Tongzhou Bay reclamation project in the past 5 years, and the topography was not significantly changed, with an average value of −0.022 m.
5 Discussion
5.1 The impact of reclamation projects on tidal flats
Reclamation projects have direct area encroachment and interfere with sediment transport in tidal flat environments. These impacts on mudflat wetlands are direct and irreversible. Taking the phase I project as an example, this study investigated the topographic changes of the tidal flats in a large area before and after the project, based on three DEMs constructed using the waterline method. In 2014–2016, a total of approximately 30 km2 of mudflats were enclosed in this project. Compared with the pre-project period in 2013, there was a certain reduction in area due to the intrusion of the mudflat topography and the unstable dynamic environment during the implementation of the project in 2015. However, after the completion of the project in 2017, the hydrodynamic environment gradually stabilized, sediment transport was redistributed, and sedimentation easily occurred on both sides of the enclosure, with the highest siltation exceeding 1 m, which was most obvious on the east side of the Yaosha polder. This phenomenon is related to the geographical location and the hydrodynamic conditions of the southern flank of the RSRs. Macroscopically, the sea area is still a siltation environment.
In fact, historical reclamation activities in Tongzhou Bay (from Yangkou Port to Tanglu Port) have been very active. In this study, the remote sensing images of the Landsat series from 1974 to 2018 were compiled, and the corresponding artificial shoreline data were extracted using a combination of visual interpretation and automatic computer interpretation. Figure 11 shows the distribution of the polder patches drawn based on 10-year intervals. Table 4 shows the area of the various stages of the polder. From 1974–2018, continuous reclamation of high beaches along the entire Tongzhou Bay coastline continued to advance more than 10 km seaward, with a total reclamation area of approximately 320 km2. The period from 2004 to 2014 was the fastest decade of coastal advancement. After 2014, except for major projects, the reclamation activities almost stopped. The protection of coastal mudflats has gained an unprecedented degree of attention. However, the tidal flat areas encroached by polder reclamation in the past decades are irreversible.

Table 4 Reclamation area for each period.
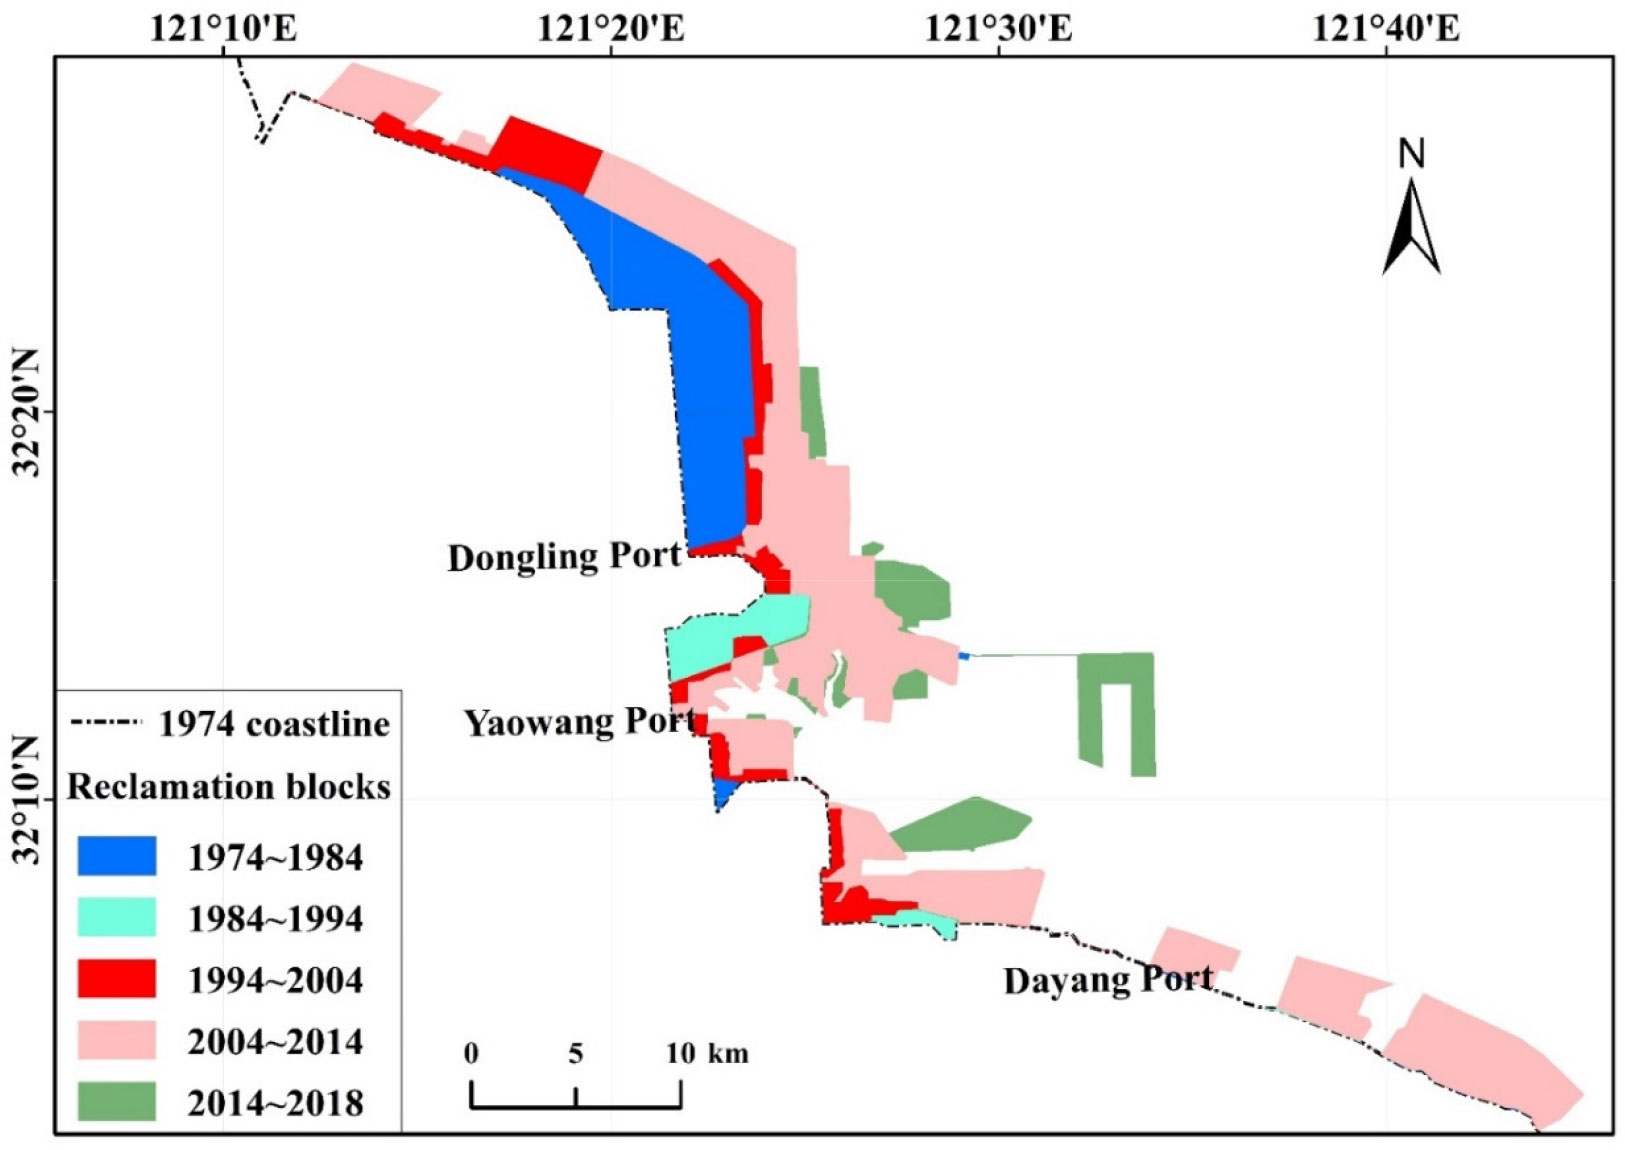
Figure 11 Distribution of the reclamation blocks in Tongzhou Bay from 1974 to 2018.
5.2 Future trends of the tidal flats in Tongzhou Bay
Previous results showed that the topographic evolution characteristics of Tongzhou Bay were mainly manifested at two scales. First, on the short-term scale, the sediment transport pattern was disrupted by the reclamation project, and partial erosion and deposition were easily generated near the seawall of the polder. As an example, on the Yaosha sand ridge, the deposition was obvious outside the seawall on the east side of phase I, and the 0-m contour expanded rapidly to the outer sea, with a rate of 250 m/year or more (Figure 6C). Second, on the long-term scale, the seabed remained macroscopically in an environment of deposition, with onshore siltation and offshore sandbanks moving southward. For a more visual illustration, we collected remote sensing images at low tide for a relatively long period of time, from 1974 to 2018. By extracting their sand ridge lines, the overlay distribution of the sand ridges in different periods was plotted. As shown in Figure 12, the sand ridges in the Tongzhou Bay sea area showed a tendency to move southeastward, and this trend was consistent with the southeastward trend of the whole RSRs (Kang et al., 2022). Specifically, over the past 40 years, the Yaosha sand ridge has shifted southward by 2,500 m, and the outer edge of the Lengjiasha sand ridge has moved over 5,000 m. Siltation has occurred at the eastern end of the Yaosha sand ridge, and the exposed areas of the Hengsha and Wulongsha sand ridges have been increasing.
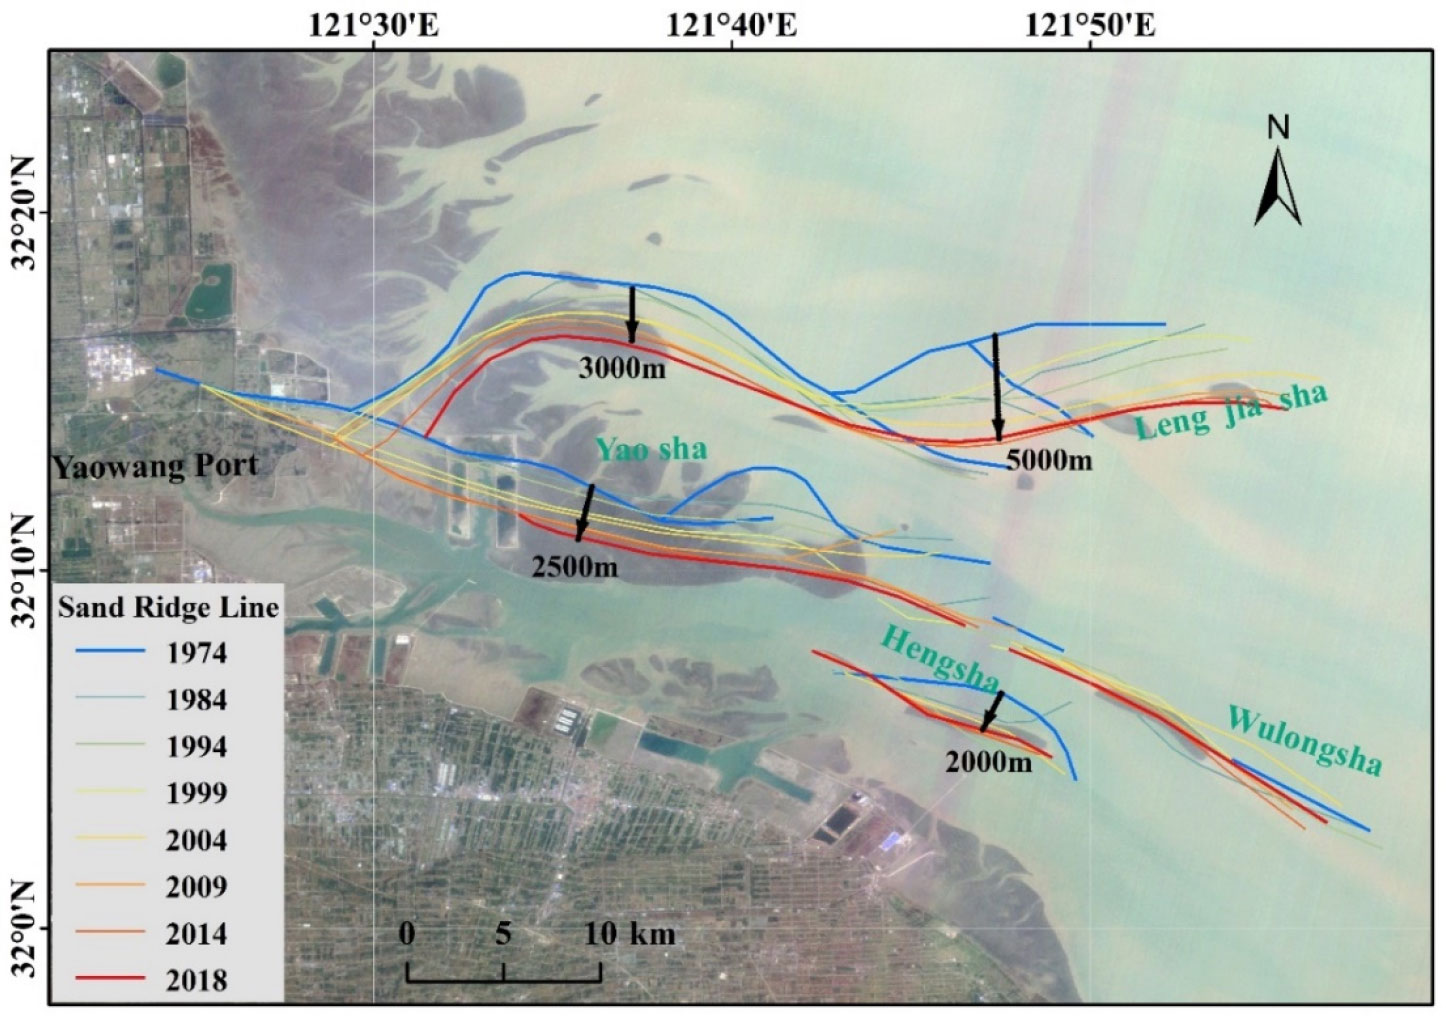
Figure 12 Spatial distribution map of the sand ridge lines from 1974 to 2018 (the background image is the HJ-1B multispectral image on March 23, 2018).
What is the reason for such a change? Previous studies have shown that tides play a dominant role in the formation and development of the RSR complex, including the waters of Tongzhou Bay (Tao et al., 2019). The offshore Jiangsu is controlled by two tidal systems: the advancing tidal wave system propagated from the East China Sea and the counterclockwise rotating tidal wave system propagated from the Southern Yellow Sea. After the return of the Yellow River to the north in 1855, the abandoned Yellow River delta was gradually eroded and sediment was transported and silted up in the southern region of the RSR complex (Su et al., 2016). Although the submerged delta has now been eroded out, the macroscopic trend of sediment transport has not changed for more than 160 years. In addition, human activities (reclamation) have flattened the coastline and weakened the blocking effect of the coastal zone on tidal waves from north to south, making it faster and hydrodynamically stronger, driving the sand ridge geomorphic body to shift in the southeastern direction (Chen et al., 2017). This trend of southeastward movement will continue for a long time, and this is an issue that needs to be focused on during the subsequent construction of the Tongzhou Bay port in the future.
5.3 Limitations of this study
The accuracy of the constructed DEMs is crucial to the analysis of the morphological evolution of the tidal flats. Its accuracy mainly depends on the density of waterline distribution and the accuracy of tidal level assignment. The time interval of the images required for DEM construction was basically controlled within 1 year in this study. Thereby, the waterline data at different high–mid–low tides were sufficiently acquired. However, in areas with frequent tidal gully oscillations, the topography changes rapidly and the water lines are prone to crossings, which, to a large extent, can cause errors in the construction of DEMs. In addition, due to the large area, the obvious north–south tidal imbalance, and the small number of tidal stations, the accuracy of the waterline assignment needed to be further improved, and a higher-resolution hydrodynamic model can be considered for the next step to improve the accuracy.
In addition, this study focused on the macroscopic scale, and the control of specific details was not rigid enough. For example, the spatial resolution of the DEM was 50 m, while the vertical elevation lay between −3 and 3 m. On the one hand, more detailed changes cannot be reflected; on the other hand, the changes in the deeper tidal trench area cannot be reflected. For these two aspects, changes in the details of the tidal flats can be analyzed by means of high-resolution monitoring, such as LiDAR (light detection and ranging) survey and unmanned aerial vehicle (UAV). In addition to improving the monitoring method used, higher temporal–spatial resolution satellite images, such as Sentinel-1 and Sentinel-2, can be used to further improve the accuracy of this method. At the same time, remote sensing bathymetry inversion algorithms for long-term submerged seas under high suspended sand concentration can also be further developed to effectively complement the analysis of underwater topography evolution.
6 Conclusion
In this study, three DEMs (2013, 2015, and 2017) of the tidal flats before and after the phase I reclamation project in Tongzhou Bay were obtained based on the waterline method using multi-source multi-temporal satellite images. The evolution characteristics of the topography were analyzed and the future development trend was discussed. Overall, the tidal flats in Tongzhou Bay were in a continuous deposition trend during the 5 years from 2013 to 2017, and the deposition thickened by 0.19 m. The area above the −2-m contour showed a trend of first decreasing (disturbed by reclamation activities) and then increasing (natural recovery). However, the impact of the reclamation project on the spatial distribution of the mudflats in a large area was limited in scope, and the erosion and deposition mostly occurred near the seawall. There was a trend of a southward shift of the offshore sand ridges. It is demonstrated that the waterline method based on remote sensing can be effectively used for the analysis of the morphological changes of large-scale tidal flats. It is important to support the future evolution of coastal geomorphology, wetland ecological protection, and coastal zone management.
Data availability statement
Publicly available datasets were analyzed in this study. These data can be found here: China Center for Resource Satellite Data and Applications (CRESDA) and United States Geological Survey (USGS).
Author contributions
YK and JL contributed to the conception and design of the study. MW and XD organized the database. GL performed the statistical analysis. YK wrote the first draft of the manuscript. JL and MW wrote sections of the manuscript. All authors contributed to the article and approved the submitted version.
Funding
This research was funded by the National Key R&D Program of China (2022YFC3106204); the Open Fund of Observation and Research Station of East China Coastal Zone, Ministry of Natural Resources (ORSECCZ2022101); the National Natural Science Funds of China (41806118); and Jiangsu Transportation Technology Project (2017ZX01).
Acknowledgments
The authors are grateful to the China Center for Resource Satellite Data and Applications (CRESDA) for supplying all the HJ-1 CCD images and the United States Geological Survey (USGS) for providing Landsat images.
Conflict of interest
The authors declare that the research was conducted in the absence of any commercial or financial relationships that could be construed as a potential conflict of interest.
Publisher’s note
All claims expressed in this article are solely those of the authors and do not necessarily represent those of their affiliated organizations, or those of the publisher, the editors and the reviewers. Any product that may be evaluated in this article, or claim that may be made by its manufacturer, is not guaranteed or endorsed by the publisher.
References
Anthony E. J., Dolique F., Gardel A., Gratiot N., Proisy C., Polidori L. (2008). Nearshore intertidal topography and topographic-forcing mechanisms of an Amazon-derived mud bank in French Guiana. Cont. Shelf Res. 28, 813–822. doi: 10.1016/j.csr.2008.01.003
Blum M. D., Roberts H. H. (2009). Drowning of the Mississippi delta due to insufficient sediment supply and global sea-level rise. Nat. Geosci. 2 (7), 488–491. doi: 10.1038/ngeo553
Cao W., Zhou Y., Li R., Li X. (2020). Mapping changes in coastlines and tidal flats in developing islands using the full time series of landsat images. Remote Sens. Environ. 239, 111665. doi: 10.1016/j.rse.2020.111665
Chen K., Zheng J., Zhang C., Wang N., Zhou C. (2017). The evolution characteristics of main waterways and their control mechanism in the radial sand ridges of the southern yellow Sea. Acta Oceanol. Sin. 36 (3), 91–98. doi: 10.1007/s13131-017-1042-y
Derion J.-P., Conreux A., Laratte S. (2022). A multisource approach for tidal flat study. example of the baie des veys, Normandy, France). Z. für Geomorphologie 64 (1), 17–38. doi: 10.1127/zfg/2022/0733
Environmental Systems Research Institute (ESRI), China Information Technology Co., Ltd (2014). ArcGIS 10.3 for desktop online software user’s manual. Esri China Information Technology Co. Ltd. Available at: https://www.esri.com/.
Gong Z., Jin C., Zhang C., Zhou Z., Zhang Q., Li H. (2017). Temporal and spatial morphological variations along a cross-shore intertidal profile, jiangsu, china. Continental Shelf Research 144, 1–9. doi: 10.1016/j.csr.2017.06.009
Heygster G., Dannenberg J., Notholt J. (2010). Topographic mapping of the German tidalflats analyzing SAR images with the waterline method. IEEE Trans. Geosci. Remote Sens. 48, 1019–1030. doi: 10.1109/TGRS.2009.2031843
ITT Visual Information Solutions (2009). ENVI 4.7 online software user & apos; s manual. ITT Visual Information Solutions. Available at: https://www.ittvis.com/.
Kang Y., Ding X., Xu F., Zhang C., Ge X. (2017). Topographic mapping on large-scale tidal flats with an iterative approach on the waterline method. Estuarine Coast. Shelf Sci. 190, 11–22. doi: 10.1016/j.ecss.2017.03.024
Kang Y., He J., Wang B., Lei J., Wang Z., Ding X. (2022). Geomorphic evolution of radial sand ridges in the south yellow Sea observed from satellites. Remote Sens. 14 (2), 287. doi: 10.3390/rs14020287
Kang Y., Lv W., He J., Ding X. (2020). Remote sensing of time-varying tidal flat topography, jiangsu coast, China, based on the waterline method and an artificial neural network model. Appl. Sci. 10 (10), 3645. doi: 10.3390/app10103645
Kim J. H., Kim S. Y., Yoo S. H. (2021). South koreans’ willingness to pay for restoration of gomsoman tidal flat. Ocean & Coastal Management 199, 105388. doi: 10.1016/j.ocecoaman.2020.105388
Lee Y.-K., Ryu J.-H., Choi J.-K., Soh J.-G., Eom J.-A., Won J.-S. (2011). A study of decadal sedimentation trend changes by waterline comparisons within the ganghwa tidal flats initiated by human activities. J. Coast. Res. 27, 857–869. doi: 10.2112/JCOASTRES-D-10-00150.1
Li Z., Heygster G., Notholt J. (2014). Intertidal topographic maps and morphological changes in the German wadden Sea between 1996–1999 and 2006–2009 from the waterline method and SAR images. IEEE J. Selected Topics Appl. Earth Observ. Remote Sens. 7 (8), 3210–3224. doi: 10.1109/JSTARS.2014.2313062
Li H., Li L., Su F., Wang T., Gao P. (2021). Ecological stability evaluation of tidal flat in coastal estuary: a case study of liaohe estuary wetland, china. Eco. Indicators 130, 108032. doi: 10.1016/j.ecolind.2021.108032
Liu Y., Li M., Cheng L., Li F., Chen K. (2012). Topographic mapping of offshore sandbank tidal flats using the waterline detection method: a case study on the dongsha sandbank of jiangsu radial tidal sand ridges, China. Mar. Geodesy 35 (4), 362–378. doi: 10.1080/01490419.2012.699501
Liu Y., Li M., Zhou M., Yang K., Mao L. (2013). Quantitative analysis of the waterline method for topographical mapping of tidal flats: a case study in the dongsha sandbank, China. Remote Sens. 5 (11), 6138–6158. doi: 10.3390/rs5116138
Ma T., Li X., Bai J., Cui B. (2019). Impacts of coastal reclamation on natural wetlands in large river deltas in China. Chin. Geographical Sci. 29 (4), 640–651. doi: 10.1007/s11769-019-1049-8
Macreadie P. I., Anton A., Raven J. A., Beaumont N., Connolly R. M., Friess D. A., et al. (2019). The future of blue carbon science. Nat. Commun. 10 (1), 3998. doi: 10.1038/s41467-019-11693-w
Mason D. C., Davenport I. J., Robinson G. J., Flather R. A., McCartney B. S. (1995). Construction of an inter-tidal digital elevation model by the ‘Water-line’ method. Geophys. Res. Lett. 22 (23), 3187–3190. doi: 10.1029/95GL03168
Mason D. C., Scott T. R., Dance S. L. (2010). Remote sensing of intertidal morphological change in Morecambe bay, U.K., between 1991 and 2007. Estuarine Coast. Shelf Sci. 87, 487–496. doi: 10.1016/j.ecss.2010.01.015
Murray N. J., Phinn S. R., DeWitt M., Ferrari R., Johnston R., Lyons M. B., et al. (2019). The global distribution and trajectory of tidal flats. Nature 565 (7738), 222–225. doi: 10.1038/s41586-018-0805-8
Ryu J. H., Kim C. H., Lee Y. K., Won J. S., Chun S. S., Lee S. (2008). Detecting the intertidal morphologic change using satellite data. Estuarine Coast. Shelf Sci. 78 (4), 623–632. doi: 10.1016/j.ecss.2008.01.020
Salameh E., Frappart F., Turki I., Laignel B. (2020). ). intertidal topography mapping using the waterline method from sentinel-1 & -2 images: the examples of arcachon and veys bays in France. ISPRS J. Photogrammetry Remote Sens. 163, 98–120. doi: 10.1016/j.isprsjprs.2020.03.003
Su M., Yao P., Wang Z. B., Zhang C. K., Stive M. J. (2016). Exploratory morphodynamic modeling of the evolution of the jiangsu coast, China, since 1855: contributions of old yellow river-derived sediment. Mar. Geol. 390, 306–320. doi: 10.1016/j.margeo.2016.10.013
Tao J., Wang Z. B., Zhou Z., Xu F., Zhang C., Stive M. J. (2019). A morphodynamic modeling study on the formation of the large-scale radial sand ridges in the southern yellow Sea. J. Geophys. Res.: Earth Surface 124 (7), 1742–1761. doi: 10.1029/2018JF004866
Tong S. S., Deroin J. P., Pham T. L. (2020). An optimal waterline approach for studying tidal flat morphological changes using remote sensing data: a case of the northern coast of Vietnam. Estuarine Coast. Shelf Sci. 236, 106613. doi: 10.1016/j.ecss.2020.106613
Tseng K. H., Kuo C. Y., Lin T. H., Huang Z. C., Lin Y. C., Liao W. H., et al. (2017). Reconstruction of time-varying tidal flat topography using optical remote sensing imageries. ISPRS J. Photogrammetry Remote Sens. 131, 92–103. doi: 10.1016/j.isprsjprs.2017.07.008
Wang Y., Gao S., Jia J., Thompson C. E., Gao J., Yang Y. (2012). Sediment transportover an accretional intertidal flat with influences of reclamation, jiangsu coast, China. Mar. Geol. 291, 147–161. doi: 10.1016/j.margeo.2011.01.004
Wang Y., Liu Y., Jin S., Sun C., Wei X. (2019). Evolution of the topography of tidal flats and sandbanks along the jiangsu coast from 1973 to 2016 observed from satellites. ISPRS J. Photogrammetry Remote Sens. 150, 27–43. doi: 10.1016/j.isprsjprs.2019.02.001
Xu Z., Kim D. J., Kim S. H., Cho Y. K., Lee S. G. (2016). Estimation of seasonal topographic variation in tidal flats using waterline method: a case study in gomso and hampyeong bay, south Korea. Estuarine Coast. Shelf Sci. 183, 213–220. doi: 10.1016/j.ecss.2016.10.026
Yang X., Zhu Z., Qiu S., Kroeger K. D., Zhu Z., Covington S. (2022). Detection and characterization of coastal tidal wetland change in the northeastern US using landsat time series. Remote Sens. Environ. 276, 113047. doi: 10.1016/j.rse.2022.113047
Keywords: topographical evolution, digital elevation model (DEM), waterline method, reclamation, Tongzhou Bay
Citation: Kang Y, Lei J, Wang M, Li G and Ding X (2023) Topographic evolution of tidal flats based on remote sensing: an example in Jiangsu coast, Southern Yellow Sea. Front. Mar. Sci. 10:1163302. doi: 10.3389/fmars.2023.1163302
Received: 10 February 2023; Accepted: 04 April 2023;
Published: 27 April 2023.
Edited by:
Nicoletta Leonardi, University of Liverpool, United KingdomReviewed by:
Jean-Paul Deroin, Université de Reims Champagne-Ardenne, FranceNadia Penna, University of Calabria, Italy
Copyright © 2023 Kang, Lei, Wang, Li and Ding. This is an open-access article distributed under the terms of the Creative Commons Attribution License (CC BY). The use, distribution or reproduction in other forums is permitted, provided the original author(s) and the copyright owner(s) are credited and that the original publication in this journal is cited, in accordance with accepted academic practice. No use, distribution or reproduction is permitted which does not comply with these terms.
*Correspondence: Yanyan Kang, a2FuZ3lhbnlhbkBoaHUuZWR1LmNu