 Moritz S. Schmid
 Su Sponaugle
 Anne W. Thompson
 Kelly R. Sutherland
 Robert K. Cowen
- 1Hatfield Marine Science Center, Oregon State University, Newport, OR, United States
- 2Department of Integrative Biology, Oregon State University, Corvallis, OR, United States
- 3Portland State University, Department of Biology, Portland, OR, United States
- 4Oregon Institute of Marine Biology, University of Oregon, Eugene, OR, United States
Eastern Boundary Systems support major fisheries whose early life stages depend on upwelling production. Upwelling can be highly variable at the regional scale, with substantial repercussions for new productivity and microbial loop activity. Studies that integrate the classic trophic web based on new production with the microbial loop are rare due to the range in body forms and sizes of the taxa. Underwater imaging can overcome this limitation, and with machine learning, enables fine resolution studies spanning large spatial scales. We used the In-situ Ichthyoplankton Imaging System (ISIIS) to investigate the drivers of plankton community structure in the northern California Current, sampled along the Newport Hydrographic (NH) and Trinidad Head (TR) lines, in OR and CA, respectively. The non-invasive imaging of particles and plankton over 1644km in the winters and summers of 2018 and 2019 yielded 1.194 billion classified plankton images. Combining nutrient analysis, flow cytometry, and 16S rRNA gene sequencing of the microbial community with mesoplankton underwater imaging enabled us to study taxa from 0.2µm to 15cm, including prokaryotes, copepods, ichthyoplankton, and gelatinous forms. To assess community structure, >2000 single-taxon distribution profiles were analyzed using high resolution spatial correlations. Co-occurrences on the NH line were consistently significantly higher off-shelf while those at TR were highest on-shelf. Random Forests models identified the concentrations of microbial loop associated taxa such as protists, Oithona copepods, and appendicularians as important drivers of co-occurrences at NH line, while at TR, cumulative upwelling and chlorophyll a were of the highest importance. Our results indicate that the microbial loop is driving plankton community structure in intermittent upwelling systems such as the NH line and supports temporal stability, and further, that taxa such as protists, Oithona copepods, and appendicularians connect a diverse and functionally redundant microbial community to stable plankton community structure. Where upwelling is more continuous such as at TR, primary production may dominate patterns of community structure, obscuring the underlying role of the microbial loop. Future changes in upwelling strength are likely to disproportionately affect plankton community structure in continuous upwelling regions, while high microbial loop activity enhances community structure resilience.
1 Introduction
Community structure in an ecological system is defined by the relative abundances of organisms and their interactions with the biotic and abiotic environment (Verity and Smetacek, 1996; Smetacek, 2012; Lima-Mendez et al., 2015). Planktonic community structure and its underlying processes determine energy transfer through the oceanic trophic web (Brown et al., 2004), in turn enabling charismatic top predators such as tuna and orcas to thrive as well as providing an important protein source for humans through fisheries. Community structure can be assessed through the lens of taxa co-occurrence. As co-occurrence is driven by processes enabling coexistence within an ecosystem, such as niche separation (MacArthur, 1958; Chesson, 2000; Lindegren et al., 2020), co-occurrences together with their biotic and abiotic environmental envelope describe ecologically important patterns that enable the investigation of community structure (HilleRisLambers et al., 2012; Williams et al., 2014; Ríos-Castro et al., 2022).
The oceanic environmental envelope is changing (Bakun, 1990; Doney et al., 2012; Bakun et al., 2015; Bograd et al., 2022). While climate change is a global phenomenon, key systems in which climate change has particularly strong effects are Eastern Boundary Upwelling Systems (EBUSs), important contributors to global ocean productivity and ecosystem services such as fisheries (Bograd et al., 2022). One such EBUS is the California Current Ecosystem which extends from British Columbia, Canada, to Baja California Sur in Mexico and exhibits strong physical and ecosystem variability on seasonal, interannual, and decadal time scales (Ware and Thomson, 2005; Barth et al., 2007; Checkley and Barth, 2009). The Northern California Current (NCC), extends from the northern border of the California Current Ecosystem southward to Cape Mendocino, CA, and encompasses variable oceanography along its extent, such as with respect to shelf width and year-round upwelling/downwelling strengths.
Upwelling in the NCC varies with latitude and season, with distinct downwelling (winter) and upwelling (spring-summer) seasons off OR and CA contrasted with persistent, stronger upwelling off northern CA (Bograd et al., 2009; García-Reyes and Largier, 2012). During upwelling, cold, nutrient- and CO2-rich waters reach the euphotic zone (Barth et al., 2005; Kirincich et al., 2005; Hales et al., 2006), fueling high levels of phytoplankton production (Dickson and Wheeler, 1995; Hales et al., 2006). Spring-summer upwelling typically occurs in intermittent events [3-10 day (d)] and is demarcated by brief relaxation periods that cumulatively fuel strong primary and secondary production in the system (Feinberg and Peterson, 2003; Hickey and Banas, 2003; Shaw et al., 2010). The NCC shelf in mid and northern Oregon (e.g., Newport at 45°N) is relatively wide, allowing for higher retention of upwelled waters compared to southern OR and northern CA locations such as Cape Blanco (42.8°N) with a narrower shelf. Circulation tends to closely track bathymetry (Lentz and Chapman, 1989; Kirincich et al., 2005; Hickey and Banas, 2008), with the coastal upwelling jet meandering off the shelf south of Heceta Bank (Barth et al., 2000). These oceanographic differences in combination substantially affect primary production and subsequent secondary production.
Tightly woven into the marine food web is the microbial loop, which drives water column recycling and repackaging of carbon and nutrients, making these available again to higher trophic levels (Turner, 2015; Cavan et al., 2019; Glibert and Mitra, 2022). While it is often associated with low-latitude marine ecosystems with low nutrient levels and more recycled production (Azam et al., 1983), the microbial loop is ever-present, even in temperate areas where upwelling is prevalent (Wilkerson et al., 1987; González et al., 2004). In intermittent upwelling regimes, smaller plankters associated with the microbial food web can become dominant (Mousseau et al., 1998). Though patterns and processes of microbial cycling have been extensively studied (Pomeroy, 1974; Azam et al., 1983; Kirchman, 2000), its influence is rarely examined beyond lower trophic levels, and it is often ignored in upwelling systems where the primary focus has been on new production and classical food chains (however, see Vargas et al. (2007) for a study integrating microbial and classic trophic web analysis in an upwelling system). Studying the composition of plankton communities in the context of their surrounding microbial communities has strong potential to improve our understanding of the mechanisms that link abiotic oceanographic conditions to ecosystem productivity.
Strong upwelling events in the NCC come with some negative ecological consequences in the form of hypoxic and anoxic events. When low oxygen water is upwelled onto the shelf and phytoplankton blooms collapse, bottom water can quickly become depleted of oxygen (Chan et al., 2008; Chan et al., 2019). Hypoxic events are becoming increasingly frequent and are also associated with low pH (ocean acidification) conditions (Feely et al., 2008; Chan et al., 2019), both conditions together having significant negative effects on demersal habitats and organisms (Doney et al., 2020; Nagelkerken and Connell, 2022). Upwelling regimes are poised to shift as a result of changes in wind forcing due to global climate change (Bakun, 1990; Bakun et al., 2015; Buil et al., 2021). Future poleward intensification of upwelling is predicted to lead to higher surface chlorophyll a (chl a), specifically in the NCC, while equatorward reduction in upwelling is predicting lower chl a in surface waters of the southern California Current (Buil et al., 2021). Predicted equatorward reduction of upwelling may also lead to increased microbial activity, while increased upwelling in the more northern NCC may lead to a reduction in microbial activity.
Simultaneously, climate change affects oceanographic processes at all spatial scales that comprise the environmental envelopes experienced by marine taxa. Effects are likely to be evident in taxa distributions, community composition, and community structure at scales ranging from microscale (e.g., predator-prey interactions, nutrient uptake in phytoplankton), fine scale (e.g., plankton thin layers and internal waves), sub-mesoscale (e.g., coastal processes such as cross-shore transport and upwelling), mesoscale (e.g., eddies, wind stress curl), and large basin scale [e.g., marine heat waves, Pacific Decadal Oscillation (PDO); Bakun and Nelson, 1991; Denman and Gargett, 1995; Mantua and Hare, 2002; Dickey and Bidigare, 2005; Prairie et al., 2012].
Historically, net-based plankton sampling has not adequately resolved planktonic communities at the micro-, and fine scales that are important for plankton dynamics (Haury et al., 1978; Yamazaki et al., 2002; Benoit-Bird et al., 2013; Schmid and Fortier, 2019; Robinson et al., 2021). In response, in-situ imaging instruments have been developed over the past few decades (Ortner et al., 1979) that can overcome this limitation. Today a variety of systems exist that have been designed for specific tasks in zooplankton imaging: for instance, UVP6 (Picheral et al., 2022) for integrated zooplankton imaging from CTD rosettes and vertical profiles, Zooglider (Ohman et al., 2019) for autonomous zooplankton imaging from gliders, the Scripps Plankton Camera System (Orenstein et al., 2020) for moored, repeated measurements, and the In-situ Ichthyoplankton Imaging System (ISIIS; Cowen and Guigand, 2008; Schmid et al., 2023) for imaging large volumes of water along towed transects. Advantages of imaging systems can include their non-destructive and high spatial resolution sampling capability (Lombard et al., 2019) as well as efficient imaging of plankton traits (Schmid et al., 2018; Vilgrain et al., 2021; Lertvilai and Jaffe, 2022). Data from imaging systems are often analyzed using machine learning due to the volume of data generated (Luo et al., 2018; Irisson et al., 2021). Together with additional onboard sensors (e.g., fluorometers, oxygen probes, CTDs) these imaging systems can describe the plankton community and their environmental envelope with high spatial resolution, providing new insight into plankton community structure (Briseño-Avena et al., 2020; Robinson et al., 2021).
To investigate the drivers of planktonic community structure in the NCC ecosystem, we deployed the ISIIS along the Newport (NH) and Trinidad (TR) lines, two historic cross-shelf transects that were visited thirty times for this study and vary in their seasonal patterns of upwelling. Sampling across two seasons (winter and summer) for two years (2018, 2019), in conjunction with a deep learning data pipeline, yielded a very large dataset for examining plankton community structure. In addition, discrete water samples taken along the same transects were used for nutrient analysis and characterizing the microbial community. To obtain a holistic view of community structure we used spatially explicit high-resolution correlations of taxa distributions. The co-occurrence of a wide range of organisms spanning from primary producers and protists, through gelatinous plankton and crustacean zooplankton, to larval fishes, in the context of their biotic and abiotic environment was used to disentangle the degree to which community structure is driven by upwelling strength and new productivity versus the potential impact of the microbial loop. We hypothesize that plankton community structure differs between locations with intermittent or continuous upwelling conditions, with plankton communities in intermittent upwelling areas depending heavily on microbial activity while those in continuous upwelling areas associated more with new productivity. With climate change increasingly affecting the California Current Ecosystem, it is important to identify current drivers of plankton community structure such that we can better anticipate future changes to the structure of the water column that may disrupt the coastal marine food web including valuable fisheries.
2 Materials and methods
2.1 Study area
Thirty transect replicates ranging from 24 to 86 km in length were sampled along the Newport Hydrographic (NH) line as well as the Trinidad Head (TR) line during the winters (February-March) and summers (July-August) of 2018 and 2019 (winter 2018 transect sample size was n=2 per location due to weather days while summer 2018 and 2019, n=4-5; Supplementary Material Table S1). Located off Newport, Oregon (Figure 1), the NH Line has been sampled since 1961 (Peterson and Miller, 1975), while the TR line off northern California has been sampled since 2007 (Robertson and Bjorkstedt, 2020). Both transects are part of regular net-based sampling efforts by the National Oceanic and Atmospheric Administration (NOAA) with a focus on determining the plankton community structure and the biophysical drivers of the recruitment of commercially important fishes. Imagery data were collected during both day and night hours, with daytime transects commencing at least 1h after sunrise and ending at least 1h before sunset, and nighttime transects commencing at least 1h after sunset and ending at least 1h before sunrise.
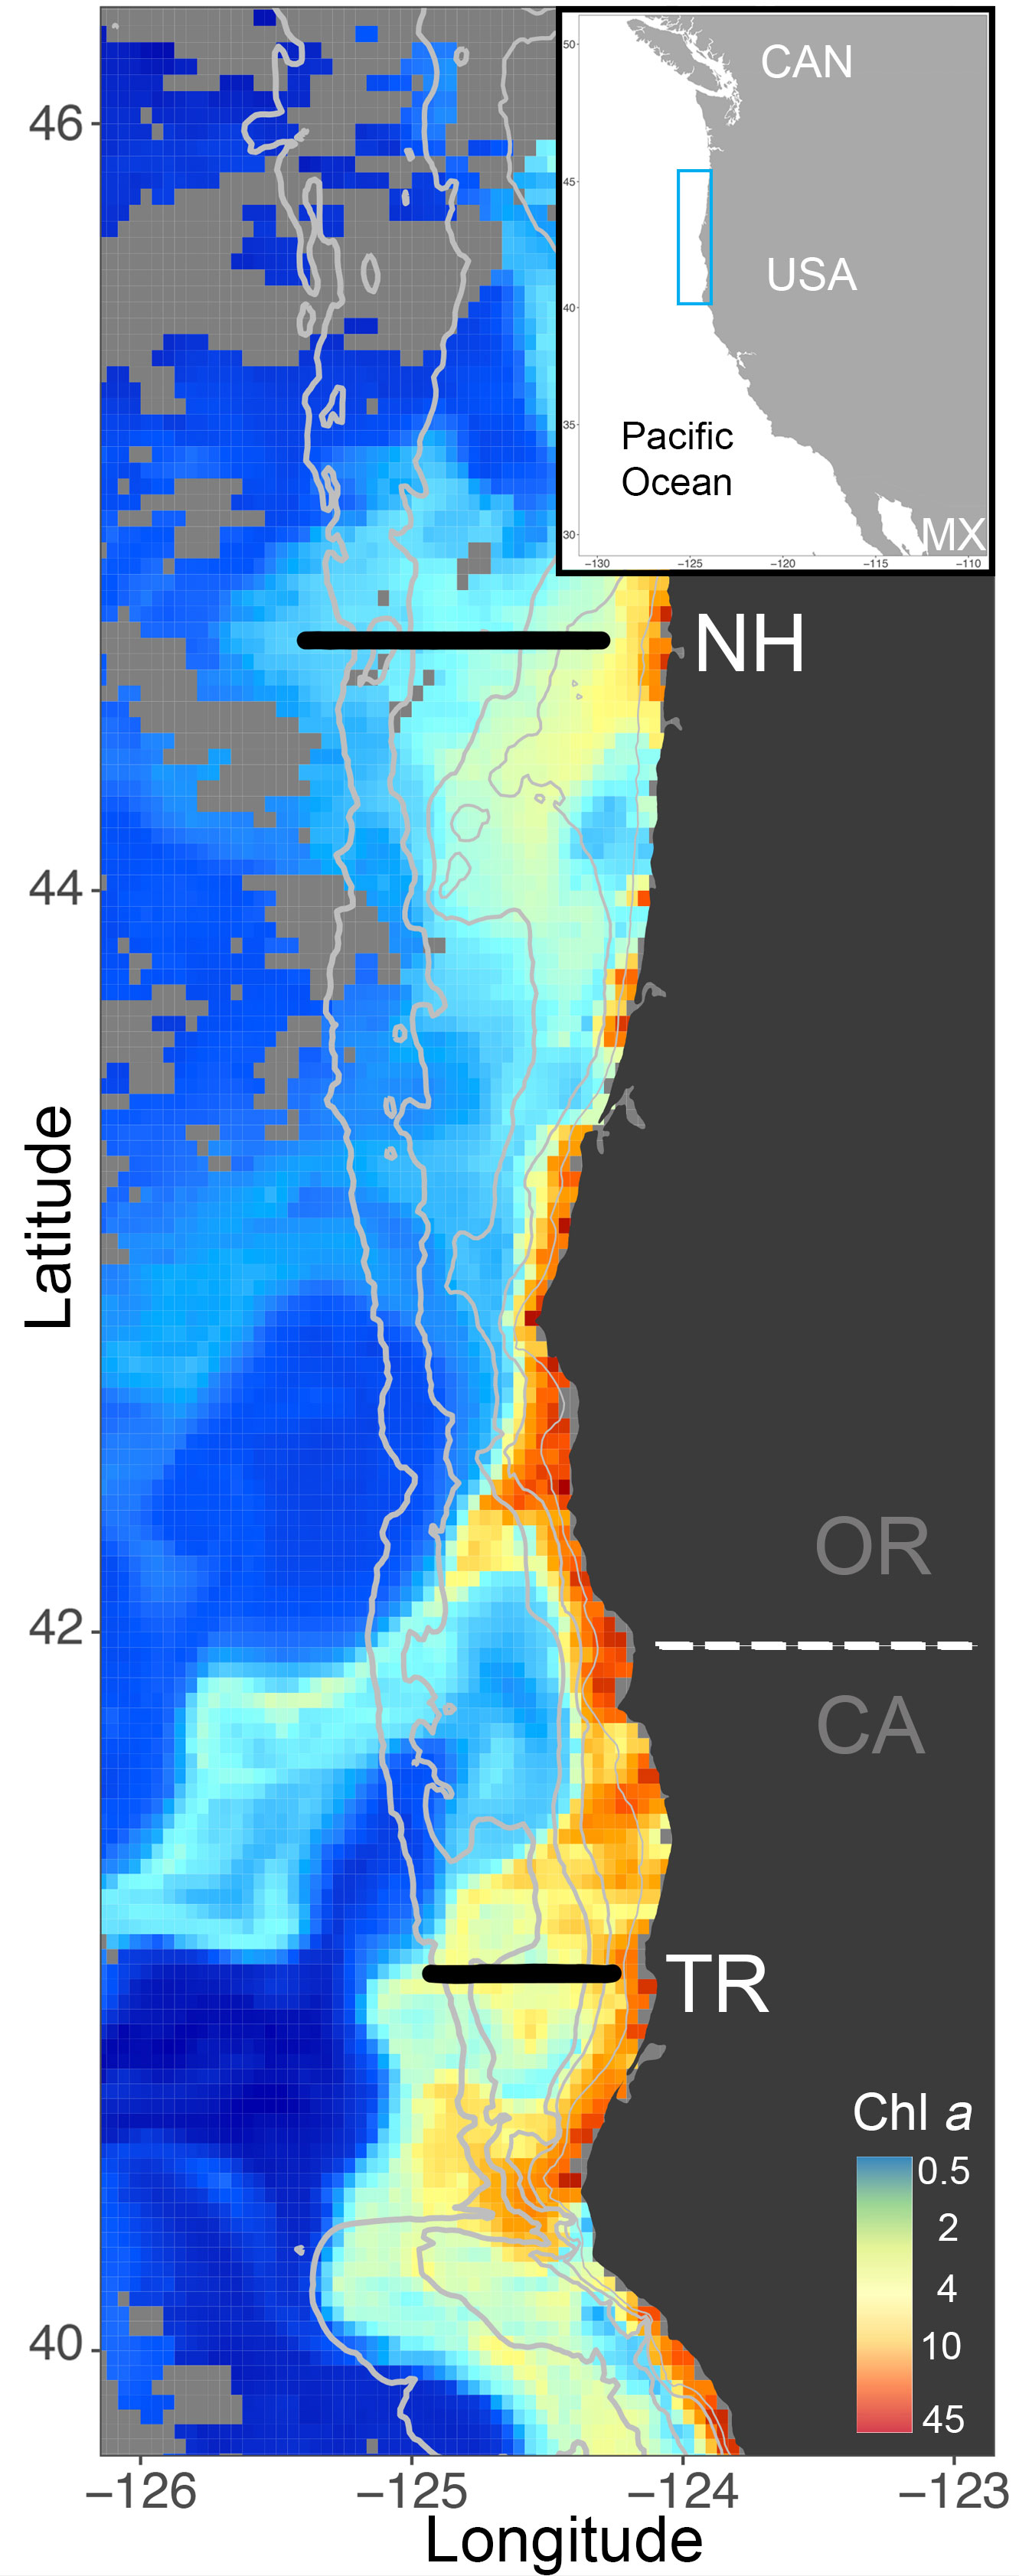
Figure 1 ISIIS transects along the Newport Hydrographic (NH) and Trinidad Head (TR) lines (black solid line) in Oregon (OR) and California (CA), respectively, where sampling occurred in winter and summer 2018 and 2019. Chlorophyll a from Aqua Modis ocean color on July 10, 2018 shows the often higher productivity in the northern California part of the Northern California Current, where the shelf is narrower than farther north at the NH Line (depth contours in solid grey lines at 50m, 100m, 200m, 1000m, 2000m). Light grey pixels indicate non-available data from Aqua Modis.
2.2 In-situ ichthyoplankton imaging system
ISIIS (Cowen and Guigand, 2008) is a towed shadowgraph and line-scan imaging system that scans a large volume of water (150 -185 L−1) to quantitatively sample abundant meso-zooplankton as well as rarer ichthyoplankton (Cowen et al., 2013; Schmid et al., 2023). ISIIS’s large imaging frame, with a 13 × 13-cm field of view and 50 cm depth of field allows for the undisturbed imaging of a variety of plankton taxa including fragile gelatinous zooplankton (McClatchie et al., 2012; Luo et al., 2014). The resulting images have a pixel resolution of 66 μm and are recorded as continuous videography. Data are sent to a top-side computer using a fiber optic cable where ISIIS data are time-stamped. ISIIS is equipped with a CTD (Sea-Bird SBE 49 FastCAT), as well as a dissolved oxygen probe (Sea-Bird 43), fluorescence sensor (Wet Labs FLRT), and photosynthetically active radiation sensor (PAR; Biospherical QCP-2300). ISIIS is towed behind the ship at 2.5 m s-1 where it undulates on each cross-shelf transect between 1 m and 100 m depth or as close as 2 m above the seafloor in shallower water. ISIIS has been used in various ecosystems with differing scientific objectives, such as the investigation of larval fish distributions at eddy fronts (Schmid et al., 2020) and fine-scale plankton patchiness in the Straits of Florida (Robinson et al., 2021), larval fish distributions in the context of environmental gradients in the NCC (Briseño-Avena et al., 2020; Swieca et al., 2020), the investigation of zooplankton individual-level interactions and parasitism in the Gulf of Mexico (Greer et al., 2021), and cross-ecosystem comparisons of a gelatinous grazer (Greer et al., 2023).
2.3 Sparse convolutional neural net
ISIIS imagery data were processed following Luo et al. (2018) and Schmid et al. (2020), with a full open-sourced, pipeline code (Schmid et al., 2021; Schmid et al., 2023). After the collected video data were flat-fielded and segmented into single regions of interest (ROIs; i.e., single plankton specimens) using a k-harmonic means clustering algorithm, a training library of images was created by choosing representative images from all 2018 and 2019 transects. The training library contained 82,909 images spanning 170 different classes, ranging from protists and phytoplankton to larval fishes. The sample size of the training classes ranged from n = 97 for rare unidentified larval fishes to n = 2000 for important-to-filter-out imaging artifacts. The sCNN (SparseConvNets with Fractional Max‐Pooling; Graham, 2015; Luo et al., 2018) was trained until the error rate plateaued at ~ 5% after 399 epochs.
The 170 original classes in the training library were mapped onto 67 broader groups (e.g., chaetognaths of different shapes merged into one group). After removing five different unknown groups, 62 taxonomic groups remained for ecological analyses. A random subset of images that had no overlap with the training library was classified by two human annotators and used for probability filtering following Faillettaz et al. (2016), an approach that removes very low probability images from the dataset, achieving 90% predictive accuracy per taxon. Removal of these “low‐confidence images” still allows for the prediction of true spatial distributions (Faillettaz et al., 2016). An independent subsample of the remaining images was again classified by the same two human annotators and the results compared with the automated classification. The resulting confusion matrix was used to calculate taxon-specific correction factors:
Average precision and recall for the 62 taxa was 0.63 and 0.92, respectively (Supplementary Material Table S2). Individuals and environmental data were binned into 1 m vertical strata and plankton concentrations (ind. m-3) estimated based on the volume of imaged seawater. Plankton concentrations were then adjusted by applying the taxon-specific correction factors.
2.4 Environmental and ecological data analyses
Upwelling - To estimate the upwelling strength on each transect, we calculated the cumulative daily Coastal Upwelling Transport Index (CUTI1; Jacox et al., 2018) for the 10 d prior to sampling of a transect. This period was selected to account for the lag between physical forcing (i.e., nutrient upwelling) and phyto- (~7 d) and zooplankton (~13-16 d) abundances (Spitz et al., 2005). To encompass plankton ranging from phyto- to zooplankton, we selected an intermediate lag of 10 d (Swieca et al., 2023).
Nutrients - Samples for nutrients were collected at each station (n=2 per station, 6 stations per transect) and placed into sterile acid-cleaned 50mL polystyrene tubes. Nutrients analyzed included the sum of nitrite (NO2-) plus nitrate (NO3-) (N+N), ammonium (NH4), phosphate (PO4), and silicate (Si). Nutrient samples were processed at the Oregon State University Elemental Analyzer Facility with a hybrid instrument. Analysis was carried out with a continuous flow analysis system including two channels of an Alpkem AutoAnalyzer II (configured with a 5 cm optical path), used for PO4 and NH4; and three channels of an Astoria Pacific Rapid Flow Analyzer for Si, NO3-, and NO2-.
Microbial Community - DNA sampling for microbes was carried out from surface (5-10 m depth) seawater samples (500-1000 mL, n=2 per station, 6 stations per transect) that were size fractionated on 47 mm 1.6 µm GF/A filters (Whatman) followed by 47 mm 0.2 µm Supor polyethersulfone filters (Pall Corporation) using a peristaltic pump. Filter membranes were moved to bead-beater tubes and frozen immediately at -20 ˚C and stored at -80 ˚C. DNA extraction was done using the DNeasy Plant Tissue Mini Kit (Qiagen) with the following modifications. Samples were lysed by bead beating with 0.55 mm and 0.25 mm sterile glass beads at 30 Hz for 2 min after addition of lysis buffer, freeze-fractured three times, incubated with Proteinase K (VWR Chemicals, Solon, OH, USA) at 20 mg/mL for 1 hour at 55 ˚C, and incubated with RNase A at 100 mg/mL for 10 min at 65 ˚C. PCR was performed in triplicate on 1 ng of DNA with the primer pair 515F‐Y/806R amplified the 16S rRNA V4 hypervariable region with conditions as published (Parada et al., 2015) using golay barcodes on the forward primers as in the EMP protocols (Caporaso et al., 2023). Reactions were performed with the QuantaBio 5Prime HotMasterMix (Qiagen Beverly, MA, USA). The Agilent High Sensitivity Kit in the Bioanalyzer (Agilent Technologies, Waldbronn, Germany) confirmed amplicon size. Triplicate PCR reactions from each sample were pooled then purified by magnetic beads. Each final pooled sample was paired-end sequenced with Illumina MiSeq v.3 (Illumina, San Diego, USA).
Flow cytometry was carried out with duplicate samples (n=2) and fixation of 1 mL seawater with a final concentration of 0.125% glutaraldehyde (Tousimis, Rockville, MD), incubated for 10 min at room temperature, then flash frozen in liquid nitrogen and stored at -80°C until processing. Cells from thawed samples were interrogated with a 488 nm laser using a BD Influx flow cytometer equipped with a 80 µm nozzle and small particle detector (BD Biosciences, San Jose, CA). Groups of phytoplankton were distinguished based on their relative red fluorescence (chlorophyll, bandpass 692/40 nm), relative orange fluorescence (phycoerythrin, bandpass 572/27 nm), side scatter, and forward scatter signals. The trigger for data collection was forward light scatter. Synechococcus populations were identified as cells with both chlorophyll and phycoerythrin fluorescence. Pigmented picoeukaryotes (PPE) were identified as cells with relatively high chlorophyll fluorescence, high forward scatter, and no phycoerythrin. Gating was carried out using FlowJo (BD Biosciences). Counts of cells measured by flow cytometry were normalized to the volume of seawater analyzed.
Amplicon sequence variants (ASVs) of seawater samples were identified based on 16S rRNA gene sequence reads that were processed using dada2 (Callahan et al., 2016) and phyloseq (McMurdie and Holmes, 2013). Sequences were quality controlled using filterAndTrim() with truncLen set to 190 (forward reads) and 160 (reverse reads), maxEE was set to 3, and maxN set to 0 to eliminate low quality base calls. Forward and reverse primers were trimmed from all reads. Error learning, sample inference, and merging of paired-end reads were done with dada2 default settings to yield unique amplicon sequence variants (ASVs). Chimeric ASVs were removed with the “consensus” method. The reference database “RefSeq-RDP16S_v2_May2018” was used to assign taxonomy to the ASVs. phyloseq was used to connect ASV sequence counts per sample to taxonomic data and metadata. Sequence abundances were standardized to the median sequencing depth of all samples (“standardized relative abundance”) without rarefying (McMurdie and Holmes, 2014). Raw sequence data can be accessed from the NCBI Sequence Read Archive2.
2.4.1 On-shelf/off-shelf plankton community structure
High spatial resolution taxa concentrations from ISIIS underwater imaging collected along the different transects were split into their respective on-shelf portions and off-shelf portions based on the longitudes of the 200 m isobath (NH = -124.61°W, TR= - 124.382°W). Spearman rank correlations between the concentrations of each taxon and the remainder of the plankton community were calculated for the on-shelf and off-shelf portions of each transect (on-shelf: M = 880, SD = 551; off-shelf M = 1860, SD = 718) based on the< 1-m vertical resolution data (Figure 2, Supplementary Materials Figure S1). Only correlations that were significant at p< 0.01 were used for further analyses.
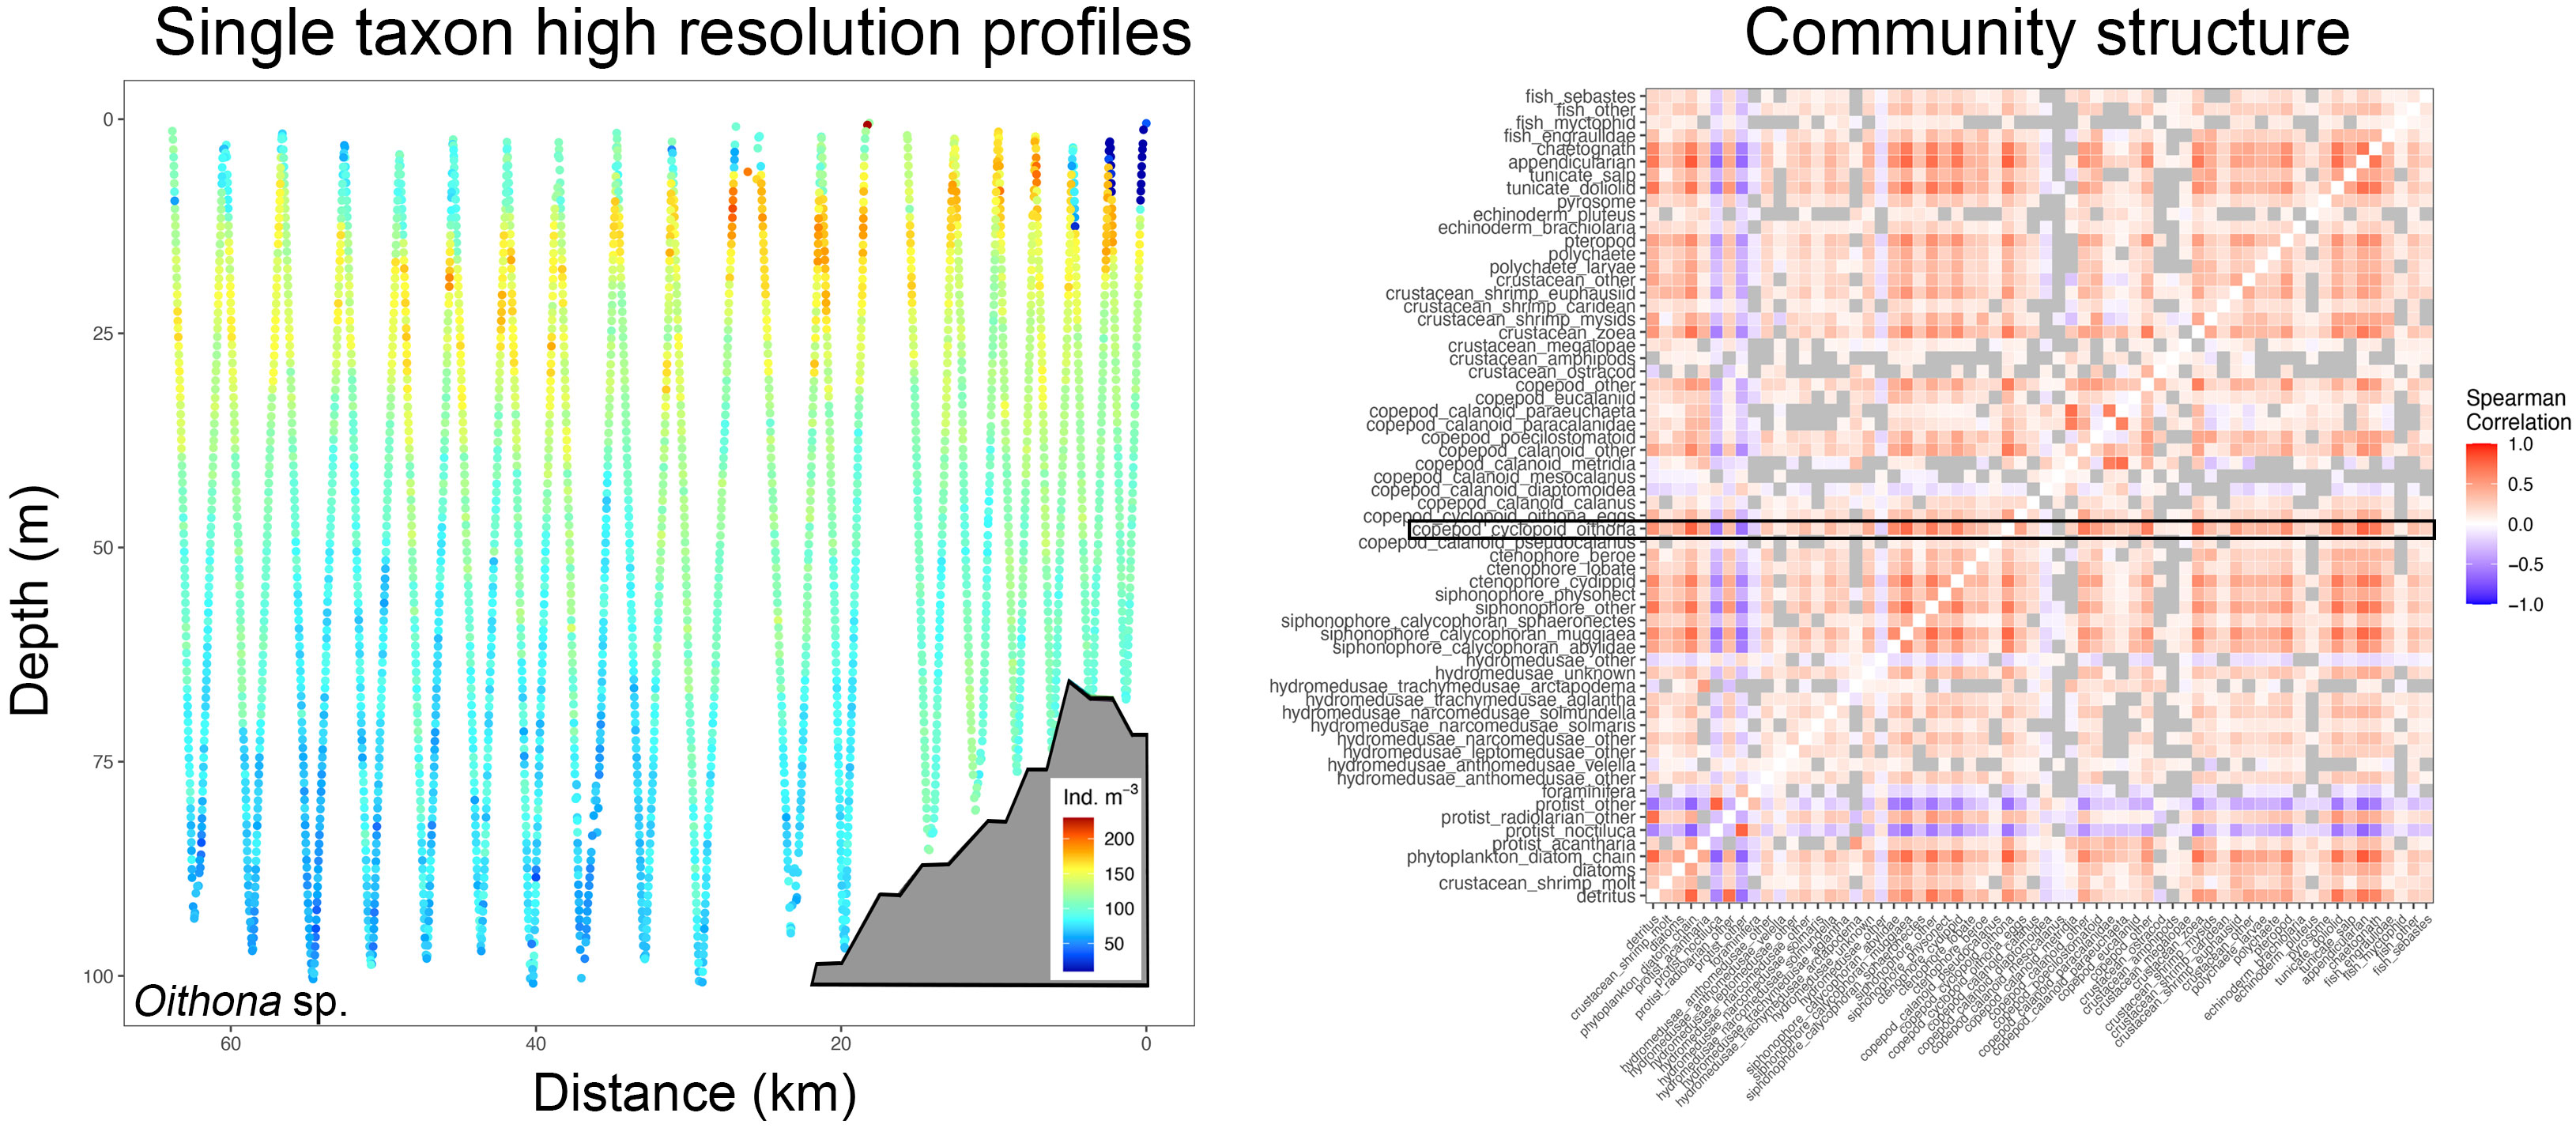
Figure 2 High spatial resolution profiles (here for instance Oithona sp. distribution from one distinct tow with the shelf delineated as a grey polygon, left panel) are correlated with all other taxa and led to correlograms that depict co-occurrence amongst taxa (right panel). In this example, the on-shelf portion of the left panel would result in one correlogram, and the off-shelf part in another. The black box shows Oithona sp. co-occurrence with other taxa (blue hues indicating negative correlation and red hues positive correlation, grey boxes are correlations that are not significant at p<0.01), while other taxa correlations above and below depict correlations of the remainder of the plankton community on the transect.
To determine whether on-shelf and off-shelf co-occurrences differed among the different years, seasons, sites, and shelf combinations, we used Wilcoxon Rank Sum tests with a confidence level of 0.999 (n=3720). To delineate patterns of taxa co-occurrences, coefficients of variation of the co-occurrences were calculated for each possible year, season, site, and shelf combination. Finally, linear regression was used to study transect-wide co-occurrence as a function of the cumulative CUTI, stratified only by location (NH/TR, n=30).
2.4.2 High spatial resolution modeling of environmental drivers of plankton community structure
Based on the original<1-m vertically stratified data, mixed layer depth (MLD, Kara et al., 2000), Brunt Vaisala Frequency, and geostrophic dynamic height anomalies (both using ‘gsw’ R package which follows TEOS-10 definitions) were calculated along a 10 m vertical grid along each transect to account for mixing depth, stratification strength, and influence of the upwelling front, respectively. Spearman rank correlation coefficients were calculated for each 10-m vertical bin using the underlying stratified taxa concentrations (Mean = 682, SD = 3, Supplementary Materials Figure S1). Correlation coefficients were then merged with the newly derived oceanographic variables (e.g., MLD), as well as all taxa concentrations and environmental variables (e.g., chl a, dissolved oxygen). The resulting dataset (Table 1) was used in two Random Forests models, one for each of the two transect lines (NH: n = 66,681, TR: n = 22,750, Supplementary Materials Figure S1). In each case the modeled response variable was the correlation coefficient for a specific 10-m vertical section of the grid; however, all data collected on NH or TR were combined for the most generalist model. Random Forest analysis (Breiman, 2001) was carried out using the ‘caret’ package in R (Kuhn, 2008), in the ‘ranger’ RF implementation, and variable importance was assessed based on permutation importance. Partial dependence plots were used to investigate the specific non-linear effects of the 10 most important explanatory variables per model.
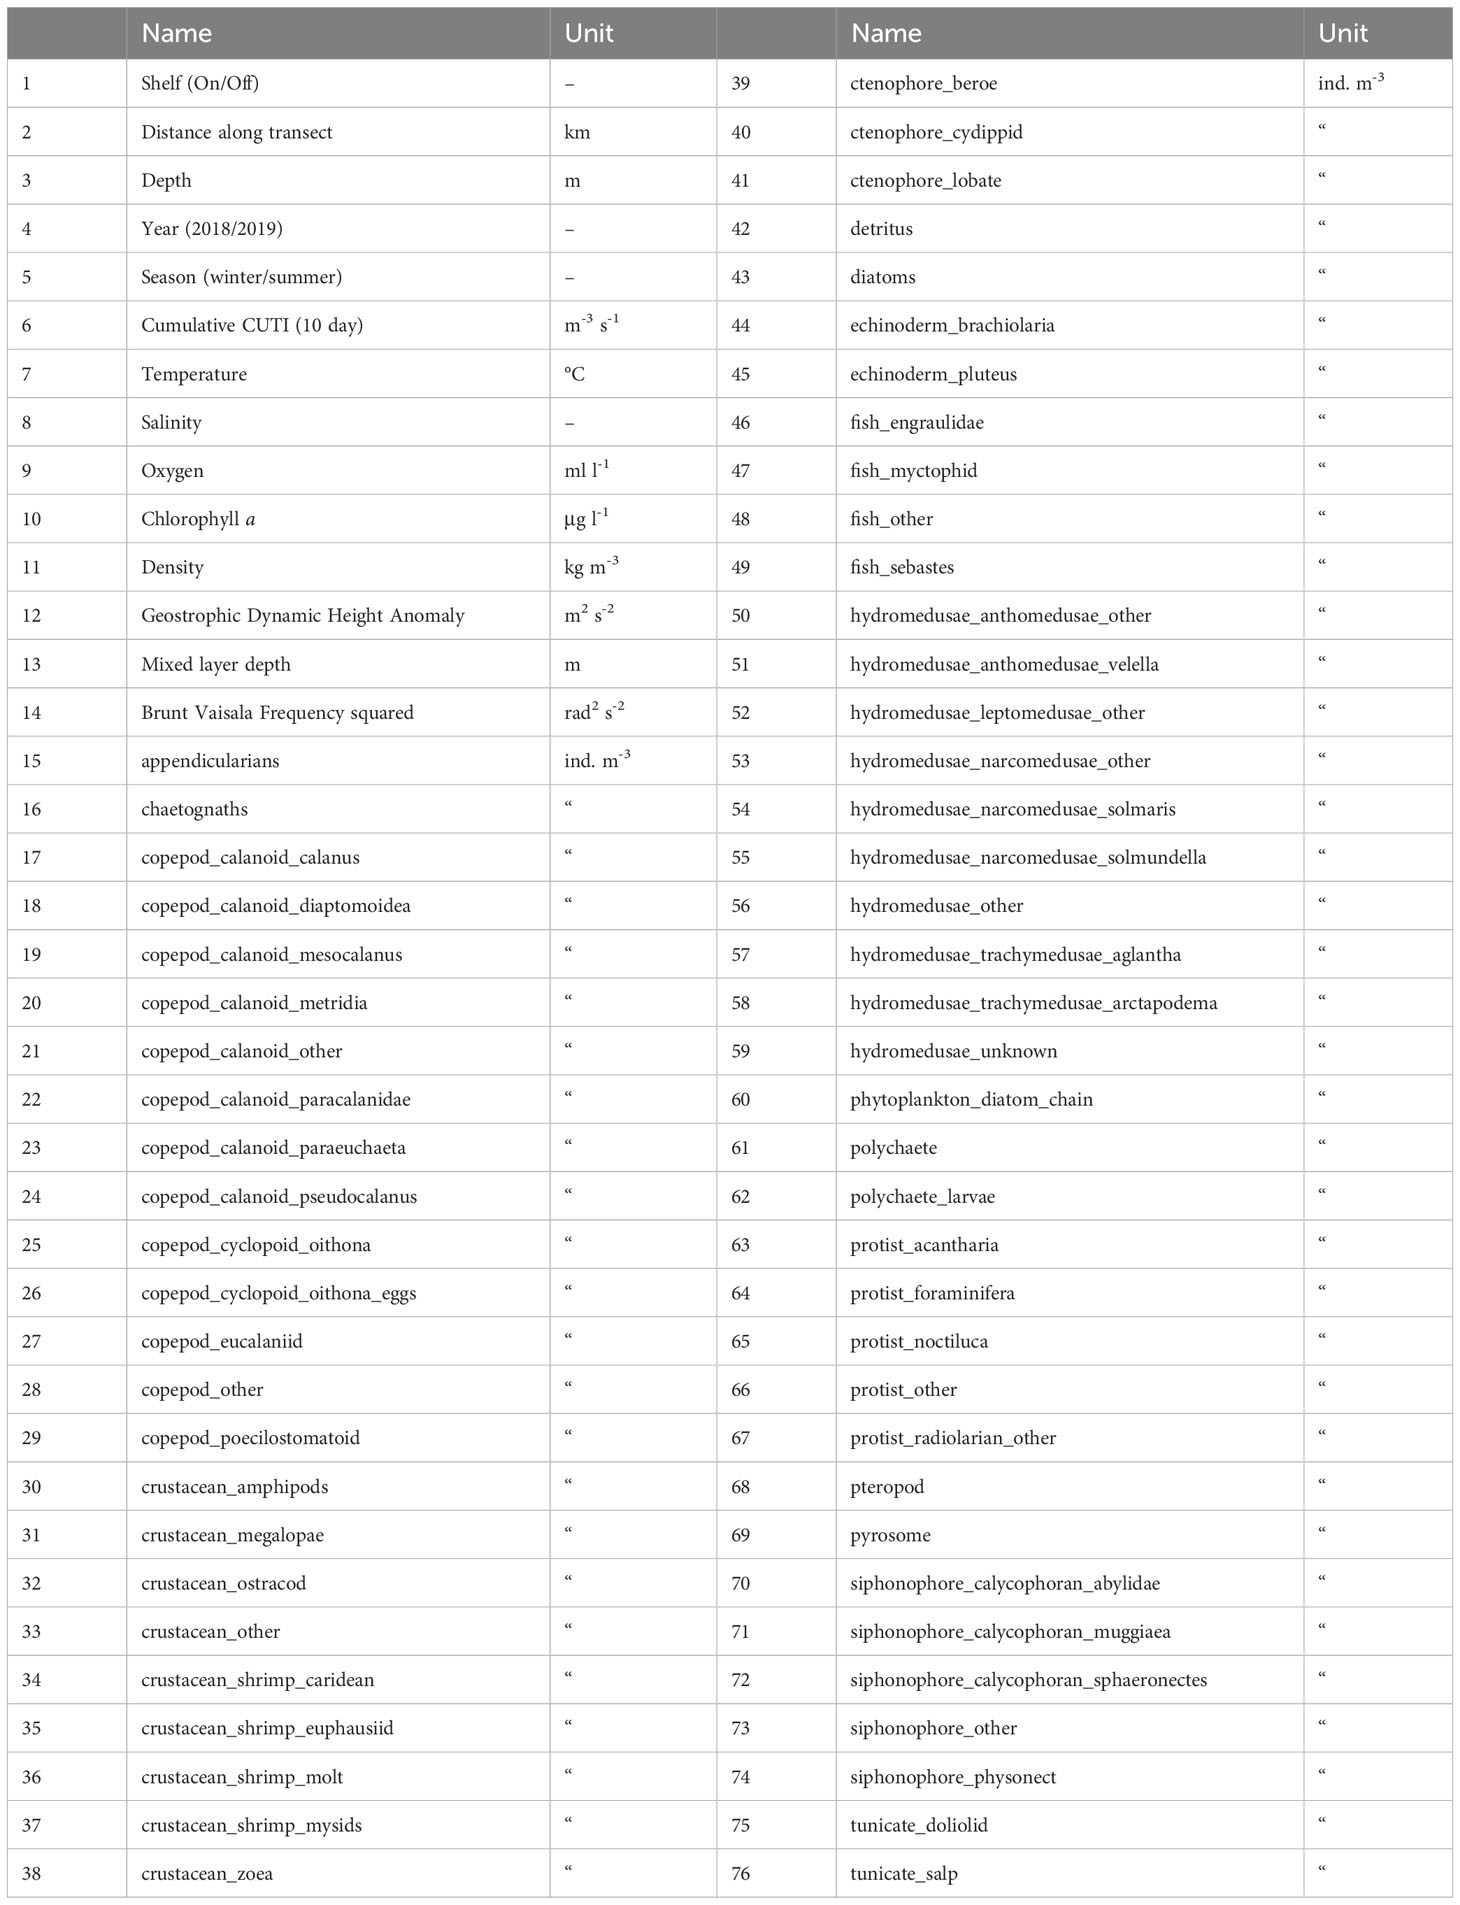
Table 1 Variables used in Random Forests modeling included biotic and abiotic environmental variables (1-14) and taxa concentrations derived from underwater imaging (15-76).
3 Results
1.194 billion plankton images were classified from 195 h of underwater imagery, traversing a total of 1644 km along 30 transects ranging from 24-86 km (Supplementary Material Table S1). Along these same transects, 96 discrete surface water samples were analyzed for inorganic nutrients and the composition and abundance of the microbial community. The vast diversity of NCC plankton imaged included taxa such as appendicularians, crab zoea and megalopae, different types of copepods as well as hydromedusae, pteropods, chaetognaths, ctenophores, salps, several groups of larval fish (Figure 3, Supplementary Material Table S1), among others. Dense thin layers of different plankton taxa were observed frequently during deployments and analysis of the imagery showed these dense layers consisted of > 25,000 calanoid copepods per m-3 (Feb 2018 on the TR line, Supplementary Material Table S1), or of >1,300 crab zoea per m-3 (Feb 2018 on the NH line). Thin dense layers of doliolids reached densities of >11,000 individuals per m-3 (e.g., NH line in July 2018), while lobate ctenophores accumulated to >800 individuals per m-3 (March 2019 on the NH line). Appendicularian accumulations of >10,000 individuals per m-3 were found on the TR line in July 2019.
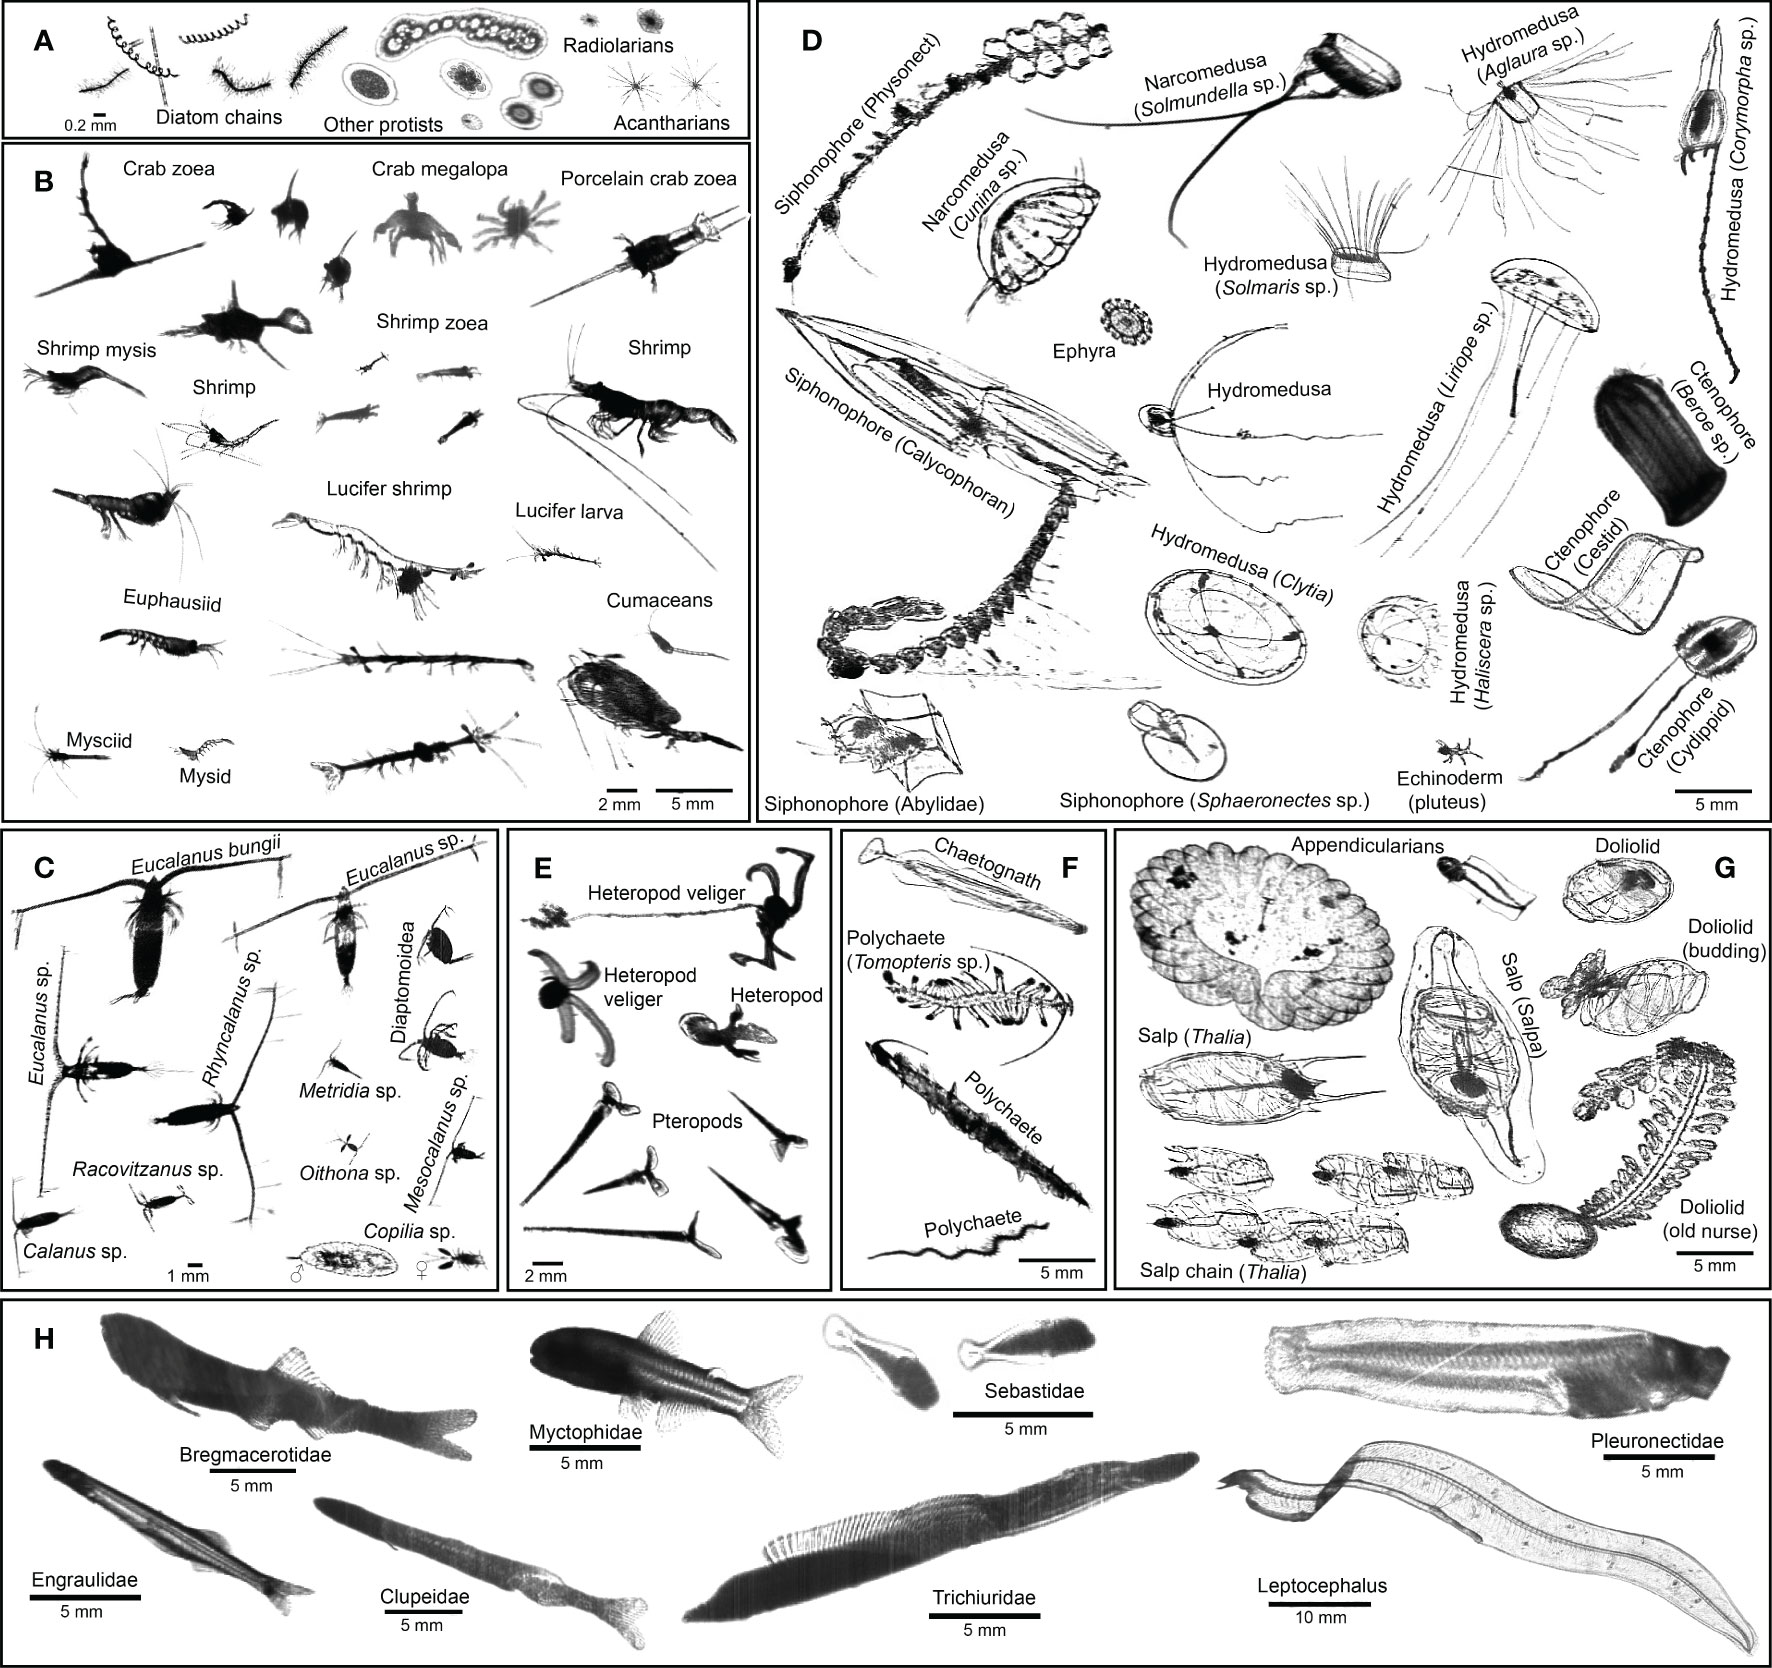
Figure 3 ISIIS images of key taxa in the northern California Current. (A) Protists; (B, C) crustaceans (D) cnidarians, ctenophores, and echinoderms; (E) heteropods and pteropods; (F) chaetognaths and polychaetes; (G) pelagic tunicates; (H) larval fishes.
Comparison of the environmental conditions at the NH and TR lines revealed distinct upwelling signatures in seawater densities along both sampling lines in the summers of 2018 and 2019 (see representative transects in Figures 4, 5). While isopycnals showed no evidence of winter upwelling on either the NH or TR line in 2019 (Figure 5) and the summer NH line in 2018, isopycnals on the summer 2018 TR line indicated upwelling. This was in agreement with cumulative CUTI upwelling 10 d prior to sampling (Figure 6). The 10-d CUTI was always higher on the TR line relative to the NH line (Figure 6). The mean 10-d CUTI for the NH line during winter 2018 was 3.8 m-3 s-1, while it was 4.8 m-3 s-1 during summer (Figure 6). Upwelling in 2019 was markedly lower, with a mean of 0.4 m-3 s-1 during winter and 3.6 m-3 s-1 during summer. On the TR line, 2018 10-d CUTI upwelling reached 13.8 m-3 s-1 and 22.3 m-3 s-1 during winter and summer, respectively, while upwelling in 2019 followed the NH trend and was reduced to 3.3 m-3 s-1 and 6.2 m-3 s-1 during winter and summer, respectively. Consistent with the 10-d CUTI, nitrate and nitrite (N+N) levels were higher on the TR line (>10 uM/L) compared to the NH line (<5 uM/L). N+N levels decreased generally sharply with longitude on the TR line in winter and summer (except for summer 2018 when off-shelf N+N were higher than onshore), while summer N+N levels on the NH line were generally low and showed no distinct nearshore/offshore pattern, compared to NH winter N+N that showed an offshore increase in nutrient levels (only one transect sampled for NH winter; Supplementary Material Figure S2).
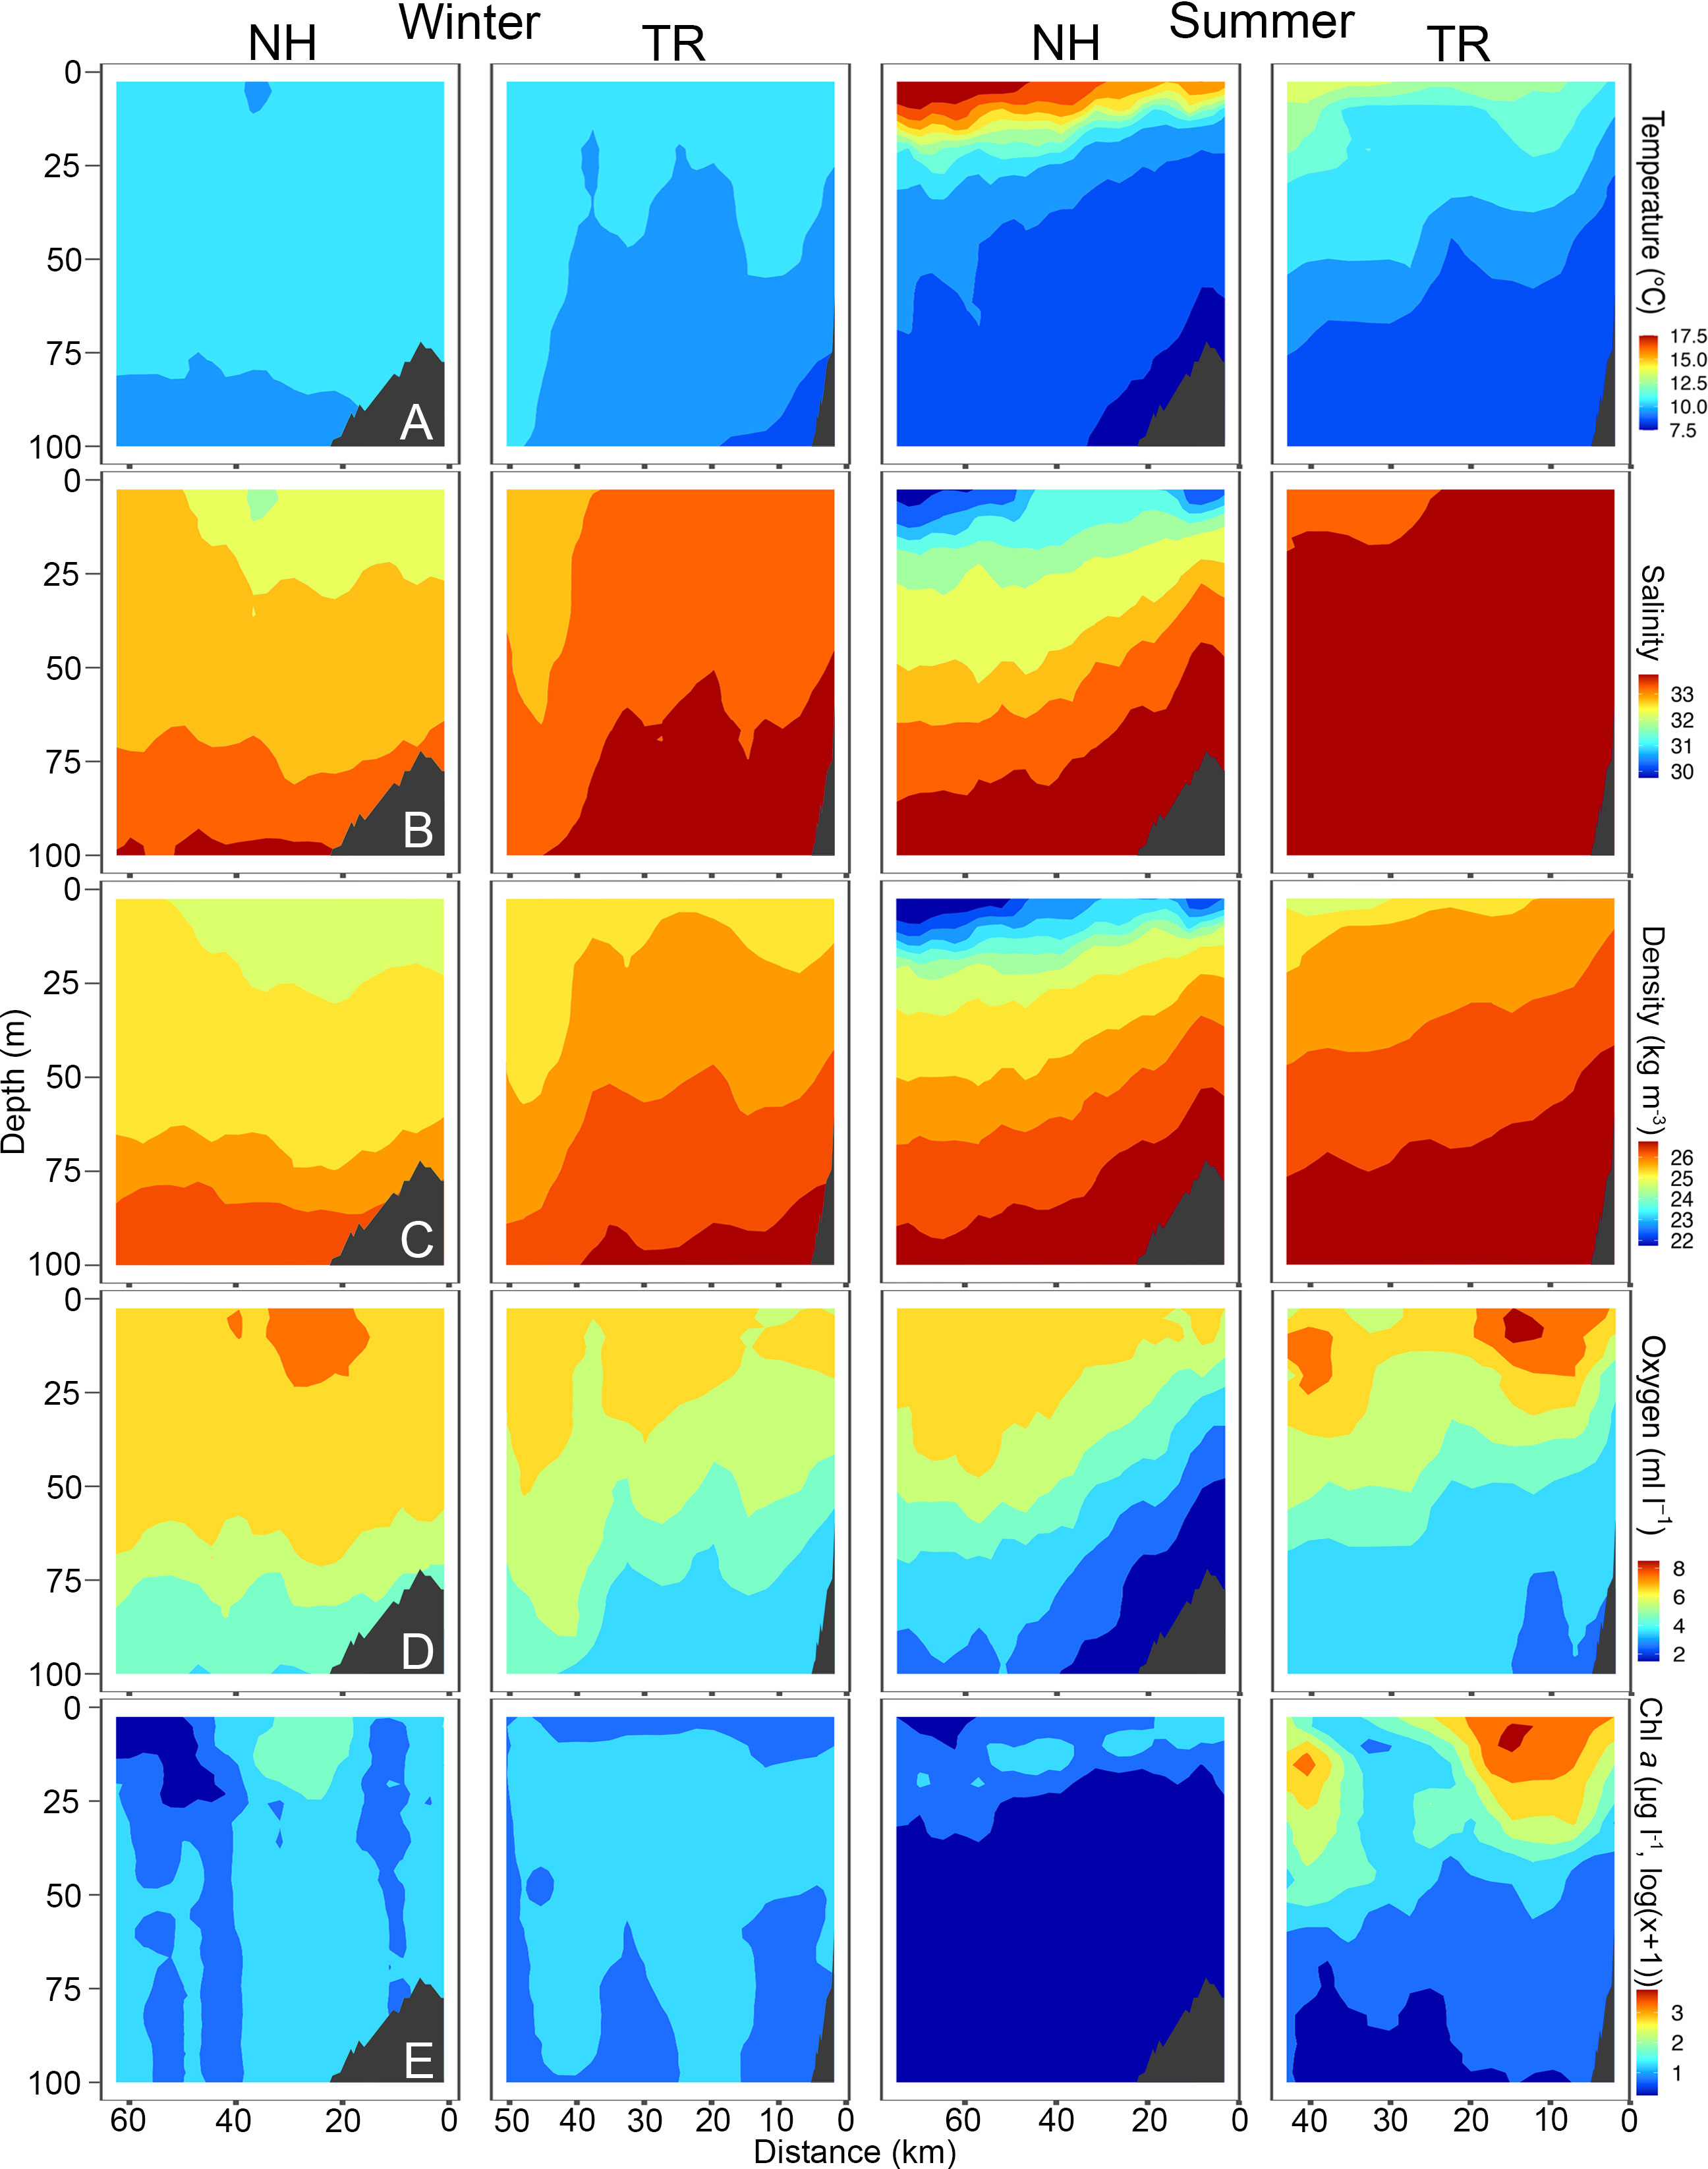
Figure 4 Temperature (A), Salinity (B), Density (C), Oxygen (D) and Chlorophyll a (chl a, (E) across the Newport Hydrographic (NH) and Trinidad Head (TR) transects in winter and summer 2018. Winter sampling on the NH and TR shown here was carried out February 16 and 21, respectively, while summer sampling was carried out on July 10 and 7, respectively. Note that Chl a is plotted in log(x+1) due to the values ranging from 0.01 to 45 μg l-1. Shelf indicated in dark grey. Note that x-axes have different lengths.
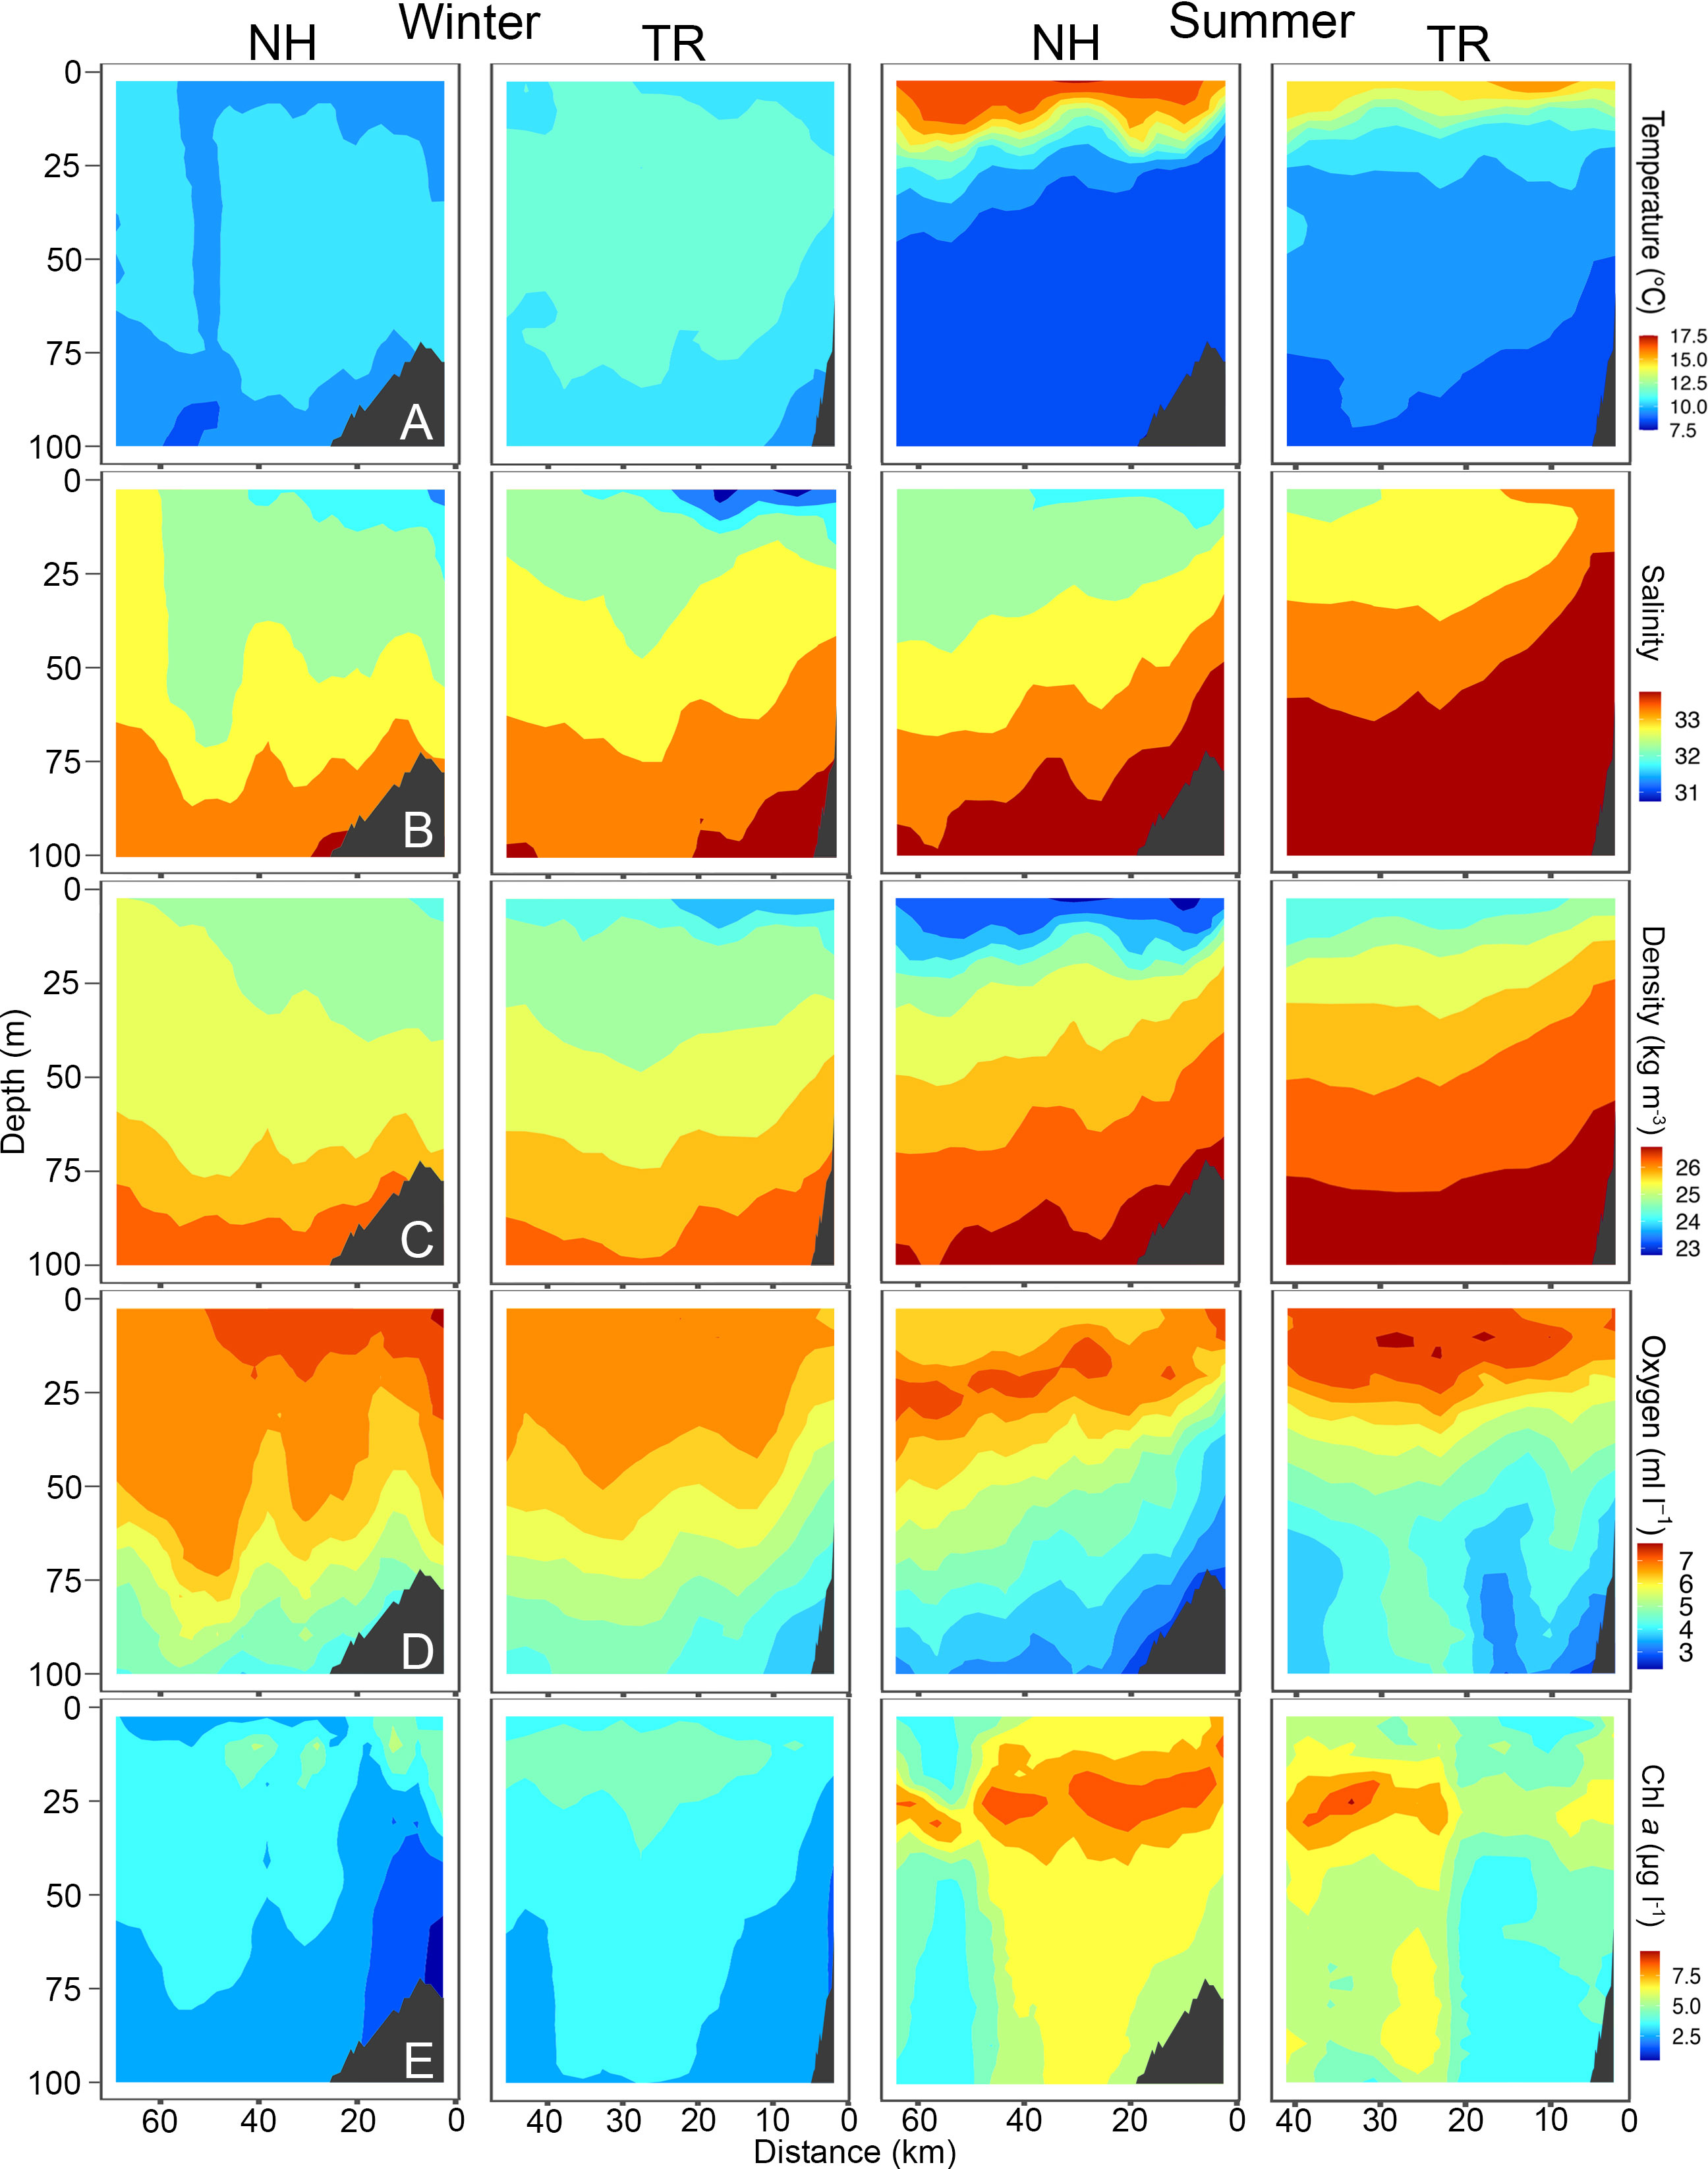
Figure 5 Temperature (A), Salinity (B), Density (C), Oxygen (D) and Chlorophyll a (chl a, (E) across the Newport Hydrographic (NH) and Trinidad Head (TR) transects in winter and summer 2019. Winter sampling on the NH and TR shown here was carried out on March 6 and 8, respectively, while summer sampling was carried out on July 23 and 18, respectively. Shelf indicated in dark grey. Note that x-axes have different lengths.
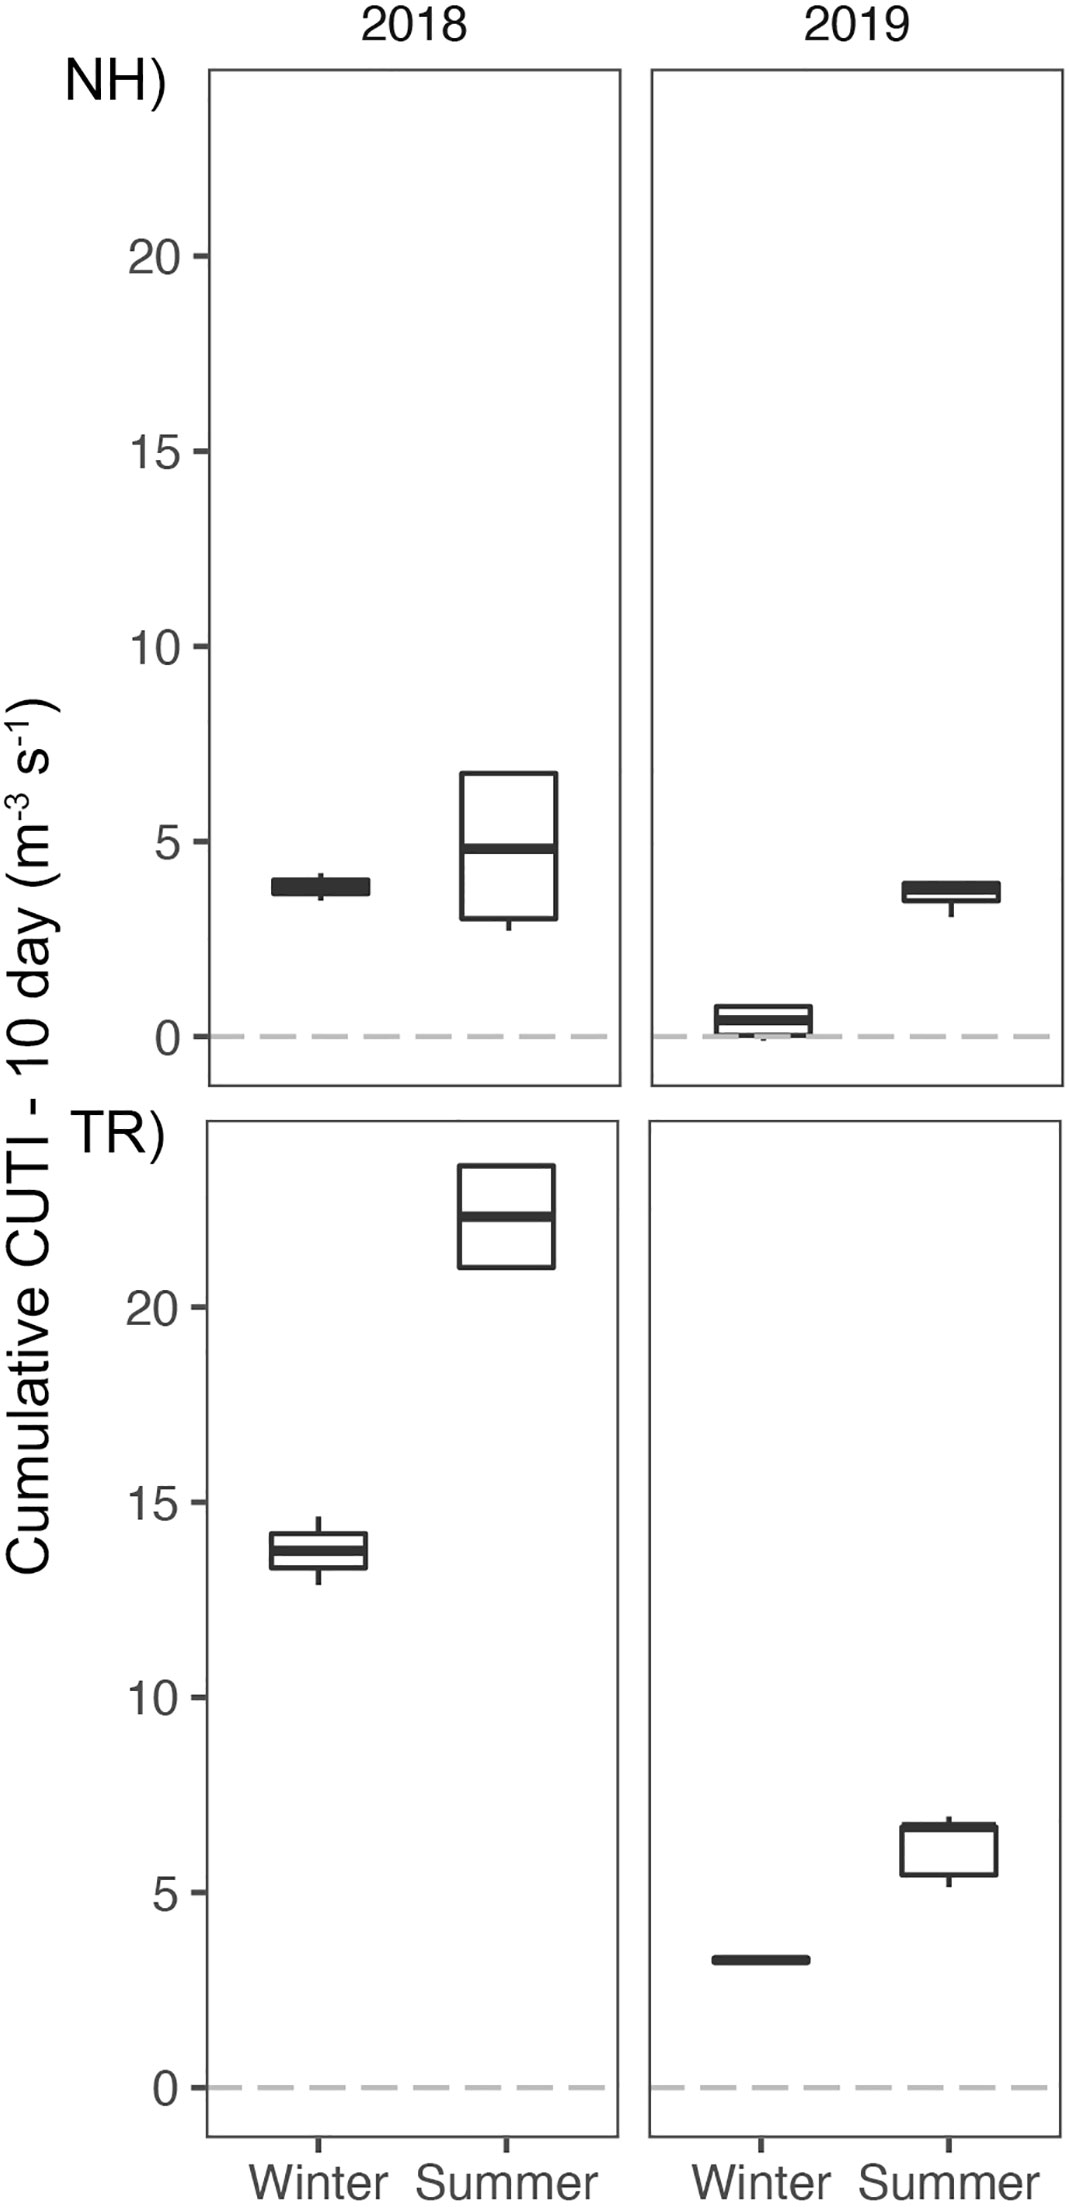
Figure 6 Cumulative Coastal Upwelling Transport Index (CUTI) over 10 d prior to sampling at the Newport Hydrographic (NH) and Trinidad Head (TR) lines. Boxplots show the median, and hinges the first and third quartiles. Whiskers extend from the hinges to the largest value but no further than 1.5 * interquartile range. Sample size n = 30.
Sea surface temperatures on the NH line peaked at 17.5°C in 2018, while water on the TR line remained substantially cooler. Surface salinities at the NH line were relatively fresh at 30, while most of the water column on the TR line was > 32.5. Oxygen levels fell to< 2 ml l-1 levels on the NH line in summer 2018, coinciding with substantial upwelling. Chl a was highest on the TR line in summer 2018 with levels reaching up to 45 μg l-1. The temperature profile along the NH line in summer 2019 closely mimicked that of 2018, with surface temperatures > 17.5°C (Figure 5). In 2019, oxygen levels fell to< 3 ml l-1 in summer in near-bottom areas on the shelf, while subsurface chlorophyll maxima reached 7.5 μg l-1 at both sampling sites in summer.
TS-diagrams reinforce that temperatures on the NH line in summer were consistently the highest measured during the study (Supplementary Material Figure S3). Winter profiles were characterized by a substantially narrower range in water temperature on both transects. While warm summer surface waters on the NH line were also the freshest found at either site, winter water was fresher on the TR line than on the NH line. Winter and summer water at both sampling sites showed a distinct seasonal signal (Supplementary Material Figure S3).
3.1 Microbial community
The community structure of the smallest size classes of plankton were determined by flow cytometry (phytoplankton: 0.2-30 µm in diameter) and 16S rRNA gene sequencing of size-fractionated seawater samples (phytoplankton and prokaryotes: 0.2-1.6 µm and 1.6 µm in diameter and larger). Pigmented picoeukaryotes (PPE) and the cyanobacterium Synechococcus dominated the phytoplankton community (Figures 7A-D), consistent with previous surveys of the NCC phytoplankton community composition and abundances (Sherr et al., 2005). Diatoms and cryptophytes (ubiquitous phototrophic flagellated protists) were the dominant eukaryotic phytoplankton taxa (Figures 7E-H). The 16S rRNA identity allowed insight into microbial function and growth conditions for select well-understood microbial lineages such as eukaryotic phytoplankton, heterotrophic bacteria, and picocyanobacteria.
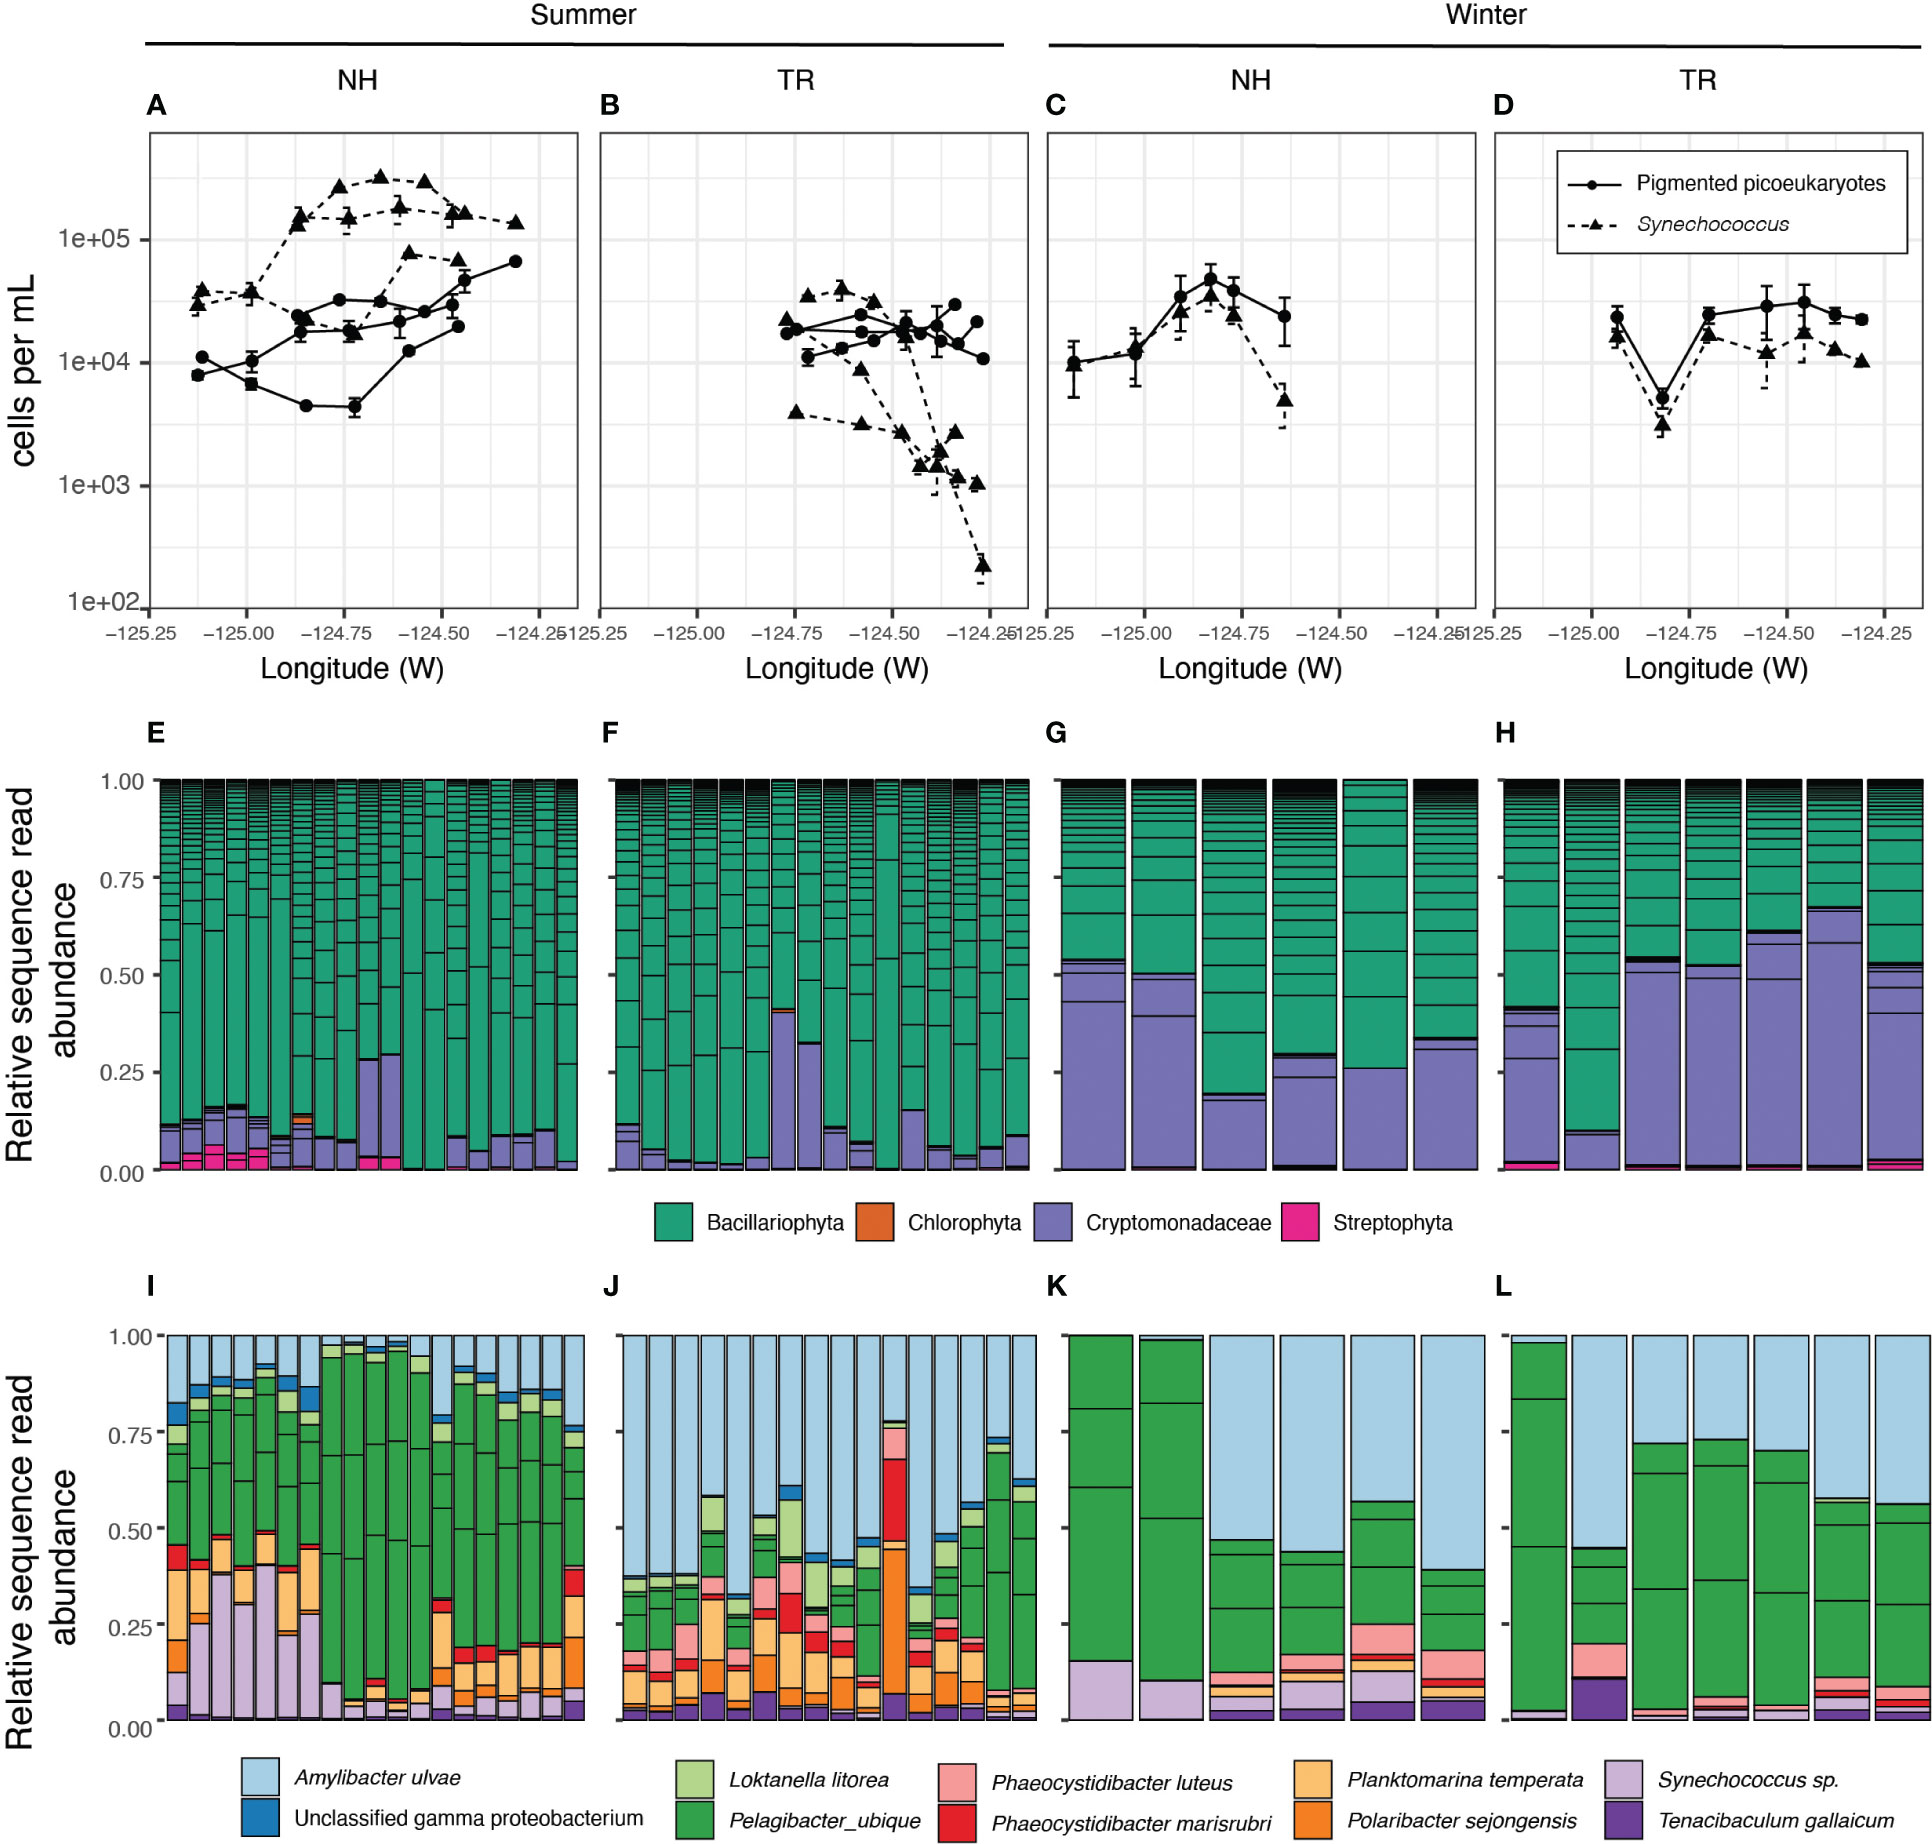
Figure 7 Microbial community composition and abundances. Abundance per volume of photosynthetic picoeukaryotes (PPE) and Synechococcus (Syn) along transects as determined by flow cytometry. (A–D). Relative abundance and Genus-level identity of eukaryotic phytoplankton, detected by their chloroplast sequences. Each column is an individual sample and the color of the bars correspond to phytoplankton classifications (E–H). Columns are ordered East - West in accordance with the x-axis in the panel above. The most abundant amplicon sequence variants in the 0.2-1.6 µm size fraction (I–L). Each column is an individual sample (ordered East - West). For E-H, boxes within each column represent unique ASVs that belong to that sample (column) or taxonomic group (color).
Phytoplankton community structure and abundances showed substantial differences between the transects and seasons. During winter, picoeukaryotes and Synechococcus were at similar abundances on both transects with little change between on- and offshore environments (Figures 7A-D). In contrast, during summers, Synechococcus exceeded picoeukaryote counts by an order of magnitude on the NH line, but fell below the picoeukaryotes along the TR line, displaying a sharp decline at nearshore stations (Figure 7), coincident with increased nutrient concentrations from recently upwelled water (Supplementary Material Figure S2). While most eukaryotic phytoplankton were diatoms in summer along both transects, in winter the cryptophytes reached similar relative abundances as diatoms on both transects (Figures 7E-H).
The prokaryote community (0.2-1.6 µm) at the study sites displayed significant patterns with regard to season and transect. Bray-Curtis dissimilarity measures indicated that the microbial community beta diversity (i.e. community structure) was significantly different between the two transect lines in summer, but was similar to each other in winter (Supplementary Material Figure S4). Specific taxa underlying these community-wide patterns included Pelagibacter (SAR11) and Amylibacter (Figures 7I-L). In winter, the TR and NH lines were similar in the balance of Pelagibacter and Amylibacter relative abundances. In contrast, the summer microbial communities of the two transects diverged. NH was dominated by Pelagibacter, while TR was dominated by Amylibacter.
3.2 On-shelf/off-shelf plankton community structure
Co-occurrences among taxa ranged from strongly negatively correlated at -1 to strongly positively correlated at +1, with substantial intra-, and inter- taxon variation (Figures 8, 9). Mean co-occurrences of all taxa differed significantly between on-shelf and off-shelf (Wilcoxon Rank Sum test, all combinations p< 0.0001, except winter of 2019 at TR) and these on-shelf/off-shelf patterns differed between the NH and TR lines (Figures 8, 9). On the NH line, across both seasons and years, correlation coefficients were more positive off-shelf compared to on-shelf, while on the TR line the pattern was more complex. Winter and summer 2018 correlations on the TR line were the opposite of the NH line, with more positive correlations on-shelf relative to off-shelf. In contrast, average TR on- and off-shelf correlations in winter 2019 were virtually indistinguishable, before transitioning in summer 2019 to a pattern similar to the NH line where off-shelf correlations were significantly higher than those on-shelf.
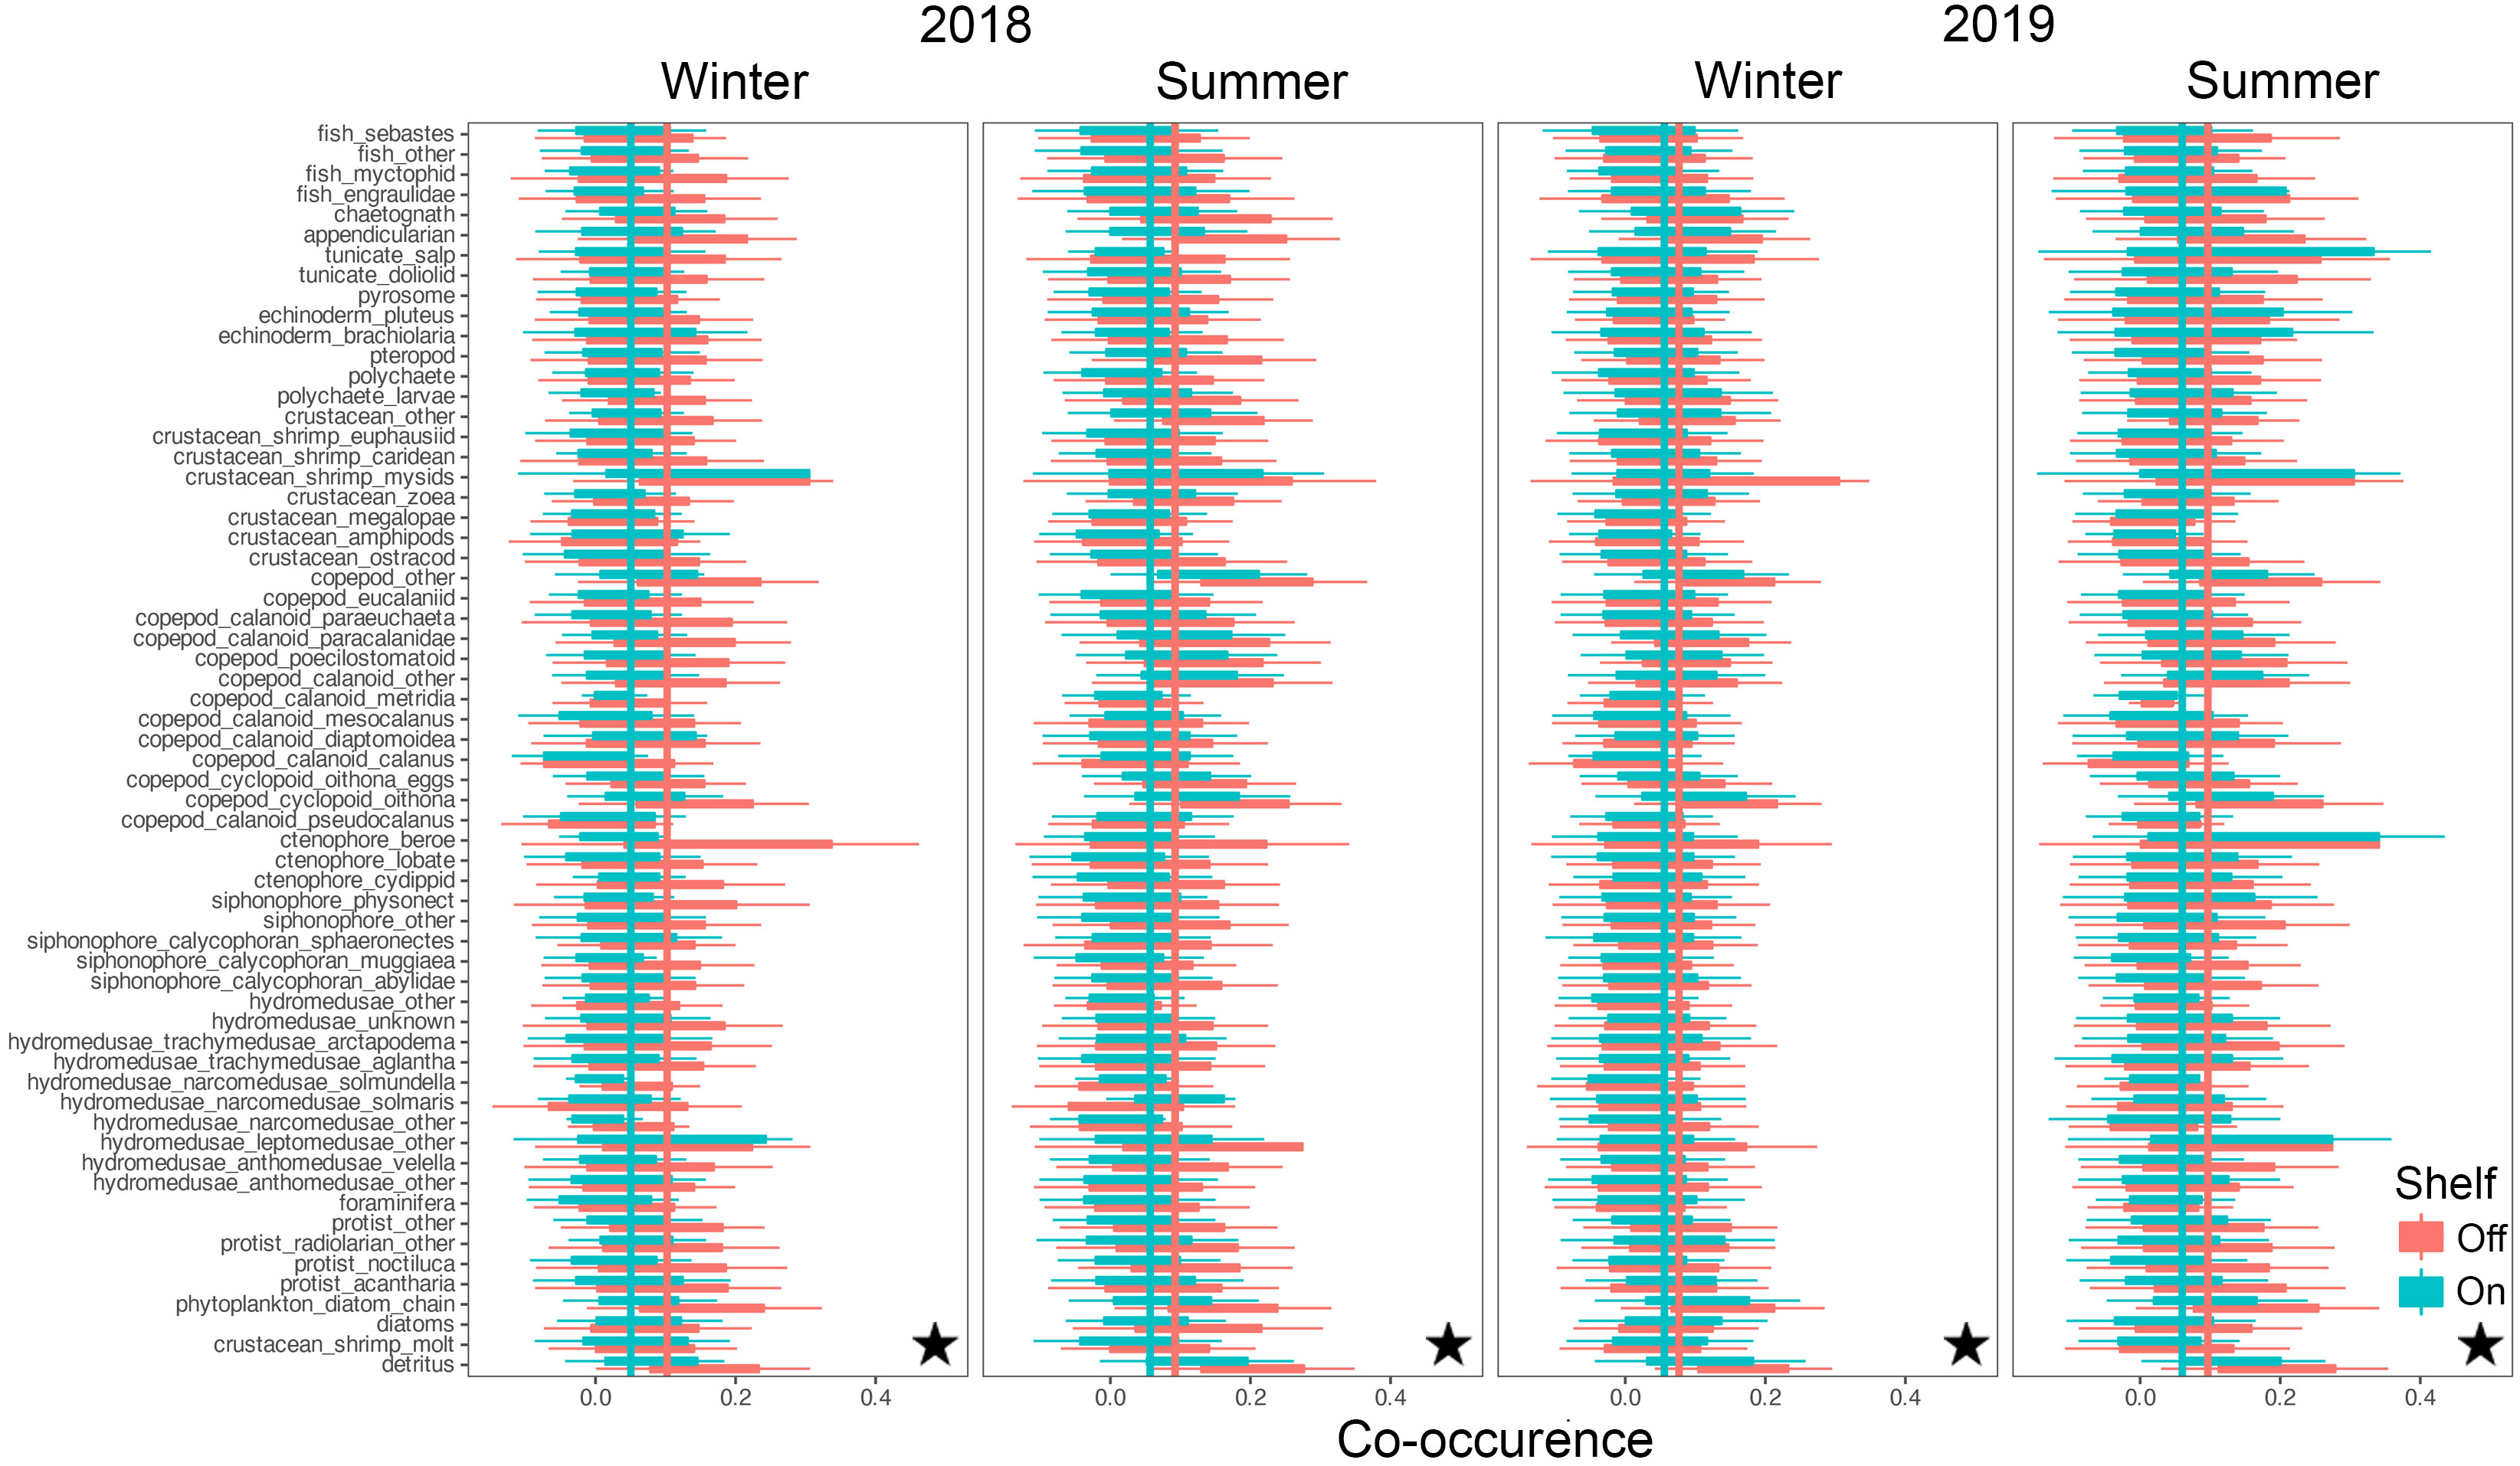
Figure 8 Co-occurrence of plankton taxa (y-axis) with all other taxa on the shelf (green) and off the shelf (red) along the Newport Hydrographic (NH) line. Vertical lines indicate taxa averages of co-occurrence as measured by spatial correlations. Stars indicate significant differences between on-, and off-shelf co-occurrence averages using Wilcoxon Rank Sum tests (p< 0.0001). Boxplots show the median, and hinges the first and third quartiles. Whiskers extend from the hinges to the largest value but no further than 1.5 * interquartile range. Single outlier values have not been included due to adverse effects on figure readability, and do not impact interpretation and calculation of statistics.
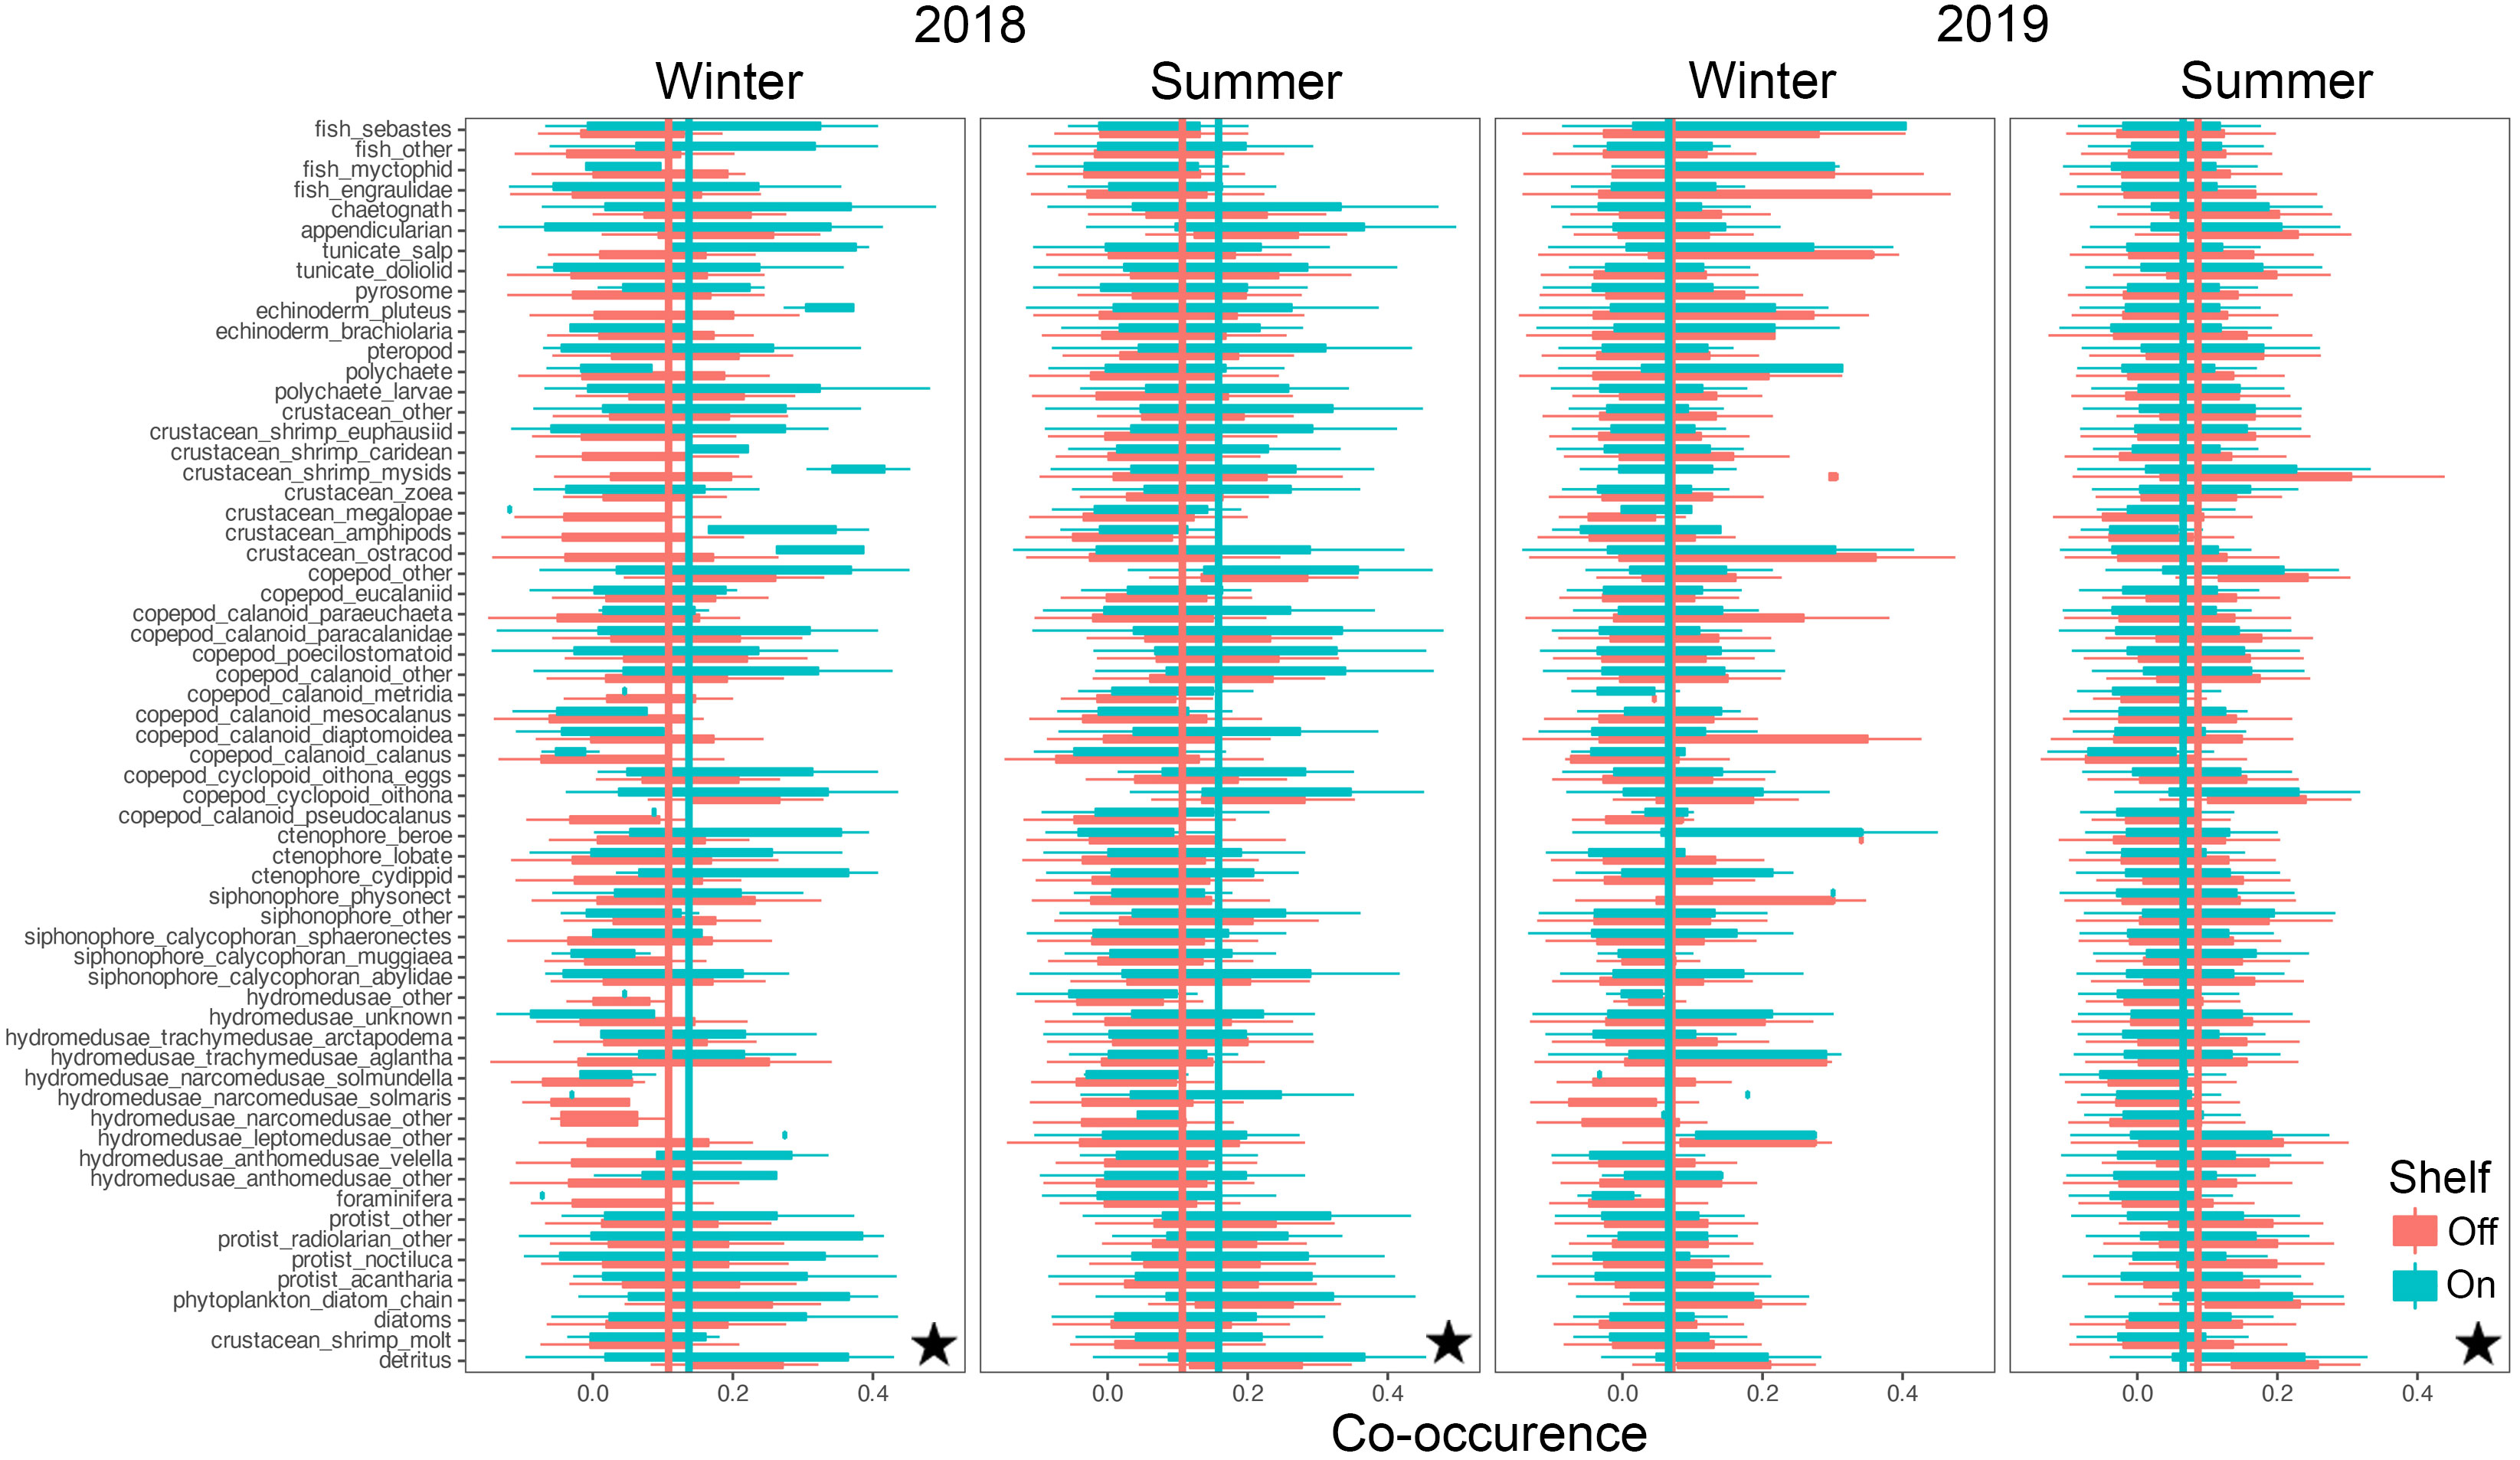
Figure 9 Co-occurrence of plankton taxa (y-axis) with all other taxa on the shelf (green) and off the shelf (red) along the Trinidad Head line. Vertical lines indicate taxa averages of co-occurrence as measured by spatial correlations. Stars indicate significant differences between on-, and off-shelf co-occurrence averages using Wilcoxon Rank Sum tests (p< 0.0001). Boxplots show the median, and hinges the first and third quartiles. Whiskers extend from the hinges to the largest value but no further than 1.5 * interquartile range. Single outlier values have not been included due to adverse effects on figure readability, and do not impact interpretation and calculation of statistics.
Similarly, the coefficients of variation (CVs) around these mean co-occurrences on the NH line were consistently higher on-shelf (> 2) compared to off-shelf (1.5), while on the TR line, the pattern was more complex (Supplementary Material Figure S5). In winter 2018, CVs for both on-shelf and off-shelf correlations on TR were virtually identical, while in summer 2018, the on-shelf CV was lower than off-shelf, before switching to a pattern similar to the NH line in 2019, with higher CVs on-shelf relative to off-shelf. Mean co-occurrence of all taxa as a function of the preceding 10-d cumulative CUTI was significant on the TR Line (Figure 10; analysis of variancet p< 0.001), while on the NH line no such relationship was detected.
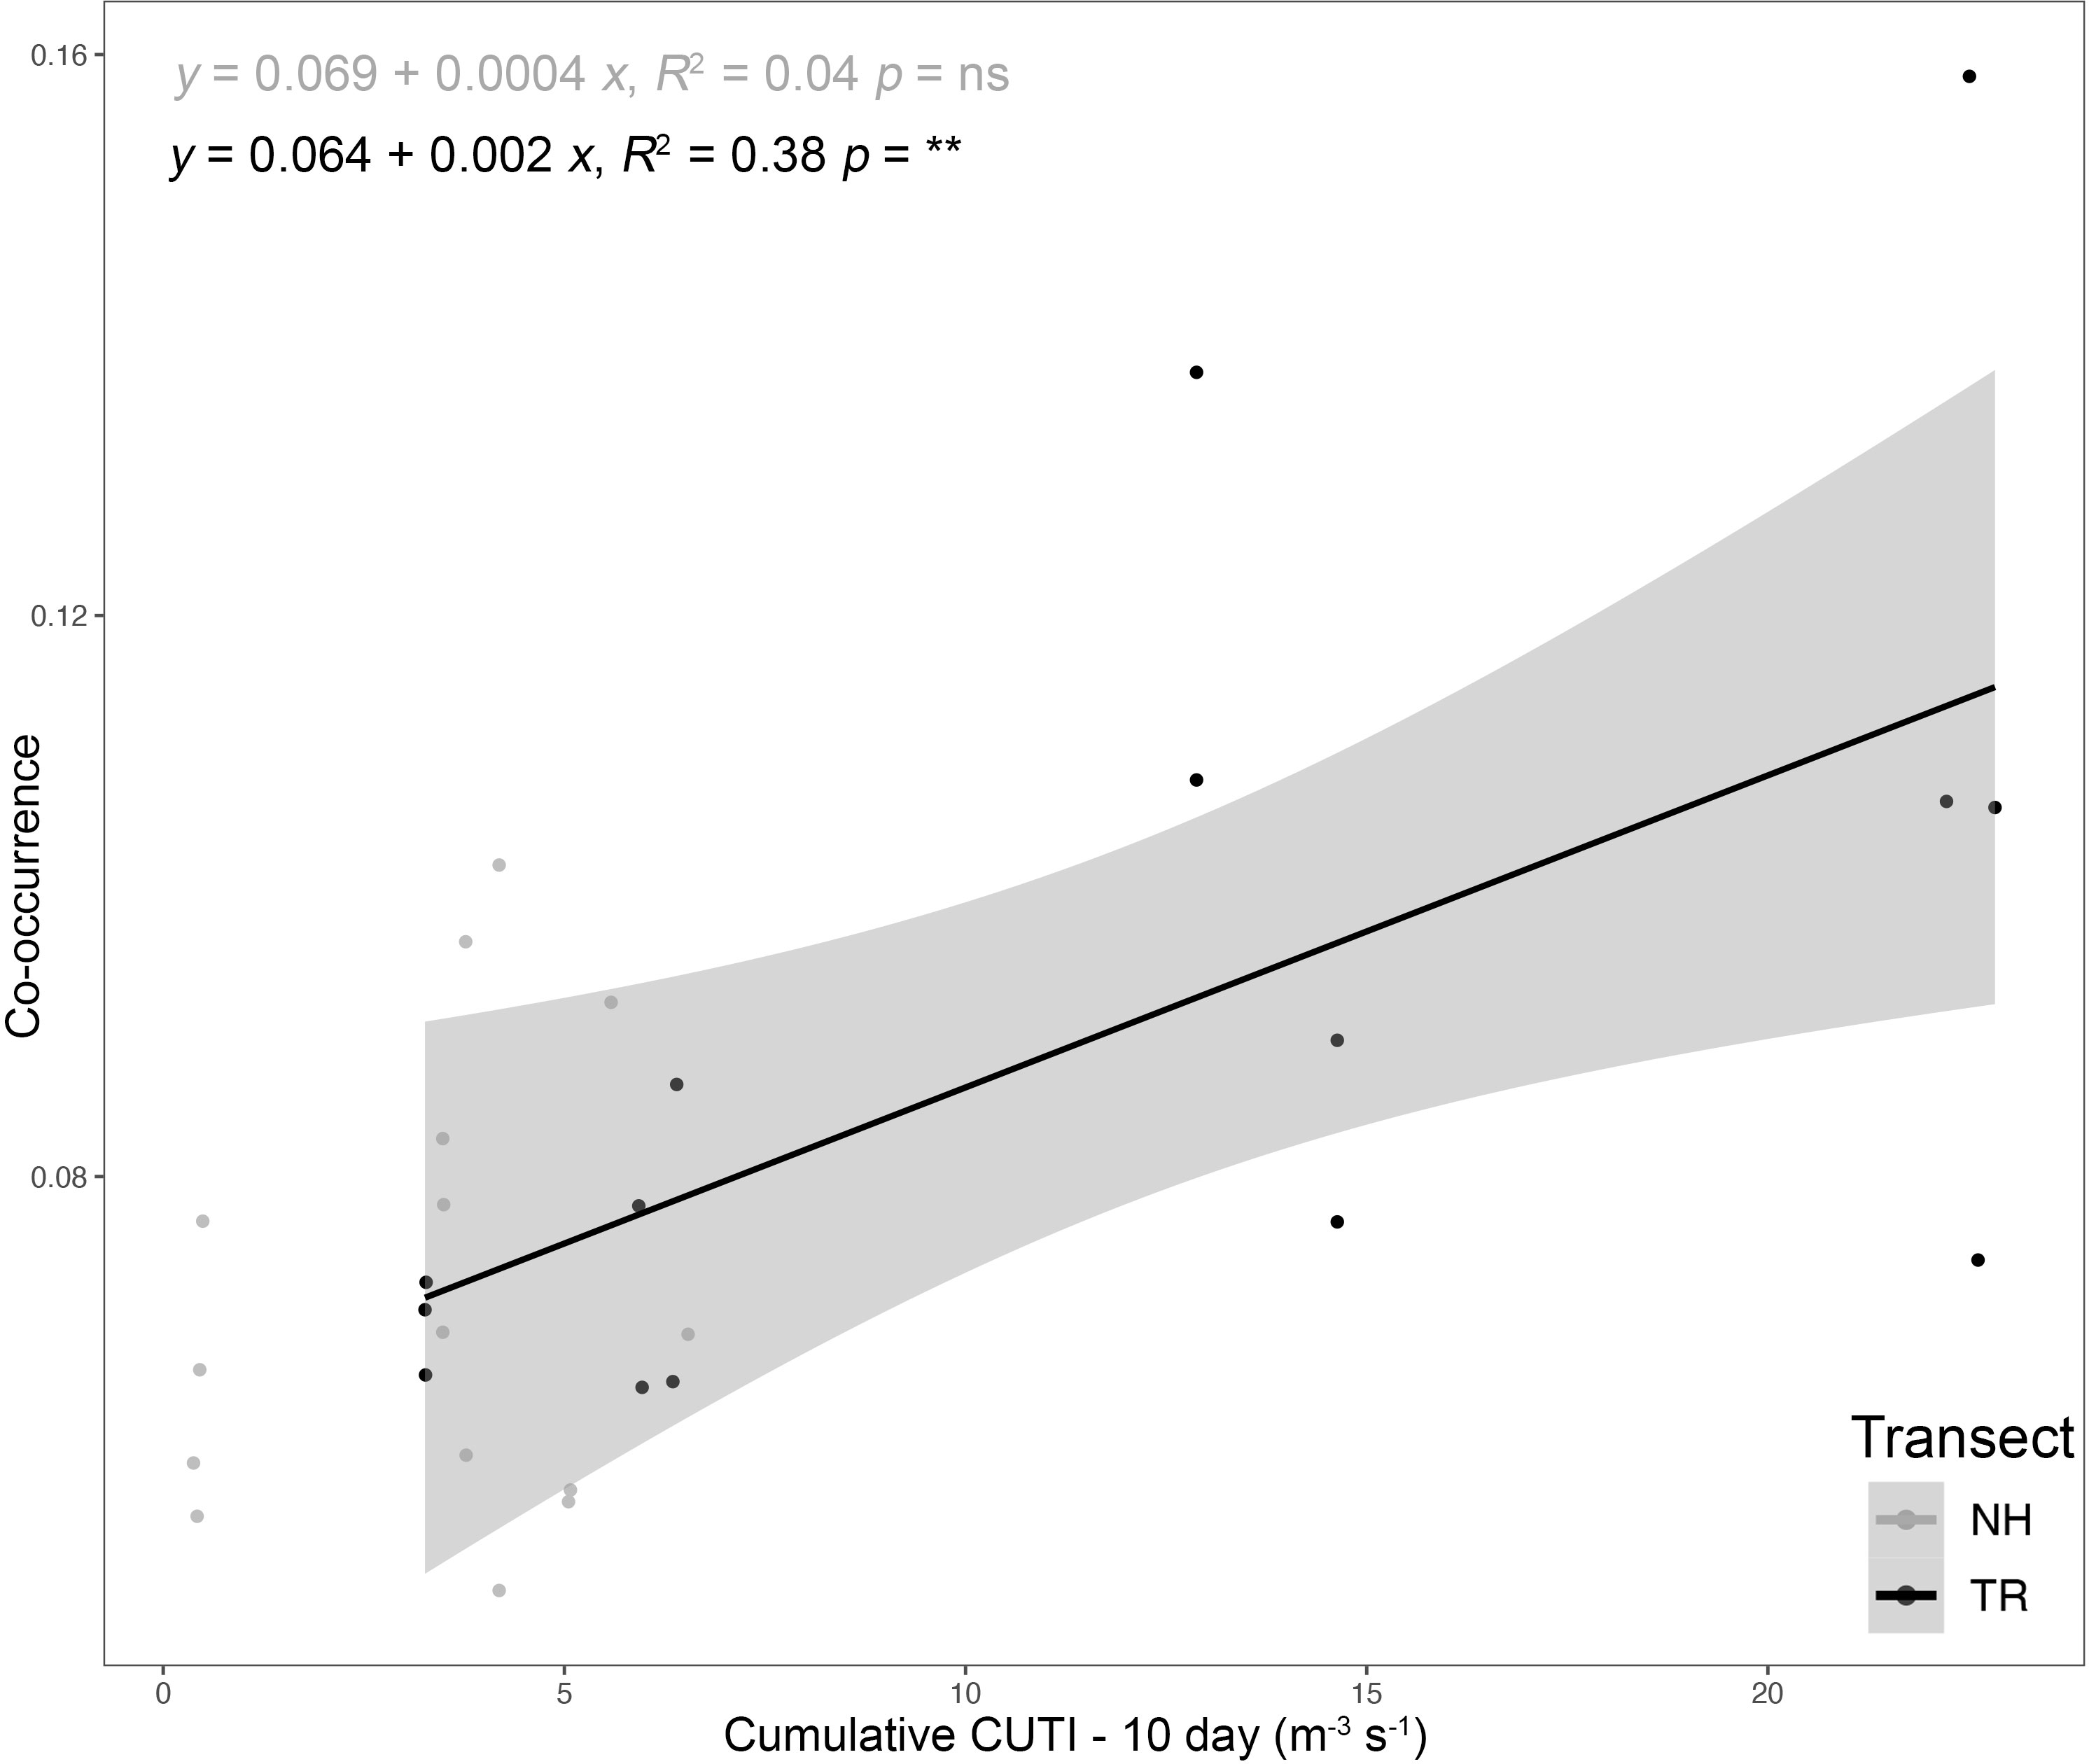
Figure 10 Plankton taxa co-occurrence as a function of the 10-d cumulative Coastal Upwelling Transport Index (CUTI) along the Newport Hydrographic (NH) and Trinidad Head (TR) lines; Analysis of variance (ns = not significant, ** p< 0.001). The shaded area indicates the 95% confidence interval.
3.3 High spatial resolution modeling of environmental drivers of plankton community structure
The two Random Forests (RF) models designed to predict vertically and horizontally stratified taxa co-occurrences based on 76 biotic and abiotic variables (Table 1) explained 42% (NH) and 43% (TR) of the variance. The variables explaining most of the variance per model differed substantially between the two transect locations (Figure 11). On the NH line, sampling depth was the most important predictor, followed by the binary on-shelf/off-shelf variable, temperature, density, the distance along the transect (i.e., how far offshore sampling occurred), and salinity (Figure 11). These abiotic variables were followed by taxa concentrations of Oithona sp. copepods, appendicularians, other small copepods, and protists. On the TR line, the binary year variable (2018/2019) was the most important predictor, followed by the 10-d cumulative CUTI, the binary shelf indicator, sampling depth, the distance along the transect, oxygen, density, temperature, chl a, and salinity (Figure 11).
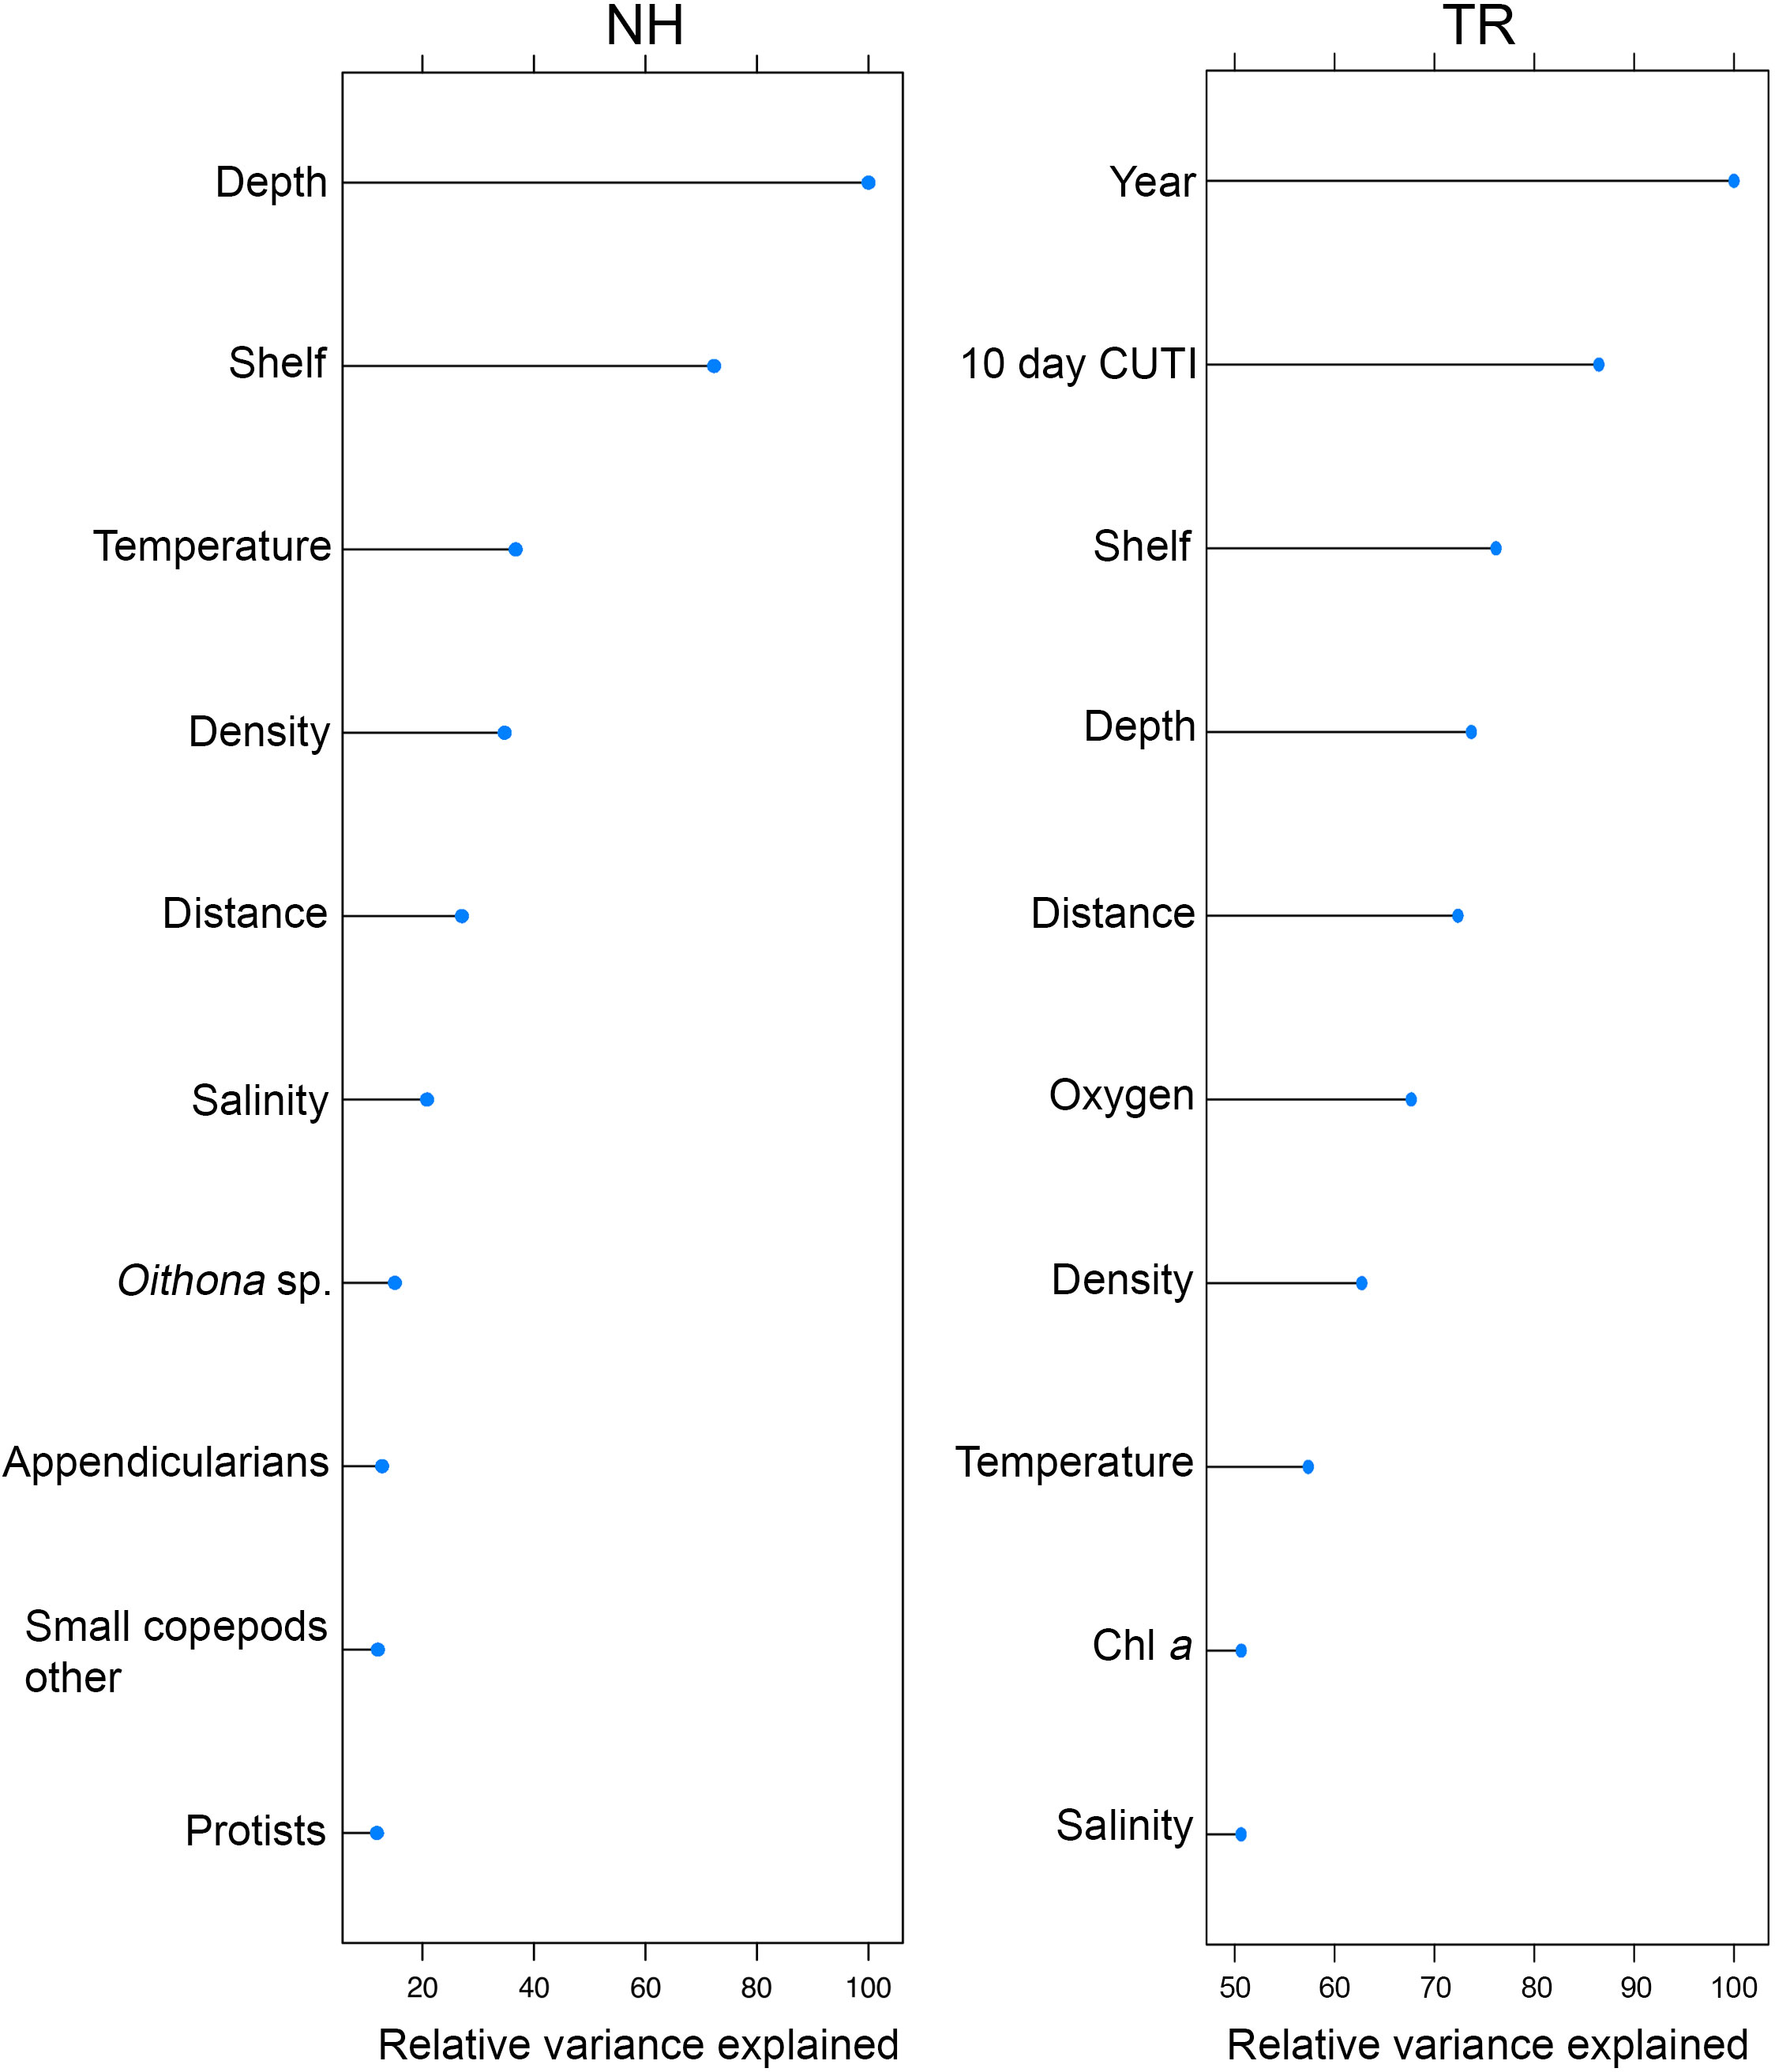
Figure 11 Top ten variables in the Random Forests models of plankton cooccurrence at the Newport Hydrographic (NH) and Trinidad Head (TR) lines, ordered by relative variance explained (variance scaled to 100% based on the most important variable).
On the NH line, a deeper sampling depth (> 85 m) led to a substantially higher chance of co-occurrence than in shallower water, while on-shelf generally predicted lower co-occurrences (Figure 12). Temperature followed a gradual pattern where warmer temperatures predicted higher co-occurrence values. Density and salinity effects were similar in that the lowest densities and salinities led to the lowest co-occurrence and vice versa. Distance along the transect indicated that locations farther offshore predicted higher co-occurrences compared to inshore locations. Concentrations of Oithona copepods, appendicularians, other small copepods, and protists had similar effects in that their lowest concentrations predicted the least likely co-occurrence, followed by a rise in predicted co-occurrence as taxa concentrations increased. Protists showed the strongest such effect whereby a steady increase in protist concentrations led to the fastest increase in predicted co-occurrence, matched only by sampling depth.
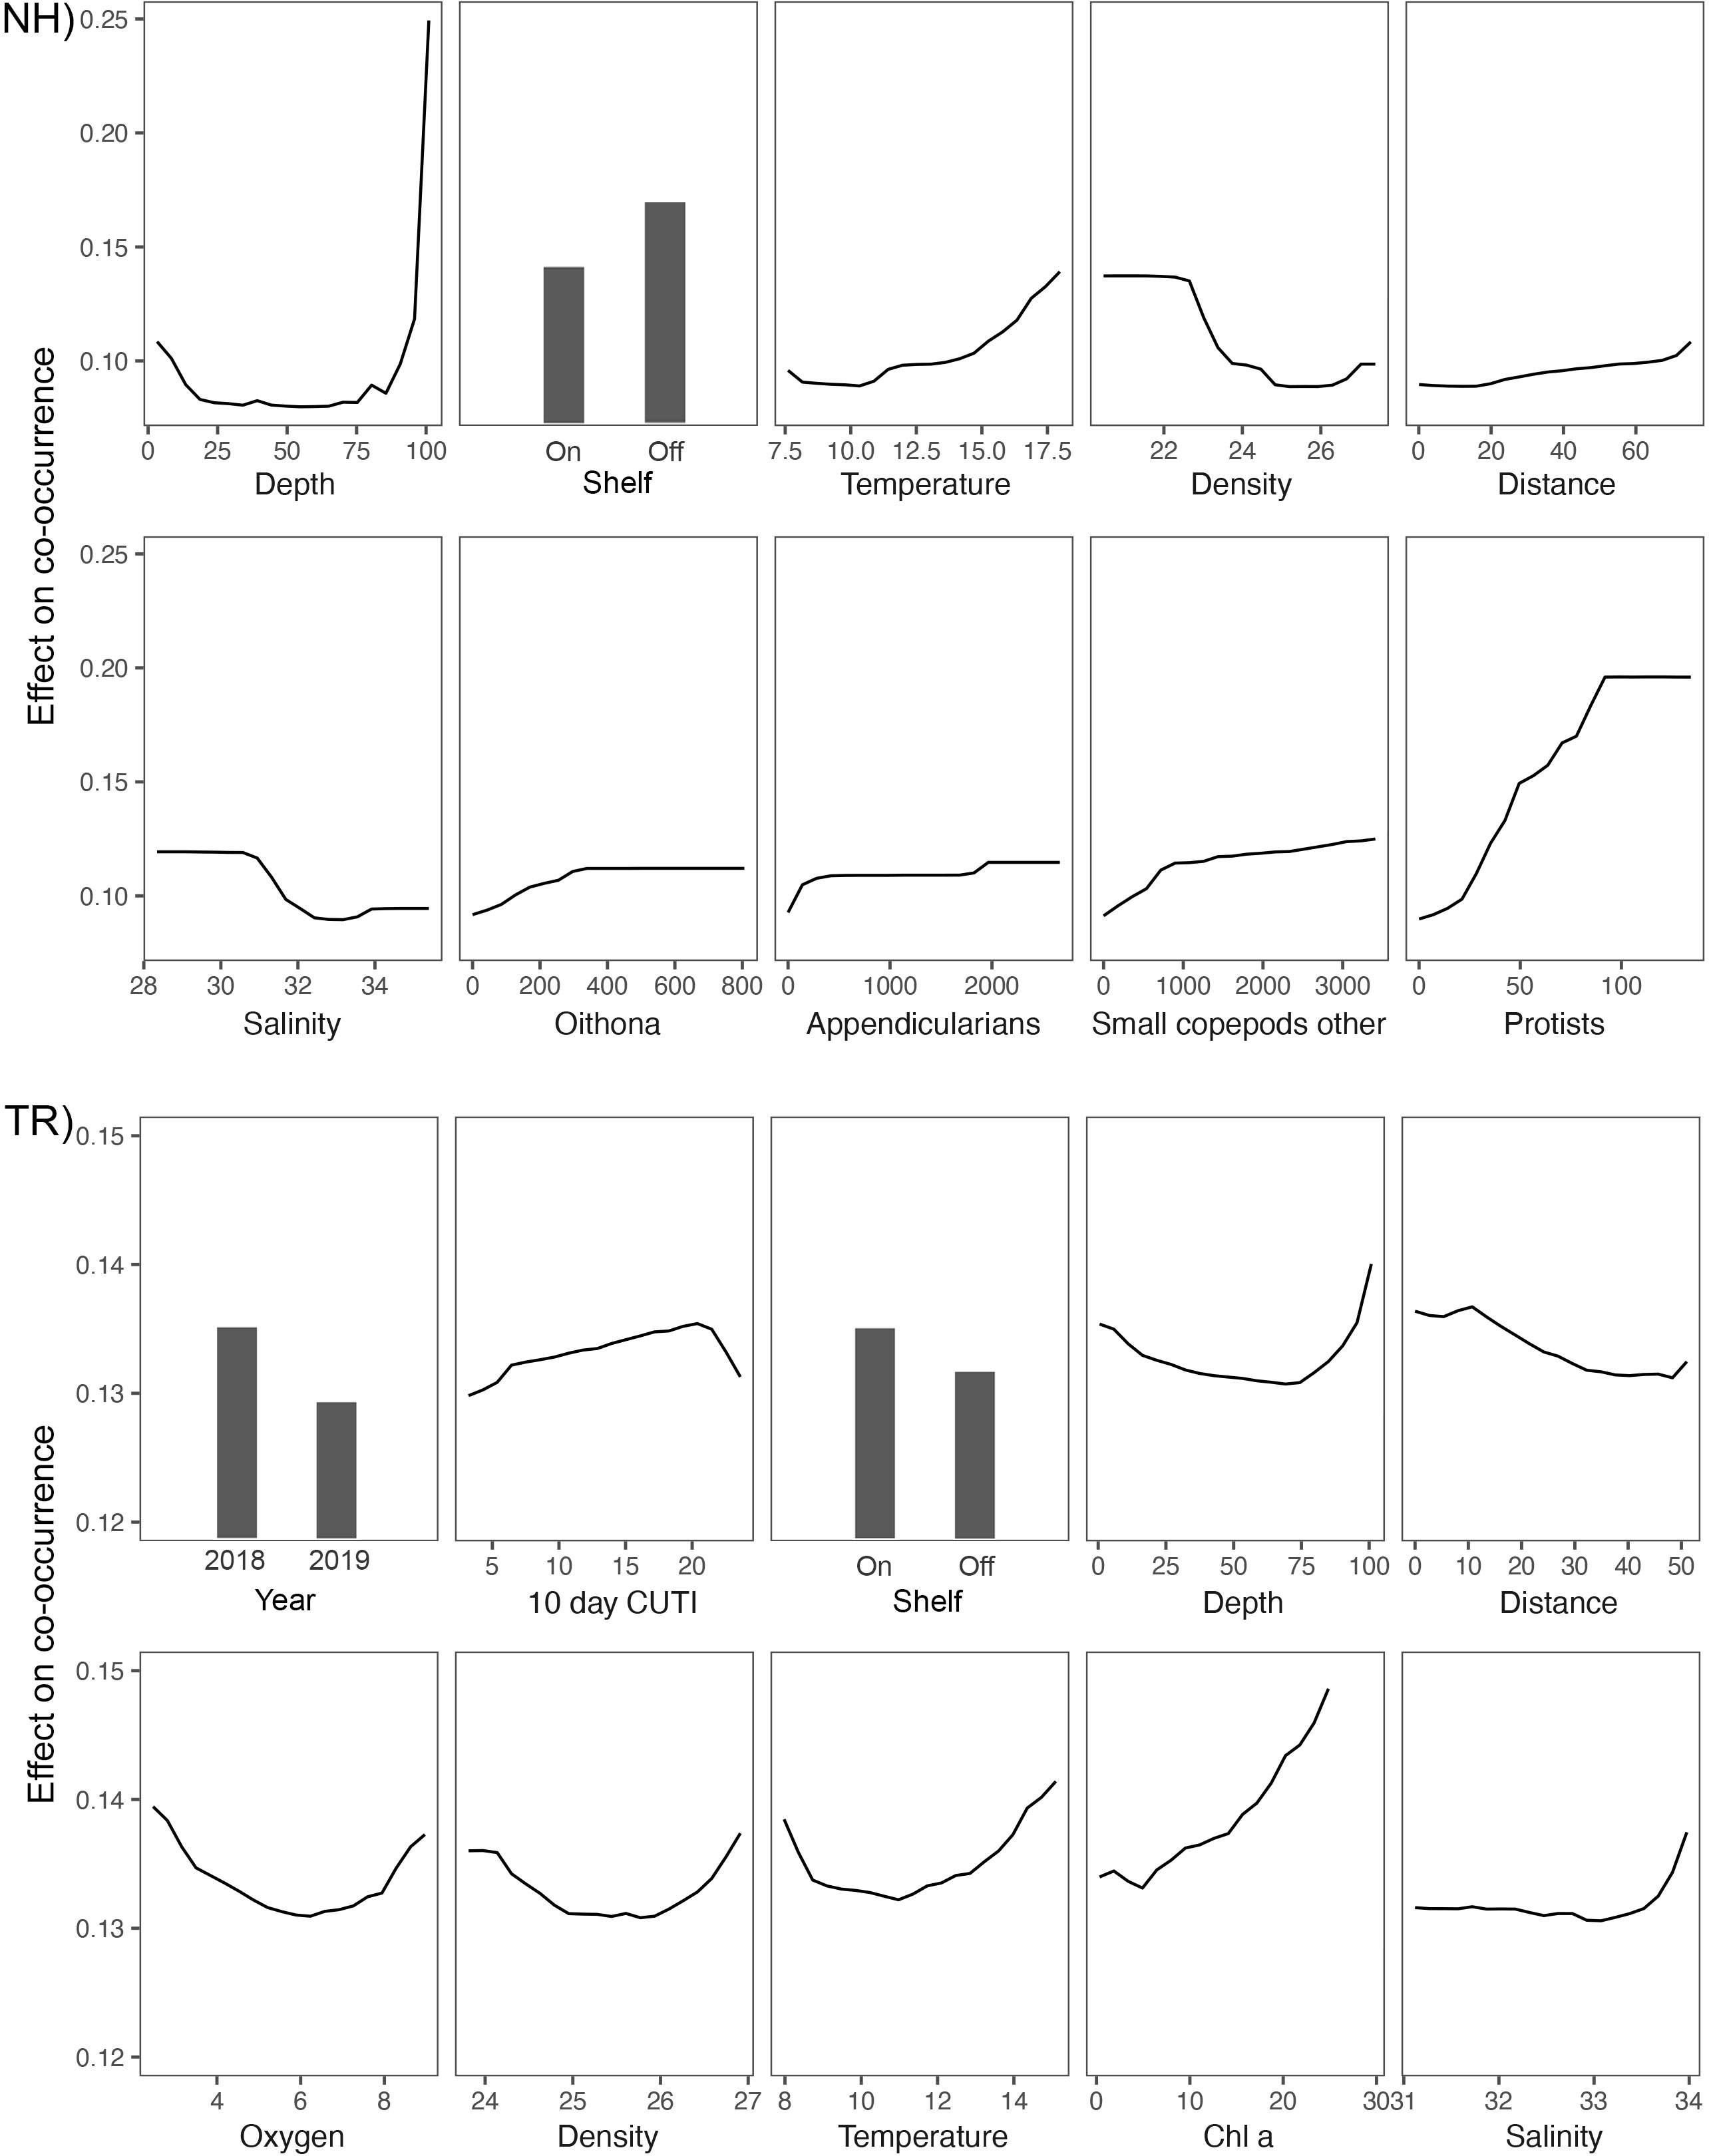
Figure 12 Partial dependence plots for the top 10 most important variables in the Random Forests models of plankton co-occurrence on the Newport Hydrographic (NH) and Trinidad Head (TR) lines. Note the differing y-axis scale between NH and TR.
On the TR line, 2018 data were a good predictor of higher co-occurrence, while 2019 data led to lower values (Figure 12). The 10-d cumulative CUTI was an important predictor and increasing CUTI values led to higher predicted co-occurrence until a CUTI of ~20 m-3 s-1, after which the predicted co-occurrence dropped (Figure 12). Notable differences between the TR and NH lines were that the shelf variable in the TR model showed that higher co-occurrence was predicted at on-shelf locations, which was followed by the distance variable that showed a decline in the predicted co-occurrence going from nearshore to offshore. While the depth variable on the TR line also showed the highest predicted co-occurrence at 100m depth, the range of the predicted co-occurrences was substantially narrower than that on the NH line. Oxygen, density, and temperature partial effects plots had a very similar pattern between locations: the lowest and highest values generally led to the highest predicted co-occurrence. The positive effect of Chl a on the co-occurrence of taxa increased steadily across the spectrum of chl a values (>20 μg l-1). The salinity partial effects profile differed substantially between locations: in contrast to the NH line, the highest salinities on the TR line were good predictors of higher taxa co-occurrence.
4 Discussion
4.1 Plankton community structure in the Northern California Current
The northern California Current (NCC) as an Eastern Boundary Upwelling System is characterized by strong, but intermittent upwelling, a typically short food web, and subsequently high fisheries biomass (Ryther, 1969; Pauly and Christensen, 1995; Rykaczewski and Checkley, 2008). While plankton community structure in the NCC has received much attention over the last decades (Peterson and Keister, 2003; Peterson et al., 2014; Peterson et al., 2017; Brodeur et al., 2019; Weber et al., 2021; Thompson et al., 2022), we still lack a comprehensive understanding of how plankton community structure responds to changing environmental conditions. Our high-resolution imaging of the water column at two locations in the NCC that differ in their scale and continuity of upwelling, together with the characterization of the microbial community from discrete water samples, enabled us to tease apart the relationships of new and recycled production (i.e., microbial loop) and plankton community structure. By simultaneously sampling a wide range of organisms including prokaryotes, protists, phytoplankton, zooplankton, and fragile gelatinous plankton, in situ plankton imaging can bridge the sampling gap in studying the microbial and new production driven components of the plankton (Biard et al., 2016; Briseño-Avena et al., 2020; Schmid et al., 2020).
Using plankton co-occurrence as a proxy for community structure (Reese and Brodeur, 2006; Brodeur et al., 2008; Sildever et al., 2021; Costas-Selas et al., 2022), we condensed >2000 high resolution taxa distribution profiles into a unified community approach. Plankton community structure differed substantially between the two sampled locations situated in their two respective upwelling regimes (i.e., NH with intermittent upwelling and TR with more continuous upwelling). TR plankton co-occurrences in 2018 were higher nearshore relative to offshore, consistent with the expectations for a nearshore upwelling system where new productivity is fueled by nutrients brought to the euphotic zone (Barth et al., 2007; Bograd et al., 2009; Jacox et al., 2018). This upwelling triggers a trophic cascade through feeding and species interactions that is reflected in the tight spatial coupling of taxa and co-occurrence. However, TR plankton co-occurrences in 2019 differed from this pattern, likely induced by much lower upwelling and hence nutrients and chl a in 2019. In sharp contrast to TR, plankton co-occurrence at NH was consistently higher in more oligotrophic Synechococcus and Pelagibacter dominated off-shelf waters relative to on-shelf waters. This pattern at NH remained consistent across years and seasons, despite the lower upwelling in 2019, and suggests that in intermittent upwelling systems, complex microbial-dominated waters rely less on upwelled nutrients and more on recycled nutrients and are more conducive to a temporally stable plankton community structure than more upwelling-reliant nearshore habitats. Flow cytometry indicated that large eukaryotic phytoplankton dominated at inshore TR stations, suggesting new production.
The relative importance of the microbial loop was highlighted by the high spatial resolution modeling of plankton co-occurrences. Among the variables explaining the most variance in taxa co-occurrence on the NH line over time were concentrations of several non-microbial plankton taxa associated with the microbial loop. Oithona sp copepods are small, ubiquitous cyclopoid copepods that are closely linked to the microbial loop through feeding on protozooplankton such as ciliates and dinoflagellates (Atienza et al., 2006; Zamora-Terol et al., 2014). Appendicularians similarly feed on the very small constituents of the microbial loop - down to picoplankton sizes - (Gorsky and Fenaux, 1998; Sutherland et al., 2010; Sutherland and Thompson, 2022) by using specialized feeding-filters (Conley and Sutherland, 2017). Appendicularians can be extremely abundant – we measured dense patches of >10,000 ind. m-3 on the TR line – and are important prey for numerous taxa, including copepods, chaetognaths, ctenophores, and larval to small adult fishes (Gorsky and Fenaux, 1998; Purcell et al., 2005; Jaspers et al., 2023). Being a key driver of plankton community structure on the NH line, while also accumulating in dense patches on the TR line, the presence of appendicularians indicates the constant underlying activity of the microbial loop. A key feature of appendicularians are their mucous houses that are discarded regularly and contribute significantly to vertical ocean carbon flux (Alldredge, 1976; Sato et al., 2003; Luo et al., 2022; Jaspers et al., 2023). The high importance of appendicularians in contributing to plankton community structure in intermittent upwelling systems further advances the body of literature emphasizing the often-overlooked importance of gelatinous plankton, and specifically, appendicularians. Protists are the prototypical constituent of the microbial loop (Azam et al., 1983; Williams et al., 2019; Glibert and Mitra, 2022) and their importance in generating plankton community structure at NH is not only a robust confirmation of high microbial loop activity but may also reflect the consumption of protists by appendicularians and Oithona copepods. These faunal patterns are consistent with the importance of sampling depth and the on-shelf/off-shelf variable in the NH co-occurrence model, as deeper off-shelf waters tend to be more oligotrophic and favorable for heightened microbial activity (Azam et al., 1983; Williams et al., 2019; Glibert and Mitra, 2022). In contrast to the variables influencing plankton community structure at NH, variation in plankton co-occurrences at TR was influenced most strongly by upwelling and chl a, both indicative of a system dominated by new productivity with relatively reduced importance of the microbial loop, and generally shorter trophic pathways (Rykaczewski and Checkley, 2008; Jacox et al., 2018).Differences in microbial community structure between the continuous and intermittent upwelling transects are consistent with this idea, as the phylogeny of marine bacteria is a strong predictor of functional traits (Martiny et al., 2013). In the intermittent upwelling system (NH), the microbial community was dominated by small and numerous cells including the cyanobacterium Synechococcus and heterotroph Pelagibacter. Both taxa thrive in relatively low nutrient environments and rely on complex biological interactions within the microbial loop (Apple et al., 2011; Braakman et al., 2017), including mixotrophy for Synechococcus (Muñoz-Marín et al., 2020). Pelagibacter, in particular, is known for the unusual variety of required nutrients and compounds it can metabolize, many of which are derived from complex interactions with other marine microbes (Giovannoni, 2017). Such complexity in dissolved organic carbon resources is expected to arise in a stable and highly diverse microbial system such as the intermittent upwelling system of the NH line. In contrast, the TR line was dominated by Amylibacter, which has been associated with recently upwelled water in other oceanic systems (Joglar et al., 2021). This work suggests that taxa such as protists, Oithona copepods, and appendicularians may connect a diverse and functionally redundant microbial community to a stable plankton community structure.
While the positive effect of chl a on predicted plankton co-occurrence increased almost linearly across the range of observed chl a values, predicted co-occurrence increased with the cumulative 10-d CUTI only up to a value of ~20 m-3 s-1 before dropping off. This non-linear relationship may be due to an imbalance of upwelling and relaxation events whereby too much and continuous upwelling led to advective loss of plankton off the shelf (Largier et al., 2006; Kudela et al., 2008). Sampling year was also an important driver on the TR line where both upwelling strength and chl a were much higher in 2018 compared to 2019. Northern California upwelling and chl a levels in 2018 and 2019 have been reported as average and slightly below average, respectively (Thompson et al., 2018; Thompson et al., 2019); however, the cumulative CUTI during the times when we sampled revealed larger differences. At TR, cumulative CUTI was much higher in 2018 (winter = 13.8 m-3 s-1; summer = 22.3 m-3 s-1) relative to 2019 (winter = 3.3 m-3 s-1; summer = 6.2 m-3 s-1). This interannual difference in CUTI likely also led to the much higher chl a levels observed in 2018 relative to 2019 (> 45 μg l-1 in 2018 vs 7.5 μg l-1 in 2019). These differences help to put into context longer term averages of upwelling intensity that can be used for general characterizations of the ecosystem, with shorter term averages and cumulative indices that can be proxies for conditions favorable for productivity and for inducing change in plankton structure. Considering that CUTI and chl a were both important predictors in the TR model, these large differences between 2018 and 2019 likely explain why the ‘year’ variable was also important and why 2018 predicted higher co-occurrences. Other variables that were important in driving plankton co-occurrences on the TR and NH lines were temperature and oxygen. Both are key drivers in structuring pelagic plankton ecosystems, through physiological effects that can impact predator-prey interactions, as well as physical discontinuities than can constrain plankton movement (Rutherford et al., 1999; Rebstock, 2003; Brodeur et al., 2019). Temperature and oxygen are also two of the variables most affected by climate change (Chan et al., 2019; Bograd et al., 2022; Smith et al., 2022).
In a strong (i.e., continuous) upwelling environment (TR), a reduction in upwelling and resulting lower chl a led to a reversal of the prevailing on-shelf/off-shelf pattern of co-occurrence, while in an already lower upwelling strength environment (i.e., intermittent upwelling regime; NH), a further reduction of upwelling led to little change in on-shelf/off-shelf co-occurrence patterns. The larger effect on plankton co-occurrences in the strong upwelling environment is consistent with the expectation that the established trophic web is reliant on the input of nutrients through upwelling and subsequent phytoplankton blooms (Barth et al., 2007; Bograd et al., 2009; Jacox et al., 2018). In an intermittent upwelling environment (NH), where we found several microbial loop associated taxa to be important in predicting co-occurrences, the established trophic web (including a protist - Oithona - appendicularian link is less reliant on nutrient input from upwelling. A parallel situation exists for the microbial community as the prevalence of Synechococcus and Pelagibacter suggest the community is built on carbon input from complex microbial sources (Azam et al., 1983; Williams et al., 2019), thus a further reduction in upwelling would be expected to have a smaller effect.
The microbial loop is an important part of many marine ecosystems (Wilkerson et al., 1987; Taylor and Landry, 2018; Williams et al., 2019; Thompson et al., 2021; Glibert and Mitra, 2022). Recent establishment of the mixoplankton paradigm—ubiquitous microbes that survive on phototrophy and phagotrophy synergistically—has had far reaching ripple effects (Flynn et al., 2019; Glibert and Mitra, 2022). For our study, at least the ubiquitous Synechococcus is a recognized mixotroph (Muñoz-Marín et al., 2020). Long considered minor players, mixotrophs are now known to comprise large parts of the microbial loop and are of high importance in the global plankton trophic web. Nonetheless, the role of the microbial loop in shaping overall plankton community structure, particularly in the context of variable environmental conditions, is not well understood. Several comparative studies have investigated the relative carbon contributions of broad taxa to new productivity and the microbial loop (Tilstone et al., 1999; Vargas et al., 2007; Landry et al., 2012; Taylor et al., 2015). For example, in a productive coastal upwelling region in the Humboldt Current, the microbial loop was found to channel a large portion of the energy flow, while new productivity contributed only a small portion of the transferred carbon (Vargas et al., 2007). Complexities of nutrient-plankton interactions, including the microbial loop, are often not well represented in models, and need refining, especially with regard to adequately including mixotrophy (Millette et al., 2023; Ratnarajah et al., 2023). Updating these models becomes especially urgent in the uncertain future ocean.
Our holistic analysis of the NCC ecosystem spanning a wide size range demonstrates that the role of the microbial loop in driving mesoplankton community structure is more evident in intermittent upwelling regimes relative to continuous upwelling regions. This finding was further supported with analyses of the underlying microbial community. While areas dominated by upwelling and high nutrient input also include microbial constituents, new productivity plays a larger role in structuring the plankton community. Here, large changes in upwelling result in sharp spatial changes to plankton community structure. In intermittent or low upwelling areas, microbial community constituents are more important drivers of overall plankton community structure, resulting in a more temporally stable plankton community structure, even in the face of changes to upwelling strength.
4.2 Plankton community structure under future climate change
Recently, marine heatwaves have disrupted the NCC, affecting multiple trophic levels (Cavole et al., 2016; Oliver et al., 2018; Fennie et al., 2023) and reducing biodiversity on basin scales (Smale et al., 2019; Smith et al., 2022). Unfortunately, such extreme events are predicted to become more prevalent in the future (Jacox et al., 2022). Marine heatwaves can lead to changes in plankton and nekton community structure (Brodeur et al., 2019) and to die-offs in seabirds, marine mammals, and kelp (Smith et al., 2022). Simultaneously, deeper and stronger stratification will result in lower nutrient supply to surface waters, with a resulting impact on food web structure—i.e., a shift to smaller plankters that rely to a greater extent on microbial-based nutrient recycling (Behrenfeld and Boss, 2013)—generating longer, less-efficient food chains. Meanwhile, changing wind patterns are projected to intensify upwelling in the NCC, and to decrease upwelling-favorable winds in the central and southern California Current Ecosystem (Buil et al., 2021). Our findings suggest that wind-related shifts in intermittent and continuous upwelling regimes, will likely transition to a plankton community structure that is driven more by microbial loop constituents, and current intermittent upwelling regions will likely transition to systems dominated by new productivity. Such fundamental changes would likely have important consequences for energy transport through the trophic web to top predators and fisheries.
4.3 Lessons learned, limitations, and future outlook
Our integrative approach allowed us to uncover ecologically important patterns emerging from changes in upwelling strength. Combining underwater imaging and machine learning enabled us to determine concentrations for all planktonic taxa in the system between 250 µm and 15 cm in size. Further combination of these data with gene sequencing for microbial taxa enabled us to encompass a very wide range of taxa and examine overall system processes. This level of analysis is critical given the magnitude of interconnectivity among the different taxa and trophic levels, and the complexity of emerging plankton-plankton interactions. The very high spatial resolution of our sampling may be especially important in identifying biodiversity hotspots and refugia for different taxa, particularly in relation to evolving threats such as hypoxic waters. Underwater imaging thus has the potential to enable more effective resource management decision making. Such high resolution imaging also generates new data layers that can be incorporated into ecosystem modeling. While exploring these potential avenues was beyond the scope of this study, we note that these can be powerful tools. In addition to determining taxa concentrations from images, the images themselves can be used for individual level studies (e.g., measurement of distance and nearest neighbors for predators and prey, behavioral traits such as tentacle positions of jellyfish that can indicate feeding, appendicularians with their mucus house vs without for carbon studies, and more). In the present study, we faced the challenge of spatial integration of microbial community data with the higher resolution imaging. In future studies this could be overcome by combining underwater imaging of mesozooplankton with continuous flow cytometry (Ribalet et al., 2019; Breier et al., 2020; Fowler et al., 2020). Further, instrumentation for sampling microbial cells 2 - 30 µm in size is not readily available – though work to address this challenge is currently underway in the microbial imaging community.
5 Conclusions
Collection and analysis of a vast dataset of in situ underwater plankton imagery (>1.1 billion plankton images) in the context of oceanographic conditions and microbial community structure revealed substantial differences in the way that plankton community structure is driven under intermittent and continuous upwelling regimes. A reduction of upwelling strength in a continuous upwelling regime induced large scale changes in plankton community structure that affected on-shelf and off-shelf taxa co-occurrences, while in an intermittent upwelling regime, more strongly influenced by microbial loop constituents, a reduction of upwelling strength had little effect on plankton community structure. We thus hypothesize that high microbial loop activity enhances the resilience of plankton community structure to climate change induced shifts in upwelling strength. This concept is consistent with the mixotrophy paradigm in which the base of the microbial loop–the mixotrophs–are better adapted to a changing ocean (e.g., changing nutrient availability) than pure auto-, or heterotrophs, due to their ability to survive on either (Glibert and Mitra, 2022).
Data availability statement
The original contributions presented in the study are publicly available. These data can be found here: NSF BCO-DMO, https://www.bco-dmo.org/project/743417 and the R2R program: https://www.rvdata.us/search/cruise/SKQ201804S, https://www.rvdata.us/search/cruise/SR1810, https://www.rvdata.us/search/cruise/AT42-13, and https://www.rvdata.us/search/cruise/SKQ201903S. Raw sequence data can be accessed from the NCBI Sequence Read Archive at https://www.ncbi.nlm.nih.gov/bioproject/PRJNA999694/. ISIIS underwater imagery is available from the authors upon request.
Ethics statement
The animal study was approved by Oregon State University’s Institutional Animal Care and Use Committee (IACUC). The study was conducted in accordance with the local legislation and institutional requirements.
Author contributions
MSS performed analyses and wrote the initial manuscript; SS, RKC, KRS, and MSS conceptualized hypotheses and research questions; SS, RKC, and KRS designed the study, sampling program, and wrote grant proposals; MSS, RKC, KRS, and AWT collected data; AWT contributed nutrient and microbial community analysis; all authors interpreted the data, discussed the results, contributed to the critical revision of the manuscript and figures, and approved the final version.
Funding
Support for this study was provided by NSF OCE-1737399, NSF OCE-2125407, and NSF XSEDE/ACCESS OCE170012, NSF OCE-1851412 to AT, NSF OCE-2125408 to KRS.
Acknowledgments
We thank our collaborators Chris Sullivan and Dominic Daprano (both at Oregon State University) for invaluable support with processing the vast quantity of data presented here. We also thank Kelsey Swieca and Christian Briseño-Avena for their help creating the sCNN training library. Current and former members of the OSU Plankton Ecology Lab at the Hatfield Marine Science Center helped collect the imagery data presented here on the four cruises, we thank them for their efforts – Jami Ivory, Christian Briseño-Avena, Kelsey Swieca, Miram Gleiber, H. Will Fennie, Megan Wilson, and Keely Axler. We acknowledge the contributions of Andrew Roberts, Beatrice Pickett, Kathleen Kouba, Carey Sweeney, and Melissa Steinman in collecting nutrient and microbial community samples ship-board, processing flow cytometry samples, and preparing sequencing libraries. Project development and field sampling benefited from contributions of collaborators Ric Brodeur and Eric Bjorkstedt. The professionalism of the officers and crews of RV Sikuliaq (Winter 2018 and 2019), RV Sally Ride (Summer 2018) and RV Atlantis (Summer 2019) enabled this project, and we are grateful to them. We thank NSF XSEDE/ACCESS and specifically staff Manu Shantharam at the San Diego Supercomputing Center for his support with classifying the image data presented here.
Conflict of interest
The authors declare that the research was conducted in the absence of any commercial or financial relationships that could be construed as a potential conflict of interest.
Publisher’s note
All claims expressed in this article are solely those of the authors and do not necessarily represent those of their affiliated organizations, or those of the publisher, the editors and the reviewers. Any product that may be evaluated in this article, or claim that may be made by its manufacturer, is not guaranteed or endorsed by the publisher.
Supplementary material
The Supplementary Material for this article can be found online at: https://www.frontiersin.org/articles/10.3389/fmars.2023.1166629/full#supplementary-material
Footnotes
References
Alldredge A. L. (1976). Discarded appendicularian houses as sources of food, surface habitats, and particulate organic matter in planktonic environments. Limnol. Oceanogr. 21, 14–24. doi: 10.4319/lo.1976.21.1.0014
Apple J. K., Strom S. L., Palenik B., Brahamsha B. (2011). Variability in protist grazing and growth on different marine synechococcus isolates. Appl. Environ. Microbiol. 77, 3074–3084. doi: 10.1128/AEM.02241-10
Atienza D., Calbet A., Saiz E., Alcaraz M., Trepat I. (2006). Trophic impact, metabolism, and biogeochemical role of the marine cladoceran Penilia avirostris and the co-dominant copepod Oithona nana in NW Mediterranean coastal waters. Mar. Biol. 150, 221–235. doi: 10.1007/s00227-006-0351-z
Azam F., Fenchel T., Field J., Gray J., Meyer-Reil L., Thingstad F. (1983). The ecological role of water-column microbes in the sea. Mar. Ecol. Prog. Ser. 10, 257–263. doi: 10.3354/meps010257
Bakun A. (1990). Global climate change and intensification of coastal ocean upwelling. Science 247, 198–201. doi: 10.1126/science.247.4939.198
Bakun A., Black B. A., Bograd S. J., García-Reyes M., Miller A. J., Rykaczewski R. R., et al. (2015). Anticipated effects of climate change on coastal upwelling ecosystems. Curr. Clim. Change Rep. 1, 85–93. doi: 10.1007/s40641-015-0008-4
Bakun A., Nelson C. S. (1991). ). The seasonal cycle of wind-stress curl in subtropical eastern boundary current regions. J. Phys. Oceanogr. 21, 1815–1834. doi: 10.1175/1520-0485(1991)021<1815:tscows>2.0.co;2
Barth J. A., Menge B. A., Lubchenco J., Chan F., Bane J. M., Kirincich A. R., et al. (2007). Delayed upwelling alters nearshore coastal ocean ecosystems in the northern California Current. Proc. Natl. Acad. Sci. 104, 3719–3724. doi: 10.1073/pnas.0700462104
Barth J. A., Pierce S. D., Castelao R. M. (2005). Time-dependent, wind-driven flow over a shallow midshelf submarine bank. J. Geophys. Res. Oceans. 110, 1-20. doi: 10.1029/2004jc002761
Barth J. A., Pierce S. D., Smith R. L. (2000). A separating coastal upwelling jet at Cape Blanco, Oregon and its connection to the California Current System. Deep. Sea. Res. Part Ii Top. Stud. Oceanogr. 47, 783–810. doi: 10.1016/s0967-0645(99)00127-7
Behrenfeld M. J., Boss E. S. (2013). Resurrecting the ecological underpinnings of ocean plankton blooms. Annu. Rev. Mar. Sci. 6, 167–194. doi: 10.1146/annurev-marine-052913-021325
Benoit-Bird K. J., Shroyer E. L., McManus M. A. (2013). A critical scale in plankton aggregations across coastal ecosystems. Geophys. Res. Lett. 40, 3968–3974. doi: 10.1002/grl.50747
Biard T., Stemmann L., Picheral M., Mayot N., Vandromme P., Hauss H., et al. (2016). In situ imaging reveals the biomass of giant protists in the global ocean. Nature 532, 504. doi: 10.1038/nature17652
Bograd S. J., Jacox M. G., Hazen E. L., Lovecchio E., Montes I., Buil M. P., et al. (2022). Climate change impacts on Eastern Boundary Upwelling Systems. Annu. Rev. Mar. Sci. 15, 303–328. doi: 10.1146/annurev-marine-032122-021945
Bograd S. J., Schroeder I., Sarkar N., Qiu X., Sydeman W. J., Schwing F. B. (2009). Phenology of coastal upwelling in the California Current. Geophys. Res. Lett. 36, 1-5. doi: 10.1029/2008gl035933
Braakman ,. R., Follows M. J., Chisholm S. W. (2017). Metabolic evolution and the self-organization of ecosystems. Proc. Natl. Acad. Sci. 114, E3091–E3100. doi: 10.1073/pnas.1619573114
Breier J. A., Jakuba M. V., Saito M. A., Dick G. J., Grim S. L., Chan E. W., et al. (2020). Revealing ocean-scale biochemical structure with a deep-diving vertical profiling autonomous vehicle. Sci. Robot. 5, 1-13. doi: 10.1126/scirobotics.abc7104
Briseño-Avena C., Schmid M. S., Swieca K., Sponaugle S., Brodeur R. D., Cowen R. K. (2020). Three-dimensional cross-shelf zooplankton distributions off the Central Oregon Coast during anomalous oceanographic conditions. Prog. Oceanogr. 188, 102436. doi: 10.1016/j.pocean.2020.102436
Brodeur R. D., Auth T. D., Phillips A. J. (2019). Major shifts in pelagic micronekton and macrozooplankton community structure in an upwelling ecosystem related to an unprecedented marine heatwave. Front. Mar. Sci. 6. doi: 10.3389/fmars.2019.00212
Brodeur R. D., Suchman C. L., Reese D. C., Miller T. W., Daly E. A. (2008). Spatial overlap and trophic interactions between pelagic fish and large jellyfish in the northern California Current. Mar. Biol. 154, 649–659. doi: 10.1007/s00227-008-0958-3
Brown J. H., Gillooly J. F., Allen A. P., Savage V. M., West G. B. (2004). Toward a metabolic theory of ecology. Ecology 85, 1771–1789. doi: 10.1890/03-9000
Buil M. P., Jacox M. G., Fiechter ,. J., Alexander M. A., Bograd S. J., Curchitser E. N., et al. (2021). A dynamically downscaled ensemble of future projections for the California Current System. Front. Mar. Sci. 8. doi: 10.3389/fmars.2021.612874
Callahan B. J., McMurdie P. J., Rosen M. J., Han A. W., Johnson A. J. A., Holmes S. P. (2016). DADA2: High resolution sample inference from Illumina amplicon data. Nat. Methods 13, 581–583. doi: 10.1038/nmeth.3869
Caporaso J. G., Ackermann G., Apprill A., Bauer M., Berg-Lyons D., Betley J. (2023). EMP 16S Illumina Amplicon Protocol v2. Protocols.io. doi: 10.17504/protocols.io.kqdg3dzzl25z/v2
Cavan E. L., Laurenceau-Cornec E. C., Bressac M., Boyd P. W. (2019). Exploring the ecology of the mesopelagic biological pump. Prog. Oceanogr. 176, 102125. doi: 10.1016/j.pocean.2019.102125
Cavole L., Demko A., Diner R., Giddings A., Koester I., Pagniello C., et al. (2016). Biological impacts of the 2013–2015 warm-water anomaly in the Northeast Pacific: winners, losers, and the future. Oceanography 29, 273–285. doi: 10.5670/oceanog.2016.32
Chan F., Barth J., Kroeker K., Lubchenco J., Menge B. (2019). The dynamics and impact of ocean acidification and hypoxia: insights from sustained investigations in the Northern California Current Large Marine Ecosystem. Oceanography 32, 62–71. doi: 10.5670/oceanog.2019.312
Chan F., Barth J. A., Lubchenco J., Kirincich A., Weeks H., Peterson W. T., et al. (2008). Emergence of anoxia in the california current large marine ecosystem. Science 319, 920–920. doi: 10.1126/science.1149016
Checkley D. M., Barth J. A. (2009). Patterns and processes in the california current system. Prog. Oceanogr. 83, 49–64. doi: 10.1016/j.pocean.2009.07.028
Chesson P. (2000). Mechanisms of maintenance of species diversity. Annu. Rev. Ecol. Syst. 31, 343–366. doi: 10.1146/annurev.ecolsys.31.1.343
Conley K. R., Sutherland K. R. (2017). Particle shape impacts export and fate in the ocean through interactions with the globally abundant appendicularian Oikopleura dioica. PloS One 12, e0183105. doi: 10.1371/journal.pone.0183105
Costas-Selas C., Martínez-García S., Logares R., Hernández-Ruiz M., Teira E. (2022). Role of bacterial community composition as a driver of the small-sized phytoplankton community structure in a productive coastal system. Microbial. Ecol. 86, 777–794. doi: 10.1007/s00248-022-02125-2
Cowen R. K., Greer A. T., Guigand C. M., Hare J. A., Richardson D. E., Walsh H. J. (2013). Evaluation of the In Situ Ichthyoplankton Imaging System (ISIIS): comparison with the traditional (bongo net) sampler. Fish. B 111, 1-13. doi: 10.7755/fb.111.1.1
Cowen R. K., Guigand C. M. (2008). In situ ichthyoplankton imaging system (ISIIS): system design and preliminary results. Limnol. Oceanogr. Methods 6, 126–132. doi: 10.4319/lom.2008.6.126
Denman K. L., Gargett A. E. (1995). Biological-physical interactions in the upper ocean: the role of vertical and small scale transport processes. Annu. Rev. Fluid. Mech. 27, 225–256. doi: 10.1146/annurev.fl.27.010195.001301
Dickey T. D., Bidigare R. R. (2005). Interdisciplinary oceanographic observations: the wave of the future. Sci. Mar. 69, 23–42. doi: 10.3989/scimar.2005.69s123
Dickson M., Wheeler P. (1995). Ammonium uptake and regeneration rates in a coastal upwelling regime. Mar. Ecol. Prog. Ser. 121, 239–248. doi: 10.3354/meps121239
Doney S. C., Busch D. S., Cooley S. R., Kroeker K. J. (2020). The impacts of ocean acidification on marine ecosystems and reliant human communities. Annu. Rev. Env. Resour. 45, 1–30. doi: 10.1146/annurev-environ-012320-083019
Doney S. C., Ruckelshaus M., Duffy J. E., Barry J. P., Chan F., English C. A., et al. (2012). Climate change impacts on marine ecosystems. Annu. Rev. Mar. Sci. 4, 11–37. doi: 10.1146/annurev-marine-041911-111611
Faillettaz R., Picheral M., Luo J. Y., Guigand C., Cowen R. K., Irisson J.-O. (2016). Imperfect automatic image classification successfully describes plankton distribution patterns. Methods Oceanogr. 15, 60–77. doi: 10.1016/j.mio.2016.04.003
Feely R. A., Sabine C. L., Hernandez-Ayon J. M., Ianson D., Hales B. (2008). Evidence for upwelling of corrosive “acidified” water onto the continental shelf. Science 320, 1490–1492. doi: 10.1126/science.1155676
Feinberg L. R., Peterson W. T. (2003). Variability in duration and intensity of euphausiid spawning off central Oregon 1996–2001. Prog. Oceanogr. 57, 363–379. doi: 10.1016/s0079-6611(03)00106-x
Fennie H. W., Grorud-Colvert K., Sponaugle S. (2023). Larval rockfish growth through a marine heatwave: window into the future. (Nature). Sci. Rep. 13, 4089. doi: 10.1038/s41598-023-30726-5
Flynn K. J., Mitra A., Anestis K., Anschütz A. A., Calbet A., Ferreira G. D., et al. (2019). Mixotrophic protists and a new paradigm for marine ecology: where does plankton research go now? J. Plankton. Res. 41, 375–391. doi: 10.1093/plankt/fbz026
Fowler B. L., Neubert M. G., Hunter-Cevera K. R., Olson R. J., Shalapyonok A., Solow A. R., et al. (2020). Dynamics and functional diversity of the smallest phytoplankton on the Northeast US Shelf. Proc. Natl. Acad. Sci. 117, 12215–12221. doi: 10.1073/pnas.1918439117
García-Reyes M., Largier J. L. (2012). Seasonality of coastal upwelling off central and northern California: New insights, including temporal and spatial variability. J. Geophys. Res. Oceans. 117, n/a–n/a. doi: 10.1029/2011jc007629
Giovannoni S. J. (2017). SAR11 Bacteria: The most abundant plankton in the oceans. Annu. Rev. Mar. Sci. 9, 231–255. doi: 10.1146/annurev-marine-010814-015934
Glibert P. M., Mitra A. (2022). From webs, loops, shunts, and pumps to microbial multitasking: Evolving concepts of marine microbial ecology, the mixoplankton paradigm, and implications for a future ocean. Limnol. Oceanogr. 67, 585–597. doi: 10.1002/lno.12018
González H. E., Giesecke R., Vargas C. A., Pavez M., Iriarte J., Santibáñez P., et al. (2004). Carbon cycling through the pelagic foodweb in the northern Humboldt Current off Chile (23°S). ICES. J. Mar. Sci. 61, 572–584. doi: 10.1016/j.icesjms.2004.03.021
Gorsky G., Fenaux R. (1998). ““The role of Appendicularia in marine food webs,”,” in The biology of pelagic tunicates. Ed. Bone Q. (Oxford, United Kingdom: Oxford University Press), 161–169.
Greer A. T., Chiaverano L. M., Treible L. M., Briseño-Avena C., Hernandez F. J. (2021). From spatial pattern to ecological process through imaging zooplankton interactions. ICES. J. Mar. Sci. 78, 2664–2674. doi: 10.1093/icesjms/fsab149
Greer A. T., Schmid M. S., Duffy P. I., Robinson K. L., Genung M. A., Luo J. Y., et al. (2023). In situ imaging across ecosystems to resolve the fine-scale oceanographic drivers of a globally significant planktonic grazer. Limnol. Oceanogr. 68, 192–207. doi: 10.1002/lno.12259
Hales B., Karp-Boss L., Perlin A., Wheeler P. A. (2006). Oxygen production and carbon sequestration in an upwelling coastal margin. Global Biogeochem. Cy. 20, 1-15. doi: 10.1029/2005gb002517
Haury L. R., McGowan J. A., Wiebe P. H. (1978). “Patterns and processes in the time-space scales of plankton distributions,” in Spatial pattern in plankton communities, vol. 3 . Ed. Steele J. H. (Boston, MA: Springer), 277–327. doi: 10.1007/978-1-4899-2195-6_12
Hickey B. M., Banas N. S. (2003). Oceanography of the U.S. Pacific Northwest Coastal Ocean and estuaries with application to coastal ecology. Estuaries 26, 1010–1031. doi: 10.1007/bf02803360
Hickey B., Banas N. (2008). Why is the northern end of the California Current System so productive? Oceanography 21, 90–107. doi: 10.5670/oceanog.2008.07
HilleRisLambers J., Adler P. B., Harpole W. S., Levine J. M., Mayfield M. M. (2012). Rethinking community assembly through the lens of coexistence theory. Ecol. Evol. Syst. 43, 227–248. doi: 10.1146/annurev-ecolsys-110411-160411
Irisson J.-O., Ayata S.-D., Lindsay D. J., Karp-Boss L., Stemmann L. (2021). Machine learning for the study of plankton and marine snow from images. Annu. Rev. Mar. Sci. 14, 1–25. doi: 10.1146/annurev-marine-041921-013023
Jacox M. G., Alexander M. A., Amaya D., Becker E., Bograd S. J., Brodie S., et al. (2022). Global seasonal forecasts of marine heatwaves. Nature 604, 486–490. doi: 10.1038/s41586-022-04573-9
Jacox M. G., Edwards C. A., Hazen E. L., Bograd S. J. (2018). Coastal upwelling revisited: Ekman, Bakun, and improved upwelling indices for the U.S. West Coast. J. Geophys. Res. Oceans. 123, 7332–7350. doi: 10.1029/2018jc014187
Jaspers C., Hopcroft R. R., Kioboe T., Lombard F., Lopez-Urrutia A., Everett J. D., et al. (2023). Gelatinous larvacean zooplankton can enhance trophic transfer and carbon sequestration. TREE 38 (10), 980–993. doi: 10.1016/j.tree.2023.05.005
Joglar V., Álvarez-Salgado X. A., Gago-Martinez A., Leao J. M., Pérez-Martínez C., Pontiller B., et al. (2021). Cobalamin and microbial plankton dynamics along a coastal to offshore transect in the Eastern North Atlantic Ocean. Environ. Microbiol. 23, 1559–1583. doi: 10.1111/1462-2920.15367
Kara A. B., Rochford P. A., Hurlburt H. E. (2000). An optimal definition for ocean mixed layer depth. J. Geophys. Res. Oceans. 105, 16803–16821. doi: 10.1029/2000jc900072
Kirchman D. L. (2000). Microbial ecology of the oceans (New York: John Wiley & Sons). doi: 10.1002/9780470281840
Kirincich A. R., Barth J. A., Grantham B. A., Menge B. A., Lubchenco J. (2005). Wind-driven inner-shelf circulation off central Oregon during summer. J. Geophys. Res. Oceans. 110, 1–17. doi: 10.1029/2004jc002611
Kudela R., Banas N., Barth J., Frame E., Jay D., Largier J., et al. (2008). New insights into the controls and mechanisms of plankton productivity in coastal upwelling waters of the Northern California Current System. Oceanography 21, 46–59. doi: 10.5670/oceanog.2008.04
Kuhn M. (2008). Building predictive models in R using the caret Package. J. Stat. Softw. 28. doi: 10.18637/jss.v028.i05
Landry M. R., Ohman M. D., Goericke R., Stukel M. R., Barbeau K. A., Bundy R., et al. (2012). Pelagic community responses to a deep-water front in the California Current Ecosystem: overview of the A-Front Study. J. Plankton. Res. 34, 739–748. doi: 10.1093/plankt/fbs025
Largier J. L., Lawrence C. A., Roughan M., Kaplan D. M., Dever E. P., Dorman C. E., et al. (2006). WEST: A northern California study of the role of wind-driven transport in the productivity of coastal plankton communities. Deep. Sea. Res. Part Ii Top. Stud. Oceanogr. 53, 2833–2849. doi: 10.1016/j.dsr2.2006.08.018
Lentz S. J., Chapman D. C. (1989). Seasonal differences in the current and temperature variability over the northern California Shelf during the Coastal Ocean Dynamics Experiment. J. Geophys. Res. Oceans. 94, 12571–12592. doi: 10.1029/jc094ic09p12571
Lertvilai P., Jaffe J. S. (2022). In situ size and motility measurement of aquatic invertebrates with an underwater stereoscopic camera system using tilted lenses. Methods Ecol. Evol. 13, 1192–1200. doi: 10.1111/2041-210x.13855
Lima-Mendez G., Faust K., Henry N., Decelle J., Colin S., Carcillo F., et al. (2015). Determinants of community structure in the global plankton interactome. Science 348, 1262073. doi: 10.1126/science.1262073
Lindegren M., Thomas M. K., Jónasdóttir S. H., Nielsen T. G., Munk P. (2020). Environmental niche separation promotes coexistence among ecologically similar zooplankton species—North Sea copepods as a case study. Limnol. Oceanogr. 65, 545–556. doi: 10.1002/lno.11322
Lombard F., Boss E., Waite A. M., Vogt M., Uitz J., Stemmann L., et al. (2019). Globally consistent quantitative observations of planktonic ecosystems. Front. Mar. Sci. 6. doi: 10.3389/fmars.2019.00196
Luo J., Grassian B., Tang D., Irisson J., Greer A., Guigand C., et al. (2014). Environmental drivers of the fine-scale distribution of a gelatinous zooplankton community across a mesoscale front. Mar. Ecol. Prog. Ser. 510, 129–149. doi: 10.3354/meps10908
Luo J. Y., Irisson J., Graham B., Guigand C., Sarafraz A., Mader C., et al. (2018). Automated plankton image analysis using convolutional neural networks. Limnol. Oceanogr. Methods 16, 814–827. doi: 10.1002/lom3.10285
Luo J. Y., Stock C. A., Henschke N., Dunne J. P., O’Brien T. D. (2022). Global ecological and biogeochemical impacts of pelagic tunicates. Prog. Oceanogr. 205, 102822. doi: 10.1016/j.pocean.2022.102822
MacArthur R. H. (1958). Population ecology of some warblers of northeastern coniferous forests. Ecology 39, 599–619. doi: 10.2307/1931600
Mantua N. J., Hare S. R. (2002). The Pacific decadal oscillation. J. Oceanogr. 58, 35–44. doi: 10.1023/a:1015820616384
Martiny A. C., Treseder K., Pusch G. (2013). Phylogenetic conservatism of functional traits in microorganisms. ISME. J. 7, 830–838. doi: 10.1038/ismej.2012.160
McClatchie S., Cowen R., Nieto K., Greer A., Luo J. Y., Guigand C., et al. (2012). Resolution of fine biological structure including small narcomedusae across a front in the Southern California Bight. J. Geophys. Res. Oceans. 117, n/a–n/a. doi: 10.1029/2011jc007565
McMurdie P. J., Holmes S. (2013). phyloseq: An R package for reproducible interactive analysis and graphics of microbiome census data. PloS One 8, e61217. doi: 10.1371/journal.pone.0061217
McMurdie P. J., Holmes S. (2014). Waste not, want not: why rarefying microbiome data is inadmissible. PLOS Computational Biology 10 (4), e1003531. doi: 10.1371/journal.pcbi.1003531
Millette N. C., Gast R. J., Luo J. Y., Moeller H. V., Stamieszkin K., Andersen K. H., et al. (2023). Mixoplankton and mixotrophy: future research priorities. J. Plankton. Res 45, 576–596. doi: 10.1093/plankt/fbad020
Mousseau L., Fortier L., Legendre L. (1998). Annual production of fish larvae and their prey in relation to size-fractionated primary production (Scotian Shelf, NW Atlantic). Ices. J. Mar. Sci. 55, 44–57. doi: 10.1006/jmsc.1997.0224
Muñoz-Marín M. C., Gómez-Baena G., López-Lozano A., Moreno-Cabezuelo J. A., Díez J., García-Fernández J. M. (2020). Mixotrophy in marine picocyanobacteria: use of organic compounds by Prochlorococcus and Synechococcus. ISME. J. 14, 1065–1073. doi: 10.1038/s41396-020-0603-9
Nagelkerken I., Connell S. D. (2022). Ocean acidification drives global reshuffling of ecological communities. Global Change Biol. 28, 7038–7048. doi: 10.1111/gcb.16410
Ohman M. D., Davis R. E., Sherman J. T., Grindley K. R., Whitmore B. M., Nickels C. F., et al. (2019). Zooglider: An autonomous vehicle for optical and acoustic sensing of zooplankton. Limnol. Oceanogr. Methods 17, 69–86. doi: 10.1002/lom3.10301
Oliver E. C. J., Donat M. G., Burrows M. T., Moore P. J., Smale D. A., Alexander L. V., et al. (2018). Longer and more frequent marine heatwaves over the past century. Nat. Commun. 9, 1324. doi: 10.1038/s41467-018-03732-9
Orenstein E. C., Ratelle D., Briseño-Avena C., Carter M. L., Franks P. J. S., Jaffe J. S., et al. (2020). The Scripps Plankton Camera system: A framework and platform for in situ microscopy. Limnol. Oceanogr. Methods 18, 681–695. doi: 10.1002/lom3.10394
Ortner P. B., Cummings S. R., Aftring R. P., Edgerton H. E. (1979). Silhouette photography of oceanic zooplankton. Nature 277, 50–51. doi: 10.1038/277050a0
Parada A. E., Needham D. M., Fuhrman J. A. (2015). Every base matters: assessing small subunit rRNA primers for marine microbiomes with mock communities, time series and global field samples. Environ. Microbiol. 18, 1403–1414. doi: 10.1111/1462-2920.13023
Pauly D., Christensen V. (1995). Primary production required to sustain global fisheries. Nature 374, 255–257. doi: 10.1038/374255a0
Peterson W., Fisher J., Peterson J., Morgan C., Burke B., Fresh K. (2014). Applied fisheries oceanography: ecosystem indicators of ocean conditions inform fisheries management in the California Current. Oceanography 27, 80–89. doi: 10.5670/oceanog.2014.88
Peterson W. T., Fisher J. L., Strub P. T., Du X., Risien C., Peterson J., et al. (2017). The pelagic ecosystem in the Northern California Current off Oregon during the 2014–2016 warm anomalies within the context of the past 20 years. J. Geophys. Res. Oceans. 122, 7267–7290. doi: 10.1002/2017jc012952
Peterson W. T., Keister J. E. (2003). Interannual variability in copepod community composition at a coastal station in the northern California Current: a multivariate approach. Deep. Sea. Res. Part Ii Top. Stud. Oceanogr. 50, 2499–2517. doi: 10.1016/s0967-0645(03)00130-9
Peterson W. T., Miller C. B. (1975). Year-to-year variations in the planktology of the Oregon upwelling zone. Fish. Bull. 73, 642–653.
Picheral M., Catalano C., Brousseau D., Claustre H., Coppola L., Leymarie E., et al. (2022). The Underwater Vision Profiler 6: an imaging sensor of particle size spectra and plankton, for autonomous and cabled platforms. Limnol. Oceanogr. Methods 20, 115–129. doi: 10.1002/lom3.10475
Pomeroy L. R. (1974). The ocean’s food web, a changing paradigm. Bioscience 24, 499–504. doi: 10.2307/1296885
Prairie J. C., Sutherland K. R., Nickols K. J., Kaltenberg A. M. (2012). Biophysical interactions in the plankton: A cross-scale review. Limnol. Oceanogr. Fluids. Environ. 2, 121–145. doi: 10.1215/21573689-1964713
Purcell J. E., Sturdevant M. V., Galt C. P. (2005). “A review of appendicularians as prey of fish and invertebrate predators,” in Response of marine ecosystems to global change: ecological impact of appendicularians. Eds. Gorsky G., Youngbluth M. J., Diebel D. (Paris, France: Contemporary Publishing International), 359–435.
Ratnarajah L., Abu-Alhaija R., Atkinson A., Batten S., Bax N. J., Bernard K. S., et al. (2023). Monitoring and modelling marine zooplankton in a changing climate. Nat. Commun. 14, 564. doi: 10.1038/s41467-023-36241-5
Rebstock G. A. (2003). Long-term change and stability in the California Current System: lessons from CalCOFI and other long-term data sets. Deep. Sea. Res. Part Ii Top. Stud. Oceanogr. 50, 2583–2594. doi: 10.1016/s0967-0645(03)00124-3
Reese D. C., Brodeur R. D. (2006). Identifying and characterizing biological hotspots in the northern California Current. Deep. Sea. Res. Part Ii Top. Stud. Oceanogr. 53, 291–314. doi: 10.1016/j.dsr2.2006.01.014
Ribalet F., Berthiaume C., Hynes A., Swalwell J., Carlson M., Clayton S., et al. (2019). SeaFlow data v1, high-resolution abundance, size and biomass of small phytoplankton in the North Pacific. Sci. Data 6, 277. doi: 10.1038/s41597-019-0292-2
Ríos-Castro R., Costas-Selas C., Pallavicini A., Vezzulli L., Novoa B., Teira E., et al. (2022). Co-occurrence and diversity patterns of benthonic and planktonic communities in a shallow marine ecosystem. Front. Mar. Sci. 9. doi: 10.3389/fmars.2022.934976
Robertson R. R., Bjorkstedt E. P. (2020). Climate-driven variability in Euphausia pacifica size distributions off northern California. Prog. Oceanogr. 188, 102412. doi: 10.1016/j.pocean.2020.102412
Robinson K. L., Sponaugle S., Luo J. Y., Gleiber M. R., Cowen R. K. (2021). Big or small, patchy all: Resolution of marine plankton patch structure at micro- to submesoscales for 36 taxa. Sci. Adv. 7, eabk2904. doi: 10.1126/sciadv.abk2904
Rutherford S., D’Hondt S., Prell W. (1999). Environmental controls on the geographic distribution of zooplankton diversity. Nature 400, 749–753. doi: 10.1038/23449
Rykaczewski R. R., Checkley D. M. (2008). Influence of ocean winds on the pelagic ecosystem in upwelling regions. Proc. Natl. Acad. Sci. 105, 1965–1970. doi: 10.1073/pnas.0711777105
Ryther J. H. (1969). Photosynthesis and fish production in the sea. Science 166, 72–76. doi: 10.1126/science.166.3901.72
Sato R., Tanaka Y., Ishimaru T. (2003). Species-specific house productivity of appendicularians. Mar. Ecol. Prog. Ser. 259, 163–172. doi: 10.3354/meps259163
Schmid M. S., Cowen R. K., Robinson K., Luo J. Y., Briseño-Avena C., Sponaugle S. (2020). Prey and predator overlap at the edge of a mesoscale eddy: fine-scale, in-situ distributions to inform our understanding of oceanographic processes. Sci. Rep. 10, 921. doi: 10.1038/s41598-020-57879-x
Schmid M. S., Daprano D., Damle M. M., Sullivan C. M., Sponaugle S., Cousin C., et al. (2023). Edge computing at sea: high-throughput classification of in-situ plankton imagery for adaptive sampling. Front. Mar. Sci. 10. doi: 10.3389/fmars.2023.1187771
Schmid M. S., Daprano D., Jacobson K. M., Sullivan C., Briseño-Avena C., Luo J. Y., et al. (2021). A Convolutional Neural Network based high-throughput image classification pipeline - code and documentation to process plankton underwater imagery using local HPC infrastructure and NSF’s XSEDE. Zenodo. doi: 10.5281/zenodo.4641158
Schmid M. S., Fortier L. (2019). The intriguing co-distribution of the copepods Calanus hyperboreus and Calanus glacialis in the subsurface chlorophyll maximum of Arctic seas. Elem. Sci. Anth. 7, 50. doi: 10.1525/elementa.388
Schmid M. S., Maps F., Fortier L. (2018). Lipid load triggers migration to diapause in Arctic Calanus copepods—insights from underwater imaging. J. Plankton. Res. 40, 311–325. doi: 10.1093/plankt/fby012
Shaw C. T., Peterson W. T., Feinberg L. R. (2010). Growth of Euphausia pacifica in the upwelling zone off the Oregon coast. Deep. Sea. Res. Part II. Top. Stud. Oceanogr. 57, 584–593. doi: 10.1016/j.dsr2.2009.10.008
Sherr E. B., Sherr B. F., Wheeler P. A. (2005). Distribution of coccoid cyanobacteria and small eukaryotic phytoplankton in the upwelling ecosystem off the Oregon coast during 2001 and 2002. Deep. Sea. Res. Part II.: Top. Stud. Oceanogr. 52, 317–330. doi: 10.1016/j.dsr2.2004.09.020
Sildever S., Laas P., Kolesova N., Lips I., Lips U., Nagai S. (2021). Plankton biodiversity and species co-occurrence based on environmental DNA – a multiple marker study. Metabarcoding. Metagenomics. 5, e72371. doi: 10.3897/mbmg.5.72371
Smale D. A., Wernberg T., Oliver E. C. J., Thomsen M., Harvey B. P., Straub S. C., et al. (2019). Marine heatwaves threaten global biodiversity and the provision of ecosystem services. Nat. Clim. Change 9, 306–312. doi: 10.1038/s41558-019-0412-1
Smetacek V. (2012). Making sense of ocean biota: How evolution and biodiversity of land organisms differ from that of the plankton. J. Biosci. 37, 589–607. doi: 10.1007/s12038-012-9240-4
Smith K. E., Burrows M. T., Hobday A. J., King N. G., Moore P. J., Gupta A. S., et al. (2022). Biological impacts of marine heatwaves. Annu. Rev. Mar. Sci. 15, 119–145. doi: 10.1146/annurev-marine-032122-121437
Spitz Y. H., Allen J. S., Gan J. (2005). Modeling of ecosystem processes on the Oregon shelf during the 2001 summer upwelling. J. Geophys. Res. Oceans. 110, 1–21. doi: 10.1029/2005jc002870
Sutherland K. R., Madin L. P., Stocker R. (2010). Filtration of submicrometer particles by pelagic tunicates. Proc. Natl. Acad. Sci. 107, 15129–15134. doi: 10.1073/pnas.1003599107
Sutherland K. R., Thompson A. W. (2022). Pelagic tunicate grazing on marine microbes revealed by integrative approaches. Limnol. Oceanogr. 67, 102–121. doi: 10.1002/lno.11979
Swieca K., Sponaugle S., Briseño-Avena C., Schmid M., Brodeur R., Cowen R. (2020). Changing with the tides: fine-scale larval fish prey availability and predation pressure near a tidally modulated river plume. Mar. Ecol. Prog. Ser. 650, 217–238. doi: 10.3354/meps13367
Swieca K., Sponaugle S., Schmid M. S., Ivory J., Corrales-Ugalde M., Sutherland K. R., et al. (2023). Growth and diet of a larval myctophid across distinct upwelling regimes in the California Current. ICES. J. Mar. Sci 80, 1431–1446. doi: 10.1093/icesjms/fsad070
Taylor A., Landry M. (2018). Phytoplankton biomass and size structure across trophic gradients in the southern California Current and adjacent ocean ecosystems. Mar. Ecol. Prog. Ser. 592, 1–17. doi: 10.3354/meps12526
Taylor A. G., Landry M. R., Selph K. E., Wokuluk J. J. (2015). Temporal and spatial patterns of microbial community biomass and composition in the southern California Current Ecosystem. Deep. Sea. Res. Part II. Top. Stud. Oceanogr. 112, 117–128. doi: 10.1016/j.dsr2.2014.02.006
Thompson A. R., Bjorkstedt E. P., Bograd S. J., Fisher J. L., Hazen E. L., Leising A., et al. (2022). State of the california current ecosystem in 2021: winter is coming? Front. Mar. Sci. 9. doi: 10.3389/fmars.2022.958727
Thompson A. R., Schroeder I. D., Bograd S. J., Hazen E. L., Jacox M. G., Leising A., et al. (2018). State of the California Current 2017-18: Still not quite normal in the North and getting interesting in the South. Calif. Cooperat. Ocean. Fish. Investig. Rep. 59, 1–66.
Thompson A. R., Schroeder I. D., Bograd S. J., Hazen E. L., Jacox M. G., Leising A., et al. (2019). State of the California Current 2018–19: a novel anchovy regime and a new marine heat wave? Calif. Cooperat. Ocean. Fish. Investig. Rep. 60, 1–65.
Thompson A. W., Ward A. C., Sweeney C. P., Sutherland K. R. (2021). Host-specific symbioses and the microbial prey of a pelagic tunicate (Pyrosoma atlanticum). Isme. Commun. 1, 11. doi: 10.1038/s43705-021-00007-1
Tilstone G., Figueiras F., Fermín E., Arbones B. (1999). Significance of nanophytoplankton photosynthesis and primary production in a coastal upwelling system (Ría de Vigo, NW Spain). Mar. Ecol. Prog. Ser. 183, 13–27. doi: 10.3354/meps183013
Turner J. T. (2015). Zooplankton fecal pellets, marine snow, phytodetritus and the ocean’s biological pump. Prog. Oceanogr. 130, 205–248. doi: 10.1016/j.pocean.2014.08.005
Vargas C. A., Martínez R. A., Cuevas L. A., Pavez M. A., Cartes C., González H. E., et al. (2007). The relative importance of microbial and classical food webs in a highly productive coastal upwelling area. Limnol. Oceanogr. 52, 1495–1510. doi: 10.4319/lo.2007.52.4.1495
Verity P., Smetacek V. (1996). Organism life cycles, predation, and the structure of marine pelagic ecosystems. Mar. Ecol. Prog. Ser. 130, 277–293. doi: 10.3354/meps130277
Vilgrain L., Maps F., Picheral M., Babin M., Aubry C., Irisson J., et al. (2021). Trait-based approach using in situ copepod images reveals contrasting ecological patterns across an Arctic ice melt zone. Limnol. Oceanogr. 66, 1155–1167. doi: 10.1002/lno.11672
Ware D. M., Thomson R. E. (2005). Bottom-up ecosystem trophic dynamics determine fish production in the Northeast Pacific. Science 308, 1280–1284. doi: 10.1126/science.1109049
Weber E. D., Auth T. D., Baumann-Pickering S., Baumgartner T. R., Bjorkstedt E. P., Bograd S. J., et al. (2021). State of the California Current 2019–2020: back to the future with marine heatwaves? Front. Mar. Sci. 8. doi: 10.3389/fmars.2021.709454
Wilkerson F. P., Dugdale R. C., Barber R. T. (1987). Effects of El Niño on new, regenerated, and total production in eastern boundary upwelling systems. J. Geophys. Res. Oceans. 92, 14347–14353. doi: 10.1029/jc092ic13p14347
Williams R. J., Howe A., Hofmockel K. S. (2014). Demonstrating microbial co-occurrence pattern analyses within and between ecosystems. Front. Microbiol. 5. doi: 10.3389/fmicb.2014.00358
Williams P. J., le B., Ducklow H. W. (2019). The microbial loop concept: A history 1930–1974. J. Mar. Res. 77, 23–81. doi: 10.1357/002224019828474359
Yamazaki H., Mackas D. L., Denman K. (2002). Coupling small-scale physical processes with biology, in Biological-physical interactions in the sea. Eds. Robinson A. R., McCarthy J. J., Rothschild B. J. (New York: John Wiley & Sons), 51–112.
Keywords: California Current, plankton community structure, microbial loop, upwelling, plankton imaging, climate change, machine learning, big data
Citation: Schmid MS, Sponaugle S, Thompson AW, Sutherland KR and Cowen RK (2023) Drivers of plankton community structure in intermittent and continuous coastal upwelling systems–from microbes and microscale in-situ imaging to large scale patterns. Front. Mar. Sci. 10:1166629. doi: 10.3389/fmars.2023.1166629
Received: 15 February 2023; Accepted: 24 October 2023;
Published: 22 November 2023.
Edited by:
Stelios Katsanevakis, University of the Aegean, GreeceReviewed by:
Xin Liu, Xiamen University, ChinaSaskia Rühl, Plymouth Marine Laboratory, United Kingdom
Copyright © 2023 Schmid, Sponaugle, Thompson, Sutherland and Cowen. This is an open-access article distributed under the terms of the Creative Commons Attribution License (CC BY). The use, distribution or reproduction in other forums is permitted, provided the original author(s) and the copyright owner(s) are credited and that the original publication in this journal is cited, in accordance with accepted academic practice. No use, distribution or reproduction is permitted which does not comply with these terms.
*Correspondence: Moritz S. Schmid, c2NobWlkbUBvcmVnb25zdGF0ZS5lZHU=