 Marvin Meresse
 François Gevaert
 Gwendoline Duong
 Lionel Denis
- Univ. Lille, CNRS, Univ. Littoral Côte d’Opale, UMR 8187 - LOG – Laboratoire d’Océanologie et de Géosciences, Station Marine de Wimereux, Lille, France
Despite their high productivity and their key role in coastal processes, microphytobenthic biofilm studies remain relatively scarce because in situ, meteorological hazards make it difficult to acquire reproducible measurements, also due to difficulties in properly reproducing field conditions in the laboratory. Therefore, in order to better understand the processes of microphytobenthic primary production, we have developed an automated laboratory system and procedure with variable light intensity, with a large number of replicates. This article aims to provide a description of the creation of a P-I curve based on a total of 128 vertical profiles recorded on a sediment core taken in situ, placed in the automated system and studied under controlled conditions of temperature and air humidity while light intensity was varied automatically, thus allowing to work in standard and replicable conditions. With measured production levels of up to 14.68 ± 3.70 mmol O2.m-2.h-1 and a productivity of 0.06 ± 0.01 mmol O2.m-2.h-1 per gram of Chl a corresponding to what is generally found in temperate environments, we have shown that our system is suitable for high frequency measurements and, by combining surficial measurements of modulated fluorescence and oxygen microprofiling in sediments, complementary information from a large dataset on photosynthetic and microphytobenthic migratory activity may be obtained under standard conditions. The development of this tool has made it possible to highlight a stabilization time for oxygen fluxes. For our study conducted in a temperate environment, we observed a time lag of a few minutes that should be considered when acquiring PE curves in the laboratory to study microphytobenthic photosynthetic capacities. This tool also allowed to describe microphytobenthic migration in response to light exposure, with successive steps observed through fluorescence and oxygen profiles. First, microphytobenthos migrated towards the surface until the optimal intensity of production at 475 µmol photons.m-2.s-1, then from this intensity as well as towards 780 µmol photons.m-2.s-1, downwards migratory movements were detected. This system is a working basis which can open interesting perspectives for the study of the effect of other abiotic (or biotic) parameters.
1 Introduction
Among the different actors of the intertidal primary production, the microphytobenthos has been known for a long time as an important contributor to intertidal primary production (Taylor, 1964; McIntire and Wulff, 1969; Guarini et al., 1998; Underwood and Kromkamp, 1999). However, there is still a lot of uncertainties about its behavior and the primary production data are scattered. In order to better understand the functioning of the microphytobenthos and the environment in which it evolves, studies require a more accurate and detailed methodology. Over the last decades, methods for studying the microphytobenthic production either directly or indirectly by measuring proxies have not changed substantially but have evolved with the continued development of increasingly efficient, non-destructive and complementary technologies (Park et al., 2014). For example, pulse-amplitude modulated (PAM) fluorometry, through the measurement of the chlorophyll fluorescence emitted in the sub-surface layer of the sediment, allows quantifying the photosynthetic activity via the calculation of the electron transfer rate (rETR) (Genty et al., 1989), evidences the setup of photoprotective mechanisms through the non-photochemical quenching (NPQ) (Schreiber et al., 1994), the physiological state of the biofilm by calculating the Fv/Fm (Genty et al., 1989) or may be used as a proxy of the surface chlorophyll biomass (Serôdio et al., 1997; Serôdio et al., 2001). Although fundamentally unchanged since the nineties (Hartig et al., 1998), this technique has evolved towards more autonomous and high frequency acquisition, hence making it possible to detect the rate of vertical migration of microphytobenthos (Barnett et al., 2020). However, one of the main drawbacks remains the vertical integration of the information, because this measurement tool is a surface-based method, which requires mathematical models to integrate this verticality (Forster and Kromkamp, 2004; Serôdio, 2004; Morelle et al., 2018). Complementary to the previously mentioned techniques, many studies use oxygen microprofiling as a non-destructive approach to evaluate microphytobenthic production (Revsbech et al., 1981; Lassen et al., 1998; Denis et al., 2012; Cartaxana et al., 2016a). This technique allows the acquisition of vertical oxygen profiles, allowing the calculation of integrated oxygen fluxes on the vertical and the vertical location of oxygen production/consumption zones in the sediment column. The microsensors themselves have not fundamentally changed (except their size, response time and accuracy), but from manual acquisition of few vertical oxygen profiles (Revsbech et al., 1981), automation has allowed studies with datasets of over 1800 vertical profiles using motorized acquisition methods (Kwon et al., 2018). However, there are two important limitations in the use of this method: (1) the measured profiles and oxygen fluxes correspond to a balance between production and consumption of oxygen, and (2) the spatial representativeness is limited by a very small scale of measurement, hence the need for replicates of measurements.
Usually, when measuring fluorescence or oxygen flux, the photosynthetic response of algae can be characterized by the construction of photosynthesis (P) versus irradiance (I) curves which can be fitted using different models (Webb et al., 1974; Jassby and Platt, 1976; Platt et al., 1980; Eilers and Peeters, 1988). Nevertheless, the construction of these P-I curves is not always straight forward. When data acquisition is performed in situ under natural light variations, the main advantage lies in the possibility to perform measurements under real environmental conditions. However, in addition to the time-consuming nature of making vertical oxygen profiles (Underwood and Kromkamp, 1999), each day may present a unique scenario of environmental conditions variations, and therefore does not allow the acquisition of a large data set under strictly identical conditions. It is therefore difficult to compare different sites under standard conditions in order to evaluate, for example, the photosynthetic characteristics of microphytobenthic communities. Moreover, the tidal and/or meteorological characteristics do not always allow a wide range of light intensities, necessary for the construction of P-I curves.
Since environmental factors tend to fluctuate at the same time, there are some difficulties in interpreting results and in the ability to perform replicable experiments in situ. This is why it seems appropriate to work under controlled conditions for studies aimed at characterizing microphytobenthic photosynthetic capacity. Furthermore, in the intertidal zone, the distribution of microphytobenthos is highly heterogeneous (MacIntyre et al., 1996; Spilmont et al., 2011; Redzuan and Underwood, 2020). As a result, by having no or few replicates, a major bias is introduced when studying the microphytobenthos on a small scale.
This paper aims to present and evaluate the efficiency of an automated P-I curve acquisition system under controlled conditions in the laboratory. The objective is to highlight the processes involved in a microphytobenthic biofilm functioning by a combined approach through the use of (i) microprofiling allowing the acquisition of information on the primary production and its vertical distribution in the sediment and (ii) modulated fluorescence allowing the acquisition of information on the migratory and photosynthetic activity processes at the surface of the sediment. The aim is also to perform a large number of measurements in standard conditions in order to study the primary production in a controlled and reproducible environment, all in an automated way by the use of a climatic chamber.
2 Materials and methods
2.1 Sampling and sedimentary characterization
Sediment samplings were performed in spring 2021, during the emersion period of an intertidal mudflat located in the Canche estuary (50°32’07 “N; 1°35’45 “E) in the eastern English Channel. Field surface sediment temperature and salinity were measured in situ as conventionally done by inserting a multi-parameter probe (HI9829, Hanna Instruments, France) into the first centimeter of the sediment within a few centimeters of the core location.
Three 15 cm diameter sediment cores were collected in the dark before sunrise and stored in the dark until the beginning of the experiment about one hour later. One core was used for oxygen microprofiling and fluorescence study, while the two others were used for sediment characterization. For this characterization, 3 subcores (2.6 cm inner diameter) were randomly taken in the two sediment cores, just prior to the start of the acquisition sequence to estimate chlorophyll a (Chl a) concentrations in the first centimeter of wet sliced sediment, using the Lorenzen method (Lorenzen, 1967). Similarly, to determine the average sediment porosity, another subcore was sampled in each of the main sediment cores and stored at -20°C. Once frozen, each subcore was manually sectioned with a thin blade into 2-mm slices, down to 1-cm depth, then into 5-mm slices, down to 3.5-cm depth, then into 1-cm slices, down to 5.5-cm depth, then into 2-cm slices, down to 9.5-cm depth for determination of porosity profiles. Each sediment slice was then dried in an oven (60°C) for a week (Danovaro et al., 1999; Flemming and Delafontaine, 2000), and the porosity was calculated from the measurement of sediment water content, obtained by dividing the difference between wet and dry sediment assuming a dry particle density (ρsed) of 2.65 g.cm-3 (Mackin and Aller, 1984) and a seawater density (ρw) of 1.03 g.cm-3. The equation used for the calculation of porosity is:
where Ww and Wsed are respectively the weight of water and the weight of sediment.
2.2 Overview of the automated photosynthesis-irradiance curve acquisition system
2.2.1 Two complementary measurement types
The experimental setting was developed to measure and describe the microphytobenthic primary production, using a sediment core (15 cm diameter, 10 cm length) brought back from the field to the laboratory, through two complementary measurement tools. On the one hand, two Clark-type microsensors (OX50, Unisense, Denmark) were used in parallel to acquire vertical oxygen profiles in pairs (Figure 1). The two microsensors were connected to multichannel amplifier for the electric potentials measured by the microsensors (MultiChannel UniAmp, Unisense, Denmark). These microsensors have been fixed on a vertical micromotor system (MM33-2, Unisense, Denmark) allowing to realize in an automated way oxygen profiles with a vertical measurement step of 50 µm. The microsensors used have an outer diameter of 50 μm, a 90% response time< 4 s, a stirring sensitivity< 2%, and were calibrated as described by Revsbech (1989a). The choice of the number of microsensors used simultaneously results from a trade-off between the total duration of an experimentation, the constraint related to the self-shading of the device on the sediment and the number of replicates. While microsensors are thin, the microsensor holder must be larger to accommodate additional sensors, thereby increasing self-shading. Therefore, the number of microsensors used must be carefully weighed against the risk of self-shading. On the other hand, the optical fiber of a pulse-amplitude modulated chlorophyll fluorometer (Diving-PAM, Heinz Walz, Germany) is placed near the microsensors to acquire fluorescence data from the sediment (Figure 1). This instrument is based on the use of modulated red light as a measuring, non-actinic light source (Kromkamp et al., 1998).
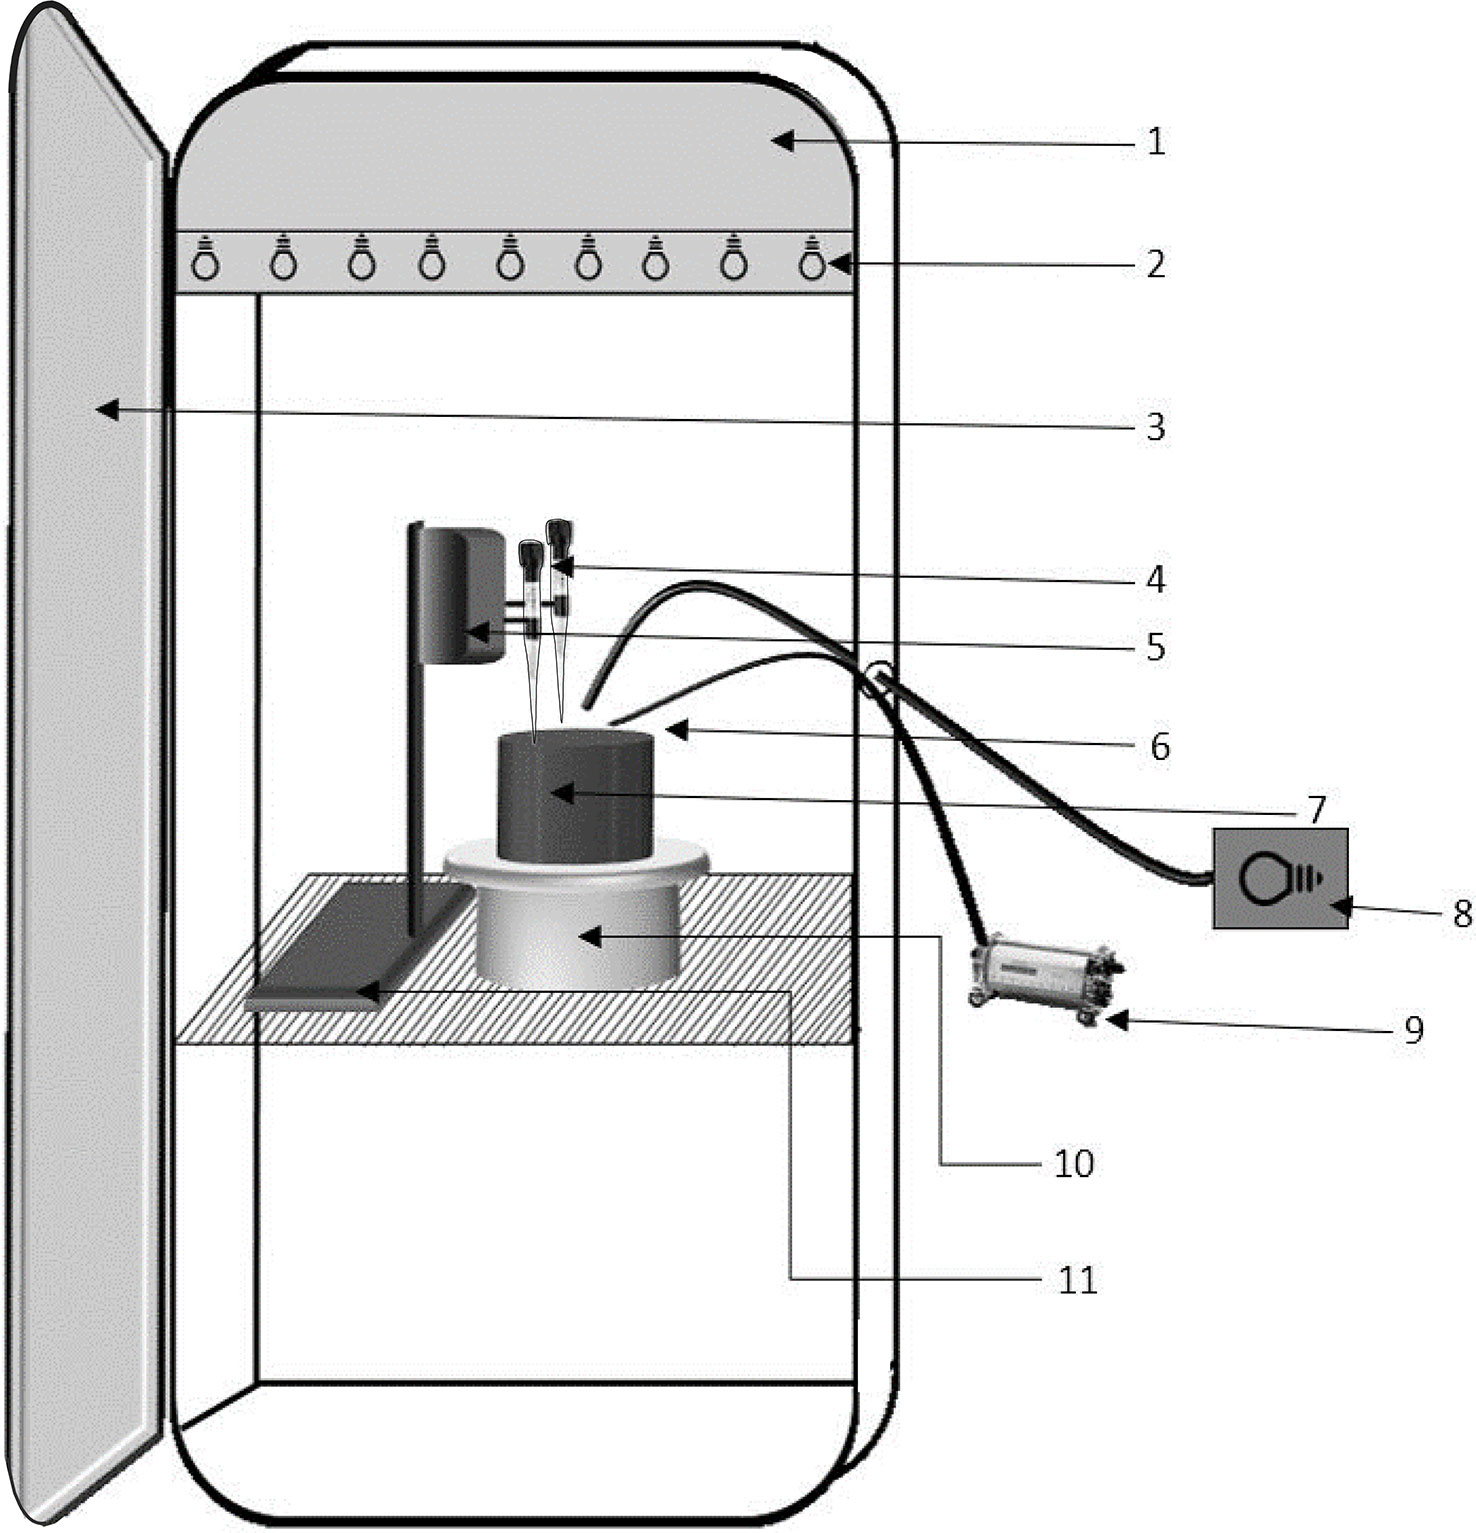
Figure 1 General layout of the experimental system for P-I curves acquisition (1) Fitoclima chamber sensors that allows the maintenance of the programmed conditions and ventilation compartment, (2) Lighting strip integrated in the climatic chamber, (3) Hermetic door, (4) Oxygen microsensors, (5) Micromotor, (6) Diving-PAM optical fiber, (7) Sediment core, (8) Additional light source KL2500 LCD, (9) Diving-PAM, (10) Programmable turntable, (11) Laboratory stand.
The Diving-PAM allowed the measurement of the effective quantum yield of the photosystem II (PSII) (ΦPSII). ΦPSII was calculated according to Genty et al. (1989):
where Ft is the instantaneous fluorescence level under ambient light and Fm′ is the maximal level determined with a single actinic saturating light pulse (0.8 s, 2500 µmol photons.m-2.s-1) for light-acclimated samples. ΦPSII is used to calculate the relative electron transport rate (rETR) through the PSII under a given light intensity, according to the estimation of Genty et al. (1989):
where PPFD (Photosynthetic Photon Flux Density) is the value of the ambient light measured with a planar light sensor (LI-190, LICOR, Germany) and 0.5 is the factor that accounts for the partitioning of energy between the two photosystems.
The non-photochemical quenching (NPQ), which is a mechanism of energy dissipation as heat, was calculated according to Serôdio et al., (2005a):
where Fm’m corresponds to the maximum Fm’ measured during the fluorescence measurements obtained here for an intensity of 110 µmol photons.m-2.s-1 corresponding to the lowest of the 16 different light intensities used during the actinic light application.
In order to characterize the microphytobenthic biofilm physiological condition, the optimal quantum yield of PSII photochemistry (Genty et al., 1989) is calculated as the ratio:
where F0 is the minimal fluorescence and Fm is the maximal fluorescence obtained during the application of a saturating pulse of white light (0.8 s, 2500 µmol photons.m-2.s-1), both levels measured after a period of 10 minutes in darkness. This parameter was measured before and after experimentation. For reliability of fluorescence measurements, gain, damping and intensity of the modulated light of the Diving-PAM was preliminary defined to obtain a sufficient Ft value (> 130) for the entire experiment. All fluorescence data presented in this study were averaged from the 14 values obtained for each light intensity.
2.2.2 A fully controlled environment
These two measurement tools were used in a climatic chamber (Fitoclima s600, Aralab, Portugal) which enables to control different parameters (light intensity, air humidity or temperature) (Figure 1). To our knowledge, such a climatic chamber has never been used for studies on microphytobenthos, but the literature contains studies carried out with this type of chamber on kelps (Martins et al., 2022) or, in most cases, on terrestrial autotrophic organisms, as done with Arabidopsis thaliana (Sattari Vayghan et al., 2022). With the previously described microsensors/PAM configuration, the light applied to the biofilm measurement spots varied from 0 to 780 µmol photons.m-2.s-1. To reach intensities close to the maximal values that can be observed in the field, an additional light source with a fiber optic guide (KL 2500 LCD, Schott, Germany) was added to the one integrated in the climatic chamber. In this way, the climatic chamber coupled with the additional lighting can create a light environment ranging from 0 to 1620 µmol photons.m-2.s-1. The system was programmed to provide 15 different light intensities, in addition to darkness.
To ensure that additional light sources have no effect on the microphytobenthic primary production, oxygen fluxes were measured under controlled conditions of temperature and air humidity for three identical light intensities using three different light modalities: (i) chamber daylight lighting alone, (ii) additional daylight lighting alone (KL 2500, Schott, Germany), and (iii) both chamber and additional daylight lighting together (50%/50%). The light intensities chosen corresponded to a low (200 µmol photons.m-2.s-1), a medium (475 µmol photons.m-2.s-1) and a high light intensity (1020 µmol photons.m-2.s-1). This high light intensity was reached by reducing the number of microsensors above the sediment and by positioning the sediment surface closer to the light source.
Furthermore, in order to avoid that the microsensors perform profiles at the same places, the system has been equipped with a programmable turntable (Mouvements Phenix, France) controlled by an Arduino system on which the sediment core can be placed to be studied. This has two advantages: (i) not to create sediment disturbance during a second penetration of the microsensor and (ii) to allow integration of the spatial micro-heterogeneity of the microphytobenthic community.
Thus, the experimental set-up presented here allows to create a range of abiotic conditions that can be replicated in order to perform experiments under the same conditions. Although we have only varied the light intensity, it is possible to vary one or more parameters at a time. Here, as an illustration, we presented the ability of the system to perform P-I curves, with a stepwise varying light intensity, at a constant air humidity level (70%) and a constant temperature level (12°C) corresponding to the average climatic parameters of the to last 5 days before sampling.
2.3 Automation of data acquisition: an opening to experimental opportunities
The whole system (Arduino for the rotation of the sediment core, light variation, microsensors movement sequence and fluorescence signal acquisition) was programmed in such a way that the measurement procedure of the oxygen profiles and fluorescence took place under an automated increase of the light intensity by steps time of 44 minutes to allow the various measurements to take place. For this purpose, the various components of the system were synchronized. Every 11 minutes, a microprofiling sequence with 2 microsensors located approximately 2 mm above the sediment was programmed in a way to reach the air-sediment interface at the same time. At the end of the profiles (when the microsensors have returned to their safe position), the turntable was programmed to rotate by 5°. Similarly to the microsensors, the optical fiber for fluorescence measurements with the Diving-PAM was placed at a 45° angle to the sediment surface to avoid shading the sediment, between the two microsensors in order to perform measurements at different locations in the sediment core. Ft and Fm’ measurements are programmed to be automatically triggered every 3 minutes allowing three replicate measurements at the same location before each rotation of the sediment core. Concurrently, the increase in light intensity was programmed to go in steps from 0 to 1620 µmol photons.m-2.s-1 every 4 microprofiling sequences. Thus, for darkness and each of the 15 light intensities, two profiles with a vertical measurement made every 50 µm were acquired during the first 11 minutes, then two more during the following 11 minutes, four times for a total of 8 profiles per light intensity (4 replicates × 2 microsensors).
Before each measurement at a given depth, microsensors were systematically stopped during a stabilization time of 4 seconds with the purpose of having a 90% reliability of the measurement. Each profile was carried out down to a depth of 4.5 mm in order to systematically reach the anoxic layer. Oxygen penetration depth (OPD) was defined as the depth where O2 concentration was steadily lower than 1% of the oxygen interface concentration (Cai and Sayles, 1996). Oxygen partial pressure was converted to oxygen concentration as a function of measured surface sediment salinity and temperature (Garcia and Gordon, 1992). In addition to this OPD, the depth of the production peak, i.e. the depth of maximum oxygen concentration, as well as the thickness of the production peak, corresponding to the depth at which the oxygen concentration at the interface is reached in the sediment (below the maximum oxygen concentration), were measured.
Vertical oxygen microprofiles were used to numerically estimate net oxygen production (NOP) as a function of depth using the SensorTrace (Unisense, Denmark) numerical profiling software, based on the model developed by Berg et al. (1998). This model is based on a series of least-squares fits to the measured steady-state oxygen profiles and requires the integration of several parameters: porosity (in our case, the average value of porosity measured over the surficial 4 millimeters), temperature and salinity of the studied sediment with an accuracy of 0.01°C and 0.01. Among different proposed models, the user chooses with the help of an F value the model which presents the best adjustment. For all calculations, we assumed steady state and vertical exchanges only (1D model), and profiles showing evident sign of bioturbation were not considered. Gross oxygen production (GOP) of microphytobenthos was calculated from the NOP values by subtracting the average respiratory fluxes measured at dark.
2.4 P-I curve fitting and statistical analysis
The characteristic photosynthetic parameters of the microphytobenthic communities, i.e. the initial slope of the non-saturated photosynthetic rate (α), the saturation onset parameter (Ik) and the maximum production (Pmax) (Coutinho and Zingmark, 1987; Henley, 1993) were assessed thanks to the statistical software R (The R Core Team, 2017) and statistical package Phytotools (V1.0) by using the model of Eilers and Peeters (1988):
where y is the photosynthetic rate and I the photosynthetic photon flux density (PPFD).
Normality and homogeneity of variance were tested using the Shapiro-Wilk W-test, and results indicated non-normal distribution of the GOP data. Hence, non-parametric Wilcoxon tests were applied to compare GOP obtained using the different light conditions by comparing 10 replicates for each light source. The R statistical software was used to perform this statistical analysis.
3 Results
3.1 Testing of the lighting system
Since the system is composed of two different daylight sources, we ensured that the three lighting modalities used in our experimentation did not have a significant impact on the biological processes we measured. No significant difference in GOP was observed between the three light sources for each light condition (p>0.05, n=10, Wilcoxon test) for the low, medium and high light intensities respectively (Figure 2). Surface temperature measurements were also taken to ensure that there were no heating issues from the lighting. For a continuous 12-hour illumination, the surface temperature of the sediment changed from 11.7 ± 0.2°C (in the dark) to 12.0 ± 0.1°C (at 1620 µmol photons.m-2.s-1) (p>0.05, n=8, Wilcoxon test).
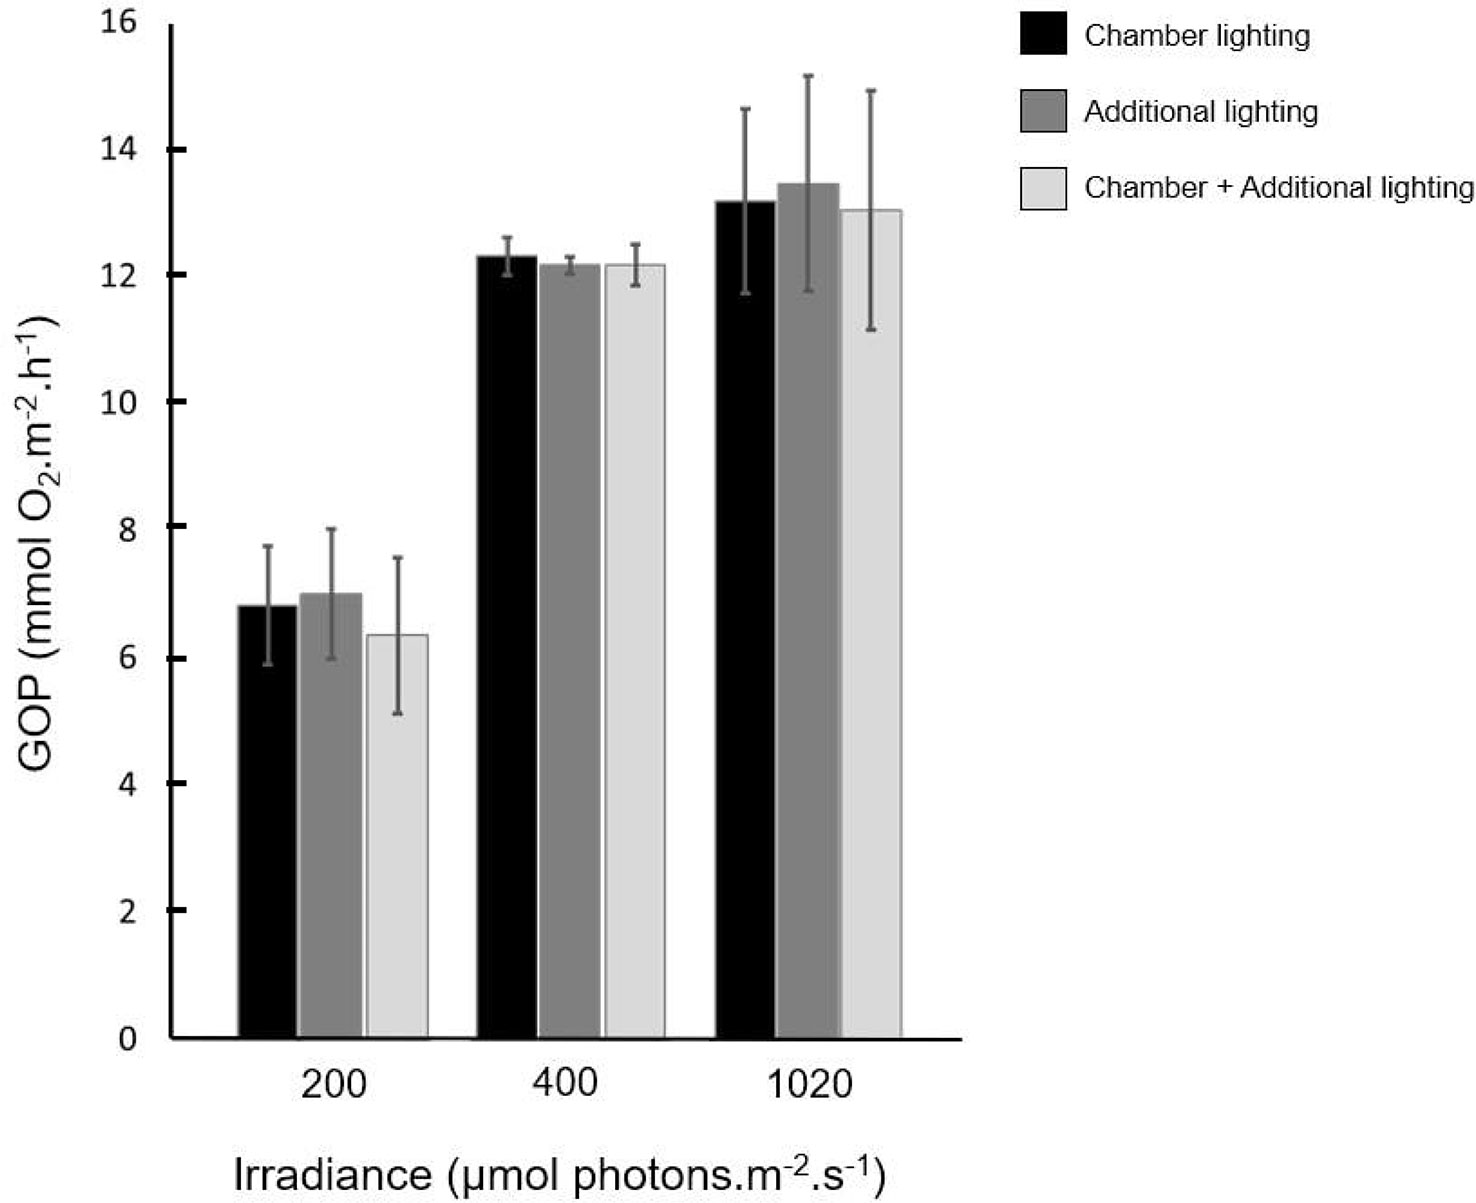
Figure 2 Gross oxygen production measured for 3 light intensities under 3 different light sources: chamber daylight lighting (black), additional daylight lighting (dark grey) and chamber combined to additional daylight lighting (light grey).
3.2 An automated creation for a large oxygen fluxes dataset
The surface temperature of the sediment core was 12.1°C, the salinity 33.6 and the average Chl a concentration 270.93 ± 32.49 mg.m-2. In the two centimeters of surficial sediment, the average porosity decreased downward from 0.92 ± 0.02 to 0.65 ± 0.03. Through the use of the autonomous system, 128 vertical oxygen profiles were acquired at different locations in the sediment core. Among all these profiles, 6 were not processed due to evidence of bioturbation that did not allow accurate profile fitting, giving a large dataset of 122 profiles. Some vertical oxygen profiles obtained at different light intensities and their corresponding model fits are presented in Figure 3. The 0 mm depth corresponds to the sediment-air interface defined as the last value showing an oxygen concentration similar to that observed in air. The profile obtained at dark (0 µmol photons.m-2.s-1) showed an exponential decrease in oxygen concentration from the first micrometers, down to anoxia values (under 1% of the interface oxygen concentration, i.e. 2.5 µM) reached at 0.65 mm depth. The two other profiles, obtained under a light intensity of 565 and 1620 µmol photons.m-2.s-1 showed a maximum oxygen concentration at a depth of 0.15 and 0.20 mm respectively, with values decreasing further down until reaching a zero concentration value corresponding to anoxia at 1.05 and 1.10 mm.
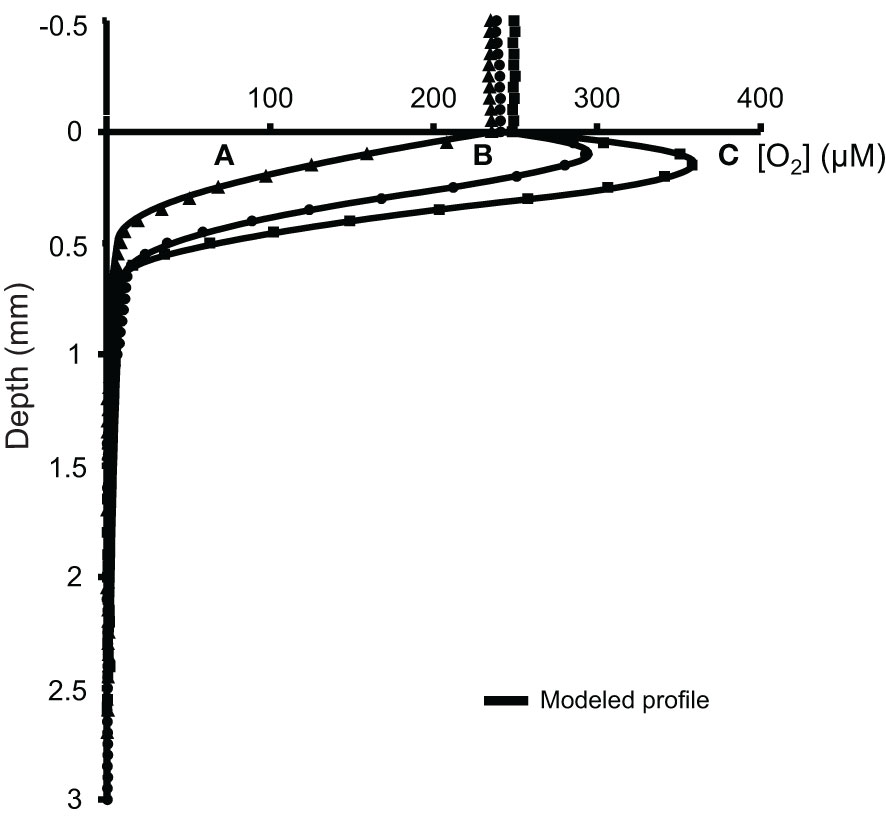
Figure 3 Raw oxygen concentrations measured under 3 light intensities versus depth in the superficial sediments with associated model fits. Profile (A) 0 µmol photons.m-2.s-1, profile (B) 565 µmol photons.m-2.s-1 and profile (C) 1650 µmol photons.m-2.s-1.
The most representative fit based on the best F value (Berg et al., 1998) allowed calculation of net oxygen production (NOP) integrated on depth. Over the entire dataset, average NOP values ranged from -4.52 ± 0.48 to 12.39 ± 2.93 mmol O2.m-2.h-1 while the oxygen penetration depth varied between 0.65 and 1.85 mm. The average GOP values ranged from 0.00 ± 0.48 to 16.91 ± 2.93 mmol O2.m-2.h-1.
3.3 P-I curve acquisition under increasing light
The 122 GOP values were related to the light values to construct a P-I curve. The initial slope (α) was 0.54 ± 0.11, the maximum production (Pmax) 14.68 ± 3.70 mmol O2.m-2.h-1 and the saturation onset parameter (Ik) 478 ± 122 µmol photons.m-2.s-1. The scatterplot was also fitted with 4 P-I curves, each corresponding to a time of exposure to a given light intensity (i.e. 11, 22, 33 and 44 minutes) (Figure 4A). The P-I curve corresponding to the data acquired during the first 11 minutes was largely different from the three others, with an α two times lower, an Ik 40% higher and a Pmax 10% higher (Table 1). The mean GOP values for each light intensity were then compared to those calculated with all the GOP values without the ones measured during the first 11 minutes (Figure 4B). The mean GOP values obtained for the data between 0 and 475 µmol photons.m-2.s-1 (i.e. from dark to Ik), was significantly different from the mean GOP values obtained for the data without the first 11 minutes (p<0.05, n=8, Wilcoxon test). Thus, only the data acquired from 22 to 44 minutes of illumination were retained for the calculation of the NOP and GOP.
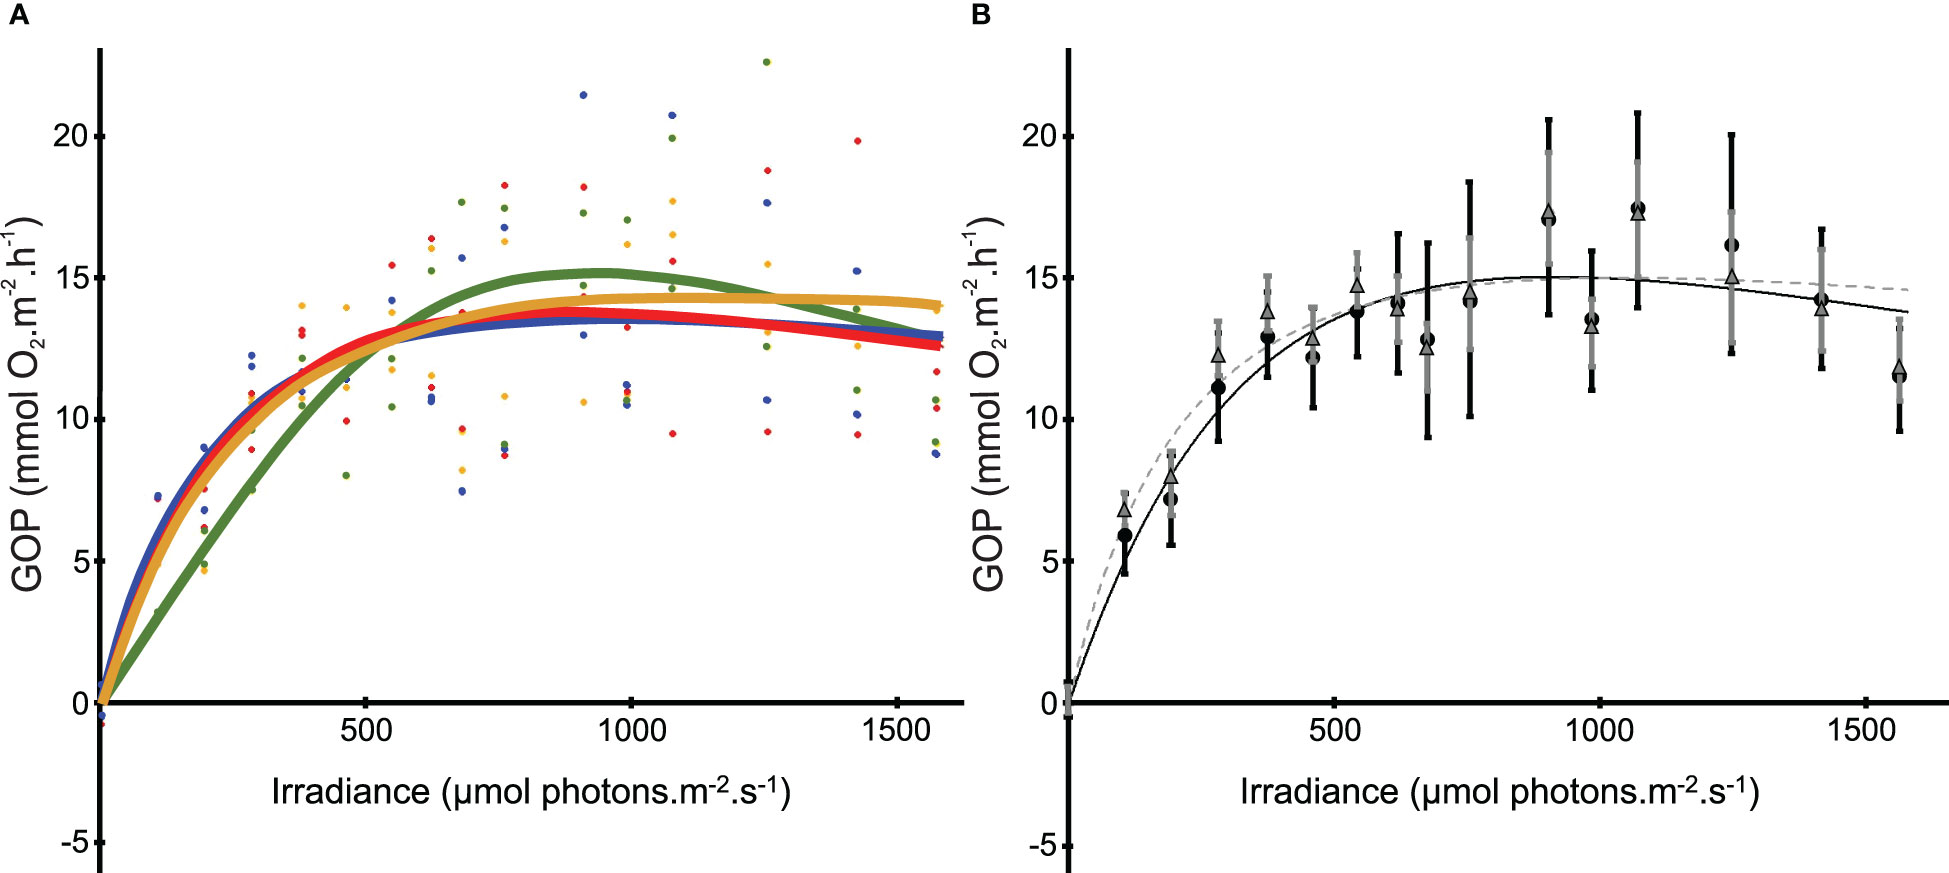
Figure 4 (A) Photosynthesis- Irradiance curves fitted following the time exposure to the different light intensities. Green curve fitted on the points corresponds to GOP calculated with the profiles carried out the first 11 minutes, orange between 11 and 22 minutes of exposure, red between 22 and 33 minutes of exposure and blue between 33 and 44 minutes of exposure for two microsensors. (B) Photosynthesis- Irradiance curves fitted on all dataset (black solid line, black dots corresponding to mean ± s.d.) and on all dataset excepted the first 11 minutes data (grey dashed line, grey triangle corresponding to mean ± s.d.).
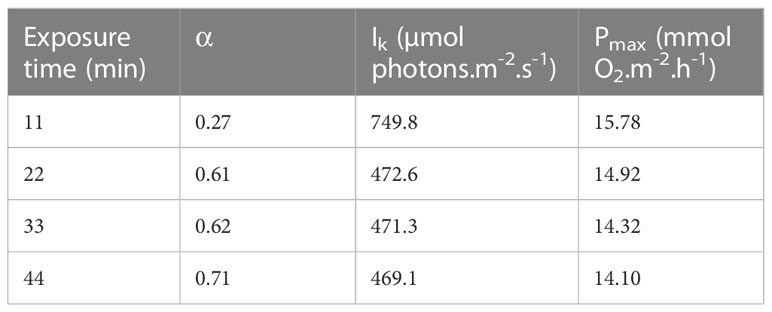
Table 1 Characteristic photosynthetic parameters of the Photosynthesis-Irradiance curves modeled following the time exposure to the different light intensities.
3.4 Fluorescence measurements
At the beginning of the experiment, before any exposure to light in the climatic chamber, Fv/Fm was 0.644 ± 0.003 and reached 0.590 ± 0.073 at the end. Ft regularly increased from 1416 ± 16 at dark to 2136 ± 82 at 475 µmol photons.m-2.s-1, then decreased to 833 ± 35 at 1620 µmol photons.m-2.s-1 (Figure 5A). NPQ demonstrated a linear increase from 475 to 1107 µmol photons.m-2.s-1, before reaching a plateau (Figure 5B).
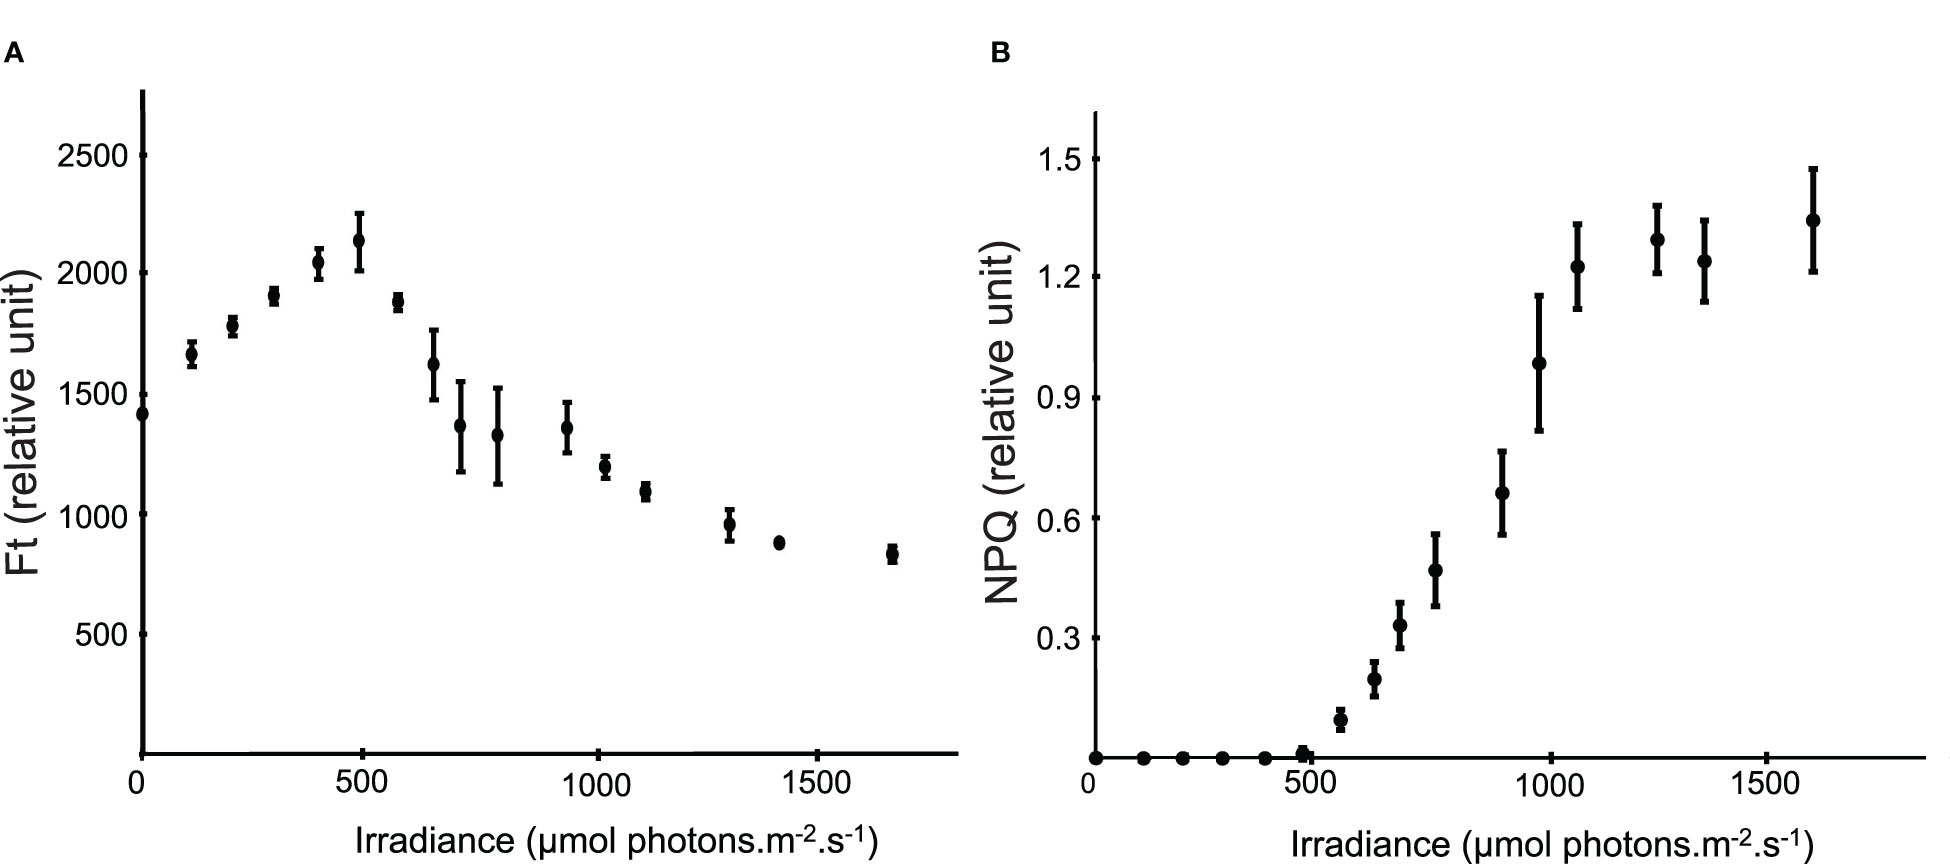
Figure 5 (A) Instantaneous fluorescence (Ft) according to the light intensity (each point corresponds to the mean ± s.d. of 14 Ft measurements, i.e. measurements performed every 3 minutes during 44 minutes). (B) Non photochemical quenching (NPQ) according to the light intensity (each point corresponds to the mean ± s.d. of 14 NPQ measurements, i.e. measurements performed every 3 minutes during 44 minutes).
3.5 Dispersion analysis: variability of photosynthetic activity within temporal heterogeneity
In order to study the short-term effect of a change in light intensity on microphytobenthic photosynthetic activity, the standard deviation (s.d.) was calculated on GOP and rETR dataset for each intensity, both on all values and on all values except the ones obtained during the first 11 minutes of exposition at a given light intensity (Figures 6A, B). This dispersion analysis has been used as a proxy of the variability of the microphytobenthic photosynthetic in response to specific light intensities. For GOP data, the s.d. ranged from 0.57 to 4.61 mmol O2.m-2.h-1 when calculated on all values and from 0.57 to 4.45 mmol O2.m-2.h-1 for values without the first 11 minutes (Figure 6A). Whatever the dataset, three peaks can be observed in GOP s.d., at 200, 780 and 1290 µmol photons.m-2.s-1 respectively. For rETR, the s.d. ranged from 0.45 to 28.35 for all values and from 0.35 to 35.00 for values without the first 11 minutes (Figure 6B). Whatever the dataset, three peaks can be observed in rETR s.d., at 0, 475 and 780 µmol photons.m-2.s-1 respectively.
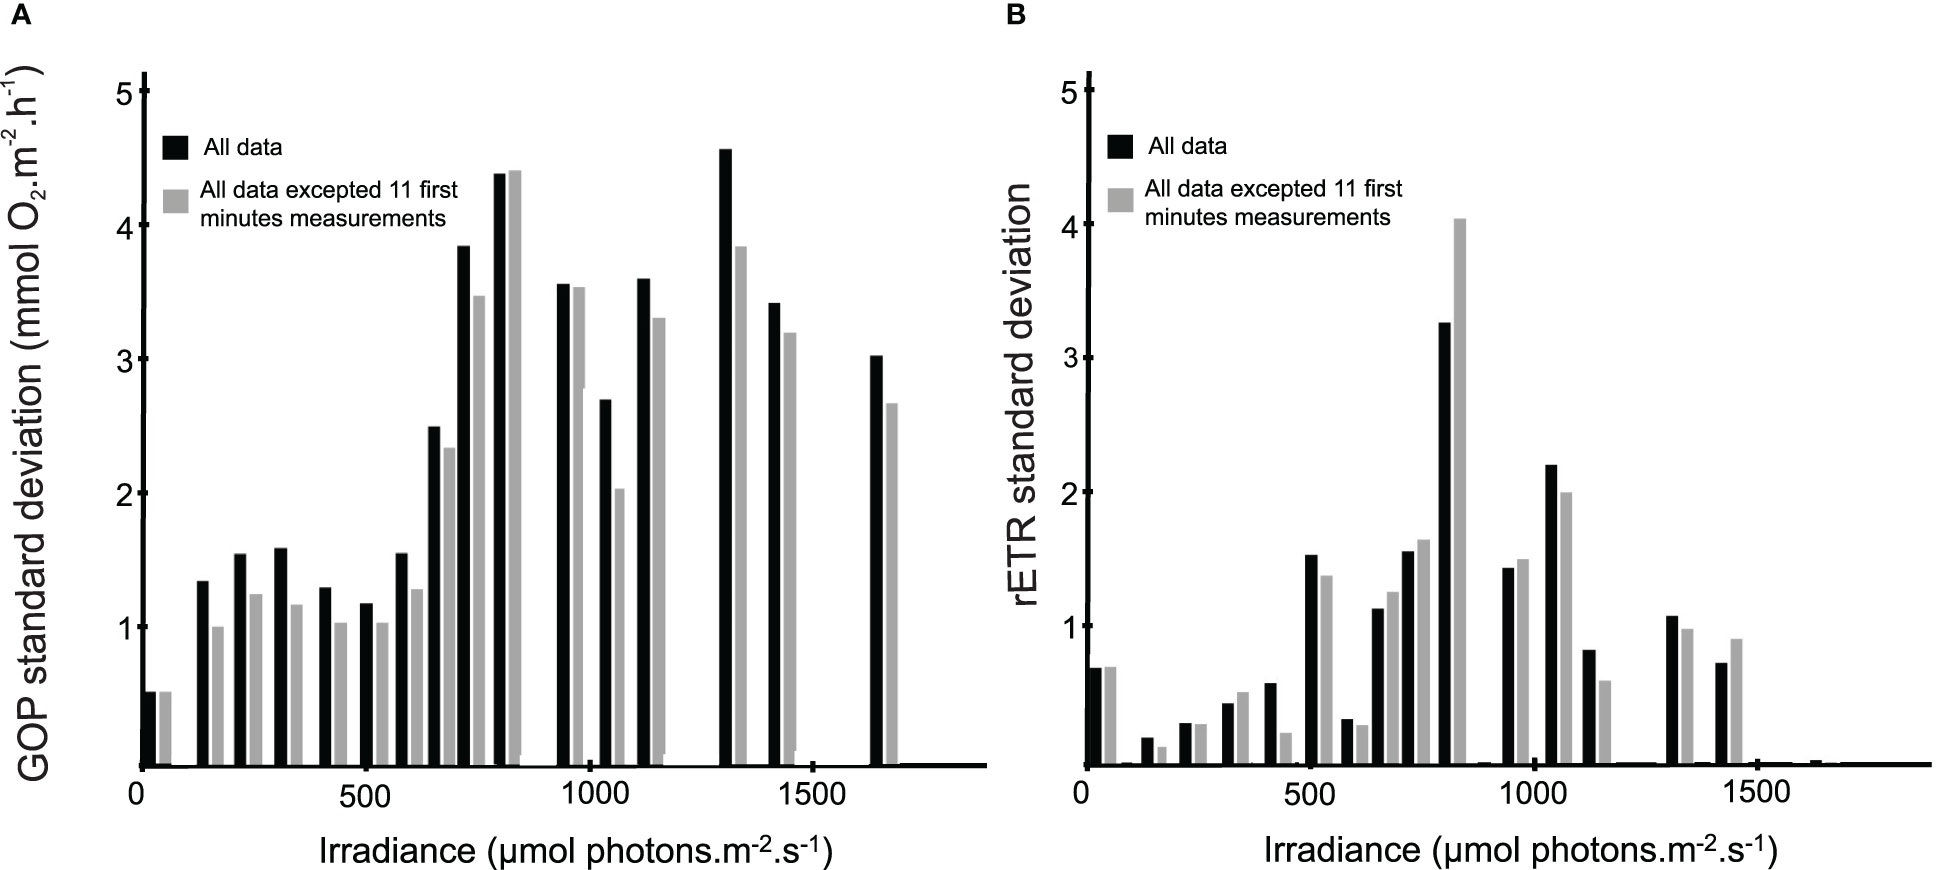
Figure 6 Standard deviation as a function of the light intensity based on GOP (A) and rETR (B). Black sticks correspond to s.d. calculated on all data (n=8 for GOP and n=14 for rETR) and grey sticks correspond to s.d. calculated on all data excluding the 11 first minutes (n=6 for GOP and n=10 for rETR).
3.6 Mean depth of the maximum O2 production and thickness of the production peak
The mean depth of the maximum oxygen concentration increased from 0 to 475 µmol photons.m-2.s-1 from 0.00 ± 0.00 to 2.18 ± 0.31 mm, then decreased up to a depth of 1.29 ± 0.50 mm during the exposition at the 3 following light intensities, to reach again a second maxima of 1.93 ± 0.37 mm at about 935 µmol photons.m-2.s-1 (Figure 7A). The thickness of the production peak followed the same pattern (Figure 7B) with a peak reaching a thickness of 3.75 ± 0.38 mm at 475 µmol photons.m-2.s-1, followed by a decrease to 2.71 + 0.39 mm at 700 µmol photons.m-2.s-1 and an increase to reach a thickness of 0.40 + 0.29 mm for the second maximum at 935 µmol photons.m-2.s-1.
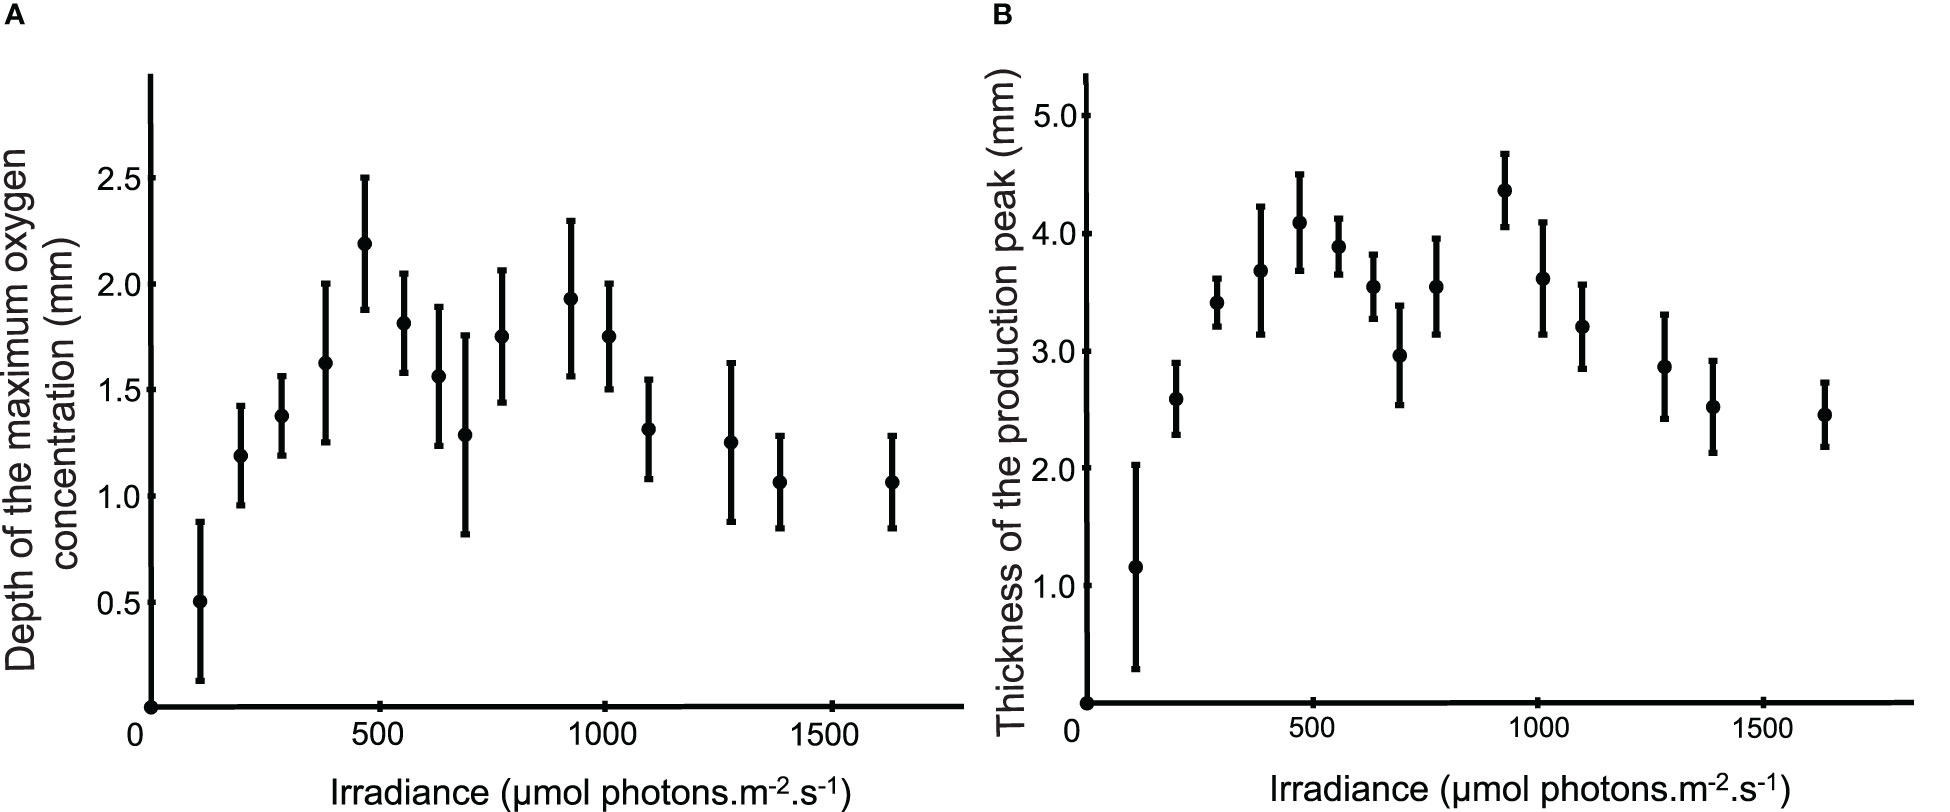
Figure 7 (A) Mean (± s.d.) depth of the maximum oxygen concentration according to the light intensity (n=6, i.e. all dataset excepted the 11 first minutes data). (B) Mean (± s.d.) thickness of the production peak according to the light intensity (n=6, i.e. all dataset excepted the 11 first minutes data).
4 Discussion
4.1 The development of an autonomous system to study photophysiology and primary production of microphytobenthos
4.1.1 Limitations of past studies and methodological contributions of the autonomous system
With field experiments, the tide usually forces users to carry out short experiments and sometimes with datasets with a small sample size. The impossibility of carrying out two comparative studies under strictly identical conditions or simply the number of people mobilized for the field study are among the many factors that make in situ acquisition complicated. Light response curves or photosynthesis – irradiance curves are usually used to determine a range of photophysiological and productivity parameters. However, the long duration of the light curves often makes replication of measurements impossible, even with fluorescence acquisition (Perkins et al., 2010), and P-I curves with less than 30 points are usually performed either in situ (Denis and Desreumaux, 2009) or in laboratory (Gerbersdorf et al., 2005; Santema and Huettel, 2018). Due to the long time period spent obtaining a single set of measurements, investigation of temporal or spatial variation is also complicated (Perkins et al., 2010). Using the autonomous system we developed, a P-I curve was constructed on a scatterplot of 122 points, with 8 replicates for each light intensity. Contrary to the method of measuring fluorescence (Morelle et al., 2018) or eddy covariance (Merikhi et al., 2021) which are techniques that do not take depth into account, to our knowledge, no study on microphytobenthos using microsensor technique has allowed the construction of a P-I curve with such a high number of values. This was made possible by the synchronization and automation of the different elements composing the autonomous system. First, the use of a lighting system added to a climate chamber allowed the programming of irradiance levels over a wide range of intensities while controlling the other parameters. Secondly, the use of a microprofiler on which two microsensors were mounted allowed the acquisition of 2 profiles at the same time. And thirdly, the integration of an automatic rotation between the different profile acquisitions allowed to face two constraints often discussed in the literature: sediment disturbance generated by successive oxygen microsensors penetration (Revsbech, 1989b) and the limit of using microsensors because of spatial heterogeneity (Glud, 2006; Denis et al., 2012). As previously shown for sandy (Blanchard, 1990; Spilmont et al., 2011) and muddy sediments (Jesus et al., 2005; Daggers et al., 2020), microphytobenthos is heterogeneously distributed at the sediment surface, thus, by using too few replicates, spatial heterogeneity cannot be considered or only partially (Glud, 2006). According to Spilmont et al. (2011), in the case of a production estimation for the realization of production budget, the sampling surface must be comprised between 30 and 220 cm2 on a sandy or even sandy-muddy sediment. To our knowledge, no study to date has established a study surface that would be representative of a muddy sediment. In our study and according to Rabouille et al. (2003), a dataset of 122 vertical profiles would allow to sample between 13 and 26 cm2 (i.e. spatial resolution of a microsensor between 0.1 and 0.2 cm2), which highlights the complementarity with the PAM, which has a higher spatial representativeness. The system we developed also allows to take into account changes in biofilm surface community that may also occur with light variations (intensity, duration), such as phototaxis, micro-cycling, as well as possible diel and tidal patterns in vertical migration (Perkins et al., 2010; Cartaxana et al., 2016b). By combining a regular increase of the light intensity with incremental light steps, it is possible to simulate an emersion with ideal light conditions at sunrise, while analyzing the response of the microphytobenthos to a given illumination. Beyond its capacity to acquire a large dataset thanks to a total automation of the different components of the system, it is important to note that this system allows to create a wide range of physico-chemical conditions, which makes possible the work in controlled conditions and simulate a wide variety of climate scenarios.
4.1.2 Laboratory tests
In order to have an autonomous system for the acquisition of P-I curves covering the whole range of light intensities encountered in the field (up to about 2000 µmol photons.m-2.s-1, Denis and Desreumaux, 2009), two additive light sources were used. The use of both types of light sources, alone or in combination, did not result in significant differences in photosynthetic activity as measured through oxygen production. In addition, the duration of exposure to light in the laboratory was calculated and tested to ensure that it was compatible with the total emersion time that microphytbenthic biofilms undergo in situ, conducting to 8 replicate profiles per light intensity. But according to the user’s needs, by making the compromise of reducing the number of light intensities, it is possible to increase the number of replicates per light intensity, for instance to better integrate spatial heterogeneity (higher replicate profiles). Thus, there is a trade-off between the number of light intensities applied to the microphytobenthic community and the number of profile replicates per intensity. Kwon et al. (2018) have chosen to acquire a large number of P-I curves from 3-4 replicates of measurements for only 5 light intensities, hence building a dataset of 1870 oxygen microprofiles during a 27 month-long survey, equivalent to only 15 P-I curves in our case. The high values of Fv/Fm obtained before and after the realization of the P-I curve acquisition (without any significant change) reflect the good physiological state of the biofilm as well as the photoregulatory capacity of the microphytobenthic assemblage during the whole experiment (Rasmussen et al., 1983; Barranguet et al., 1998; Chevalier et al., 2010), in accordance with no evidence of photoinhibition on the P-I curve (no decrease in the production rate at high light intensities).
4.2 Validation of the measurement protocol: productivity comparison
By reporting the maximum production obtained in this study to the biomass of microphytobenthos, we calculated a productivity of 0.06 ± 0.01 mmol O2.m-2.h-1 per gram of Chl a, a value comparable to 0.07 ± 0.02 mmol O2.m-2.h-1 per gram of Chl a obtained for the same study site and the same season by Denis and Desreumaux (2009). However, Denis and Desreumaux (2009) observed larger variations which could be attributed to a smaller dataset but also to the impossibility of carrying out replicate measurements under standard conditions in the field. Indeed, a significant bias can be introduced by integrating few values per light intensity (MacIntyre et al., 1996; Spilmont et al., 2011). Therefore, the autonomous acquisition system, making possible the acquisition of replicates per light intensity, could allow to go much further in understanding the mechanisms of primary production.
4.3 Feedback on the autonomous system: stabilization time of the fluxes
Modeling of P-I curves as a function of time revealed significant differences of GOP between the first 11 minutes compared to the following 33 minutes of exposure to a given light intensity. Regarding the photosynthetic dynamics of microphytobenthos, two main hypotheses can be formulated to explain this difference. Among the different responses to light variations, the migratory behavior of microphytobenthos by phototactism in response to light variations (Morris et al., 2008) is a strategy employed to either access greater illumination or to escape from excessive intensities (Perkins et al., 2001; Serôdio et al., 2005b; Mouget et al., 2008; Serôdio et al., 2012; Du et al., 2018). Several studies have investigated microphytobenthic migration behavior, and the fastest species have been observed to move at speeds ranging from 2 to 20 µm.s–1 (Cohn and Disparti, 1994; Consalvey et al., 2004), theoretically allowing them to migrate distances of up to 1 millimeter in approximately 1 to 9 minutes. Beyond its migratory capacity, microphytobenthos is known to implement various photoacclimation mechanisms, such as changes in the number (Pniewski and Piasecka-Jedrzejak, 2020) or size conformation of the photosynthetic unit (Kromkamp and Limbeek, 1993). These mechanisms are common under highly variable light conditions (Falkowski and Owens, 1980; Behrenfeld et al., 1998), which are characteristic of temperate estuarine mudflats subjected to macrotidal regimes (alternating emersion/immersion, cloud cover, resuspension, bioturbation, burial (Josefson et al., 2012)). It is important to note that our data acquisition procedure involved performing the P-I curves sequentially, which is a common practice but unavoidably results in a lack of independence among the measurements. Secondly, the hypothesis that would explain this stabilization time lies in the oxygen diffusion time. According to Fick’s diffusion laws (Fick, 1995), oxygen diffuses from the most concentrated area to the least concentrated with a diffusion speed that can be variable according to the porosity. This diffusion is not instantaneous and thus, once the microphytobenthos is in optimal light conditions after having migrated and/or set up its different photoadaptive mechanisms, the oxygen concentrations will tend to be balanced in the surrounding sedimentary layers. The model of Berg et al. (1998) that allows the calculation of depth-integrated oxygen fluxes is based on a steady-state assumption. It takes into account the vertical diffusion in the calculation, allowing to define successive production/consumption zones. In this way, the vertical diffusion time is taken into account. On the other hand, as the microphytobenthos is heterogeneously distributed, the microsensor does not always pass exactly where the maximum amount of oxygen is produced, which can lead to the taking into account of a stabilization time so that the microsensors can measure the photosynthetic activity of the microphytobenthos in a state of equilibrium for O2 concentration.
We have shown here that the curves obtained by means of 8 repetitions carried out with the automated laboratory system allowed to highlight a difference in the creation of P-I curve between the one obtained on the data resulting from the profiles acquired during the first 11 minutes of illumination and those acquired after 11 minutes of illumination. Depending on the study goal, it may be interesting to study this flux stabilization time or to avoid it. If the objective is to study microphytobenthos physiology and its primary production capacities, it will be recommended, before each profile, to take into account a lag time by illuminating the sediment for about ten minutes in order to reach a steady state. On the other hand, if the objective is to extrapolate the photosynthetic activity of microphytobenthos to the natural environment, it is necessary to take into account short-term variations, including the fluxes measured during the first minutes. It is important to note that this equilibrium time is to be taken into account only for the measurements of oxygen flux by microsensors because the fluorescence technique allows the measurement of a photon flux, which does not need an equilibrium time since the photon flux measured by the PAM measures a process in progress and microsensors its result. Even so, caution must be taken when using this technique since the photoacclimation mechanisms are not instantaneous. Many authors use the rapid light curve (RLC) technique which allows acquisition within 1.5–2 minutes to obtain a P-I curve although there is always a variation corresponding to the short-term light history of the microphytobenthos using illuminations of the order of 10 to 20 seconds to perform the RLC (Serôdio et al., 2005b; Lefebvre et al., 2011).
Under field conditions, due to random changes in light during cloudy periods, the microphytobenthos is exposed to variable light conditions and must therefore migrate continuously in the sediment which leads to never presenting a totally stable flux value because the assumption of photosynthetic steady state cannot be made. It is to this technical limitation that our experimental system responds since it allows precise quantification of the photosynthetic capacities of microphytobenthos, something more complicated to set up in situ. It is in this way that the system developed here can be interesting because it is able to recreate these conditions in the laboratory while controlling all other parameters. Thus, the system presented here made it possible to highlight the stabilization time of oxygen fluxes when the microphytobenthos is exposed to a given light intensity. The authors therefore recommend a minimum adaptation time of 11 minutes to a new intensity when measurements are made by applying light of increasing intensity in steps. To go further, it is important to note that 11 minutes corresponds to the entire completion of a profile. Therefore, the 11 minutes announced correspond to the maximum stabilization time. Indeed, the first profile sequence takes about 7 minutes to reach the OPD. Thus, between the 7th and 11th minute of acquisition (i.e. the beginning of the second profile acquisition sequence), the microphytobenthos was exposed to the same light intensity for about 4 minutes, during which time the fluxes were stabilized.
4.4 An autonomous and standardized methodological approach integrating complementary tools to go further in the understanding of photosynthetic mechanisms
The experimental system presented here allows to accurately describe under controlled conditions the photosynthetic activity of microphytobenthos and its spatial variability on the horizontal, but also the vertical plane. Several parameters and measurements are coupled in order to have precise information about the mechanisms happening in 3 dimensions at the sediment surface. Thanks to the exploitation of the vertical oxygen profiles, it is possible to obtain information concerning the depth at which the most important photosynthetic activity takes place through the average depth of the production, but also the intensity of this activity via the average thickness of the oxygen peak. The depth of the oxygen peak as a function of intensity gives information on the migratory kinetics of the microphytobenthos, while on the other hand, the thickness of the peak integrates diffusive mechanisms.
As the light intensity increased during P-I curve establishment, the photosynthetic and migratory activity of the microphytobenthos widely varied. Different light intensity ranges were identified: (i) from 0 to 475 µmol photons.m-2.s-1, (ii) from 475 to 780 µmol photons.m-2.s-1, (iii) from 780 to 1110 µmol photons.m-2.s-1 and (iv) from 1110 to 1650 µmol photons.m-2.s-1. From 0 to 475 µmol photons.m-2.s-1 (i.e. up to the saturation onset parameter Ik), the instantaneous fluorescence Ft increased, testifying that the microphytobenthos migrated towards the sediment surface (Serôdio et al., 1997; Morris et al., 2008; Cartaxana et al., 2016a). Even if there are models that allow to adjust the information on the depth (Morelle et al., 2018), PAM fluorometry only gives surface information as widely discussed in the literature (Kromkamp et al., 1998; Forster and Kromkamp, 2004; Serôdio, 2004) and can therefore be considered as a proxy of the active microphytobenthic biomass. This observation means that maximum of active microphytobenthic biomass could be found at Ik. This result is in line with the increase in photosynthetic activity as observed through the linear increase of GOP from 0 to 475 µmol photons.m-2.s-1. Moreover, this increase in photosynthetic activity occurred with little variability with respect to the dispersion values of GOP and rETR. In addition, this increase in photosynthetic activity, even though the microphytobenthos migrated towards the surface, caused a burying of the maximum oxygen concentration and an increase in the thickness of the production peak, which is a signal of the accumulation of primary producers on the surface of the sediment. These features are in agreement with the progressive arrival of microphytobenthos in the superficial zone of the sediment, the most suitable for its photosynthetic activity. Moreover, up to Ik, the microphytobenthos did not show signs of excessive light exposure since the NPQ value did not increase.
From 475 to 780 µmol photons.m-2.s-1, photoprotective mechanisms were evidenced by the increase in NPQ, allowing the microphytobenthos to dissipate the energy excess as heat (Serôdio et al., 2005a). In parallel, it was beyond Ik that the fluorescence signal Ft decreased, suggesting that some microphytobenthic organisms were migrating towards deeper sedimentary layers as a strategy to avoid photoinhibition due to excessive light energy that was neither used for photosynthetic electron transport nor dissipated as heat when potential saturation of photosystems occurred (Admiraal, 1984). Nevertheless, no decrease in GOP was observed beyond Ik, suggesting that photosynthetic activity did not globally decrease, but variations in the depth and average thickness of the peak were clearly observed, suggesting that the production peak rose by thinning towards the interface while compensating with a higher intensity.
At 780 µmol photons.m-2.s-1, a change in the migratory dynamics and in the microphytobenthic photosynthetic activity occurred, marked by a strong heterogeneity in GOP and rETR values. It is conceivable that other groups of microphytobenthic organisms migrated to deeper sedimentary layers. Previous studies have already shown that within the same biofilm, the light preference could be highly variable between species and induced migratory movements at different light intensities (Hanelt et al., 1993; Serôdio et al., 2006), consequently implying changes in the depth and thickness of the oxygen peak. Concurrently with this migration, the NPQ continued to increase progressively until it reached a plateau from 1110 µmol photons.m-2.s-1, value generally observed in the literature for intertidal mudflats in a temperate environment (Pniewski et al., 2016; Morelle et al., 2018).
From 1110 to 1650 µmol photons.m-2.s-1, a GOP dispersion peak was visible. In the field study of Denis et al. (2012), this variability was also observable, with GOP dispersion at high irradiance about two to three times higher than for previous light intensities. As light is stronger, it also penetrates deeper into the sedimentary layers. Kühl et al. (1997) showed that the photic zone could reach about 0.6 mm in muddy sediments colonized by microbial mats (grain size< 63 µm). Thus, although the microphytobenthos has migrated in the sediment, it still received high light intensities, inducing a strong variability of oxygen production in the subsurface. A possible trade-off between vertical migration and photoprotection has been hypothesized (van Leeuwee et al., 2008; Jesus et al., 2009), which could explain this disparity in photosynthetic response, creating a strong dispersion. But Blommaert et al. (2017) demonstrated that for temperate ecosystems, there is no trade-off between vertical migration mechanisms and photoprotective mechanisms. On the other hand, under high illuminations, other parameters can lead to a significant dispersion of the GOP. Cell size, for example, is a factor that can impact the photoprotective capacity of microphytobenthos, as due to its small size, pigment self-shading may be less, making cells more vulnerable to photodamages (Key et al., 2010) and thus requiring more photoprotection. On the other hand, no high dispersion was visible through the dispersion measurements on the rETR. Indeed, because microphytobenthic communities are composed of epipelic organisms (which move in between sediment particles) and epipsammic organisms (which live attached to sediment particles), those living fixed will remain at the surface during high light levels. As shown by Barnett et al. (2015), these organisms have a greater capacity for NPQ and xanthophyll cycling, and will have a greater tolerance to high light levels.
4.5 Comments and recommendations
One of the main advantages of this system is the design and setting of a wide range of physico-chemical conditions, enabling reproducibility of laboratory measurements thanks to the possibility of working under standardized conditions. It allows to test the effect of a targeted parameter, but also the synergy of several parameters (salinity, temperature, light…) on different types of sediment, taking care to choose the appropriate microsensor. Furthermore, in addition to enabling the control of various parameters and standardizing measurements, this system additionally improves our comprehension of microphytobenthic photosynthetic capacities by allowing access to additional information through its automated acquisition of P-I curves, which enables the acquisition of large datasets. By analyzing oxygen flux stabilization time, migration moments through dispersion, and notable elements of a vertical profile (such as depth and thickness of the peak), this system contributes significantly to improving the understanding of microphytobenthic photosynthetic capacities. This improvement is particularly significant as incomplete or poorly supplied P-I curves are not valuable in scientific literature. But a common limit to any use of microsensors remains the time needed for data processing when the number of profiles becomes consequent. Furthermore, in the present experimental procedure, respiration is only calculated from oxygen profiles at dark. The additional use of the light-dark shift technique (Glud et al., 1992; Serôdio et al., 2001; Serôdio et al., 2007) for a few light intensities would allow considering respiration at light in the calculation of GOP, hence resulting in more accurate estimates. However, this method can be time-consuming, requires additional experimental setup, and is thus best used as an auxiliary experiment rather than a routine measurement technique in our P-I curve acquisition procedure.
The total cost of the system in the configuration presented here is approximately 90,000 Euros. This estimate includes all of the measurement equipment, but not all of the options for these measurement devices are necessary, especially the Diving-PAM or the microsensor system. Less expensive equipment exists for a much lower cost, bringing the system to an approximate cost of 25,000 to 30,000 euros. Such a budget would allow for the creation of a low or zero operating cost system. To go further in the development of this autonomous system, several possibilities are conceivable. Firstly, it is possible to go further in the control of the parameters by developing a module allowing to work in immersion in order to take into account additional parameters such as salinity, water height or current intensity for example. It would be also possible to integrate other devices allowing to have additional and complementary information such as a hyperspectral camera, allowing to obtain information on the variation of the surface biomass or a modular system of multi-parameter imaging, allowing to have an image of the entire surface of the sediment. Nevertheless, by adding extra-captors, it will be necessary to take care of the creation of self-shading, which is already a limiting factor in the number of microsensors used.
Data availability statement
The raw data supporting the conclusions of this article will be made available by the authors, without undue reservation.
Author contributions
Conceptualization, MM; Data curation, MM, FG, GD and LD; Formal analysis, MM, FG and LD; Methodology, MM, FG and LD; Supervision, FG and LD; Writing—review and editing, MM, FG and LD. All authors contributed to the article and approved the submitted version.
Funding
This work has been financially supported by the French Region Hauts-de-France and the Lille University.
Acknowledgments
We thank the Lille University for the financial participation in the publication of this manuscript in Open Access.
Conflict of interest
The authors declare that the research was conducted in the absence of any commercial or financial relationships that could be construed as a potential conflict of interest.
Publisher’s note
All claims expressed in this article are solely those of the authors and do not necessarily represent those of their affiliated organizations, or those of the publisher, the editors and the reviewers. Any product that may be evaluated in this article, or claim that may be made by its manufacturer, is not guaranteed or endorsed by the publisher.
Supplementary material
The Supplementary Material for this article can be found online at: https://www.frontiersin.org/articles/10.3389/fmars.2023.1167464/full#supplementary-material
References
Admiraal W. (1984). The ecology of estuarine sediment-inhabiting diatoms. Prog. Phyco. Res. 3, 269–322.
Barnett A., Méléder V., Blommaert L., Lepetit B., Gaudin P., Vyverman W., et al. (2015). Growth form defines physiological photoprotective capacity in intertidal benthic diatoms. ISME J. 9, 32–45. doi: 10.1038/ismej.2014.105
Barnett A., Méléder V., Dupuy C., Lavaud J. (2020). The vertical migratory rhythm of intertidal microphytobenthos in sediment depends on the light photoperiod, intensity, and spectrum: evidence for a positive effect of blue wavelengths. Front. Mar. Sci. 7. doi: 10.3389/fmars.2020.00212
Barranguet C., Kromkamp J., Peene J. (1998). Factors controlling primary production and photosynthetic characteristics of intertidal microphytobenthos. Mar. Ecol. Prog. Ser. 173, 117–126. doi: 10.3354/meps173117
Behrenfeld M. J., Prasil O., Kolber Z. S., Babin M., Falkowski P. G. (1998). Compensatory changes in photosystem II electron turnover rates protect photosynthesis from photoinhibition. Photosynth. Res. 58, 259–268. doi: 10.1023/A:1019894720789
Berg P., Risgaard-Petersen N., Rysgaard S. (1998). Interpretation of measured concentration profiles in sediment pore water. Limnol. Oceanogr. 43, 1500–1510. doi: 10.4319/lo.1998.43.7.1500
Blanchard G. F. (1990). Overlapping microscale dispersion patterns of meiofauna and microphytobenthos. Mar. Ecol. Prog. Ser. 68, 101–111. doi: 10.3354/meps068101
Blommaert L., Lavaud J., Vyverman W., Sabbe K. (2017). Behavioural versus physiological photoprotection in epipelic and epipsammic benthic diatoms. Eur. J. Phycol. 53, 146–155. doi: 10.1080/09670262.2017.1397197
Cai W. J., Sayles F. L. (1996). Oxygen penetration depths and fluxes in marine sediments. Mar. Chem. 52, 123–131. doi: 10.1016/0304-4203(95)00081-X
Cartaxana P., Cruz S., Gameiro C., Kühl M. (2016a). Regulation of intertidal microphytobenthos photosynthesis over a diel emersion period is strongly affected by diatom migration patterns. Front. Mar. Sci. 7. doi: 10.3389/fmicb.2016.00872
Cartaxana P., Ribeiro L., Goessling J. W., Cruz S., Kühl M. (2016b). Light and O2 microenvironments in two contrasting diatom-dominated coastal sediments. Mar. Ecol. Prog. Ser. 545, 35–47. doi: 10.3354/meps11630
Chevalier E. M., Gevaert F., Créach A. (2010). In situ photosynthetic activity and xanthophylls cycle development of undisturbed microphytobenthos in an intertidal mudflat. J. Exp. Mar. Biol. Ecol. 385, 44–49. doi: 10.1016/j.jembe.2010.02.002
Cohn S. A., Disparti N. C. (1994). Environmental factors influencing diatom cell motility. J. Phycol. 30, 818–828. doi: 10.1111/j.0022-3646.1994.00818.x
Consalvey M., Paterson D. M., Underwood G. J. C. (2004). The ups and downs of life in benthic biofilms: migration of benthic diatoms. Diatom Res. 19, 181–202. doi: 10.1080/0269249X.2004.9705870
Coutinho R., Zingmark R. (1987). Diurnal photosynthetic responses to light by macroalgae. J. Phycol. 23, 336–343. doi: 10.1111/j.1529-8817.1987.tb04142.x
Daggers T. D., Herman P. M. J., van der Wal D. (2020). Seasonal and spatial variability in patchiness of microphytobenthos on intertidal flats from sentinel-2 satellite imagery. Front. Mar. Sci. 7. doi: 10.3389/fmars.2020.00392
Danovaro R., Marrale D., Della Croce N., Parodi P., Fabiano M. (1999). Biochemical composition of sedimentary organic matter and bacterial distribution in the Aegean Sea: trophic state and pelagic-benthic coupling. J. Sea. Res. 42, 117–129. doi: 10.1016/S1385-1101(99)00024-6
Denis L., Desreumaux P. E. (2009). Short-term variability of intertidal microphytobenthic production using an oxygen microprofiling system. Mar. Freshw. Res. 60, 712. doi: 10.1071/MF08070
Denis L., Gevaert F., Spilmont N. (2012). Microphytobenthic production estimated by in situ oxygen microprofiling: short-term dynamics and carbon budget implications. J. Soils Sediments 12, 1517–1529. doi: 10.1007/s11368-012-0588-8
Du G. Y., Yan H., Liu C., Mao Y. (2018). Behavioral and physiological photoresponses to light intensity by intertidal microphytobenthos. J. Oceanol. Limnol. 36, 293–304. doi: 10.1007/s00343-017-6099-0
Eilers P. H. C., Peeters J. C. H. (1988). A model for the relationship between light intensity and the rate of photosynthesis in phytoplankton. Ecol. Modell 42, 199–215. doi: 10.1016/0304-3800(88)90057-9
Falkowski P. G., Owens T. G. (1980). Light-shade adaptation. Plant Physiol. 66, 592–595. doi: 10.1104/pp.66.4.592
Flemming B. W., Delafontaine M. T. (2000). Mass physical properties of muddy intertidal sediments: some applications, misapplications and non-applications. Cont. Shelf. Res. 20, 1179–1197. doi: 10.1016/S0278-4343(00)00018-2
Forster R. M., Kromkamp J. C. (2004). Modelling the effects of chlorophyll fluorescence from subsurface layers on photosynthetic efficiency measurements in microphytobenthic algae. Mar. Ecol. Prog. Ser. 284, 9–22. doi: 10.3354/meps284009
Garcia H. E., Gordon L. I. (1992). Oxygen solubility in seawater: better fitting equations. Limnol. Oceanogr. 37, 1307–1312. doi: 10.4319/lo.1992.37.6.1307
Genty B., Briantais J. M., Baker N. R. (1989). The relationship between the quantum yield of photosynthetic electron transport and quenching of chlorophyll fluorescence. Biochim. Biophys. Acta Gen. Subj. 990, 87–92. doi: 10.1016/S0304-4165(89)80016-9
Gerbersdorf S., Meyercordt J., Meyer-Reil L. (2005). Microphytobenthic primary production in the bodden estuaries, southern Baltic Sea, at two study sites differing in trophic status. Aquat. Microb. Ecol. 41, 181–198. doi: 10.3354/ame041181
Glud R. N. (2006). “Microscale techniques to measure photosynthesis: a mini-review,” in Functioning of microphytobenthos. Eds. Kromkamp J., Brouwer F. C., Blanchard G. F., Forster R. M., Creach V. (Amsterdam: Proceedings from Amsterdam-colloquium), 31–42.
Glud R. N., Ramsing N. B., Revsbech N. P. (1992). Photosynthesis and photosynthesis-coupled respiration in natural biofilms quantified with oxygen microsensors. J. Phycol. 28, 51–60. doi: 10.1111/j.0022-3646.1992.00051.x
Guarini J. M., Blanchard G. F., Bacher C., Gros P., Riera P., Richard P., et al. (1998). Dynamics of spatial patterns of microphytobenthic biomass: inferences from a geostatistical analysis of two comprehensive surveys in marennes-oléron bay (France). Mar. Ecol. Prog. Ser. 166, 131–141. doi: 10.3354/meps166131
Hanelt D., Huppertz K., Nultsch W. (1993). Daily course of photosynthesis and photoinhibition in marine macroalgae investigated in the laboratory and field. Mar. Ecol. Prog. Ser. 97, 31–37. doi: 10.3354/meps097031
Hartig P., Wolfstein K., Lippemeier S., Colijn. F. (1998). Photosynthetic activity of natural microphytobenthos populations measured by fluorescence (PAM) and 14C-tracer methods: a comparison. Mar. Ecol. Prog. Ser. 166, 53–62. doi: 10.3354/meps166053
Henley W. J. (1993). Measurement and interpretation of photosynthetic light-response curves in algae in the context of photoinhibition and diel changes. J. Phycol. 29, 729–739. doi: 10.1111/j.0022-3646.1993.00729.x
Jassby A. D., Platt T. (1976). Mathematical formulation of the relationship between photosynthesis and light for phytoplankton. Limnol. Oceanogr. 21, 540–547. doi: 10.4319/lo.1976.21.4.0540
Jesus B., Brotas V., Marani M., Paterson D. M. (2005). Spatial dynamics of microphytobenthos determined by PAM fluorescence. Est. Coast. Shelf Sci. 65, 30–42. doi: 10.1016/j.ecss.2005.05.005
Jesus B., Brotas V., Ribeiro L., Mendes C. R., Cartaxana P., Paterson D. M. (2009). Adaptations of microphytobenthos assemblages to sediment type and tidal position. Cont. Shelf Res. 29, 1624–1634. doi: 10.1016/j.csr.2009.05.006
Josefson A. B., Norkko J., Norkko A. (2012). Burial and ecomposition of plant pigments in surface sediments of the Baltic Sea: role of oxygen and benthic fauna. Mar. Ecol. Prog. Ser. 455, 33–49. doi: 10.3354/meps09661
Key T., McCarthy A., Campbell D. A., Six C., Roy S., Finkel Z. V. (2010). Cell size trade-offs govern light exploitation strategies in marine phytoplankton. Environ. Microbiol. 12, 95–104. doi: 10.1111/j.1462-2920.2009.02046.x
Kromkamp J. C., Barranguet C., Peene J. (1998). Determination of microphytobenthos PSII quantum efficiency and photosynthetic activity by means of variable chlorophyll fluorescence. Mar. Ecol. Prog. Ser. 162, 45–55. doi: 10.3354/meps162045
Kromkamp J., Limbeek M. (1993). Effect of short-term variation in irradiance on light harvesting and photosynthesis of the marine diatom Skeletonema costatum: a laboratory study simulating vertical mixing. Microbio 139, 2277–2284. doi: 10.1099/00221287-139-9-2277
Kühl M., Lassen C., Revsbech N. P. (1997). A simple light meter for measurements of PAR (400 to 700 nm) with fiber-optic microprobes: application for p vs E0(PAR) measurements in microbial mat. Aquat. Microb. Ecol. 13, 197–207. doi: 10.3354//ame013197
Kwon B. O., Kim H. C., Koh C. H., Ryu J., Son S., Kim Y. H., et al. (2018). Development of temperature-based algorithms for the estimation of microphytobenthic primary production in tidal flat: a case study in daebu mudflat, Korea. Env. pollut. 241, 115–123. doi: 10.1016/j.envpol.2018.05.032
Lassen C., Glud R. N., Ramsing N. B., Revsbech N. P. (1998). A method to improve the spatial resolution of photosynthetic rates obtained by oxygen microsensors. J. Phycol 34, 89–93. doi: 10.1046/j.1529-8817.1998.340089.x
Lefebvre S., Mouget J. L., Lavaud J. (2011). Duration of rapid light curves for determining the photosynthetic activity of microphytobenthos biofilm in situ. J. Aquabot. 95, 0–8. doi: 10.1016/j.aquabot.2011.02.010
Lorenzen C. J. (1967). Determination of chlorophyll and pheo-pigments: spectrophotometric equations. Limnol. Oceanogr. 12, 343–346. doi: 10.4319/lo.1967.12.2.0343
MacIntyre H. L., Geider R. J., Miller D. C. (1996). Microphytobenthos: the ecological role of the “secret garden” of unvegetated, shallow-water marine habitats. distribution, abundance and primary production. Estuaries 19, 186–201. doi: 10.2307/1352224
Mackin J. E., Aller J. C. (1984). Ammonium adsorption in marine sediments. Limnol. Oceanogr. 29, 250–257. doi: 10.4319/lo.1984.29.2.0250
Martins N., Barreto L., Bartsch I., Bernard J., Serrão E. A., Pearson G. A. (2022). Daylength influences reproductive success and sporophyte growth in the Arctic kelp species Alaria esculenta. Mar. Ecol. Prog. Ser. 683, 37–52. doi: 10.3354/meps13950
McIntire C. D., Wulff B. L. (1969). A laboratory method for the study of marine benthic diatoms. Limnol. Oceanogr. 14, 667–678. doi: 10.4319/lo.1969.14.5.0667
Merikhi A., Berg P., Huettel M. (2021). Technical note: novel triple O2 sensor aquatic eddy covariance instrument with improved time shift correction reveals central role of microphytobenthos for carbon cycling in coral reef sands. Biogeosciences 18, 5381–5395. doi: 10.5195/bg-18-5381-2021
Morelle J., Orvain F., Claquin P. (2018). A simple, user friendly tool to readjust raw PAM data from field measurements to avoid over- or underestimating of microphytobenthos photosynthetic parameters. J. Exp. Mar. Biol. Ecol. 503, 136–146. doi: 10.1016/j.jembe.2018.02.007
Morris E., Forster R., Peene J., Kromkamp J. (2008). Coupling between photosystem II electron transport and carbon fixation in microphytobenthos. Aquat. Microb. Ecol. 50, 301–311. doi: 10.3354/ame01175
Mouget J., Perkins R., Consalvey M., Lefebvre S. (2008). Migration or photoacclimation to prevent high irradiance and UV-b damage in marine microphytobenthic communities. Aquat. Microb. Ecol. 52, 223–232. doi: 10.3354/ame01218
Park J., Kwon B. O., Kim M., Hong S., Ryu J., Song S. J., et al. (2014). Microphytobenthos of Korean tidal flats: a review and analysis on floral distribution and tidal dynamics. Ocean. Coast. 102, 471–482. doi: 10.1016/j.ocecoaman.2014.07.007
Perkins R., Kromkamp J. C., Serôdio J., Lavaud J., Jesus B., Mouget J. L., et al. (2010). “The application of variable chlorophyll fluorescence to microphytobenthic biofilms,” in Chlorophyll a fluorescence in aquatic sciences: methods and applications, vol. 4 . Eds. Sugget D., Prášil O., Borowitzka M. (Dordrecht: Dev. App. Phyco), 237–275. doi: 10.1007/978-90-481-9268-7_12
Perkins R., Underwood G., Brotas V., Snow G., Jesus B., Ribeiro L. (2001). Responses of microphytobenthos to light: primary production and carbohydrate allocation over an emersion period. Mar. Ecol. Prog. Ser. 223, 101–112. doi: 10.3354/meps223101
Platt T., Gallegos C. L., Harrison W. G. (1980). Photoinhibition and photosynthesis in natural assemblages of marine phytoplankton. J. Mar. Res. 38, 687–701.
Pniewski F., Piasecka-Jedrzejak I. (2020). Photoacclimation to constant and changing light conditions in a benthic diatom. Front. Mar. Sci. 7. doi: 10.3389/fmars.2020.00381
Pniewski F., Richard P., Latała A., Blanchard G. (2016). Non-photochemical quenching in epipsamic and epipelic microalgal assemblages from two marine ecosystems. Cont. Shelf Res. 136, 74–82. doi: 10.1016/j.csr.2016.12.013
R Core Team (2017). A language and environnement for statistical computing. (Vienna, Austria: R Foundation for Statistical Computing) Available at: https://www.R-project.org/.
Rabouille C., Denis L., Dedieu K., Stora G., Lansard B., Grenz C. (2003). Oxygen demand in coastal marine sediments: comparing in situ microelectrodes and laboratory core incubations. J. Exp. Mar. Biol. Ecol. 285-286, 49–69. doi: 10.1016/S0022-0981(02)00519-1
Rasmussen M. B., Henriksen K., Jensen A. (1983). Possible causes of temporal fluctuations in primary production of the microphytobenthos in the Danish wadden Sea. Mar. Biol. 73, 109–114. doi: 10.1007/BF00406878
Redzuan N. S., Underwood G. J. C. (2020). Movement of microphytobenthos and sediment between mudflats and salt marsh during spring tides. Front. Mar. Sci. 7. doi: 10.3389/fmars.2020.00496
Revsbech N. P. (1989a). An oxygen microsensor with a guard cathode. Limnol. Oceanogr. 34, 474–478. doi: 10.4319/lo.1989.34.2.0474
Revsbech N. P. (1989b). Diffusion characteristics of microbial communities determined by use of oxygen microsensors. J. Microbio. Meth. 9, 111–122. doi: 10.1016/0167-7012(89)90061-4
Revsbech N. P., JØrgensen B. B., Brix O. (1981). Primary production of microalgae in sediments measured by oxygen microprofile, H14 fixation, and oxygen exchange methods. Limnol. Oceanogr. 26, 717–730. doi: 10.4319/lo.1981.26.4.0717
Santema M., Huettel M. (2018). Dynamics of microphytobenthos photosynthetic activity along a depth transect in the sandy northeastern gulf of Mexico shelf. Est. Coast. Shelf Sci. 212, 273–285. doi: 10.1016/j.ecss.2018.07.016
Sattari Vayghan H., Nawrocki W. J., Schiphorst C., Tolleter D., Hu C., Douet V., et al. (2022). Photosynthetic light harvesting and thylakoid organization in a CRISPR/Cas9 Arabidopsis thaliana LHCB1 knockout mutant. Front. Plant Sci. 13. doi: 10.3389/fpls.2022.833032
Schreiber U., Bilger W., Neubauer C. (1994). Chlorophyll fluorescence as a nonintrusive indicator for rapid assessment of in vivo photosynthesis. Ecophy. Photosynth. 100, 49–70. doi: 10.1007/978-3-642-79354-7_3
Serôdio J. (2004). Analysis of variable chlorophyll fluorescence in microphytobenthos assemblages: implications of the use of depth-integrated measurements. Aquat. Microb. Ecol. 36, 137–152. doi: 10.3354/ame036137
Serôdio J., Coelho H., Vieira S., Cruz S. (2006). Microphytobenthos vertical migratory photoresponse as characterised by light-response curves of surface biomass. Estuar. Coast. Shelf Sci. 68, 547–556. doi: 10.1016/j.ecss.2006.03.005
Serôdio J., Cruz S., Vieira S., Brotas V. (2005a). Non-photochemical quenching of chlorophyll fluorescence and operation of the xanthophyll cycle in estuarine microphytobenthos. J. Exp. Mar. Biol. Ecol. 326, 157–169. doi: 10.1016/j.jembe.2005.05.011
Serôdio J., da Silva J. M., Catarino F. (1997). Nondestructive tracing of migratory rythms of intertidal benthic microalgae using in vivo chlorophyl a fluorescence. J. Phycol. 33, 542–553. doi: 10.1111/j.0022-3646.1997.00542.x
Serôdio J., da Silva J. M., Catarino F. (2001). Use of in vivo chlorophyll a fluorescence to quantify short-term variations in the productive biomass of intertidal microphytobenthos. Mar. Ecol. Prog. Ser. 218, 45–61. doi: 10.3354/meps218045
Serôdio J., Ezequiel J., Barnett A., Mouget J. L., Méléder V., Laviale M., et al. (2012). Efficiency of photoprotection in microphytobenthos: role of vertical migration and the xanthophyll cycle against photoinhibition. Aquat. Microb. Ecol. 67, 161–175. doi: 10.3354/ame01591
Serôdio J., Vieira S., Barroso F. (2007). Relationship of variable chlorophyll fluorescence indices to photosynthetic rates in microphytobenthos. Aquat. Microb. Ecol. 49, 71–85. doi: 10.3354/ame01129
Serôdio J., Vieira S., Cruz S., Barroso F. (2005b). Short-term variability in the photosynthetic activity of microphytobenthos as detected by measuring rapid light curves using variable fluorescence. Mar. Biol. 146, 903–914. doi: 10.1007/s00227-004-1504-6
Spilmont N., Seuront L., Meziane T., Welsh D. T. (2011). There’s more to the picture than meets the eye: sampling microphytobenthos in a heterogeneous environment. Estuar. Coast. Shelf Sci. 95, 470–476. doi: 10.1016/j.ecss.2011.10.021
Taylor W. R. (1964). Light and photosynthesis in intertidal benthic diatoms. Helgolander Wiss. Meeresunters 10, 29–37. doi: 10.1007/BF01626096
Underwood G. J. C., Kromkamp J. (1999). Primary production by phytoplankton and microphytobenthos in estuaries. Adv. Ecol. Res. 29, 93–153. doi: 10.1016/S0065-2504(08)60192-0
van Leeuwee M., Brotas V., Consalvey M., Forster R., Gillespie D., Jesus B., et al. (2008). Photoacclimation in microphytobenthos and the role of xanthophyll pigments. Eur. J. Phycol. 43, 123–132. doi: 10.1080/09670260701726119
Keywords: intertidal mudflat, microphytobenthos, migratory behavior, modulated fluorescence, oxygen microprofile, photoregulation, primary production
Citation: Meresse M, Gevaert F, Duong G and Denis L (2023) A new procedure for autonomous acquisition of photosynthesis-irradiance curves on a microphytobenthic biofilm. Front. Mar. Sci. 10:1167464. doi: 10.3389/fmars.2023.1167464
Received: 16 February 2023; Accepted: 09 May 2023;
Published: 22 May 2023.
Edited by:
Panagiotis D. Dimitriou, University of Crete, GreeceReviewed by:
João Serôdio, University of Aveiro, PortugalNafsika Papageorgiou, National and Kapodistrian University of Athens, Greece
Copyright © 2023 Meresse, Gevaert, Duong and Denis. This is an open-access article distributed under the terms of the Creative Commons Attribution License (CC BY). The use, distribution or reproduction in other forums is permitted, provided the original author(s) and the copyright owner(s) are credited and that the original publication in this journal is cited, in accordance with accepted academic practice. No use, distribution or reproduction is permitted which does not comply with these terms.
*Correspondence: Marvin Meresse, bWFydmluLm1lcmVzc2VAdW5pdi1saWxsZS5mcg==