 Jiali Zeng
 Bin Ai
 Zhuokai Jian
 Mingzhen Ye
 Jun Zhao
 Shaojie Sun
- 1School of Marine Sciences, Sun Yat-sen University, Zhuhai, China
- 2Southern Marine Science and Engineering Guangdong Laboratory (Zhuhai), Zhuhai, China
- 3Pearl River Estuary Marine Ecosystem Research Station, Ministry of Education, Zhuhai, China
- 4Guangdong Provincial Key Laboratory of Marine Resources and Coastal Engineering, Guangzhou, China
Mangroves are rapidly disappearing in several places of the world, and mangrove dynamics are becoming important evidence of ecological restoration and protection along the coast. Mangrove populations in the Guangdong-Hong Kong-Macao Coastal Area (GCA) have experienced a substantial impact of anthropogenic pressure in the 20th century. Monitoring its spatio-temporal variation and protection effect has been regarded as an important task in coastal management. In this study, we provided the comprehensive assessment of mangrove dynamics in the GCA and typical sites from 1988 to 2020 at eight-year intervals. At this time interval, mangrove ecosystems changed significantly as a result of global warming and human impacts. The geographical distribution of mangroves was obtained by applying the Random Forest (RF) classifier on Landsat images with a 30 m spatial resolution on the Google Earth Engine (GEE) platform, based on relevant indices such as Normalized Difference Mangrove Index (NDMI), Normalized Difference Vegetation Index (NDVI), Normalized Difference Suspended Sediment Index (NDSSI), Normalized Difference Built-up Index (NDBI) and Soil Adjusted Vegetation Index (SAVI). Quantitative evaluation indicated that overall accuracy of over 88% was achieved with RF classifier for mangrove extraction. In the GCA, mangrove area was 95.4 km2 in 1988, dropped to 71.4 km2 in 1996, then expanded to 127.5 km2 in 2020, with an overall dynamic rate of 1.02%. In typical sites, mangroves show a similar trend to the overall area. The subsequent mangrove growth is attributed to reserve establishment, accompanied by the expansion of replanted mangrove areas. In the GCA, provincial-level and county-level reserves show a high rate of mangrove dynamic, while national-level reserves display a low rate of mangrove dynamic. The dynamic rate in reserves of the Guangdong-Hong Kong-Macao Greater Bay Area (GBA) is higher than other parts of the GCA, indicating that the effect of mangrove protection is better in the GBA. The results of this study will provide scientific foundations for the sustainable management and conservation of mangrove ecosystem, the quantification of ecosystem services (such as coastal protection and carbon storage), as well as the formulation of strategies for mitigating and adapting to climate change.
1 Introduction
Mangroves are among the most abundant coastal ecosystems, providing valuable services for climate change adaptation (Taillardat et al., 2018; Gevaña et al., 2019). They have the capacity to store huge amounts of carbon, almost four times more than other land ecosystems (Donato et al., 2011), and they can also protect the coast from natural disasters. However, they are much more sensitive to global warming (Stocken and Menemenlis, 2017), and human impacts (Richards and Friess, 2016). Highly recognized research indicated that worldwide mangroves were disappearing at a dynamic rate of 2%, which resulted in an annual emission of 0.15 to 1.02 Pg (billion tons) of carbon dioxide (Pendleton et al., 2012). The Intergovernmental Panel on Climate Change (IPCC) has estimated that if the temperature rises by 2 °C, mangrove forested areas would be severely endangered by sea level rise (Tan et al., 2022). As a result, a series of strategies has been issued from international and national agencies to preserve mangrove forests. For instance, Nature Based Solutions (NbS) was put forward by Sustainable Development Goals (SDGs). Among these, the SDG 14 specifically emphasizes the restoration and conservation of mangroves, in order to ensure the sustainable use of marine resources (Sasmito et al., 2023).
At present, projects of marine NbS carried out in China mainly include a network of marine reserves, ecological red lines, and wetland restoration project (Chen G. et al., 2017; Zhang et al., 2022). Among them, mangrove reserves play a crucial role in the effective restoration, covering nearly half of mangrove areas. Striving to be a city model for mangrove restoration and management, mangrove reserves have been established in both main and scattered areas along the coast of China, to protect mangrove resources as well as possible. The availability of dynamic mangrove distribution is critical for better mangrove protective planning.
Mangroves are mainly distributed on tidal flats in the intertidal zone so that it is difficult to monitor them for a long time, traditionally by field investigation. Geospatial technology and remote sensing (RS) allow for the assessment of changes on the Earth caused by climate change and human activities (Pei et al., 2021). For systematic quantification of land characteristics, temporal satellite data is a common solution (Mountford et al., 2017; Sahani, 2021). It is now much simpler to quantify land changes thanks to the availability of remote sensing images (e.g., Landsat images, Sentinel images, etc.) and corresponding data products, such as the Normalized Difference Vegetation Index (NDVI), Modified Normalized Difference Pond Index (MNDPI) and so on. Landsat remote sensing images are commonly utilized to assess covering changes in forest management, especially in mangroves (Wu et al., 2013). However, the efficiency and computing capabilities of evaluating multi-temporal satellite information covering large areas on the Earth are limited for large regional-scale and long-term studies. The application of cloud-based computing platforms and machine learning methods opens new opportunities for large-scale and long-term studies on mangrove monitoring. A lot of scientists have recently used Google Earth Engine (GEE) to assess the change patterns of mangrove forested areas, and different methods have been applied to extract mangroves from satellite imagery on the GEE platform (Chen B. et al., 2017; Hu et al., 2018; Liu et al., 2019).
The Guangdong-Hong Kong-Macao Coastal Area (GCA), with a developed economy and a high frequency of disasters, is one of most important ecological protection sites in China (Du and Loh, 2020; Song et al., 2022). In 2023, the Mangrove Restoration Plan of Guangdong (2021-2025) was released, which will push the implementation of mangrove restoration in the GCA, construct blue carbon ecosystem, and build up coastal ecological barrier with the cooperation of Hong Kong and Macao. It urgently requires high-qualified mangrove maps for making ecological plans in the GCA. Many studies have analyzed mangrove dynamics in the Guangdong-Hong Kong-Macao Greater Bay Area (GBA) (Guo et al., 2021; He et al., 2022), but less of them pay attention to mangroves dynamics at a larger-scale of the GCA. Mangrove reserve network has been well developed in recent years. The assessment of conservation effects in different levels of mangrove reserves has been carried out, with a comparative analysis between the GBA and other regions of the GCA. It can not only offer scientific foundation for efficiently and economically protecting mangroves, but also provide valuable experiences for mangrove management for other regions. Besides, previous research lacked focus on changes of both natural and replanted mangroves. In the study, we pay attention to the situation of both natural and replanted mangroves in typical sites for scientific foundation of quantifying their different ability of providing ecosystem services such as coastal protection and carbon storage. Furthermore, it can assist in the development of strategies to mitigate and adapt to climate change.
As a result, the current efforts in coastal mangrove management are still far from being sufficient. This study is designed to achieve objectives in: a) proposing a Landsat-based Random Forests (RF) classification framework on the GEE platform, for generating temporal maps of mangrove distribution in the GCA from 1988 to 2020; b) analyzing dynamic patterns of mangroves in the GCA as well as typical sites, and determining natural and replanted mangrove cover in typical sites; c) assessing the impacts of ecological restoration in mangrove reserves, and verifying the protection effects from different level of mangrove reserves in GBA and GCA.
2 Materials and methods
2.1 Study area
This study aims to evaluate the conservation effect of mangroves in GCA. GCA has about 5660 kilometers of mainland coastline (Figure 1). The coast is so favorable for mangroves, because of its terrain, nutritional richness, different types of beaches, and the deposition of alluvial material by rivers (e.g., Pearl River, Rong River, Han River, etc.). The GCA is the central region of Asia, backed by two international centres of Hong Kong and Macao. Relying on its superior location and the cooperation with Hong Kong-Macao, economic and social development in the GCA have been at the top of China. It leads to increasing mangrove ecosystems occupied by urbanization land. In recent years, there are reports of strong conservation in zones with different economic development such as Zhanjiang, Pearl River Estuary, Shantou, and Chaozhou (Zhao, 2017). These zones are located in the western, central, and eastern regions of the GCA, allowing for an observation of mangrove spatial variations. Therefore, the above zones have been correspondingly selected as Zone A (east coast of Zhanjiang), Zone B (the Pearl River Estuary), and Zone C (Shantou, Chaozhou) for further analysis.
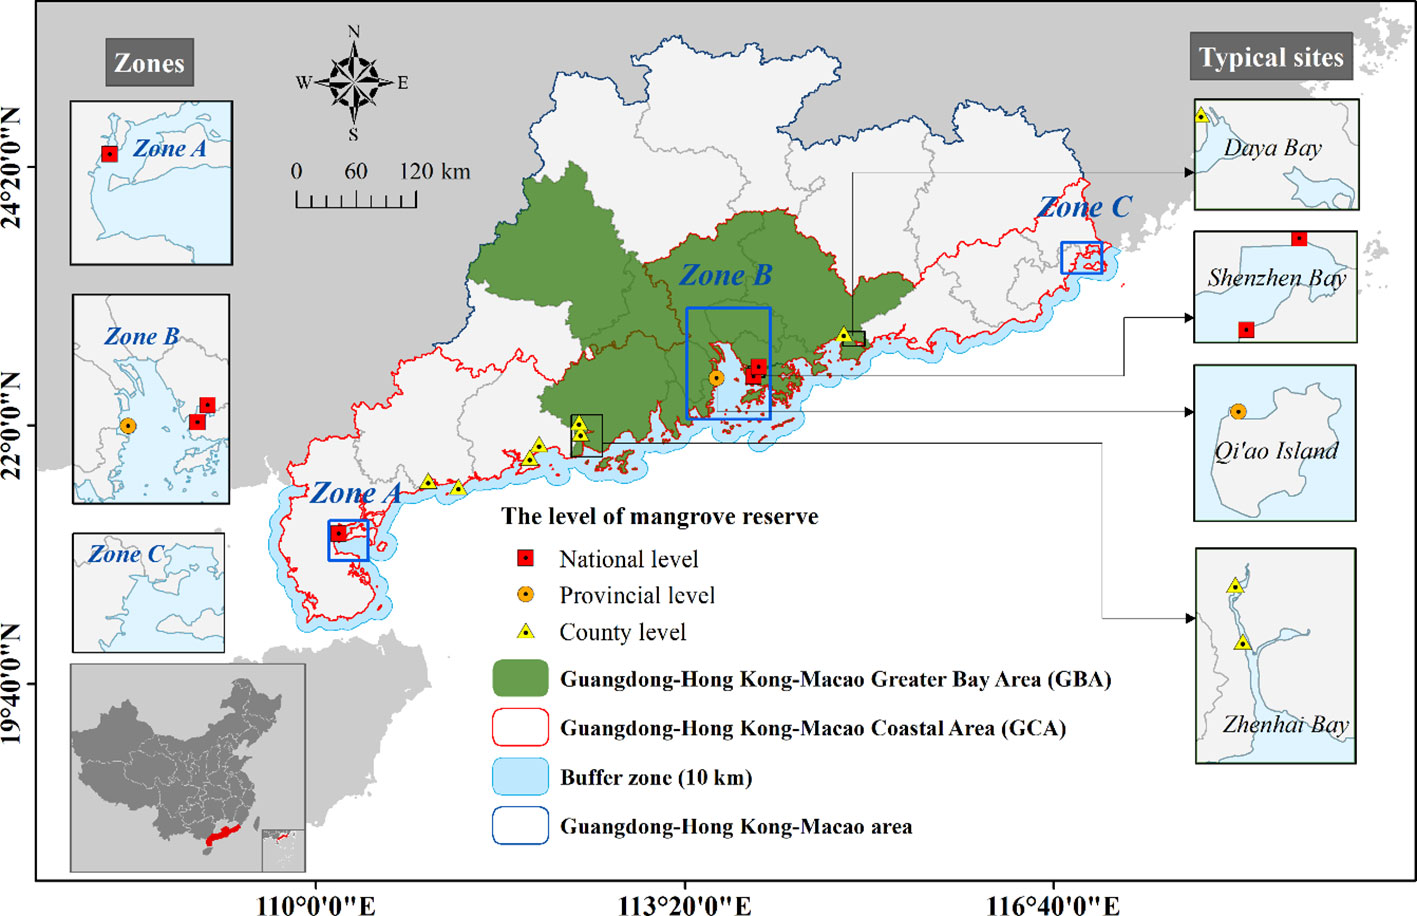
Figure 1 The location of study area and main mangrove reserves.
The GCA has set several mangrove reserves for reversing the mangrove reduction. Based on the National Wetland Resources Survey, nearly 11 key mangrove nature reserves have been established in the GCA (Table 1). In the GCA, the GBA is the center of economic growth and a key region for mangrove protection. Mangrove reserves with higher level in the GBA are mostly constructed in the Zhenhai Bay, Qi’ao Island, Shenzhen Bay and Daya Bay. Therefore, we focused on typical sites in the GBA including Zhenhai Bay, Qi’ao Island, Shenzhen Bay, and Daya Bay to analyze the effect of mangrove conservation or restoration.

Table 1 Main mangrove reserves in the Guangdong-Hong Kong-Macao Coastal Area (GCA).
2.2 Data and processing
2.2.1 Landsat remote sensing images
The Landsat series satellites from NASA have been dedicated to its mission of Earth observation for more than 40 years. The mission led to a largely consistent design and features of the Landsat satellites, ensuring a high level of uniformity and comparability in Landsat data. Landsat-5 TM, Landsat-7 ETM+ and Landsat-8 OLI images from the GEE platform were utilized for mangrove cover mapping. These images were calibrated into Surface Reflectance (SR) with 30 m spatial resolution. Thirteen tiles of images can cover the whole study area (shown in Figure 2) (120/043, 120/044, 121/044, 121/045, 122/043, 122/044, 122/045 123/044, 123/045, 123/046, 124/044, 124/045, 124/046). Mangroves may be readily distinguished from other land covers in winter or dry season images based on their spectral characteristics. Besides, mangroves are a community of evergreen shrubs and tiny trees, with a relatively stable pattern of photosynthesis and growth throughout the year. Based on the biological characteristic, the previous study succeeded in identifying mangroves from other terrestrial plants with satellite images in autumn and winter (Zhang et al., 2015). To improve the accuracy of mangrove mapping, images in nearly two years were collected from GEE, and those captured from July to August in the year were not applied. However, raw Landsat images may contain clouds or cloud shadows, which may raise up classification issues. They were successfully identified and eliminated with C Function of Mask (CFMask) algorithm (Crist, 1985) before the RF classification. A total of 1555 Landsat images was eventually collected into 5 yearly groups after image denoising (Figure 2). The processing steps above were carried out on the GEE platform.
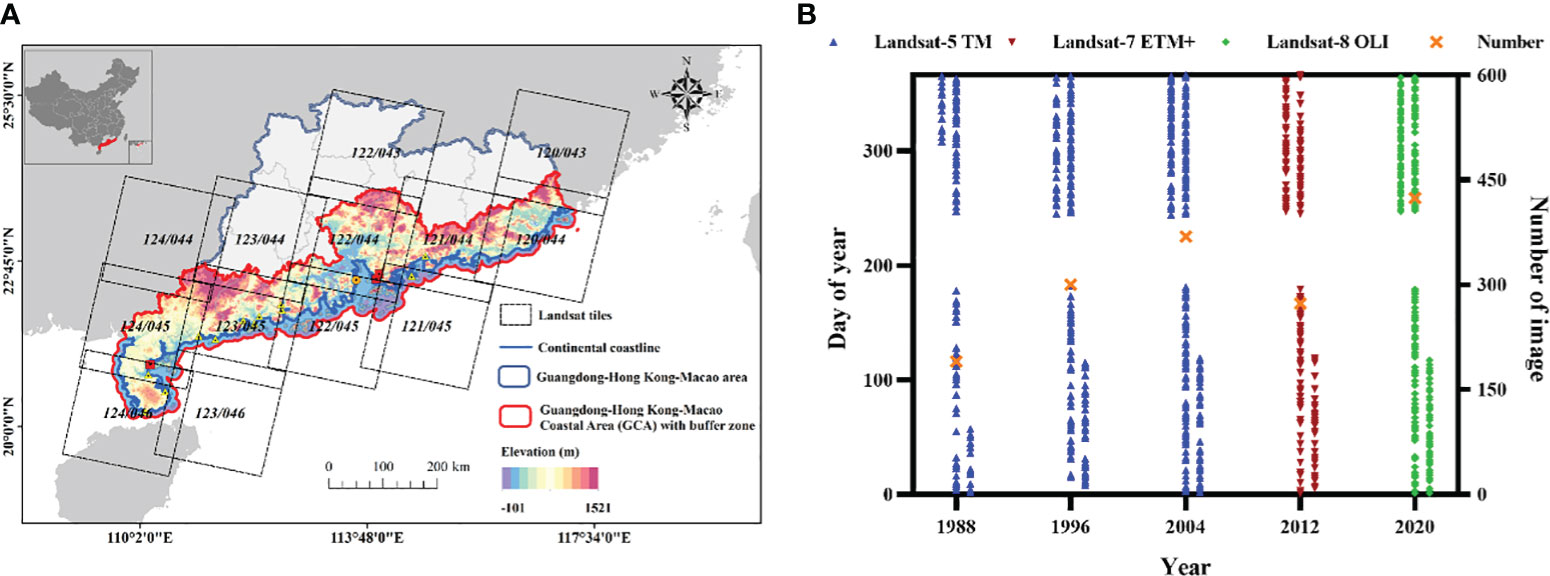
Figure 2 Date details about Landsat images used in the study: (A) study area covered by Landsat tiles; (B) day of year and number of images. TM is the abbreviation for Thematic Mapper, ETM+ represents Enhanced Thematic Mappr, and OLI refers to Operationa Land Imager.
2.2.2 Auxiliary data
The auxiliary data used for sample selection and accuracy verification was high-resolution images collected from Google Earth, mangrove survey data of previous studies (Zhang et al., 2021), and mangrove in-situ survey data by Unmanned Aerial Vehicle (UAV) (Figure 3). High-resolution images of Google Earth are from WorldView satellite, IKONOS, QuickBird, GeoEye-1, and SPOT 5. And mangrove in-situ data in this study was collected in Qi’ao Island for the verification.

Figure 3 Unmanned Aerial Vehicle (UAV) aerial photographs of mangrove field survey in Qi’ao Island.
2.3 Methodology
2.3.1 Image classification
As the main objective of the study was to analyze mangrove dynamics, to better interpret mangrove populations, clean water and muddy water were both categorized as “Water” class, and similarly, impervious surface and bare land were merged into the type of “Other”, and “Tidal flat” related to mangroves was set to another land cover. As a result, four primary land covers, including “Water”, “Mangrove”, “Tidal flat”, and “Other”, were classified using interpretation keys from the color-composite images of Short-Wave Length Infrared 1 (SWIR1), Near Infrared (NIR) and RED bands (Table 2) in GEE. Eventually, distribution of mangroves was mapped separately for eight-year intervals.
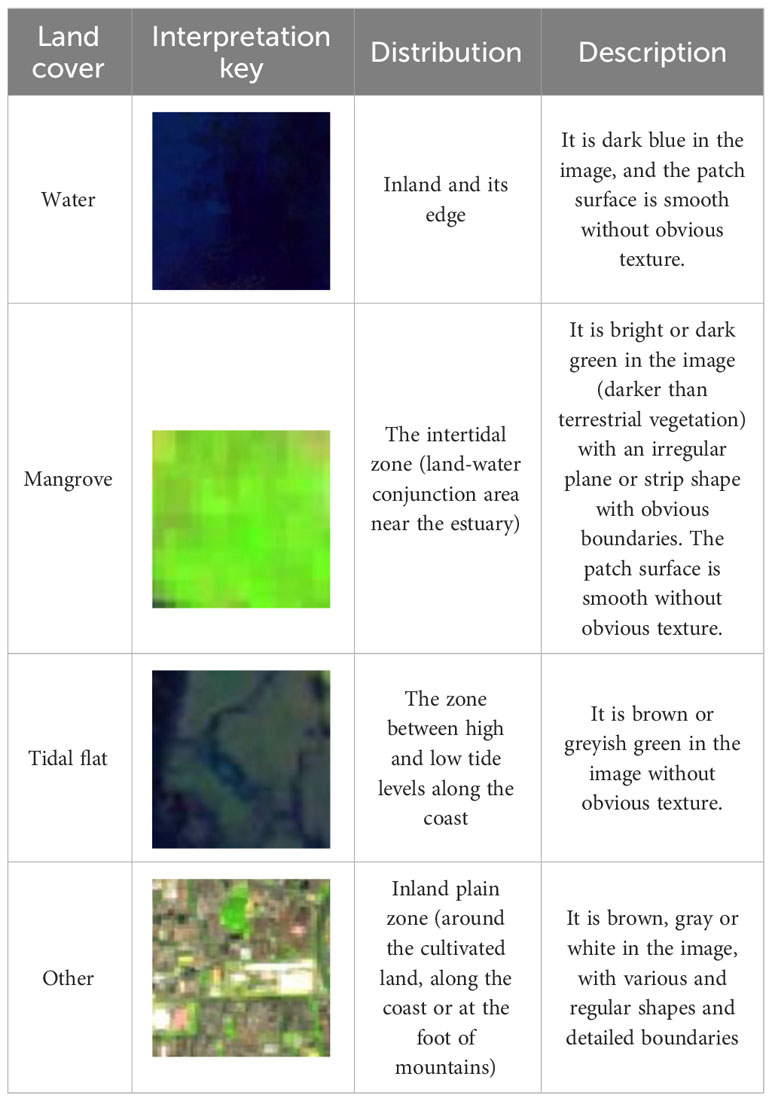
Table 2 Description of interpretation keys in study area with Landsat-8 Operationa Land Imager (OLI) image.
2.3.2 Random forest classifier
In this study, we mapped the distribution of mangroves by using RF machine learning classification algorithm at eight-year intervals from 1988 to 2020 on the GEE platform. RF algorithm is a method of classification based on an ensemble of decision trees. It uses the bagging sampling approach along with a random feature selection to set decision trees, and each decision tree predicts a classification result (Cutler et al., 2007). The final classification is determined by averaging the prediction of each tree. When using RF algorithm, we need to adjust the number of random trees, determine the ratio of sample data for classification and validation, and select the combination of features for the classification. The advantages of RF include high classification accuracy, efficient computation of large databases and good tolerance for outliers and noise (Trigila et al., 2015). More importantly, RF algorithm is typically regarded as an explainable Machine Learning approach (Arrieta et al., 2020). It allows for a better explanation of the feature set, making it a valuable tool for enhancing interpretability of the model. Nowadays, RF is widely used in land classification based on remote sensing (Rodriguez-Galiano et al., 2012), and has also achieved excellent application in salt marsh mapping (Zhao et al., 2023), and mangrove classification (Gilani et al., 2021).
Different features are required for a RF classification model in the study area with mixed types of land covers, in order to get the better mangrove maps. Based on the situation of the GCA, the characteristic of mangrove species and the previous research (Mondal et al., 2021), indices for the model, such as Normalized Difference Mangrove Index (NDMI), Normalized Difference Vegetation Index (NDVI), Normalized Difference Suspended Sediment Index (NDSSI), Normalized Difference Built-up Index (NDBI), and Soil Adjusted Vegetation Index (SAVI), were included (Table 3). In general, NDVI is commonly used to reflect vegetation greenness, SAVI is used to reflect real mangrove greenness by minimizing soil brightness, NDMI is specially used to reflect mangrove greenness, NDSSI is used to exclude suspended sediment around mangroves, and NDBI is used to identify construction land in urban areas.

Table 3 Indices used in the mangrove classification with Random Forest (RF) algorithm.
To obtain as accurate classification as possible, 500 trees were selected to build the RF classifier. Based on interpretation keys, the total number of 800 samples for four land cover classes was uniformly selected from Landsat images each year. The RF classifier was trained using 70% of the samples, and the remaining 30% samples were utilized for verification. Spectral features (Blue, Red, Green, NIR and SWIR), indices (NDVI, SAVI, NDMI, NDSSI, NDBI), and terrain indicators (e.g., elevation and slope) were input into RF classifier to identify and differentiate different types.
2.3.3 Statistical measures for classification accuracy
In the classification, overall, producer, and user accuracy, as well as Cohen’s Kappa coefficient value were developed and calculated using the confusion matrix (Foody, 2002) for the classification evaluation (Table 4). Therein, overall accuracy reflects the probability of properly identified pixels referring to the validation data. To avoid classification accuracy of non-research land cover classes from affecting the evaluation of mangrove class, user and producer accuracy are selected as indicators of mangrove extraction results (Wen et al., 2020). If overall accuracy, Cohen’s Kappa value, user accuracy and producer accuracy are over 0.8 (80%), then it considers that the classification result is good (Teng et al., 2015). In addition to accuracy evaluation reports, mangrove maps were overlaid with corresponding Landsat scenes and supplementary data to visually analyze how well they synchronized for further analysis and verification. This visual interpretation was necessary to supplement, for increasing trust in mangrove cover maps (Green et al., 1998).

Table 4 Basic classification accuracy indicators based on confusion matrix.
3 Results
3.1 Overall accuracy of mangrove classification
Mangrove forests in the GCA from 1988 to 2020 were obtained with RF in GEE, and accuracy assessment of mangroves in 1988, 1996, 2004, 2012 and 2020 was calculated and shown in Table 5. It shows that overall accuracies were mostly over 88% and Cohen’s Kappa coefficient values were higher than 0.84. User accuracy and producer accuracy of mangrove cover maps were basically higher than 89%, while producer accuracy in 1988 was slightly lower at 80.77%. The classification results were generally satisfactory, and it can be used to describe distribution of mangroves from 1988 to 2020. The RF model performed well in extracting dense mangrove distribution, but it may mistakenly classify low shrubs around ponds as mangroves. Therefore, sparse mangrove areas were further interpreted based on the high-resolution Google imagery.
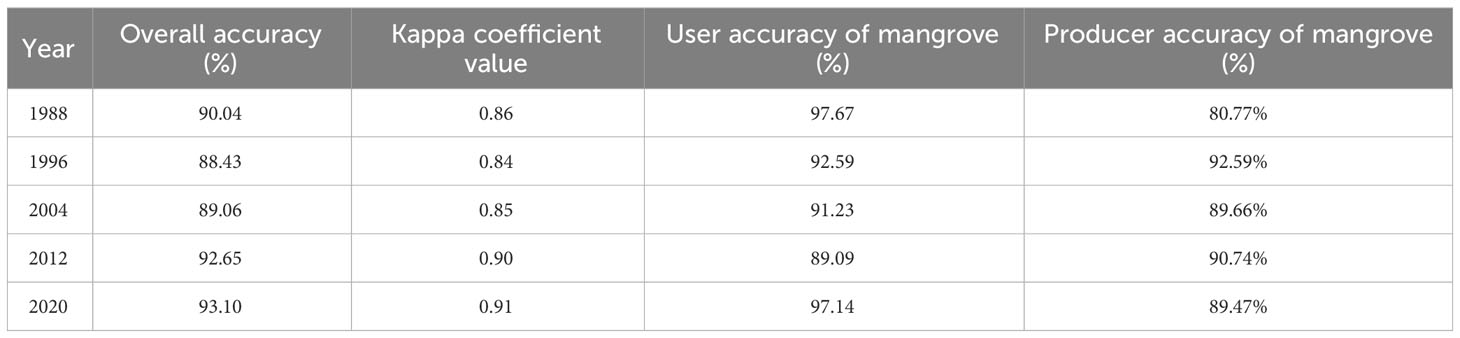
Table 5 Accuracy assessment of mangrove cover in the Guangdong-Hong Kong-Macao Coastal Area (GCA).
3.2 Spatial distribution and overall pattern of mangrove dynamics
The total area of mangroves during the period from 1988–2020 at eight-year intervals was summarized and shown in Figure 4. It indicates that the overall area of mangroves generally showed a trend of first decreasing and then increasing in the GCA (Figure 4A). In 1988, mangroves covered 95.4 km2, which decreased to 71.4 km2 in 1996, with the dynamic rate of -3.15% (Figure 4B). There has been a significant improvement in mangrove cover from 1996 to 2020, although the rate of increase has slowed during 2012-2020, i.e., 71.4 km2 in 1996, 76.2 km2 in 2004, 92.0 km2 in 2012 and 127.5 km2 in 2020, with the dynamic rate of 0.85% between 1996 and 2004, 2.59% between 2004 and 2012 and 4.28% between 2012 and 2020. Mangrove areas in the GCA has increased by 32.1 km2 in total during the past 33 years (1988-2020), at a dynamic rate of 1.02%. The study of mangroves in China (Wang et al., 2020) reported the mangrove cover in Guangdong showed a trend of decreasing first and then increasing over 30 years (1990–2019), with the dynamic rate of 1.45%. Most mangroves in Hong Kong have been protected with a state of natural regeneration in the Mai Po Nature Reserve, while mangroves in Macao are always relatively less. The areas disparity was most likely caused by different mangrove mapping methods. Despite small inconsistencies, the result that the total mangrove area shows a steady increase pattern significantly supports the current study’s conclusions.
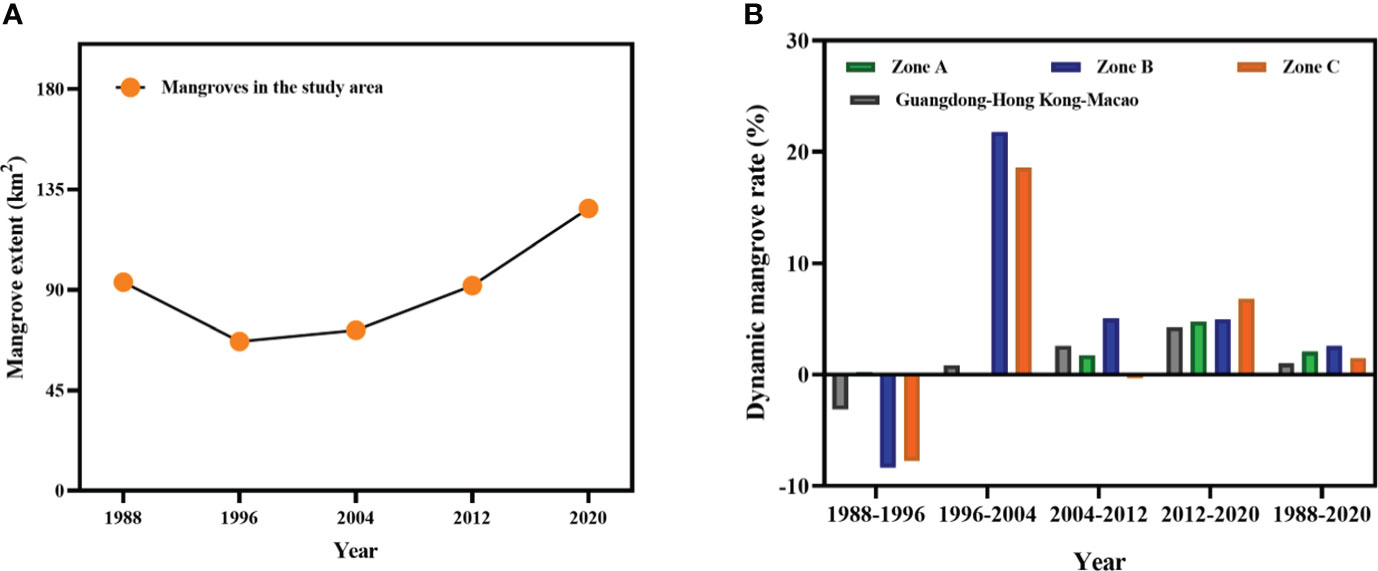
Figure 4 Assessment of mangrove change in the Guangdong-Hong Kong-Macao Coastal Area (GCA) from 1988 to 2020: (A) mangrove extent; (B) dynamic mangrove rate.
Spatial distribution of mangroves during the period from 1988–2020 at eight-year intervals was shown in Figure 5. It was evident that most of the total mangrove cover lay along the west coast of the GCA, while the remaining was spread across the central and east coast. The east coast of Zhanjiang (Zone A), the Pearl River Estuary (Zone B) and Shantou, Chaozhou (Zone C) can be found in the GCA with obvious changes, impacting the overall change trend. From 1988 to 2020, mangroves increased obviously in these three zones, among them Zone B with the fastest dynamic rate of 2.57%. During the period from 1988 to 1996, there was an increase in the mangrove cover in Zone A, with a growth rate of 0.21%. However, during the same period, there was a decline in mangrove areas in both Zone B (the dynamic rate of -8.35%) and Zone C (the dynamic rate of -7.74%). Moving forward to the period from 1996 to 2004, the change of mangroves in the three zones showed different patterns. Mangrove areas in Zone B and Zone C showed a significantly increasing trend, with the dynamic rate higher than 18.50%. However, mangrove areas in Zone A increased slowly (the dynamic rate of 0.20%). From 2004 to 2020, the mangrove in Zone A and Zone B showed a trend of increased fluctuations (average dynamic rate of 2.85% in Zone A and 4.18% in Zone B), while mangrove areas in Zone C experienced a slight decline followed by a rapid increase.
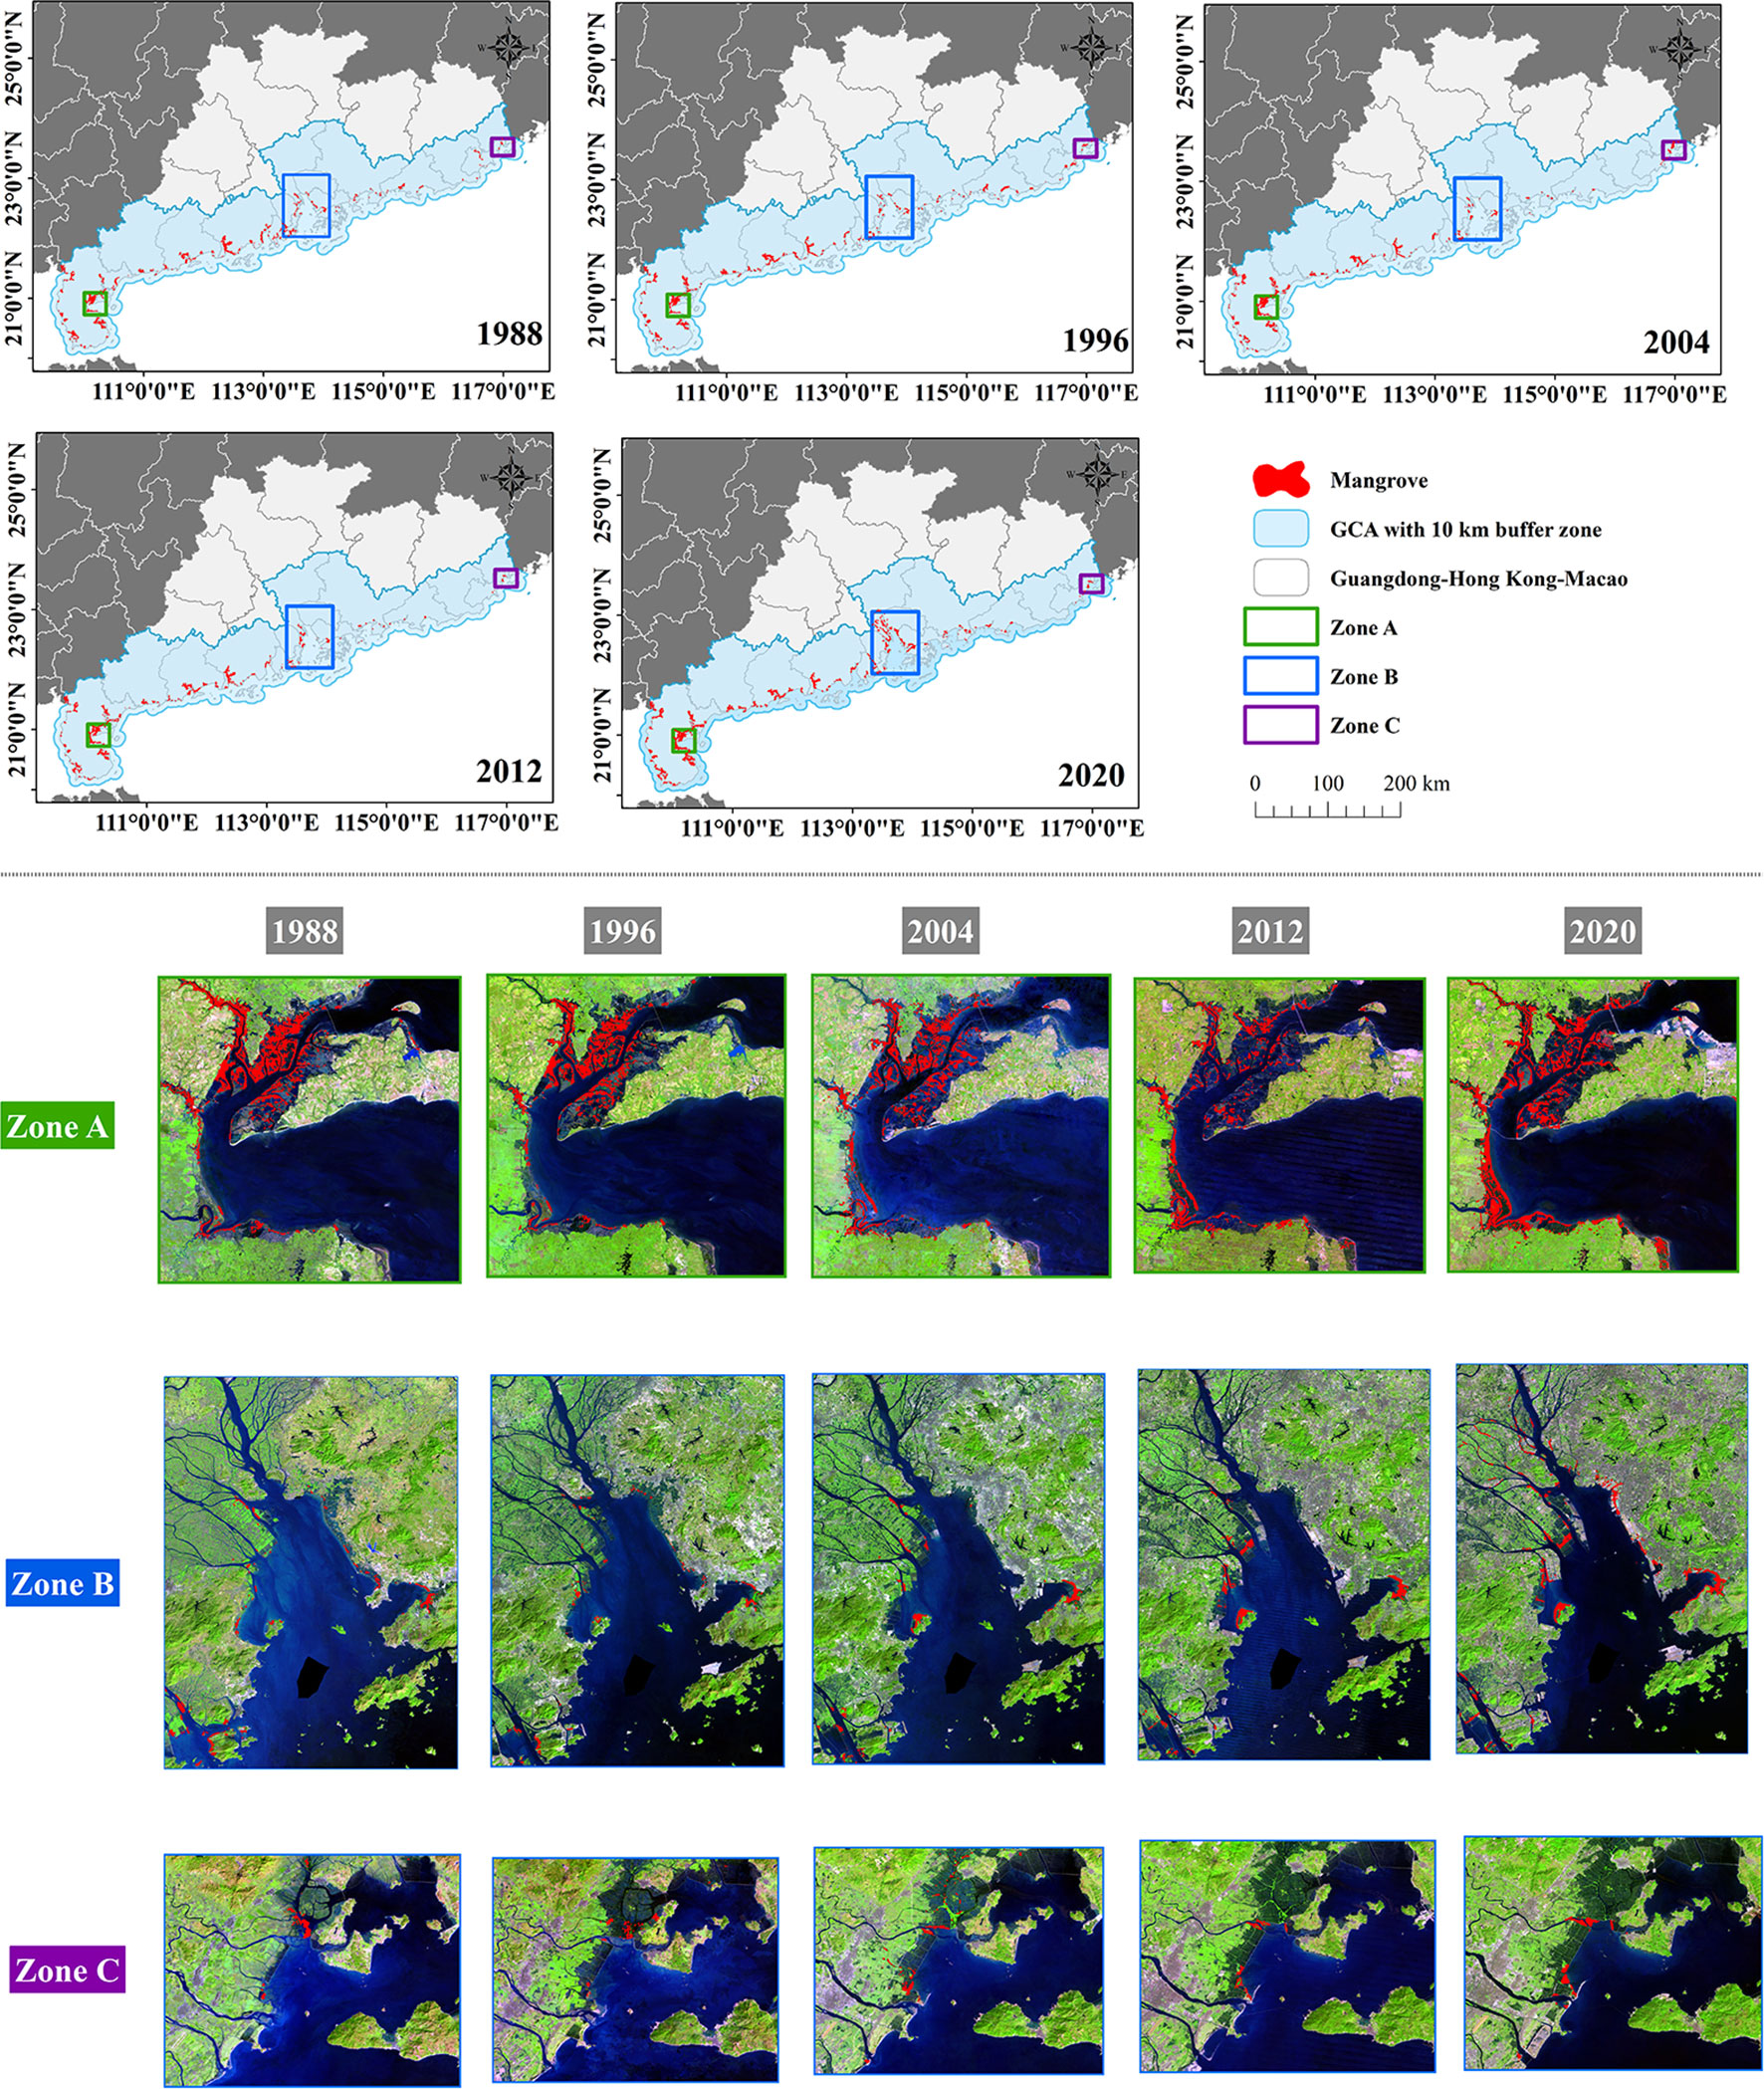
Figure 5 Spatial distribution of mangroves from 1988–2020 at eight-year intervals in the Guangdong-Hong Kong-Macao Coastal Area (GCA).
3.3 Temporal and spatial variation in typical sites
Mangrove areas in the GBA present relatively concentrated distribution, national, provincial, and county level mangrove reserves have been successively set up in typical sites such as Zhenhai Bay, Qi’ao Island, Shenzhen Bay and Daya Bay. In the study, these typical sites were selected for further analysis. The results show that mangroves in the typical sites were all first declining and then increasing (Figure 6). In Zhenhai Bay, over 12.1 km2 of mangroves were present in 2020. Between 1988 and 2012, the mangrove cover in Zhenhai Bay was around 17.0 km2. Based on the findings, in Qi’ao Island, 5.2 km2 was covered by mangroves in 2020. The mangrove area of Qi’ao Island has increased dramatically during the last thirty-three years, from 0.4 km2 to 5.2 km2. Mangroves in Shenzhen Bay covered areas of 7.7 km2 in 2020. Mangrove areas showed a fluctuating pattern. In 1988, mangroves covered 3.09 km2, which declined to 1.7 km2 in 1996, and then reached to 5.4 km2 in 2004, 6.8 km2 in 2012, and 7.7 km2 in 2020. In Daya Bay, the mangroves expanded slowly, only reaching a total area of 0.9 km2 until 2020.
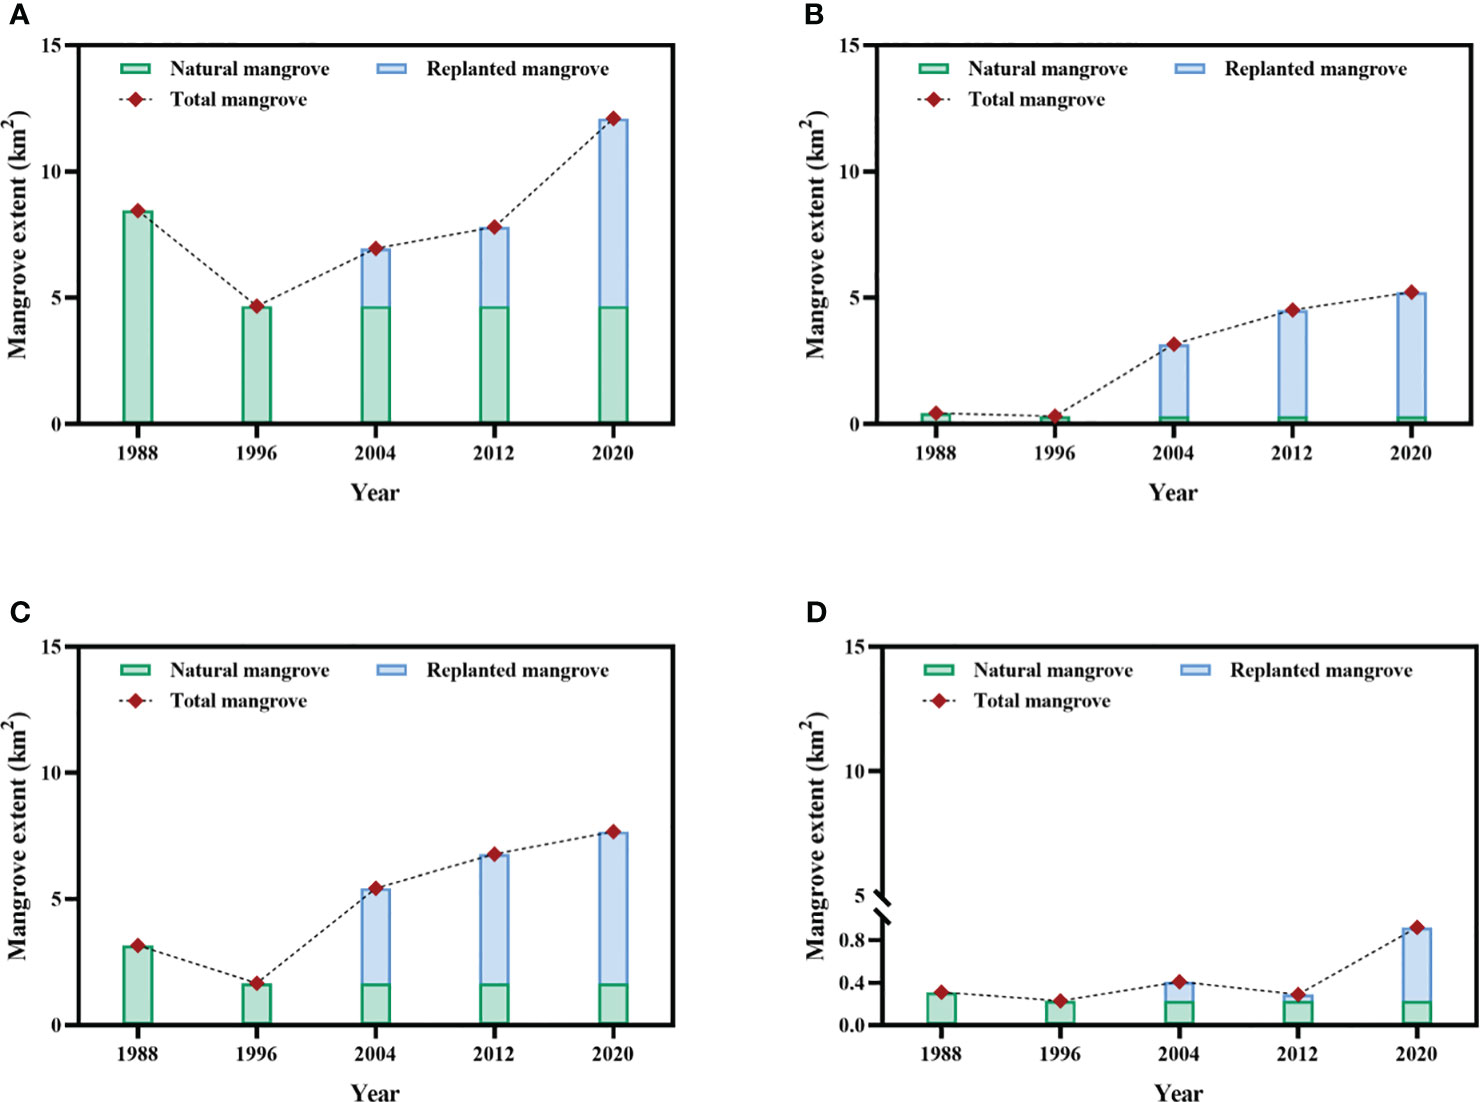
Figure 6 Mangrove dynamics in typical sites from 1988 to 2020: (A) Zhenhai Bay; (B) Qi’ao Island; (C) Shenzhen Bay; (D) Daya Bay.
Increased mangrove areas of typical sites are presented in Figure 7. In the middle of Zhenhai Bay, mangrove areas experienced an expansion along coast (Figure 7A). In Qi’ao Island, the increase of mangroves was concentrated along the east coast during the period from 1988 to 2020 (Figure 7B). On spatial maps, significant recovery of mangrove areas was observed in the northeast and northwest of Shenzhen Bay (Figure 7C). The increase of mangrove cover in Daya Bay mainly occurred in the northwest and southeast of Figure 7D. It’s worth noting that there is a rise in agriculture and building land around the expanded mangrove areas in these four sites.
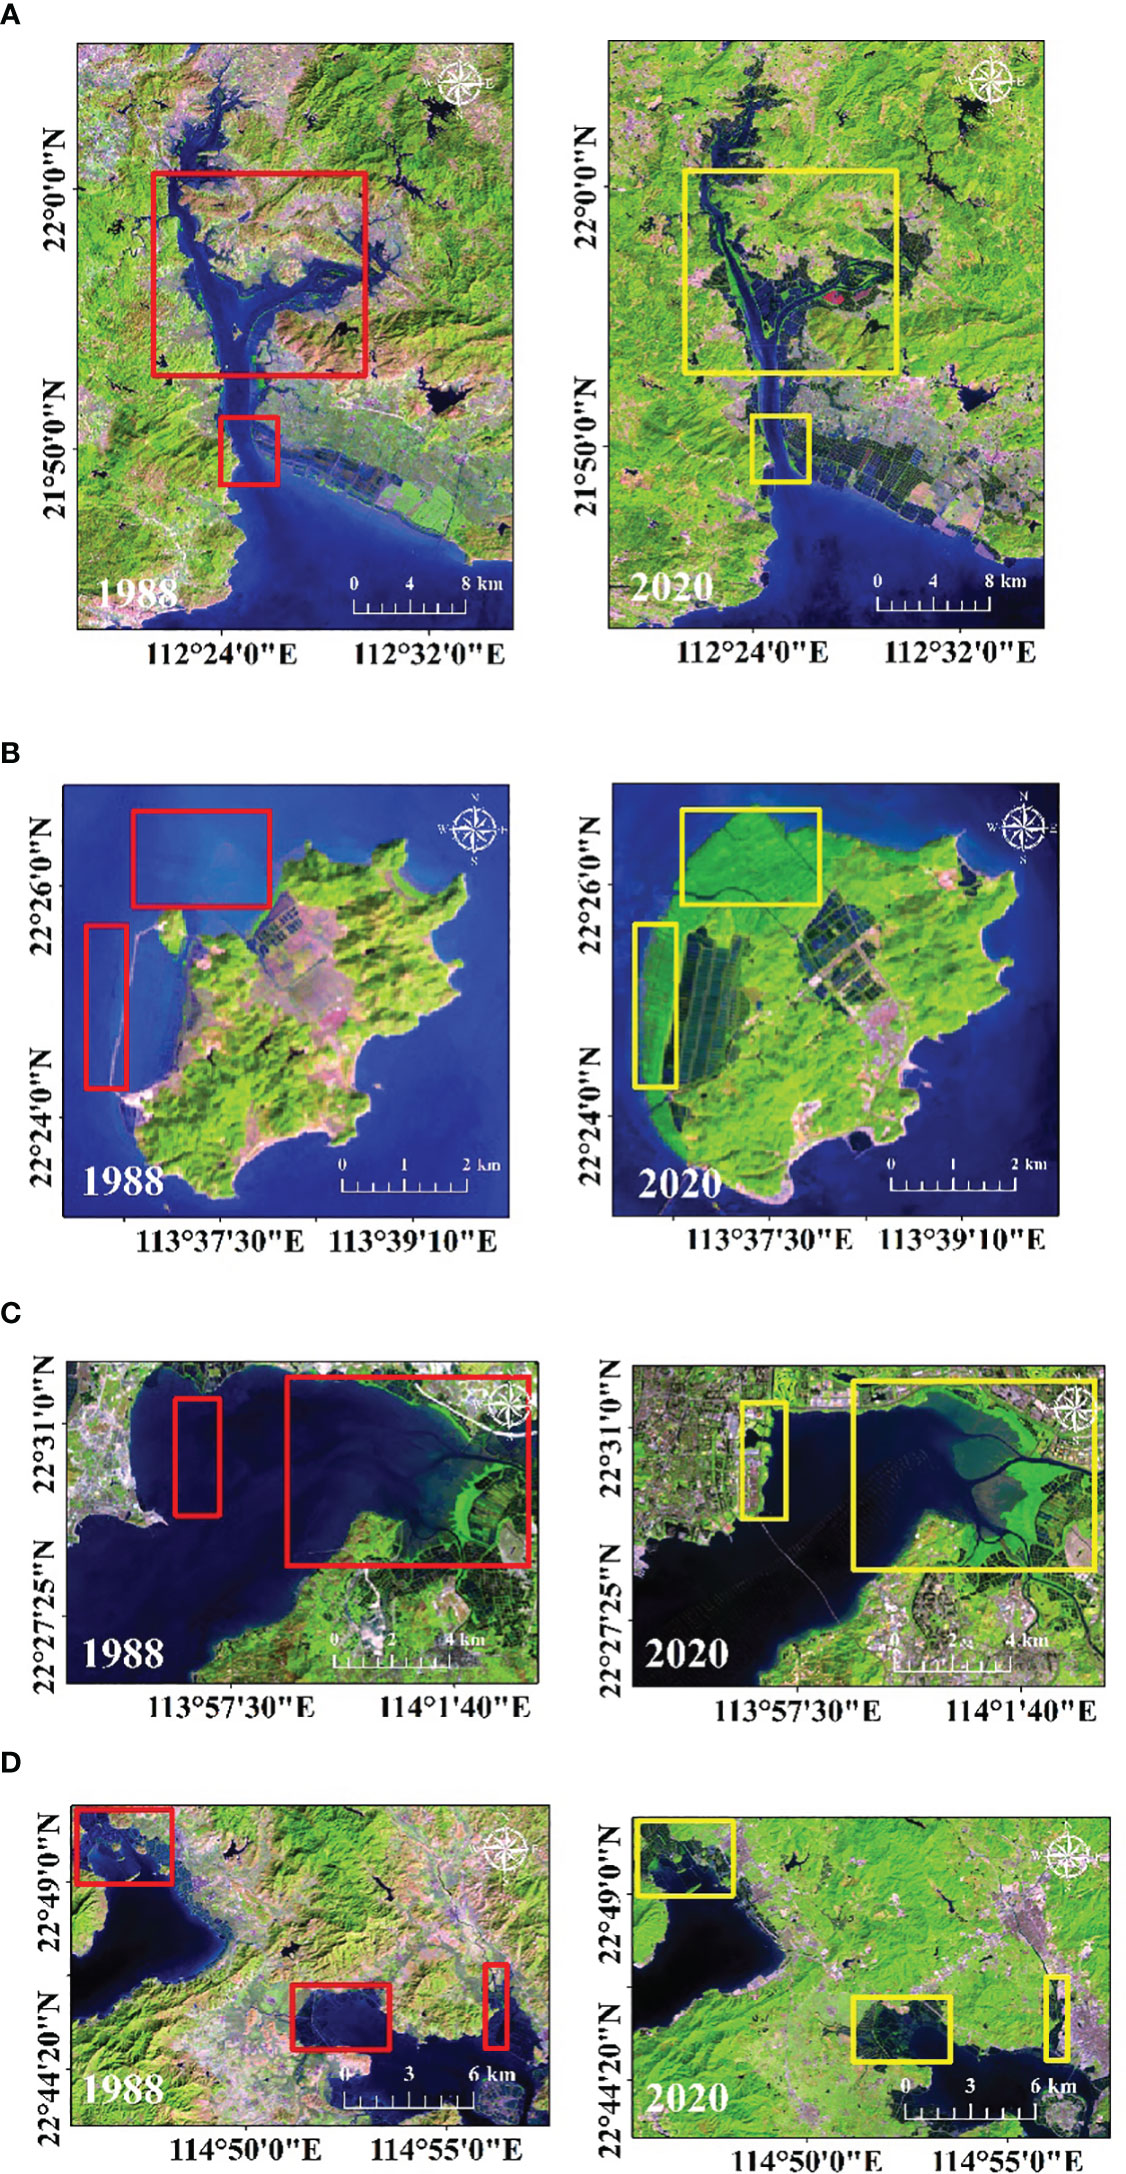
Figure 7 Increased mangrove areas in typical sites from 1988 to 2020: (A) Zhenhai Bay in Jiangmen; (B) Qi’ao Island in Zhuhai; (C) Shenzhen Bay in Shenzhen; (D) Daya Bay in Huizhou.
Nowadays, mangrove ecosystem consists of naturally grown mangroves and replanted mangroves. Replanting work is mainly carried out in mangrove reserves. The establishment of reserves in typical sites occurred mainly at the end of the 20th century. Before 1996, mangrove cover was all witnessed a decline, which was subsequently followed by an upward trend. Based on above situation, natural mangroves were dominant before 1996, and replanted mangroves replaced natural mangroves as the major presence after that. Since 1996, replanted mangrove areas have gradually expanded (Figure 6). The proportion of replanted mangroves exceeded that of natural mangroves as early as 2004 in Qi’ao Island and Shenzhen Bay. By 2020, replanted mangroves in all sites have accounted for more than half. Replanted mangroves with the highest proportion were found in Qi’ao Island, whereas the proportions of natural and replanted mangroves were closest in Zhenhai Bay. Compared to the largest natural mangrove areas in 1988, three sites (Qi’ao Island, Zhenhai Bay, and Daya Bay) had larger replanted mangrove areas in 2020. Notably, replanted mangrove areas far exceeded the largest natural mangrove area in Qi’ao Island. However, replanted mangrove areas in Zhenhai Bay were smaller than the largest natural mangrove areas.
3.4 Protection effectiveness of mangroves in natural reserves
Different levels of protection in nature reserves result in varying dynamic mangrove rates (Figure 8). The mean dynamic rate in mangrove reserves of the GBA stands at 15.75%, surpass that in other regions of the GCA, which averages at 10%. It can be further illustrated by considering specific cases. For instance, the top two reserves with the highest dynamic rates are Qi’ao Provincial Mangrove Reserve in Zhuhai (62%) and Zhenhai Bay County Mangrove Reserve (18%), both of which were established at the end of the 20th century (Table 1). Conversely, the last three reserves with lowest dynamic rates were identified in Maipu National Nature Reserve in Hong Kong (3%), Zhanjiang National Mangrove Reserve in Zhanjiang (2%) and Huidong County Mangrove Reserve (2%). Mangrove reserves with higher dynamic rates and lower dynamic rate are both predominantly located in typical sites of the GBA.
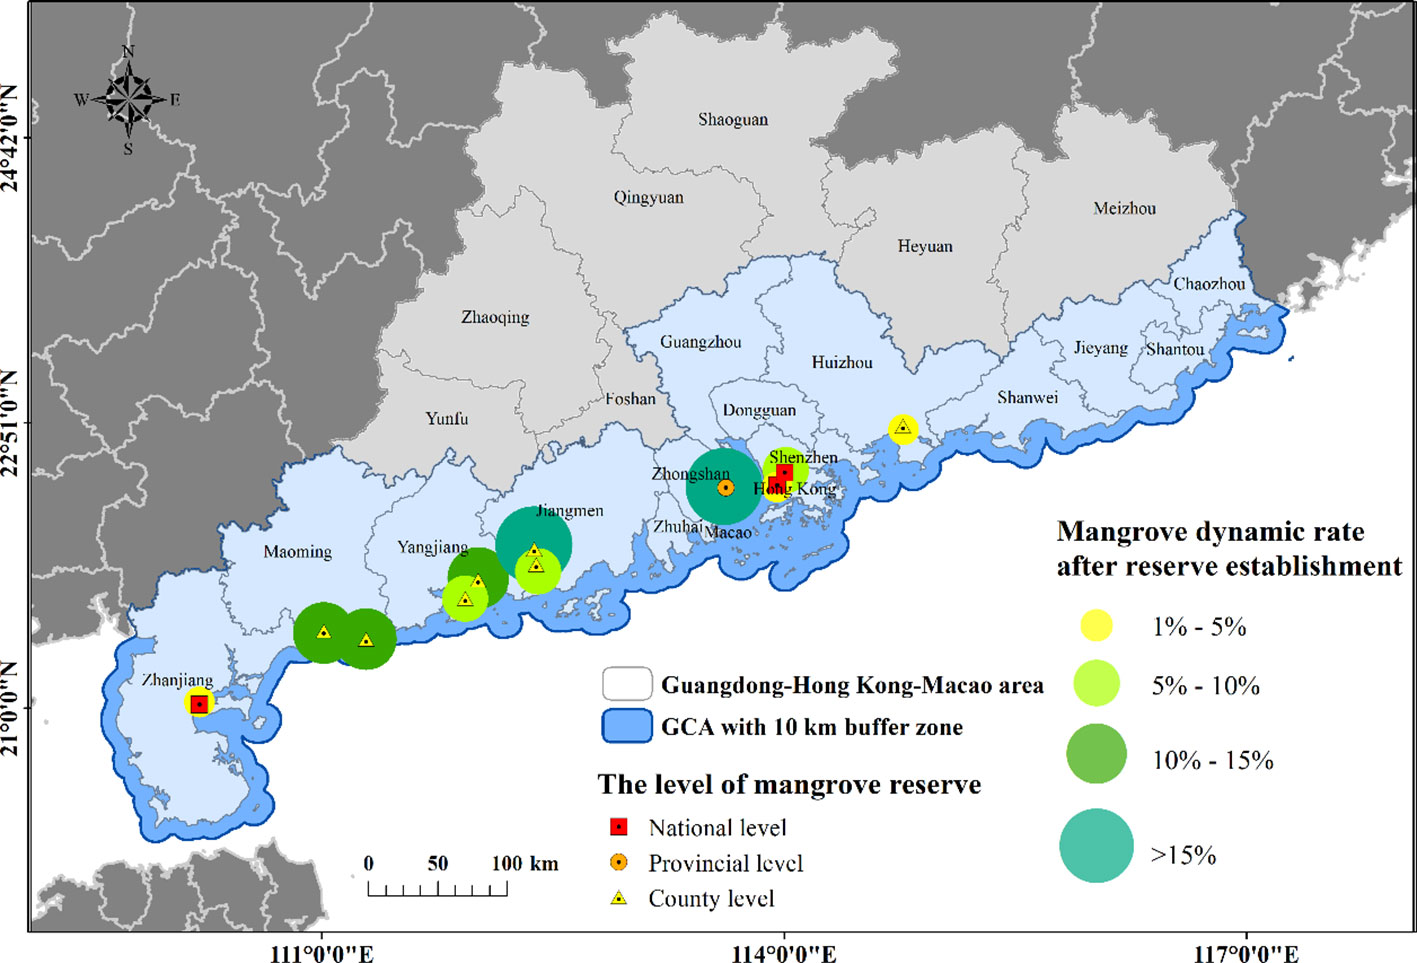
Figure 8 Dynamic rate of mangrove cover in different level reserves in the Guangdong-Hong Kong-Macao Coastal Area (GCA).
4 Discussion
4.1 Comparisons with different mangrove datasets in Qi’ao Island and Shenzhen Bay
Four quality mangrove datasets from Hu et al. (2018); Jia et al. (2018); Zhang et al. (2023) and Zhao and Qin (2022) were used for comparison in order to evaluate the performance of mangrove maps in the GCA. Visual comparisons with reference datasets were made for two key sites: Qi’ao Island in Zhuhai and Shenzhen Bay in Shenzhen (Figure 9). The reason for choosing these two sites was that key mangrove reserves were set in Qi’ao Island and Shenzhen Bay. Then, the years of 1988 and 2020 were chosen to evaluate mangrove mapping results of sparse mangroves and dense mangroves, because there were relatively fewer mangroves in 1988 and more mangroves in 2020. Therefore, mangrove distribution in 1988 of this study (This Study-1988) was compared with mangrove data in 1990 of (Hu et al., 2018) (Hu-1990) and (Jia et al., 2018) (Jia-1990), while mangrove distribution in 2020 of this study (This Study-2020) was checked with mangrove data in 2020 of (Zhang et al., 2023) (Zhang-2020), mangrove data in 2019 of (Zhao and Qin, 2022) (Zhao and Qin-2019).
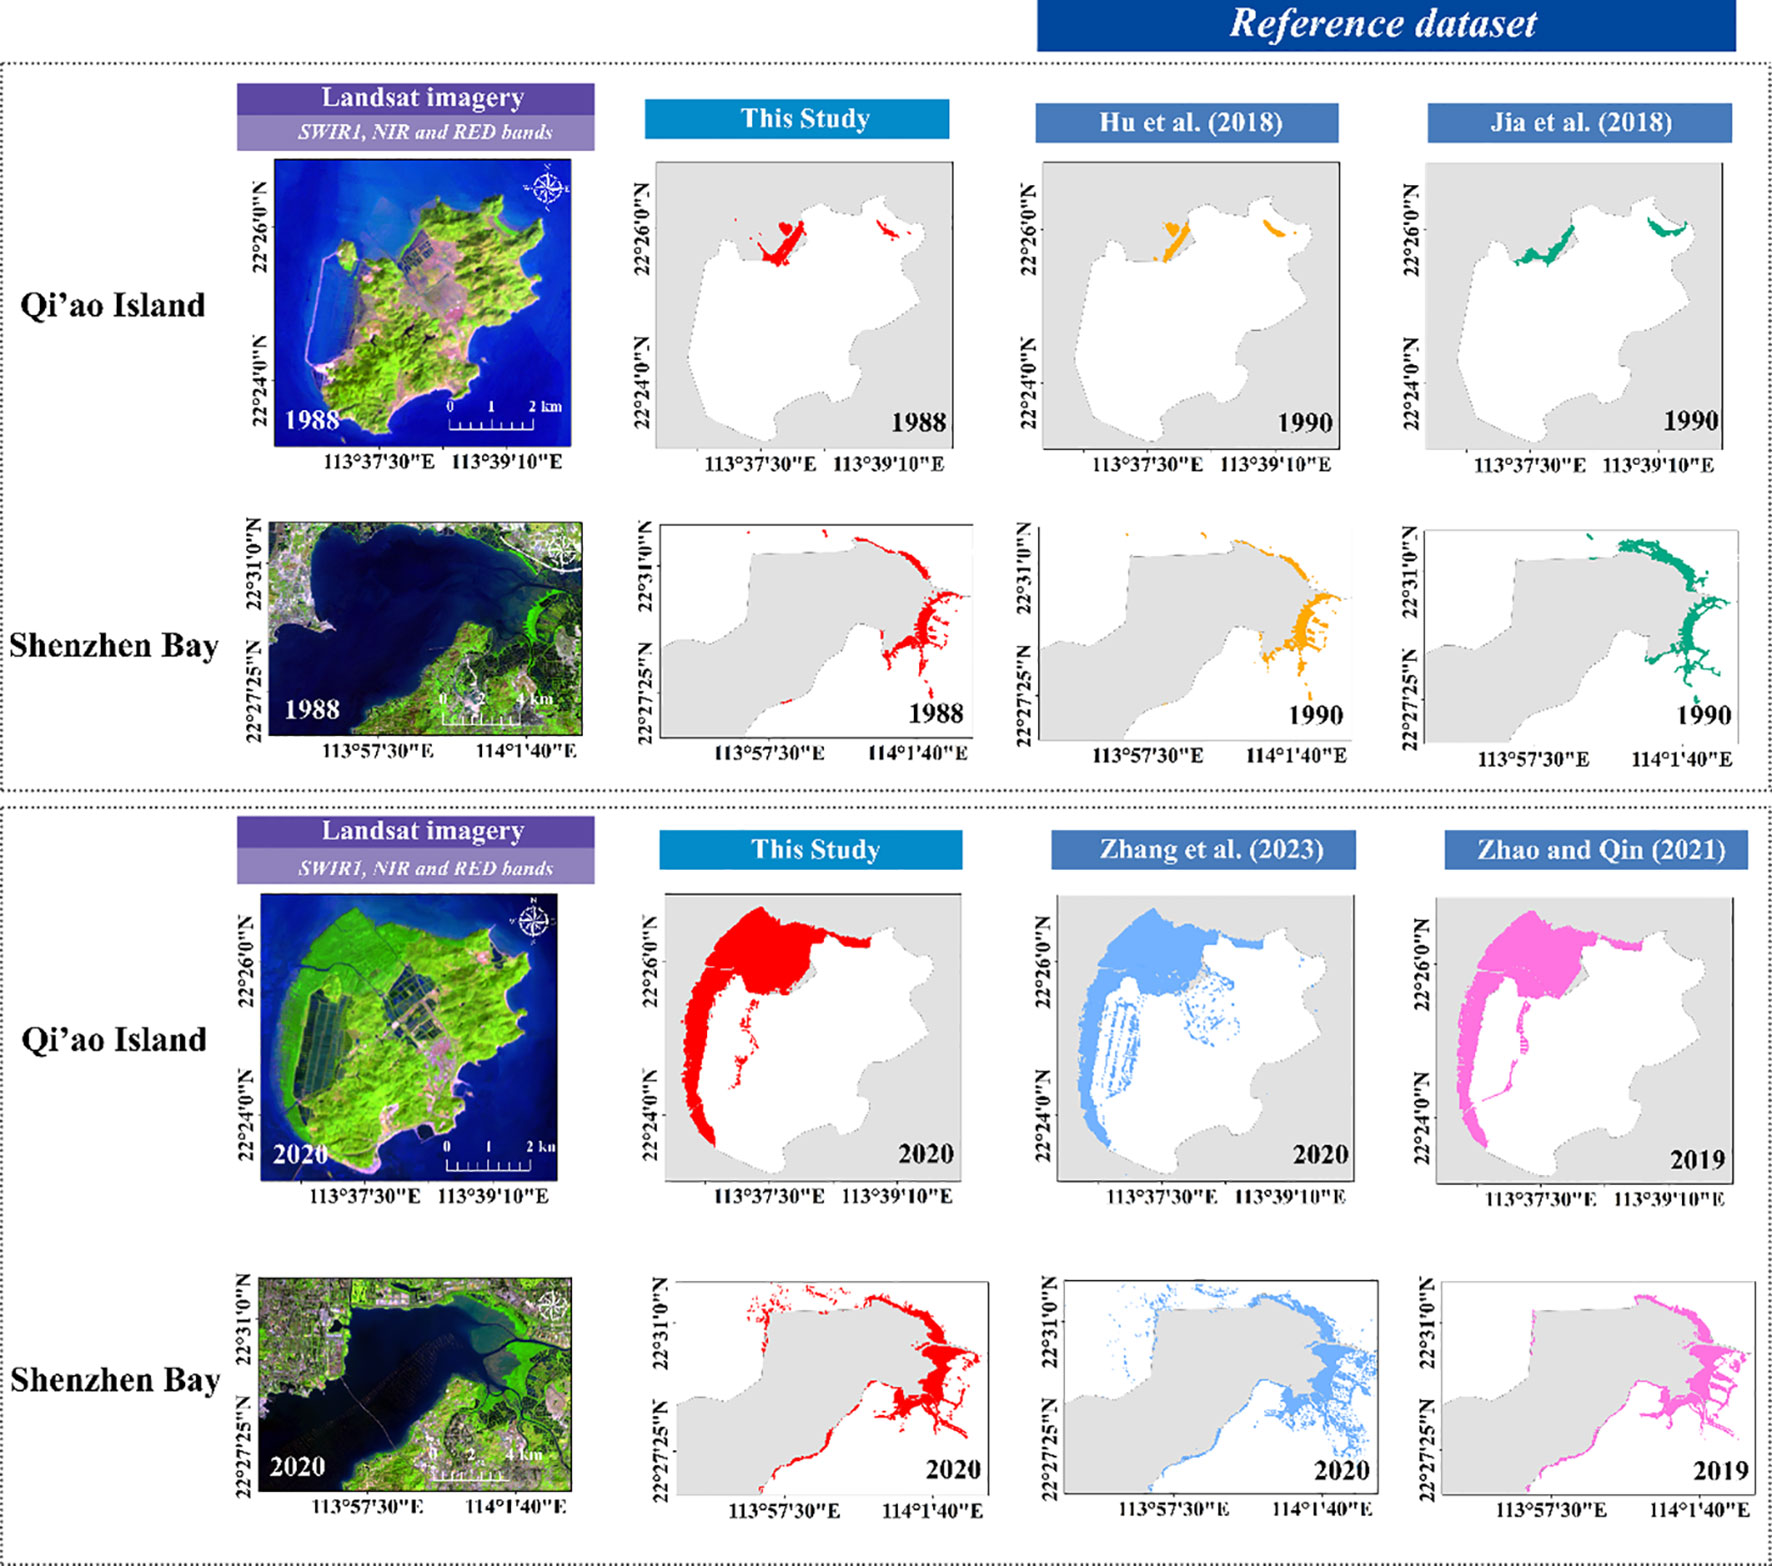
Figure 9 Comparison of different mangrove datasets in two key sites (Qi’ao Island and Shenzhen Bay).
Over five mangrove datasets, there was good consistency in mapping the geographical distribution of mangroves. In 1988, small-area mangrove patches challenged the mapping ability of mangrove datasets (This Study-1988, Hu-1990, Jia-1990) derived from Landsat data. They were able to extract small mangrove areas in the northwest and northeast of Qi’ao Island, as well as in the northeast of Shenzhen Bay. Jia-1990 showed neat and tidy boundaries of mangrove patches but made a little omission error in small mangrove areas of the east of Shenzhen Bay, while This Study-1988 and Hu-1990 could well mapped these small areas. It is mainly because Jia-1990 was derived by the object-based classification approach, and This Study-1988 and Hu-1990 were developed by pixel-based approaches. In 2020, large mangrove areas were so concentrated that mangrove datasets produced by RF classifier (This Study-2020, Zhang-2020, Zhao and Qin-2019) all performed well in capturing them. In the central part of Qi’ao Island, Zhang-2020 inaccurately identified small and fragmented mangrove patches. Besides, Zhao and Qin-2019 missed small mangrove areas in northern Shenzhen Bay. In fact, there are also a few mangroves in the Shahe Golf Course and the Overseas Chinese Town (OCT) Wetland Streetpiano of Shenzhen. The errors possibly came from different features used in RF classification.
4.2 Effect of mangrove restoration in the GCA
From above analysis, it can be concluded that the construction of mangrove reserve is one of the most effective means to protect mangroves. Since 1996, there has been a gradual turnaround in mangrove areas, with a shift towards steady growth. National reserves were established prior to 1996 in the GCA, such as Zhanjiang Mangrove Reserve in Zhanjiang, Neilingding Island-Futian Nature Reserve in Shenzhen, and Mai Po Nature Reserve in Hong Kong. The restoration in reserves has prevented the rapid destruction of the mangrove cover at the beginning of 21st century. On the 14th Meeting of the Conference of the Contracting Parties to the Ramsar Convention on Wetlands (COP14), China shows the significant progress on costal mangrove conservation. GCA is a coastal area with best mangrove protection. The dynamic mangrove rate of the GCA from 1988 to 2020 (1.02%) is closer to that of China (1.36%) (Wang et al., 2020). Specifically, there was a obvious increase in mangrove populations of Zones A and B. It is possible that national reserves with stable mangrove growth and provincial or county reserves with rapid mangrove growth were both identified in Zones A and B. The mangrove protection in national reserves with more mature and tall mangroves is facing more challenges. These reserves are located along coastal areas, suffering frequent typhoon events. The larger gaps appeared on the mature and tall mangroves lead them less resistance to typhoons, and their restoration demands greater efforts (Li et al., 2023). Furthermore, human activities like tourism and fisheries may increase pressure on the mangrove restoration of national reserves. Striking a balance between economic development and ecological conservation will reduce the intensity of mangrove protection.
In addition to the construction of mangrove reserves, other protective measures also contribute to the increase of mangrove areas. It is mostly found in Zones B and C. The north of Zone B mainly includes the coastal area of Guangzhou, such as Nansha and Panyu. Guangzhou government has implemented lots of mangrove restoration projects on the Nansha wetland, the north side of Humen Bridge, Haiou Island of Panyu and so on (Fu et al., 2014; Qiu et al., 2017). Since 2021, Guangzhou has joined the Cities for Biodiversity (C4B), which will provide stronger support for mangrove ecological restoration. The southeast of Zone B mainly includes Shenzhen. After the release of 13th Five-Year Plan, Shenzhen has carried out 12 wetland restoration projects (Li et al., 2007). In 2022, the resolution to build World’s first International Mangrove Center in Shenzhen was adopted at the COP14 on wetland conservation. After that, mangrove protection in Shenzhen will play an exemplary role in China and the world. Zone C is mainly the coastal area of Shantou, including Jinping, Haojiang, Chenghai and Chaoyang. Shantou has stepped up efforts to do the mangrove protective work, such as developing inner gulf wetlands in Jinping, and building the Global Environment Fund (GEF) international wetland demonstration area in Suai Bay of Haojiang (Zhang et al., 2020). With the situation of global warming, northeast coastal areas of the GCA will be more suitable for mangrove growth, and results of mangrove plantation will be more effective. Therefore, mangrove areas in Shantou may also increase significantly in the future.
4.3 Natural and replanted mangroves in typical
As an important mangrove distribution in the GCA, the GBA is one of regions with the fastest mangrove growing (Guo et al., 2021), and it encounters difficulty in mangrove protection due to rapid urban expansion and climate change. In typical sites of the GBA, the change of mangrove cover was basically consistent with the overall change in the GCA. Mangrove areas in all sites experienced a declining trend from 1988 to 1996, and increased differently from 1996 to 2020. Daya Bay, with a relatively smaller overall mangrove area, experienced a slow and fluctuating upward trend. It could be attributed to prioritization of aquaculture, tourism, and economic growth in Huizhou (Wang et al., 2008), resulting in lower funding for mangrove protection. Three sites (Zhenhai Bay, Qi’ao Island, and Shenzhen Bay) showed remarkable growth in their mangrove ecosystems, accompanied by a visible expansion of replanted mangrove cover. It indicates that a higher level of mangrove conservation in these three sites, reflecting increased investments in protecting mangroves. There are also differences in the protection of these three sites. Presently, Zhenhai Bay has a nearly equal proportion of natural and replanted mangrove areas, with replanted areas slightly smaller than the largest natural mangrove areas. This may suggest that more conservation efforts in Zhenhai Bay are needed. Based on lower urbanization and less land reclamation in Zhenhai Bay (Figure 7), it may indicate a slower pace of economic development compared to other sites. The conservation work seems to focus on restoration of damaged natural mangroves, rather than replanting more mangroves. The proportion of replanted mangroves on Qi’ao Island is the largest, indicating a substantial investment aimed at maximizing mangrove protection. Currently, mangroves have become a mark of Qi’ao Island. Since 1996, the extent of replanted mangroves in Shenzhen Bay has consistently outpaced that of other sites, indicative of a prolonged and stable contribution to conservation.
Monitoring both natural and replanted mangroves is crucial. When establishing mangrove afforestation, it is advisable to afforestation based on existing natural mangroves of a certain quantity and size (Temmink et al., 2022). This approach significantly enhances the possibilities of successful replanting. This principle can be used as a reference for the mangrove restoration with a slow pace in Daya Bay. However, it’s important to acknowledge that replanted mangroves tend to consist of uniform populations and follow a more standardized arrangement. Consequently, their coastal protection capability may be poorer than that of natural mangroves. A substantial number of replanted mangroves are located in Qi’ao Island and Shenzhen Bay, where are susceptible to frequent natural disasters. Hence, it is important to focus on the preservation of natural mangrove ecosystems. Besides, mangroves are a reservoir of both aboveground and belowground carbon, with a notable presence of belowground carbon (Djamaluddin et al., 2023). While replanted mangroves contribute to climate change mitigation, protecting the remaining natural mangroves is also valuable. It is primarily because the carbon reserves in natural mangrove areas are larger and irreplaceable. Mangrove reserves in Qi’ao Island with more replanted mangroves should pay more attention to the natural mangroves. The mangrove ecosystem in Zhenhai Bay consists of a majority of natural mangroves, offering opportunities for studying on their carbon storage.
4.4 Exploration of mangrove conservation in the GBA and surrounding regions
The effect of mangrove restoration in the GBA can be quantified by comparing the dynamic rate of mangrove reserves in the GBA and other regions of the GCA after construction. The protection of mangroves in the GBA is better than in other regions of the GCA, due to a higher mangrove dynamic rate in the GBA. Most of the mangrove reserves with higher dynamic rates in the GBA were established before 2000. After 2000, mangrove reserves are mostly established in other areas of the GCA, including Zhanjiang, Maoming and Yangjiang. It shows that mangrove protection in the GBA has weakened during the 21st century. But in recent years, national wetland and mangrove parks have been built in Zhenhai Bay and Daya Bay, that is, mangrove protection in the GBA will be strengthened. In general, mangrove protection in the GBA is better than that in other regions of GCA. Mangrove protection in the GBA should play a leading role and advance side by side with that in other areas of the GCA.
The successful protection is mainly attributed to techniques of mangrove afforestation, as well as the establishment of strict standards. The standards mainly include qualifications for designers and constructors, field investigations, the selection of suitable mangrove species, scientific methods of afforestation, criteria of monitoring mangroves, and strict deadlines (Li et al., 2022). Additionally, continuous research and adaptive management strategies play an important role in optimizing the effectiveness of these protective measures. However, some local standards are so simplification that they may contribute to the poor mangrove protection in other regions of GCA. Hence, it is advisable to adopt the well-established regulations from successful mangrove reserves in the GBA.
4.5 Impact of coastal reclamation on mangroves
Human activities have different influence on mangroves. For instance, costal reclamation can be a strategy to restore the mangrove habitat in addition to above protection. Land reclamation has been implemented in the GCA to solve the contradiction between demand for urban construction land and limit of land supply. It resulted in land use change, including urbanization, agriculture, aquaculture, and industrialization. Initially, four sites (Zhenhai Bay, Qi’ao Island, Shenzhen Bay, and Daya Bay) all suffered costal reclamation, and their mangrove resources were lost to varying degrees.
While costal reclamation is one of the important factors causing the degradation of mangrove ecosystems, mangrove suitable areas surprisingly increased during the implementation of land claim. It is mainly because the process of costal land claim has also resulted in the formation of new tidal flats suitable for mangrove growth by the silt deposition and the reduction of tidal influx (Wang et al., 2010; Zhang et al., 2019). Rapid sedimentation not only allows mangrove seed dispersal, but it also provides new mangrove habitats, resulting in mangrove expansion. Taking Shenzhen Bay as an example, there is a positive link between the development of mangroves and the decrease of tidal influx by costal reclamation during the same period (Wang et al., 2022). In reclaimed sites, a model of sustainable development may involve the successful reestablishment and robust protection of mangroves. As these mangroves flourish, it paves the way for the prosperity of adjacent agricultural, fishing, and tourism businesses, achieving a harmonious blend of economic growth and ecological stability.
5 Conclusion
The study focuses on mangrove dynamics and its protection effect at eight-year intervals from 1988 to 2020 in the GCA. Mangrove cover was derived by using RF classifier with Landsat 30 m spatial resolution satellite images on the GEE cloud platform. The main conclusions are as follows:
(1) The overall accuracy of mangrove classification was basically higher than 88%. Overall trend of mangrove dynamics showed a first decreasing and subsequently rising pattern in the GCA, with the average increasing rate of 1.02%. And it also shows that mangroves increased obviously in zones of Zone A (the east coast of Zhanjiang), Zone B (the Pearl River Estuary) and Zone C (Shantou, Chaozhou), among them Zone B with the fastest dynamic rate of 2.57%. (2) In typical sites of the GBA, mangroves revealed growing trends as a result of mangrove reserve construction, along with an expansion of replanted mangrove areas. The mangrove cover in Zhenhai Bay is the greatest, while Daya Bay had the minimal mangrove cover. Qi’ao Island has the highest proportion of replanted mangrove, and Shenzhen Bay consistently leads in afforestation. It’s crucial to monitor the changes of both natural and replanted mangroves for afforestation, coastal protection, and carbon storage research. (3) Setting of mangrove reserves shows effectiveness in reversing the rapid decline and increases mangrove areas. Provincial-level and county-level reserves play a key role in accelerating the increase of the mangrove cover, while national-level reserves provide a relatively moderate protection. The mangrove protection in national reserves with more mature and tall mangroves is facing more challenges. Mangrove protection in the GBA is better than in other areas of the GCA, offering valuable insights that can serve as a reference for other regions. In addition to mangrove reserve establishment, other work, such as the construction of wetland parks, ecological research, improvements to mangrove protective system, and even costal reclamation can be beneficial to protect mangrove resources.
This study may reveal major evidence of mangrove change and provide some references for sustainable management of mangroves in the GCA. It also provides a scientific foundation to quantify ecosystem services, such as coastal protection and carbon storage, and assists in the development of strategies to mitigate and adapt to climate change.
Data availability statement
The original contributions presented in the study are publicly available. The dataset can be found here: https://www.scidb.cn/en/s/jYRzQr. Further inquiries can be directed to the corresponding author.
Author contributions
JLZ: Methodology, Visualization, Validation, Writing - Original Draft, Writing - Review & Editing. BA: Conceptualization, Methodology, Writing - Original Draft, Writing – Review, Funding acquisition. ZJ: Validation, Writing - Review & Editing. MY: Validation, Writing - Review & Editing. JZ: Visualization, Writing - Review & Editing. SS: Visualization, Writing - Review & Editing. All authors contributed to the article and approved the submitted version.
Funding
This work was supported by the National Natural Science Foundation of China [grant number 42071261], the Project supported by Southern Marine Science and Engineering Guangdong Laboratory (Zhuhai) [grant number SML2020SP011].
Conflict of interest
The authors declare that the research was conducted in the absence of any commercial or financial relationships that could be construed as a potential conflict of interest.
Publisher’s note
All claims expressed in this article are solely those of the authors and do not necessarily represent those of their affiliated organizations, or those of the publisher, the editors and the reviewers. Any product that may be evaluated in this article, or claim that may be made by its manufacturer, is not guaranteed or endorsed by the publisher.
References
Arisanty D., Nur Saputra A. (2017). “Remote sensing studies of suspended sediment concentration variation in Barito Delta,” in IOP Conference Series: Earth and Environmental Science (United Kingdom: Institute of Physics). Vol. 98. 12058. doi: 10.1088/1755-1315/98/1/012058
Arrieta A. B., Diaz-Rodriguez N., Del Ser J., Bennetot A., Tabik S., Barbado A., et al. (2020). Explainable Artificial Intelligence (XAI): Concepts, taxonomies, opportunities and challenges toward responsible AI. Inf. Fusion 58, 82–115. doi: 10.1016/j.inffus.2019.12.012
Chen B., Xiao X., Li X., Pan L., Doughty R., Ma J., et al. (2017). A mangrove forest map of China in 2015: Analysis of time series Landsat 7/8 and Sentinel-1A imagery in Google Earth Engine cloud computing platform. Isprs-J. Photogramm. Remote Sens. 131, 104–120. doi: 10.1016/j.isprsjprs.2017.07.011
Chen G., Hu W., Chen B., Ma Z., Liao J. (2017). Marine spatial planning using in marine ecological red line zoning–a case study of Dongshan County. J. Appl. Oceanogr. 36, 6–15. doi: 10.3969/J.ISSN.2095-4972.2017.01.002
Crist E. P. (1985). A TM Tasseled Cap equivalent transformation for reflectance factor date. Remote Sens. Environ. 17, 301–306. doi: 10.1016/0034-4257(85)90102-6
Cutler D. R., Edwards T. C., Beard K. H., Cutler A., Hess K. T. (2007). Random forests for classification in ecology. Ecology 88, 2783–2792. doi: 10.1890/07-0539.1
Djamaluddin R., Fusi M., Djabar B., Evans D., Holmes R., Huxham M., et al. (2023). Point of (no) return? Vegetation structure and diversity of restored mangroves in Sulawesi, Indonesia, 14-16 years on. Restor. Ecol. 31, e13963. doi: 10.1111/rec.13963
Donato D. C., Kauffman J. B., Murdiyarso D., Kurnianto S., Stidham M., Kanninen M. (2011). Mangroves among the most carbon-rich forests in the tropics. Nat. Geosci. 4, 293–297. doi: 10.1038/NGEO1123
Du C., Loh C. (2020). Toward a more open and collaborative climate change policy framework in Hong Kong and Macao within the Guangdong-Hong Kong-Macao Greater Bay Area. Chin. J. Population Resour. Environ. 18, 179–187. doi: 10.1016/j.cjpre.2020.03.001
Foody G. M. (2002). Status of land cover classification accuracy assessment. Remote Sens. Environ. 80, 185–201. doi: 10.1016/S0034-4257(01)00295-4
Fu Y., Tang C., Li J., Zhao Y., Zhong W., Zeng X. (2014). Sources and transport of organic carbon from the Dongjiang River to the Humen outlet of the Pearl River, southern China. J. Geogr. Sci. 24, 143–158. doi: 10.1007/s11442-014-1078-2
Gevaña D. T., Pulhin J. M., Tapia M. A. (2019). “Chapter 13 - fostering climate change mitigation through a community-based approach: carbon stock potential of community-managed mangroves in the Philippines,” in Coastal Management. Eds. Krishnamurthy R. R., Jonathan M. P., Srinivasalu S., Glaeser B. (America: Academic Press), 271–282.
Gilani H., Naz H. I., Arshad M., Nazim K., Akram U., Abrar A., et al. (2021). Evaluating mangrove conservation and sustainability through spatiotemporal, (1990-2020) mangrove cover change analysis in Pakistan. Estuar. Coast. Shelf Sci. 249, 107128. doi: 10.1016/j.ecss.2020.107128
Green E. P., Clark C. D., Mumby P. J., Edwards A. J., Ellis A. C. (1998). Remote sensing techniques for mangrove mapping. Int. J. Remote Sens. 19, 935–956. doi: 10.1080/014311698215801
Guo H. J., Cai Y. P., Yang Z. F., Zhu Z. C., Ouyang Y. R. (2021). Dynamic simulation of coastal wetlands for Guangdong-Hong Kong-Macao Greater Bay area based on multi-temporal Landsat images and FLUS model. Ecol. Indic. 125, 107559. doi: 10.1016/j.ecolind.2021.107559
He T. T., Fu Y. C., Ding H., Zheng W. P., Huang X. H., Li R. H., et al. (2022). Evaluation of mangrove wetlands protection patterns in the Guangdong-Hong Kong-Macao greater bay area using time-series landsat imageries. Remote Sens. 14, 6026. doi: 10.3390/rs14236026
Hu L. J., Li W. Y., Xu B. (2018). Monitoring mangrove forest change in China from 1990 to 2015 using Landsat-derived spectral-temporal variability metrics. Int. J. Appl. Earth Obs. Geoinf. 73, 88–98. doi: 10.1016/j.jag.2018.04.001
Huete A. R. (1988). A soil-adjusted vegetation index (SAVI). Remote Sens. Environ. 25, 295–309. doi: 10.1016/0034-4257(88)90106-X
Jia M. M., Wang Z. M., Zhang Y. Z., Mao D. H., Wang C. (2018). Monitoring loss and recovery of mangrove forests during 42 years: The achievements of mangrove conservation in China. Int. J. Appl. Earth Obs. Geoinf. 73, 535–545. doi: 10.1016/j.jag.2018.07.025
Li Q., Bonebrake T. C., Michalski J. R., Wong F. K. K., Fung T. (2023). Combining multi-temporal airborne LiDAR and Sentinel-2 multispectral data for assessment of disturbances and recovery of mangrove forests. Estuar. Coast. Shelf Sci. 291, 108444. doi: 10.1016/j.ecss.2023.108444
Li H., Chen G., Zan Q. (2007). Protection and restoration of mangroves in Shenzhen. Urban Environ. Urban Ecol. 20, 10–12. doi: 10.3969/j.issn.1001-5221.2007.02.003
Li R., Yang F., Wang H., Wang W. (2022). Current development status and countermeasures of mangrove protection and restoration standards. Acta Scientiarum Naturalium Universitatis Pekinensis 58, 916–928. doi: 10.13209/j.0479-8023.2022.079
Liu K., Peng L., Li X., Tan M., Wang S. (2019). Monitoring the inter-annual change of mangroves based on the Google Earth engine. J. Geo-Inf. Sci. 21, 731–739. doi: 10.12082/dqxxkx.2019.180354
Mondal B., Saha A. K., Roy (2021). Spatio-temporal pattern of change in mangrove populations along the coastal West Bengal, India. Environ. Challenges 5, 100306. doi: 10.1016/j.envc.2021.100306
Mountford G. L., Atkinson P. M., Dash J., Lankester T., Hubbard S. (2017). “Chapter 4 - sensitivity of vegetation phenological parameters: from satellite sensors to spatial resolution and temporal compositing period,” in Sensitivity Analysis in Earth Observation Modelling. Eds. Petropoulos G. P., Srivastava P. K. (United Kingdom: Elsevier), 75–90.
Myneni R. B., Hall F. G., Sellers P. J., Marshak A. L. (1995). The interpretation of spectral vegetation indexes. IEEE Transaction Geosci. Remote Sens. 33, 481–486. doi: 10.1109/36.377948
Pei T., Xu J., Liu Y., Huang X., Zhang L., Dong W., et al. (2021). GIScience and remote sensing in natural resource and environmental research: Status quo and future perspectives. Geogr. Sustain 2, 207–215. doi: 10.1016/j.geosus.2021.08.004
Pendleton L., Donato D. C., Murray B. C., Crooks S., Jenkins W. A., Sifleet S., et al. (2012). Estimating global "Blue carbon" Emissions from conversion and degradation of vegetated coastal ecosystems. PloS One 7, e43542. doi: 10.1371/journal.pone.0043542
Qiu N., Xu S., Qiu P., Song Y., Niu A., Xu G. (2017). Species diversity and spatial distribution pattern of mangrove in Nansha Wetland Park, Guangzhou, Guangdong Province, China. Ecol. Environ. Sci. 26, 27–35. doi: 10.16258/j.cnki.1674-5906.2017.01.005
Richards D. R., Friess D. A. (2016). Rates and drivers of mangrove deforestation in Southeast Asia 2000-2012. Proc. Natl. Acad. Sci. U. S. A. 113, 344–349. doi: 10.1073/pnas.1510272113
Rodriguez-Galiano V. F., Ghimire B., Rogan J., Chica-Olmo M., Rigol-Sanchez J. P. (2012). An assessment of the effectiveness of a random forest classifier for land-cover classification. Isprs-J. Photogramm. Remote Sens. 67, 93–104. doi: 10.1016/j.isprsjprs.2011.11.002
Sahani N. (2021). Assessment of spatio-temporal changes of land surface temperature (LST) in Kanchenjunga Biosphere Reserve (KBR), India using Landsat satellite image and single channel algorithm. Remote Sens. Applications: Soc. Environ. 24, 100659. doi: 10.1016/j.rsase.2021.100659
Sasmito S. D., Basyuni M., Kridalaksana A., Saragi-Sasmito M. F., Lovelock C. E., Murdiyarso D. (2023). Challenges and opportunities for achieving Sustainable Development Goals through restoration of Indonesia's mangroves. Nat. Ecol. Evol. 7, 62–70. doi: 10.1038/s41559-022-01926-5
Shi T., Liu J., Zhongwen H., Wang J., Wu G. (2016). New spectral metrics for mangrove forest identification. Remote Sens. Lett. 7, 885–894. doi: 10.1080/2150704X.2016.1195935
Song C., Sun C., Xu J., Fan F. (2022). Establishing coordinated development index of urbanization based on multi-source data: A case study of Guangdong-Hong Kong-Macao Greater Bay Area, China. Ecol. Indic. 140, 109030. doi: 10.1016/j.ecolind.2022.109030
Stocken T., Menemenlis D. (2017). Modelling mangrove propagule dispersal trajectories using high-resolution estimates of ocean surface winds and currents. Biotropica 49, 472–481. doi: 10.1111/btp.12440
Taillardat P., Friess D. A., Lupascu M. (2018). Mangrove blue carbon strategies for climate change mitigation are most effective at the national scale. Biol. Lett. 14, 20180251. doi: 10.1098/rsbl.2018.0251
Tan H., Cai R., Du J., Hu W. (2022). Climate change and marine ecosystems: impacts, adaptation, and vulnerability. Daqi Kexue Xuebao = Trans. Atmospheric Sci. 45, 489. doi: 10.13878/j.cnki.dqkxxb.20220411001
Temmink R. J. M., Lamers L. P. M., Angelini C., Bouma T. J., Fritz C., van de Koppel J., et al. (2022). Recovering wetland biogeomorphic feedbacks to restore the world's biotic carbon hotspots. Science 376, n1479. doi: 10.1126/science.abn1479
Teng H., Zha X., Xin X., Qiuguo Y. E. (2015). Stereo renovation technology for charts based on arcGIS software. Hydrographic Surveying Charting 35, 1–4. doi: 10.3969/j.issn.1671-3044.2015.05.015
Trigila A., Iadanza C., Esposito C., Scarascia-Mugnozza G. (2015). Comparison of Logistic Regression and Random Forests techniques for shallow landslide susceptibility assessment in Giampilieri (NE Sicily, Italy). Geomorphology 249, 119–136. doi: 10.1016/j.geomorph.2015.06.001
Wang Z., Feng Z., Chen P., Yi R., Tan G. (2022). Evolution process of mangrove forests in Shenzhen Bay and its response to human activities. China Rural Water Hydropower (12) 24–30. doi: 10.12396/znsd.220428
Wang C., Huang F., Yu D., Song P. (2010). The suitability assessment of mangrove costal reclamation. J. Subtropical Resour. Environ. 5, 62–67. doi: 10.13624/j.cnki.issn.1001-7445.2015.1570
Wang Y., Lou Z., Sun C., Sun S. (2008). Ecological environment changes in Daya Bay, China, from 1982 to 2004. Mar. pollut. Bull. 56(11), 1871–1879. doi: 10.1016/j.marpolbul.2008.07.017
Wang H., Ren G., Wu P., Liu A., Pan L., Ma Y., et al. (2020). Analysis on the Remote Sensing monitoring and landscape pattern change of mangrove in China from 1990 to 2019. J. Ocean Technol. 39, 1–12. doi: 10.3969/j.issn.1003-2029.2020.05.001
Wen X., Jia M., Li X., Wang Z., Zhong C., Feng E. (2020). Identification of mangrove canopy species based on visible unmanned aerial vehicle images. J. For. Environ. 40, 486–496. doi: 10.13324/j.cnki.jfcf.2020.05.005
Wu P., Zhang J., Ma Y., Li X. (2013). Remote sensing monitoring and analysis of the changes of mangrove resources in China in the past 20 years. Adv. Mar. Sci. 31, 406–414. doi: 10.3969/j.issn.1671-6647.2013.03.013
Zha Y., Gao J., Ni S. (2003). Use of normalized difference built-up index in automatically mapping urban areas from TM imagery. Int. J. Remote Sens. 24, 583–594. doi: 10.1080/01431160304987
Zhang X., Chen X., Mi S., Gong Z., Lin P. (2020). Rehabilitation of biological coasts of China. Mar. Sci. Bull. (Beijing) 39, 1–11. doi: 10.11840/j.issn.1001-6392.2020.01.001
Zhang W., Chen Z., Wang J. (2015). Monitoring the areal variation of mangrove in Beibu Gulf coast of Guangxi China with remote sensing data. J. Guangxi Univ. (Natural Sci. Edition) 40, 1570–1576. doi: 10.13624/j.cnki.issn.1001-7445.2015.1570
Zhang M., Hong Y. M., Zou F. S., Zhang Q., Fan H. M., Chan S., et al. (2019). Response of shorebird habitat selection to coastal reclamation and urbanization in an extensively developed delta: A case study in Macao, China. Ocean Coast. Manage. 179, 104871. doi: 10.1016/j.ocecoaman.2019.104871
Zhang R., Jia M., Wang Z., Zhou Y., Mao D., Ren C., et al. (2022). Tracking annual dynamics of mangrove forests in mangrove National Nature Reserves of China based on time series Sentinel-2 imagery during 2016–2020. Int. J. Appl. Earth Obs. Geoinf. 112, 102918. doi: 10.1016/j.jag.2022.102918
Zhang X., Liu L. Y., Zhao T. T., Chen X. D., Lin S. R., Wang J. Q., et al. (2023). GWL_FCS30: a global 30 m wetland map with a fine classificationsystem using multi-sourced and time-series remote sensing imagery in 2020. Earth Syst. Sci. Data 15, 265–293. doi: 10.5194/essd-15-265-2023
Zhang J., Yang X., Wang Z., Zhang T., Liu X. (2021). Remote sensing based spatial-temporal monitoring of the changes in coastline mangrove forests in China over the last 40 years. Remote Sens. 13, 1986. doi: 10.3390/rs13101986
Zhao Y. (2017). Remote sensing survey and proposal for protection of the shoreline and the mangrove wetland in Guangdong Province. Remote Sens. Land Resour. 29, 114–120. doi: 10.6046/gtzyyg.2017.s1.19
Zhao C., Jia M., Wang Z., Mao D., Wang Y. (2023). Toward a better understanding of coastal salt marsh mapping: A case from China using dual-temporal images. Remote Sens. Environ. 295, 113664. doi: 10.1016/j.rse.2023.113664
Keywords: mangrove dynamics, Guangzhou-Hong Kong-Macao Coastal Area (GCA), google earth engine (GEE), random forest (RF), protection effect
Citation: Zeng J, Ai B, Jian Z, Ye M, Zhao J and Sun S (2023) Analysis of mangrove dynamics and its protection effect in the Guangdong-Hong Kong-Macao Coastal Area based on the Google Earth Engine platform. Front. Mar. Sci. 10:1170587. doi: 10.3389/fmars.2023.1170587
Received: 21 February 2023; Accepted: 27 September 2023;
Published: 12 October 2023.
Edited by:
Marcel Stive, Delft University of Technology, NetherlandsReviewed by:
Chuanpeng Zhao, Chinese Academy of Sciences (CAS), ChinaXiankun Yang, Guangzhou University, China
Copyright © 2023 Zeng, Ai, Jian, Ye, Zhao and Sun. This is an open-access article distributed under the terms of the Creative Commons Attribution License (CC BY). The use, distribution or reproduction in other forums is permitted, provided the original author(s) and the copyright owner(s) are credited and that the original publication in this journal is cited, in accordance with accepted academic practice. No use, distribution or reproduction is permitted which does not comply with these terms.
*Correspondence: Bin Ai, YWJpbkBtYWlsLnN5c3UuZWR1LmNu