 Matthew R. Dunn
 Brittany Finucci
 Matthew H. Pinkerton
 Philip Sutton
 Clinton A.J. Duffy
- 1Fisheries Centre, National Institute of Water and Atmospheric Research (NIWA), Wellington, New Zealand
- 2Marine Species Team - Biodiversity, Heritage, and Visitors, Department of Conservation, Auckland, New Zealand
Five species of sea turtles are known to occur in New Zealand waters, with the leatherback turtle (Dermochelys coriacea) being the most frequently reported. In New Zealand all sea turtles are protected, but there are currently no fisheries bycatch mitigation measures. We describe fishery captures of leatherbacks from Ministry observer and fisher self-reported data. A generalized additive model (GAM) was then used to evaluate which factors might explain the observed year trend in captures. Between fishing years 2007–08 and 2020–21 (years starting 1 October), there were 217 captures of leatherback turtles, an annual average of 15.5. Reported captures increased substantially to 50 in 2020–21. Nearly all (97.7%) captures were reported from surface longline fisheries. Because of sparse observer coverage most captures (85.3%) were self-reported by fishers. Within the main fishery, just 9.4% of the vessels reported 94.5% of the leatherback captures, and one vessel reported 40.4% of all captures. Some non-reporting of captures seems likely. The GAM estimated a higher probability of capture with increasing SST from a constant-over-time spatial pattern of monthly sea surface temperature, and predicted the increase in captures in 2020–21. Much of the increase in bycatch could therefore be explained by the fleet moving into warmer areas where the probability of leatherback capture was higher. Capture mitigation measures could include restricting fishing in turtle ‘hotspot’ times and areas. New Zealand waters should be recognized as an important seasonal foraging ground for leatherback turtles where capture mitigation measures are necessary.
1 Introduction
New Zealand is an oceanic nation whose Exclusive Economic Zone (EEZ) of 4.2 million km2 exceeds its land area 15-fold. New Zealand’s EEZ extends from subtropical to subantarctic waters and hosts a wealth of marine life, with over 17 000 described species and thousands of known yet undescribed species (Gordon et al., 2010; MacDiarmid et al., 2013). Whilst New Zealand is committed to the conservation of biodiversity, the challenges are substantial, with New Zealand species considered ‘At Risk’ or ‘Threatened’ making up 91% of marine birds, 76% of freshwater fish, and 85% of land reptiles, and around one third of New Zealand species still classified as ‘Data Deficient’ under the New Zealand Threat Classification System (Department of Conservation, 2020). Five of the seven species of sea turtles are known to occur in New Zealand waters. The leatherback turtle (Dermochelys coriacea) is most frequently reported, followed by green turtle (Chelonia mydas), hawksbill turtle (Eretmochelys imbricata), loggerhead turtle (Caretta caretta), and olive ridley turtle (Lepidochelys olivacea) (Gill, 1997; Godoy, 2016; Abraham et al., 2021; Dunn et al., 2022). Whilst hawksbill, loggerhead, and olive ridley turtles are likely vagrant visitors to New Zealand waters, a temperate foraging ground for juvenile green turtles is known for northern New Zealand (Godoy et al., 2016), and leatherback turtles are known to forage seasonally as far south as the west coast of the South Island (Godoy, 2016; Dunn et al., 2022).
Leatherback turtles encountered around New Zealand are most likely to be from the western Pacific subpopulation, originating from nesting beaches at the Solomon Islands, Papua Barat, Indonesia, and Papua New Guinea (Benson et al., 2011). This subpopulation is currently assessed as Critically Endangered by the IUCN Red List of Threatened Species (Tiwari et al., 2013). The Malaysian subpopulation, where historically at least 3000 nests per year were reported, is now considered functionally extinct (Dutton et al., 2007; Tapilatu et al., 2013). The Papua Barat nesting females were estimated to be declining at an average rate of 5.9% per year between 1984 and 2011 (Tapilatu et al., 2013), and at 6.1% between 2001 and 2017 (Martin et al., 2020). Leatherback turtle abundance at a foraging ground off California, an area used by the western Pacific population, was similarly estimated to be declining at 5.6% between 1990 and 2017 (Benson et al., 2020). The estimated number of annual nesting females at Papua Barat was 787 (95% CI: 659–939) in 2017 and represents about 75% of the western Pacific nesting leatherbacks (Martin et al., 2020). Therefore, these estimates are likely indicators of population trend, although underestimates of absolute abundance which, following Martin et al. (2020), might have been just over 1000 females nesting annually in 2017. Martin et al. (2020) predicted the extinction of western Pacific leatherback turtles to be about as likely as not by the end of the 21st Century.
Globally, commercial surface longline fisheries have been identified as the major source of sea turtle bycatch and mortality (Lewison et al., 2004; Wallace et al., 2010). In New Zealand, surface longline fisheries for tunas (Thunnus spp.) and swordfish (Xiphias gladius) have reported most sea turtle bycatch (Godoy, 2016; Abraham et al., 2021; Dunn et al., 2022). Although all sea turtles are protected in New Zealand under the New Zealand Wildlife Act 1953, and have a highly threatened status, New Zealand currently has no effective sea turtle bycatch mitigation or conservation measures in place. In 2009, New Zealand Ministry for Primary Industries (MPI, previously New Zealand Ministry of Fisheries) argued that sea turtle capture rates were minimal and thus no measures were necessary (WCPFC, 2009). However, the capture rates on which this argument was based were estimated from MPI observer data collected between 2000 and 2008 (Brouwer & Griggs, 2009), a period when fisher reporting of sea turtle interactions was not mandatory, and the form for fishers to report sea turtle captures had yet to be introduced (the “Non-Fish Protected Species form” was introduced in 2008; FishServe, 2023). Subsequent studies found MPI observer data accounted for <15% of the turtle captures and were inadequate for estimating turtle bycatch as the observed fishing trips were generally in the wrong times and places (Godoy, 2016; Dunn et al., 2022).
Here, we summarize capture records of leatherback turtles in New Zealand waters from MPI observer and fisher reported data. This includes a large increase in leatherback turtle captures by surface longline fisheries reported in 2021 (Dunn et al., 2022). We include an evaluation of whether this increase in captures was more likely to be caused by a change in (a) oceanographic conditions, potentially ocean warming, or (b) fisher behavior, in particular changes in the fishing pattern (location and/or season).
2 Methods
2.1 Study area
The New Zealand EEZ extends over roughly 25–57°S and 162°E–172°W. Turtle captures have been highest in the Bay of Plenty region which is situated on the northeast coast of the North Island (Figure 1). The inner shelf waters of the Bay of Plenty are nutrient rich (Bradford-Grieve et al., 2006; Leathwick et al., 2006) and tropical marine megafauna, including whale sharks (Rhincodon typus), mobula rays (Mobula birostis and Mobula japonica), and sea turtles, are regularly sighted in the region, particularly in the spring and summer months (Francis et al., 1999; Duffy, 2002; Duffy & Abbott, 2003). This region also supports a variety of customary, recreational, and commercial fisheries (Fisheries New Zealand, 2022).
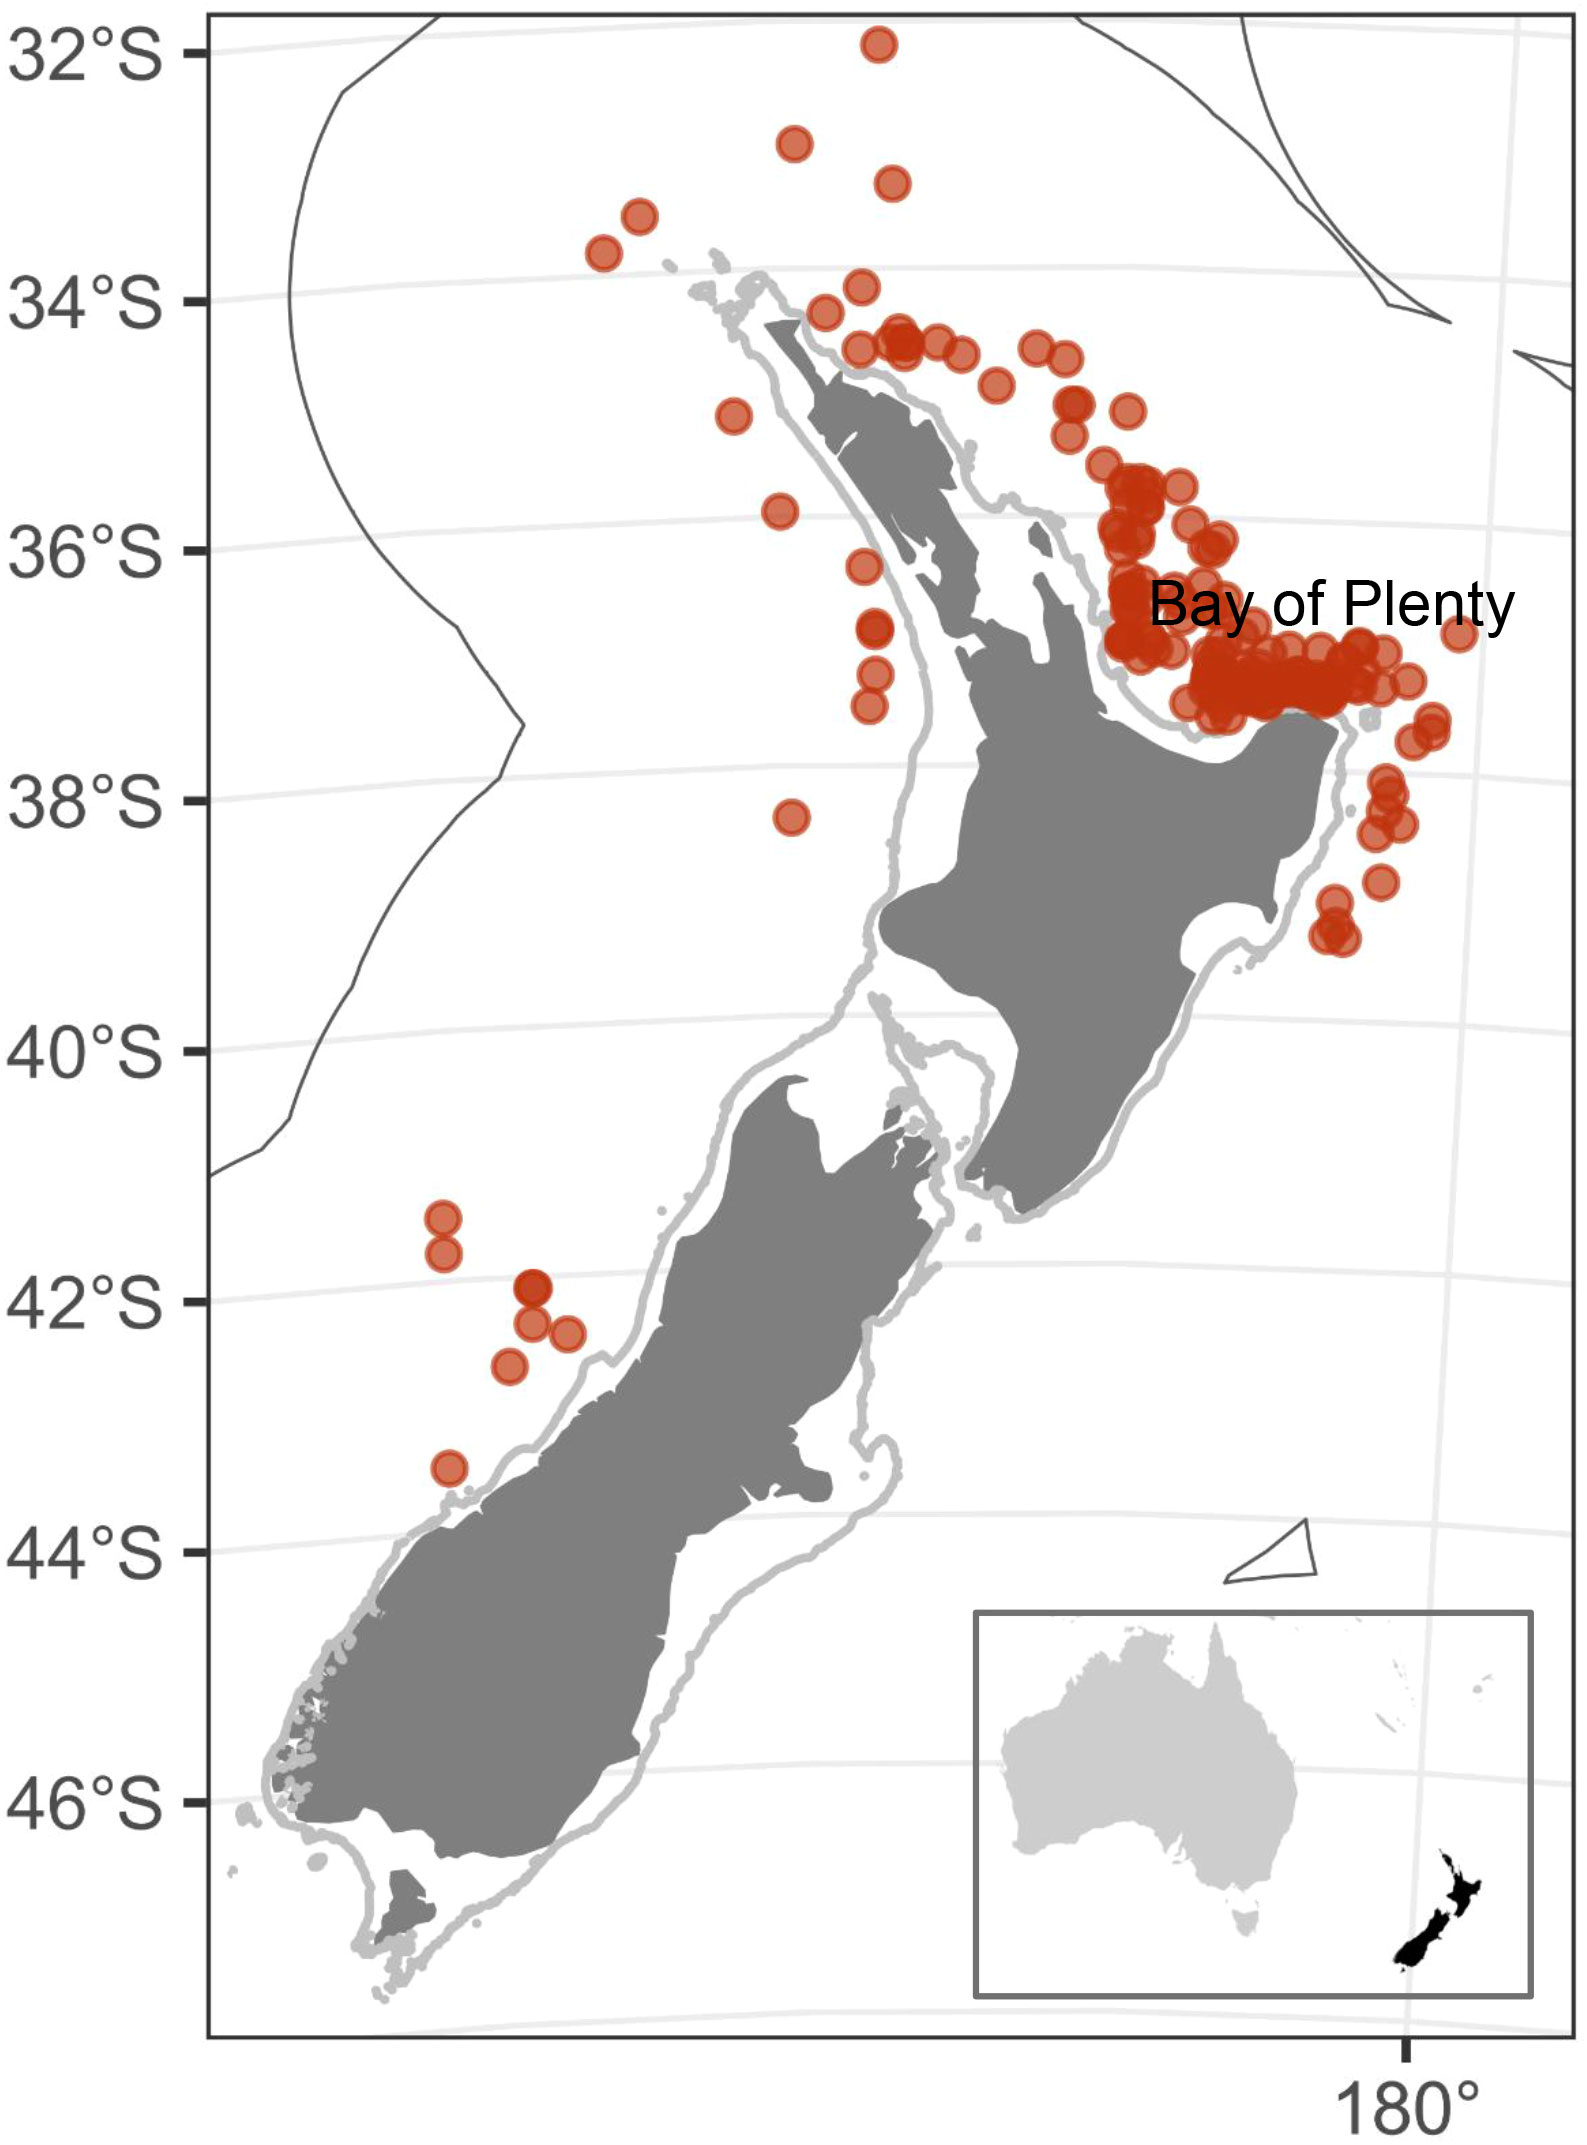
Figure 1 Distribution of fisher-reported and observer-reported leatherback turtle captures from 2007–08 to 2020–21 (red dots, n=217). Grey line indicates the 100 m isobath, and the black line is the New Zealand Exclusive Economic Zone (EEZ).
2.2 Species captures and fisheries data
Surface longline catch and effort data and sea turtle capture data (all species) were collated from mandatory commercial fisher reporting (‘fisher’-reported records), along with similar catch and effort and turtle capture records collected by MPI Observers aboard commercial vessels (‘observer’-reported records), between the fishing years 2007–08 and 2020–21 (New Zealand fishing years extend from October 1 to September 30). The New Zealand government requires all commercial operators to complete catch effort and landing records, which include (at least) details about the location, time and date of the trip, fishing method, and quantity of the catch. The vessels operating in the surface longline fishery report these details for every set. It is also mandatory to report all captures of protected species, including turtles.
The data sets included all fishing events, whether a turtle capture was reported or not. For leatherback turtle (hereafter referred to as leatherback) captures, the fisher and observer records were combined to provide a single data set. Any duplication between the data sets was removed. Where a capture was reported by both the fisher and observer, and those records were not the same (e.g., in turtle species identification), primacy was given to the observer data.
Summarized for all years and areas, surface longlines were generally set during the night (10 pm to 3 am) and hauled early evening (4 pm to midnight), with an average fishing duration of about 20 hours; most sets were made in water depths between about 200 m and 750 m; and the reported target species was predominantly southern bluefin tuna (Thunnus maccoyii; 50% of sets), followed by bigeye tuna (Thunnus obesus; 37%), swordfish (Xiphias gladius; 11%), and Pacific bluefin tuna (Thunnus orientalis; 1%). Data on bait type collected by observers were limited but ranged from 25–100% squid (average 56% squid), the remainder being fish. Vessel length varied between 10 and 57 m (average 30 m).
Patterns in leatherback reporting by vessels with and without observers aboard were evaluated for the main leatherback capture area and season: the east coast North Island north of 37°S, and January to April inclusive, between 2007–08 and 2020–21. There are no formal database links between New Zealand fishing industry and MPI observer data sets, therefore a fisher record was assumed to have an observer aboard if the vessel-year-month-day of the fisher record had a match in the observer database.
A subset of the combined data was selected to assess fishing variables that may influence leatherback captures. All fishing events sampled by observers, and additional fisher records for eight vessels that each reported at least one leatherback capture in every year fished were selected. These fisher vessels were considered vessels ‘inclined to report leatherback captures’, and substantially increased the data set for analysis.
2.3 Environmental variables
A set of environmental variables as potential predictors of leatherback occurrence in longline fishing events were collated at a 1 km2 grid resolution. The collated environmental variables are summarized in the Supplementary Information and included (briefly): sea-surface temperature (MODIS-Aqua monthly 4 km SST (“SST4”): Kilpatrick et al., 2015; Kilpatrick et al., 2019; NASA OBPG, 2020), OI-SST v2.1 (Huang et al., 2021), chlorophyll-a concentration (chl-a: Gall et al., 2022), eddy kinetic energy (EKE), satellite altimetry (Aviso), mixed-layer depth (Chassignet et al., 2007), and temperature at depth (Roemmich & Gilson, 2009). For SST and chl-a, climatological monthly data were calculated by averaging all January, February, etc., between 2001–02 and 2021–22, and “monthly anomalies” were calculated as the difference between the actual monthly values and these monthly climatologies (Gall et al., 2022). SST4 was generally preferred over OI-SST in the analyses because of its higher spatial resolution. Captures were removed from the analysis dataset where any of the remaining variables were missing, either because they were not available for that time and location, or the capture was missing data fields required to link to the environmental data. This included some captures from water too shallow to be included in the environmental data.
2.4 Predicting leatherback catches
Leatherback captures were modeled using a binomial (occurrence only) generalized additive model (GAM). Most captures were of one leatherback per longline set (single captures were 91% of 178 sets). Captures of other turtle species were not modeled as the data were too scarce. Some fishing variables (e.g., bait type) have been found to influence leatherback captures but could not be included here due to incomplete records (Dunn et al., 2022). We used the restricted maximum likelihood method (REML) for automated selection of smoothing parameters to select a ‘base’ model, using the mgcv library (Wood, 2017) in R (R Core Team, 2022). The gam.check function was used to assess model fit by visually evaluating residual plots and running diagnostic tests to ensure adequate basis dimensions for each smooth. We then checked for competing models that might describe the data equally well by manually adding and/or replacing correlated or related variables in the base model. We considered the model to show no improvement if REML improved by less than 1, additional deviance explained <0.5%, and the additional term had a p-value >0.05.
The predicted effect of each variable was plotted over the observed range with all other variables fixed at their median values. Because the focus on the analyses was to evaluate factors influencing capture and potentially explain a trend over time, the predicted trend by year was plotted against the observed catch rates and as the correlation between the two. Because the GAM did not include a year coefficient, any trend in predicted captures over time resulted from trends in model variables. The influence of each variable on the year trend was shown as the mean predicted value from that variable for each year divided by the overall mean predicted for that variable (Bentley et al., 2012).
The variable testing included four versions of SST, which were two monthly-mean observed temperatures (SST OI v2.1, and SST43-monthly), a climatological monthly-mean temperature (a mean area-month SST calculated over the 20-year period 2002–22), and the anomaly (difference) of monthly-mean observed SST from the climatological monthly-mean. If an SST variable explained the trend in leatherback captures and SST anomaly was selected, we concluded a trend in SST was the most likely explanation. If the climatological average was selected and explained the trend in leatherback captures, then the model would have no temporal trend in SST, and we concluded a change in time and location fished was more likely.
3 Results
Between 2007–08 and 2020–21, there were 217 reported captures of leatherback turtles, with an average of 15.5 per year, and unusually high captures occurring in 2020–21 (Table 1). The percentage of leatherback captures reported only by fishers was 89.2% for the 13 years to 2019–20, and 82.1% overall when including the unusually high captures from 2020–21.
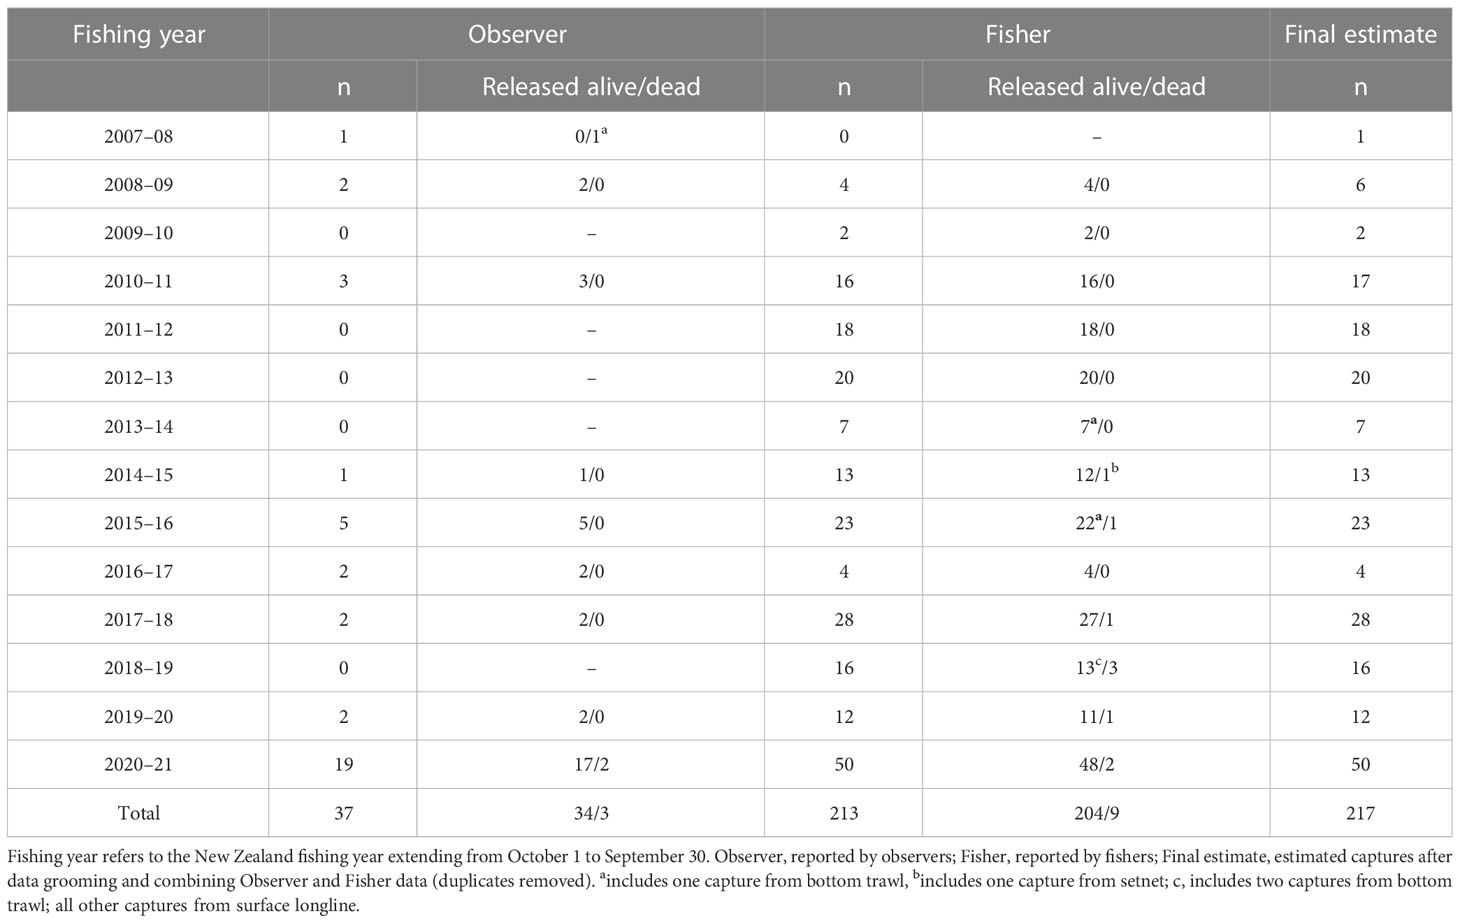
Table 1 Reported leatherback turtle captures by fishing year and source in New Zealand waters.
3.1 Summary of leatherback captures in New Zealand waters
Leatherbacks were most often reported off the northeast North Island (Figure 1). There were few captures from the west coast North Island, but there was also relatively little commercial surface longline fishing in that area (Figure 2). There were no reported fishery captures from the east coast South Island and Subantarctic waters, despite surface longline fishing effort taking place in these regions (e.g., Finucci et al., 2021). Off the northeast North Island, leatherback captures were widespread in some years (e.g., 2015–16, 2019–20), but spatially aggregated in other years, usually in the Bay of Plenty (e.g., 2017–18, 2020–21) (Figures 2, 3). Captures were largely made during the austral summer, between January and May. Nearly all (97.7%, n=212/217) leatherback captures occurred in the New Zealand surface longline fisheries targeting bigeye tuna (49.1%, n=104), swordfish (40.0%, n=85), southern bluefin tuna (9.0%, n=19) and Pacific bluefin tuna (1.9%, n=4). The remaining captures were by bottom trawl (n=4) and set net (n=1).
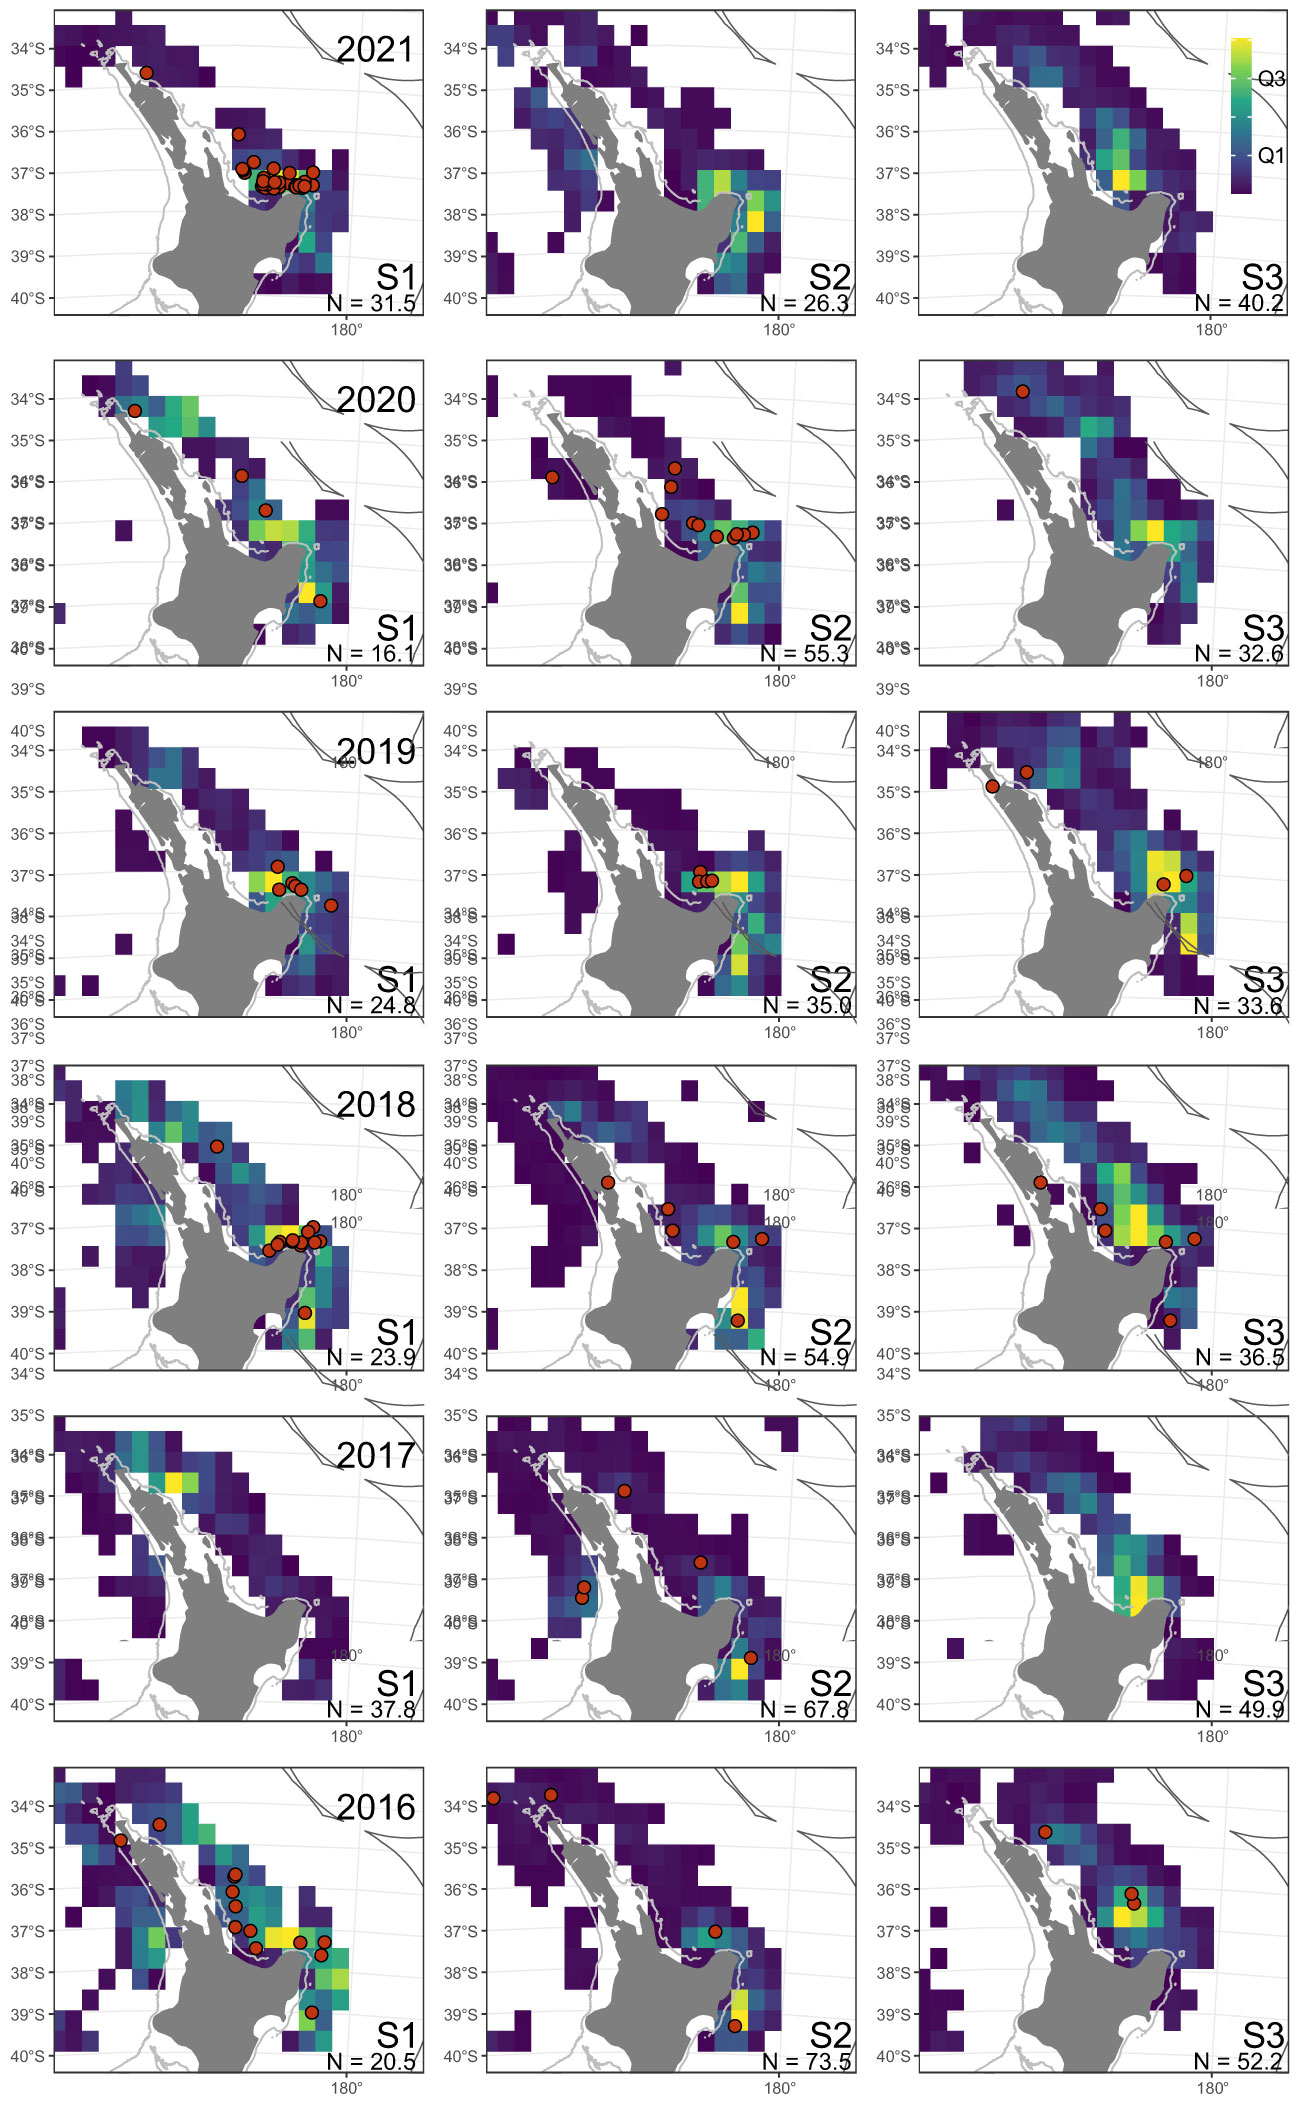
Figure 2 Distribution of fisher-reported leatherback turtle captures (red dots), with shaded spatial cells indicating the relative distribution of commercial surface longline fishing effort within each fishing year and season, for New Zealand waters above 40°S (S1=January-March, S2=April-June, S3=July-December). Spatial cells are shaded by quartile. N, total effort represented in each plot in thousands of hooks. Fishing year labeled as year-ending (i.e., 2021 indicates the 2020–21 fishing year).
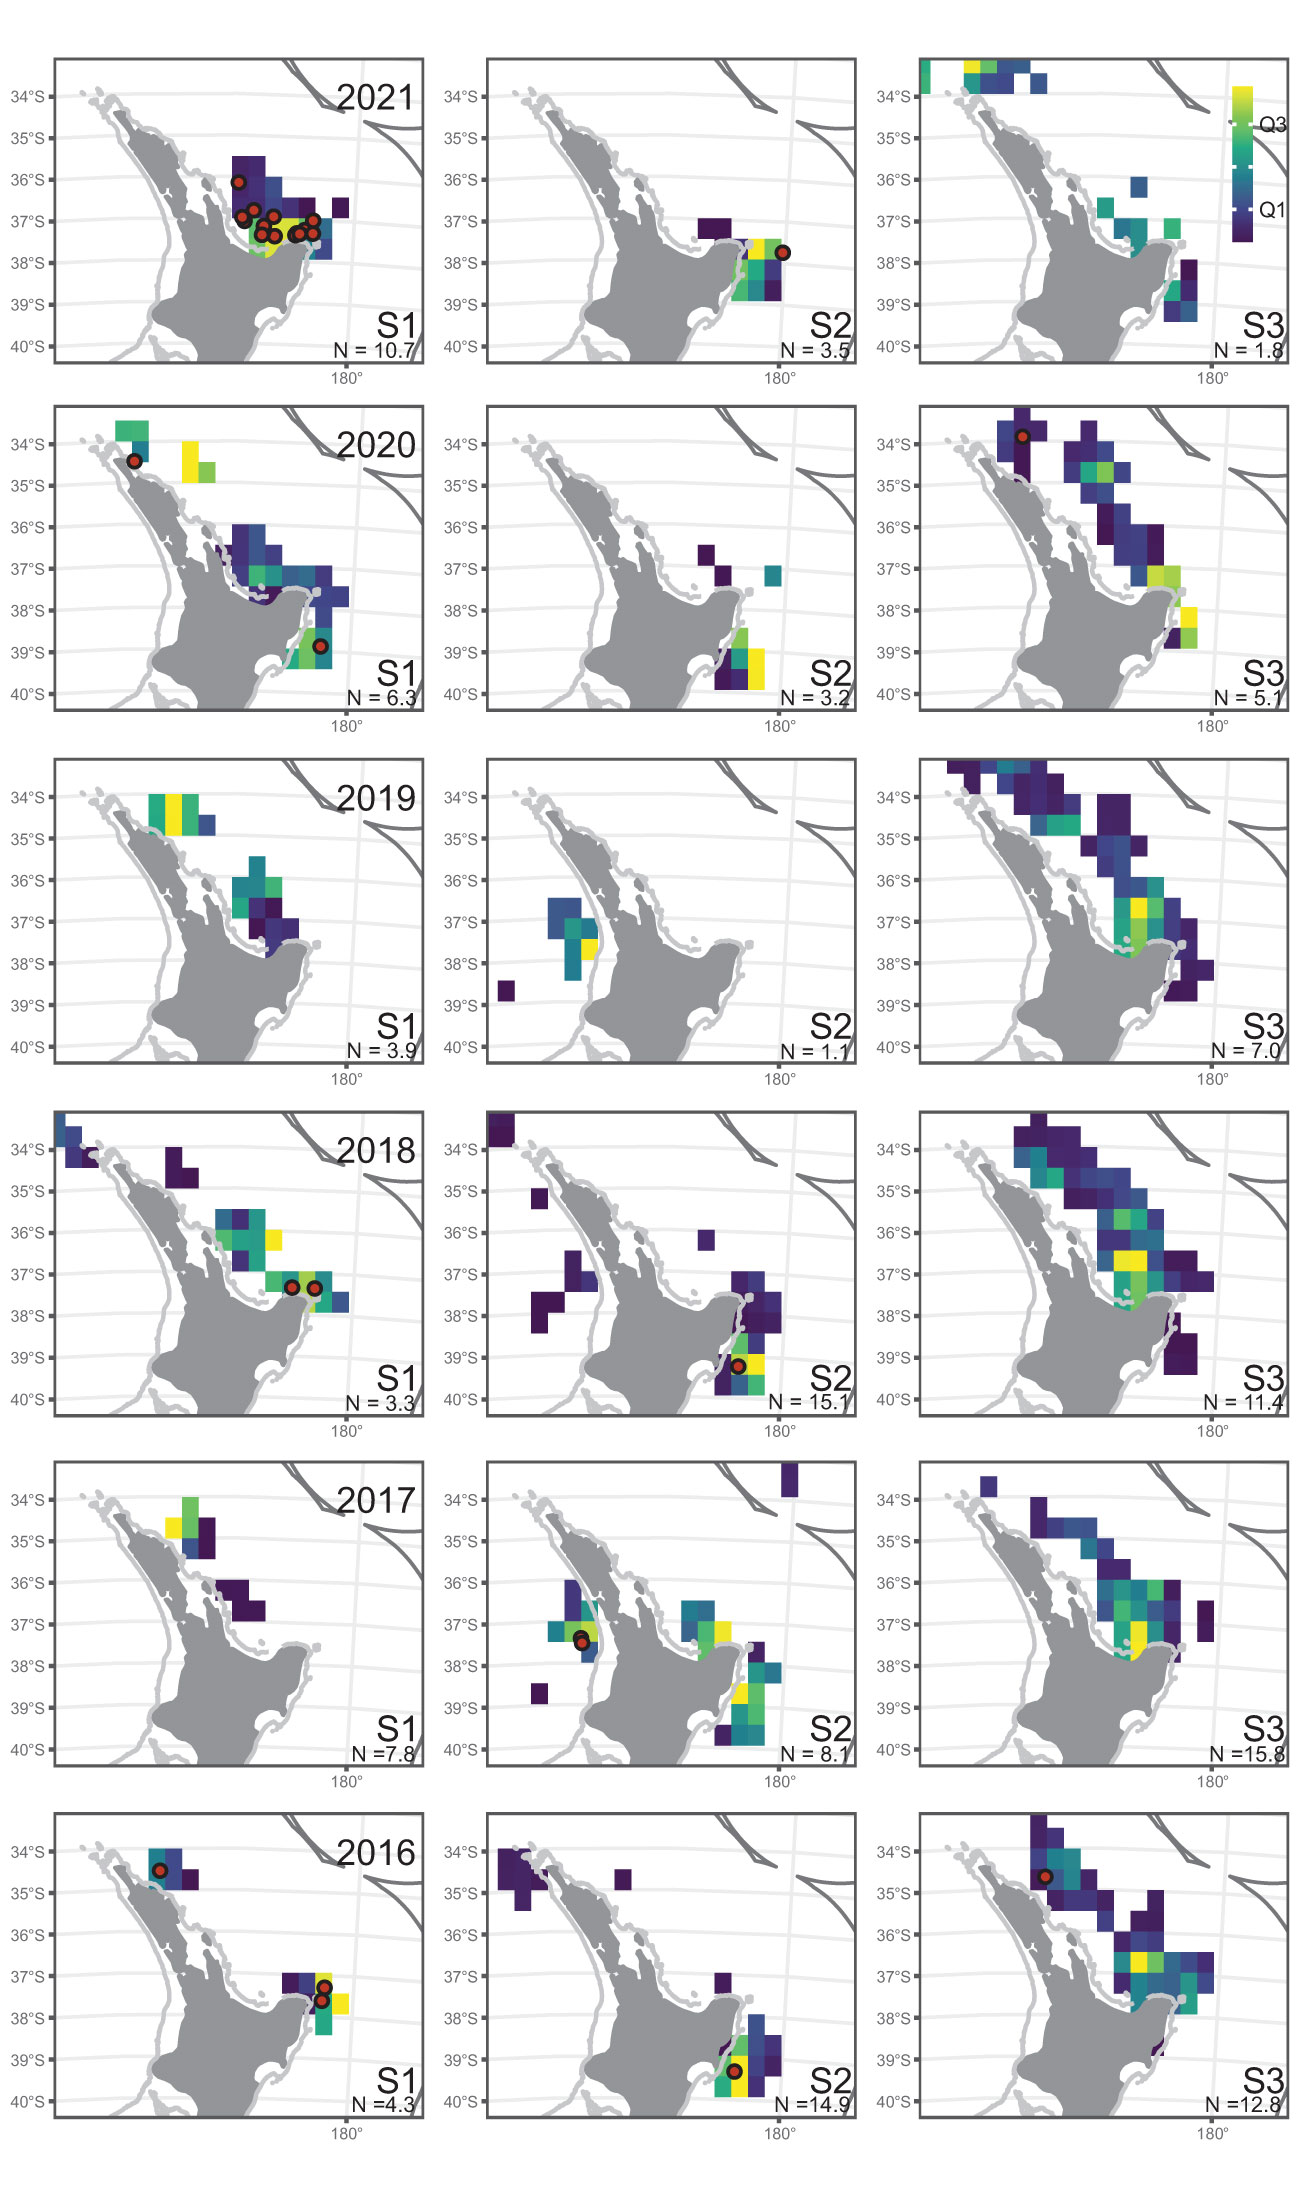
Figure 3 Distribution of observer-reported leatherback turtle captures (red dots), with shaded spatial cells indicating the relative distribution of observed surface longline fishing effort (above 40°S), within each fishing year and season (S1=January-March, S2=April-June, S3=July-December). Spatial cells are shaded by quartile. N, total effort represented in each plot in thousands of hooks. Fishing year labeled as year-ending (i.e., 2021 indicates the 2020–21 fishing year).
Commercial fishing effort was relatively high in the austral summer of 2017, when it was focused off the far northeast of the North Island, and in 2021, when it was focused in the Bay of Plenty (Figure 2; Supplemental Figure S1), whereas most years fished both these areas. Ministry observer coverage reflected the same pattern of fishing and sampled both the far northeast and Bay of Plenty in most years, but in 2017 most of the Bay of Plenty was not sampled, and in 2021 the far northeast was not sampled (Figure 3).
No data were available on size or sex of captured leatherbacks. Of the observer-reported captures from surface longline vessels, two leatherbacks were reported as dead (5.6%). Details of how the leatherback was captured was less often reported (n=16), but most were reported as hooked in the flipper or body (75.0% n=12), with others hooked in the mouth (12.5%, n=2) or tangled in the gear (12.5%, n=2). Where details of release were recorded (n=17), most (88.2%) leatherbacks still had the hook embedded. Many fisher-reported captures from surface longline vessels also described individual status, with most (74.5%, n=155) classified as released alive and uninjured, 21.6% (n=45) as alive and injured, and 3.8% (n=10) as dead. The capture reported from set net was dead, and 25.0% (n=1) of captures by bottom trawl were dead.
3.2 Reporting of leatherback captures
There were 53 vessels active in the fishery which reported the largest bycatch of leatherbacks, that is off the east coast North Island between January and April, using surface longline, almost entirely targeting bigeye tuna and swordfish. Of these vessels, nine (22.6%) made fisher reports of a leatherback capture, five of the nine reported 94.5% of the captures, and one vessel alone reported 40.4% of all leatherback captures. The latter single vessel accounted for only 9.2% of the fishing effort (by number of hooks) whereas the 44 vessels that never reported a leatherback accounted for 43.4% of the fishing effort.
Within this fishery, most of the reported leatherback captures (85.3% of 109) were made by vessels which did not have an observer aboard. Only 12 vessels (22.6%) conducted trips with an observer aboard, covering 5.0% of the total fishing events. This observer coverage was lower than the New Zealand average for surface longlines, which has been up to 16.5% but typically 6–7% annually (Griggs et al., 2021). Of the 4.04 M hooks observed, 16 captures of leatherbacks were reported by observers, giving a catch rate of 3.9 leatherbacks per M hooks. The five most active vessels in the fishery, which together accounted for half of the effort and included four of the five vessels that reported most leatherbacks, had a fisher-reported catch rate of 45 leatherbacks per M hooks, about 12 times higher than reported by observers.
This situation was different in summer 2020–21, when leatherback captures, and the commercial surface longline fishing effort and observer coverage (8.0% coverage), were focused in the Bay of Plenty (Figures 2, 3). The single vessel that reported 40.4% of leatherback captures over seven years (2012–13 to 2020–21), was only observed in the final two years (2019–20 and 2020–21), when it accounted for 33.0% and 47.3% of the observed events, respectively. In 2020–21, the proportion of observed effort was unusually high during summer (S1, January to March) in the Bay of Plenty (at 27.0% coverage), associated with the relatively high number of leatherback captures (Figure 3). In most earlier years, the observer coverage was highest in the Bay of Plenty during winter and spring (S3, July to December; 7–18.0% coverage), when there were few or no leatherback captures.
3.3 Factors affecting leatherback catch rates
The GAM analysis data set included 5098 surface longline fishing events between 2007–08 and 2020–21 (mean 364 year-1, range 244–450), and a total of 178 leatherbacks (82.0% of all leatherback captures). The GAM reproduced the general increasing trend in total reported captures and the peak in the 2020–21 fishing year (Figure 4). The base model had the variables SST4-climatology + latitude + log(chl-a) and explained 18.9% of the deviance. Manual testing identified EKE as an additional predictor, and a final model with predictors SST4-climatology + latitude + log(chl-a) + log(EKE) explained 19.4% of the deviance.
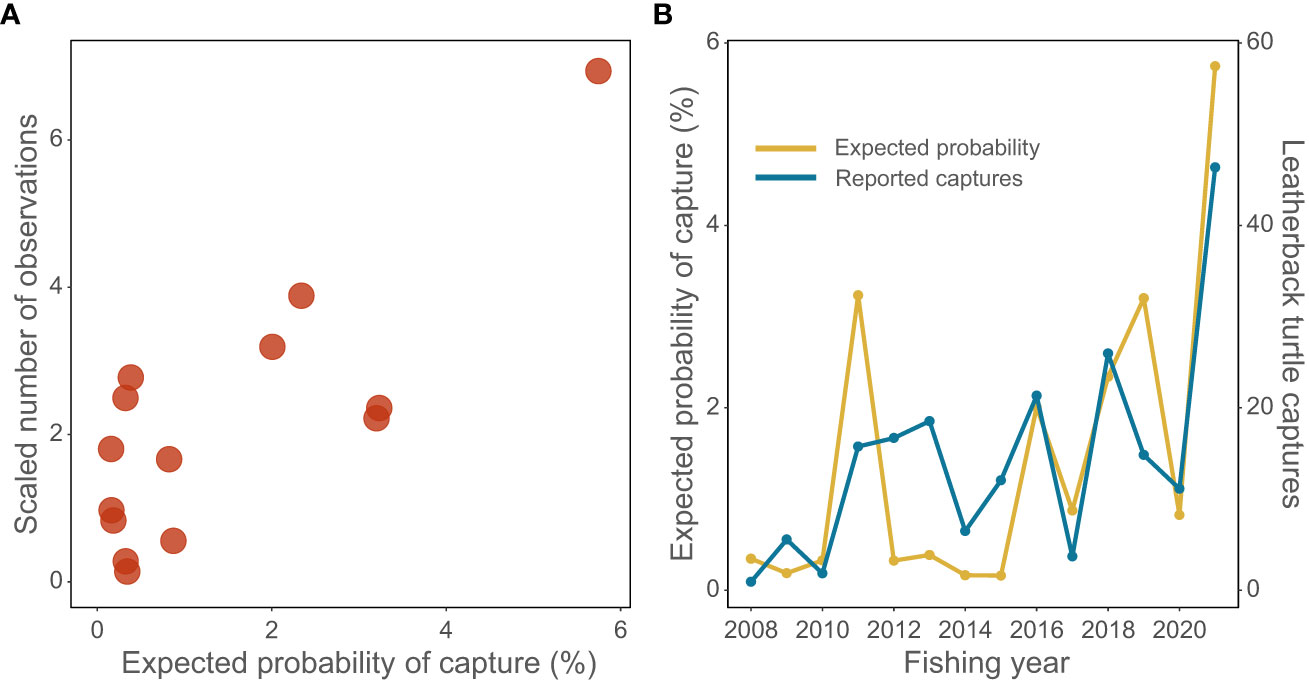
Figure 4 (A) Observed number of leatherback turtle reported captures versus the generalized additive model (GAM) predicted probability of leatherback turtle capture by fishing year; and (B) GAM expected median probability of capture (yellow line) and the observed reported number of captures (blue line) by fishing year (scaled to have the same mean). Fishing year labeled as year-ending (i.e., 2021 indicates the 2020–21 fishing year).
The SST4-climatology alone explained 16.5% of the deviance, which was slightly more than explained by either of the observed monthly SSTs (SST4-monthly = 16.2%; SST OI v2.1 = 16.4%). The SST4-anomaly was not selected in any model, and explained no more than 0.4% of the deviance when fitted alone or with other variables.
When number of hooks was added into the model, latitude and EKE were removed, and the deviance explained remained the same. Larger vessels were correlated with larger numbers of hooks (R2 = 0.95), had greater engine power, fished almost exclusively south of 40°S, at the end of summer, and had a lower leatherback capture rate. Number of hooks was correlated with vessels, and vessels were aliasing for times and places fished.
Captures were predicted to be increasingly likely once SST4-climatology was above about 18°C (Figure 5A), when chl-a levels were low (Figure 5D), when EKE was low (Figure 5G), and south of about 37°S (Figure 5J). SST4-climatology contributed most strongly to the increasing trend in captures (Figure 5B) being higher in 2010–11 and since 20017–18 (Figure 5C). Chl-a was relatively high in 2007–08 to 2009–10, but then less variable and contributed little to the year trend (Figures 5E, F). EKE was relatively low in 2007–08 to 2009–10, and then less variable (Figures 5H, I). There was no clear correlation between log(EKE) and log(chl-a) (R2 = 0.08). Latitude had relatively little influence on captures (Figure 5J), although reduced the peak predicted from SST in 2010–11 (Figure 5K), and the fishery was active over a relatively narrow latitude range in 2011, 2018, and 2022 (Figure 5L).
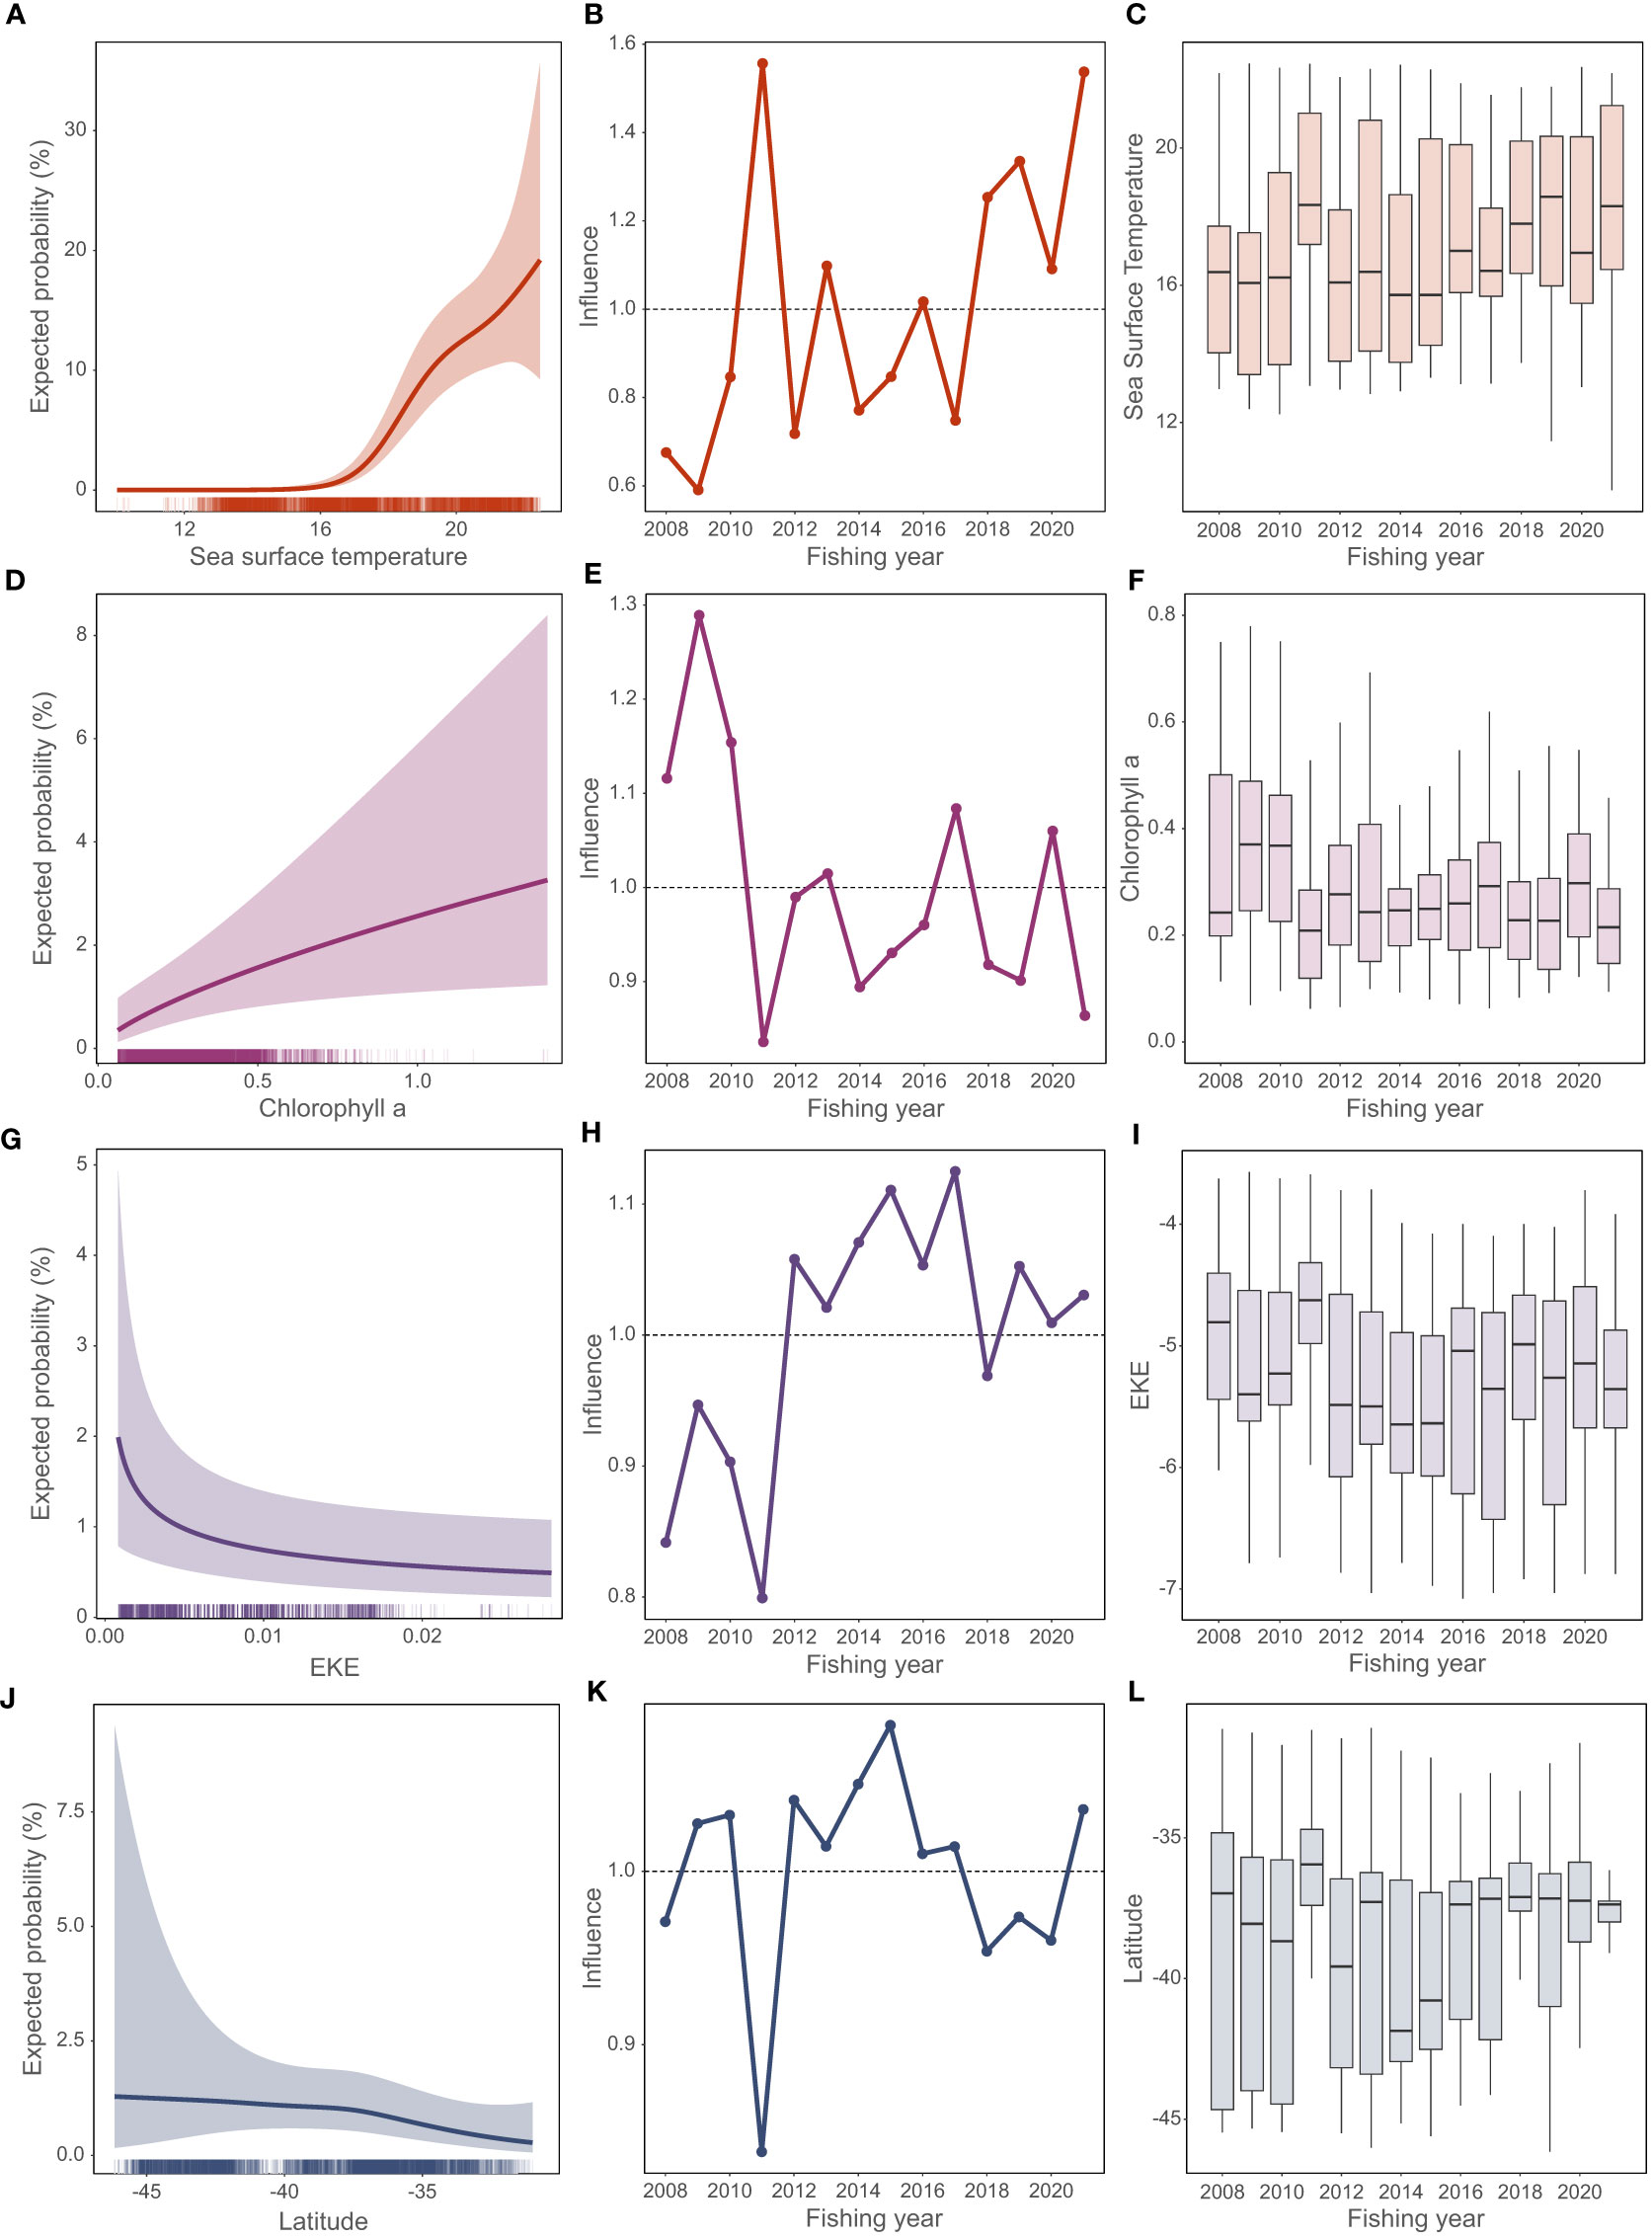
Figure 5 Leatherback turtle predicted probability of capture from the generalized additive model (GAM) predictors: (A, D, G, J) the predicted coefficient effect (with 95% confidence interval) estimated with other coefficients fixed at their median values; (B, E, H, K) the influence of each term on the estimate by fishing year; (C, F, I, L) the distribution of each variable by fishing year (box plot showing median as the solid bar, interquartile range as the box, with whiskers extending to the 5% and 95% intervals). Fishing year labeled as year-ending (i.e., 2021 indicates the 2020–21 fishing year).
At the start of the 2020–21 season (spring), a lower bound of SST associated with higher probability of capture (18°C) was at about 38°S and included coastal areas of the upper North Island and Bay of Plenty (Figure 6A). By the middle of summer 2021, SST was >18°C around all the North Island, as was also the case in years with low reported leatherback captures (e.g., 2017; Figure 6B). In some years with low reported captures the SST early in the season was lower; for example, in spring 2016–17 the SST was generally <18°C south of about 36°S and in most coastal areas (Figure 6C), but in summer 2016–17 the 18°C isotherm was again south of 40°S (Figure 6D).
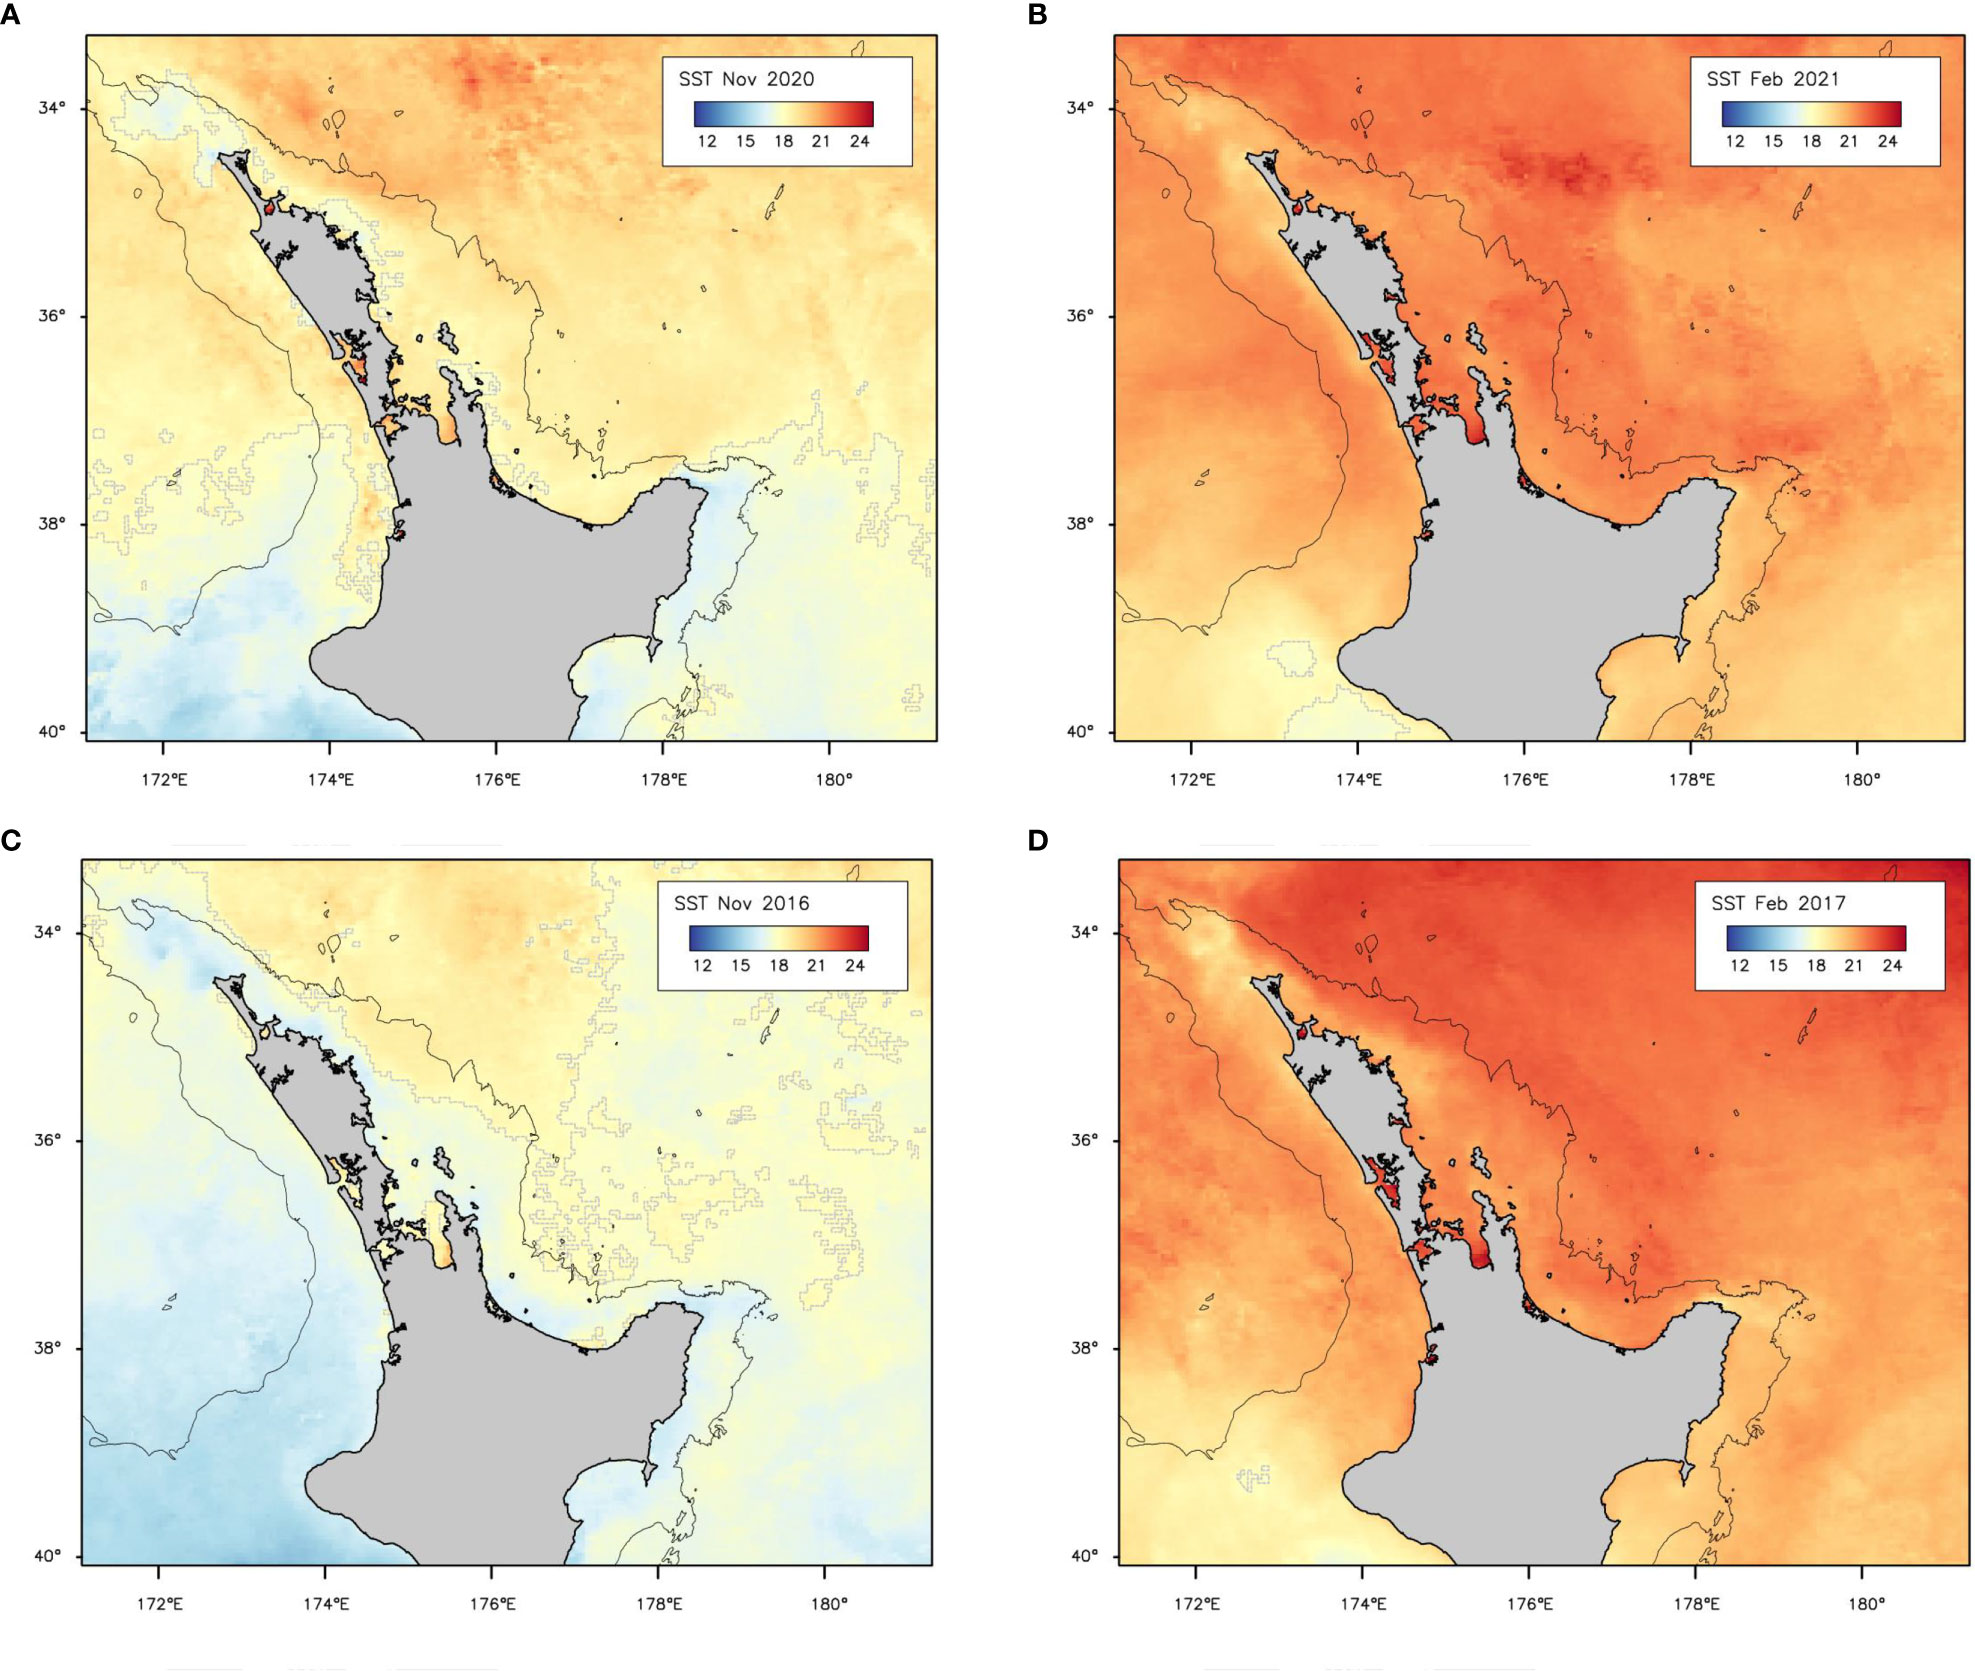
Figure 6 Monthly sea-surface temperature (SST) in the study area from MODIS-Aqua 4 km monthly dataset (SST4, see Methods for details) for (A) spring and (B) mid-summer 2020–21 (year of peak turtle captures), and for comparison, (C) spring and (D) mid-summer 2016–17 (relatively low captures). The 18°C isotherm is marked by a broken grey line. The black solid line is the 1000 m isobath.
Within the long-term “footprint” of the fishery (i.e., all locations ever fished over the period 2007–08 to 2021–22) fishing occurred in warmer areas in the summer and colder areas in the winter (Figure 7A). Leatherbacks were predominantly captured in the warmest waters fished in a given year (Figures 7A, B). Between 2007–08 and 2020–21, there was a slight upward trend in SST in both the area fished each year and the overall fishery footprint (Figure 7A). Surface warming in the actual locations fished between 2007–08 and 2021–22 was three times higher than the change in the footprint (2.4°C compared to 0.8°C). Repeating the analysis with climatological SST4 (Figure 7B) showed that about two-thirds of the warming in the fished area (1.5°C) was attributable to changes in the location and/or timing of fishing, with about one-third occurring because of warming of the whole area over time (Figure 7C). The SST anomaly calculated on the actual fishing locations per year and over the fishery footprint were very similar (Figure 7C), meaning the fleet position moved from year to year, but broadly experienced the same warming trend everywhere. SST4 and OI-SST v2.1 data were consistent in the study area (Figures 7C, D). The recent surface warming of the study region was part of a longer warming trend (Figure 7D) with an increase in SST of about 1.2°C since 1981 and with obvious effects of approximately decadal climate cycles (Sutton & Bowen, 2019).
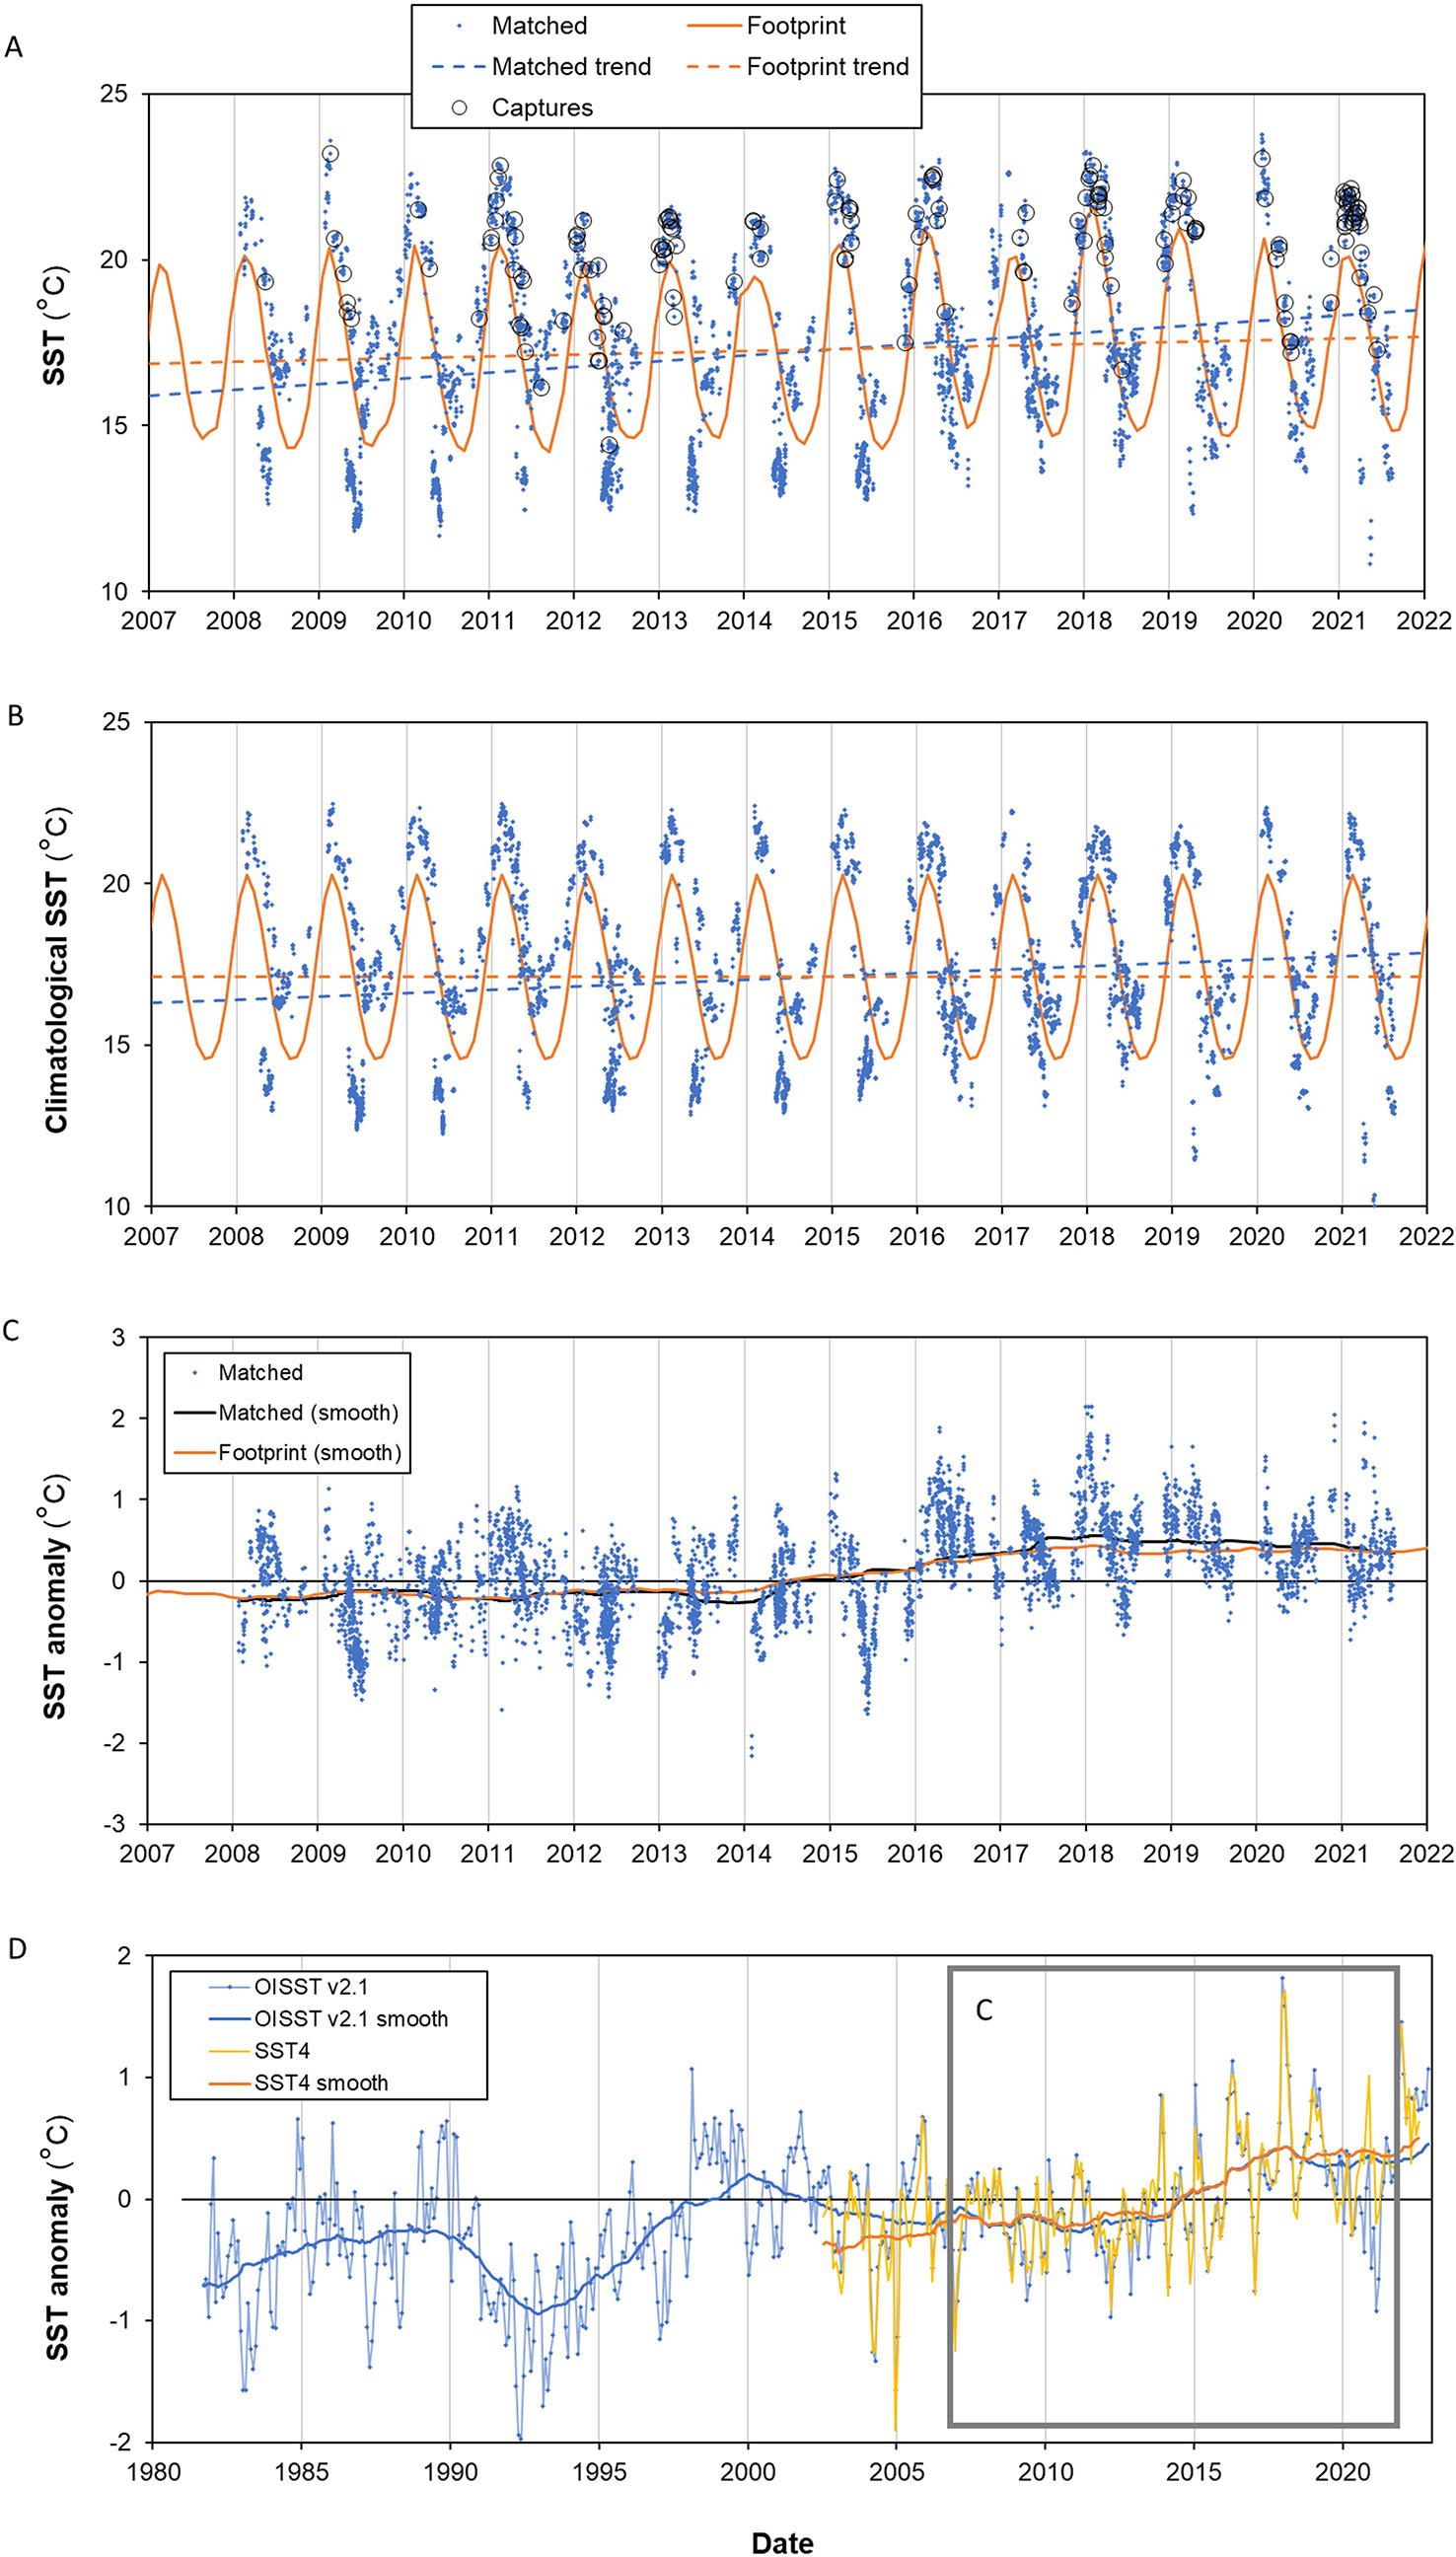
Figure 7 Sea-surface temperature (SST) in the study area. “Matched” means the SST at the same location and month as the fishing event. “Footprint” is the mean SST over all locations 2007–08 to 2021–22. (A) Actual SST4 (MODIS-Aqua 4 km monthly) where captures of leatherback turtles are shown as black circles. The dashed lines give the linear fitted trends in SST4 over the period 2008–2022; the warming is 2.4°C over the matched areas and 0.8°C over the footprint; (B) As (A) except for SST4 climatological months. The warming 2008–2022 based on the linear fit is 1.5°C for the matched SST4 and (of course) zero over the footprint; (C) Monthly-anomalies in SST4 for fishing locations. Lines are the 4-year smoothers; and (D) As (C) but for the fishing footprint using longer-term OI-SST v2.1 SST anomalies with the whole SST4 record for comparison. The total SST4 change over the footprint over the 20 year period (2002–2022) was 0.9°C.
4 Discussion
Western Pacific leatherbacks are Critically Endangered and require protection throughout their range (Pilcher, 2021). Benson et al. (2011) identified New Zealand as a seasonal foraging ground for western Pacific leatherbacks, but leatherback movements in New Zealand waters are poorly known, and New Zealand has not been identified as an area of high bycatch risk (WCPFC, 2009; Roe et al., 2014). The government department report by Godoy (2016) reiterated that New Zealand was an important foraging ground for leatherbacks, and one where bycatch rates were relatively high. We have confirmed leatherback bycatch is an ongoing and potentially increasing issue in the surface longline fisheries. At the time of writing, New Zealand has had no effective sea turtle bycatch mitigation or conservation measures in place.
4.1 Factors influencing New Zealand leatherback bycatch
The reported number of leatherbacks captured in New Zealand fisheries increased dramatically in 2021. The GAM predicted a similar increase in capture probability, and was influenced primarily by SST. Although leatherbacks can retain metabolic heat allowing them to visit cooler waters (Frair et al., 1972), the capture of leatherbacks off New Zealand primarily in summer would be consistent with a temperature influence, where winter was too cold for them, or their prey. We estimated the lower bound of SST for leatherback captures to be ~15°C, close to ~14°C estimated for satellite tagged leatherbacks in the southeast Pacific (Shillinger et al., 2011) and 15°C estimated for the northern Atlantic (McMahon & Hays, 2006), but higher than the 10–15°C estimated for the northern Pacific (Okuyama et al., 2021).
We found the probability of leatherback capture in New Zealand increased steadily with increasing SST from about 16° to 18°C, and then increased more slowly and with greater uncertainty to the limit of our observations at 22.8°C. This SST influence is broadly consistent with previous studies, where three tagged leatherbacks foraging in the Tasman Front region encountered a mean SST of about 19.4°C (Benson et al., 2011). In the eastern Pacific, leatherbacks were found to forage at a mean SST of 19.4°C (Shillinger et al., 2011), and occur over a broad temperature range that peaked at around 19°C and decreased above about 24°C (Degenford et al., 2021). We estimated leatherback capture was more likely in areas with relatively low EKE and low chlorophyll. Benson et al. (2011) also found leatherbacks associated with areas of low EKE, speculating these areas may be associated with zooplankton retention. The association of higher leatherback captures with low chlorophyll is also consistent with Benson et al. (2011) for the Tasman Front and New Zealand region, albeit the opposite of the chlorophyll effects they found for the East Australia Current Extension, California Current Ecosystem, and Indonesian seas.
In the GAM analysis, the most influential predictor of leatherback capture probability was climatological monthly-mean SST, and the GAM predicted a year trend in capture probability that broadly matched the observed trend in leatherback captures. The climatological monthly-mean SST (being a climatological average) was constant over the observed time period (2007–08 to 2021–22), therefore the hypothesis that fleet redistribution caused an increase in capture probability by moving into warmer waters was better supported than a hypothesis that the increase was caused by warming SST. This was also shown in the empirical analysis, where SST averaged across the New Zealand surface longline fishing footprint had increased by ~0.8°C since 2008, but changes in the timing and/or locations of fishing increased the encountered SST by 2.4°C. That an environmental trend may not be a primary influence is consistent with oceanographic studies showing that there has been some warming of oceans around the New Zealand coast over the last few decades, but little warming in the East Auckland Current off northeast New Zealand (Bowen et al., 2017; Sutton & Bowen, 2019). Whilst the East Australian Current, to which the East Auckland Current is related, has pushed further south and brought pronounced changes in marine conditions off Tasmania, there has not been any sign of a similar extension of the East Auckland Current system (Sutton & Bowen, 2019). The subtropical gyre has seen an increase in activity (Roemmich et al., 2016), but that spin-up has not seen a corresponding simple acceleration of the boundary currents, which would influence coastal New Zealand (Sloyan and O’Kane, 2015; Fernandez et al., 2018). The other environmental variables in the GAM had a relatively weak influence on the year trend, but it remains possible there were other important variables, not included in the model, that influence the number of leatherbacks captured. This includes whatever variables might have influenced the distribution of the fishery target species, tuna and swordfish, and brought those fish and the fishing fleet into areas where leatherbacks were more abundant. Further research is needed to understand the factors influencing the behavior and redistribution of the fishing fleet.
The GAM predicted probability of leatherback capture on the east coast North Island increased with distance south until about 38°S, and then remained relatively high. A latitude of 38°S is consistent with the Bay of Plenty, where there is a semi-permanent eddy (Roemmich & Sutton, 1998), which may retain leatherbacks and/or their prey and help explain the aggregation of leatherbacks in that region. However, no leatherback captures were reported further south than about 39°S on the east coast of the North Island, even though SST appeared suitable (Figure 6). Numerous leatherback strandings have occurred at the Chatham Islands (at about 44°S, 176°40’W; n=26; C. Duffy, unpublished data), and in-progress telemetry shows two of three leatherbacks in New Zealand waters have moved into the vigorous eddy region between the North Island and Chatham Islands (P. Waldie, unpublished data, 2 May 2023; Supplemental Figure S2). Therefore, the relatively productive subtropical frontal region occurring off the east coast at about 42–44°S (Murphy et al., 2001) seems likely to be a leatherback habitat, but did not feature in our data set because of relatively sparse surface longline fisheries, or non-reporting. Leatherbacks were also occasionally caught further south at about 42°S off the west coast South Island, which is the location of a seasonal surface longline fishery (Griggs et al., 2021). The absence of captures to the north of that fishery, on the west coast North Island, may also be because there is less surface longline effort operating in that region.
The perception of trends in leatherback captures is influenced by the quality of fisher reporting because observer coverage has been sparse, and generally in the wrong place and wrong time of year. An exception was 2021, when observers did cover the vessel and apparently locations where turtle captures were most frequent. We needed to include selected commercial fisher data to produce an acceptable data set for GAM analyses, and although this data set may also be potentially biased by fisher reporting, it included most (82%, n=178/217) of the reported leatherback captures, and reassuringly estimated environmental effects similar to previous studies. Reporting of protected species is mandatory for commercial fishers, and there is no penalty for their accidental capture during commercial fishing, however the incentive to report when at sea and distant from fishery observers may not be high. We consider it suspicious that within the main leatherback capture area and season, only five vessels (about 10%) reported 94.5% of the captures, and one vessel alone reported 40.4% of all captures. Whilst it is heartening that some vessels apparently reported turtle captures well, we conclude non-reporting is likely to have taken place, and turtle captures (all species) are likely to be underestimated. Underreporting of leatherbacks has also been suspected where similar fisher logbook systems are used in the Canadian Atlantic (Hurtubise et al., 2020). Extrapolating from observer data, Abraham et al. (2021) estimated captures to be more than twice the reported level, on average 49 sea turtles per year (range 23–127) between 2002–03 and 2017–18, scaled-up from on average just under two observed per year (range 0–6). Because observer coverage was poorly placed (season and area), the uncertainty in Abraham et al. (2021) estimates was very large. At the time of writing (January 2023), anecdotal information suggests there was little or no observer coverage of the surface longline fishery in austral summer 2022, with only one vessel self-reporting any leatherback captures after January 2022. If verified, this suggests the number of captures in 2021–22 will be particularly poorly known. There may be no way of reliably estimating New Zealand leatherback captures until independent and reliable observations of fishing events are increased, which would currently require a substantial allocation of observers.
4.2 Mitigation measures are needed in New Zealand
New Zealand currently has no mitigation measures to reduce sea turtle bycatch. The WCPFC (2009) has recommended a catch rate to which interactions should be reduced. However, this catch rate is a level to which captures might be practically minimized, so is of operational and economic relevance to fisheries, and does not consider the actual number of turtles caught (Brouwer & Bertram, 2009). The use of a catch rate limit is also weak because the appropriate measure of fishing effort, including what spatial and seasonal fishing should be included, is ill-defined. It is clearly preferable to target conservation of turtle populations through control of the absolute number of captures and mortalities as, for example, implemented with Total Allowable Catches for managed commercial fisheries, and implemented for turtles in Hawai’i (NOAA, 2020).
The reported number of leatherbacks captured in New Zealand waters in 2020–21 exceeded more than three-fold the annual limit at which Hawaiian longline fisheries are closed (n=16; NOAA, 2020). The reported captures in New Zealand are also likely to be underestimated because of low observer coverage, which for the domestic surface longline fleet has been up to 16.5% annually, but typically 6–7% (Griggs et al., 2021). Sea turtle bycatch mitigation measures implemented in Hawai’i successfully reduced sea turtle bycatch by about 90% (NOAA, 2020; Work et al., 2021). The measures include the annual limit on captures in the shallow-set pelagic longline fishery, a further limit on individual vessel captures, no fishing within a 50–75 nautical mile radius of the center of each island, mandatory use of circle hooks and mackerel-type bait, dehooking and resuscitation training, and 100% observer coverage. The Hawaiian experience demonstrates there are proven mitigation measures which could significantly contribute to the conservation of these species, whilst enabling a commercial fishing fleet to persist.
From our analyses, we concluded a primary cause of the relatively high New Zealand captures of leatherbacks in 2020–21 could be a change in fishing fleet distribution. This means capture mitigation could include moving the fleet out of leatherback ‘hotspot’ areas and times. Introduction of static areas closed to fishing based upon current minimal knowledge of New Zealand leatherback distribution could displace the fleet to areas where turtles may equally likely be caught, therefore dynamic closures, triggered by move-on rules, might be preferable. In addition, Hazen et al. (2018) found dynamic closures could achieve adequate protection of leatherbacks whilst being 2 to 10 times smaller than static closures. There have been several studies developing statistical models to provide advice to managers on the most effective areal closures for bycatch mitigation, whilst also allowing fishing to occur (Eguchi et al., 2017; Hazen et al. (2018); Degenford et al., 2021). These include near real-time tools such as the “South Pacific Turtle Watch (SPTW)” (Howell et al., 2015; Hoover et al., 2019). Predictive models of leatherback distribution therefore already exist and could be modified or developed to suit the New Zealand context, providing a useful tool to help fishers avoid turtle hotspots and/or triggering any move-on rule. Research would be required to ensure a predictive model for New Zealand had the necessary skill and credibility, and evaluate whether proposed closures might prove costly to the New Zealand fishing fleet to the extent that it confounded turtle bycatch management efforts. New Zealand turtle conservation efforts, including predictive modeling, would benefit greatly from fishery independent data, such as population-level distribution estimates from ariel surveys, movement estimates derived from satellite telemetry, and additional fishery effort and capture data collected in the right areas and times by observers.
Data availability statement
The data analyzed in this study is subject to the following licenses/restrictions: The raw turtle capture and fishery catch and effort data supporting the conclusions of this article can be obtained from New Zealand Ministry of Primary Industries and Department of Conservation. The environmental data will be made available by the authors, without undue reservation, to any qualified researcher. Assistance in requesting data from New Zealand Ministry of Primary Industries and Department of Conservation can be obtained frombWF0dC5kdW5uQG5pd2EuY28ubno=. Requests for the environmental data should be directed tobWF0dC5kdW5uQG5pd2EuY28ubno=.
Author contributions
CD and MD contributed to the conception and design of the study. BF, MD, MP, and PS organized the data, and performed the analyses. BF and MD wrote the first draft of the manuscript. All authors contributed to the article and approved the submitted version.
Funding
This project was funded by the Department of Conservation, Wellington, New Zealand (Conservation Services Programme project INT2021-03) with co-funding from NIWA Oceans SSIF Programme “Structure and function of marine ecosystems”.
Acknowledgments
Thank you to the following people for their advice and providing data for this work: Owen Anderson (NIWA), Celine Campana and Mikaylie Wilson (Auckland Zoo), Dan Godoy (Blue Planet Marine), Karen Middlemiss (DOC), and Fisheries New Zealand RDM. The altimeter products (AVISO) were produced by Ssalto/Duacs and distributed by Aviso+, with support from Cnes. Argo data were collected and made freely available by the International Argo Program and the national programs that contribute to it. The Argo Program is part of the Global Ocean Observing System. MODIS-Aqua data were used courtesy of NASA Goddard Space Flight Center. NOAA OI SST V2 High Resolution Dataset data were provided by the NOAA PSL, Boulder, Colorado, USA, from their website at https://psl.noaa.gov.
Conflict of interest
The authors declare that the research was conducted in the absence of any commercial or financial relationships that could be construed as a potential conflict of interest.
Publisher’s note
All claims expressed in this article are solely those of the authors and do not necessarily represent those of their affiliated organizations, or those of the publisher, the editors and the reviewers. Any product that may be evaluated in this article, or claim that may be made by its manufacturer, is not guaranteed or endorsed by the publisher.
Supplementary material
The Supplementary Material for this article can be found online at: https://www.frontiersin.org/articles/10.3389/fmars.2023.1170632/full#supplementary-material
References
Abraham E. R., Tremblay-Boyer L., Berkenbusch K. (2021). “Estimated captures of New Zealand fur seal, common dolphin, and turtles in New Zealand commercial fisheries, to 2017–18,” in New Zealand aquatic environment and biodiversity report no. 258 (Wellington: Fisheries New Zealand).
Benson S. R., Eguchi T., Foley D. G., Forney K. A., Bailey H., Hitipeuw C., et al. (2011). Large-Scale movements and high-use areas of Western Pacific leatherback turtles, Dermochelys coriacea. Ecosphere 2, 1–27. doi: 10.1890/ES11-00053.1
Benson S. R., Forney K. A., Moore J. E., LaCasella E. L., Harvey J. T., Carretta J. V. (2020). A long-term decline in the abundance of endangered leatherback turtles, Dermochelys coriacea, at a foraging ground in the California current ecosystem. Glob. Ecol. Conserv. 24, e01371. doi: 10.1016/j.gecco.2020.e01371
Bentley N., Kendrick T. H., Starr P. J., Breen P. A. (2012). Influence plots and metrics: tools for better understanding fisheries catch-per-unit-effort standardizations. ICES J. Mar. Sci. 69, 84–88. doi: 10.1093/icesjms/fsr174
Bowen M., Markham L., Sutton P., Zhang X., Wu Q., Shears N. (2017). Interannual variability of sea surface temperatures in the southwest pacific and the role of ocean dynamics. J. Clim. 30, 7481–7492. doi: 10.1175/JCLID-16-0852.1
Bradford-Grieve J., Probert K., Lewis K., Sutton P., Zeldis J., Orpin A. (2006). “New Zealand shelf region,” in The Sea, vol 14: the global coastal ocean: interdisciplinary regional studies and syntheses. Eds. Robinson A., Brink H. (Cambridge, MA: Harvard University Press).
Brouwer S., Bertram I. (2009). “Setting bycatch limits for sea turtle in the Western and Central Pacific Oceans shallow-set longline fisheries,” in Scientific committee fifth regular session, WCPFC-SC5-2009/EB WP-05 (Port Vila: Western and Central Pacific Fisheries Commission).
Brouwer S., Griggs L. (2009). “Description of New Zealand’s shallow-set longline fisheries,” in Scientific committee fifth regular session, WCPFC-SC5-2009/EB IP-01 rev1 (Port Vila: Western and Central Pacific Fisheries Commission).
Chassignet E. P., Hurlburt H. E., Smedstad O. M., Halliwell G. R., Hogan P. J., Wallcraft A. J., et al. (2007). The HYCOM (HYbrid coordinate ocean model) data assimilative system. J. Mar. Syst. 65, 60–83. doi: 10.1016/j.jmarsys.2005.09.016
Degenford J. H., Liang D., Bailey H., Hoover A. L., Zárate P., Azócar J., et al. (2021). Using fisheries observation data to develop a predictive species distribution model for endangered sea turtles. Conserv. Sci. Pract. 3, e349. doi: 10.1111/csp2.349
Department of Conservation (2020) Te Mana o te taiao – Aotearoa New Zealand biodiversity strategy summary. Available at: https://www.doc.govt.nz/nature/biodiversity/aotearoa-new-zealand-biodiversity-strategy/te-mana-o-te-taiao-summary/ (Accessed January 15, 2023).
Duffy C. A. J. (2002). Distribution, seasonality, lengths, and feeding behaviour of whale sharks (Rhincodon typus) observed in New Zealand waters. N. Z. J. Mar. Freshw. Res. 36, 565–570. doi: 10.1080/00288330.2002.9517112
Duffy C. A. J., Abbott D. (2003). Sightings of mobulid rays from northern New Zealand, with confirmation of the occurrence of Manta birostris in New Zealand waters n. Z. J. Mar. Freshw. Res. 37, 715–721. doi: 10.1080/00288330.2003.9517201
Dunn M. R., Finucci B., Pinkerton M. H., Sutton P. (2022). “Review of commercial fishing interactions with marine reptiles,” in NIWA client report 2022147WN(Wellington, New Zealand).
Dutton P. H., Hitipeuw C., Zein M., Benson S. R., Petro G., Pita J., et al. (2007). Status and genetic structure of nesting populations of leatherback turtles (Dermochelys coriacea) in the Western Pacific. Chelonian Conserv. Biol. 6, 47–53. doi: 10.2744/1071-8443(2007)6[47:SAGSON]2.0.CO;2
Eguchi T., Benson S. R., Foley D. G., Forney K. A. (2017). Predicting overlap between drift gillnet fishing and leatherback turtle habitat in the California current ecosystem. Fish. Oceanogr. 26, 17–33. doi: 10.1111/fog.12181
Fernandez D., Bowen M., Sutton P. (2018). Variability, coherence and forcing mechanisms in the New Zealand ocean boundary currents. Prog. Oceanogr. 165, 168–188. doi: 10.1016/j.pocean.2018.06.002
Finucci B., Griggs L., Sutton P., Fernandez F., Anderson O. (2021). “Characterisation and CPUE indices for swordfish (Xiphias gladius) from the New Zealand tuna longline fishery 1993 to 2019,” in New Zealand fisheries assessment report 2021/07 (Wellington: Fisheries New Zealand).
Fisheries New Zealand (2022). “Fisheries assessment plenary, May 2022: stock assessments and stock status,” in Compiled by the fisheries science team, Fisheries New Zealand (Wellington: New Zealand).
FishServe (2023) New catch effort form for non-fish and protected species catch. Available at: https://www.fishserve.co.nz/news/new_catch_effort_form_for_nonfish_and_protected_species_catch (Accessed May 1, 2023).
Frair W., Ackman R. G., Mrosovsky N. (1972). Body temperature of Dermochelys coriacea: warm turtle from cold water. Science 177, 791–793. doi: 10.1126/science.177.4051.791
Francis M. P., Worthington C. J., Saul P., Clements K. D. (1999). New and rare tropical and subtropical fishes from northern New Zealand. Waters. N. Z. J. Mar. Freshw. Res. 33, 571–586. doi: 10.1080/00288330.1999.9516901
Gall M. P., Pinkerton M. H., Steinmetz T., Wood S. (2022). Satellite remote sensing of coastal water quality in New Zealand. N. Z. J. Mar. Freshw. Res. 56, 585–616. doi: 10.1080/00288330.2022.2113410
Gill B. J. (1997). Records of turtles and sea snakes in New Zealand 1837–1996. N. Z. J. Mar. Freshw. Res. 31, 477–486. doi: 10.1080/00288330.1997.9516781
Godoy D. A. (2016). The ecology and conservation of green turtles (Chelonia mydas) in New Zealand. [Dissertation] (New Zealand: Massey University).
Godoy D. A., Smith A. N. H., Limpus C., Stockin K. A. (2016). The spatio-temporal distribution and population structure of green turtles (Chelonia mydas) in New Zealand. N. Z. J. Mar. Freshw. Res. 50, 549–565. doi: 10.1080/00288330.2016.1182034
Gordon D. P., Beaumont J., MacDiarmid A., Robertson D. A., Ahyong S. T. (2010). Marine biodiversity of Aotearoa New Zealand. PloS One 5, e10905. doi: 10.1371/journal.pone.0010905
Griggs L. H., Datta S., Finucci B., Baird S. J. (2021). “Fish bycatch in New Zealand tuna longline fisheries 2015–16 to 2017–18,” in New Zealand fisheries assessment report 2021/20 (Wellington: Fisheries New Zealand).
Hazen E. L., Scales K. L., Maxwell S. M., Briscoe D. K., Welch H., Bograd S. J., et al. (2018). A dynamic ocean management tool to reduce bycatch and support sustainable fisheries. Sci. Adv. 4, eaar3001. doi: 10.1126/sciadv.aar3001
Hoover A. L., Liang D., Alfaro-Shigueto J., Mangel J. C., Miller P. I., Morreale S. J., et al. (2019). Predicting residence time using a continuous-time discrete-space model of leatherback turtle satellite telemetry data. Ecosphere 10, e02644. doi: 10.1002/ecs2.2644
Howell E. A., Hoover A., Benson S. R., Bailey H., Polovina J. J., Seminoff J. A., et al. (2015). Enhancing the TurtleWatch product for leatherback sea turtles, a dynamic habitat model for ecosystem-based management. Fish. Oceanogr. 24, 57–68. doi: 10.1111/fog.12092
Huang B., Liu C., Freeman E., Graham G., Smith T., Zhang H. M. (2021). Improvements of the daily optimum interpolation sea surface temperature (DOISST) version 2.1. J. Climate 34, 2923–2939. doi: 10.1175/JCLI-D-20-0166.1
Hurtubise J. A., Bond E. P., Hall K. E., James M. C. (2020). Evaluating mandatory reporting of marine turtle bycatch in Atlantic Canadian fisheries. Mar. Policy 121, 104084. doi: 10.1016/j.marpol.2020.104084
Kilpatrick K. A., Podestá G., Walsh S., Williams E., Halliwell V., Szczodrak M., et al. (2015). A decade of sea surface temperature from MODIS. Rem. Sens. Environ. 165, 27–41. doi: 10.1016/j.rse.2015.04.023
Kilpatrick K. A., Podestá G., Williams E., Walsh S., Minnett P. J. (2019). Alternating decision trees for cloud masking in MODIS and VIIRS NASA Sea surface temperature products. J. Atmos. Ocean. Technol. 36, 387–407. doi: 10.1175/JTECH-D-18-0103.1
Leathwick J. R., Elith J., Francis M. P., Hastie T., Taylor P. (2006). Variation in demersal fish species richness in the oceans surrounding New Zealand: an analysis using boosted regression trees. Mar. Ecol. Prog. Ser. 321, 267–281. doi: 10.3354/meps321267
Lewison R., Freeman S. A., Crowder L. B. (2004). Quantifying the effects of fisheries on threatened species: the impact of pelagic longlines on loggerhead and leatherback sea turtles. Ecol 7, 221–231. doi: 10.1111/j.1461-0248.2004.00573.x
MacDiarmid A. B., Law C. S., Pinkerton M. H., Zeldis J. (2013). “New Zealand marine ecosystem services,” in Ecosystem services in New Zealand – conditions and trends. Ed. Dymond J. R. (Lincoln: Manaaki Whenua Press), 238–253.
Martin S. L., Siders Z., Eguchi T., Langseth B., Yau A., Baker J., et al. (2020). “Update to assessing the population-level impacts of north pacific loggerhead and Western Pacific leatherback turtle interactions: inclusion of the Hawaii-based deep-set and American Samoa based longline fisheries,” in NOAA Technical memorandum NOAA-TMNMFS-PIFSC-101 (Honolulu: National Oceanic and Atmospheric Administration).
McMahon C. R., Hays G. C. (2006). Thermal niche, large-scale movements and implications of climate change for a critically endangered marine vertebrate. Glob. Change Biol. 12, 1330–1338. doi: 10.1111/j.1365-2486.2006.01174.x
Murphy R. J., Pinkerton M. H., Richardson K. M., Bradford-Grieve J., Boyd P. W. (2001). Phytoplankton distributions around New Zealand derived from SeaWiFS remotely-sensed ocean colour data. N. Z. J. Mar. Freshw. Res. 35, 343–362. doi: 10.1080/00288330.2001.9517005
NASA OBPG (2020). doi: 10.5067/MODAM-MO4N9. MODIS Aqua Global Level 3 Mapped SST. Ver. 2019.0. PO.DAAC, CA, USA.
NOAA (2020) Compliance guide: Sea turtle limits in the Hawaii shallow-set longline fishery. Available at: https://www.fisheries.noaa.gov/action/final-rule-sea-turtle-limits-hawaii-shallow-set-longline-fishery (Accessed July 4, 2022).
Okuyama J., Benson S. R., Dutton P. H., Seminoff J. A. (2021). Changes in dive patterns of leatherback turtles with sea surface temperature and potential foraging habitats. Ecosphere 12, e03365. doi: 10.1002/ecs2.3365
Pilcher N. J. (2021). Review of the status of sea turtles in the pacific ocean 2021 (Apia, Samoa: Secretariat of the Pacific Regional Environment Programme).
R Core Team (2022). R: a language and environment for statistical computing (Vienna: R Foundation for Statistical Computing).
Roe J. H., Morreale S. J., Paladino F. V., Shillinger G. L., Benson S. R., Eckert S. A., et al. (2014). Predicting bycatch hotspots for endangered leatherback turtles on longlines in the Pacific Ocean. Proc. R. Soc B 281, 20132559. doi: 10.1098/rspb.2013.2559
Roemmich D., Gilson J. (2009). The 2004–2008 mean and annual cycle of temperature, salinity, and steric height in the global ocean from the Argo program. Prog. Oceanogr. 82, 81–100. doi: 10.1016/j.pocean.2009.03.004
Roemmich D., Gilson J., Sutton P., Zilberman N. (2016). Multidecadal change of the South Pacific gyre circulation. J. Phys. Oceanogr. 46, 1871–1883. doi: 10.1175/JPO-D-15-0237.1
Roemmich D., Sutton P. (1998). The mean and variability of ocean circulation past northern New Zealand: determining the representativeness of hydrographic climatologies. J. Geophys. Res. 103, 13041–13054. doi: 10.1029/98JC00583
Shillinger G. L., Swithenbank A. M., Bailey H., Bograd S. J., Castelton M. R., Wallace B. P., et al. (2011). Vertical and horizontal habitat preferences of post-nesting leatherback turtles in the South Pacific Ocean. Mar. Ecol. Prog. Ser. 422, 275–289. doi: 10.3354/meps08884
Sloyan B. M., O’Kane T. J. (2015). Drivers of decadal variability in the Tasman Sea. J. Geophys. Res. 120, 3193–3210. doi: 10.1002/2014JC010550
Sutton P. J. H., Bowen M. (2019). Ocean temperature change around New Zealand over the last 36 years. N. Z. J. Mar. Freshw. Res. 53, 305–326. doi: 10.1080/00288330.2018.1562945
Tapilatu R. F., Dutton P. H., Tiwari M., Wibbels T., Ferninandus H. V., Iwanggin W. G., et al. (2013). Long-term decline of the Western Pacific leatherback, Dermochelys coriacea: a globally important sea turtle population. Ecosphere 4, 1–15. doi: 10.1890/ES12-00348.1
Tiwari M., Wallace B. P., Girondot M. (2013) Dermochelys coriacea (West pacific ocean subpopulation). the IUCN Red List of Threatened Species 2013: e.T46967817A46967821. Available at: https://dx.doi.org/10.2305/IUCN.UK.2013-2.RLTS.T46967817A46967821.en (Accessed January 15, 2023).
Wallace B. P., Lewison R. L., McDonald S. L., McDonald R. K., Kot C. Y., Kelez S., et al. (2010). Global patterns of marine turtle bycatch. Conserv. Lett. 3, 131–142. doi: 10.1111/j.1755-263X.2010.00105.x
WCPFC (2009). “Summary report,” in Scientific committee fifth regular session (Port Vila: Western and Central Pacific Fisheries Commission). Available at: https://www.spc.int/DigitalLibrary/Doc/FAME/Meetings/WCPFC/SC5/SC5_MeetingReportPreliminary_rev20.html.
Wood S. (2017). Generalized additive models: an introduction with r (2nd edition) (Boca Raton: Chapman and Hall/CRC).
Keywords: protected species, threatened species, marine reptiles, fisheries bycatch, sea surface temperature, climate change
Citation: Dunn MR, Finucci B, Pinkerton MH, Sutton P and Duffy CAJ (2023) Increased captures of the critically endangered leatherback turtle (Dermochelys coriacea) around New Zealand: the contribution of warming seas and fisher behavior. Front. Mar. Sci. 10:1170632. doi: 10.3389/fmars.2023.1170632
Received: 21 February 2023; Accepted: 18 May 2023;
Published: 07 June 2023.
Edited by:
Lorenzo Mari, Polytechnic University of Milan, ItalyReviewed by:
Scott Robert Benson, National Oceanic and Atmospheric Administration (NOAA), United StatesScott A. Eckert, Principia College, United States
Copyright © 2023 Dunn, Finucci, Pinkerton, Sutton and Duffy. This is an open-access article distributed under the terms of the Creative Commons Attribution License (CC BY). The use, distribution or reproduction in other forums is permitted, provided the original author(s) and the copyright owner(s) are credited and that the original publication in this journal is cited, in accordance with accepted academic practice. No use, distribution or reproduction is permitted which does not comply with these terms.
*Correspondence: Matthew R. Dunn, bWF0dC5kdW5uQG5pd2EuY28ubno=