 Jonathan P. A. Gardner
 Jamila Patterson
 Edward J. K. Patterson
- 1School of Biological Sciences, Victoria University of Wellington, Wellington, New Zealand
- 2Suganthi Devadason Marine Research Institute, Tuticorin, Tamil Nadu, India
The Asian green mussel (AGM), Perna viridis, is a mussel of ecological and economic importance throughout much of the tropical and subtropical regions of Asia, from China and Korea in the east to Oman on the Arabian Peninsula in the west. We collated published DNA sequence data and then analysed 467 bp of cytochrome c oxidase I gene (COI) sequence variation from 649 mussels (576 from SE Asia and 73 from India) to test for regional differentiation. Analysis of molecular variation, a haplotype network and a neighbour-joining tree all revealed significant differentiation between mussels from India and those from SE Asia. We observed a greater number of segregating sites (haplotypes) and private haplotypes than expected for Indian mussels compared to SE Asian mussels, based on the respective sample sizes. Tests of neutrality revealed population expansion or a recent selective sweep for only the mussels from India. We suggest that the differentiation of the Indian from the SE Asian mussels is explained by the pronounced seasonal input of freshwater into the northern Bay of Bengal area, which acts as a (semi-permeable) barrier to gene flow between the two regions (i.e., east versus west of the Bay). This suggestion is based on the oceanography of the region and is consistent with the biogeography and reports of genetic breaks in a range of taxa in this region. Further targetted sampling of AGMs from the east coast of India, Bangladesh and Myanmar is required to test this hypothesis, and additional sampling of AGMs from west of India (e.g., Pakistan, Iran, the Arabian Peninsula) will also be informative. Finally, this study is based on the analysis of a single marker (COI) because this is all that is presently available from published sources but we note that the application of new molecular markers such as single nucleotide polymorphisms to newly collected mussel samples will greatly advance our understanding of the AGM genetic discontinuity and its age, and help test its geographical location and its nature (e.g., a steep/shallow cline or a stepped cline).
Introduction
The study of the distribution of organisms or species and the factors that control their distributions has benefitted dramatically from the development and application of molecular genetic methods to infer native areas and times of diversification between species or lineages within species (e.g., Creer et al., 2016; Porter and Hajibabaei, 2018). Earlier studies focussed on explaining large-scale patterns of distributions based on presence-absence and/or abundance data, typically in the absence of molecular data (e.g., Ekman, 1953; Darlington, 1957; Briggs, 1974; Longhurst, 2007). Advances in molecular biology (e.g., Mantooth and Riddle, 2011) and the development of phylogeography (Avise, 2000) have encouraged the study of fine-scaled patterns of distribution, both in terms of accounting for rare and/or cryptic species (Jörger and Schrödl, 2013; Fišer et al., 2018; Struck et al., 2018) and for describing within-species genetic diversity such as the presence of differentiated lineages (e.g., Apte and Gardner, 2002; Gardner et al., 2010; Boehm et al., 2013; Bowen et al., 2016).
For marine coastal species, some sort of barrier to gene flow may exist between contemporary sites (populations) either side of a major feature and result in differentiated lineages that reflect the biogeographic history of the species (Barber et al., 2000; Apte and Gardner, 2002; Periasamy et al., 2017). It is therefore not unusual for genetic diversity (e.g., allelic richness, genotypic frequencies) within a species to align with biogeographic boundaries, providing intraspecific concordance between biogeography and phylogeography (Bowen et al., 2016). In a number of notable cases major rivers have been shown to act as barriers to the movement of some marine species because their larvae and/or adults cannot survive the major salinity perturbation caused by the river as it flows into the coastal marine zone; that is, the river outfall acts as a barrier to gene flow and/or may mark a biogeographic boundary (Dong et al., 2012; Wang et al., 2015; Moura et al., 2016; Chang et al., 2017; Davis et al., 2018). Understanding how patterns of regional genetic differentiation within a broadly distributed species arose and are maintained is still, however, a major challenge (Avise, 2000; Apte and Gardner, 2002; Gardner et al., 2010).
The Asian green mussel (AGM), Perna viridis Linnaeus 1758, is a subtropical and tropical mussel of the family Mytilidae (Bivalvia, Mollusca). It is widely distributed throughout the Indo-Pacific region, from approximately Oman (Persian Gulf) in the west to eastern China and western Korea in the east. This region of native distribution includes much of Malaysia, Thailand, Viet Nam, the Philippines, Taiwan, Hong Kong, Singapore, western Indonesia as well as India, Sri Lanka, Pakistan, Iran and Oman (Siddall, 1980; Wood et al., 2007; Gilg et al., 2013; Gardner et al., 2016; Dias et al., 2017). The AGM occurs most often in intertidal and/or shallow subtidal rocky reef environments, usually in waters of higher and more constant salinity regimes (Segnini et al., 1998; Rajagopal et al., 2006). P. viridis is both an ecosystem engineer (e.g., Crooks, 2002; Borthagaray and Carranza, 2007; Sousa et al., 2009) and an important aquaculture and wild-caught fisheries species (Vakily, 1989; Ong et al., 2009; Prakoon et al., 2010; Awan et al., 2012; Divya et al., 2012; Laxmilatha, 2013; Divya et al., 2020; Rejeki et al., 2020) and is an important source of protein and revenue for peoples in many coastal locations throughout SE Asia (FAO, 2019). In addition, the AGM is now a widely distributed invasive species (CABI, 2021), being found in many warm-water locations, including Brazil, Cuba, eastern Indonesia, Jamaica, Japan, South Africa, Trinidad and Tobago, southeast USA, Venezuela, and several island locations in the South Pacific Ocean (e.g., Siddall, 1980; Hanyu and Sekiguchi, 2000; Baker et al., 2007; Gilg et al., 2013; Castillo et al., 2014; Huhn et al., 2015; Micklem et al., 2016; Dias et al., 2017; de Messano et al., 2019; Arrieche et al., 2020).
Determining patterns of genetic diversity within a species is important for phylogeographic understanding (Avise, 2000; Bowen et al., 2016) and as a basic component of biodiversity protection (e.g., CBD, 1992; CBD, 2020). For the AGM several regional-scale studies have used different genetic markers to report what are generally low levels of spatial genetic differentiation amongst native populations from locations including southern China and the South China Sea, peninsular Malaysia, Sabah Malaysia, the Gulf of Thailand, Singapore and southern India (Ong et al., 2009; Prakoon et al., 2010; Divya et al., 2012; Lin et al., 2012; Ye et al., 2015; Ye et al., 2016; Lau et al., 2018; Divya et al., 2020). Overall, these findings indicate that gene flow is moderately high within a region and that genetic divergence is therefore low: such findings are consistent with a mussel species that has very large population sizes, which produces millions of larvae per mass spawning event, and for which the pelagic larval duration is 21-35 days (Laxmilatha et al., 2011). These life-history and demographic characteristics tend to facilitate wide-spread genetic connectivity (larval exchange), which in turn tends to minimise genetic differences amongst populations (e.g., Weersing and Toonen, 2009; Gardner et al., 2010; Faurby and Barber, 2012).
Whilst much is known about regional-scale population genetic variation of the AGM very little is known at the continental scale across its full distributional range. The reasons for the absence of information are likely to be: (1) the logistic and legal (e.g., permitting) difficulties of obtaining mussel samples from multiple locations/countries across such a large natural distribution (approx. 10,000 km of longitude and many different countries) and (2) the research focus on the AGM as a bioinvader outside the region as opposed to a focus on its intrinsic genetic diversity inside the region of its natural distribution. Whilst not specifically addressing the question of continental-scale within-species genetic diversity, earlier studies using different markers and approaches have noted a pronounced genetic split between native Indian mussels and native mussels from SE Asia (Gilg et al., 2013; Gardner et al., 2016; Dias et al., 2017; Ye et al., 2021). The reason for this apparent genetic discontinuity between mussels from the Indian subcontinent and those from SE Asia, and its specific location, have not previously been investigated and requires examination. However, it is immediately noticeable that the Bay of Bengal separates the Indian and the SE Asian mussels.
The Bay of Bengal (BoB) is one of the world’s 64 large marine ecosystems and is the largest bay in the world, with an area of 2,172,000 km2 (Brewer et al., 2015). The BoB is bordered by India and Sri Lanka to the west, Bangladesh to the north, and Myanmar to the east, whilst the Andaman and Nicobar Islands along the eastern boundary separate the Bay from the adjacent Andaman Sea. A large number of major rivers (including the Irrawaddy, Ganges, Brahmaputra, Meghna, Mahanadi, Godavari, Krishna and Salween) flow from the Himalayan Mountains through the region of Bengal and into the bay (NOAA n/d; Behara and Vinayachandran, 2016). During the monsoon season >200 km3 of water drains into the BoB; annually the Ganges-Brahmaputra-Meghna system contributes 1032 km3 of freshwater input, and ~2.5 billion tonnes of sediment enter the bay each year from the Ganges River alone (NOAA n/d; Kay et al., 2018). This riverine input causes a warm, low-salinity, nutrient and oxygen-rich layer (sometimes referred to as a barrier layer) to form to a depth of 100 m and that extends ~1,500 km into the BoB from the northern coastline (NOAA n/d; Behara and Vinayachandran, 2016; Kay et al., 2018; Rainville et al., 2022). Upper ocean circulation in the BoB is complex and identifying an ‘average’ pattern is often confounded by pronounced seasonal (monsoonal) variation (Rainville et al., 2022). Nonetheless, circulation reverses semi-annually, although not exactly matching wind direction, and in both seasons circulation is largely unorganised and characterised by meso-scale cyclonic (during the northeast monsoon) and anti-cyclonic (January to April) eddies (Chamarthi et al., 2008; Brewer et al., 2015; Behara and Vinayachandran, 2016; Rainville et al., 2022). Because the BoB receives a vast volume of freshwater on a seasonal time scale this water needs to be transported out of the bay (Behara and Vinayachandran, 2016; Herron et al., 2022). This is achieved largely by the East Indian Coastal Current (EICC) on the western side of the bay during November–January and by equator-ward flowing currents on the eastern side during both summer and winter (Chaitanya et al., 2014; Behara and Vinayachandran, 2016 and references therein, although not all studies agree on this e.g., Rainville et al., 2022). This phenomenon of southward flowing water along the eastern coast of India has been described as a ‘river in the sea’ and is so pronounced that it has been measured by fishermen in knee-deep water (Chaitanya et al., 2014). Finally, the region is also characterised by periods of variable upwelling and downwelling that modify the depth of the thermocline, and which support important regional fisheries (Chamarthi et al., 2008; Brewer et al., 2015; Rainville et al., 2022).
In the present paper we examine for the first time the phylogeographic relationships between two spatially explicit groups of Asian green mussels either side of the Bay of Bengal. We test the hypothesis of genetic differentiation between Indian (western) and SE Asian (eastern) mussels using mitochondrial (COI) DNA sequence data compiled from published sources and downloaded from GenBank. To better understand where and why a pronounced genetic break exists in a species that (1) is widely and continuously distributed, at least where suitable habitat exists, (2) has very large population sizes and considerable capacity for natural larval dispersal, (3) is moderately tolerant of environmental variation and establishes successfully and rapidly in new locations, and (4) which is a member of an old evolutionary genus (dating back to the Eocene, ~ 60 M years before present: Moore, 1969), we examine our findings in the context of the coastal physical oceanography and regional-scale processes that may act as a natural barrier to gene flow for the AGM between the Indo-Pacific region and Indian Ocean region.
Materials and methods
Sequence data
DNA sequence data for part of the cytochrome c oxidase I gene (COI) were compiled from a variety of sources (Table S1). Criteria for inclusion in this study included (1) that the sequence data must have been extracted from a mussel that was considered to be native to the region from which it was collected (i.e., the mussel was clearly not an invader at a site outside the accepted range of P. viridis), (2) that site location and region of origin information were provided, and (3) that the sequence was of sufficient length and quality to permit alignment and subsequent trimming against all other sequences to produce an alignment that was informative (Table S1).
We use the term ‘location’ to identify site of collection (China - mainland, Hong Kong, India, Indonesia, Philippines, Singapore, Taiwan, Thailand, Viet Nam) and the term ‘region’ to refer to sites east of the Bay of Bengal (China - mainland, Hong Kong, Indonesia, Philippines, Singapore, Taiwan, Thailand, Viet Nam) and west of the Bay of Bengal (India) (Figure 1).
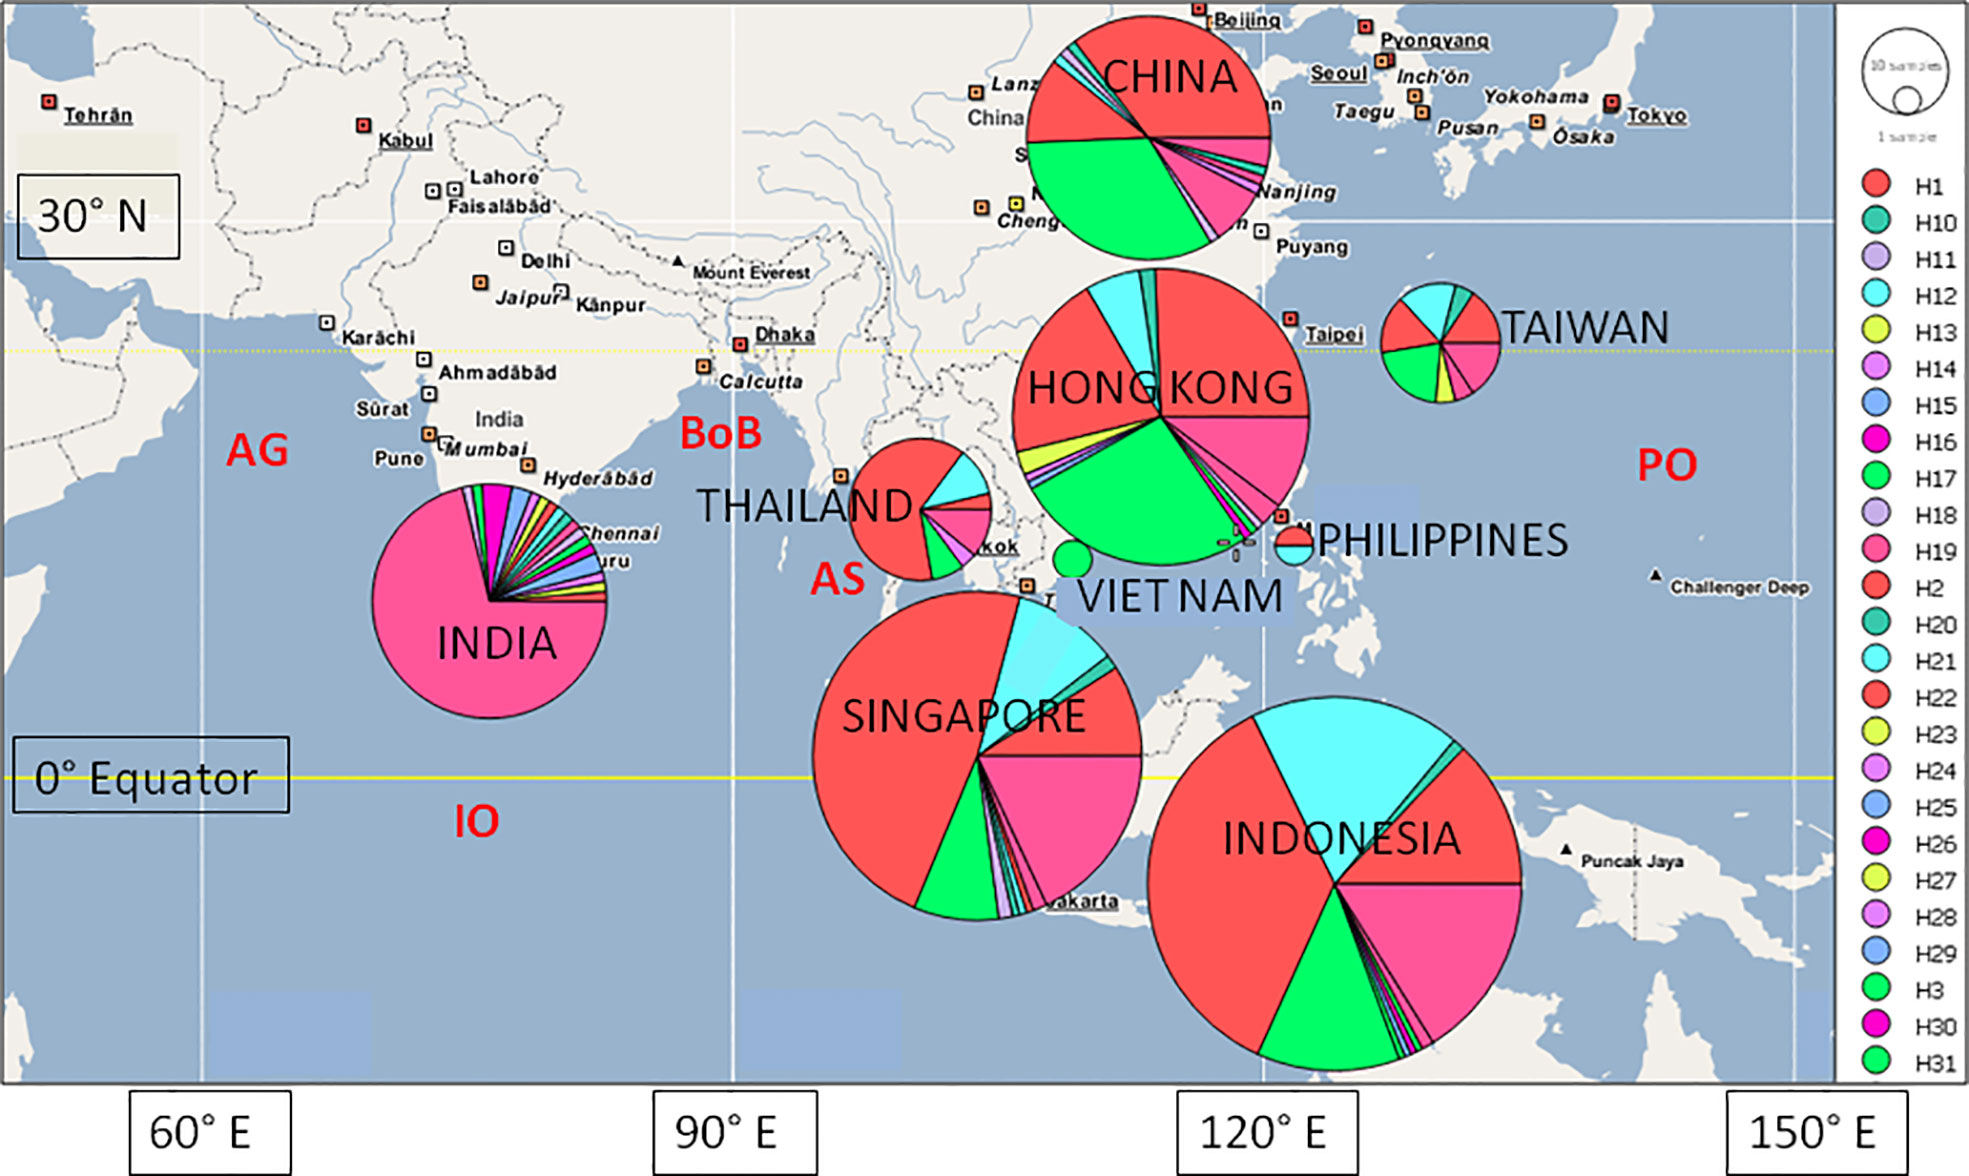
Figure 1 Map of location (China - mainland, Hong Kong, India, Indonesia, Philippines, Singapore, Taiwan, Thai land, Viet Nam) of mussels for which COI sequence data are available, including haplotypic diversity per location (larger circles indicate more mussels). AG, Arabian Gulf; AS, Andaman Sea; BoB, Bay of Bengal; I O, Indian Ocean; PO, Pacific Ocean.
Data analysis
COI sequence data were imported in FASTA format into Geneious (v7.1.8, BioMatters Ltd, ww.geneious.com), checked for quality and consistency, and aligned using MAFFT (Katoh et al., 2002). Sequence ends were trimmed to give a 467 bp aligned sequence for subsequent analysis. Analyses were conducted to test for location (country) and regional (west versus east of the Bay of Bengal) differences amongst or between samples.
The software FaBox v1.61 (Villesen, 2007 - https://birc.au.dk/~palle/php/fabox/) was used to count haplotypic variation: private (found only at a single location or within a single region) and shared haplotypes were identified. Permutational RxC testing (Miller, 2005) was employed to test for haplotypic variation as a function of the number of mussels per location or region. Because RxC is a permutational test it generates both a P value and a standard error (SE) for the P value, and it does not require observed or expected cell values of ≥5.
Using DnaSP v.6.12.03 (Rozas et al., 2017) standard diversity indices including number of segregating sites (S), haplotype diversity (H), mean number of pairwise differences (Π), and nucleotide diversity (π) were estimated for each population. Estimates of genetic distance between pairs of locations and between the two regions were calculated using different metrics (GST, NST, ΦST). These values were tested for differentiation from zero in GenAlEx v6.5.03 (Peakall and Smouse, 2012) using 999 permutations. P-values of the 36 tests were corrected for multiple testing using the Benjamini-Hochberg false discovery rate test as implemented in the software package Bonferroni Calculator v1.1 (Lesack & Naugler, 2011).
To measure deviation from the null hypothesis of constant population size and random mating, neutrality testing was conducted using Tajima’s D (Tajima, 1989) values that were estimated by comparing the differences between the number of segregating sites and the average number of nucleotide differences for mussels from each location or region. Positive D values indicate an absence of significant recent mutations that may result from balancing selection or a decline in population size, whereas negative values reflect excess recent mutations that may indicate population expansion or a selective sweep. Fu’s FS values were calculated in DnaSP: negative values of Fu’s FS provide evidence for an excess of haplotypes and likely population expansion. Finally, the Ramos-Onsins and Rozas R2 statistic, where lower values are expected to reflect recent population expansion, was also calculated in DnaSP. Fu’s FS value is generally thought to be better for large sample sizes whereas the Ramos-Onsins and Rozas R2 statistic is better for small sample sizes (Ramos-Onsins and Rozas, 2002). Significance (p-values) for these statistics were calculated via the coalescence approach in DnaSP.
The software PopART (Leigh and Bryant, 2015) was used to construct haplotypic networks to illustrate relationships amongst COI haplotypes of the 467 bp aligned sequences as a function of location and region. PopART was also employed to carry out an AMOVA (analysis of molecular variation) to test for genetic subdivision across the range of P. viridis samples. AMOVA (Excoffier et al., 1992; Dupanloup et al., 2002) is based on a priori location or region (group) designations and works to identify groups with the lowest within-group genetic variation. Where appropriate, location was nested within region to test for differentiation between regions, amongst locations and across all individuals. Levels of significance were tested using 1000 permutations.
A neighbour-joining consensus tree was generated using the Geneious software for the COI sequences to examine the relationships amongst all haplotypes as a function of location and region. Bootstrapping (999 permutations) was performed to evaluate support for the branches.
Results
In total, 649 COI sequences were retained, for which there was confidence that the individual mussel was native (i.e., clearly not introduced), site/region/country collection data were provided (Table 1), and we could obtain a trimmed and informative sequence of 467 bp.
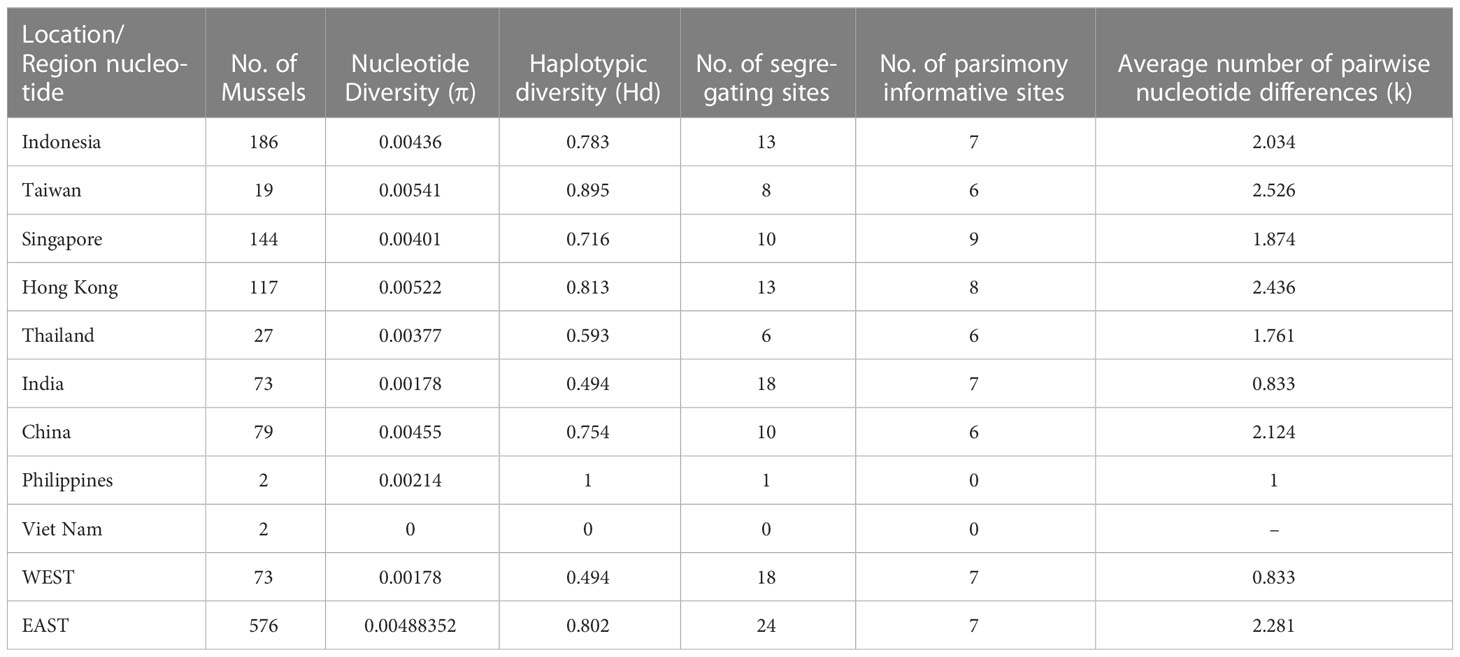
Table 1 Genetic diversity measures for mussels from nine locations and two regions.
In total, 39 different haplotypes were observed, of which 28 were private at the location level (Figure 1; Table S2). The number of observed haplotypes and the number of private haplotypes as a function of location were significantly different (P < 0.0001, SE < 0.0005 in both cases). For the observed haplotypes there were more haplotypes observed than expected amongst the mussels from India and Taiwan, and fewer than expected from Indonesia and Singapore. For the private haplotypes, there were far more observed than expected for mussels from India and fewer than expected for mussels from Indonesia and Singapore (Table S3). At the regional level there more haplotypes and also far more private haplotypes observed than expected for the mussels from India (west of the Bay of Bengal) and fewer than expected for SE Asia (i.e., east of the Bay of Bengal) - P < 0.0001, SE < 0.0001 in both cases (Table S3).
Excluding the mussels from the Philippines and Viet Nam (because n = 2 in both cases) the location-specific estimates of nucleotide diversity (π) ranged from 0.00178 (India) to 0.00541 (Taiwan), haplotypic diversity (Hd) ranged from 0.494 (India) to 0.895 (Taiwan), and the average number of pairwise nucleotide differences (k) ranged from 0.833 (India) to 2.526 (Taiwan). The number of segregating sites (number of haplotypes) ranged from 6 (Thailand) to 18 (India) and the number of parsimony informative sites ranged from 6 (China, Thailand, Taiwan) to 9 (Singapore). At the regional level (Table 1) the mussels from west of the Bay of Bengal (n = 73) exhibited lower values for all indices (except the number of parsimony informative sites which was the same) as the mussels from east of the Bay of Bengal (n = 576).
For neutrality testing, the only estimate of Tajima’s D value that was statistically significantly was that for India (D = -2.305, P < 0.01), which may indicate population expansion or a recent selective sweep (Table 2). Statistically non-significant Tajima’s D values for the mussels from SE Asian locations suggest that these populations may be at or near to equilibrium status. Fu’s FS test results for the locations were all negative, but only the result for India was statistically significant and indicative of a recent population expansion. For the two regions, the west (India) result was highly statistically significant whilst the east (SE Asia) result was borderline statistically significant, suggesting a large and recent population expansion to the west of the Bay of Bengal and the possibility of a recent expansion to the east. The Ramos-Onsins and Rozas R2 test results were all positive (in the range 0.0280 to 0.1497 for the individual locations) and the smallest value was observed for the Indian sample (low R2 values are indicative of population expansion). Of the seven location-specific tests only that for India was statistically significant. For the two regions the R2 value of the west (India) was ~50% of that of the east (SE Asia) and only the result for the west region was statistically significant. Overall, these Ramos-Onsins and Rozas R2 test results indicate recent population amongst the Indian (western) mussels and no expansion amongst the mussels of the eastern sites and the east region (Table 2).
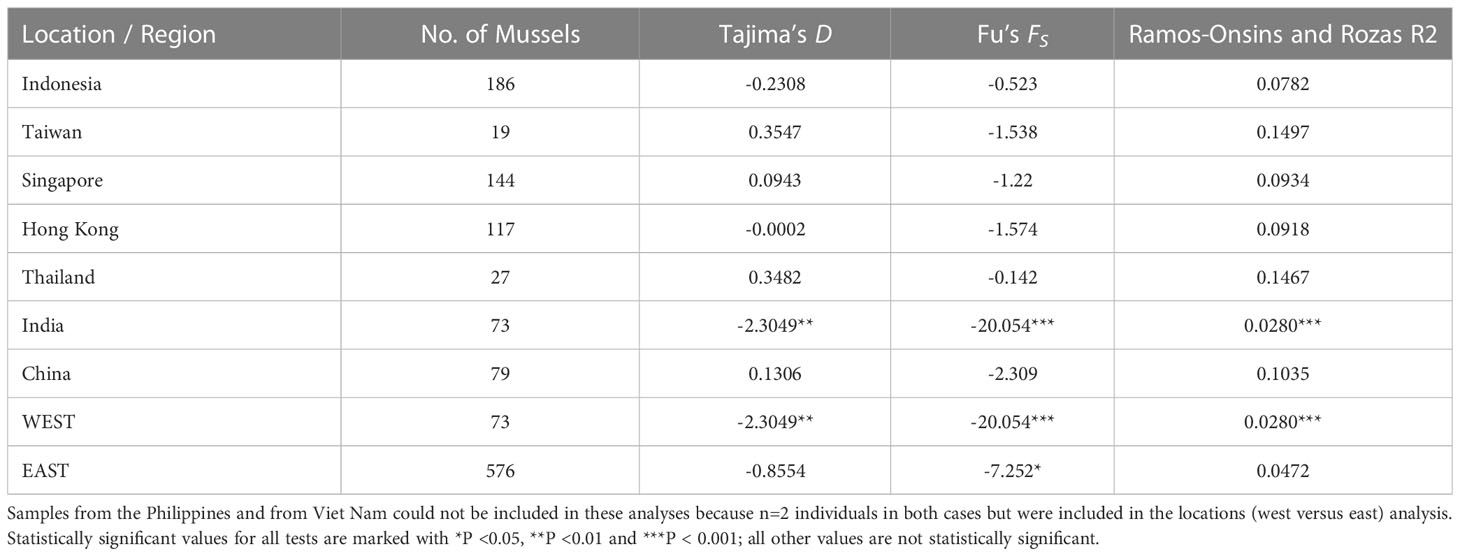
Table 2 Tests of deviation from neutrality (possible range expansion) for mussels from seven locations and two regions.
Estimates of genetic distance between pairs of locations and between the two regions were consistent regardless of which metric (GST, NST, ΦST) was used so we only present here the results for ΦST. After correction for multiple testing 19 of the 36 tests (p-value ≤ 0.024) were statistically significant. Across all nine pairwise location comparisons the ΦST values ranged from 0.000 (negative values have been set to zero) to 0.857, with a mean ± SD of 0.308 ± 0.283, and when the samples from the Philippines and Viet Nam (n=2 in both cases) were excluded the ΦST values ranged from 0.000 to 0.656, with a mean ± SD of 0.212 ± 0.212 (Table 3; Figure S1). All pairwise combinations involving the mussels from India were highly statistically different from zero (Table 3; Figure S1). Excluding the Philippines and Viet Nam samples, the India sample had the highest mean ΦST value of 0.520, which was between 2 and 3.7 times the values exhibited by the populations from SE Asia (a high of 0.250 for Thailand and a low of 0.140 for Taiwan) (Table 3). Not surprisingly, the ΦST value of genetic differentiation between the regions – east versus west of the Bay of Bengal – was high at 0.498.
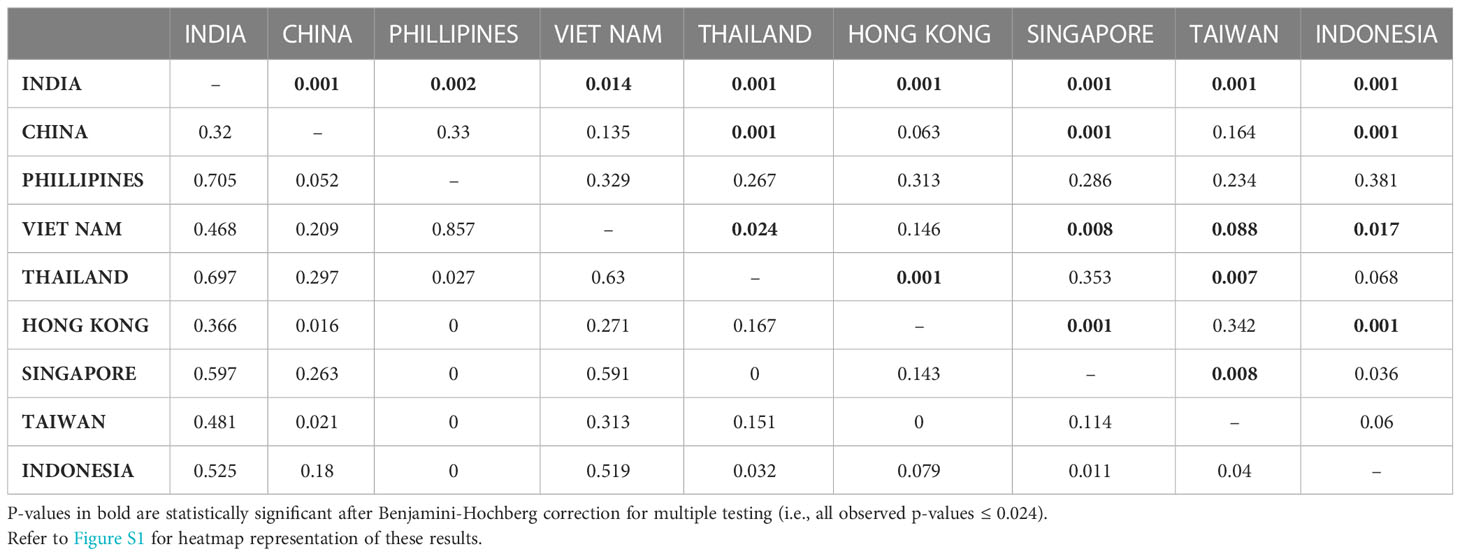
Table 3 Estimates of pairwise genetic distance estimates (ΦST - below diagonal) and significance levels (P based on 999 permutations - above diagonal) between nine sampling locations.
AMOVA testing was carried out at four different spatially explicit levels (Table 4). AMOVA revealed statistically significant differences in COI sequence variation amongst mussels of all nine locations (25% of total variation, ΦST = 0.249, p < 0.001) and also amongst mussels from the eight southeast Asia locations (12% of total variation, ΦST = 0.118, p < 0.001). AMOVA also identified statistically significant differences in COI sequence variation amongst mussels of all nine locations when nested within region (43% of total variation amongst regions and 9% among locations, ΦST = 0.519, ΦSC = 0.161, p < 0.001) and also between the two regions (15% of total variation, ΦST = 0.151, p < 0.001). Thus, whilst all four models were statistically significant, the best fit AMOVA model included all nine locations when nested within region (east versus west of the Bay of Bengal) and the poorest performing model involved only the eight locations from SE Asia.
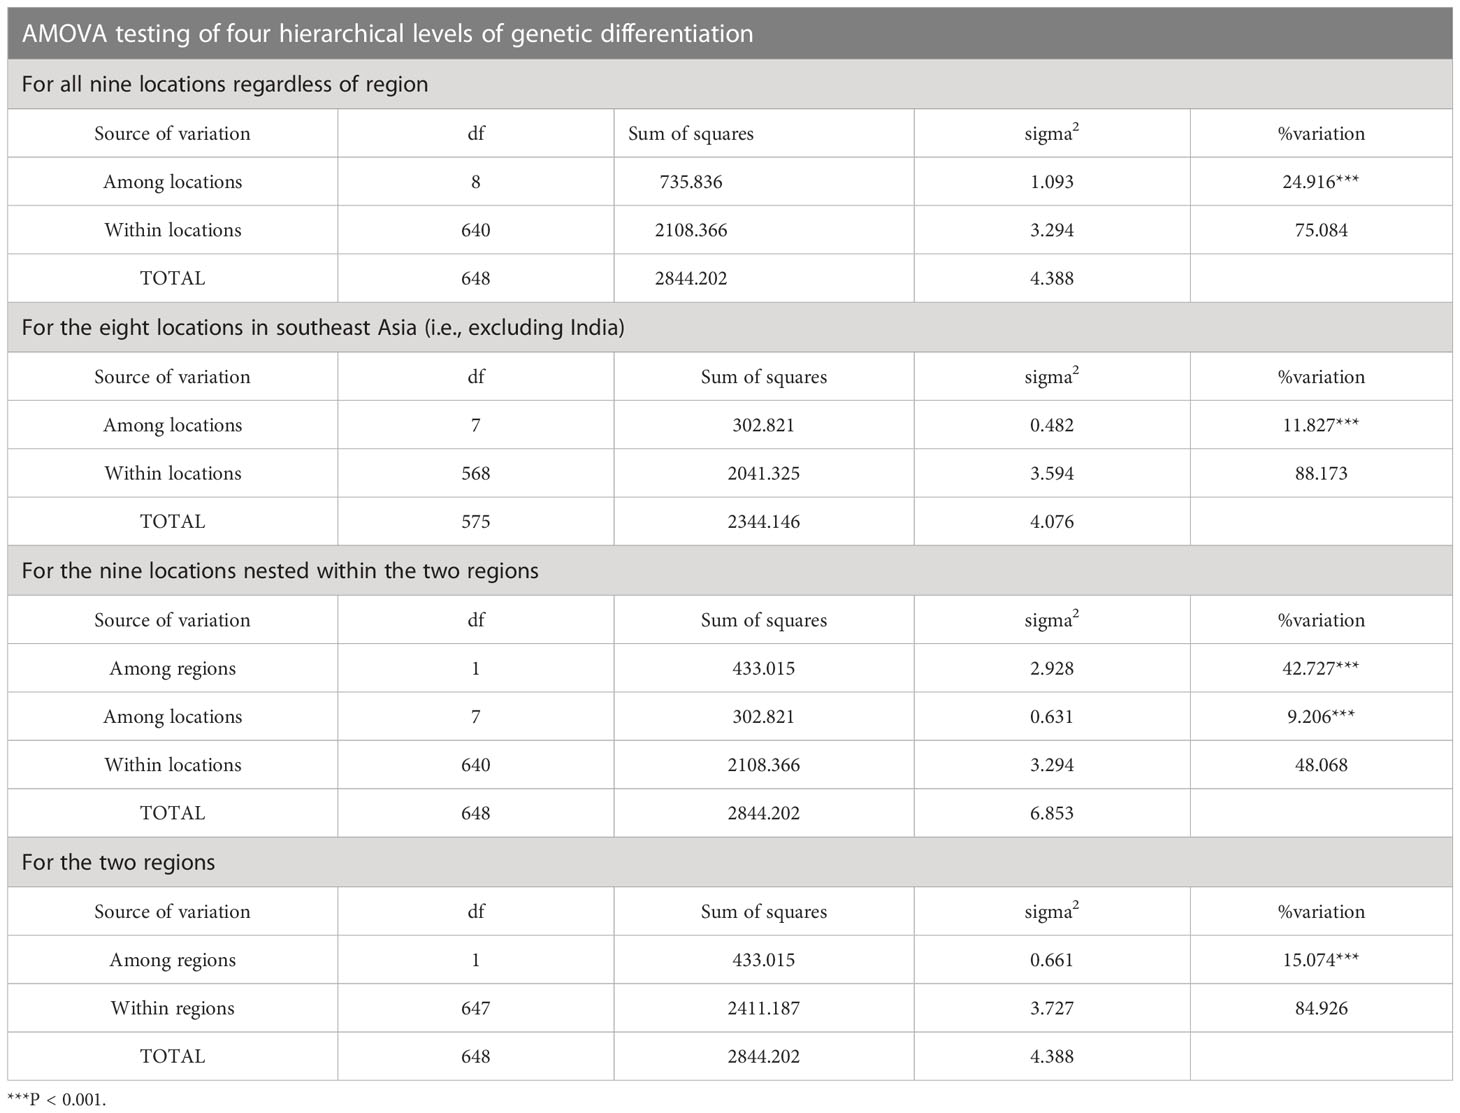
Table 4 AMOVA results at four different levels: all nine locations regardless of origin, the eight locations in southeast Asia (i.e., excluding India), for the nine locations nested within region, and for the two regions.
Different haplotypic networks were constructed using PopART but all gave basically the same result – clear separation of Indian mussels from those of SE Asia (Figure 2). Six main haplotypes (H1, H2, H3, H5, H9 and H12) were identified, from which all other haplotypes branched. Haplotype H5, being most frequent in the Indian mussels, was clearly separated from the other five haplotypes, for the nine-location TCS network and most evidently for the two-region TCS network (Figure 2). Haplotype H5 (Indian mussels) was mostly closely linked to haplotype H3 (one base change) and then to H1 (two base changes).
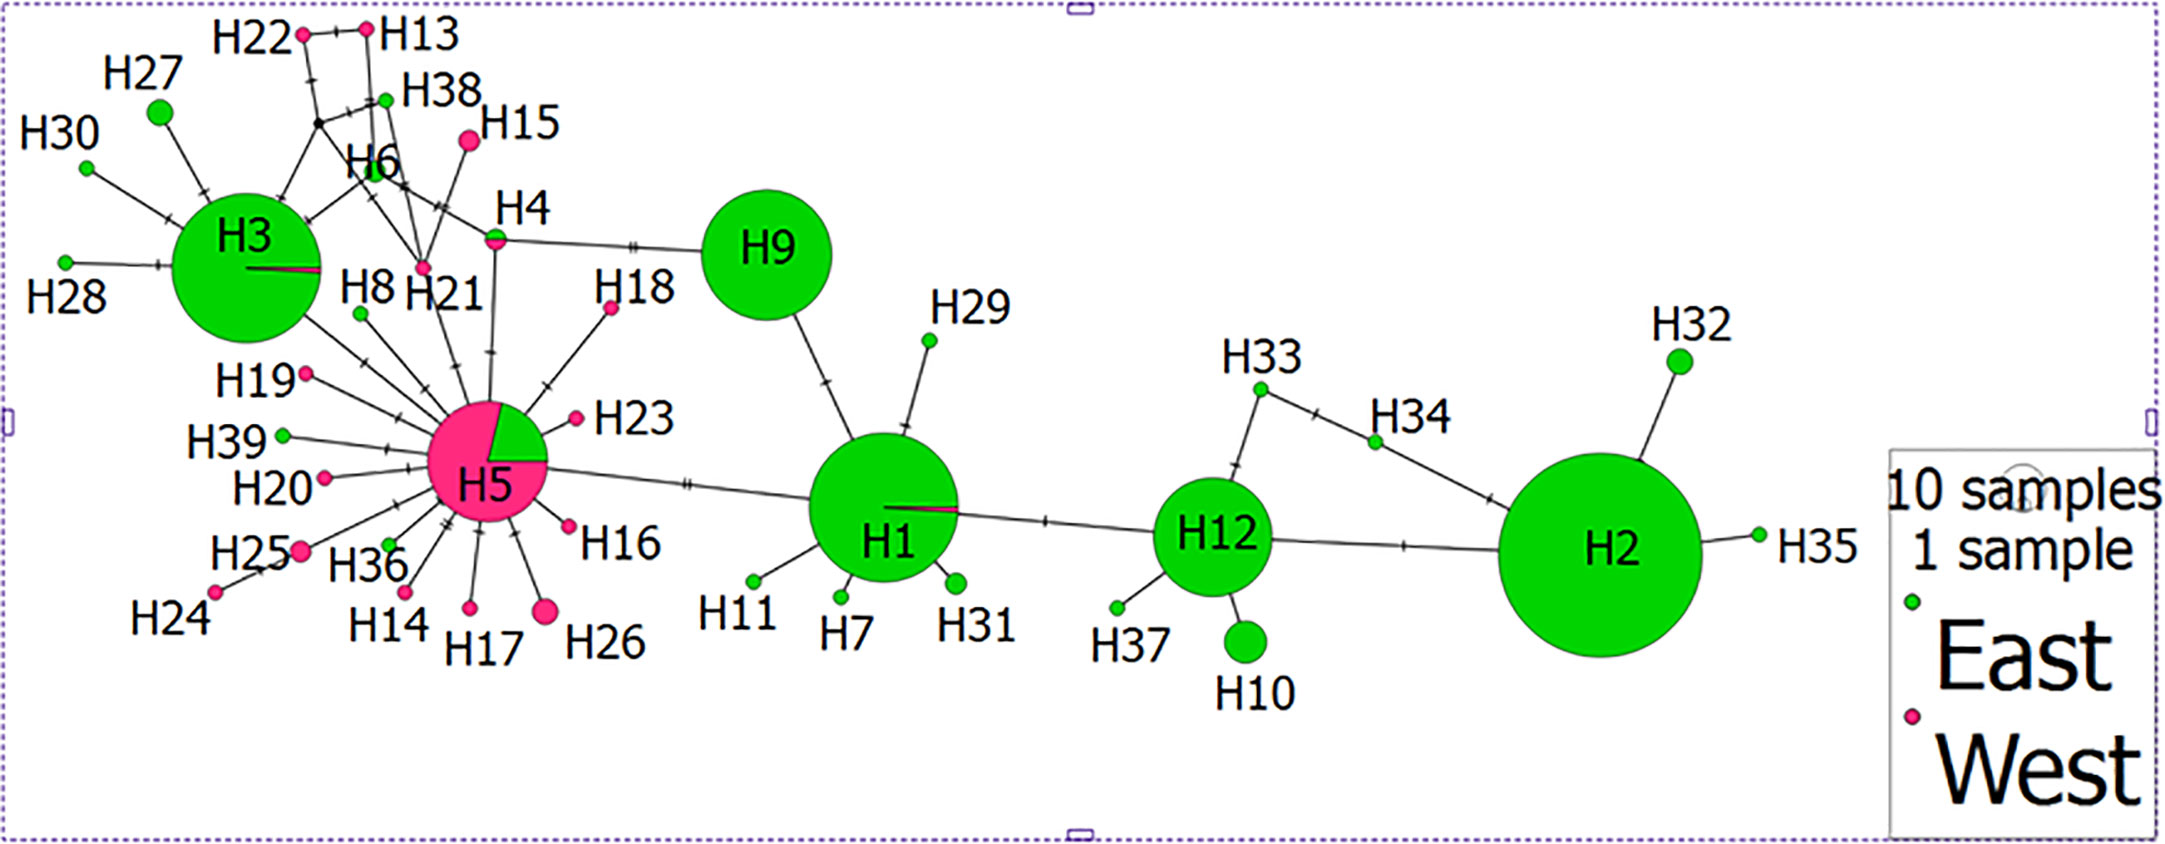
Figure 2 Haplotype network showing differentiation between mussels from east of the Bay of Bengal (SE Asia in green) and west of the Bay of Bengal (India in pink). Individual haplotypes are labelled H1 to H39; size of size represents number of individuals per haplotype.
The NJ tree revealed two main clusters, with an incomplete separation of Indian mussels from the SE Asian mussels (Figure 3). On the main branch of the tree most samples were from Hong Kong and Singapore, with others from Indonesia, the Philippines, and Thailand. Of the 14 haplotypic branches in this first cluster (which was composed of 4 subclusters) only one (haplotype 1) had a single Indian mussel and only 7 were private haplotypes. There was no evidence of geographic structure amongst these haplotypes. The remaining haplotypes formed a distinct second cluster with bootstrap support of 54% (bootstrap support values across the NJ tree were in the range 51 to 61%). This second main grouping was dominated by mussels from India, with representation from other locations to a lesser extent. This grouping of 25 haplotypes contained 21 private haplotypes, 14 of which were found only in India (Figure 3). Of the six most frequently occurring haplotypes (Table S2) four of them (H1, H2, H9, H12) occurred in the first cluster and two (H3, H5) in the second cluster.
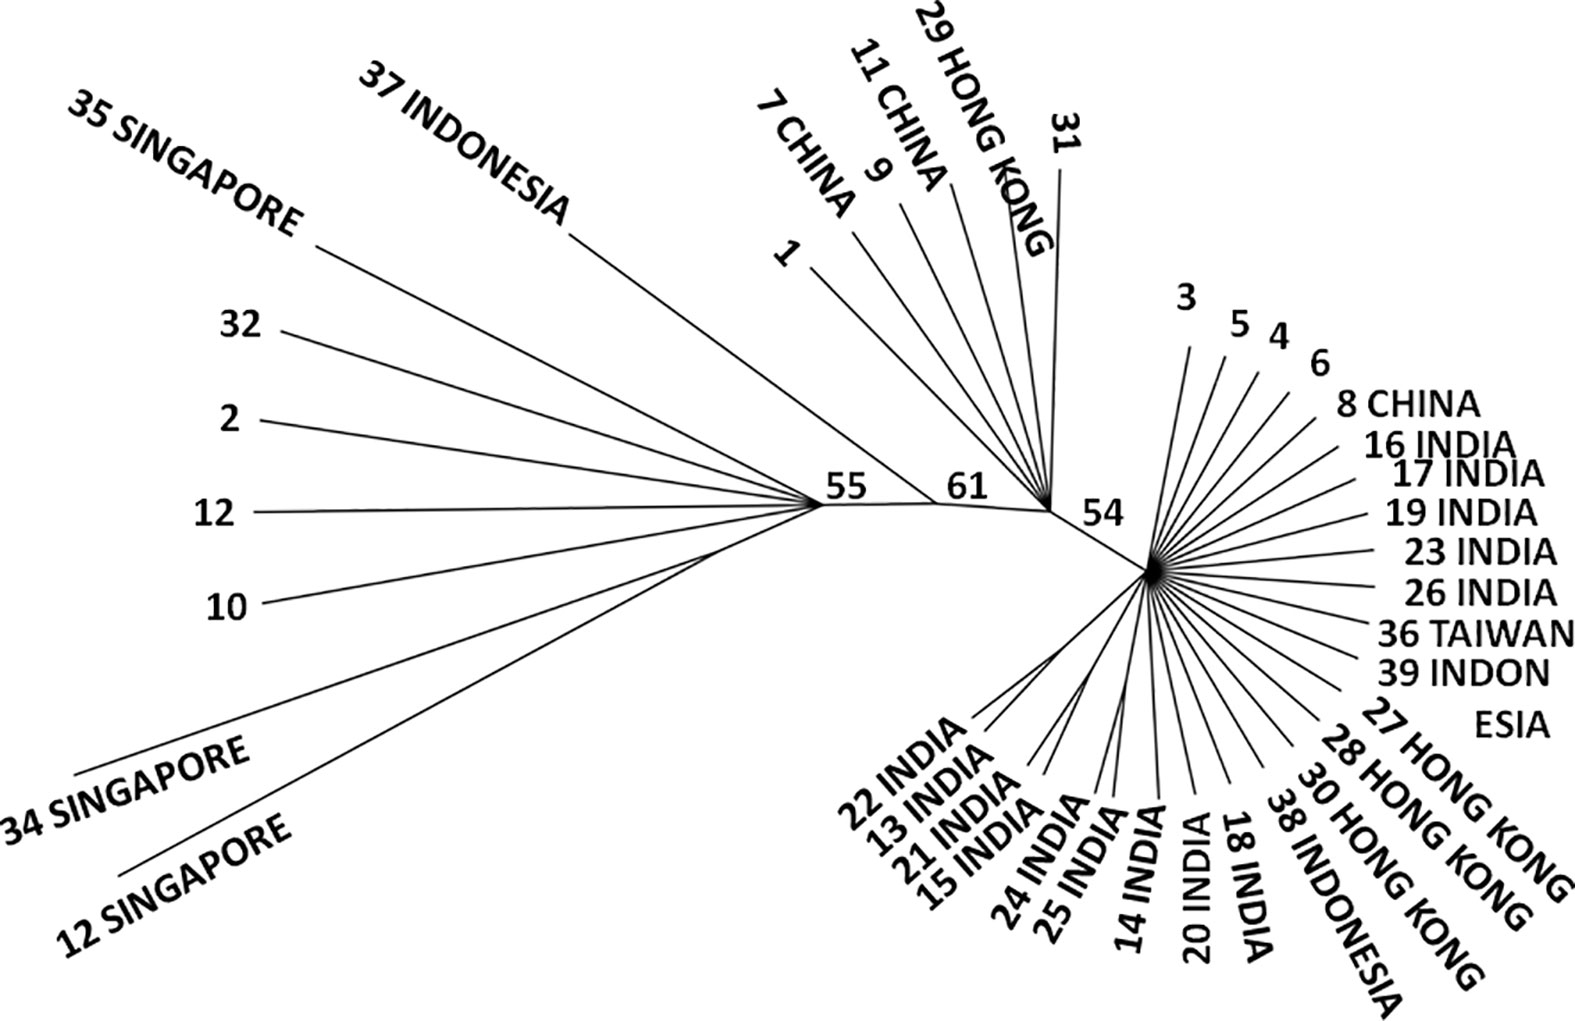
Figure 3 Neighbour Joining tree of COI sequence variation for the Asian green mussel, Perna viridis. Number at end of each branch represents haplotype whilst country name indicates unique haplotypes (haplotype number with no country name is a shared haplotype). Numbers are per cent bootstrap support values for major nodes.
Discussion
Our analyses of COI sequence variation (n=649 sequences of 467 bp length from 9 locations and 2 regions) reveal for the first time the existence of statistically significant genetic differentiation between P. viridis mussels from west of the Bay of Bengal (India) and those from east of the Bay (SE Asia). There is proportionately greater haplotypic diversity and a greater number of private haplotypes within the 73 mussels from India than exists within the 576 mussels from SE Asia. In addition, AMOVA clearly shows that the greatest level of differentiation exists when sampling locations are nested within regions (east versus west of the Bay of Bengal) and the TCS haplotypic network and the NJ tree both show a high (but incomplete) level of differentiation between mussels from either side of the Bay of Bengal.
Limitations
Our study is based on results from only one marker – mtDNA COI partial gene sequence. Ideally, multiple markers should be used in a study such as this because they are more informative than a single marker (e.g., Larraín et al., 2018; Zbawicka et al., 2019; Simon et al., 2020; Zbawicka et al., 2022) and because assessment of genetic diversity within the mitogenome may not reflect genetic diversity within the nuclear genome (reviewed by Toews and Brelsford, 2012). Preliminary assessment of the use of other markers for P. viridis (e.g., ITS, Cyt-b, 16S, D-loop) revealed too little data (small samples sizes, too few sampling locations) from published sources, including GenBank, to be informative. In addition, where markers such as ITS have been used for the assessment of local scale genetic diversity there is limited or no power to detect differences and the COI marker is far more informative (e.g., Gardner et al., 2016; Ye et al., 2021). Thus, right now we can only use a single marker because this is all that is publically available and informative, and because sampling of new mussel samples from the Indo-Pacific region is too challenging (logistical difficulties make field work of this type prohibitively expensive and permitting issues limit access). Future work on this topic will benefit from the use of combined mitogenome and nuclear genome markers, as well as the use of newer, highly polymorphic markers such as single nucleotide polymorphisms (SNPs) to better understand contemporary gene flow versus historic patterns of genetic structure.
The Bay of Bengal as a barrier to gene flow
As noted in the Introduction, the Bay of Bengal is a large marine ecosystem, the largest bay in the world, and is characterised by very strong seasonal input of freshwater. Our results have, for the first time, highlighted the BoB region as the area of interest but identifying the exact location of the genetic discontinuity in the AGM between western (India) and eastern (SE Asia) regions of the bay is presently impossible because there has been no reported sampling of mussels from most of the Bay of Bengal itself. To the west of the bay region AGMs have been sampled for COI analysis from approximately Chennai (India) and on the east coast of the bay from Thailand and Malaysia. There has also been very limited sampling from Kochin (southern India) or to the west, including Oman. Whilst the AGM has been recorded from many other sites both in the region of the BoB itself (e.g., Bangladesh) and beyond, they have not been subject to genetic analysis. Examination of biogeographic patterns for the BoB region are informative and provide clear evidence of distributional discontinuities in numerous species (e.g., Sivadas and Ingole, 2016) and within-species genetic discontinuities for a range of taxa including seagrass, dolphins and horseshoe crabs (Nguyen et al., 2014; Amaral et al., 2017; Periasamy et al., 2017). The influence of pronounced seasonal salinity variation on coastal biota is not surprising given the osmotic stress that such variation may induce and the physiological responses (stenohaline versus euryhaline) of different taxa (e.g., Wang et al., 2011a; Wang et al., 2011b; McFarland et al., 2013; Pourmozaffar et al., 2020; Suokhrie et al., 2021). To better understand the shape (e.g., shallow cline, stepped cline, linear gradient) and to identify the exact location of differentiation of eastern from western mussels more sampling of the AGM is required from the east coast of India, from Bangladesh and from the coast of Myanmar. Additional work describing, for example, the timing of gametogenesis and spawning plus larval tolerance of environmental variation including salinity fluctuation of P. viridis in the Bay of Bengal region and how these key biological responses relate to the timing of major freshwater outflow into the BoB may provide insight into how it is that a seasonal barrier (freshwater outflow) to gene flow may act to prevent or minimise connectivity between eastern and western regions.
Regional population genetic differentiation
In India, P. viridis is found extensively along the western (Arabian Sea) coastline from the north (Gulf of Kutch, Gujarat State), but in particular in the state of Kerala in the south. On the east coast (Bay of Bengal) it is found at least as far north as Chilka Lake (Orissa State), as well as at the Andaman and Nicobar Islands (Andaman Sea) (Jones and Alagarswami, 1973; Divya et al., 2012; Laxmilatha, 2013). Divya et al. (2012) assessed genetic variation of P. viridis from three mainland Indian sites using RAPDs and concluded that all sites formed a single stock characterised by high levels of gene flow. Their fourth sample, from the offshore Andaman Islands (located to the southeast of the Bay of Bengal), was differentiated from the three mainland samples. More recently, Divya et al. (2020) assessed variation at the ATP-ase6 and cyt-b loci in mussels from two sites on the west coast (Goa and Kollam – Arabian Sea), two on the east coast (Chennai and Vishakapatnam – Bay of Bengal) and one from Port Blair in the Andaman and Nicobar Islands (Andaman Sea). They reported low nucleotide diversity (indicative of a severe historical bottleneck) and high haplotypic diversity (indicative of recent population expansion) for mussels from all sites, and noted that the Bay of Bengal plus Andaman Sea populations exhibited greater genetic diversity than the Arabian Sea populations. More recent work, based on microsatellite variation did not include the sample from the Andaman Islands (Divya et al., 2022). Overall, these analyses indicate the existence of three partially differentiated groups of AGM within India: a moderately well differentiated group from the Andaman Sea and two partially differentiated groups from the east coast (Bay of Bengal) and the west coast (Arabian Sea). It is not possible to say if the Andaman Sea mussels are more or less similar to those from SE Asia because no such comparison was run by Divya et al. (2020) but the greater differentiation of the Andaman Sea mussels from the BoB and Arabian Sea mussels points to separation (reduced gene flow) from the Andaman Sea to mainland India (and vice versa), and this is consistent with the overall differentiation of the SE Asian mussels from the Indian AGMs. Our analysis of COI sequence variation for mussels from India could not test for mainland differences because we had too few mussel samples from the western coast, and there are no COI sequence data for the Andaman Sea island mussels.
Very little population genetic analysis has been carried for AGMs west of India. Ye et al. (2021) examined DNA sequence variation at three markers - ITS, D-loop (control region) and COI - for mussels collected from four sites in mainland China, one in the Gulf of Thailand (mean sample size of 24.4 mussels for the 5 sites for ITS and of 27.4 for both D-loop and COI) and for one site in Oman (sample size of 10 for all three markers). Based on ITS sequence variation the mussels from Oman did not show any obvious differentiation from the mussels from China and Thailand. However, the combined COI plus D-loop haplotypic analysis revealed pronounced separation of the Omani mussels from those of China and Thailand. This finding is consistent with the interpretation of the freshwater outflow in the Bay of Bengal acting as a barrier to gene flow between eastern and western regions either side of the bay but it is also consistent with some degree of isolation-by-distance given that the Oman sampling site (one site with only 10 mussels sampled) is also the most distant (remote) site of the six sites that were sampled. Nonetheless, the COI plus D-loop sequence variation does exhibit the expected genetic differentiation of Oman from the SE Asian sites whereas the ITS network (for the same mussels) does not show any such differentiation. Overall, we interpret these findings as being consistent with our own findings of AGM from east of the BoB being significantly differentiated from those west of the BoB. We were unable to include the sequence data of the study of Ye et al. (2021) because there was too little sequence overlap for the aligned and edited sequence to be informative in our analyses. Clearly, additional sampling of AGMs from regions to the west of India (Pakistan, Iran, the Arabian Peninsula) is required to help clarify the situation and to test the hypothesis of east versus west of the BoB mussel differentiation.
East versus west - contrasting patterns of demographic histories
The genus Perna is part of the Malayo-Pacific biota (Fleming, 1979) and is now extensively distributed throughout much of the Indo-Pacific region, the Indian Ocean region and extends west to Oman (Wood et al., 2007). We observed pronounced evidence of recent population expansion amongst the mussels from India but all other location samples exhibited evidence of equilibrium. At the regional level (i.e., east versus west of the BoB) the combined samples from the east (SE Asia) were found to be at equilibrium by two of the three tests but exhibited some low level evidence of expansion (p = 0.048) based on the Fu’s FS test. In contrast, the mussels from west of the BoB (i.e., the Indian mussels) exhibited strong evidence of population expansion based on results from all three tests. Overall, our neutrality test results strongly suggest that Perna viridis has migrated from the Malayo-Pacific region (where it originated ~ 60 M years before present (Moore, 1969) and where contemporary populations appear to be at equilibrium), across the Bay of Bengal, which probably acted historically as some sort of semi-permeable barrier to larval movement based on the observed natural salinity variation, and then settled on the coastlines of India, Sri Lanka, Pakistan, Iran and Oman. Dating of this east to west movement is best based on analysis of several different markers, both mitochondrial and nuclear, and is therefore not possible in the present study. Nonetheless, the very strong signal of population expansion in the west allows us to suggest that range expansion has been reasonably recent given that the Indian population is nowhere near to exhibiting equilibrium status. Further testing is required but this is not possible using only publically available data (e.g., GenBank) so we suggest that a specifically targetted approach involving new sampling is going to be required.
Conclusions
Analysis of COI sequence variation has revealed a pronounced genetic break in the continuously distributed Asian green mussel, Perna viridis, with the location of the discontinuity identified as occurring in the Bay of Bengal. We hypothesise that pronounced freshwater input into the Bay is the likely cause of the genetic break between mussels from SE Asia and those from India (and presumably further west). There is strong evidence of population expansion in the region to the west and population equilibrium to the east of the Bay of Bengal. These results provide a new insight into the phylogeography of the Asian green mussel and the identification of different lineages (east versus west of the Bay of Bengal) may help with the genetic identification of invasive mussels, either when moved between the two regions or when moved from one region to a new location somewhere else in the world.
Data availability statement
Data (FASTA file) and ReadMe text file available in Open Science Framework at DOI 10.17605/OSF.IO/R6D7F.
Author contributions
All authors listed have made a substantial, direct, and intellectual contribution to the work and approved it for publication.
Funding
This research was supported by funding from the School of Biological Sciences (Victoria University of Wellington, New Zealand) to JPAG.
Acknowledgments
We thank Dr. Yingying Ye for sharing her COI sequence data with us, Mikel Mendiola for producing Figure S1 (the heat map), and Victoria University of Wellington (New Zealand) and the Suganthi Devadason Marine Research Institute (India) for their support.
Conflict of interest
The authors declare that the research was conducted in the absence of any commercial or financial relationships that could be construed as a potential conflict of interest.
Publisher’s note
All claims expressed in this article are solely those of the authors and do not necessarily represent those of their affiliated organisations, or those of the publisher, the editors and the reviewers. Any product that may be evaluated in this article, or claim that may be made by its manufacturer, is not guaranteed or endorsed by the publisher.
Supplementary material
The Supplementary Material for this article can be found online at: https://www.frontiersin.org/articles/10.3389/fmars.2023.1172997/full#supplementary-material
References
Amaral A. R., Smith B. D., Mansur R. M., Brownell R. L., Rosenbaum H. C. (2017). Oceanographic drivers of population differentiation in Indo-Pacific bottlenose (Tursiops aduncus) and humpback (Sousa spp.) dolphins of the northern Bay of Bengal. Conservation Genetics 18, 371–381. doi: 10.1007/s10592-016-0913-7
Apte S., Gardner J. P. A. (2002). Population genetic variation in the New Zealand greenshell mussel, Perna canaliculus: SSCP and RFLP analyses of mitochondrial DNA. Mol. Ecol. 11, 1617–1628. doi: 10.1046/j.1365-294X.2002.01554.x
Arrieche D., Maeda-Martinez A. N., Acosta-Balbas V., Freites L., Acosta-Salmon H., Lodeiros-Seijo C. (2020). Optimum temperature for growth of an invasive green mussel Perna viridis population from Venezuela, determined in an open-flow system. Aquacul. Rep. 16, 100284. doi: 10.1016/j.aqrep.2020.100284
Avise J. C. (2000). Phylogeography: the history and formation of species (Cambridge, Mass., USA: Harvard University Press).
Awan K. P., Mahar M. A., Larik Z. A. (2012). Growth performance of green mussels (Perna viridis Linnaeus 1758) culturing artificially on rafts at Ambra creek coastal belt of Arabian Sea in Sindh, Pakistan. Sindh Univ. Res. J. (Sci. Series) 44, 319–322. Available at: https://www.researchgate.net/profile/Mukhtiar-Mahar/publication/282787956_Growth_performance_of_green_mussels_perna_virifis_Linnaeus_1758_culturing_artificially_on_rafts_at_Ambra_creek_coastal_belt_of_Arabian_Sea_in_Sindh_Pakistan/links/561d1d2308ae50795afd7533/Growth-performance-of-green-mussels-perna-virifis-Linnaeus-1758-culturing-artificially-on-rafts-at-Ambra-creek-coastal-belt-of-Arabian-Sea-in-Sindh-Pakistan.pdf.
Baker P., Fajans J. S., Arnold W. S., Ingrao D. A., Marelli D. C., Baker S. M. (2007). Range and dispersal of a tropical marine invader, the Asian green mussel, Perna viridis, in subtropical waters of the Southeastern United States. J. Shellfish Res. 26, 345–355. doi: 10.2983/0730-8000(2007)26[345:RADOAT]2.0.CO;2
Barber P. H., Palumbi S. R., Erdmann M. V., Moosa M. K. (2000). A marine Wallace's line? Nature 406, 692–693. doi: 10.1038/35021135
Behara A., Vinayachandran P. N. (2016). An OGCM study of the impact of rain and river water forcing on the Bay of Bengal. J. Geophys. Res. – Oceans 121, 1–22. doi: 10.1002/2015JC011325
Boehm J. T., Woodall L., Teske P. R., Lourie S. A., Baldwin C., Waldman J., et al. (2013). Marine dispersal and barriers drive Atlantic seahorse diversification. J. Biogeogr. 40, 1839–1849. doi: 10.1111/jbi.12127
Borthagaray A. I., Carranza A. (2007). Mussels as ecosystem engineers: their contribution to species richness in a rocky littoral community. Acta Oecol. 31, 243–250. doi: 10.1016/j.actao.2006.10.008
Bowen B. W., Gaither M. R., DiBattista J. D., Iacchei M., Andrews K. R., Grant W. S., et al. (2016). Comparative phylogeography of the Ocean planet. Proc. Natl. Acad. Sci. U.S.A. 113, 7962–7969. doi: 10.1073/pnas.1602404113
Brewer D., Hayes D., Lyne V., Donovan A., Skewes T., Milton D., et al. (2015). “An ecosystem characterisation of the Bay of Bengal,” in Report to FAO for the Bay of Bengal Large Marine Ecosystem Project (CSIRO, Australia), 287. Available at: https://aquadocs.org/handle/1834/34573.
CABI (2021). “Perna viridis,” in Invasive species compendium (Wallingford, UK: CAB International). Available at: www.cabi.org/isc.
Castillo A., Valor A., Rodríguez Y., Báez R., Graña N. (2014). Epifauna associated with the Asian green mussel Perna viridis (Mytiloida: Mytilidae) in Cienfuegos Bay, Cuba. Int. J. Mar. Sci. 4, 134–142. doi: 10.5376/ijms.2014.04.0014
CBD (1992) Convention on biological diversity. Available at: https://www.cbd.int/convention/.
CBD (2020). Secretariat of the convention on biological diversity (2020) Global biodiversity outlook 5 (Montréal, Canada). Available at: https://www.cbd.int/gbo/gbo5/publication/gbo-5-en.pdf
Chaitanya A. V. S., Lengaigne M., Vialard J., Gopalakrishna V. V., Durand F., Kranthikumar C., et al. (2014). Salinity measurements collected by fishermen reveal a “River in the sea” flowing along the eastern coast of India. Bull. Am. Meteorol. Soc. 95 (12), 1897–1908. doi: 10.1175/BAMS-D-12-00243.1
Chamarthi S., Shree Ram P., Josyula L. (2008). Effect of river discharge on Bay of Bengal circulation. Mar. Geodesy 31 (3), 160–168. doi: 10.1080/01490410802265476
Chang Y. W., Chan J. S. M., Hayashi R., Shuto T., Tsang L. M., Chu K. H. (2017). Genetic differentiation of the soft shore barnacle Fistulobalanus albicostatus (Cirripedia: Thoracica: Balanomorpha) in the West Pacific. Mar. Ecol. 38, e12422. doi: 10.1111/maec.12422
Creer S., Deiner K., Frey S., Porazinska D., Taberlet P., Thomas W. K., et al. (2016). The ecologist's field guide to sequence-based identification of biodiversity. Methods Ecol. Evol. 7, 1008–1018. doi: 10.1111/2041-210X.12574
Crooks J. A. (2002). Characterizing ecosystem-level consequences of biological invasions: the role of ecosystem engineers. Oikos 97, 153–166. doi: 10.1034/j.1600-0706.2002.970201.x
Darlington P. J. (1957). Zoogeography: the geographical distribution of animals (New York, USA: John Wiley and Sons Inc.).
Davis C. D., Epps C. W., Flitcroft R. L., Banks M. A. (2018). Refining and defining riverscape genetics: how rivers influence population genetic structure. WIREs Water 5, e1269. doi: 10.1002/wat2.1269
de Messano L. V. R., Gonçalves J. E. A., Messano H. F., Campos S. H. C., Coutinho R. (2019). First report of the Asian green mussel Perna viridis (Linnaeus 1758) in Rio de Janeiro, Brazil: a new record for the Southern Atlantic Ocean. BioInvasions Records 8 (3), 653–660. doi: 10.3391/bir.2019.8.3.22
Dias P. J., Fotedar S., Munoz J., Hewitt M. J., Lukehurst S., Hourston M., et al. (2017). Establishment of a taxonomic and molecular reference collection to support the identification of species regulated by the Western Australia prevention list for introduced marine pests. Manage. Biol. Invasions 8, 215–225. doi: 10.3391/mbi.2017.8.2.09
Divya P. R., Jency P. M. E., Joy L., Kathirvelpandian A., Kumar Singh R., Basheer V. S. (2020). Population connectivity and genetic structure of Asian green mussel, Perna viridis along Indian waters assessed using mitochondrial markers. Mol. Biol. Rep. 47, 5061–5072. doi: 10.1007/s11033-020-05575-4
Divya P. R., Joy L., Poulose S., Jency P. M. E., Basheer V. S., Kathirvelpandian A., et al. (2022). Genetic stock identification in Perna viridis (Linnaeus 1758) from the Indian peninsula by using microsatellite markers. Mol. Biol. Rep. 49, 3357–3363. doi: 10.1007/s11033-022-07178-7
Divya P. R., Thomas P. C., Gopalakrishnan A., Sathianandan T. V., Paulton M. P. (2012). Stock structuring in Asian green mussel Perna viridis population along the Indian coast based on shell morphometrics and RAPD markers. Mar. Biol. Assoc. India 52, 35–41. Available at: https://epubs.icar.org.in/index.php/IJAnS/article/view/21775.
Dong Y.-W., Wang H.-S., Han G.-D., Ke C.-H., Zhan X., Nakano T., et al. (2012). The impact of Yangtze River discharge, Ocean currents and historical events on the biogeographic pattern of Cellana toreuma along the China coast. PloS One 7 (4), e36178. doi: 10.1371/journal.pone.0036178
Dupanloup I., Schneider S., Excoffier L. (2002). A simulated annealing approach to define the genetic structure of populations. Mol. Ecol. 11, 2571–2581. doi: 10.1046/j.1365-294X.2002.01650.x
Excoffier L., Smouse P. E., Quattro J. M. (1992). Analysis of molecular variance inferred from metric distances among DNA haplotypes: application to human mitochondrial DNA restriction data. Genetics 131, 479–491. doi: 10.1093/genetics/131.2.479
FAO (2019). Species fact sheet Perna viridis. Available at: http://www.fao.org/fishery/species/2691/en.
Faurby S., Barber P. H. (2012). Theoretical limits to the correlation between pelagic larval duration and population genetic structure. Mol. Ecol. 21, 3419–3432. doi: 10.1111/j.1365-294X.2012.05609.x
Fišer C., Robinson C. T., Malard F. (2018). Cryptic species as a window into the paradigm shift of the species concept. Mol. Ecol. 27613–, 635. doi: 10.1111/mec.14486
Fleming C. A. (1979). The geological history of New Zealand and its life (New Zealand: Auckland University Press), 141.
Gardner J. P. A., Bell J. J., Constable H. B., Hannan D. A., Ritchie P. A., Zuccarello G. C. (2010). Multi-species coastal marine connectivity: a literature review with recommendations for further research. New Zealand. Aquat. Environ. Biodiversity Rep. 58, 1–47. Available at: https://fs.fish.govt.nz/Page.aspx?pk=113&dk=22326.
Gardner J. P. A., Patterson J., George S., Patterson E. J. K. (2016). Combined evidence indicates that Perna indica Kuriakose and Nair 1976 is Perna perna (Linnaeus 1758) from the Oman region introduced into Southern India more than 100 years ago. Biol. Invasions 18, 1375–1390. doi: 10.1007/s10530-016-1074-9
Gilg M. R., Johnson E. G., Gobin J., Bright B. M., Ortolaza A. I. (2013). Population genetics of the introduced and native populations of the green mussel, Perna viridis: determining patterns of introduction. Biol. Invasions 15, 459–472. doi: 10.1007/s10530-012-0301-2
Hanyu K., Sekiguchi H. (2000). Perna mussels introduced into Ise and Mikawa bays, central Japan. Sessile Organ. 17, 1–11. doi: 10.4282/sosj.17.1
Herron A. J., Bohman S. M., Gordon A. L. (2022). Freshwater transport by eddies within the Bay of Bengal’s central axis. Deep-Sea Res. Part I 185, 103770. doi: 10.1016/j.dsr.2022.103770
Huhn M., Zamani N. P., Lenz M. (2015). A ferry line facilitates dispersal: Asian green mussels Perna viridis (Linnaeus 1758) detected in eastern Indonesia. BioInvasions Records 4 (1), 23–29. doi: 10.3391/bir.2015.4.1.04
Jones S., Alagarswami K. (1973). “Mussel fishery resources of India,” in Proceedings of the symposium on living resources of the seas around India 1968 (Mandapam Camp). Central Marine Fisheries Research Institute, Cochin, India. Available at: http://eprints.cmfri.org.in/2759/.
Jörger K. M., Schrödl M. (2013). How to describe a cryptic species? Practical challenges of molecular taxonomy. Front. Zool. 10, 59. doi: 10.1186/1742-9994-10-59
Katoh K., Misawa K., Kuma K., Miyata T. (2002). MAFFT: a novel method for rapid multiple sequence alignment based on fast Fourier transform. Nucleic Acids Res. 30, 3059–3066. doi: 10.1093/nar/gkf436
Kay S., Caesar J., Janes T. (2018). “Marine dynamics and productivity in the Bay of Bengal,” in Ecosystem services for well-being in deltas. Eds. Nicholls R., Hutton C., Adger W., Hanson S., Rahman M., Salehin M. (Cham: Palgrave Macmillan). doi: 10.1007/978-3-319-71093-8_14
Larraín M. A., Zbawicka M., Araneda C., Gardner J. P. A., Wenne R. (2018). Native and invasive taxa on the Pacific coast of South America: impacts on aquaculture, traceability and biodiversity of blue mussels (Mytilus spp.). Evolution. Appl. 11, 298–311. doi: 10.1111/eva.12553
Lau J.-S., Ransangan J., Rodrigues K. F. (2018). Genetic diversity and population structure of the Asian green mussel (Perna viridis) in the waters of Sabah, Malaysia based on mitochondrial DNA D-loop sequences. Turkish J. Fish. Aquat. Sci. 18, 109–117. doi: 10.4194/1303-2712-v18_1_12
Laxmilatha P. (2013). A review of the green mussel Perna viridis fishery of South West coast of India. Int. J. Mar. Sci. 3, 408–416. Available at: http://eprints.cmfri.org.in/9658/.
Laxmilatha P., Rao G. S., Patnaik P., NageshwaraRao T., Prasad Rao M., Dash B. (2011). Potential for the hatchery production of spat of the Asian green mussel Perna viridis (Linnaeus 1758). Aquaculture 312 (1-4), 88–94. doi: 10.1016/j.aquaculture.2010.12.031
Leigh J., Bryant D. (2015). PopART: full-feature software for haplotype network construction. Methods Ecol. Evol. 6, 1110–1116. doi: 10.1111/2041-210X.12410
Lesack K., Naugler C. (2011). An open-source software package for performing Bonferroni and related corrections for multiple comparisons. J. Pathol. Inf. 2, 52. doi: 10.4103/2153-3539.91130
Lin G., Lo L. C., Yue G. H. (2012). Genetic variations in populations from farms and natural habitats of Asian green mussel, Perna viridis, in Singapore inferred from nine microsatellite markers. J. World Aquacul. Soc. 43 (2), 270–277. doi: 10.1111/j.1749-7345.2012.00558.x
Longhurst A. R. (2007). Ecological geography of the Sea. 2nd ed. (Academic Press), ISBN: 9780080465579ISBN 978-0-12-455521-1.
Mantooth S., Riddle B. (2011). Molecular biogeography: the intersection between geographic and molecular variation. Geogr. Compass 5, 1–20. doi: 10.1111/j.1749-8198.2009.00297.x
McFarland K., Donaghy L., Volety A. (2013). Effect of acute salinity changes on hemolymph osmolality and clearance rate of the non-native mussel, Perna viridis, and the native oyster, Crassostrea virginica, in Southwest Florida. Aquat. Invasions. 8, 299–310. doi: 10.3391/ai.2013.8.3.06
Micklem J. M., Griffiths C. L., Ntuli N., Mwale M. (2016). The invasive Asian green mussel Perna viridis in South Africa: all that is green is not viridis. Afr. J. Mar. Sci. 38, 207–215. doi: 10.2989/1814232X.2016.1180323
Miller M. P. (2005). Alleles in space (AIS) - computer software for the joint analysis of interindividual spatial and genetic information. J. Heredity 96 (6), 722–724. doi: 10.1093/jhered/esi119
Moore R. C. (1969). “Treatise on invertebrate paleontology,” in Mollusca 6 - Bivalvia. Ed. Part N. (The Geological Society of America, Inc., and The University of Kansas). Availabe at: http://paleo.ku.edu/treatise2/parts/n12.html.
Moura R. L., Amado-Filho G. M., Moraes F. C., Brasileiro P. S., Salomon P. S., Mahiques M. M., et al. (2016). An extensive reef system at the Amazon River mouth. Sci. Adv. 2 (4), e1501252. doi: 10.1126/sciadv.1501252
Nguyen V. X., Detcharoen M., Tuntiprapas P., Soe-Htun U., Sidik J. B., Harah M. Z., et al. (2014). Genetic species identification and population structure of Halophila (Hydrocharitaceae) from the Western Pacific to the Eastern Indian Ocean. BMC Evolution. Biol. 14, 92. doi: 10.1186/1471-2148-14-92
NOAA (n/d) Large Marine Ecosystems - Bay of Bengal. Available at: http://na.nefsc.noaa.gov/lme/text/lme34.htm.
Ong C. C., Yusoff K., Yap C. K., Tan S. G. (2009). Genetic characterization of Perna viridis L. @ in peninsular Malaysia using microsatellite markers. J. Genet. 88 (2), 153–163. Available at: https://link.springer.com/article/10.1007/s12041-009-0023-0.
Peakall R., Smouse P. E. (2012). GenAlEx 6.5: genetic analysis in Excel. population genetic software for teaching and research - an update. Bioinformatics 28, 2537–2539. doi: 10.1093/bioinformatics/bts460
Periasamy R., Ingole B., Meena R. M. (2017). Phylogeny and genetic variation within population of Tachypleus gigas (Müller 1785). Curr. Sci. 112 (10), 2029–2033. doi: 10.18520/cs/v112/i10/2029-2033
Porter T. M., Hajibabaei M. (2018). Scaling up: a guide to high-throughput genomic approaches for biodiversity analysis. Mol. Ecol. 27, 313–338. doi: 10.1111/mec.14478
Pourmozaffar S., Jahromi S. T., Rameshi H., Sadeghi A., Bagheri T., Behzadi S., et al. (2020). The role of salinity in physiological responses of bivalves. Rev. Aquacul. 12, 1548–1566. doi: 10.1111/raq.12397
Prakoon W., Tunkijjanukij S., Nguyen T. T. T., Na-Nakorn U. (2010). Spatial and temporal genetic variation of green mussel, Perna viridis in the Gulf of Thailand and implication for aquaculture. Mar. Biotechnol. 12 (5), 506–515. doi: 10.1007/s10126-009-9234-x
Rainville L., Lee C. M., Arulananthan K., Jinadasa S. U. P., Fernando H. J. S., Priyadarshani W. N. C., et al. (2022). Water mass exchanges between the Bay of Bengal and Arabian Sea from multiyear sampling with autonomous gliders. J. Phys. Oceanog. 52 (10), 2377–2396. doi: 10.1175/JPO-D-21-0279.1
Rajagopal S., Venugopalan V., van der Velde G., Jenner H. A. (2006). Greening of the coasts: a review of the Perna viridis success story. Aquat. Ecol. 40, 273–297. doi: 10.1007/s10452-006-9032-8
Ramos-Onsins S. E., Rozas J. (2002). Statistical properties of new neutrality tests against population growth. Mol. Biol. Evol. 19, 2092–2100. doi: 10.1093/oxfordjournals.molbev.a004034
Rejeki S., Debrot A. O., van den Brink A. M., Ariyati R. W., Lakshmi Widowati L. (2020). Increased production of green mussels (Perna viridis) using longline culture and an economic comparison with stake culture on the north coast of Java, Indonesia. Aquacul. Res. 52, 373–380. doi: 10.1111/are.14900
Rozas J., Ferrer-Mata A., Sánchez-Del Barrio J. C., Guirao-Rico A., Librado P., Ramos-Onsins S. E., et al. (2017). DnaSP v6: DNA sequence polymorphism analysis of large datasets. Mol. Biol. Evol. 34, 3299–3302. doi: 10.1093/molbev/msx248
Segnini M., Chung S., Perez J. (1998). Salinity and temperature tolerances of the green and brown mussels, Perna viridis and Perna perna (Bivalvia: Mytilidae). Rev. Biología Trop. 46, 121–125. Available at: https://revistas.ucr.ac.cr/index.php/rbt/article/view/29372.
Siddall S. E. (1980). A clarification of the genus Perna (Mytilidae). Bull. Mar. Sci. 30, 858–870. Available at: https://docserver.ingentaconnect.com/deliver/connect/umrsmas/00074977/v30n4/s8.pdf?expires=1687149118&id=0000&titleid=10983&checksum=81E5BEA49ADCD5C36FEA267D63DC48EA&host=https://www.ingentaconnect.com.
Simon A., Arbiol C., Nielsen E. E., Couteau J., Sussarellu R., Burgeot T., et al. (2020). Replicated anthropogenic hybridisations reveal parallel patterns of admixture in marine mussels. Evolution. Appl. 13, 575–599. doi: 10.1111/eva.12879
Sivadas S. K., Ingole B. S. (2016). Biodiversity and biogeography pattern of benthic communities in the coastal basins of India. Mar. Biol. Res. 12:8, 797–816. doi: 10.1080/17451000.2016.1203949
Sousa R., Gutiérrez J. L., Aldridge D. C. (2009). Non-indigenous invasive bivalves as ecosystem engineers. Biol. Invasions 11, 2367–2385. doi: 10.1007/s10530-009-9422-7
Struck T. H., Feder J. L., Bendiksby M., Birkeland S., Cerca J., Gusarov V. I., et al. (2018). Finding evolutionary processes hidden in cryptic species. Trends Ecol. Evol. 33 (3), 153–163. doi: 10.1016/j.tree.2017.11.007
Suokhrie T., Saraswat R., Nigam R. (2021). Multiple ecological parameters affect living benthic foraminifera in the river-influenced west-central Bay of Bengal. Front. Mar. Sci. 8. doi: 10.3389/fmars.2021.656757
Tajima F. (1989). Statistical method for testing the neutral mutation hypothesis by DNA polymorphism. Genetics 123 (3), 585–595. doi: 10.1093/genetics/123.3.585
Toews D. P., Brelsford A. (2012). The biogeography of mitochondrial and nuclear discordance in animals. Mol. Ecol. 21 (16), 3907–3930. doi: 10.1111/j.1365-294X.2012.05664.x
Vakily J. M. (1989). The biology and culture of mussels of the genus Perna. in ICLARM studies and reviews (International Center for Living Aquatic Resources Management, Manila). Available at: https://worldfishcenter.org/publication/biology-and-culture-mussels-genus-perna.
Villesen P. (2007). FaBox: an online toolbox for fasta sequences. Mol. Ecol. Notes 7, 965–968. doi: 10.1111/j.1471-8286.2007.01821.x
Wang Y., Hu M., Wong W. H., Cheung S. G., Shin P. K. S. (2011a). Combined effects of dissolved oxygen and salinity on growth and body composition of juvenile green-lipped mussel Perna viridis. J. Shellfish Res. 30, 851–857. doi: 10.2983/035.030.0326
Wang Y., Hu M., Wong W. H., Shin P. K. S., Cheung S. G. (2011b). The combined effects of oxygen availability and salinity on physiological responses and scope for growth in the green-lipped mussel Perna viridis. Mar. pollut. Bull. 63, 255–261. doi: 10.1016/j.marpolbul.2011.02.004
Wang J., Tsang L. M., Dong Y. W. (2015). Causations of phylogeographic barrier of some rocky shore species along the Chinese coastline. BMC Evolution. Biol. 15, 15:114. doi: 10.1186/s12862-015-0387-0
Weersing K., Toonen R. J. (2009). Population genetics, larval dispersal, and connectivity in marine systems. Mar. Ecol. Prog. Ser. 393, 1–12. doi: 10.3354/meps08287
Wood A. R., Apte S., MacAvoy E. S., Gardner J. P. A. (2007). A molecular phylogeny of the marine mussel genus Perna (Bivalvia: Mytilida) based on nuclear (ITS 1 and 2) and mitochondrial (COI) DNA sequences. Mol. Phylogenet. Evol. 44, 685–698. doi: 10.1016/j.ympev.2006.12.019
Ye Y., Li J., Wu C. (2015). Genetic diversity and population connectivity of the Asian green mussel Perna viridis in South China Sea, inferred from mitochondria DNA markers. Biochem. Systemat. Ecol. 61, 470–476. doi: 10.1016/j.bse.2015.07.009
Ye Y., Senanan W., Li J., Cai H., Wu C. (2016). Genetic diversity and population structure of the Asian green mussel Perna viridis in South China Sea based on microsatellite markers. Biochem. Systemat. Ecol. 68, 135–141. doi: 10.1016/j.bse.2016.07.010
Ye Y., Yan C., Maltagliati F., Fu Z., Guo B., Xu K., et al. (2021). Weak population structure of Perna viridis in Indo-Pacific region based on nuclear and mitochondrial DNA marker. Preprint at Research Square - 1–17. doi: 10.21203/rs.3.rs-179065/v1
Zbawicka M., Gardner J. P. A., Wenne R. (2019). Cryptic diversity in smooth-shelled mussels on Southern Ocean islands: connectivity, hybridisation and a marine invasion. Front. Zool. 16, 1–12. doi: 10.1186/s12983-019-0332-y
Keywords: genetic discontinuity, lineage formation, Indo-Pacific region, Mollusca - Bivalvia, freshwater input, barrier to gene flow
Citation: Gardner JPA, Patterson J and Patterson EJK (2023) Phylogeography of the Asian green mussel, Perna viridis: pronounced regional genetic differentiation is explained by major freshwater input into the Bay of Bengal. Front. Mar. Sci. 10:1172997. doi: 10.3389/fmars.2023.1172997
Received: 24 February 2023; Accepted: 09 June 2023;
Published: 13 July 2023.
Edited by:
Anna Rita Rossi, Sapienza University of Rome, ItalyReviewed by:
Lucía Couceiro, University of A Coruña, SpainRocío Pérez-Portela, University of Barcelona, Spain
Copyright © 2023 Gardner, Patterson and Patterson. This is an open-access article distributed under the terms of the Creative Commons Attribution License (CC BY). The use, distribution or reproduction in other forums is permitted, provided the original author(s) and the copyright owner(s) are credited and that the original publication in this journal is cited, in accordance with accepted academic practice. No use, distribution or reproduction is permitted which does not comply with these terms.
*Correspondence: Jonathan P. A. Gardner, am9uYXRoYW4uZ2FyZG5lckB2dXcuYWMubno=
†ORCID: Jonathan P. A. Gardner, orcid.org/0000-0002-6943-2413
J. K. Patterson Edward, orcid.org/0000-0002-3575-6006