 Dehua Gong
 Xiaojie Cui1†
 Mingyuan Song
 Yong Tang
- 1Center for Marine Ranching Engineering Science Research of Liaoning, Dalian Ocean University, Dalian, China
- 2Collage of Marine Sciences, Shanghai Ocean University, Shanghai, China
To understand the behavior of the large yellow croaker (Larimichthys crocea) in a pen aquaculture setting, three individuals in each of two experimental groups were telemetered in meter scale by four cable-synchronized hydrophones. The ultrasound pinger system was applied to track the motion of six L. crocea for 24 h using two fixation methods, i.e., implanting tags in the abdomen (the in vivo implantation group) and hanging tags on the dorsal fin (the dorsal fin suspension group). Pingers repeated unique 62.5 kHz coded signals at 5 s intervals along with a pressure signal. The results showed that fish tagged with internal pingers took approximately 3 h longer than externally tagged fish to stabilize in their behavior, as measured by depth utilization; the horizontal movements of the test fish were mostly found outside of the fence, where the test fish performed round-trip swimming, with the least probability of appearing near the production platform and more frequent activities in the feeding areas.
1 Introduction
The large yellow croaker (Larimichthys crocea) belongs to the order of Osteicthys, Perciformes, Sciaenidae, and is a warm–temperate offshore pelagic migratory fish. Being one of the most important economic fishes in China (Wang et al., 2020), it is distributed in the South and the East China Sea, as well as southern Yellow Sea. Shallow-sea fenced farming is an emerging aquaculture method for L. crocea. This culture facility is more resistant to wind and waves, and the culture site is generally located in the outer sea area, which shares features of the natural environment, including a deep water level, high current speed, frequent water exchange, less pollution, a wide source of bait, large culture area, and plenty of space for fish activities. The L. crocea farmed in this area usually have a larger size, better color, and enhanced meat quality, and thus are more commercially welcomed than traditional net-cultured fish. There have been few studies on the activities of L. crocea in the artificial culture area. The use of ultrasonic pingers can better understand the behavioral changes of L. crocea in cages and provide data support for the optimization and improvement of artificial breeding modes.
In recent years, with the continuous optimization and improvement of cage structure and material, the techniques of deep-sea cage culture, shallow-sea cage culture, and lake cage culture have developed rapidly in practical production and application (Calado et al., 2021; Fu et al., 2021; Zhao and Dai, 2021); for example, Nile tilapia (Oreochromis niloticus), striped bass (Morone saxatilis) (Del Rio-Zaragoza et al., 2021), rainbow trout (Oncorhynchus mykiss) (Liu et al., 2021), and large yellow croaker (Han et al., 2022) can all be produced on a large scale through cage culture technology. There has been little research on the behavior tracking of L. crocea in cage culture in the shallow sea, and ultrasonic bio-telemetry technology is one method that can be used to study fish behavior, including migration, reproduction, habitat selection, seasonal movement patterns, and the relationship between fish and nets (Poddubnyi et al., 1966; Young et al., 1972; Biesinger et al., 2013).
Fish were monitored by fixing ultrasonic pingers to the fish body. Fixation methods include insertion into the stomach via injection, dorsal fin suspension, and in vivo implantation; the choice of implantation method mainly depends on the size and species of the fish and the objectives of the study (Bridger and Booth, 2003; Hussey et al., 2015). Once the ultrasonic marker has been fixed, the ultrasonic signal from the marked fish can be received by the receiver. The acquired data are processed to obtain changes in the underwater behavior of the marker fish, including swimming speed and horizontal and vertical movement positions (Juell and Westerberg, 1993). Synchronizing the time between the hydrophone and the 3D positioning of the ultrasonic landmarks to an accuracy of 2-5 m enables the more accurate determination of fish movements (Hou et al., 2019). The effects of different methods of fixing ultrasonic pingers on fish have been studied extensively(Adams et al., 1998; Anglea et al., 2003; Makiguchi and Ueda, 2009), external fixed ultrasonic markers may affect the swimming speed of some fish (Brown et al., 1999), and are more likely to be lost in the wild in complex conditions (Haynes, 1978). Immobilizing ultrasound pingers in vivo is more stable, but minimally invasive surgery increases the risk of infection and mortality in fish (Mellas and Haynes, 1985; Panther et al., 2011; Miller et al., 2014). In addition, standardized implantation techniques can improve fish survival and the retention of ultrasound pingers, and the use of sterile instruments for surgical suturing can effectively reduce the rate of infection in fish and speed up wound healing in fish implanted with ultrasound pingers (Wagner et al., 2011).
Since 2000, ultrasonic biotelemetry has developed rapidly, with improved accuracy for biolocation, increased species range, enlarged tracking range, and extended tracking durations (Wang et al., 2012; Cooke et al., 2013; Roy et al., 2014). At the same time, ultrasonic telemetry can be applied to different environmental conditions, and more and more experts and scholars have conducted detailed studies on biological and behavioral changes through ultrasonic biotelemetry. In order to determine the behavior change characteristics of L. crocea in a shallow-water culture environment, this experiment filled this gap based on the ultrasonic pinger method and calculated the swimming distance changes of L. crocea by measuring their movement depth and position, thus providing a theoretical basis for the management of L. crocea under shallow sea fences and their design optimization.
2 Materials and methods
2.1 The selection of experiment site and subjects
The experiment was carried out in a fenced area in shallow water off Da Chen Island, Taizhou, Zhejiang Province, China, with the size of the fenced area being around 80 m × 60 m × 12 m (length × width × depth) (Figure 1). In total, six L. crocea were tested, three with pingers implanted in the abdomen and the other three with pingers suspended on the dorsal fin; ultrasonic pinger could perform 24-hour diurnal tracking. At the same time, the animal-borne underwater sound recorder (AUSOMS-mini, AQUA co., Ltd., Japan, bandwidth 100 Hz to 20 kHz, sensitivity: -202 dB re 1V-μPa-1) was applied in the culture enclosure for simultaneous monitoring of underwater environmental noise. In order to study the diurnal movement patterns of L. crocea in the enclosures, the results of this experiment were analyzed in four time periods: 18:00-0:00; 0:00-6:00; 6:00-12:00; 12:00-18:00.
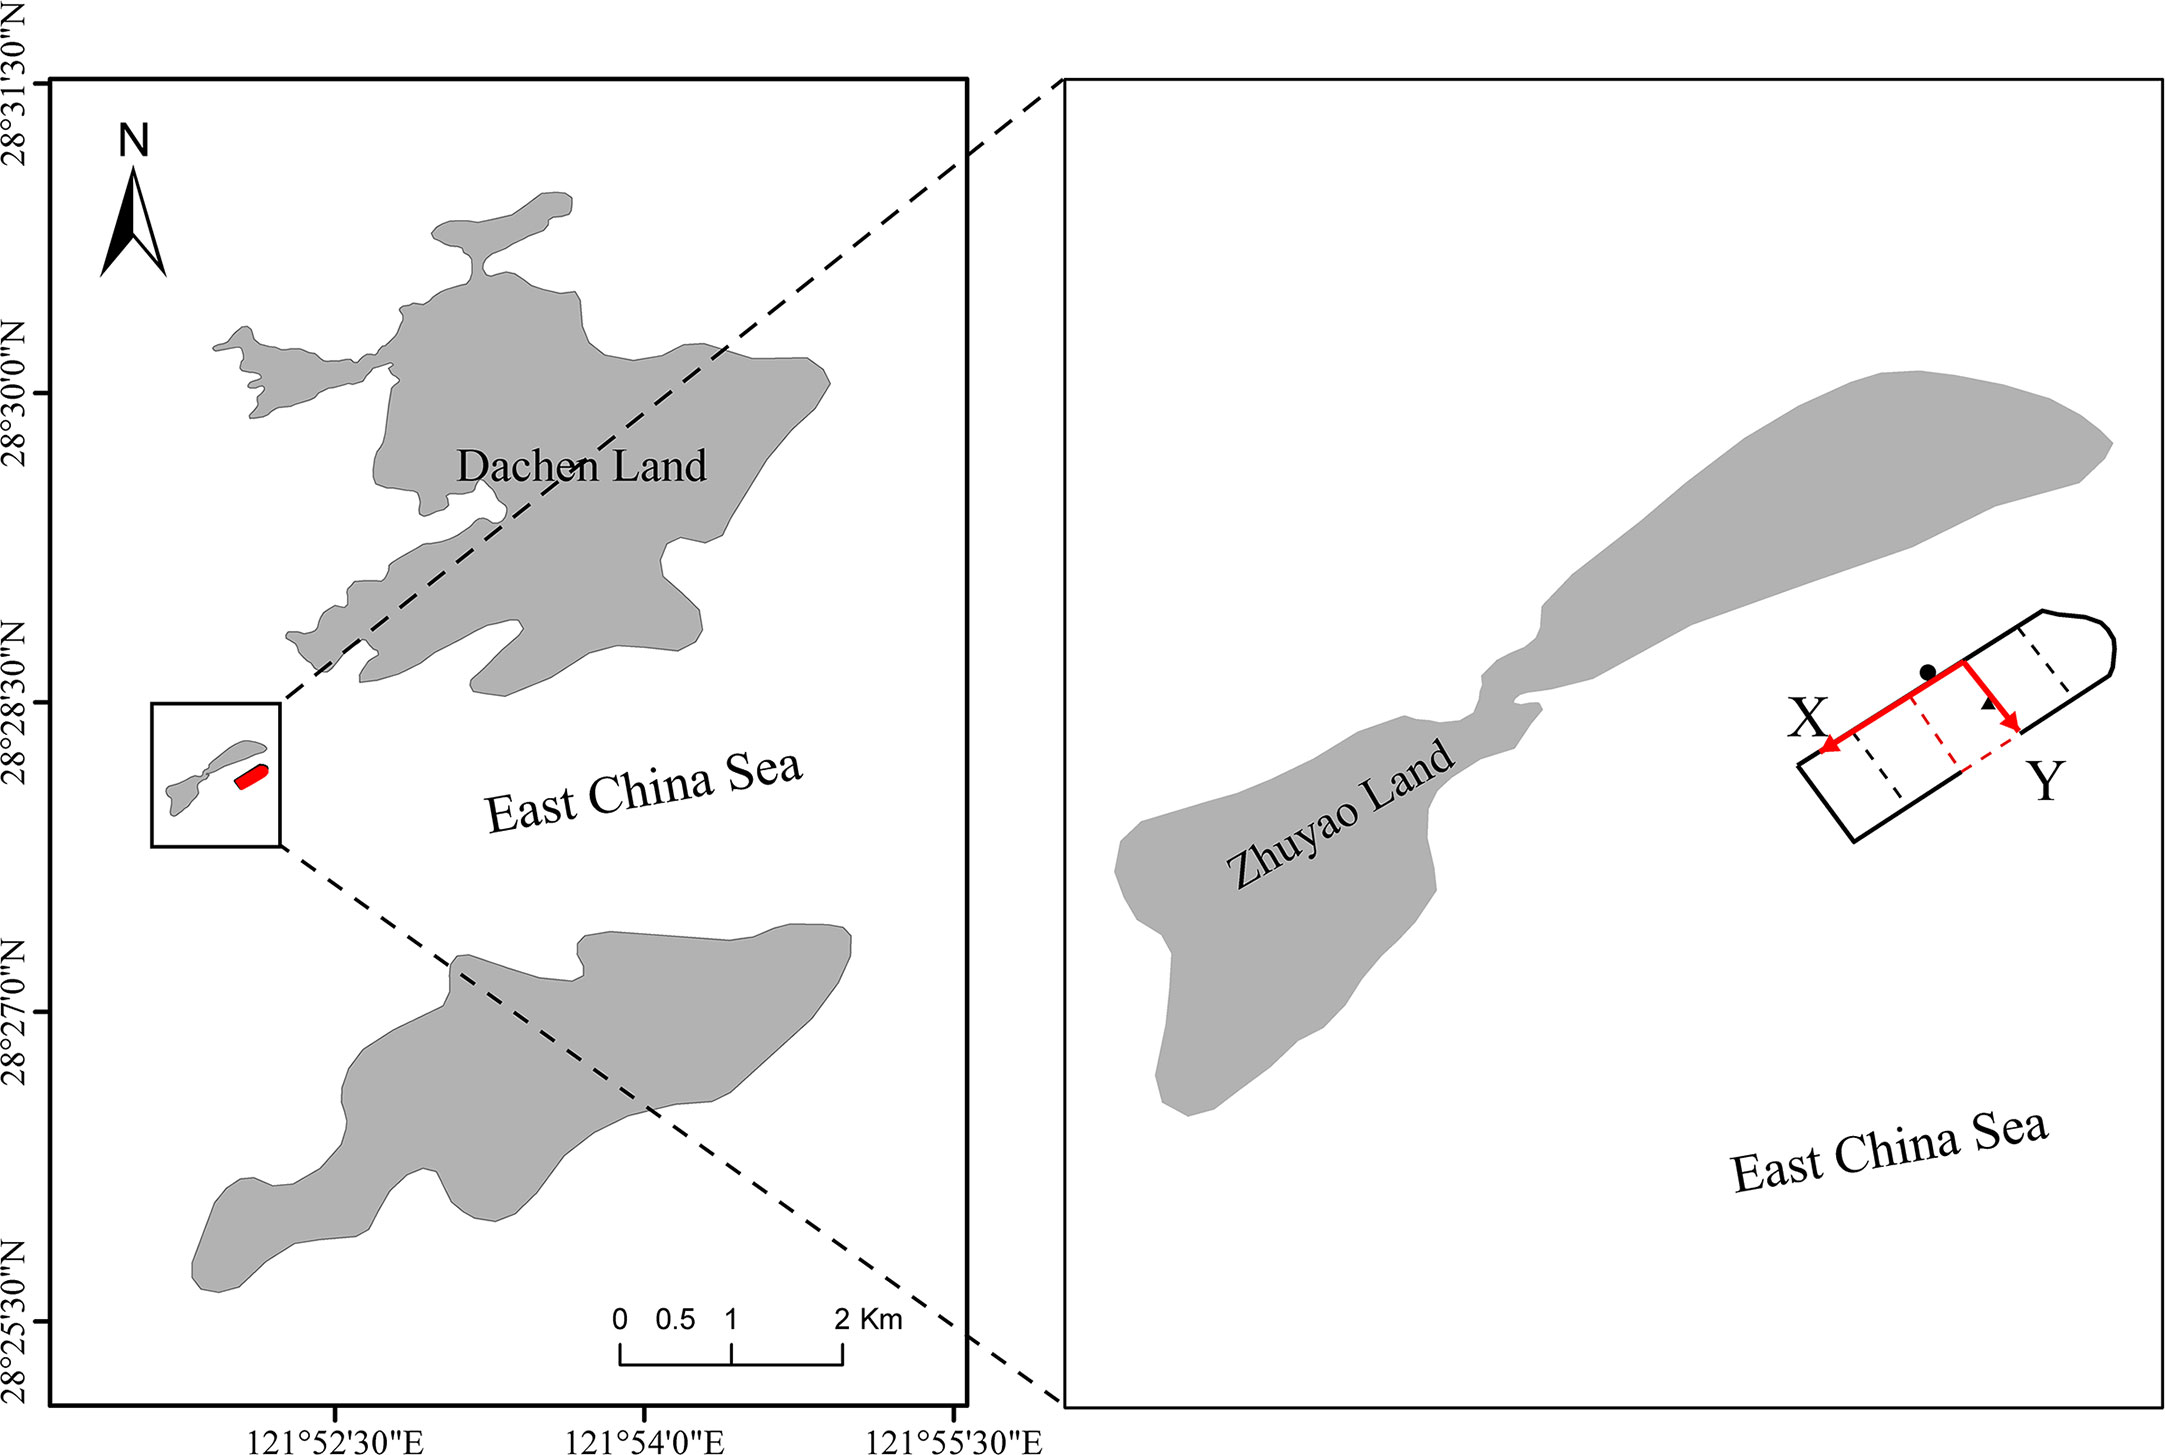
Figure 1 Large shallow sea fencing facilities in the sea near Dachen Island, Taizhou City, Zhejiang Province, China (X-axis is the production platform; Y-axis is the feeding platform; the red box indicates the ultrasonic mark coordinate setting; ● is the working position; ▲ is the feeding position).
Three L. crocea with sound health conditions were randomly selected for the surgical implantation of ultrasonic pingers in the abdomen (Figure 2A). The mass of the ultrasonic pinger was 5 g in air and almost 0 in water. The average body length of the test fish was 31.43 ± 0.74 cm, and the average body weight was 465.20 ± 13.24 g (Table 1). Before the implantation, the surgical equipment was sterilized, and the pingers were cleaned and disinfected by soaking in 75% alcohol before rinsing with distilled water to reduce adverse post-implantation irritation to the body wall. MS-222 anesthetic was added to the bucket to anesthetize the test fish, and an oxygenation pump was used to oxygenate the water during the anesthesia process. Then, minimally invasive surgery was performed to implant the ultrasonic pinger into the abdominal cavity of the L. crocea; the entire surgical suture time had to be completed within 45 s. After the ultrasonic pinger was fixed, the fish was housed in a temporary water tank to be oxygenated and resuscitated. When the normal swimming ability had recovered, they were put into the test area for experimentation. Another three L. crocea with similar health conditions to the implantation group were selected randomly, and the ultrasonic pingers were suspended around their first dorsal fin by minimally invasive surgery (Figure 2B). The average body length of the test fish was 31.47 ± 0.69 cm, and the average weight was 468.10 ± 11.68 g. The two groups of experimental fish were anesthetized with the same concentration of MS-222 during the operation, and then put into the fence after a 2-hour rest. The placement positions of the two groups of experimental fish were the same.
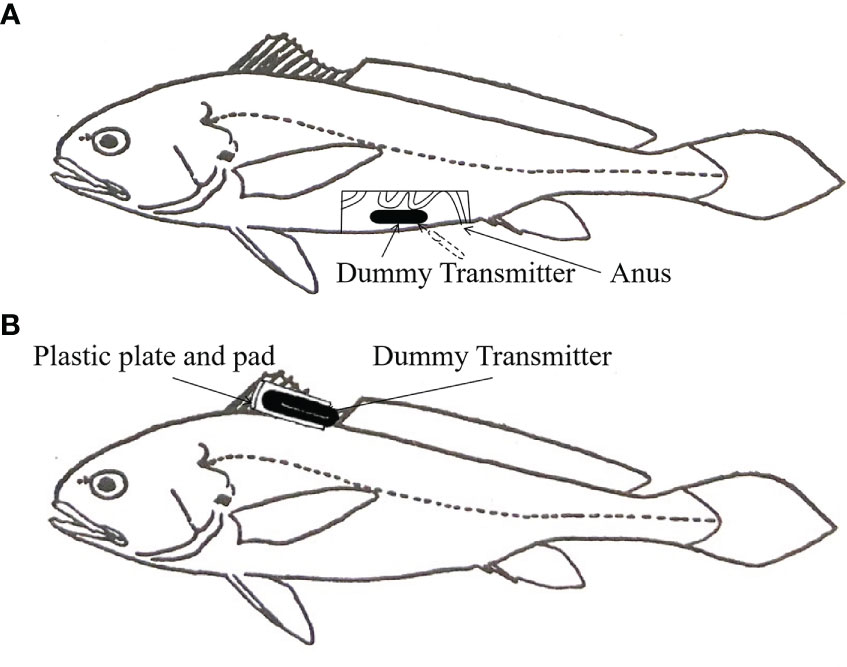
Figure 2 1/3 Schematic diagram of ultrasonic pinger fixation in L. crocea: (A) Ultrasonic pinger implantation. This fixation method uses a scalpel to scrape off the abdominal scales from the test fish and then cut open the abdominal cavity of the test fish to implant the ultrasonic pinger without destroying the abdominal organ tissues of the fish; (B) Dorsal fin suspension of the ultrasonic pinger. This fixation method uses a surgical suture to fix the ultrasonic marker near the first dorsal fin of the test fish. The plastic plate and pad have a mass of about 1 g, which weighs almost nothing in water and has a negligible effect on the swimming ability of the test fish.

Table 1 The body length, weight, and beacon-to-body weight ratio of the tested L. crocea.
2.2 Ultrasonic pinger tracking system
In this test, a wired four-channel ultrasonic pinger tracking system (FRX-4002 type, FUSION, Japan) was used to track L. crocea. The pinger in the system (FPX-1030 type) was from the same company as the whole system, with external dimensions of about 35 mm in length and 10 mm in diameter. Its emitting frequency was 62.5 kHz, and the sound pressure level was 155 dB (re 1μPa at 1m) (Figure 3). At an emission interval of 5 s, its battery life would be 5 days. Phase modulation coding of the emitted acoustic wave was performed using 31-bit M-sequence pseudo-random coding; the interval for the pinger to emit the pulse acoustic wave could be adjusted using magnet switch counting (Miyamoto et al., 2011). The pulse emission interval set for this experiment was 5 s.
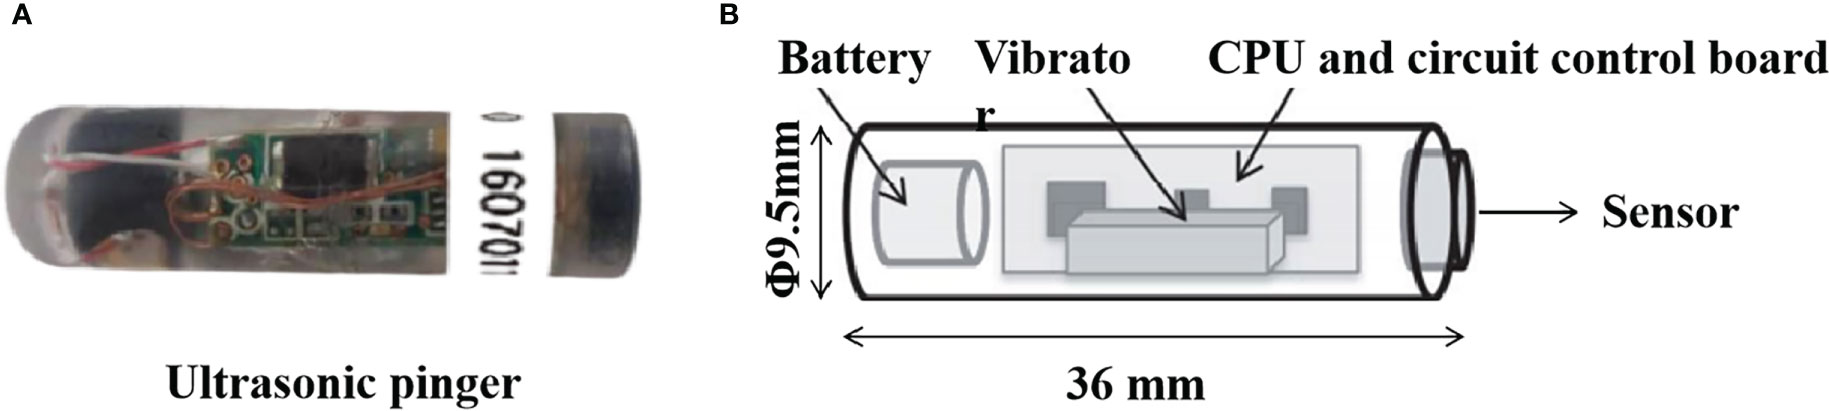
Figure 3 The FPX-1030 type of ultrasonic pinger with 62.5 kHz. (A) Actual appearance; (B) Schematic of 60 kHz FPX-1030 ultrasonic ping.
The pinger tracking receiving system consisted of an array of four hydrophones and a receiver (Figure 4). The hydrophones were connected to the receiver through a data line, and the receiver could receive data from the four hydrophones in real time through a computer. The four hydrophones were set at each of the corners of the fence at 2 m under water, forming a rectangular array with a length of 75.50 m (Y-axis) and a width of 48.64 m (X-axis); the time-resolved accuracy of the system was 0.05s.
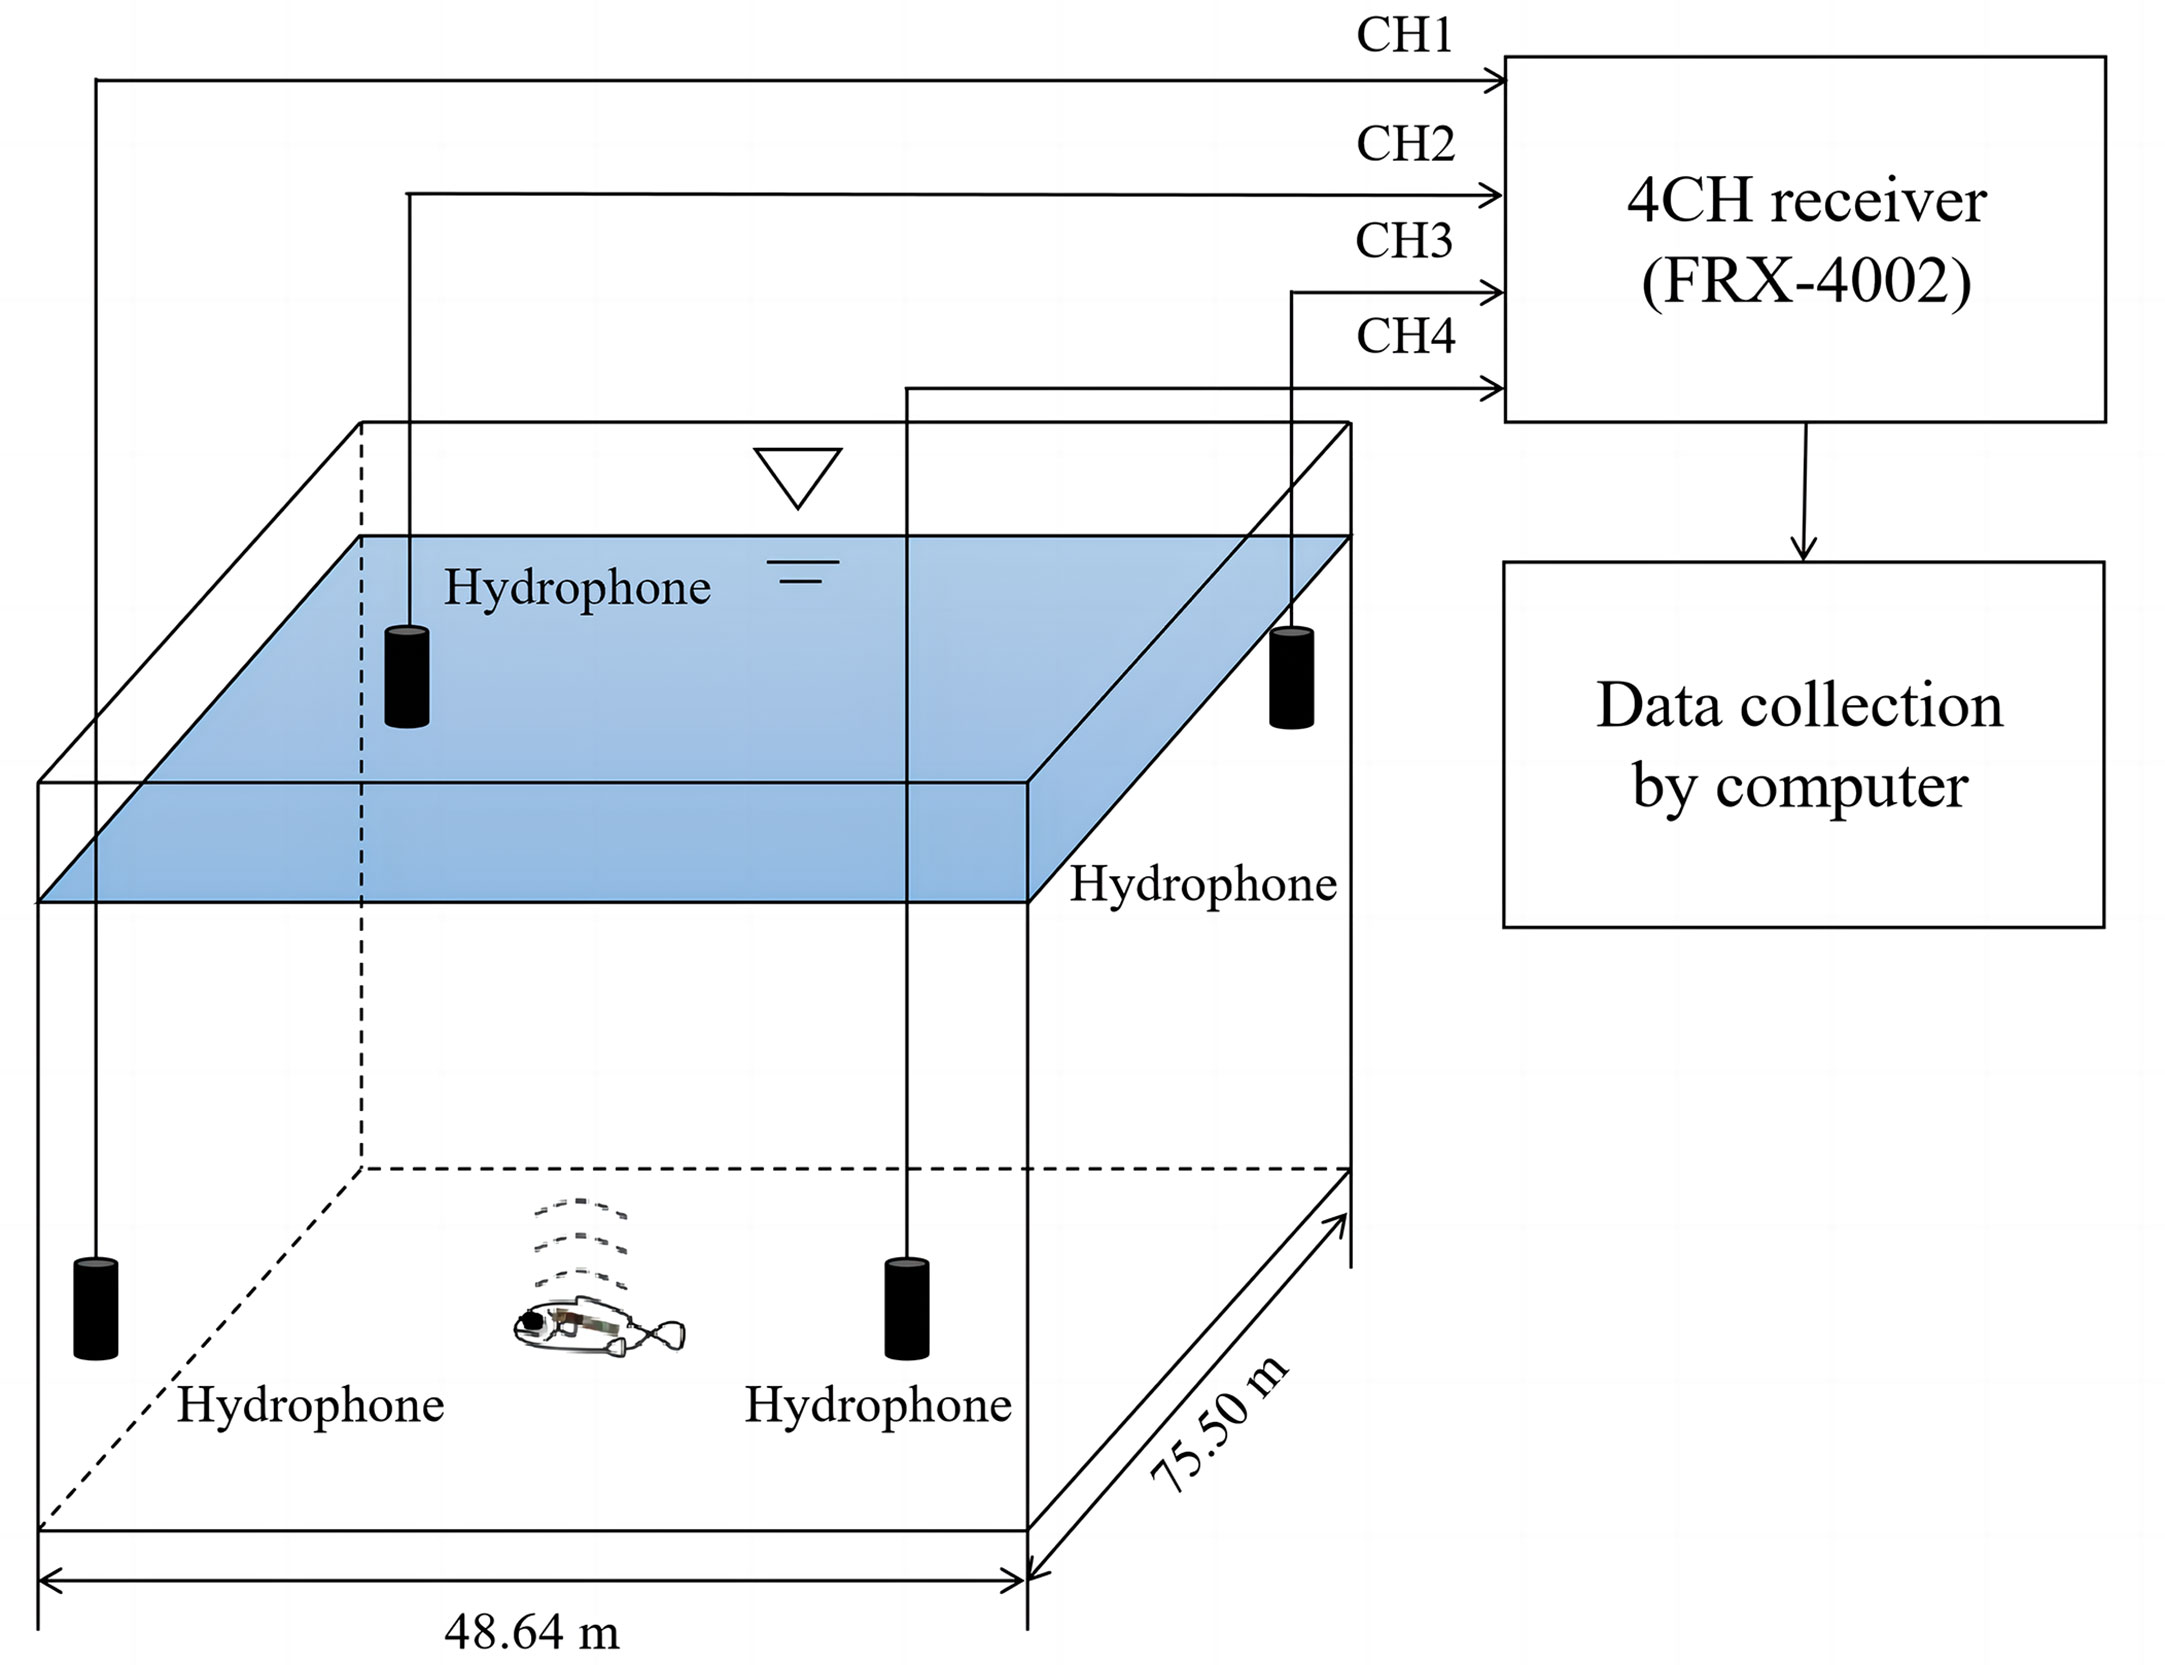
Figure 4 The FRX-4002 type of the ultrasonic pinger tracking system (4 receivers).
The underwater acoustic noise signal was collected by AQH hydrophones (sensitivity: -193 dB re 1 V μ Pa-1, Institute of Information, Kyoto University, Japan). The bandwidth of the hydrophone was 20 Hz ~ 20 kHz. The sampling frequency of 192 kHz was stored in.wav format, and American iZotope RX 8 audio analysis software was used for human ear discrimination and time domain spectrum analysis. Finally, the frequency characteristics were obtained by fast Fourier transform (FFT) through the system’s own analysis software.
2.3 Data process and analyses
The depth was measured by the mark’s own pressure (depth) sensor and was transmitted to the receiving system through a double pulse. The model for depth (d) was calculated by the formula:
Where a and b are the fitting coefficients of the pressure sensor’s depth model. These coefficients were given by the actual pressure measurements performed by the manufacturer; t represents the time interval between the actual double pulses measured in the data file.
The horizontal position was measured according to the long baseline (LBL) method combined with the least squares method(Madsen et al., 2004). The calculation is based on the time difference between ultrasonic pulse signals emitted by the ultrasonic markers reaching one hydrophone and reaching the rest of the three hydrophones (Figure 5). The calculation formula for the horizontal position is as follows:
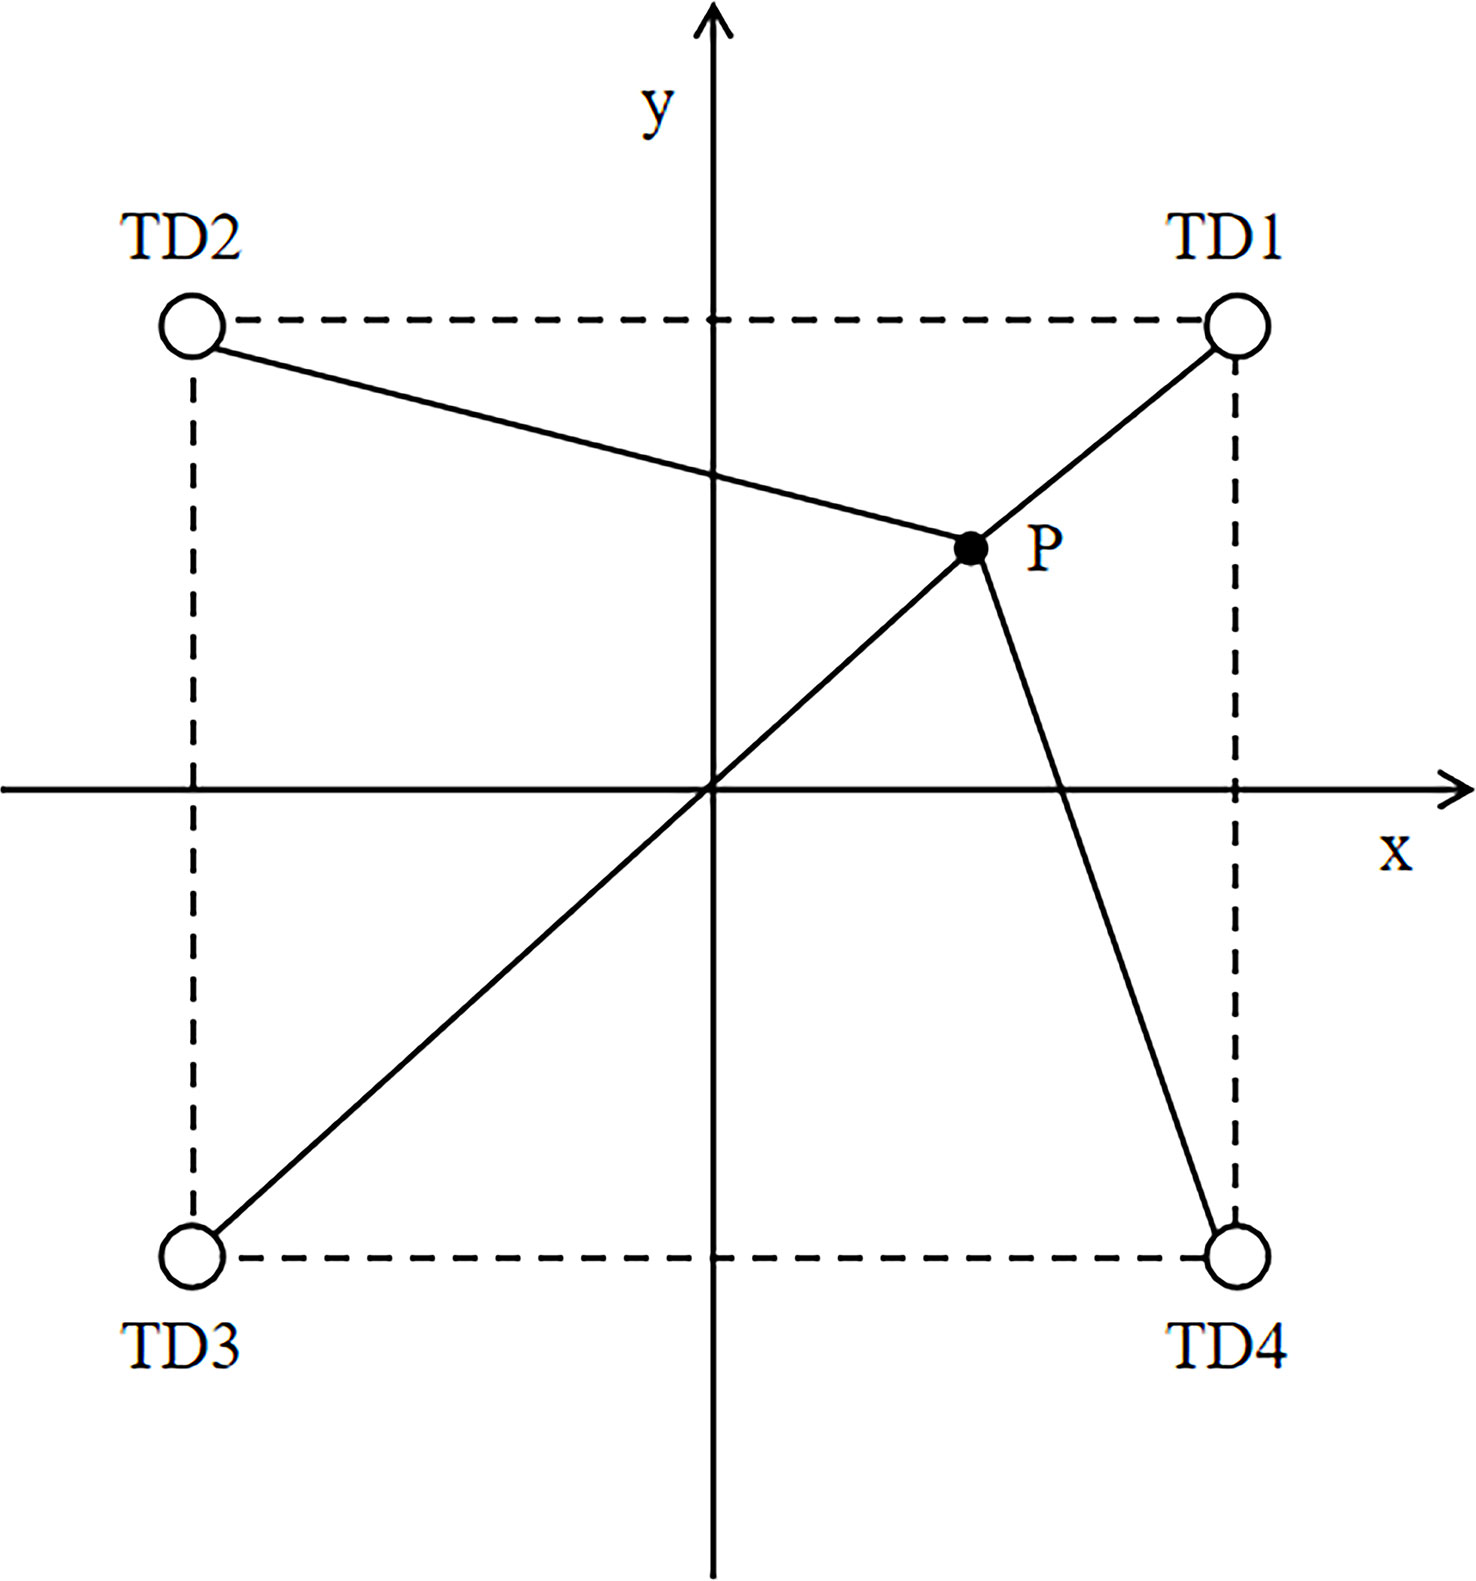
Figure 5 Position measurement system: TD1–TD4 are acoustic receivers; point P is the pinger for tracking.
Where c is the sound velocity.
In the actual measurement, the coordinates of the speculative point P1 are (xP1, yP1), and the time difference between the arrival of P1 at receivers TD2, TD3, and TD4 and the time of arrival at TD1 can be calculated using the following formula:
where Δtj is the slant distance time difference and ΔTj is the projection of Δtj on the xy plane. The difference between Δtj and ΔTj is greater than the given value δ.
In Equation (4), δ is the time difference and ϵ is the fixed value assigned to the location accuracy. The regression calculation using the Newton–Gaussian method was performed to solve for xP1 and yP1.
The swimming speed is calculated according to the relation between the change of beacon position and time (V=S/t). The test results were processed in the form of mean ± S.D., the data were analyzed by one-way ANOVA with SPSS23 software, and the significance level was set as 0.05.
3 Results and analysis
3.1 Distribution of two groups of L. crocea in the fenced area
In this experiment, the detection rate of ultrasonic signs in this test was 100%. The implantation method and the dorsal fin suspension pinger method were used for 24 h ultrasonic pinger tracking tests of L. crocea in the fenced area, and the vertical movement data of L. crocea under different fixation methods were obtained. After being placed into the fenced area, both groups of L. crocea showed substantial upward and downward behaviors in the beginning. The movement trajectories of the two groups were divided into four stages based on four time periods—18:00-24:00, 00:00-06:00, 06:00-12:00, and 12:00-18:00—which were analyzed as follows.
The 24 h vertical movement trajectory of the implantation group (Figure 6). After approximately 6 h (18:00-24:00) of release, the fish gradually stabilized. From 18:00 to 21:00, the fish moved substantially up and down at a depth of 0 m~6 m; from 21:00 to 24:00, the fish started to descend until stabilizing at a depth of 6 m~10 m under water. On the next day, from 00:00 to 04:00, the fish mainly moved around the depth of 6 m~10 m under water; from 04:00 to 11:00, the fish again showed substantial up and down snorkeling movements at a depth of 0 m~8 m under water; from 11:00 to 14:00, the fish descended to the depth of 6 m-10 m under water; from 14:00 to 18:00, the fish were moving at a depth of 2 m~10 m, with most of them moving up and down at depths of 4 m~8 m.
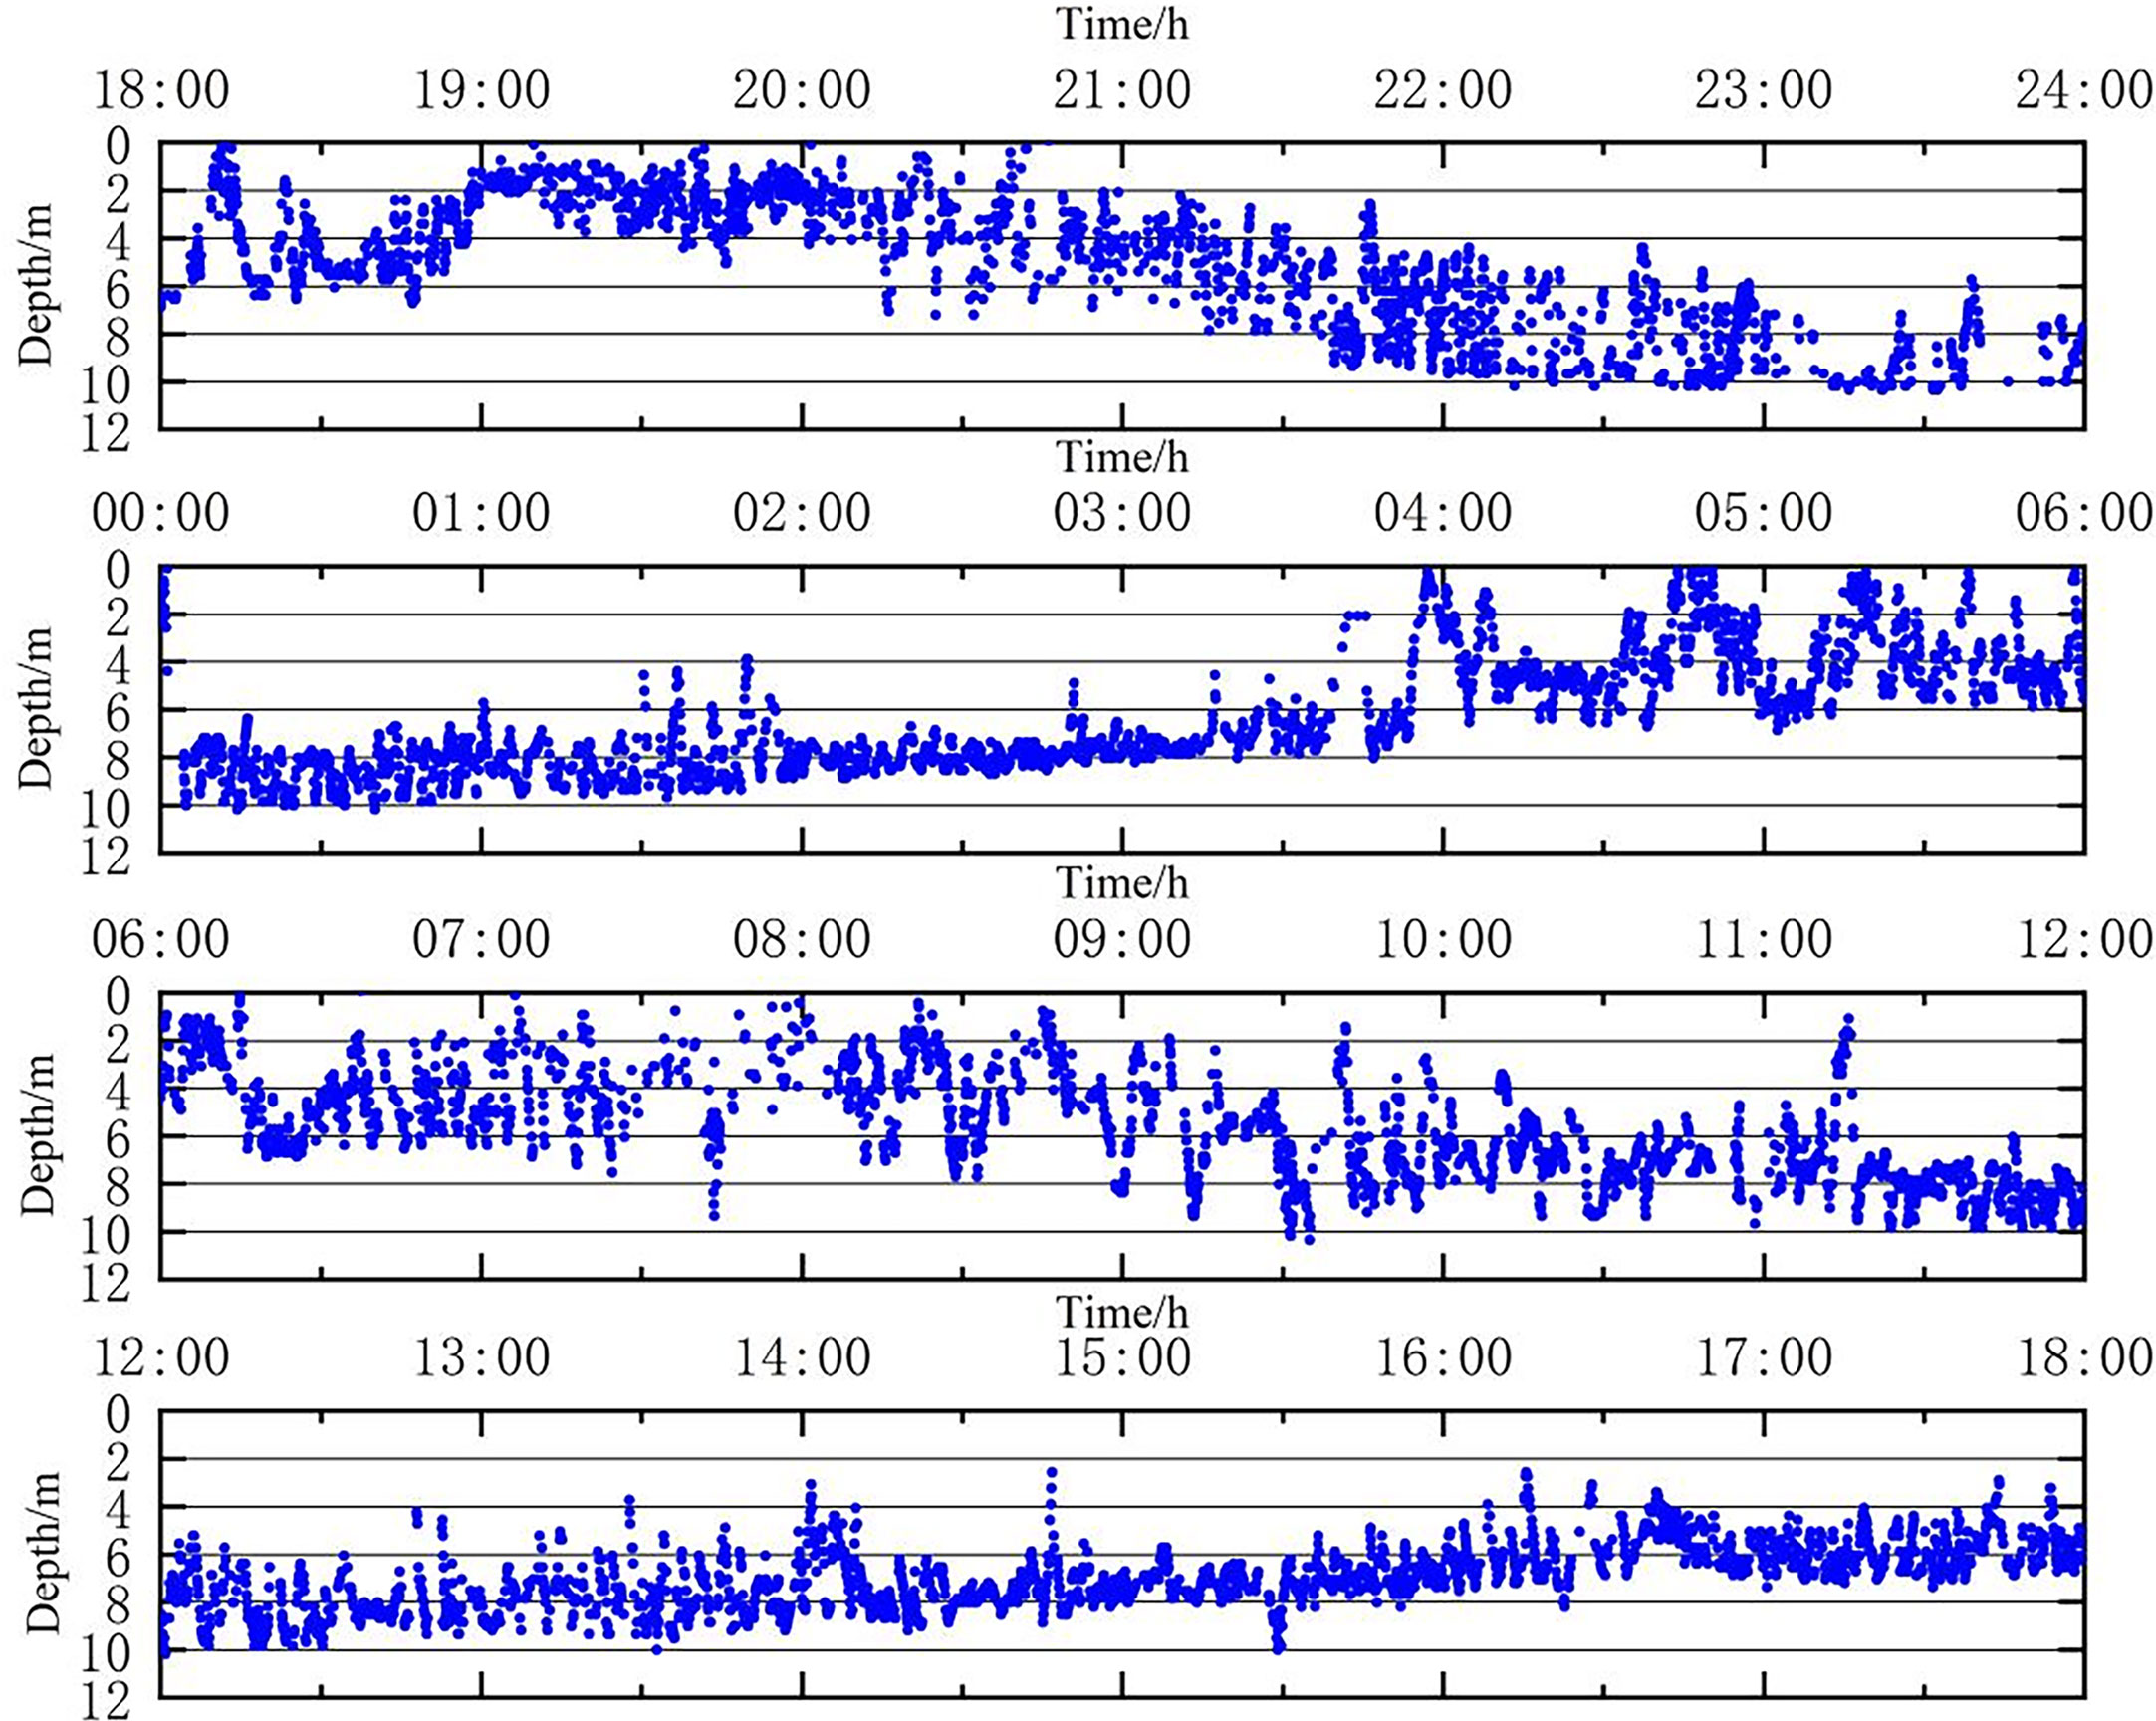
Figure 6 The 24 h vertical movement trajectory of the in vivo implantation group.
The 24 h vertical movement trajectory of the suspension group (Figure 7). After about 3 h of release, the test fish first stabilized then began to dive (18:00-21:00); from 21:00 to 22:00, the fish descended to a depth of 6-8 m. After 22:00, the test fish continued to move downward until becoming stable at a depth of 8-10 m. After 00:00 the following morning, the fish moved upward and then dived back to a depth of 8 m-10 m; from 01:00-05:00, the fish mainly moved at a depth of 4-8 m. During 05:00-09:00, the fish moved up and down significantly at a depth of 0-10 m. During 09:00-12:00, the fish moved at a depth of 2-10 m, mainly concentrating at 4-8 m for up and down snorkeling movements. From 12:00 to 15:00, the test fish continued the snorkeling movements at 2 m to 10 m under water. After 15:00, the fish stabilized again and mainly moved at 6-8 m.
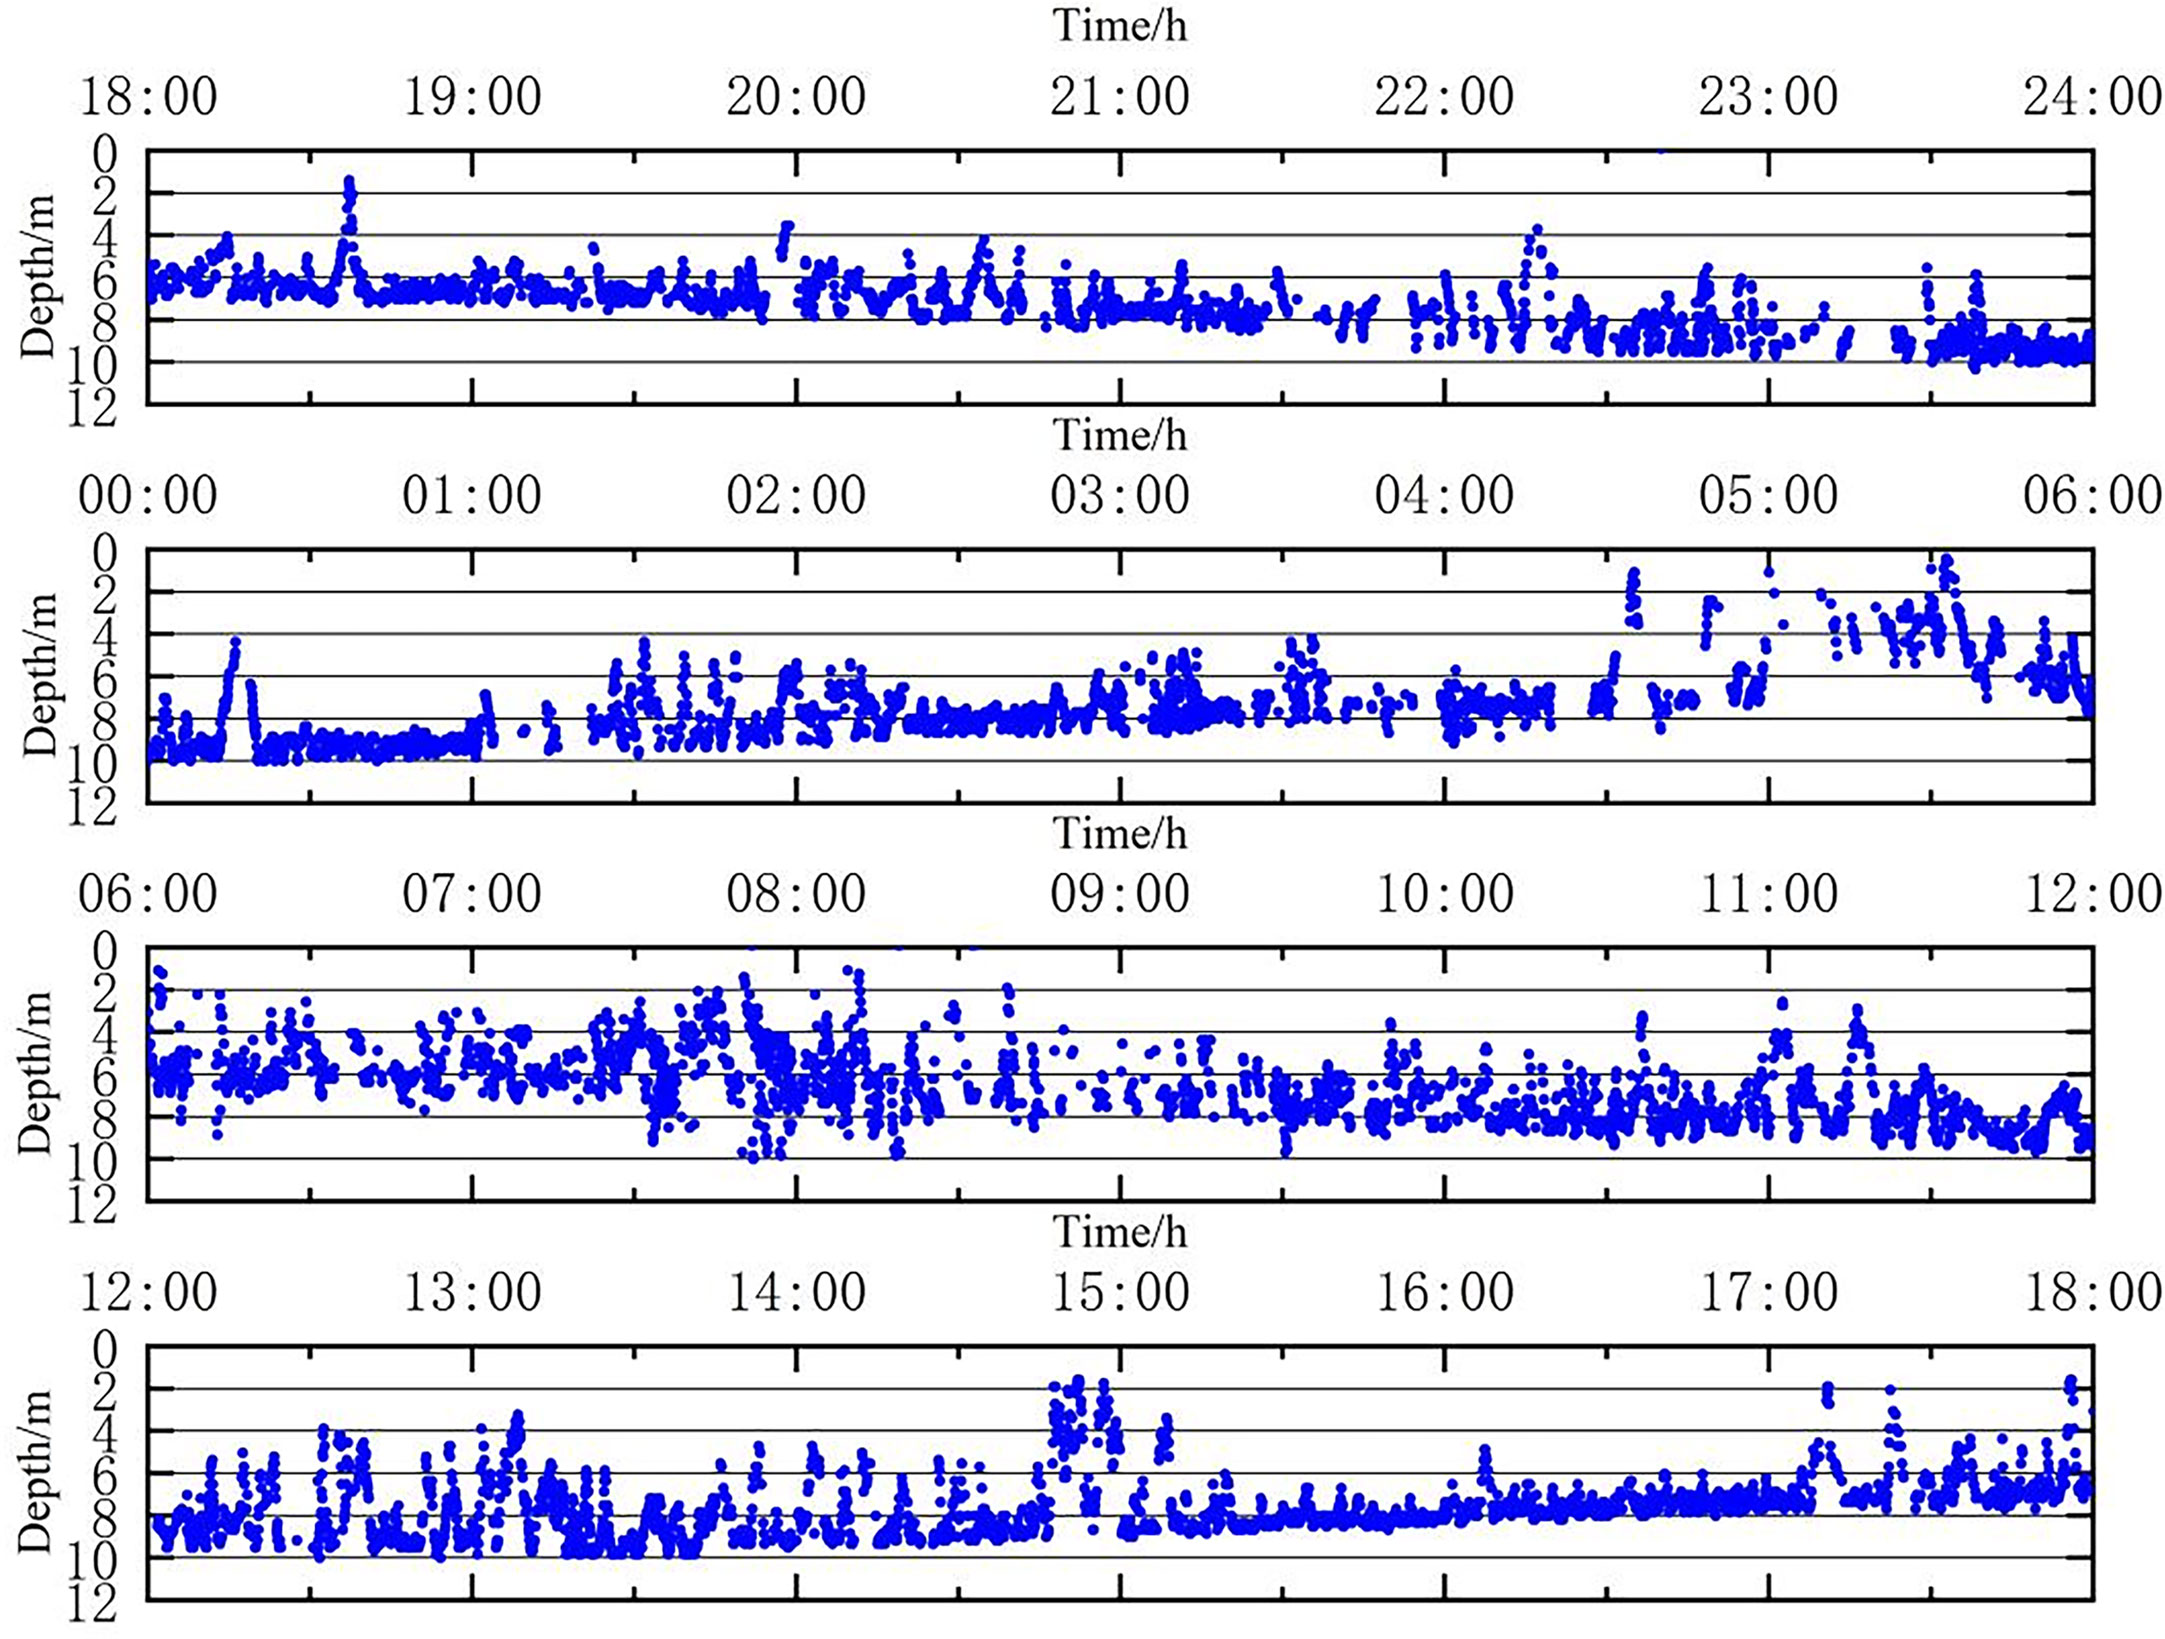
Figure 7 The 24 h vertical movement trajectory of the dorsal fin suspension group.
There was a difference in the time to stabilization between the two groups, with the suspension group taking less time to stabilize than the implantation group (p<0.05) and remaining stable at depths of 4-8 m for a longer time. For the implantation group, the primary time periods for the up and down movements were between 18:00 and 24:00 at a depth of 0-6m, and between 04:00 and 11:00 at a depth of 0-8 m the following day. In contrast, for the suspension group, the main time periods for similar movements were 05:00-09:00 at a depth of 0-10 m and 12:00-15:00 at a depth of 2-10 m. The suspension group swam up and down more frequently than the implanted group (P<0.05). The implantation group swam mainly at depths between 4 m and 10 m, while the fish in the dorsal fin suspension group swam mainly at water depths between 2 m and 10 m. Overall, both groups of L. crocea were more concentrated around 6 m.
The position data during tracking were obtained by calculating the horizontal position. The density of the scattered points reflected the emergence frequency of L. crocea, and the denser the points, the more frequent the emergence (Figure 8). From the horizontal position scatter distribution, it can be seen that when the production platform and feeding area were not in operation, the test fish in both groups exhibited irregular swimming movements inside the fenced area; when the production platform and feeding area started working, both groups appeared more frequently outside of the fenced area than inside the area (P<0.01), and they swam back and forth along the outside for a long time. The test fish were least likely to be found near the working platform and moved more frequently in the feeding area (P<0.01).
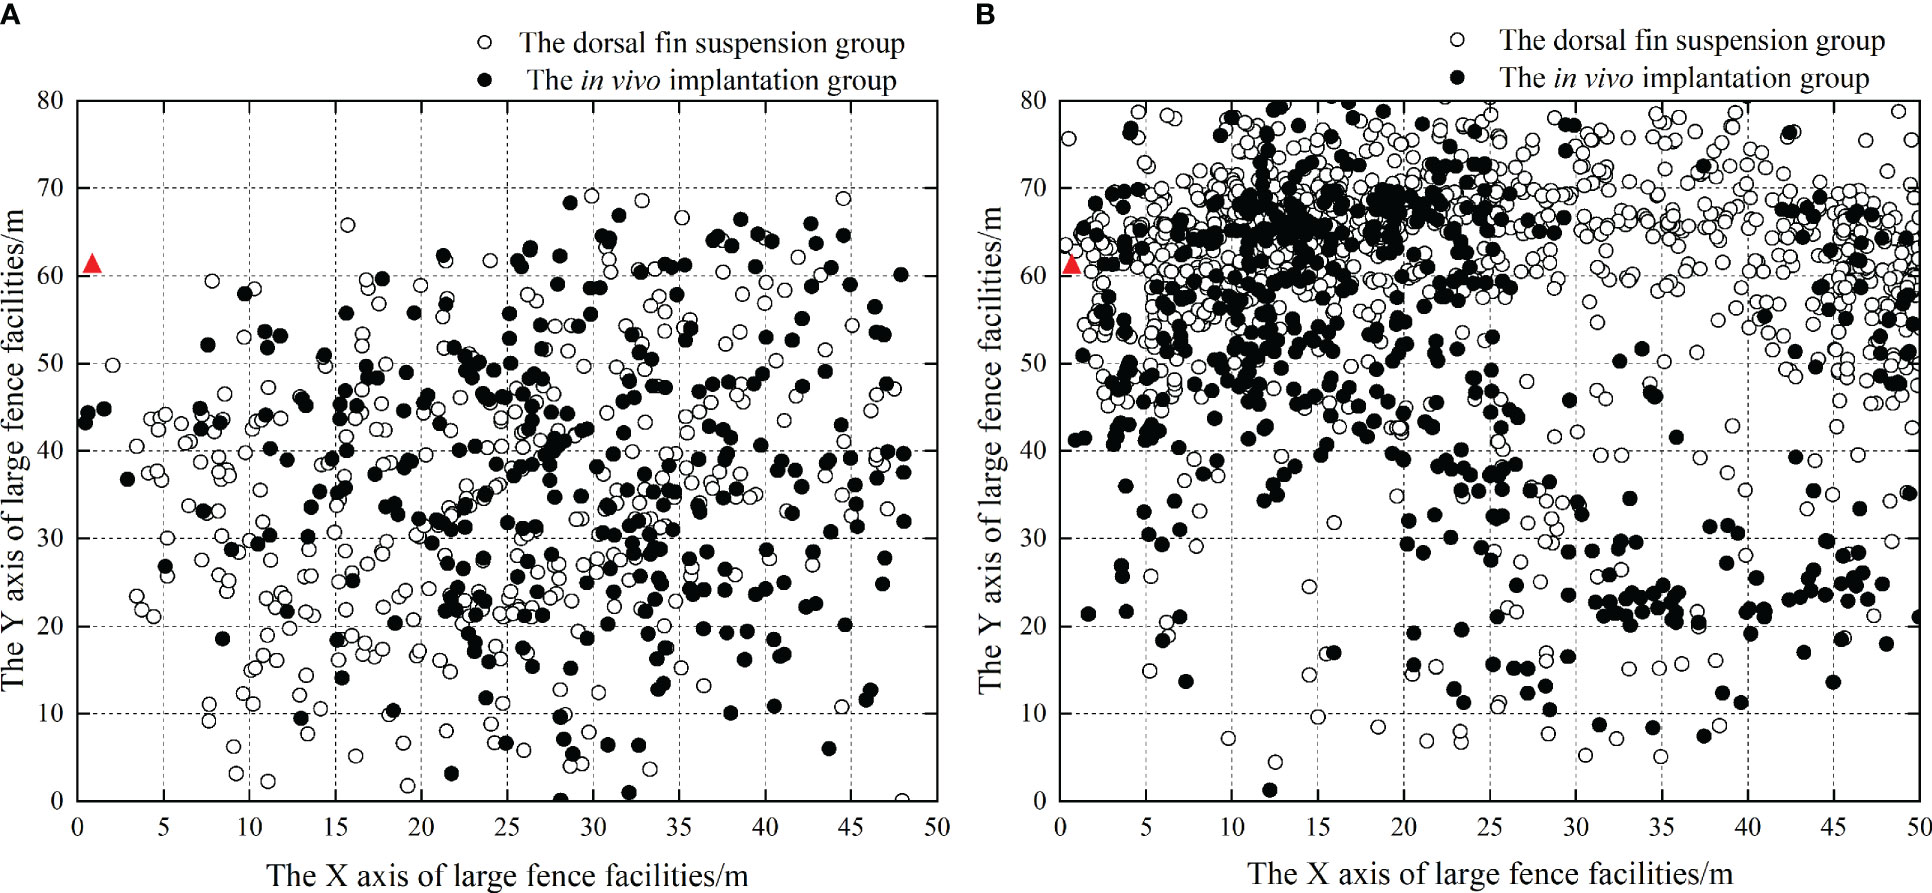
Figure 8 Horizontal distribution of L. crocea within the fenced area. (A) Schematic diagram of the horizontal distribution of two groups of experimental fish when bait was not cast in the bait casting area; (B) Schematic diagram of horizontal distribution of two groups of test fish when feeding in the feeding area; ▲ indicates the feeding position.
3.2 The average swimming speed of the L. crocea with different fixation method
The mean swimming speed of the test fish under different fixation methods was calculated based on the 24 h three-dimensional position (Figure 9). The blue and black lines represent the mean swimming speeds of the dorsal fin suspension group and the implantation group, respectively. During the first 4 h of release into the fenced area (18:00-22:00), the mean swimming speed varied within a small range between the two groups: for the suspension group, the mean speed was 24.35 ± 6.54 cm·s-1 (about 0.88 LB·s-1), and their speeds in each hour were 26.1 cm·s-1, 22.9 cm·s-1, 31.4 cm·s-1, and 17.0 cm·s-1, respectively. In contrast, in the implantation group, the mean speed was 27.78 ± 5.91 cm·s-1 (about 0.77 LB·s-1), and their speeds in each hour were 52.1 cm·s-1, 11.5 cm·s-1, 20.0 cm·s-1, and 27.5 cm·s-1, respectively. In the first 4 h, the fish in both groups freely swam in the fenced area with an average speed of less than 1 LB·s-1.
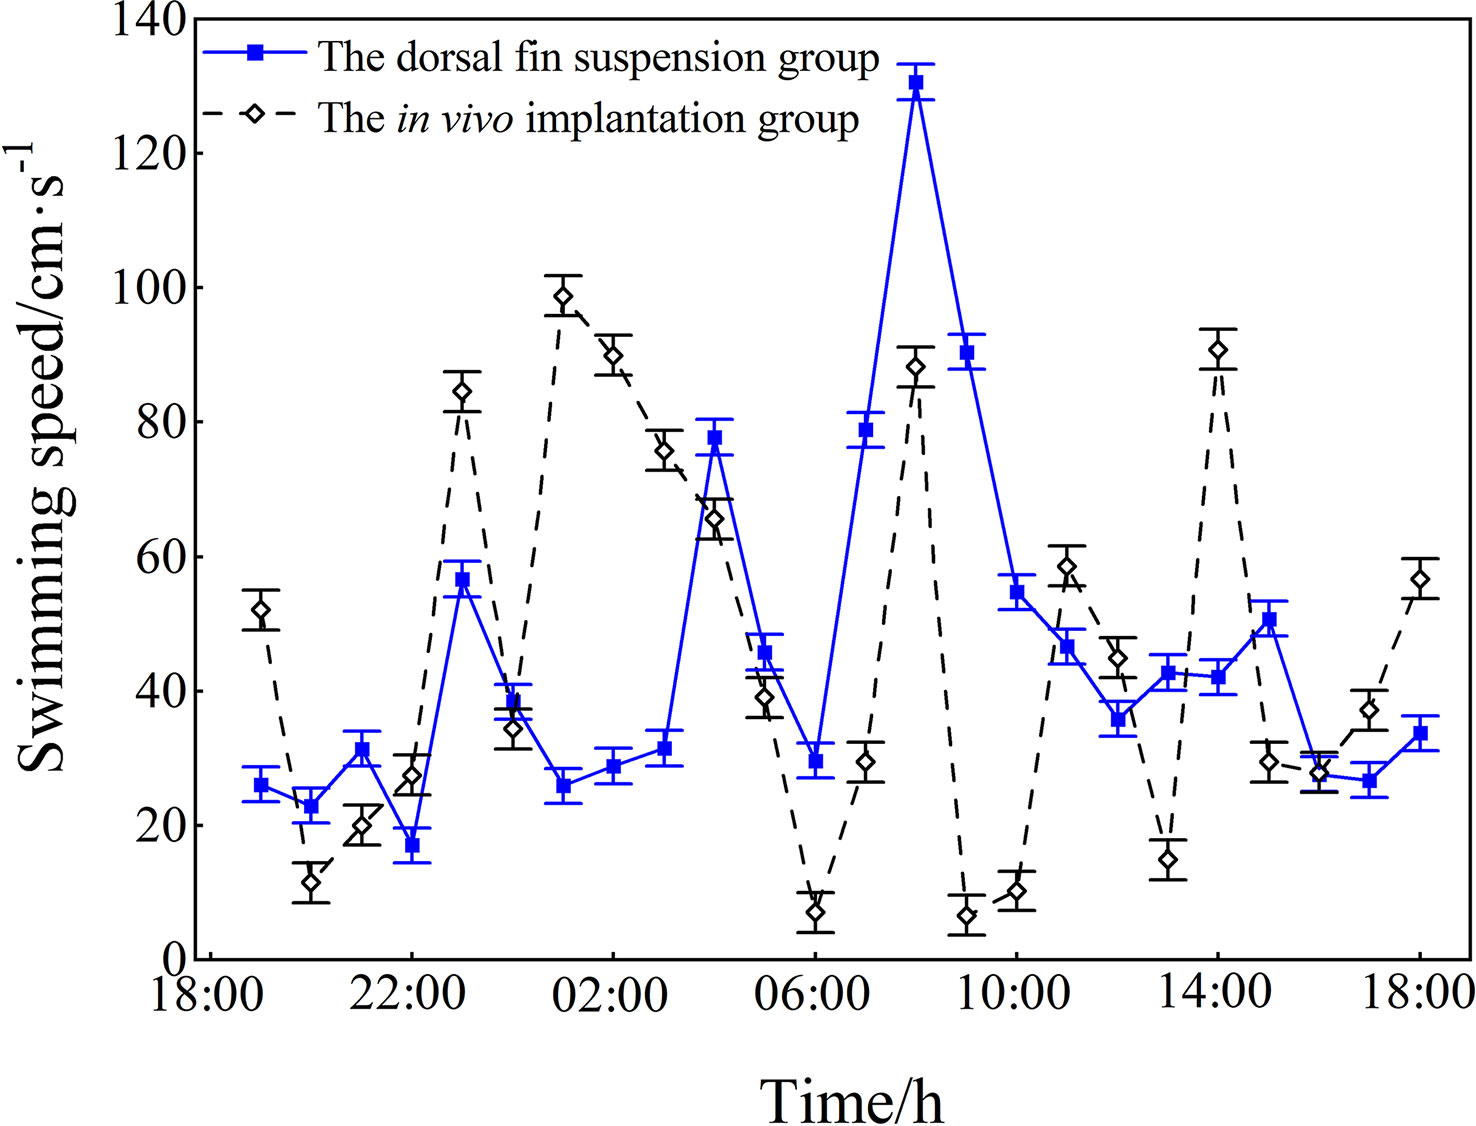
Figure 9 The mean swimming speed (mean ± SD) of the test fish under different fixation methods. The blue line represents the speed of the suspension group; the black line represents that of the implantation group.
The mean swimming speed increased significantly in both groups during the time period 22:00-02:00. At 23:00, the speed increased by 39.6 cm·s-1 (about 1.26 LB·s-1) in the suspension group and by 47.1 cm·s-1 (about 1.50 LB·s-1) in the implantation group. During 06:00-08:00, when the L. crocea foraged, the suspension group increased their mean swimming speed by 101.0 cm·s-1 (about 3.21 LB·s-1) and the implantation group increased their mean swimming speed by 81.2 cm·s-1 (about 2.58 LB·s-1), indicating significant increases for both test groups. After 08:00, the average speed of both groups began to decrease after the end of the feeding, and the two test groups were again exercising free cruising in the fenced area. The results of the 24 h tracking test on both test groups showed that the mean swimming speed was 45.5 ± 26.1 cm·s-1 (about 1.45 LB·s-1) in the implantation group and 45.5 ± 26.1 cm·s-1(about 1.45 LB·s-1) in the suspension group, with no significant effect of the different fixation methods on the swimming speed (P>0.05).
3.3 The impact of vessel noise on the behavior of the L. crocea
The use of ultrasonic beacons could better determine the behavioral changes of L. crocea in cages and provide data support for the optimization and improvement of artificial culture mode. The analysis results of the simultaneous monitoring spectrum of underwater environmental noise in the fenced area are shown in Figure 10. Based on the actual situation around the fence, the analysis of the WENZ spectrum showed that the underwater background noise in the fence mainly comprised: the swimming noise (100~400 Hz); biological sounding (500~800 Hz); the accompanying biological noise generated during feeding (50~2100 Hz); and equipment noise of the artificial operation platform in the culture area (3000~5500 Hz). When small vessels passed the fenced area, the underwater environmental noise showed changes in sound pressure level at a bandwidth of 100~2500 Hz, which might include: swimming noise (100~400 Hz) generated by the test fish after being disturbed; vessel noise with the main frequency peak at 300~500 Hz; and water surface wave noise (1000-1200 Hz) from passing ships. The sound pressure level of the underwater ambient noise increased significantly, with a real-time increase in sound pressure level of approximately 14 dB.
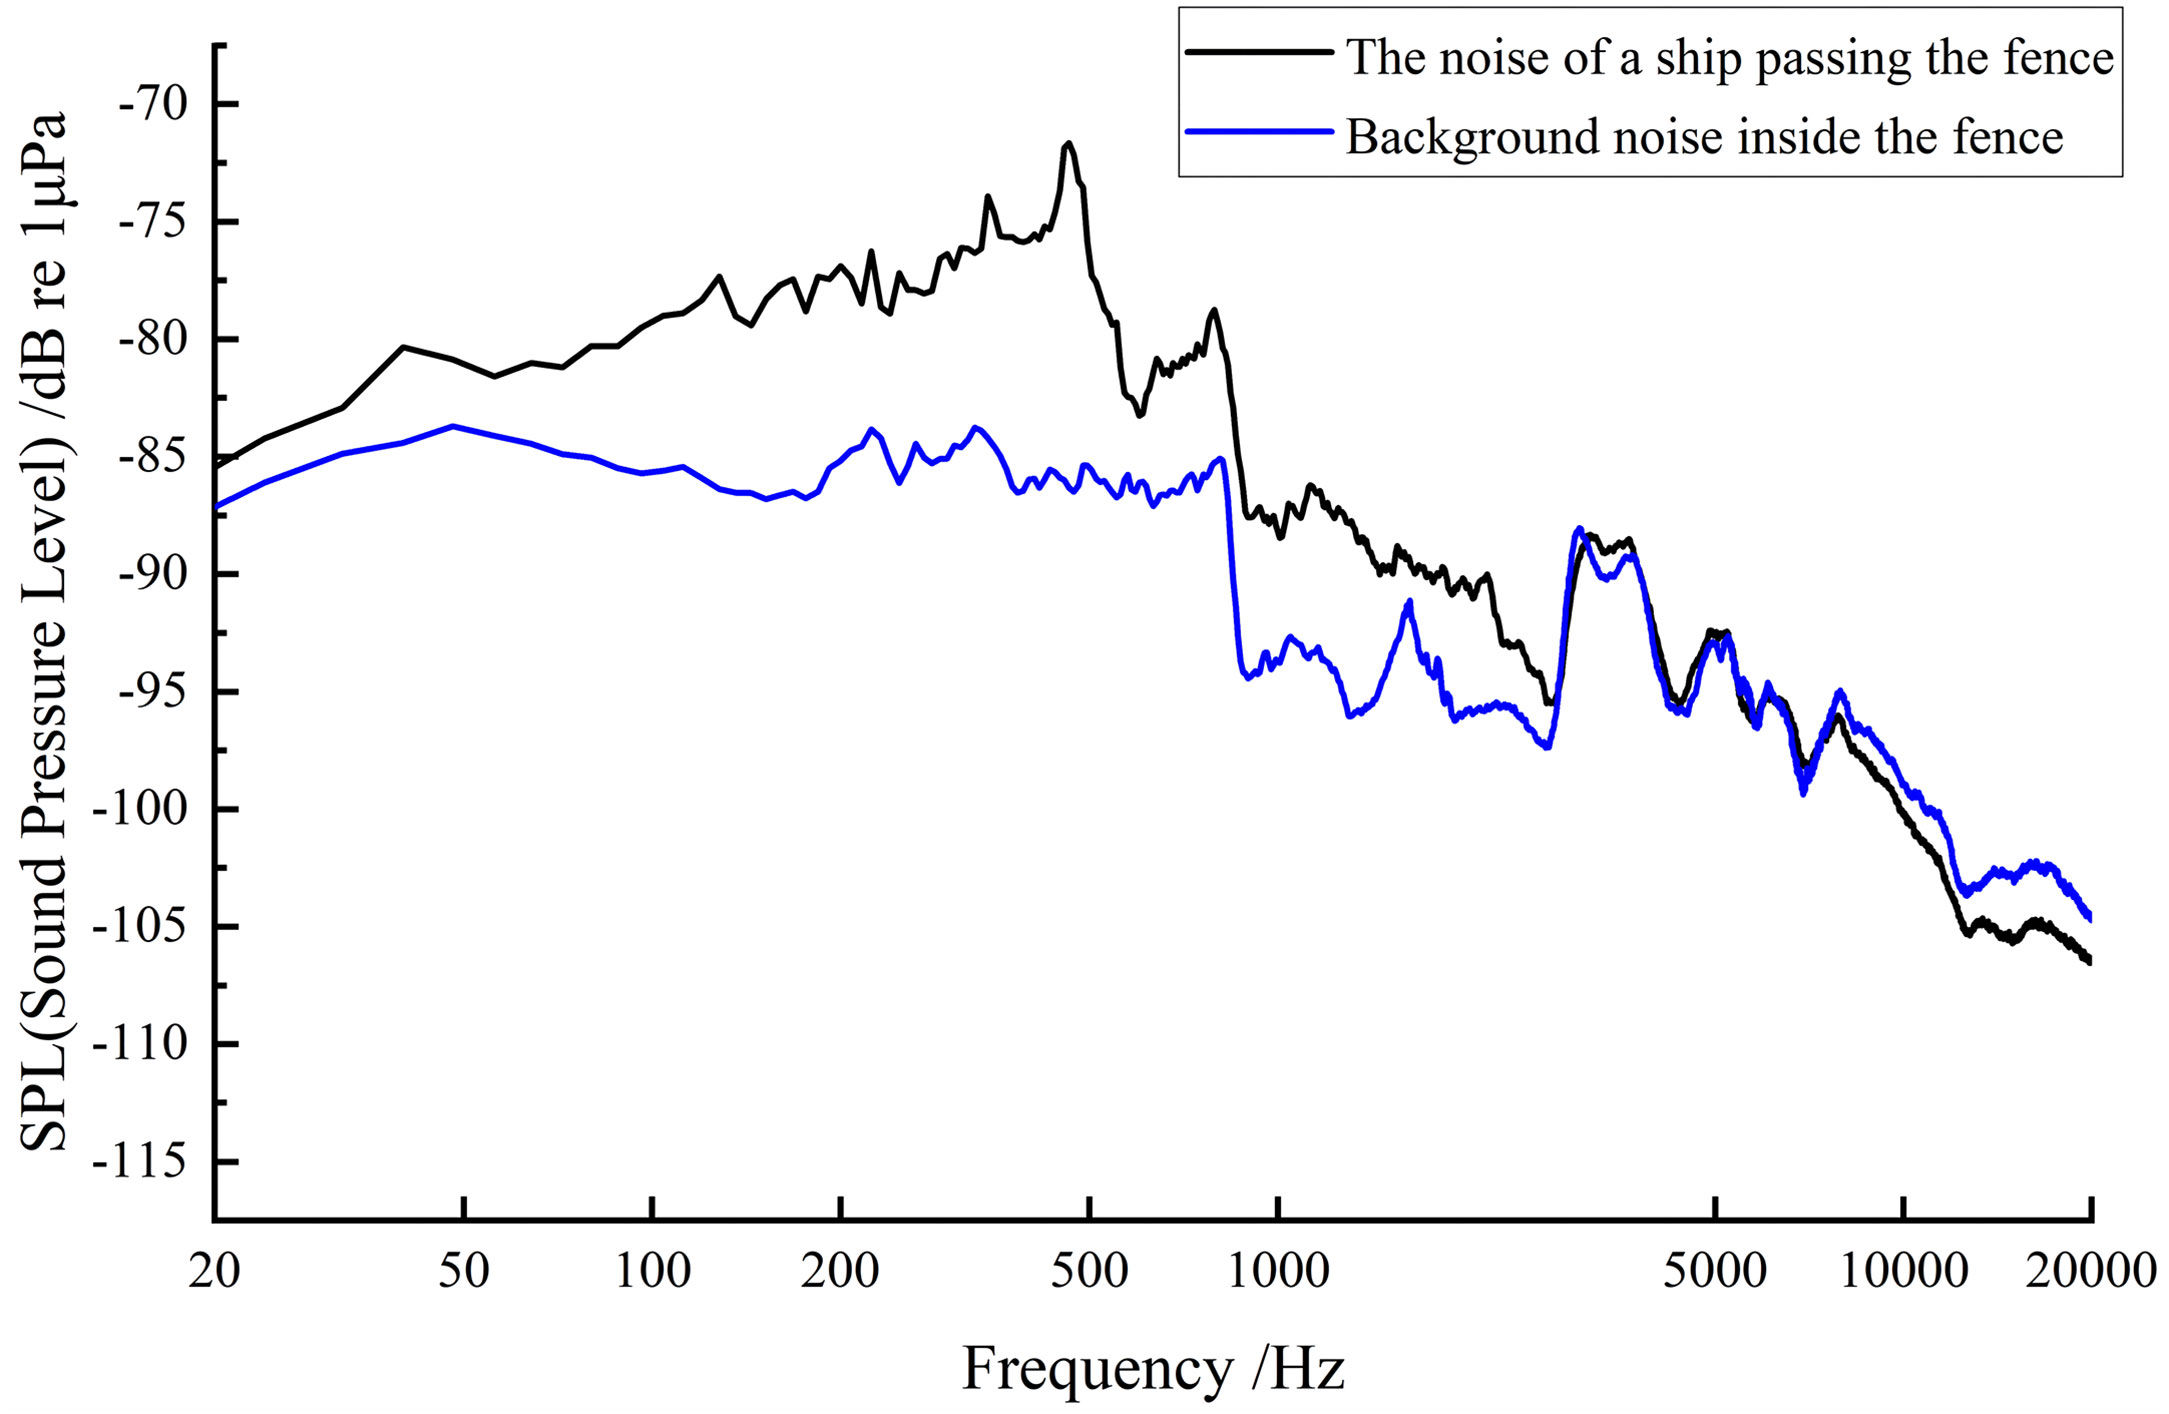
Figure 10 The noise power spectra of environmental noise within the fence and the noise when vessels passed by. The blue line is the noise power spectrum of environmental noise within the fence; the black line represents the noise power spectrum when vessels pass by.
The fish in both groups moved irregularly within the fence before the small vessels passed by. When the vessels passed by the side of the production platform, the suspension group moved back and forth, trying to swim away from the platform, with those the furthest from the noise source being the most active. For the implantation group, the fish moved towards the outer side of the fence and away from the vessel noise. They continued to move to the edge away from the fence (Figure 11). The results showed that when the vessel passed by the fence, the effect of the vessel noise on the L. crocea was significant (P<0.01), and the horizontal movement of the fish in both groups changed significantly after being exposed to vessel noise.
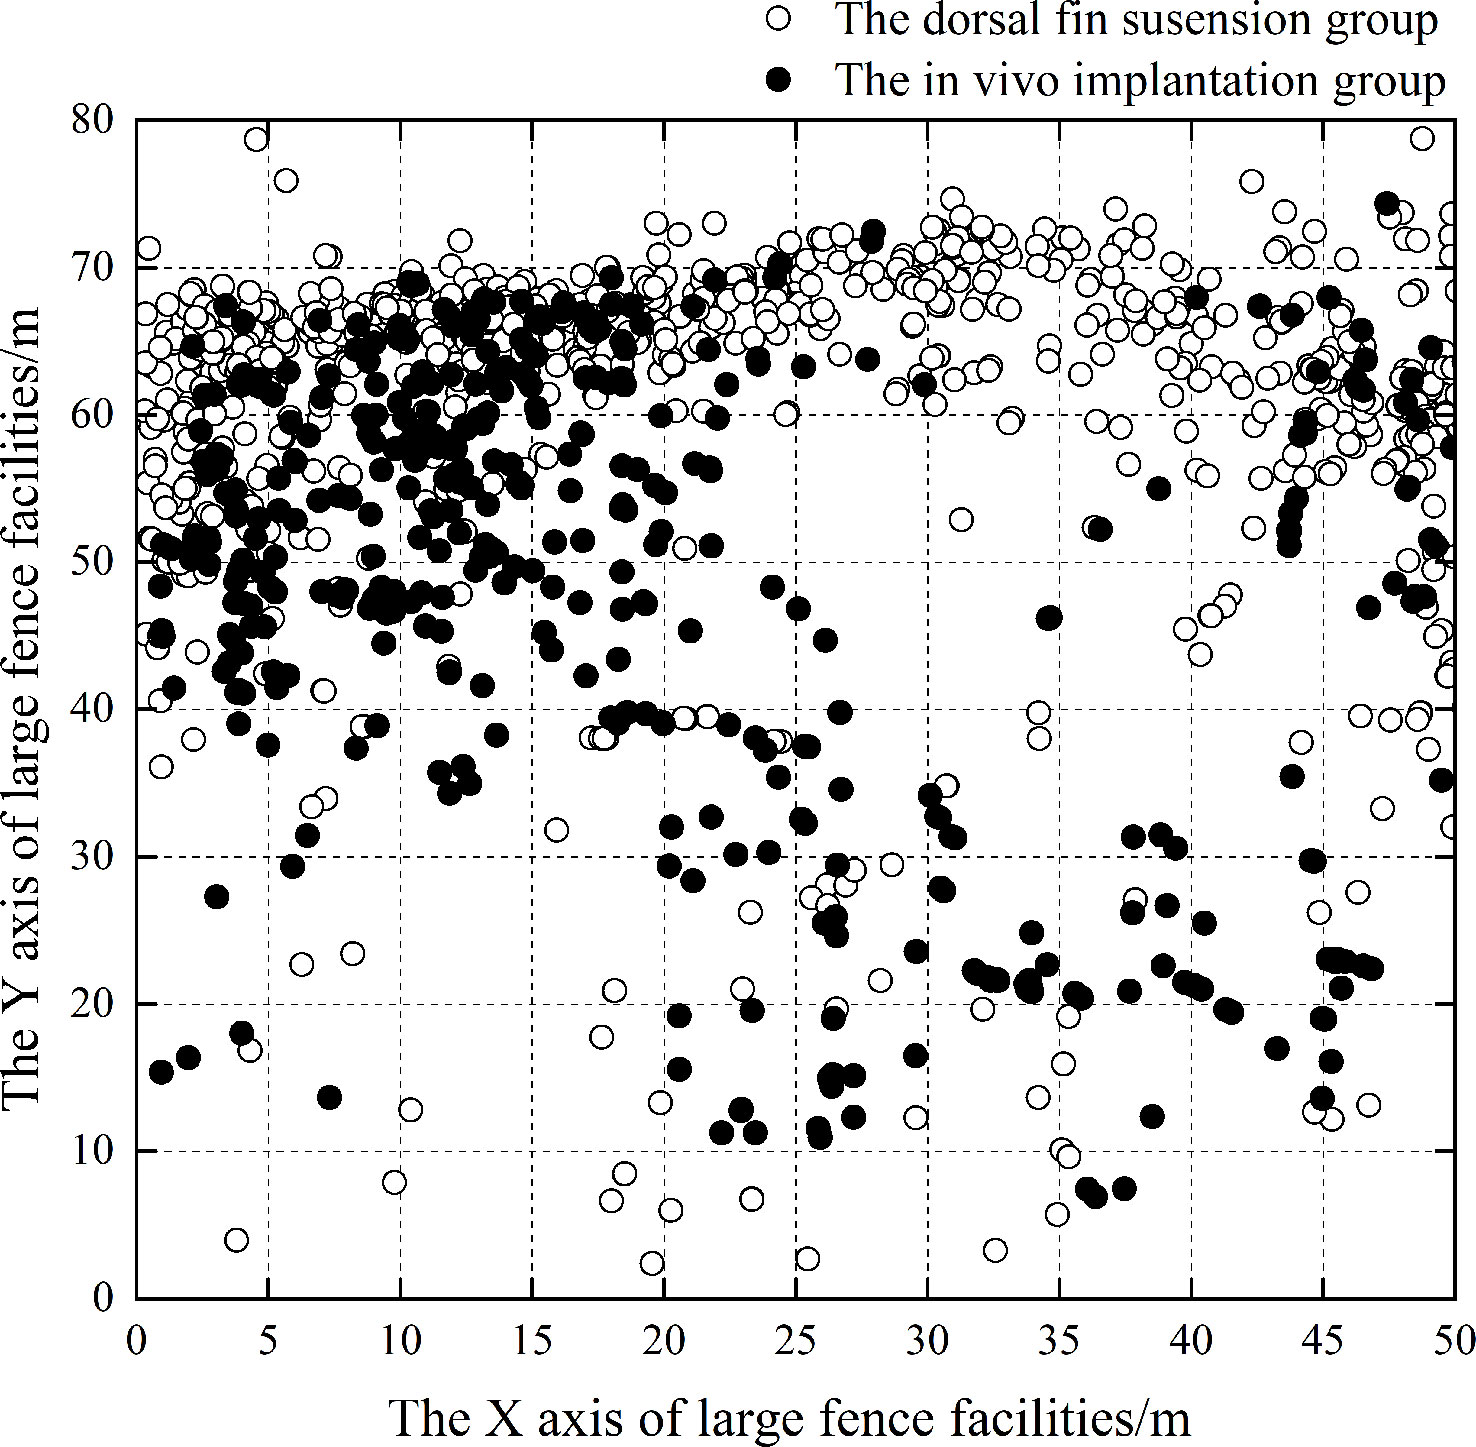
Figure 11 Horizontal distributions of L. crocea in the implantation group and the suspension group after the vessel docked. The X and Y axes of the fence facility correspond to those depicted in Figure 1, with the X-axis being the production platform and the Y-axis being the feeding platform.
4 Discussion
4.1 Effect of suturing on the body of L. crocea
In this experiment, the in vivo implantation method and the dorsal fin suspension method were used for the fixation of ultrasonic pingers. The results showed that the time required for the suspension group to enter a stable state was about 3 h less than that for the implantation group. This is because the implantation method requires a series of complex operations that may exert a greater impact on the fish including dissection, pinger implantation, and ventral suturing. Although the dorsal fin suspension method is simpler, the implantation method is still required for long-term behavioral tracking because the pingers are easily dislodged outside the fish, which is consistent with the results of Moore et al. who studied the effects of ultrasonic pinger implantation on the behavior (Moore et al., 1990) and physiology of Atlantic salmon, concluding that the surgical implantation method is most suitable for long-term studies of the target species.
Makiguchi and Ueda (2009), in comparing the effects of the in vivo implantation method and the dorsal fin suspension method on the ability of the cherry salmon (Oncorhynchus masou), noted that the test fish required 2 h of respite recovery after the in vivo implantation procedure before the test could be conducted, which is consistent with the results of this study. Therefore, in future studies, the proficiency of pinger in vivo implantation needs to be improved and a certain time needs to be allocated for post-implantation observation, so as to ensure the success of the implantation. This helps to extend the time that fish carry the pinger and to reduce the mortality of test fish due to improper test operations. Bridger and Booth (2003) used three methods for ultrasonic pinger fixation in fish: stomach implantation, dorsal fin suspension, and in vivo implantation. Their study proved that stomach implantation had the minimum negative impact on fish. In this study, only two methods, dorsal fin suspension and in vivo implantation, were used for 24 h tracking of the L. crocea. Therefore, the methods and the duration of tracking need to be improved in future studies.
The results showed that the test fish needed some time to recover after surgery, and the different methods of ultrasonic pinger implantation had no significant effect on the swimming speed. When conducting ultrasonic telemetry tests on target subjects, it is necessary to select the appropriate pinger method according to the morphological characteristics of the target subject in order to mitigate the negative effects. In order to minimize the negative effects of ultrasonic beacon on fish body, it is necessary to select appropriate ultrasonic pingers and marking method according to the morphological characteristics of target fish species in ultrasonic telemetry test (Summerfelt and Mosier, 1984; Jepsen et al., 2005; Zale et al., 2005; Panther et al., 2011; Lee et al., 2013). Implantation proficiency on the part of the experimenter is also critical, as reducing operational errors during the procedure will effectively reduce the post-operative recovery time of the experimental fish, reduce the risk of wound infection, and improve the survival rate of the fish (Cooke et al., 2003; Wagner et al., 2011).
In the future work, it is also necessary to observe the postoperative test fish, record the postoperative behavior changes of the test fish, optimize the operation plan through in-depth research, gradually improve the time of fish carrying pingers, and reduce the death of the test fish caused by improper operation of the test fish.
4.2 Behavioral changes of the L. crocea in the fenced area
Instead of moving around randomly and horizontally within the fence, the test fish tended to gather around the feeding area outside the fence; they may have been attracted by the bait in this area. In this experiment, the 24 h vertical movements of the fish in the implantation group and the dorsal fin suspension group were tracked. The findings that the implantation group mainly moved in the 4-10 m water layer, while the dorsal fin suspension group mainly moved in the 2-10 m water layer. In general, both groups mainly moved around 6 m under water, but their up and down floating frequencies differed, with the suspension group exhibiting a higher frequency from 6:00 to 12:00. During the period of 18:00-21:00, the implantation group mainly moved at 4-8 m and the suspension group mainly moved at 2-6 m. In addition, the two groups were found to move upward at both dusk and dawn, which is consistent with the biological behavior of the L. crocea. The results showed that the two fixation methods did not affect their vertical movement ability. However, there were differences in the stability of the movement.
4.3 The impact of underwater noise on L. Crocea
No matter which fixation method was adopted, the L. crocea tended to move outside of the fence when the ship passed. This is because, on the one hand, the fish have an auditory sensitivity frequency of 300~800 Hz, which makes them sensitive to low-frequency noise (Yin, 2017). The underwater noise generated by ships induced a startled escape response, and the L. crocea mainly moved to keep away from the noise. The main noise sources in this test area included equipment noise (3000~5500 Hz) from the artificial operation platform in the fenced culture area, ship noise with a main frequency peak at 300~500 Hz, and surface wave noise (1000~1200 Hz) generated by the vessels. All of these noises were within the hearing sensitive frequency range of the L. crocea, thus inducing a negative response and causing them to leave the noisy area. On the other hand, the distribution of bait attracted L. crocea to gather in the feeding area, where bait was fed at regular intervals for quite a long time.
Long-term exposure to high-intensity, low-frequency noise can affect the hearing, behavior, growth, stress response, feeding conversion efficiency, and immunity of fish to a certain extent. This experiment studied underwater noise, mainly because ship noise was common in the fenced culture area, and this kind of noise may impact L. crocea. Therefore, studying the behavior changes of L. crocea before and after a ship passes can better determine the behavioral characteristics of L. crocea in the fence. During this experiment, the two groups of test fish mainly moved within the enclosure randomly before the vessel passed. When the vessel passed the production platform, both groups escaped and moved back and forth, trying to swim away from the platform, and they moved most frequently around the edge of the fence farther from the noise. Fay and Popper (2009) studied the hearing sensitivity of teleost in 50-1000 Hz and pointed out that L. crocea belongs to the family of Sciaenidae and has a wide hearing spectrum and low hearing threshold. Shi et al. (2010) simulated the effect of ship noise on the cortisol secretion of L. crocea, and found that the cortisol content in the blood was significantly increased under the stimulation of ship noise, which was considered to be a stress response. Smith et al. (2004) studied the effect of white noise on goldfish (Carassius auratus); the results showed that both the cortisol and glucose levels in the blood of goldfish increased significantly after 10 min of exposure to white noise at 160-170 dB:re 1µpa. Yin Leiming’s study adopted the ABR method to measure the hearing sensitivity of L. crocea; the results showed that the range was 500~800 Hz (Yin, 2017). Neo et al. (2016) used ultrasonic biotelemetry to study the behavioral changes of the European bass (Dicentrarchus labrax) under the noise stimulation of a large underwater horn. The results showed that continuous stimulation resulted in a rapid dive and movement away from the noise source compared with pulsed stimulation, a finding that was also consistent with the results of the current experiment.
The main frequency peaks of noise in the fenced area were 300-600 Hz. When ships passed the fenced production platform, the sound pressure level of underwater ambient noise in the 300-500 Hz bandwidth increased significantly by approximately 14 dB, and the peak of the ship noise spectrum completely obscured the biological sound of L. crocea. It was clear from the test results that both groups moved towards the side of the fence farther away from the production platform. L. crocea appeared to respond negatively to the ship noise, i.e., they appeared to flee from the noise source; it can be concluded that the ship noise startled the L. crocea. Wysocki et al. studied the effect of ship noise on the immunity of carp (Cyprinus carpio), gudgeon (Gobio gobio), and European perch (Perca fluviatilis) through playback of these noise recordings. The results showed an increase in cortisol secretion and stress levels in all three species (Wysocki et al., 2006). Codarin et al. (2009) found that ship noise affected the auditory sensitivity of several fish species. In addition, their acoustic-communication-dependent behaviors, such as mate finding, foraging, and individual fighting, were undermined. Sarà et al. (2007) studied the effects of ship noise on the migratory behavior of the Atlantic bluefin tuna (Thunnus thynnus) in waters off the Egadi Archipelago, Sicily, Italy. The results showed that ship noise affected the accuracy of these tunas’ baiting and spawning migrations.
In conclusion, this experiment used the long baseline (LBL) method to track the L. crocea and monitored the data concerning their movement within the fence. An underwater acoustic measurement system was adopted to spectrally analyze noise sources in the farming environment of L. crocea. This study is the first to obtain the 24 h behavioral data of L. crocea in the fence using two ultrasonic pinger fixation methods. It was observed that the swimming range of L. crocea was mainly 2 to 10 m under water. In addition, the underwater ambient noise was matched with the time domain to understand the sound environment of the fenced area. The impacts of the farming environment and noise sources on the behavior and spatial distribution of L. crocea were analyzed to clarify the optimal underwater sound environment parameters for culturing L. crocea. This experiment provides preliminary understanding of the movement patterns of L. crocea within the fence, and can provide a scientific theoretical basis and data support for the management and optimization of shallow sea fences for L. crocea culture in the future. In addition, this study has implications for studies on other fish species regarding the selection of ultrasonic pinger fixation methods.
Data availability statement
The original contributions presented in the study are included in the article/supplementary material. Further inquiries can be directed to the corresponding authors.
Ethics statement
The animal study was reviewed and approved by Dalian Ocean University.
Author contributions
DG conceived and designed the experiment. YT and LY conducted the experiment. DG, XC and MS are involved in data analysis. BX and PX collected and maintained the research data. DG wrote the manuscript. DG and XC contributed equally to this work and share first authorship. All authors contributed to the article and approved the submitted version.
Funding
This research was funded by the National Key Research and Development Program of China (2019YFD0901303) and the Science and Technology Innovation Fund of Dalian, China (2021JJ11CG001).
Acknowledgments
We are grateful to the experts who helped us complete the ultrasonic pinger implantation operations and the people who helped us collect data in the field. Special thanks to Researcher Wei Song for providing venue support and assistance for this experiment.
Conflict of interest
The authors declare that the research was conducted in the absence of any commercial or financial relationships that could be construed as a potential conflict of interest.
Publisher’s note
All claims expressed in this article are solely those of the authors and do not necessarily represent those of their affiliated organizations, or those of the publisher, the editors and the reviewers. Any product that may be evaluated in this article, or claim that may be made by its manufacturer, is not guaranteed or endorsed by the publisher.
References
Adams N. S., Rondorf D. W., Evans S. D., Kelly J. E., Perry R. W. (1998). Effects of surgically and gastrically implanted radio transmitters on swimming performance and predator avoidance of juvenile chinook salmon (Oncorhynchus tshawytscha). Can. J. Fisheries Aquat. Sci. 55 (4), 781–787. doi: 10.1139/f97-285
Anglea S., Geist D., Brown R., Deters K. (2003). Evaluation of surgically implanted acoustic transmitters on the swimming performance, predator avoidance, and buoyancy compensation of juvenile Chinook salmon. 2003. Rep. Prepared Public Utility District.
Biesinger Z., Bolker B. M., Marcinek D., Grothues T. M., Dobarro J. A., Lindberg W. J. (2013). Testing an autonomous acoustic telemetry positioning system for fine-scale space use in marine animals. J. Exp. Mar. Biol. Ecol. 448, 46–56. doi: 10.1016/J.JEMBE.2013.06.007
Bridger C. J., Booth R. K. (2003). The effects of biotelemetry transmitter presence and attachment procedures on fish physiology and behavior. Rev. Fisheries Sci. 11 (1), 13–34. doi: 10.1080/16226510390856510
Brown R. S., Cooke S. J., Anderson W. G., McKinley R. S. (1999). Evidence to challenge the “2% rule” for biotelemetry. North Am. J. Fisheries Manage. 19 (3), 867–871. doi: 10.1577/1548-8675(1999)019<0867:ETCTRF>2.0.CO;2
Calado R., Mota V. C., Madeira D., Leal M. C. (2021). Summer is coming! Tackling ocean warming in Atlantic salmon cage farming. Animals 11 (6), 1800. doi: 10.3390/ANI11061800
Codarin A., Wysocki L. E., Ladich F., Picciulin M. (2009). Effects of ambient and boat noise on hearing and communication in three fish species living in a marine protected area (Miramare, Italy). Mar. Pollut. Bull. 58 (12), 1880–1887. doi: 10.1016/j.marpolbul.2009.07.011
Cooke S. J., Graeb B., Suski C., Ostrand K. (2003). Effects of suture material on incision healing, growth and survival of juvenile largemouth bass implanted with miniature radio transmitters: case study of a novice and experienced fish surgeon. J. Fish Biol. 62 (6), 1366–1380. doi: 10.1046/j.1095-8649.2003.00119.x
Cooke S. J., Midwood J. D., Thiem J. D., Klimley P., Lucas M. C., Thorstad E. B., et al. (2013). Tracking animals in freshwater with electronic tags: Past, present and future. Anim. Biotelemetry 1 (1), 1–19. doi: 10.1186/2050-3385-1-5
Del Rio-Zaragoza O. B., Cavalheiro Araujo B., Viana M. T. (2021). Health status evaluation of striped bass (Morone saxatilis) exposed to low temperature in sea cage culture during the grow-out. Aquaculture Res. 52 (6), 2435–2445. doi: 10.1111/are.15093
Fay R., Popper A. (2009). Fish hearing and bioacoustics since 1973. J. Acoustical Soc. America 125 (4), 2485–2485. doi: 10.1121/1.4808776
Fu X., Huang D., Xu H., Ma S. (2021). Overview of the development of cage aquaculture in deep Sea. J. Aquaculture 42 (10), 23–26. doi: 10.3969/j.issn.1004-2091.2021.10.006
Han X., Song W., Gui F., Wang L. (2022). Large-Scale enclosure culture technology of pseudosciaena crocea with ecological imitation and shore connection. China Fisheries 11), 79–81.
Haynes J. (1978). Movement and habitat studies of chinook salmon and white sturgeon.[Oncorhynchus tshawytscha, acipenser transmontanus] (Richland, WA (USA: Battelle Pacific Northwest Labs.). doi: 10.2172/6632297
Hou Y., Zou X., Tang W., Jiang W., Zhu J., Deng C., et al. (2019). Precise capture of fish movement trajectories in complex environments via ultrasonic signal tag tracking. Fisheries Res. 219, 105307. doi: 10.1016/j.fishres.2019.105307
Hussey N. E., Kessel S. T., Aarestrup K., Cooke S. J., Cowley P. D., Fisk A. T., et al. (2015). Aquatic animal telemetry: A panoramic window into the underwater world. Science 348 (6240), 1255642. doi: 10.1126/science.1255642
Jepsen N., Schreck C., Clements S., Thorstad E. (2005). A brief discussion on the 2% tag/bodymass rule of thumb. Aquat. Telemetry: Adv. Appl., 255–259.
Juell J.-E., Westerberg H. (1993). An ultrasonic telemetric system for automatic positioning of individual fish used to track Atlantic salmon (Salmo salar l.) in a sea cage. Aquacultural Eng. 12 (1), 1–18. doi: 10.1016/0144-8609(93)90023-5
Lee J., Tezak E., Berejikian B. (2013). Telemetry tag effects on juvenile lingcod ophiodon elongatus movement: A laboratory and field study. J. Fish Biol. 82 (6), 1848–1857. doi: 10.1111/jfb.12111
Liu Z., Zhao W., Hu W., Zhu B., Xie J., Liu Y., et al. (2021). Lipid metabolism, growth performance, antioxidant ability and intestinal morphology of rainbow trout (Oncorhynchus mykiss) under cage culture with flowing water were affected by dietary lipid levels. Aquaculture Rep. 19, 100593. doi: 10.1016/J.AQREP.2021.100593
Makiguchi Y., Ueda H. (2009). Effects of external and surgically implanted dummy radio transmitters on mortality, swimming performance and physiological status of juvenile masu salmon oncorhynchus masou. J. Fish Biol. 74 (1), 304–311. doi: 10.1111/j.1095-8649.2008.02131.x
Mellas E. J., Haynes J. M. (1985). Swimming performance and behavior of rainbow trout (Salmo gairdneri) and white perch (Morone americana): Effects of attaching telemetry transmitters. Can. J. Fisheries Aquat. Sci. 42 (3), 488–493. doi: 10.1139/f85-066
Miller E. A., Froehlich H. E., Cocherell D. E., Thomas M. J., Cech J. J., Klimley A. P., et al. (2014). Effects of acoustic tagging on juvenile green sturgeon incision healing, swimming performance, and growth. Environ. Biol. Fishes 97, 647–658. doi: 10.1007/s10641-013-0167-x
Miyamoto Y., Uchida K., Takao Y., Sasakura T. (2011). Development of a new ultrasonic biotelemetry system using a maximum length sequence signal. J. Mar. Acoust Soc. Jpn 38 (3), 119–127. doi: 10.3135/JMASJ.38.119
Moore A., Russell I., Potter E. (1990). The effects of intraperitoneally implanted dummy acoustic transmitters on the behaviour and physiology of juvenile Atlantic salmon, salmo salar l. J. Fish Biol. 37 (5), 713–721. doi: 10.1111/j.1095-8649.1990.tb02535.x
Neo Y., Hubert J., Bolle L., Winter H. V., Ten Cate C., Slabbekoorn H. (2016). Sound exposure changes European seabass behaviour in a large outdoor floating pen: Effects of temporal structure and a ramp-up procedure. Environ. Pollut. 214, 26–34. doi: 10.1016/j.envpol.2016.03.075
Panther J. L., Brown R. S., Gaulke G. L., Deters K. A., Woodley C. M., Eppard M. B. (2011). Influence of incision location on transmitter loss, healing, survival, growth, and suture retention of juvenile Chinook salmon. Trans. Am. Fisheries Soc. 140 (6), 1492–1503. doi: 10.1080/00028487.2011.637003
Poddubnyi A., Spiktor Y. I., Kidiun S. (1966). The results of preliminary experiments in tracking sturgeon carrying electronic tracer tags. Vop. Ikhtiol. 6, 725–734.
Roy R., Beguin J., Argillier C., Tissot L., Smith F., Smedbol S., et al. (2014). Testing the VEMCO positioning system: Spatial distribution of the probability of location and the positioning error in a reservoir. Anim. Biotelemetry 2 (1), 1–7. doi: 10.1186/2050-3385-2-1
Sarà G., Dean J., d’Amato D., Buscaino G., Oliveri A., Genovese S., et al. (2007). Effect of boat noise on the behaviour of bluefin tuna thunnus thynnus in the Mediterranean Sea. Mar. Ecol. Prog. Ser. 331, 243–253. doi: 10.3354/meps331243
Shi H., Jiao H., You Z., Wang Y., Li S., Xu J., et al. (2010). Effect of ship noise on plasma cortisol level of bass and yellow croaker. Acta Ecologica Sin. 30 (14), 3760–3765.
Smith M. E., Kane A. S., Popper A. N. (2004). Noise-induced stress response and hearing loss in goldfish (Carassius auratus). J. Exp. Biol. 207 (3), 427–435. doi: 10.1242/jeb.00755
Summerfelt R. C., Mosier D. (1984). Transintestinal expulsion of surgically implanted dummy transmitters by channel catfish. Trans. Am. Fisheries Soc. 113 (6), 760–766. doi: 10.1577/1548-8659(1984)113<760:TEOSID>2.0.CO;2
Wagner G. N., Cooke S. J., Brown R. S., Deters K. A. (2011). Surgical implantation techniques for electronic tags in fish. Rev. Fish Biol. Fisheries 21, 71–81. doi: 10.1007/s11160-010-9191-5
Wang X., Lu G., Zhao L., Yang Q., Gao T. (2020). Assessment of fishery resources using environmental DNA: Small yellow croaker (Larimichthys polyactis) in East China Sea. PloS One 15 (12), e0244495. doi: 10.1371/journal.pone.0244495
Wang C., Wei Q., Kynard B., Du H., Zhang H. (2012). Migrations and movements of adult Chinese sturgeon acipenser sinensis in the Yangtze river, China. J. Fish Biol. 81 (2), 696–713. doi: 10.1111/j.1095-8649.2012.03365.x
Wysocki L. E., Dittami J. P., Ladich F. (2006). Ship noise and cortisol secretion in European freshwater fishes. Biol. Conserv. 128 (4), 501–508. doi: 10.1016/j.biocon.2005.10.020
Yin L. (2017). Study on the response and mechanism of acoustic attraction behavior of pseudosciaena crocea (Shanghai Ocean University).
Young A., Tytler P., Holliday F., MacFarlane A. (1972). A small sonic tag for measurement of locomotor behaviour in fish. J. Fish Biol. 4 (1), 57–65. doi: 10.1111/j.1095-8649.1972.tb05652.x
Zale A. V., Brooke C., Fraser W. C. (2005). Effects of surgically implanted transmitter weights on growth and swimming stamina of small adult westslope cutthroat trout. Trans. Am. Fisheries Soc. 134 (3), 653–660. doi: 10.1577/T04-050.1
Keywords: Larimichthys crocea, ultrasound pinger, long baseline (LBL), fish behavior, pen aquaculture
Citation: Gong D, Cui X, Song M, Xing B, Xu P, Tang Y and Yin L (2023) Behavior of large yellow croaker (Larimichthys crocea) in pen aquaculture as measured by meter-scale telemetry. Front. Mar. Sci. 10:1177037. doi: 10.3389/fmars.2023.1177037
Received: 01 March 2023; Accepted: 26 April 2023;
Published: 17 May 2023.
Edited by:
Zhao Yunpeng, Dalian University of Technology, ChinaCopyright © 2023 Gong, Cui, Song, Xing, Xu, Tang and Yin. This is an open-access article distributed under the terms of the Creative Commons Attribution License (CC BY). The use, distribution or reproduction in other forums is permitted, provided the original author(s) and the copyright owner(s) are credited and that the original publication in this journal is cited, in accordance with accepted academic practice. No use, distribution or reproduction is permitted which does not comply with these terms.
*Correspondence: Yong Tang, eS10YW5nQHNob3UuZWR1LmNu; Leiming Yin, eWlubGVpbWluZ0BkbG91LmVkdS5jbg==
†These authors share first authorship