 Hanlu Liu1
 Yonggang Jia1*
 Shaotong Zhang2*
 Hongxian Shan1
 Liang Xue1Zhiwen Sun1Yongzheng Quan1Zhenghui Li1
 Tian Chen1
 Zhuangcai Tian3
 Zhenhao Wang4
- 1Shandong Provincial Key Laboratory of Marine Environment and Geological Engineering, College of Environmental Science and Engineering, Ocean University of China, Qingdao, China
- 2Key Laboratory for Submarine Geosciences and Prospecting Techniques (Ministry of Education), College of Marine Geosciences Ocean University of China, Qingdao, China
- 3State Key Laboratory for Geomechanics and Deep Underground Engineering, China University of Mining and Technology, Xuzhou, China
- 4First Institute of Oceanography, Ministry of Natural Resources (MNR), Qingdao, Shandong, China
Accurately measuring the critical shear stress is crucial for numerous applications, such as sediment transport modeling, erosion prediction, and the design of sustainable coastal engineering structures. However, developing reliable and precise in-situ measurement devices faces significant challenges due to the harsh and dynamic nature of aquatic environments. Factors like turbulence and waves introduce complexities that must be considered when designing and calibrating these devices. The newly developed Openable Underwater Carousel In-situ Flume (OUC-IF) was used to determine the critical shear stress (τc) and quantify erosion rates. Acoustic Doppler Velocimeter (ADV) was employed to measure 3D near-bottom velocities, which were then used to estimate and pre-calibrate bed shear stress (τ) applied on the seabed in the annular flume. Three computation methods of shear stress were evaluated: turbulent kinetic energy (TKE), direct covariance (COV), and log profile (LP). In-situ erosion experiments were conducted for the first time at two sites in the tidal flat of the Yellow River Delta (site 1 with a water depth of 1.32 m and site 2 with a water depth of 0.75 m). The critical shear stress was found to be 0.10 Pa at site 1 and 0.19 Pa at site 2, and the erosion rates of the sediments were successfully measured. The effect of wave-seabed interactions on erosion resistance was explored by theoretically estimating the wave-induced pore pressure of the seabed based on the observed data. The max liquefaction degree of the seabed at site 1 and site 2 was 0.035 and 0.057, respectively, and the average erosion coefficient Me was 2.63E-05 kg m-2s-1 at site 1 and 3.48E-05 kg m-2s-1 at site 2.
Highlights
1. A large in-situ annular flume was developed, which can measure the erosion resistance of seabed considering wave-seabed interactions.
2. Erosion resistance was measured at two intertidal sites in the Yellow River Delta, 3.7 km apart, and the critical shear stresses were found to be 0.10 Pa and 0.19 Pa, respectively.
3. The liquefaction degree of seabed reached 0.035~0.057 and the average of erosion coefficient Me were 2.63E-05 kg m-2s-1 and 3.48E-05 kg m-2s-1for the experiment.
1 Introduction
Sediment erosion, deposition, and transport of the seabed play a crucial role in the research and engineering of rivers, estuaries, and coasts(e.g., siltation of harbors, dredging of navigation channels, and coastal protection). These sedimentary processes have a direct impact on the evolution of estuarine and coastal geomorphology (Brand et al., 2010). Sediment erosion occurs when the bed shear stress induced by the flow exceeds a certain critical value of shear stress (Winterwerp et al., 2012). The critical shear stress is a key input parameter of sediment transport models (Lu et al., 2011; Zhang S. et al., 2021), and it is determined through lab or field erosion experiments (Amos et al., 1992a; Krishnappan, 1993; Maa et al., 1993; Thompson et al., 2019; He et al., 2021).
Lab erosion experiments can be used to determine the critical shear stress of remoulded soil samples and core samples (Wang et al., 2011; Beckers et al., 2020). Two types of annular flumes are commonly used for this purpose: rotating annular flumes (Krishnappan, 1993; Zreik et al., 1998; Yang et al., 2015; Baar et al., 2018), and race-way annular flumes (Zhang S. et al., 2018; Zhang Y. et al., 2021). These flumes have a rectangular cross-sectional width of 30 cm and are designed to measure the erodibility of remoulded soil samples. The difference between rotating annular flumes and race-way annular flumes is that the latter has a soil tank designed at the end of the flow route, with a rectangular flow path before reaching the tank to reduce secondary flow (Black and Cramp, 1995; Zhang S. et al., 2018). Several types of straight flumes are also used to measure the erodibility of sediment core samples, including SEDflume (McNeil et al., 1996; Lick and McNeil, 2001); the Erosion Function Apparatus (EFA) (Briaud et al., 1999), the SETEG flume (Noack et al., 2015), the ASSET flume (Roberts et al., 2003), the SERF (Sediment Erosion Rate Flume) (Crowley et al., 2012). These flumes can be used to estimate the variation of erodibility with depth. However, the process of sampling, transporting, and testing sediment cores can cause sediment disturbance that alters its biological, physical, and chemical properties. This disturbance may directly affect the evaluation of the erosion resistance of sediment in the laboratory.
In-situ measurement of seabed erodibility is a significant but challenging task. Nonetheless, various portable straight and annular flumes have been developed for conducting field erosion experiments. For instance, SEAFLUME was deployed in Buzzards Bay, Massachusetts (Young and Southard, 1978); SEADUCT (Nowell and Hollister, 1985); Sea Carousel, which was deployed in the Bay of Fundy (Amos et al., 1992b), the Fraser River Delta (Amos et al., 1997), tidal flats in Venice Lagoon (Amos et al., 2004; Amos et al., 2010); VIMS Sea Carousel, which was deployed in the lower James River Estuary (Maa et al., 1993), Baltimore Harbor, Maryland (Maa et al., 1998), the York River, Virginia (Maa and Kim, 2001), the Anacostia River (Maa, 2008); the mobile recirculating flume (MORF) (Black and Cramp, 1995), deployed in the intertidal Yellow River Delta (Meng et al., 2012); the Portable straight flume, which was deployed in Quincy Bay of Boston Harbor(Ravens and Gschwend, 1999); In-Situ Erosion Flume (ISEF), which was deployed in the intertidal area of the Wadden Sea Coast (Houwing, 1999); Voyager II, deployed in the North Sea (Thompson et al., 2011), UK shelf seas (Thompson et al., 2019); a small, portable annular flume (Zheng et al., 2019). However, the large in-situ flume experimental research is limited in the China sea.
In shallow water environments, waves frequently assume a more significant or even dominant role in the entrainment of bottom sediments (e.g., Paphitis and Collins, 2005; Danielsson et al., 2007; Bolaños et al., 2012). This mechanism is mainly attributed to the wave orbital shear stress (e.g., Wolanski and Spagnol, 2003; Brand et al., 2010). Moreover, sediment erosion in the seabed is not only caused by wave-induced orbital shear stresses, but also by wave-induced excess pressure, leading to seepage and even seabed liquefaction (Foda and Huang, 2002; Jeng, 2017). The transient and residual seabed liquefaction effects play a significant role in the erosion process of seabed sediment. The contribution of wave-induced seabed transient liquefaction to sediment resuspension can range from 20-60%. The degree of residual liquefaction determines the erosion coefficient, which can range from 8.27 E-05 kg m-2s-1 to 5.44 E-04 kg m-2s-1, and significantly affects sediment erosion resistance (Jia et al., 2014; Zhang S. et al., 2018; Liu et al., 2020). Currently, there is no large in-situ annular flume that combines wave and current. However, some researchers have developed a laboratory annular flume with coupled seepage and scour to investigate the influence of wave-induced seepage on sediment erodibility (Zhang S. et al., 2018; Tang et al., 2021). Therefore, there is an urgent need to develop a large in-situ annular flume that combines wave-current action to investigate the influence of wave-induced seepage on the erodibility of the seabed.
To determine the erosion resistance of sediments in the subaqueous area of Yellow River Delta, three main methods are commonly used: (1) laboratory erosion experiments with near-undisturbed core samples collected from the field (Gao et al., 2018; Shi et al., 2018); (2) laboratory erosion experiments with remoulded soil collected from the tidal flat area of the Yellow River Delta (Zhang S. et al., 2018; Liu et al., 2020); (3) an in-situ annular flume was used to measure the erosion threshold in different locations along the intertidal zone of the Yellow River Delta (Meng et al., 2012). It is worth noting that the in-situ annular flume used by Meng et al. (2012) can only be used in the intertidal zone during exposed periods, which limits its ability to measure the critical shear stress of underwater sediments.
The aim of this paper is to develop and deploy a large in-situ annular flume to determine the critical shear stress and estimate the erosion rate of underwater sediments in the Yellow River Delta, which has not been done before. Three methods of shear stress estimation, namely the log profile (LP), direct covariance (COV), and turbulent kinetic energy (TKE) methods, are evaluated in the laboratory to calibrate curves of shear stress vs. motor frequency. The motor frequency is then used to describe the shear stress based on calibration. The annular flume is deployed for the first time to measure the critical shear stress and erosion rate of sediments at two sites in the tidal flat of Yellow River Delta (site 1 water depth 1.32 m; site 2 water depth 0.75 m). During the experiments, the wave-induced pore pressure of the seabed is theoretically estimated based on wave pressure data, taking into account the effect of wave-seabed interactions on erosion resistance. The liquefaction degree of the seabed and the erosion coefficient Me during the experiment are also analyzed.
2 Methods
2.1 Design of the newly developed OUC-IF
The Openable Underwater Carousel In-situ Flume (OUC-IF) has been developed to determine the critical shear stress and estimate the erosion rate of sediment while considering wave-seabed interactions. The OUC-IF is a benthic, annular flume designed for erosion measurement of natural, undisturbed sediment in subaqueous conditions (as shown in Figure 1). It consists of a steel channel that is 0.3 m high and 0.15 m wide, with a total diameter of 2.1 m. Current in the flume is driven by the rotation gearwheel with eight equidistantly spaced paddles. The gearwheel is rotated by a submarine motor, which is powered by 220 V AC. The frequency of the motor is regulated by the motor controller, ranging from 0 Hz to15 Hz (underwater). The mean bed shear stress is determined from the measurement of velocity at a height of 0.15 m above the bed. The paddles movement generated measurable turbulence, but it had a minimal impact on the benthic boundary layer, as indicated by the near-bed velocity profile and estimates of bed shear stress (Amos et al., 1992a; Kassem et al., 2021). The suspended sediment concentration (SSC) is measured with a turbidity meter (RBR Concerto) at a height of 5 cm above the bed. The critical shear stress and bed erosion rate are determined from the time series of SSC.
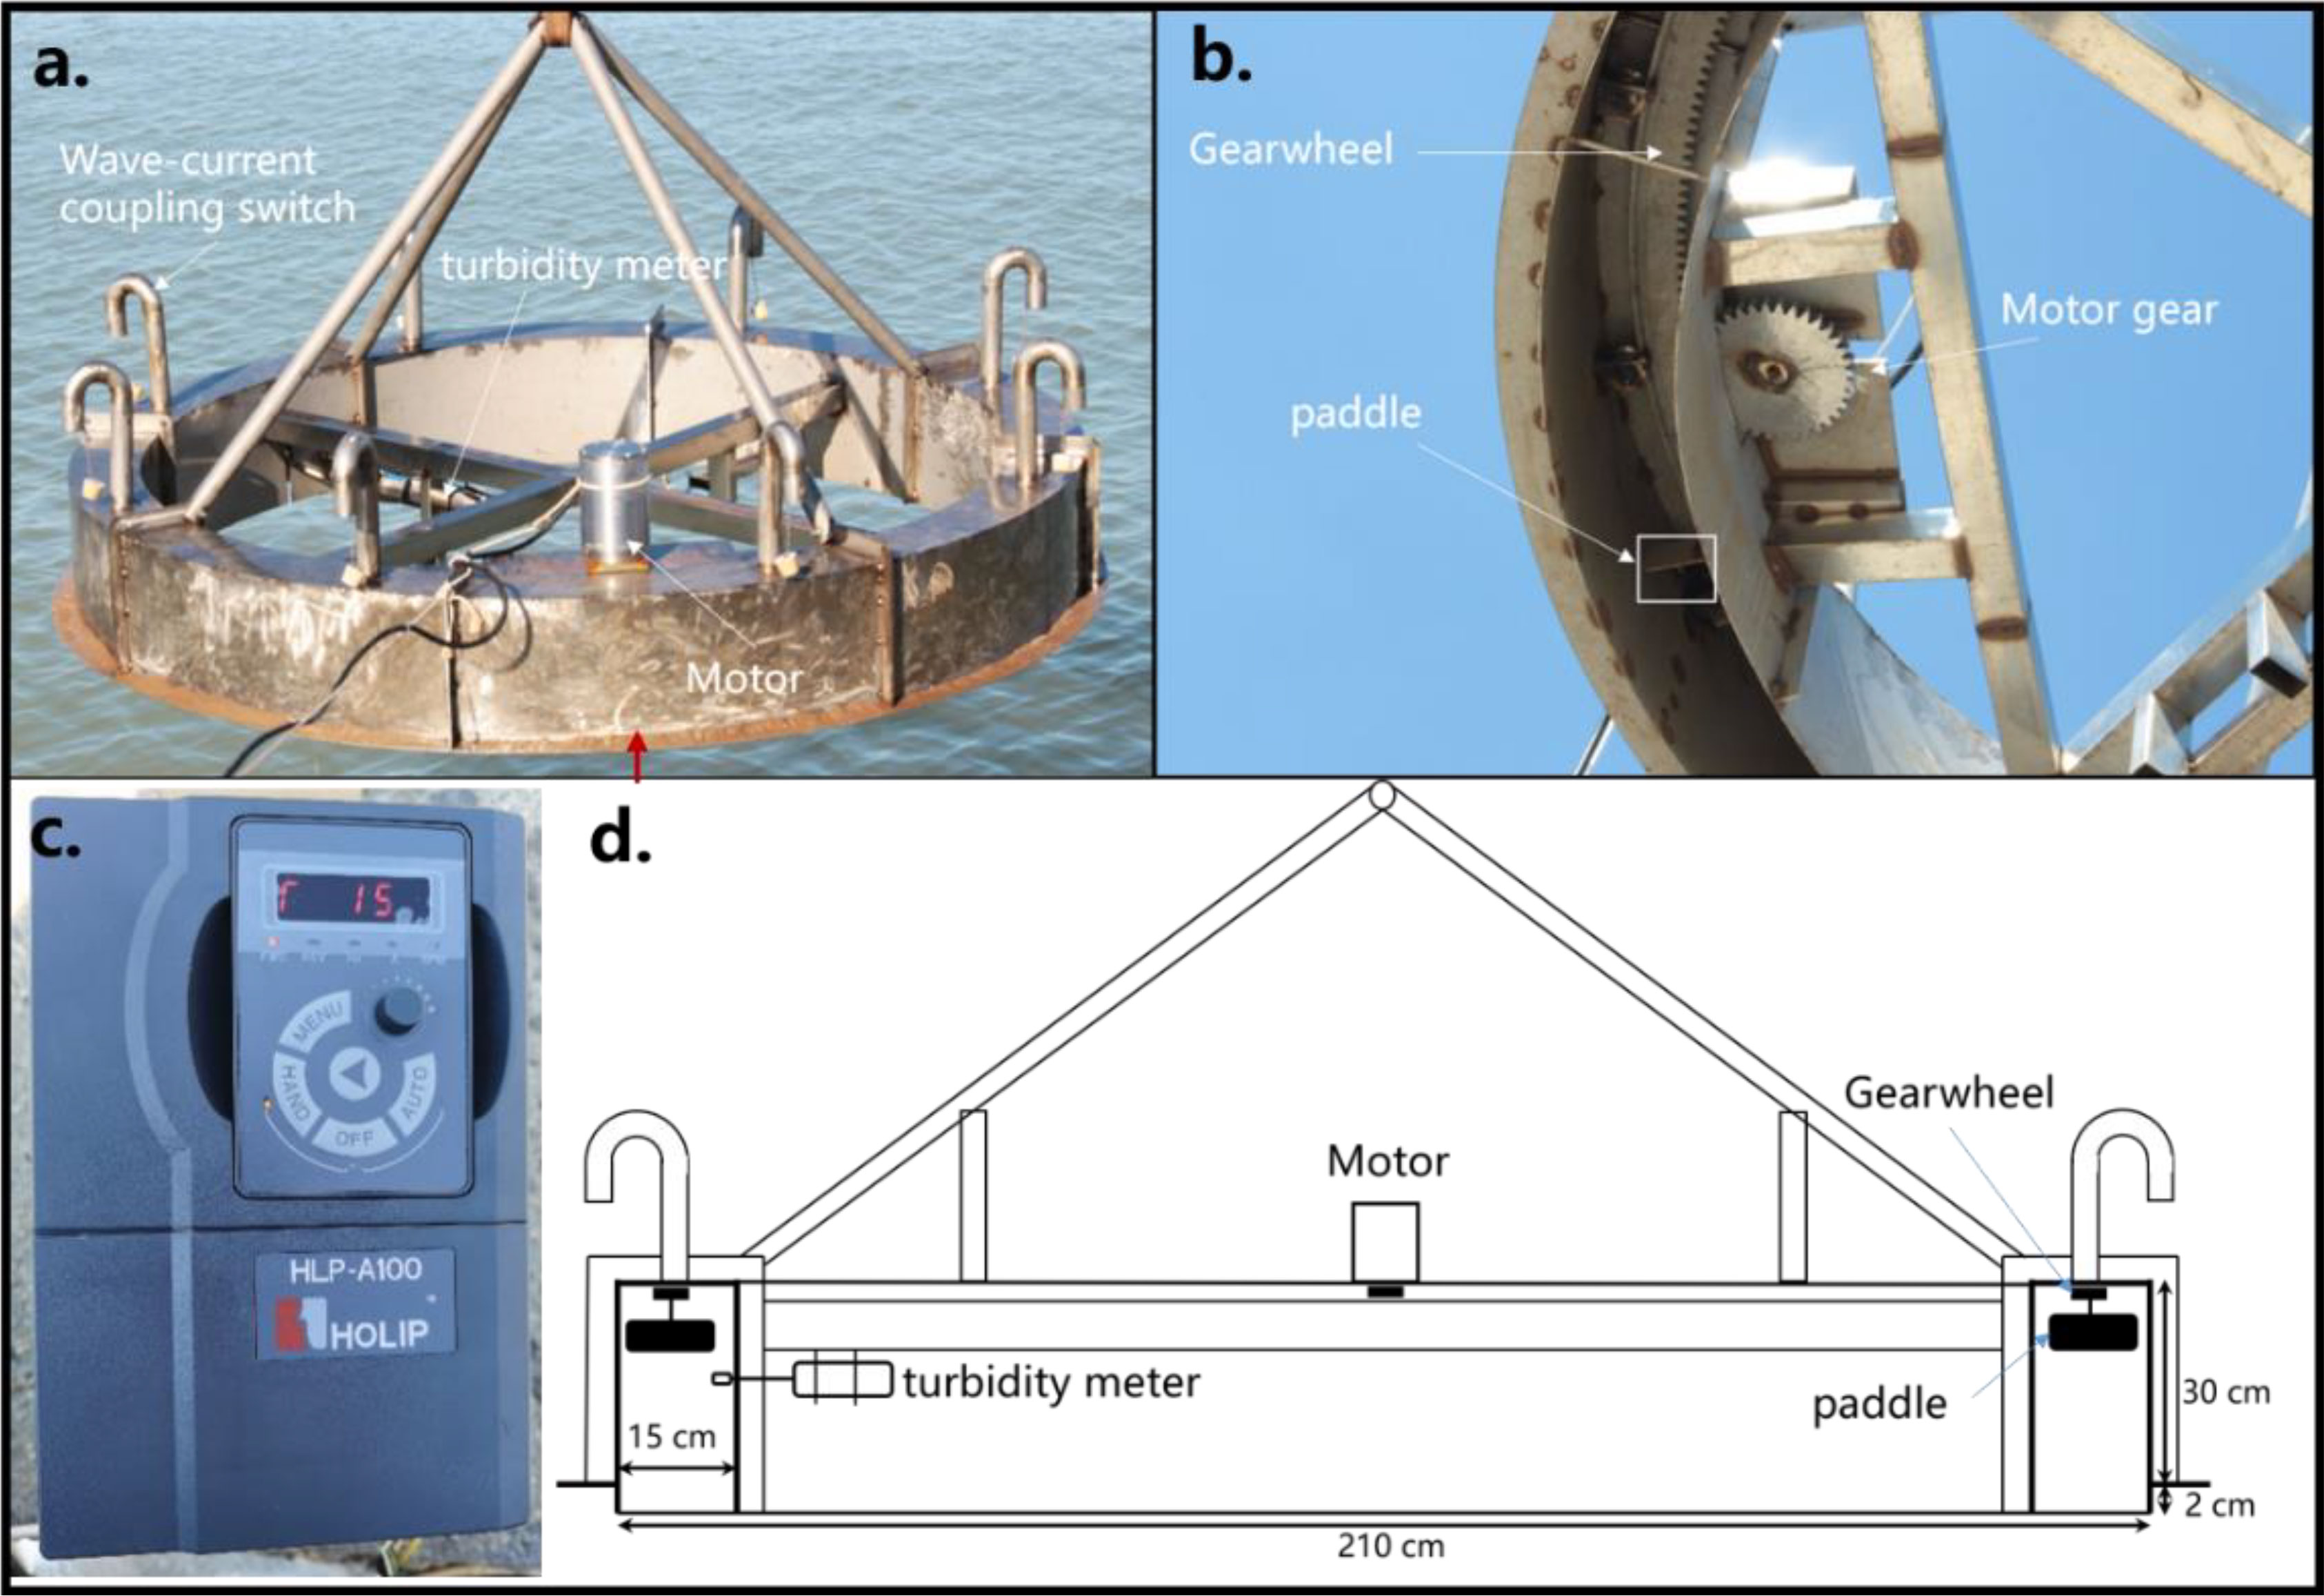
Figure 1 Structure of the in-situ annular flume: (A) Deployment of the OUC-IF including flume channel, deployed RBR Concerto location, red arrow shows the direction of view in Figure 1B; (B) Detail of the in-situ annular flume, including motor, motor gear, gearwheel, paddles; (C) Motor controller, showing the motor frequency; (D) the construction diagram of the annular flume.
Figure 2 shows that the OUC-IF is capable of combining wave and current through a wave-current coupling control system, which consists of eight U-tubes (5.0 cm in diameter) and rubber plugs. It takes a different perspective than the conventional understanding of wave-current interaction. This device focuses solely on the bed shear stresses generated by current and vertical wave pressure, while ignoring the shear stresses induced by waves. Especially under large waves(e.g. in winter), pressure effect dominates sediment erosion (Foda and Huang, 2002). The objective is to provide a more precise estimation of the effect of pore pressure response on sediment erosion resistance caused by wave pressure. This is the key advantage compared to the similar in-situ annular flumes (Amos et al., 1992a; Maa et al., 1993; Thompson et al., 2019; Zheng et al., 2019). When the wave-current coupling control system is open, seawater between the inside and outside of the flume is exchanged. This makes the annular flume “underwater openable,” similar to the principle of the seepage meter (Smith et al., 2009). Wave pressure from the sea surface can be transferred to the seabed while controlling current speeds. Moreover, the pendulous section of the U-tubes is designed to be 14 cm long, preventing convection and diffusion of external sediment into the flume. In this way, comparative experiments can be undertaken to study the change of erosion resistance under wave-induced seepage.
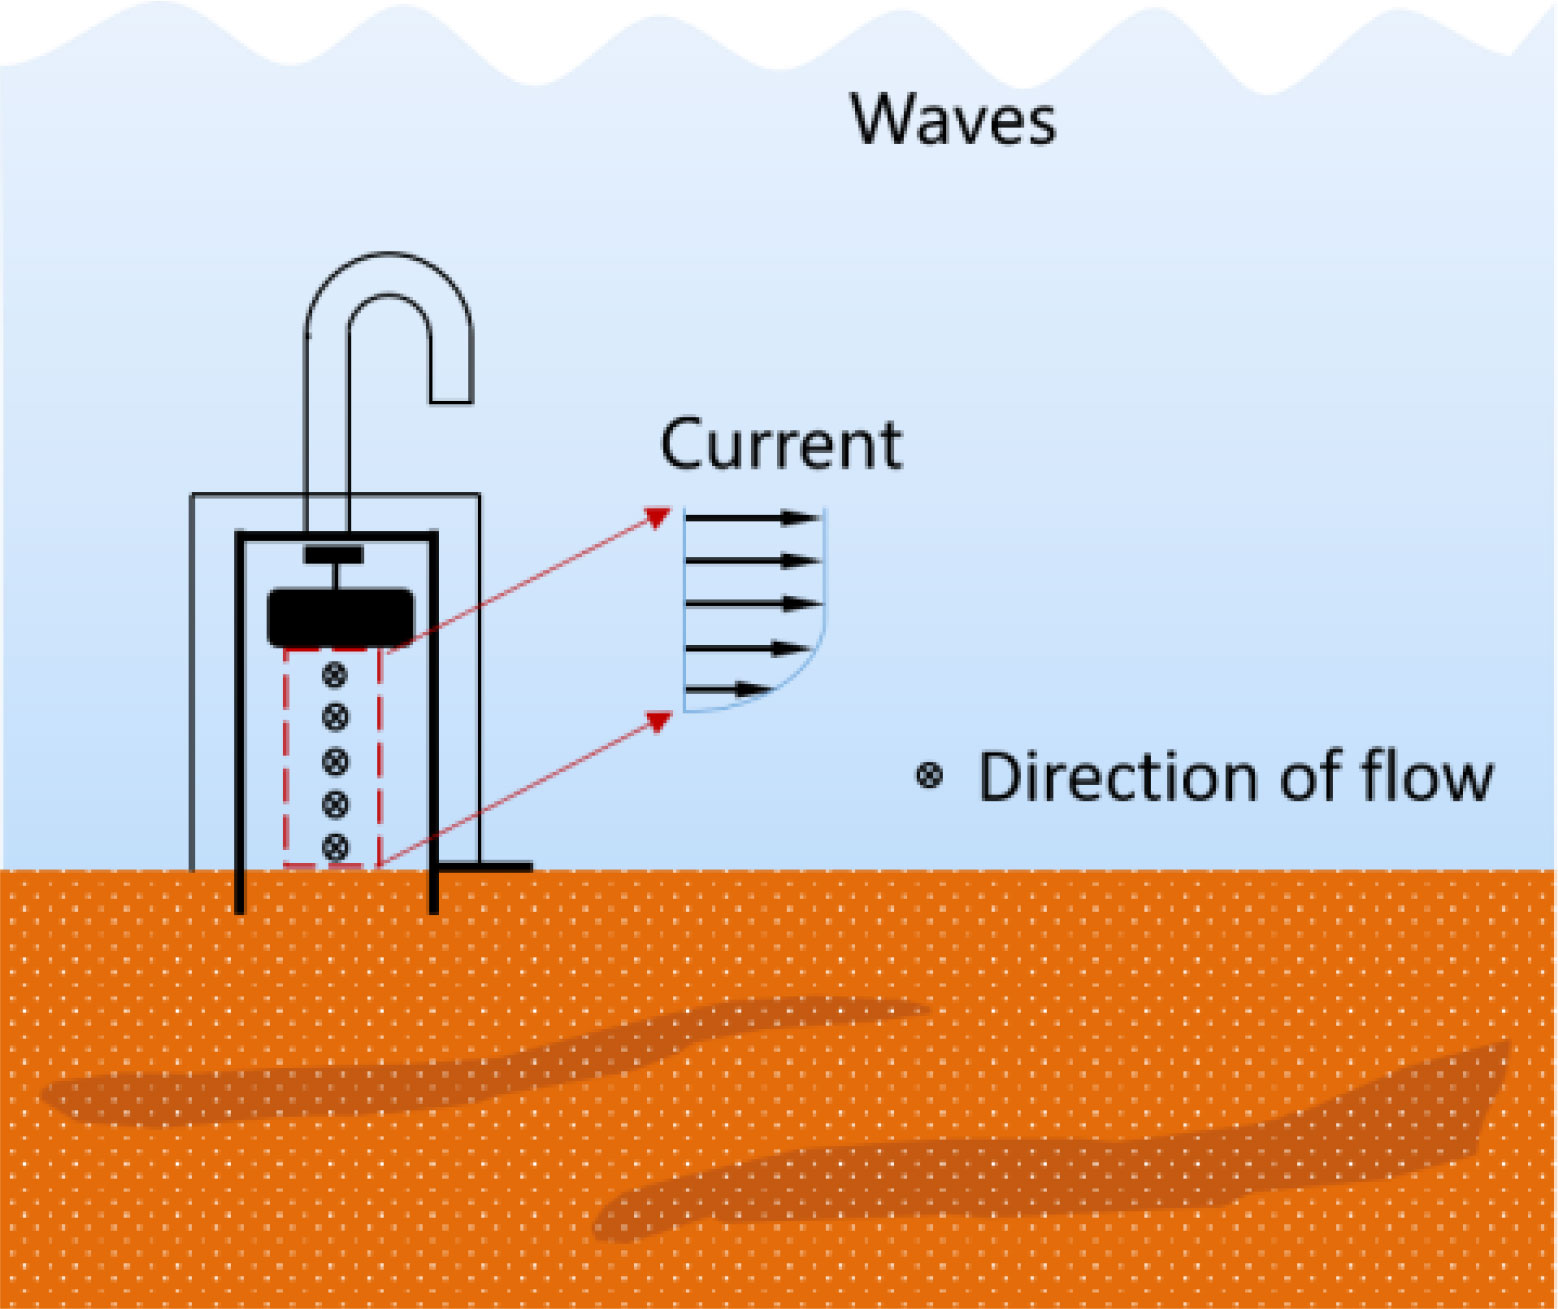
Figure 2 Schematic diagram of OUC-IF combining waves and current.
2.2 Calibration of bed shear stress in the OUC-IF
Bed shear stress is determined by the near-bottom velocity in the flume. In order to obtain the calibration curves of motor frequency and bed shear stress, laboratory calibration experiments were undertaken at OUC in an iron pool with a length of 6 m, a width of 3 m, and a height of 3 m respectively.
During the calibration experiments, six stepwise motor frequencies (current speeds) were used, 2.5 Hz, 5.0 Hz, 7.5 Hz, 10.0 Hz, 12.5 Hz, and 15.0 Hz, each lasting around 10 minutes respectively. The Nortek Vectrino, equipped with a side view sensor, measured the velocity along the channel (u), across the channel (v) and vertically (w) at a 2.0 cm above the bed level, and was connected to a computer. The position of the sensor in the flume and the velocity measurement axis are shown in Figure 3. The sampling frequency was set to 8 Hz in continuous acquisition mode. The phase-space thresholding method (Aberle et al., 2003) was applied to denoise the time series of fluctuating velocities, with velocity spikes replaced by the last valid data points (Islam and Zhu, 2013).
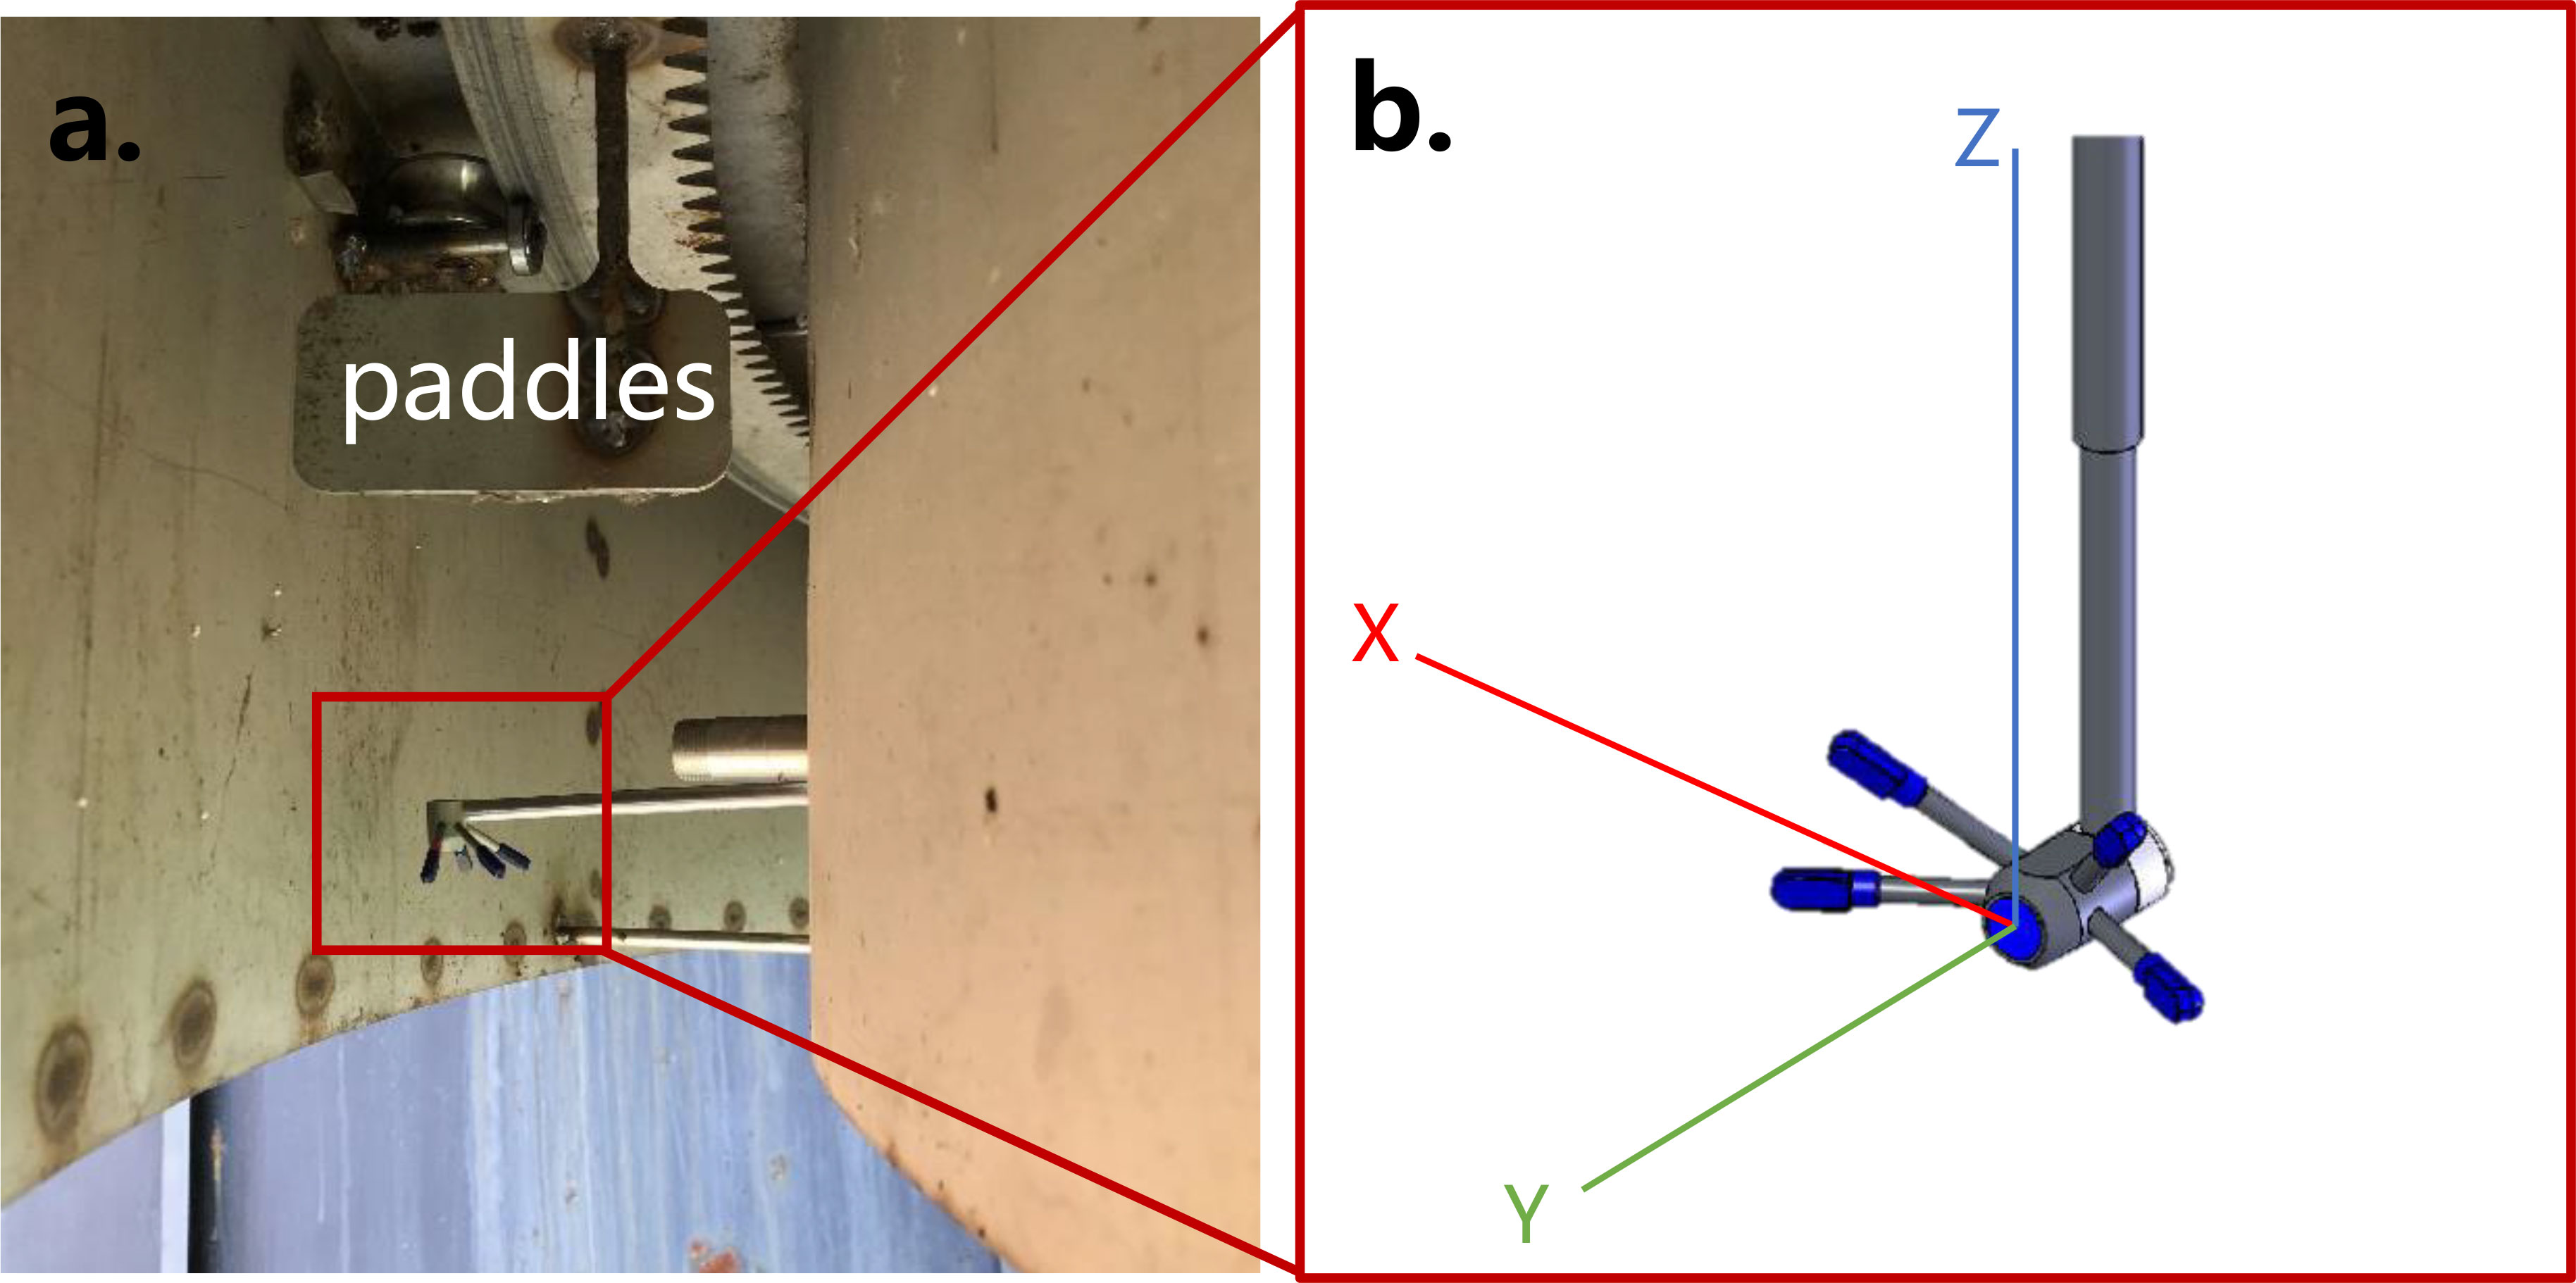
Figure 3 (A) The position of the sensor in the flume, 7.0 cm above the bed level, and velocity measurement point is 5.0 cm under the sensor; (B) the axis of velocity direction: X, Y, Z are the along channel, vertical direction, and across channel, respectively.
The hydrodynamic characteristics in the annular flume were analyzed using numerical simulation and measurement (Maa, 1990; Maa, 1993; Maa et al., 1995). Furthermore, there are three commonly used methods for estimating bed shear stress: (1) the Turbulent Kinetic Energy Method, (2) direct covariance, and (3) the Log Profile Method. The applicability, assumptions, and limitations of these three methods have been reviewed by many researchers (Kim et al., 2000; Pope et al., 2006; Van Prooijen and Winterwerp, 2010; Pieterse et al., 2015; Johnson and Cowen, 2020; Li et al., 2021). To determine the near-bottom bed shear stress using the near-bottom flow velocity in the water column, it is recommended to use several methods simultaneously and then compare the results of the analysis.
2.2.1 TKE method
Turbulent kinetic energy is a measure of the intensity of turbulent motion within a shearing fluid. As the test site is in absence of large waves, instantaneous velocity at time t in the x-direction is defined as:
where is the measured velocity, is the mean velocity and is the fluctuations due to turbulence (Soulsby, 1983). The area below the spectrum is a measure of the signal variance due to turbulence. This method can be applied to all three components of flow and to the Turbulent Kinetic Energy density, E, which is calculated from:
and the bed shear stress calculated from τ = 0.19E where the value 0.19 is an empirical coefficient (the TKE coefficient), which is generally accepted as valid for a range of bottom roughnesses (Soulsby, 1983).
2.2.2 COV method
Reynolds stress seems to represent a suitable method for estimating bed shear stress for fully turbulent flows with large Reynolds numbers (Dyer, 1986),
which u’ and w’ indicates the turbulence deviation from the mean flow in the horizontal (flow direction) and vertical directions (Heathershaw and Simpson, 1978). Unlike the LP method, the COV method does not depend on z. This method seems to be ideal because the covariance represents an unbiased estimate of the bottom stress (Kim et al., 2000).
2.2.3 LP method
Calculation of shear stresses by the log profile method needs measurement of flow velocities at different heights above the bottom bed (Joshi et al., 2017). For a completely rough turbulent boundary layer, the theoretical velocity profile of the lowest part of the turbulent boundary layer described by the von Karman-Planet equation has a logarithmic structure due to the effect of increasing bottom friction with proximity to the sediment-water interface (Soulsby and Dyer, 1981):
where κ = 0.4, is the von Karman constant (dimensionless). uz is the measured flow rate at a height z = 2 cm above the bottom bed. u* is the frictional flow rate; z0=ks/30, Nikuradsez roughness ks =2.5*D50 (Soulsby, 1997), D50 is the median grain size of the sub-bed sediment, the median grain size of silts in the intertidal area of the abandoned Diaokou lobe in the modern Yellow River Delta is 0.044mm (Zhang S. et al., 2018).
The relationship between the frictional velocity u* and the bed shear stress τ is given by the following equation (Dyer, 1980):
2.3 In-situ erosion experiments in the tidal flat of Yellow River Delta
The modern Yellow River Delta was formed after the diversion of the Yellow River in 1855 and is located in the southwestern part of the semi-enclosed Bohai Sea in China, between Bohai Bay and Laizhou Bay. The site 1 and site 2, at water depth 1.32 m and 0.75 m respectively, are in the tidal flat of Yellow River Delta(as shown in Figure 4). The sediment particle size distribution curves for site 1 and site 2 are presented in Figure 5.
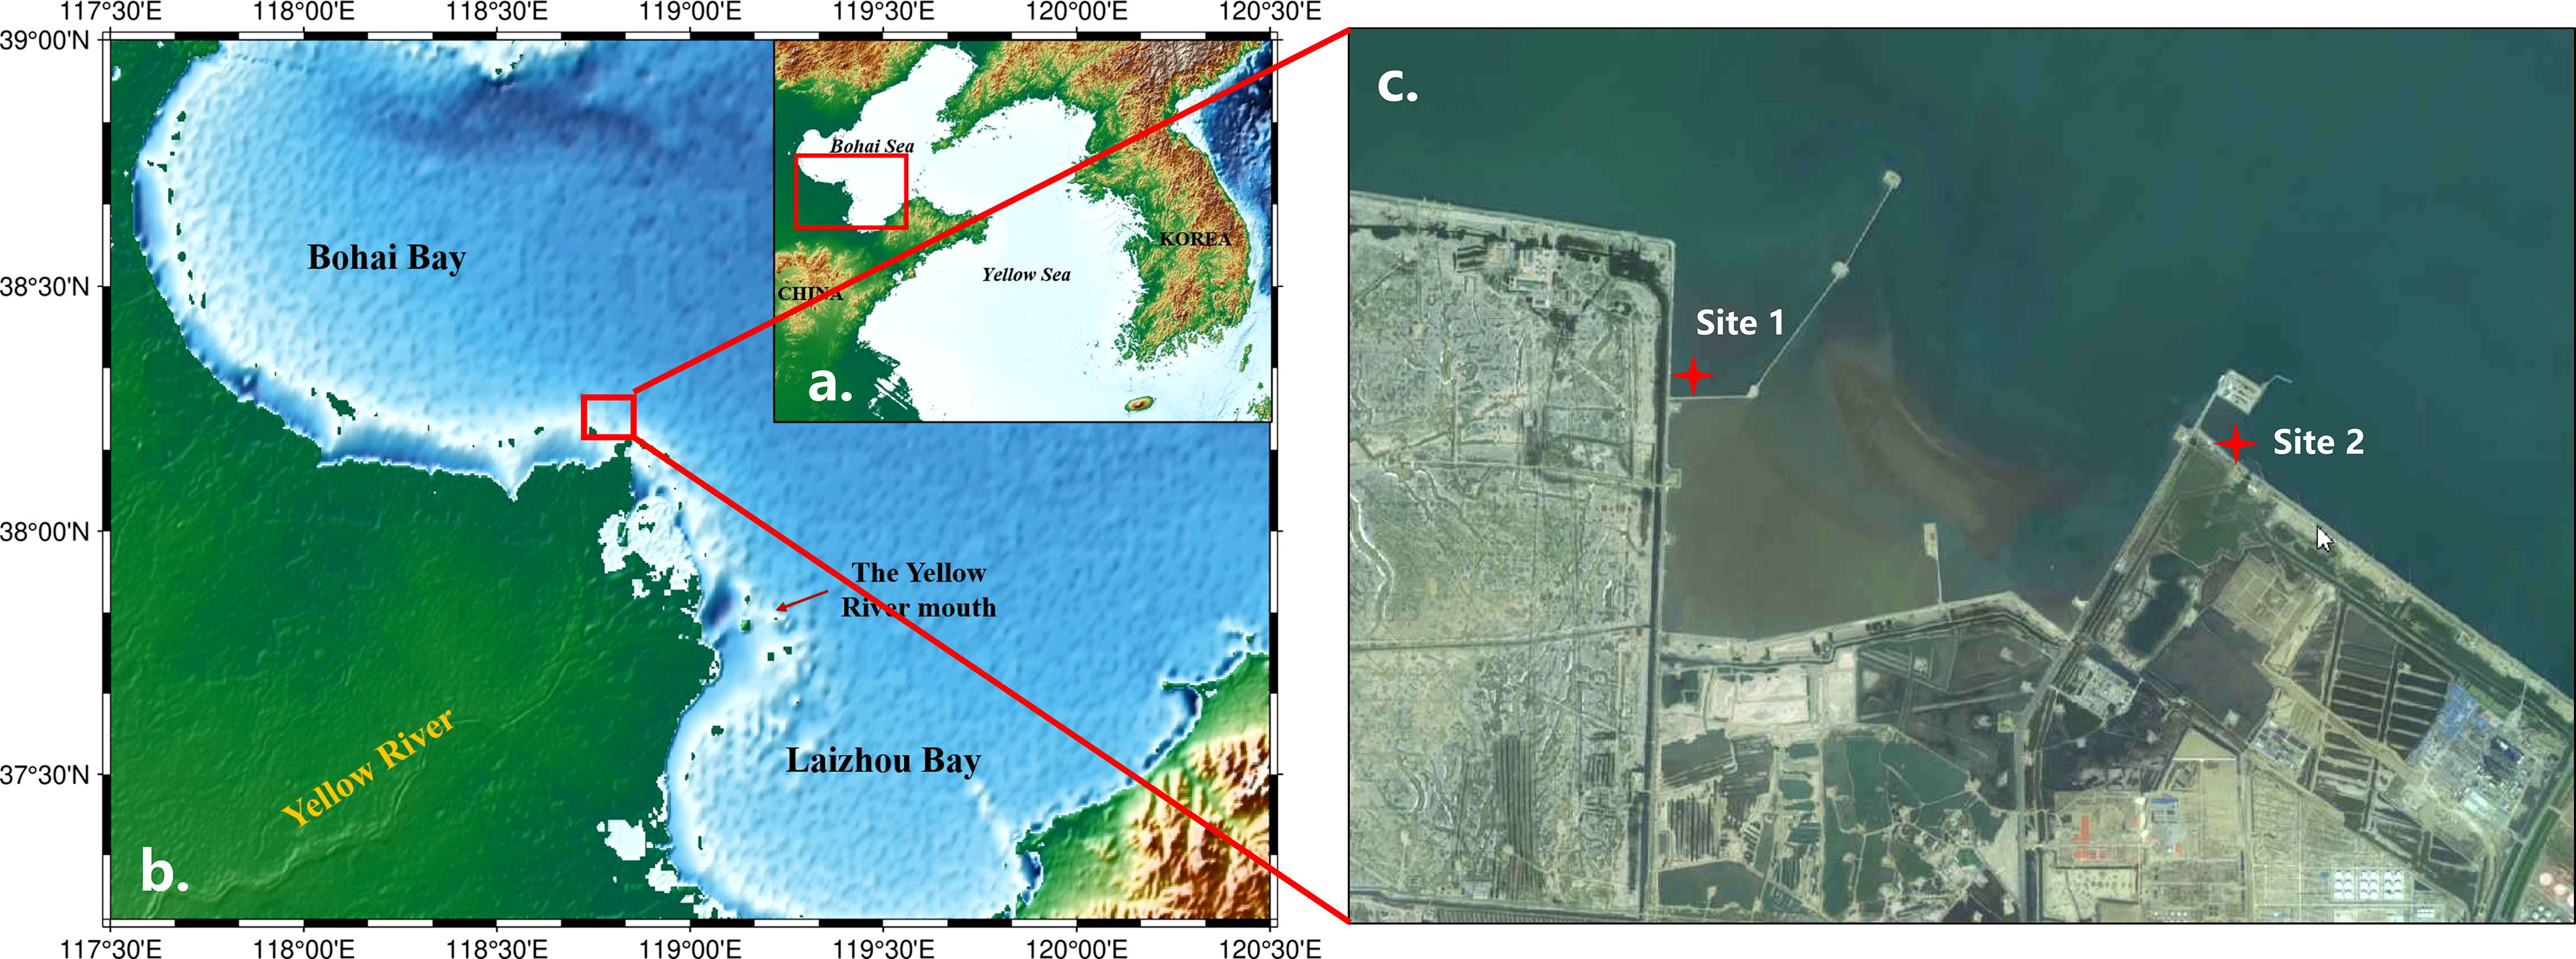
Figure 4 (A) The relative position of the Yellow River Delta (B) The relative position of the study area in the Yellow River Delta (C) Location of the two experimental sites: Site 1, 118.8527E, 38.1356N; Site 2:118.8945E, 38.1327N.
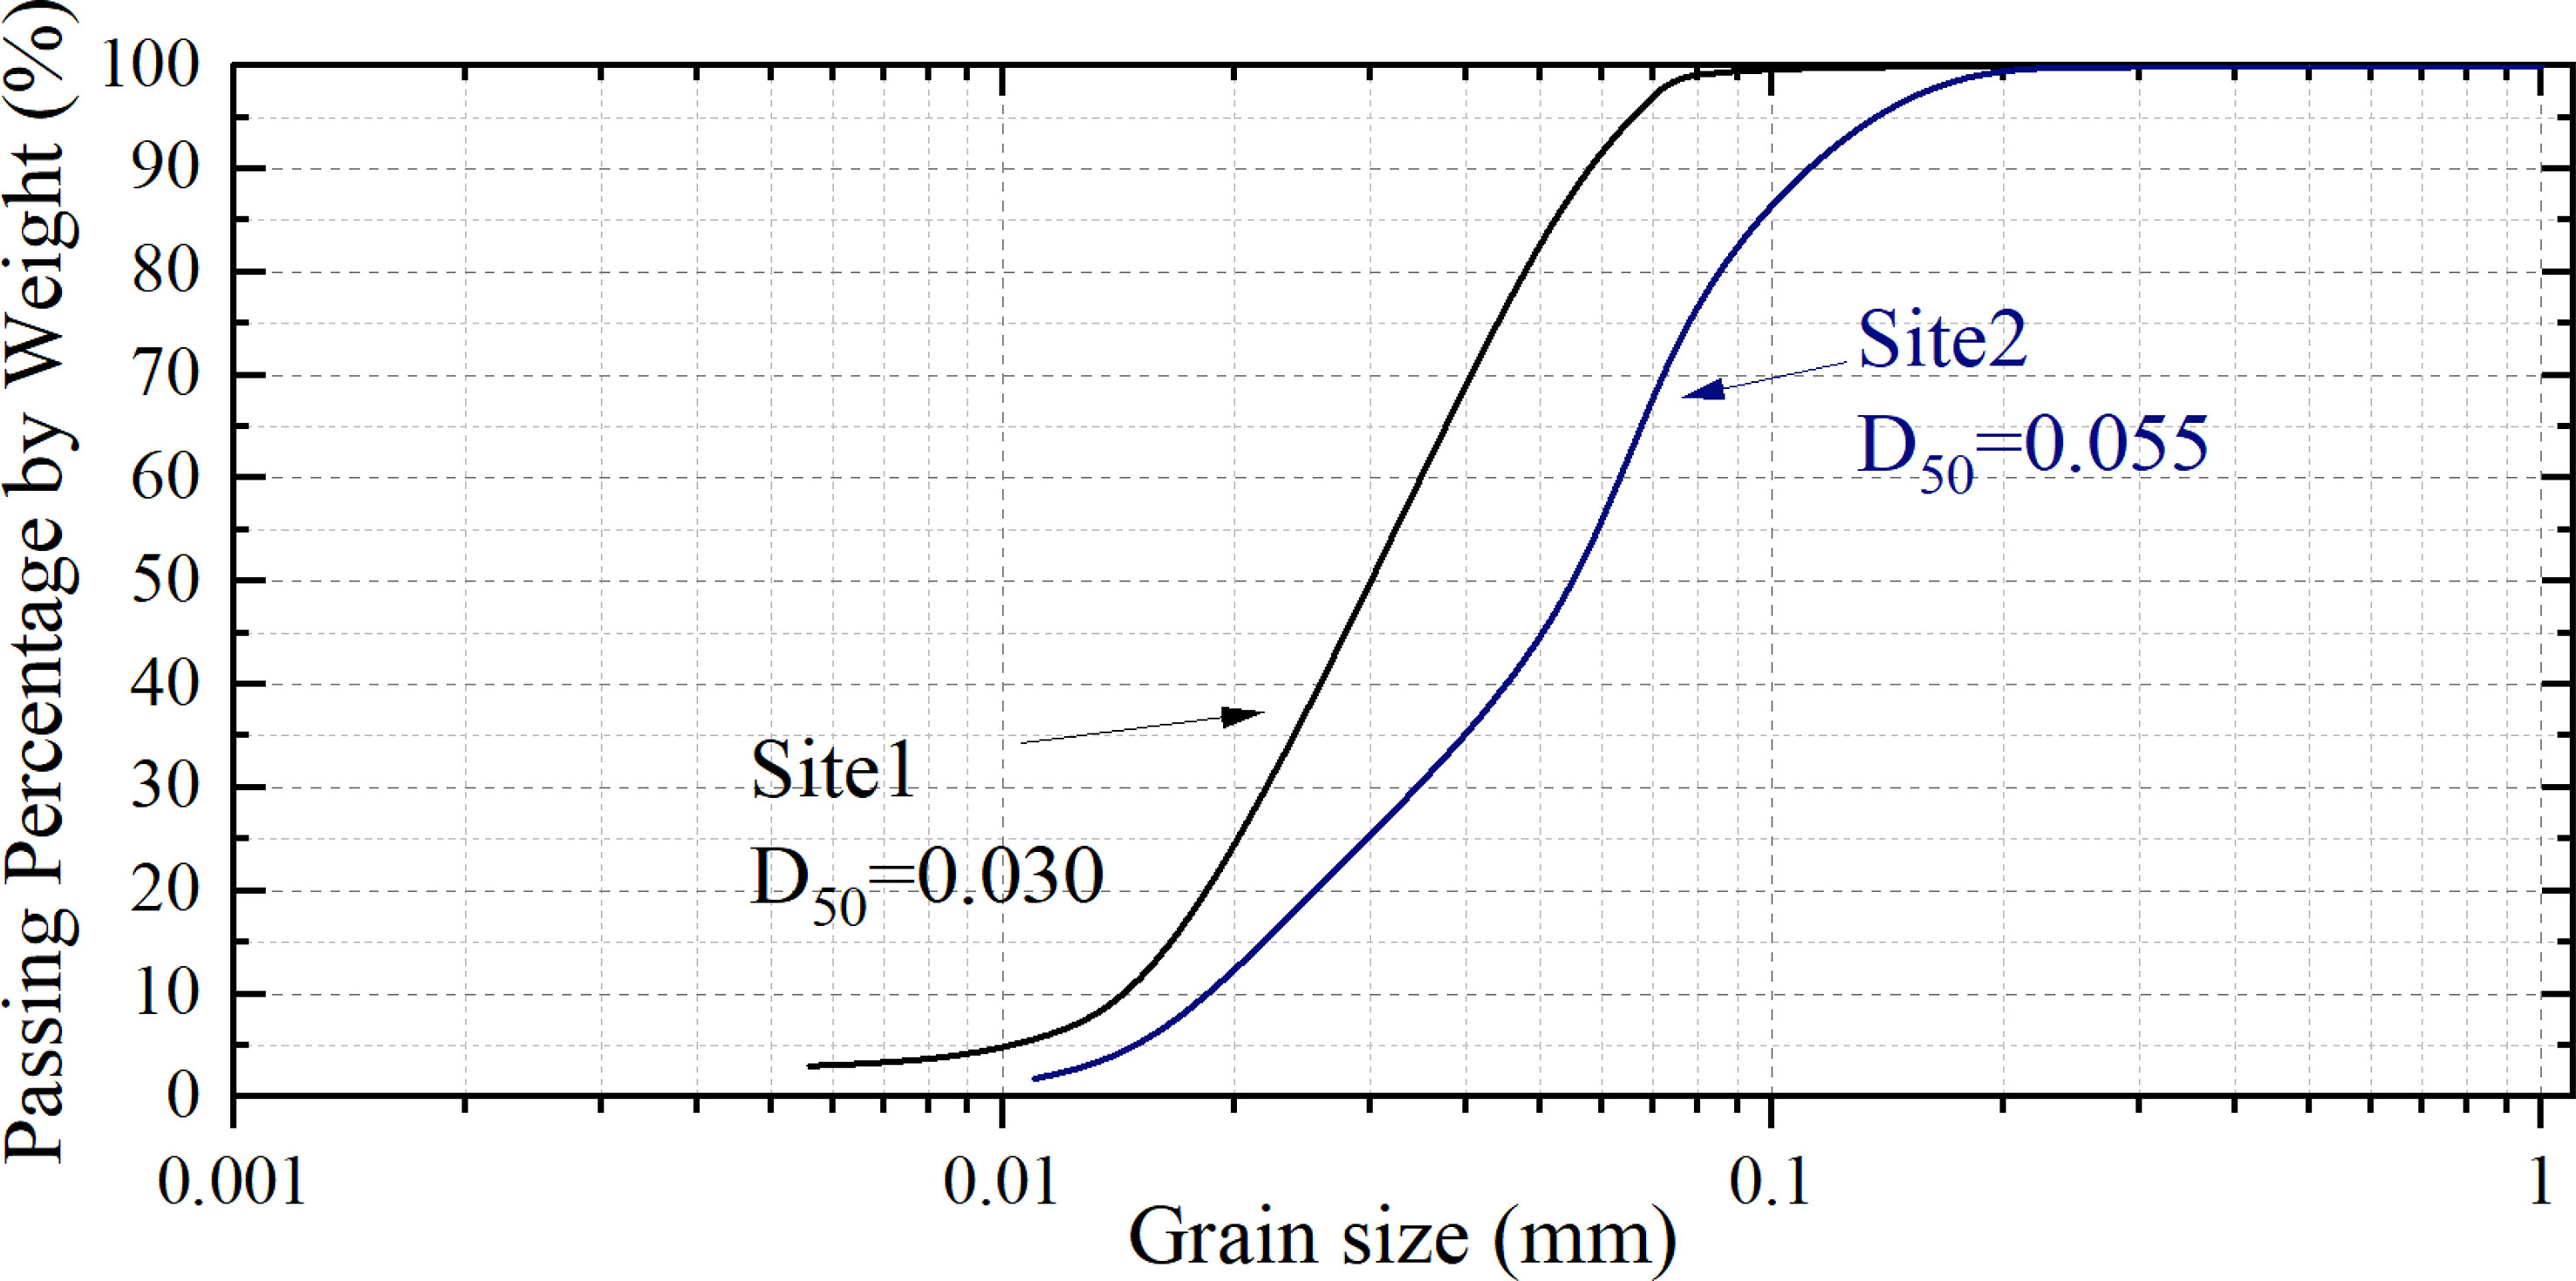
Figure 5 The particle size distribution curves: The black line represents sediments at site 1; the blue line represents sediment at site 2.
The RBR Concerto was set to sample every 3 seconds to obtain the turbidity in the flume. The turbidity data was converted to suspended sediment concentration (SSC) using a linear regression between NTU recorded by the RBR Concerto and SSC. A crane with a 25 m boom was used to lift the in-situ annular flume. The seabed was first determined to be flat before the annular flume was slowly lowered to the seabed. It was left for 30 minutes before the erosion experiments began. Each stepwise bed shear stress was maintained for 5 minutes in each round of experiments. Three groups of erosion experiments were conducted at site 1 and site 2, respectively, resulting in six groups of experiments in total. The turbidity time series data were collected during the experiments to determine the critical shear stress and erosion rate. The turbidity time series were collected during the experiments to determine the critical shear stress and erosion rate.
SSC was used to determine the erosion rate at each stepwise bed shear stress. The SSC time series was then time-averaged every 18 s to eliminate high-frequency short-term variability in the record (Widdows et al., 2007), and erosion rates were calculated.
where ze is the depth of erosion. ρb is the dry bulk density of the bed. M represents the total dry volume of erosion mass in the water column, and is calculated as SSC times Ah, where A refers to the bed area, and h represents the height of the flume channel.
3 Results
3.1 Calibration results of the OUC-IF
3.1.1 Calibrations of the current velocity of the OUC-IF
The current velocity in three directions, u, v, and w, during the experiment period, is shown in Figure 6A. The velocity along the channel direction (u), accounted for the largest proportion, while the velocity across the channel(v), was the smallest. After flow stabilization at each step, the mean velocity V was calculated, and the statistical results were shown in Table 1.
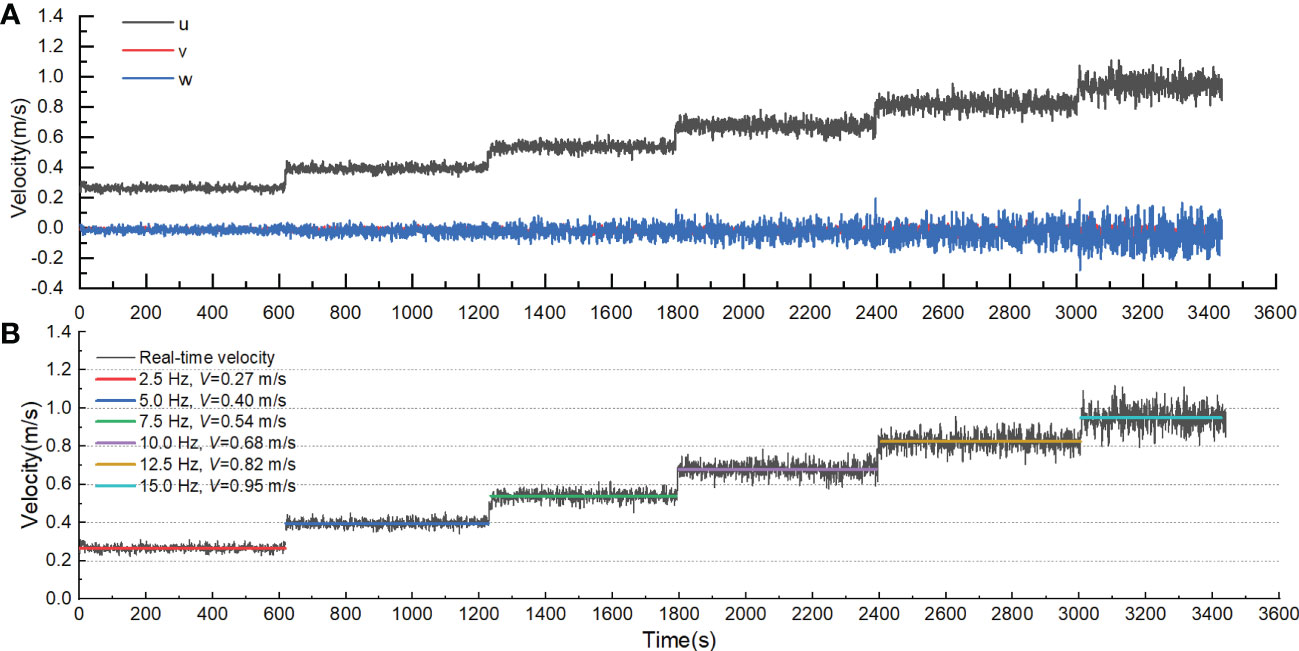
Figure 6 Velocities at different step of motor frequencies: (A) velocities in three directions; (B) Mean velocities at different motor frequencies.
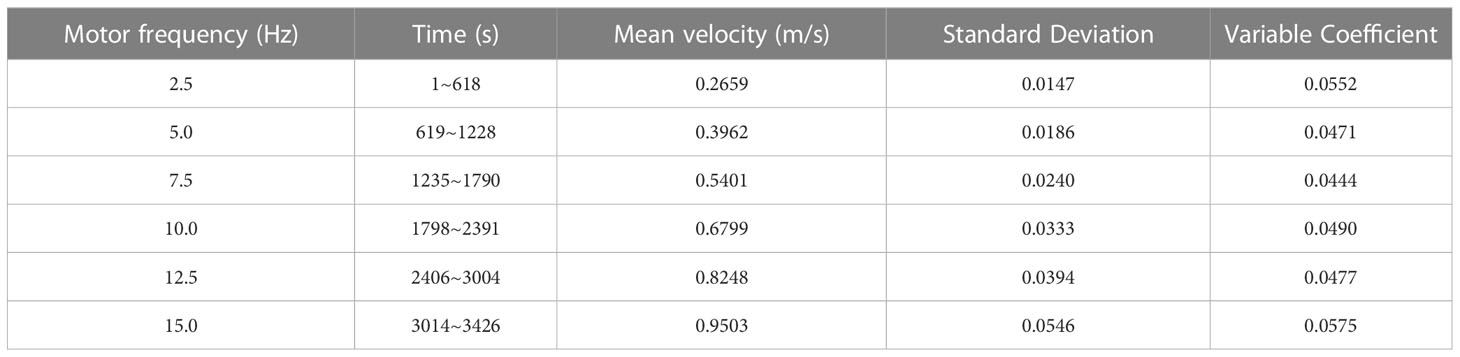
Table 1 Data statistics of the velocity of each stepwise.
The mean velocity V of each step is,
where u, v, w is the velocity in the along channel, vertical, and across channel directions.
The velocities near the bottom in the flume are shown in Table 1 and Figure 6B. The mean velocities corresponding to the six steps were 0.27 m/s, 0.40 m/s, 0.54 m/s, 0.68 m/s, 0.82 m/s, and 0.95 m/s, respectively. The standard deviation (less than 0.03) of velocities at motor frequencies 2.5 Hz, 5.0 Hz, and 7.5 Hz were smaller than those at motor frequencies 10.0 Hz, 12.5 Hz, and 15.0 Hz. This suggests that the stronger the rotational speed of the paddles in the flume, the greater the turbulence effect.
3.1.2 Calibrations of the bed shear stress of the OUC-IF
So far, there is no perfect method to accurately measure or calculate bed shear stress directly, and reliable results can be obtained by using an overall average of multiple methods (Kim et al., 2000; Thompson et al., 2003; Pope et al., 2006; Joshi et al., 2017; Li et al., 2021). In this study, flow-induced bed shear stresses were calculated using three methods: (1) the TKE method, (2) the COV method, and (3) the LP method. In all cases, the bed shear stress increases nonlinearly with the flow velocity.
The mean shear stress for each step is presented in Figures 7, 8, where the LP method yielded the highest values, followed by the TKE method and the COV method. For the first five steps, the difference between the COV and TKE methods was relatively small compared to the difference between these two methods and the LP method. The fluctuations of bed shear stress calculated by the three methods are illustrated in Figure 7. The maximum shear stresses obtained from the TKE and COV methods were 3.97 Pa and 2.97 Pa, respectively, with large fluctuations ranging from 0.23 to 3.96 Pa for the TKE method and from 0.22 to 2.97 Pa for the COV method. The maximum shear stress calculated by the LP method was 2.89 Pa, with small fluctuations ranging from 0.11 to 1.43 Pa and insignificant peaks. The COV method estimated lower bed shear stress than the TKE method because the velocity fluctuation in the vertical direction was smaller and tended to approach zero, resulting in smaller contributions from w’. In contrast, the TKE method considers velocity fluctuations in all three directions. Furthermore, as the in-situ annular flume only transfer the vertical pressure of the wave, the wave orbital shear stress is eliminated. Therefore, only Reynolds stresses are considered when applying the TKE method.
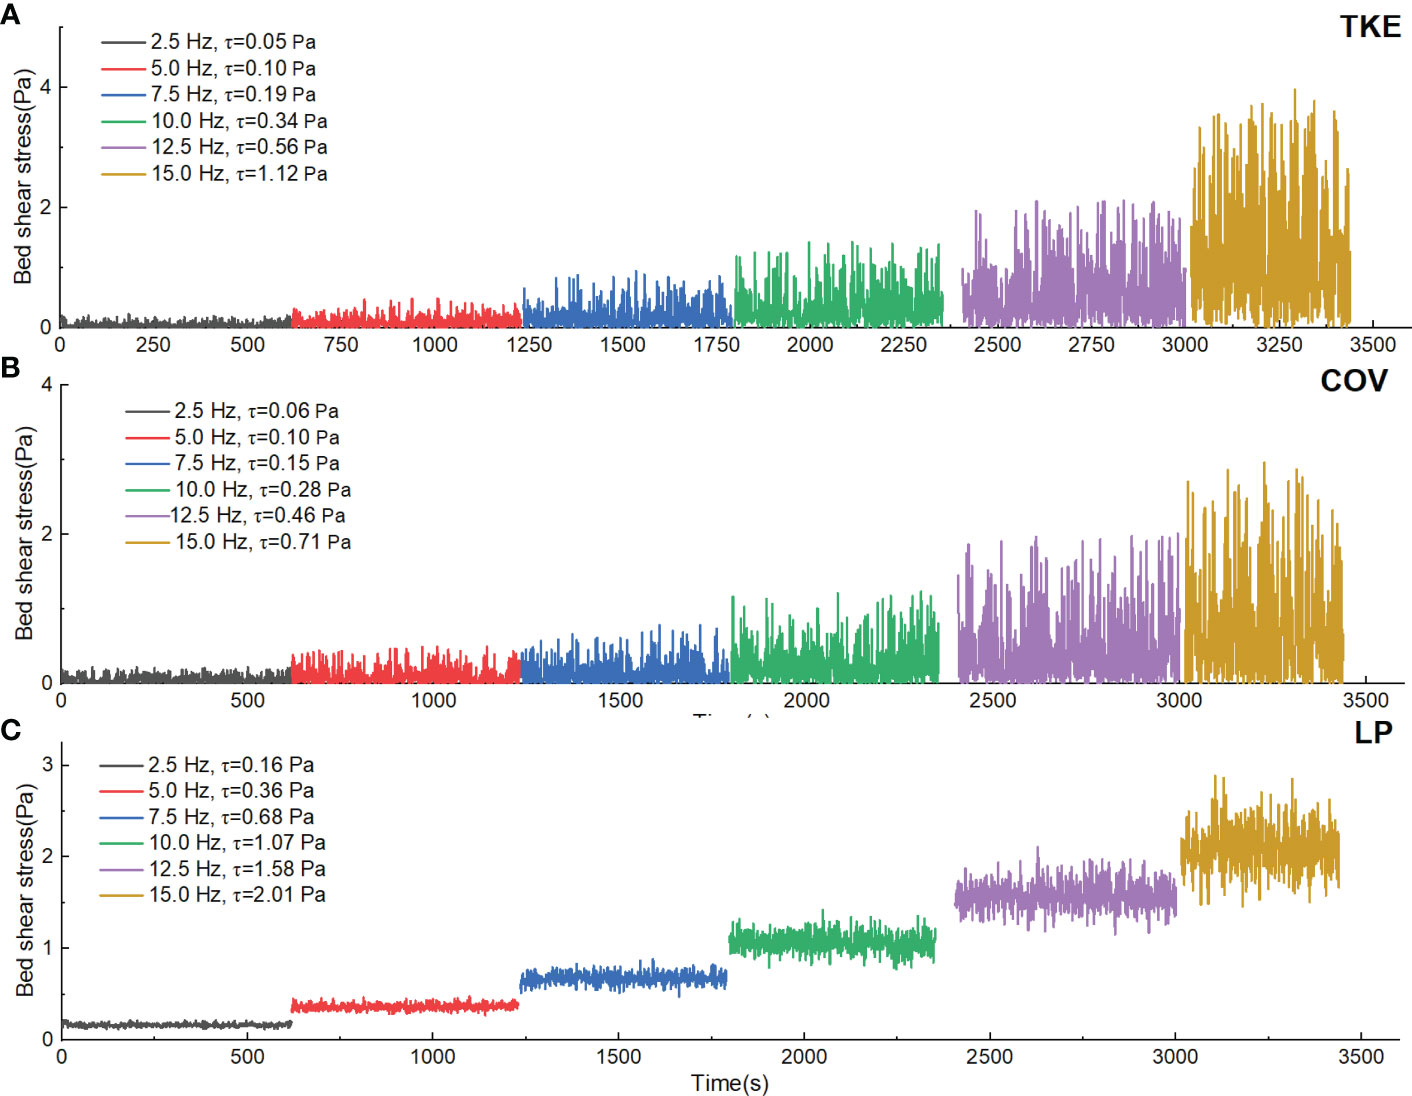
Figure 7 Bed shear stress calculated by (A) TKE method, (B) COV method, (C) LP method.
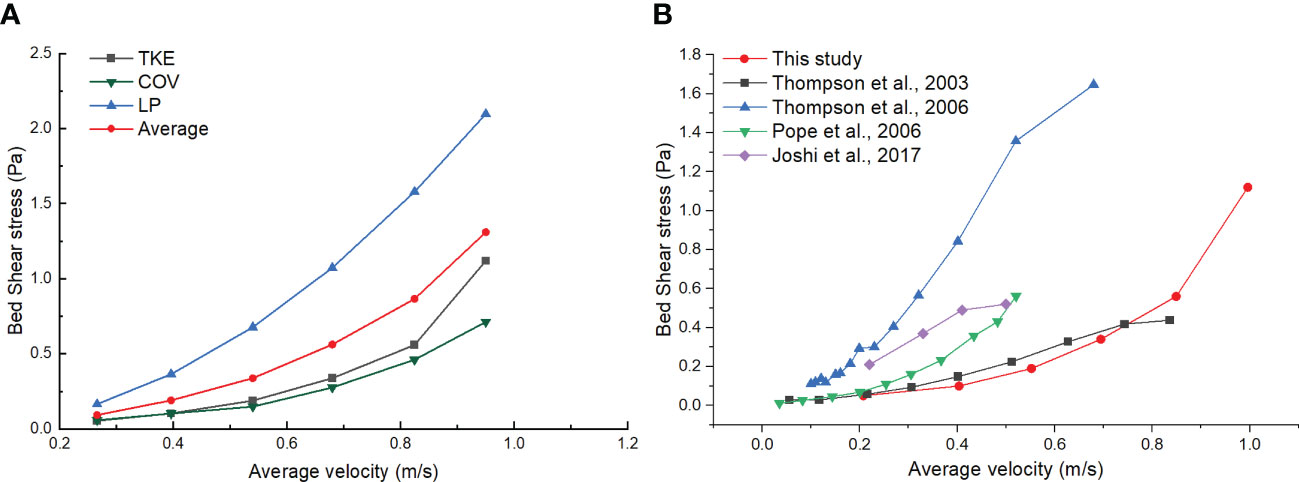
Figure 8 (A) Calculation results of different shear stress methods for different stepwise (mean value) (B) Comparison of the averaged bottom shear stress from this study with Thompson et al. (2003); Thompson et al. (2006); Pope et al. (2006); Joshi et al. (2017), calculated by TKE method.
As shown in Figure 8, the mean shear stress calculated by the TKE method was less than or equal to the COV method, except for motor frequencies between 7.5 Hz and 15.0 Hz. The difference between them increased at higher motor frequencies, with the largest difference of 0.41 Pa observed at a motor frequency of 15.0 Hz. The LP method consistently produced higher mean shear stress values than both the TKE and COV methods.
Numerous studies have compared various methods of near-bottom shear stress and have highlighted their respective advantages and disadvantages (Zhang Q et al., 2018; Kim et al., 2000; Amos et al., 2003; Amos et al., 2004; Thompson et al., 2004; Verney et al., 2006; Andersen et al., 2007; Salehi and Strom, 2012). The LP method heavily relies on precise and synchronous velocity measurements at different heights, which can be challenging to achieve, particularly in laboratory conditions (Thompson et al., 2003). The COV method is highly sensitive to sensor deviations, a characteristic that is likely to occur in annular flumes where the flow is non-linear (Pope et al., 2006). In comparison to the LP method, the TKE method does not require precise knowledge of the elevation of bed sediment (Thompson et al., 2003; Pope et al., 2006; Thompson et al., 2006). Thompson et al. (2003) measured velocity in an annular flume using Laser Doppler Velocimetry (LDV) at heights of 0.002, 0.005, 0.01, 0.015, 0.03, 0.05, and 0.10 m, and Acoustic Doppler Velocimetry (ADV) at a single height of 0.01 m. The TKE method produced very similar shear stress results between the two instruments, with differences only in the detection error of the system. In the hydrodynamic environment of an annular flume, the TKE method only requires velocity measurement data to be collected at a fixed point in the near-bed region to estimate shear stress.
Moreover, the TKE method has significant advantages when applied to 3D velocity measurements in an annular flume of the same dimensions as the one used in this study (Thompson et al., 2004). Based on the analysis of bed shear stress time series trend, magnitude, dispersion, and correlation with the signal-to-noise ratio, the TKE method is deemed the most appropriate method for bed shear stress estimation (Kim et al., 2000; Salehi and Strom, 2012). In comparison with previous studies, the bed shear stress calculated using the TKE method in this paper is similar to that obtained by Thompson et al. (2003), with an average velocity of 0 to 0.8 m/s, as illustrated in Figure 8B.
3.2 Results of field measurements
3.2.1 Critical shear stress from field measurements
The determination of the critical shear stress relies on the observed a sudden increase of the SSC during erosion experiments, rather than a fixed SSC value (Sutherland et al., 1998; Maa and Kim, 2001; Thompson et al., 2019). Thus, the SSC was measured during the erosion experiments in the flume. The initial SSC recorded at the start of the experiment was approximately 0.1 g/L.
Two erosion experiments were undertaken at two different sites, and the time series of bed shear stress and SSC during these experiments are presented in Figure 7. The in-situ flume was set up for 30 minutes before the start of each experiment, and each experiment lasted for approximately 30 minutes. However, it should be noted that the latter experiments conducted at site1 and site2 were shorter, lasting only two minutes for each step. The maximum current velocity in the flume reached 0.95 m/s, corresponding to a maximum shear stress of 1.12 Pa (as calculated using the TKE method). Throughout the experimental process, two significant increases in SSC were observed, indicating the occurrence of erosion at the corresponding bed shear stress.
At site 1, following the first erosion event, the change in SSC exhibited Type Ia erosion characteristics (Sanford and Maa, 2001; Maa et al., 1998; Amos et al., 1997), with the rate of growth of SSC decreasing with time until it reached a constant value. With the increase in bed shear stress, a second erosion event occurred, resulting in a small increase in SSC. Subsequently, the bed shear stress was increased again, and the SSC stabilized at approximately 5.4 g/L. The critical shear stresses for sediment at site1 and site2 were 0.10 Pa and 0.19 Pa, respectively. As illustrated in Figure 9 and Table 2, the grain size of sediment at site2 was larger than that at site 1, which may have contributed to the larger critical shear stress observed.
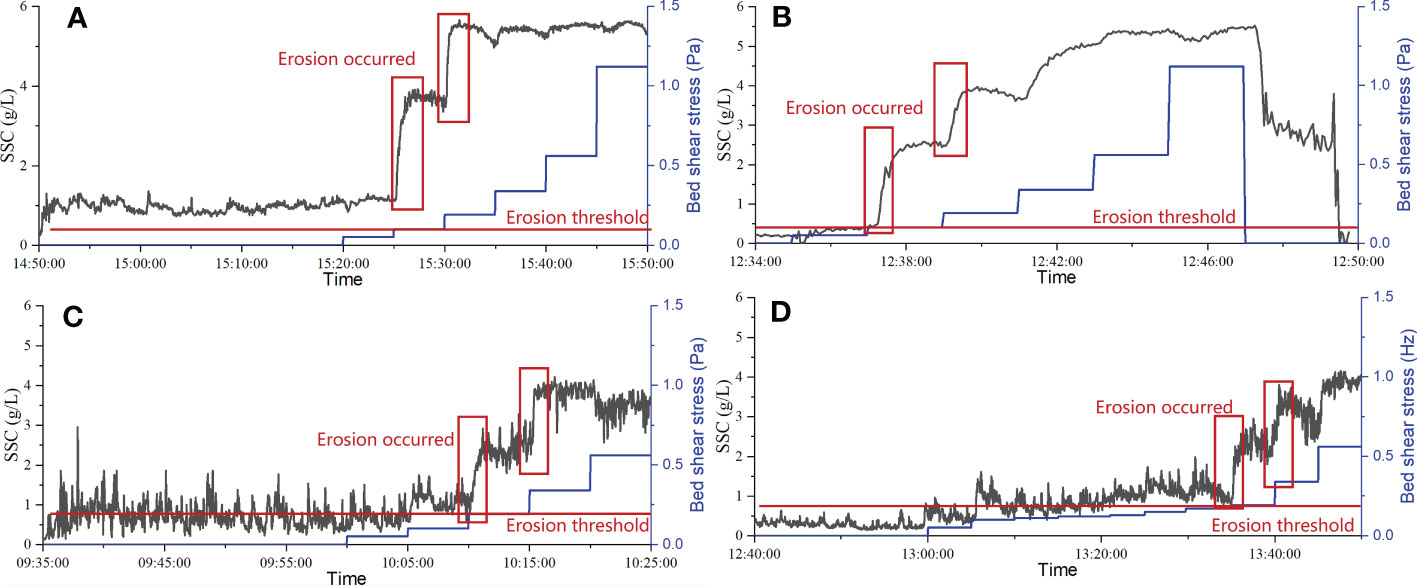
Figure 9 The SSC changes during the experiment in the flume: (A, B) represent features at site 1, which critical shear stress is 0.10 Pa; (C, D) represent features at site 2, which critical shear stress is 0.19 Pa.
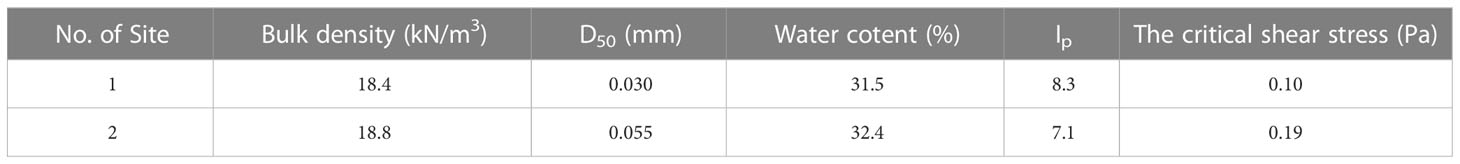
Table 2 Results for the field experiment, including physical parameters and the critical shear stress.
3.2.2 Critical shear stress under wave pressure from field measurements
The wave pressure conduction device was turned on at site1 and site2 points for measurement experiments, as depicted in Figure 10. The critical shear stresses under the condition of wave pressure were found to be 0.10 Pa and 0.19 Pa, respectively, as shown in Figures 10A, 10B, and these values were with those obtained in the absence of wave pressure. Furthermore, Figures 10C, D depict the wave height changes during the experiments at site 1 and site 2, respectively, with the maximum wave heights recorded at 0.02 m and 0.03 m, respectively.
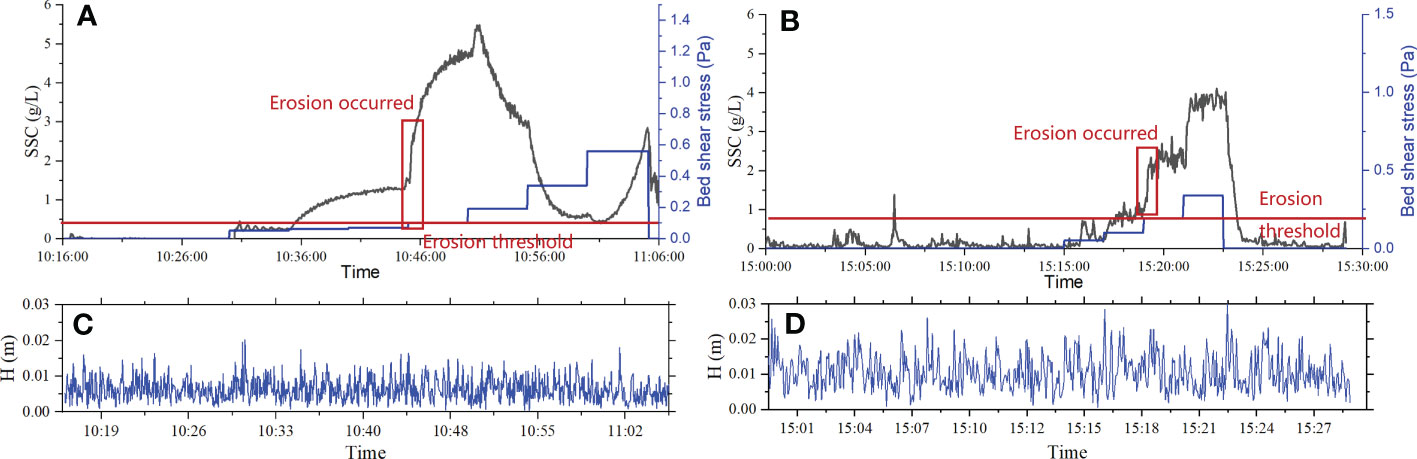
Figure 10 Erosion process under wave pressure. (A, B) show the SSC during the experiment period in site 1 and site2 respectively; (C, D) show the wave height during the experiment period in site 1 and site2 respectively.
4 Discussion
4.1 Critical shear stress of sediment in the subaqueous Yellow River Delta
Intertidal sites in the Yellow River Delta are composed of different sediment types, including silty clay, clay silt, and sand silt.In previous works, five methods were used to determine the critical shear stress of sediments: the laboratory annular flume, the laboratory straight flume, the Cohesive Strength Meter (CSM), the in-situ recirculating flume, and empirical formulas. In addition, we calculated the sediment critical bed shear stress using the equation of van Rijn (2007), which considers the viscosity between sediment particles.
where the critical bed-shear stress of noncohesive sediments , the critical shields parameter , the dimensionless particle size , and the gelling volume concentration of sediments ; s is the ratio of densities of sediment and water; ν is the kinematic viscosity of water (m2/s); α is the empirical coefficient (α = 1 herein); is the maximum volume concentration of sandy sediments; g is the acceleration of gravity (m/s2); γ is the experience coefficient (generally 1.5), Dsand = 62.5 μm; D is the sediment grain size; pcs is the percentage of clay components; and ρ and ρs are the water and sediment particle density (kg/m3), respectively.
To visually compare the different methods used to measure and calculate the critical shear stress of sediments in the Yellow River submerged delta, the data in Table 3 have been plotted in Figure 11. Given the limited data obtained in our experiment, we analyzed more in-situ data obtained with the in-situ recirculating flume on the tidal flats of the Yellow River Delta, resulting in critical shear stresses ranging from 0.023 to 0.254 Pa (Meng et al., 2012; Zheng et al., 2013).The erosion thresholds, measured by Meng et al. (2012), ranging from 0.088 Pa to 0.254 Pa, which is in general agreement with the measured erosion thresholds (0.10 Pa to 0.19 Pa) presented in this paper. As shown in Figure 11, the data from Meng et al. (2012) does not exhibit a strong negative correlation between median grain size and critical shear stress, and the data exhibits significant dispersion. For example, when d50 = 0.027 for S1-6 and S1-7, the critical shear stress is 0.115 Pa and 0.09 Pa, respectively, and when d50 = 0.042 for S4-1, the critical shear stress is 0.196 Pa. By comparing the data from these three points, we found that the critical shear stress increases with the increase of water content and decreases with the decrease of plasticity index. The erosion thresholds, measured by Zheng et al. (2013), ranging from 0.023 Pa to 0.088 Pa. as shown in Figure 11, the critical shear stress decreases with increasing D50. Notably, 0.088 Pa is the critical shear stress for undisturbed sediments in their natural state, while the critical shear stress for sediments at the surface decreases under wave loading, ranging from 0.023-0.066 Pa. Thus, in addition to D, wave-soil interaction is an important factor that influences the critical shear stress in sediments. Although based on a small amount of data, we hypothesize that the critical shear stress of sediment is related to water content, plasticity index and wave-seabed interaction. To analyze how the properties of sediment influences the critical shear stress, further field data collection is required.
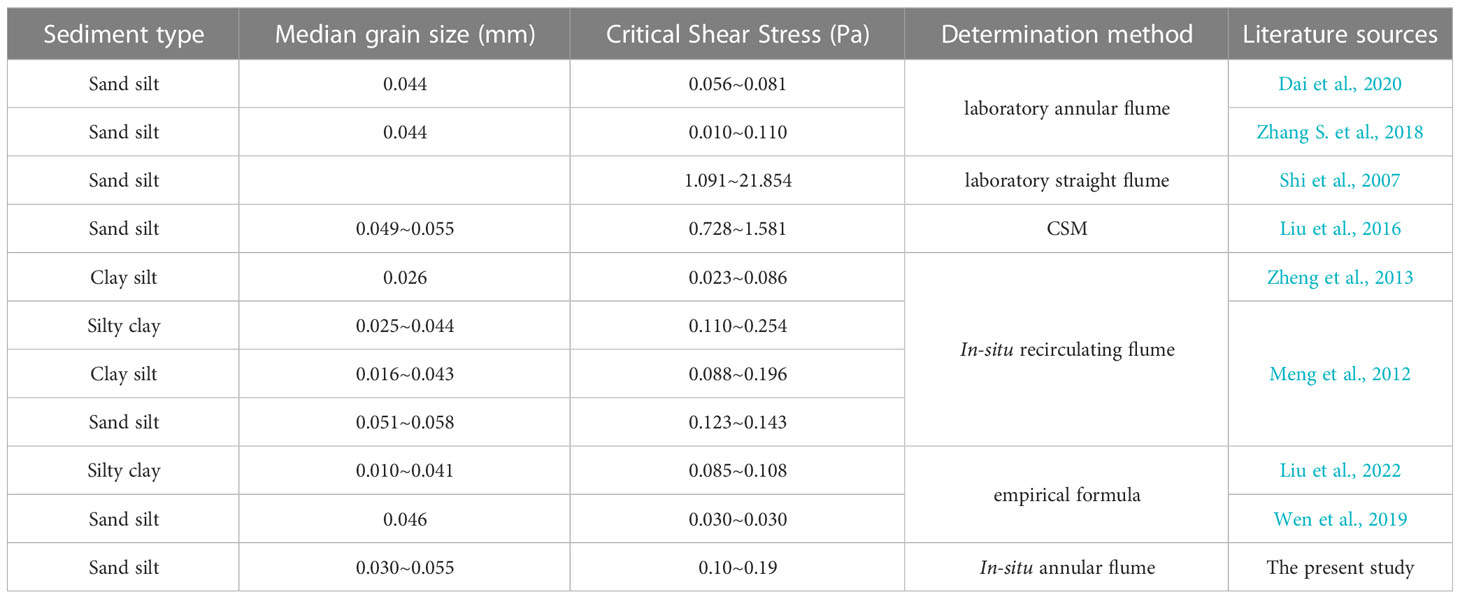
Table 3 Critical shear stress of sediment in the Yellow River Delta subaqueous.
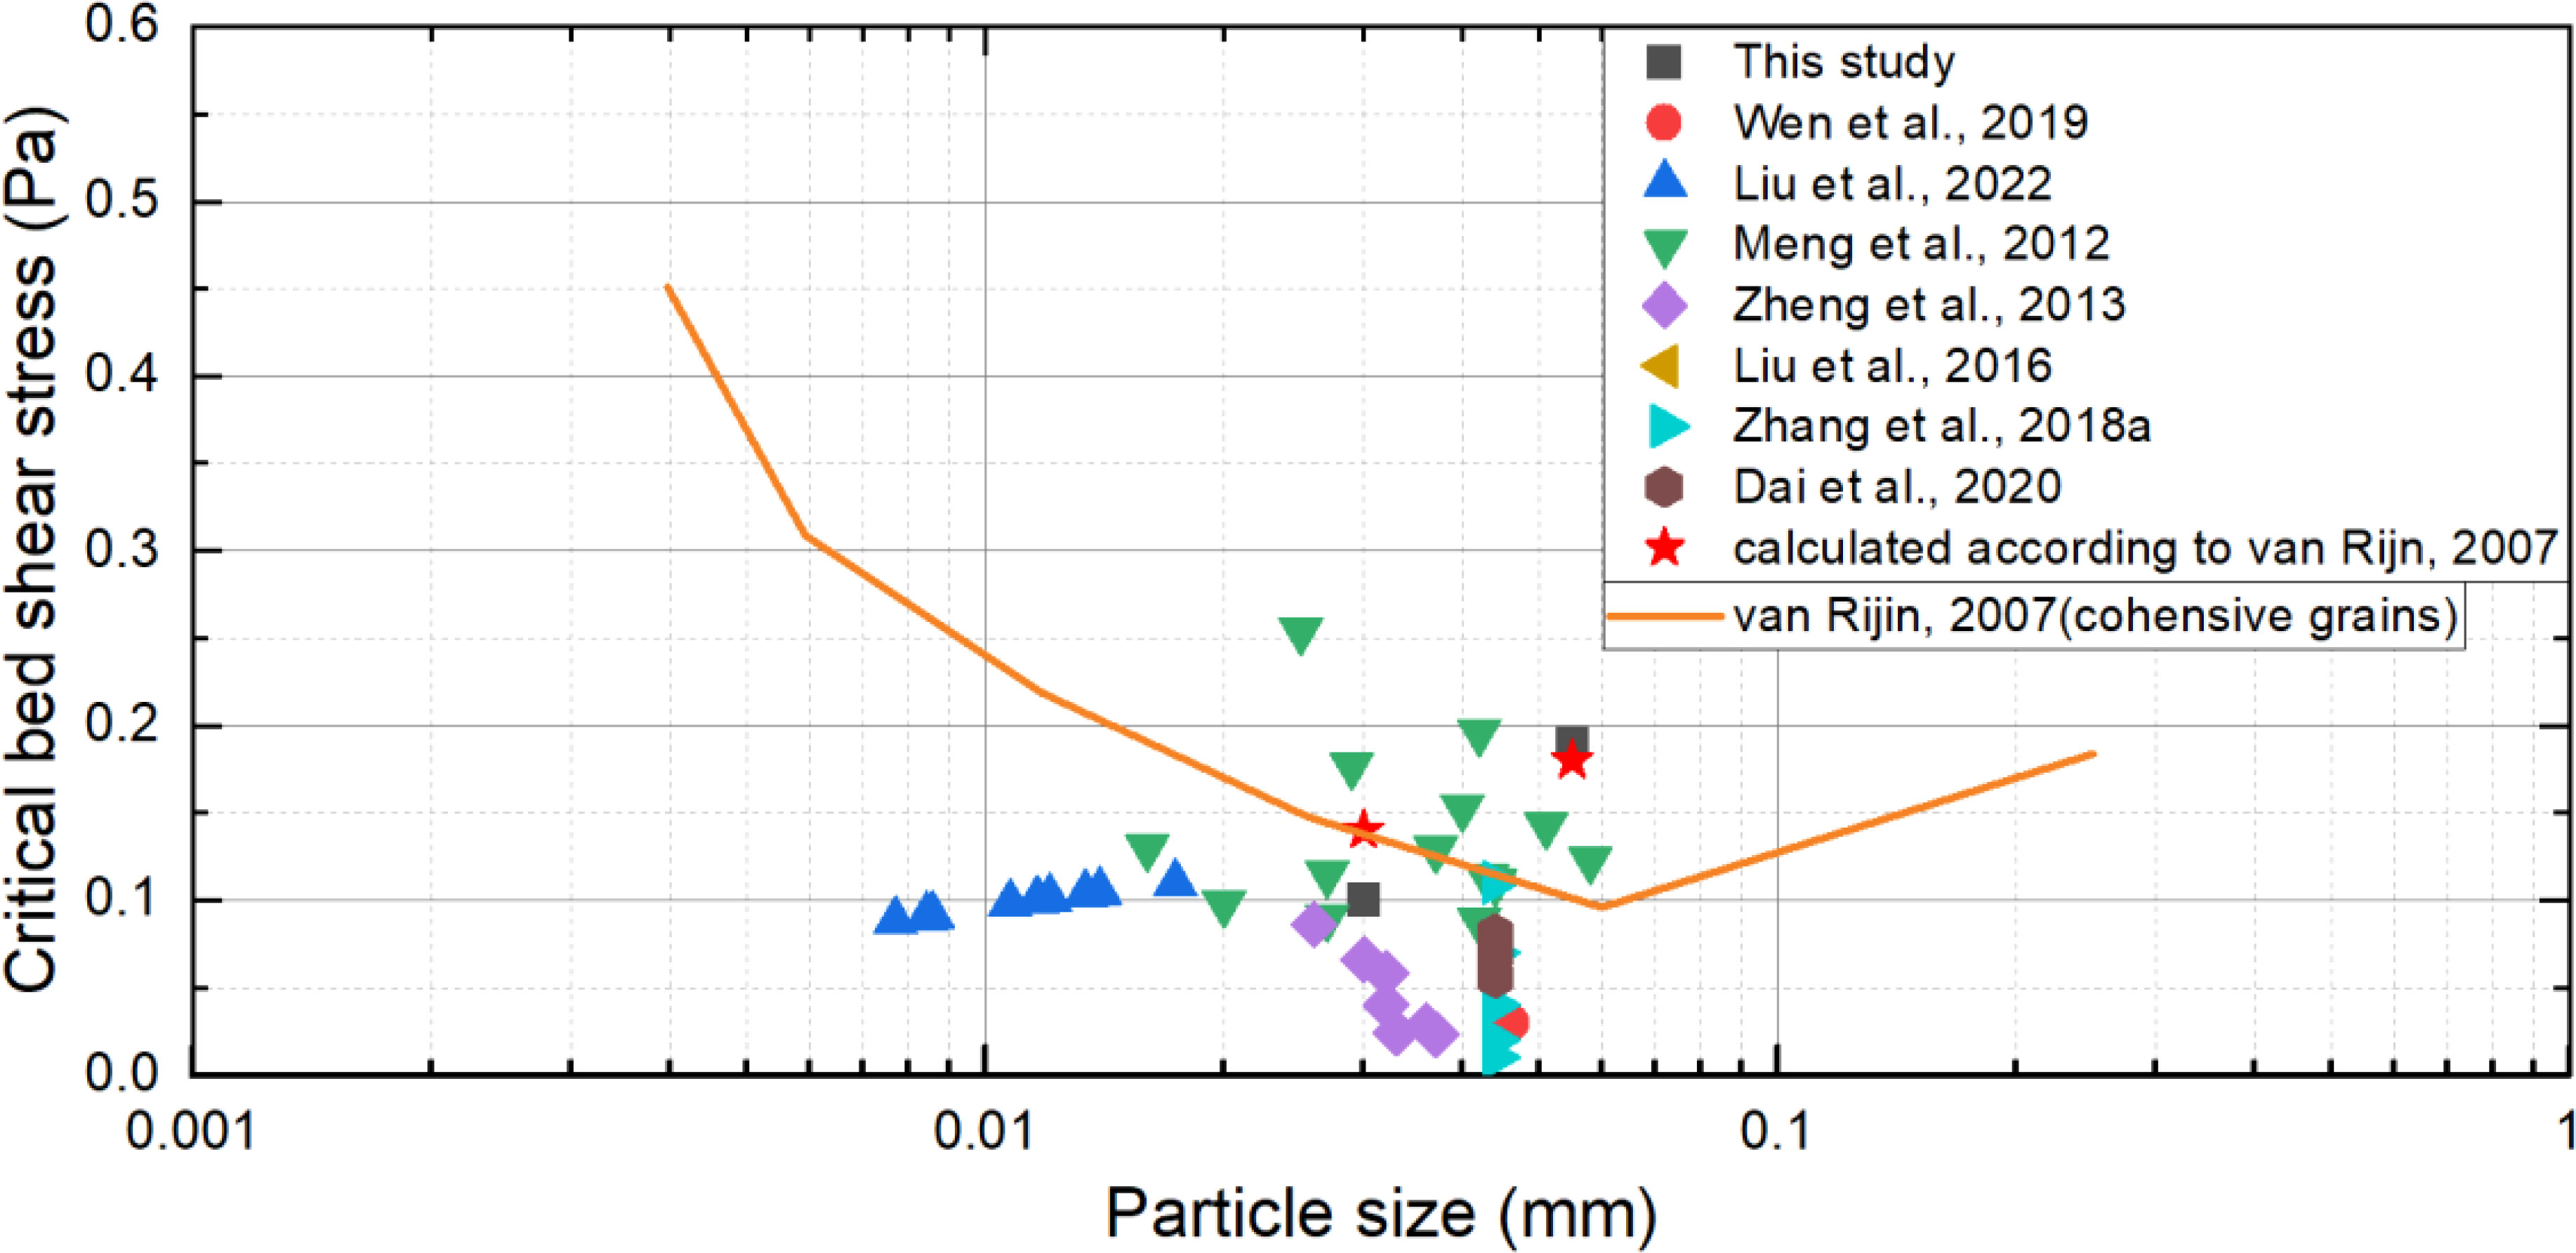
Figure 11 Comparison of critical shear stresses of sediment in the Yellow River Delta subaqueous.
For remoulded soils, laboratory annular flume tests resulted in critical shear stress values ranging from 0.056 to 0.081 Pa (Dai et al., 2020) and 0.010~0.110 Pa (Zhang S. et al., 2018). Dai et al. (2020) investigated the effect of salinity on the critical shear stress of sediments, while Zhang S. et al. (2018) parameterized the effect of liquefaction degree on the critical erosion shear stress and erosion coefficients Me. The critical shear stress of core samples increased with the depth of the eroded sediment mass (Shi et al., 2007), ranging from 1.091 to 21.854 Pa, which is much larger than other results in Table 3 due to the higher degree of soil consolidation in deeper soil layers. Liu et al. (2016) utilized CSM to test the erosion resistance of fine-grained sediments in the tidal flats of the Yellow River Delta. The results showed that the critical shear stress of the fine-grained sediments ranged from 0.728 to 1.581 Pa, and increased linearly with the salinity of the deposition environment. Numerous scholars have compiled and analyzed a substantial quantity of experimental data to derive empirical equations for both sediment grain size and the critical shear stress (Roberts et al., 1998; Dou, 1999; van Rijn, 2007). As shown in the Figure 11, as the particle size decreases, the critical stress rapidly decreases, reaches a minimum value, and gradually increases. Additionally, for smaller particles, the critical shear stress exhibits a strong dependence on the packing density and increases as the particle size decreases (van Rijn, 2007).The empirical formula suggested by Dou (1999) was often used on numerical simulations of sediment transport in (Li et al., 2020; Liu et al., 2022; Wen et al., 2019; Lu et al., 2011), and the calculated critical shear stress ranged from 0.030 to 0.108 Pa. The critical shear stresses calculated with equation (8) at site1 and site2 is 0.14 Pa and 0.18 Pa, respectively. The lower critical shear stress at site 1 compared to site 2 may be due to the difference in sediment density between them. In comparison to the measurements obtained in the present study, the measurements of the laboratory straight flume and CSM are significantly larger, while those of the laboratory annular flume and those calculated with the empirical formula are smaller. Moreover, on average, the erodibility measured by SEDFLUME was greater than that measured by FLUME (Ravens, 2007). In general, the in-situ measurement method is considered more accurate, advanced and reliable than laboratory experimental methods as it avoids changes in the physical characteristics of sediments during transportation to the laboratory. However, the annular flume developed in this study can overcome this drawback and provide more accurate results of sediment erodibility.
4.2 Erosion rate of sediment
The type of erosion was determined by analyzing the trends in erosion rate through time series of SSC, as previously described in studies by Amos et al. (1992b) and Sanford and Maa (2001). Figure 11 corresponds to erosion rate at site1 (as shown in Figure 8A) and Figure 12B corresponds to erosion rate at site2 (as shown in Figure 10B). The erosion rate peaks at each erosion occurrence and then decreases over time. Using this method, the changes in erosion rates during the experiments at site1 and site2 were obtained. The type of sediment erosion has a significant effect on net erosion, as reported by Amos et al. (1992b). The erosion experiments conducted in this study showed that Type Ia erosion (Parchure and Mehta, 1985; Sanford and Maa, 2001) occurred at both site1 and site2 during the first erosion occurrence, which is characterized by erosion rate decaying to zero with time, as illustrated in Figure 12A.
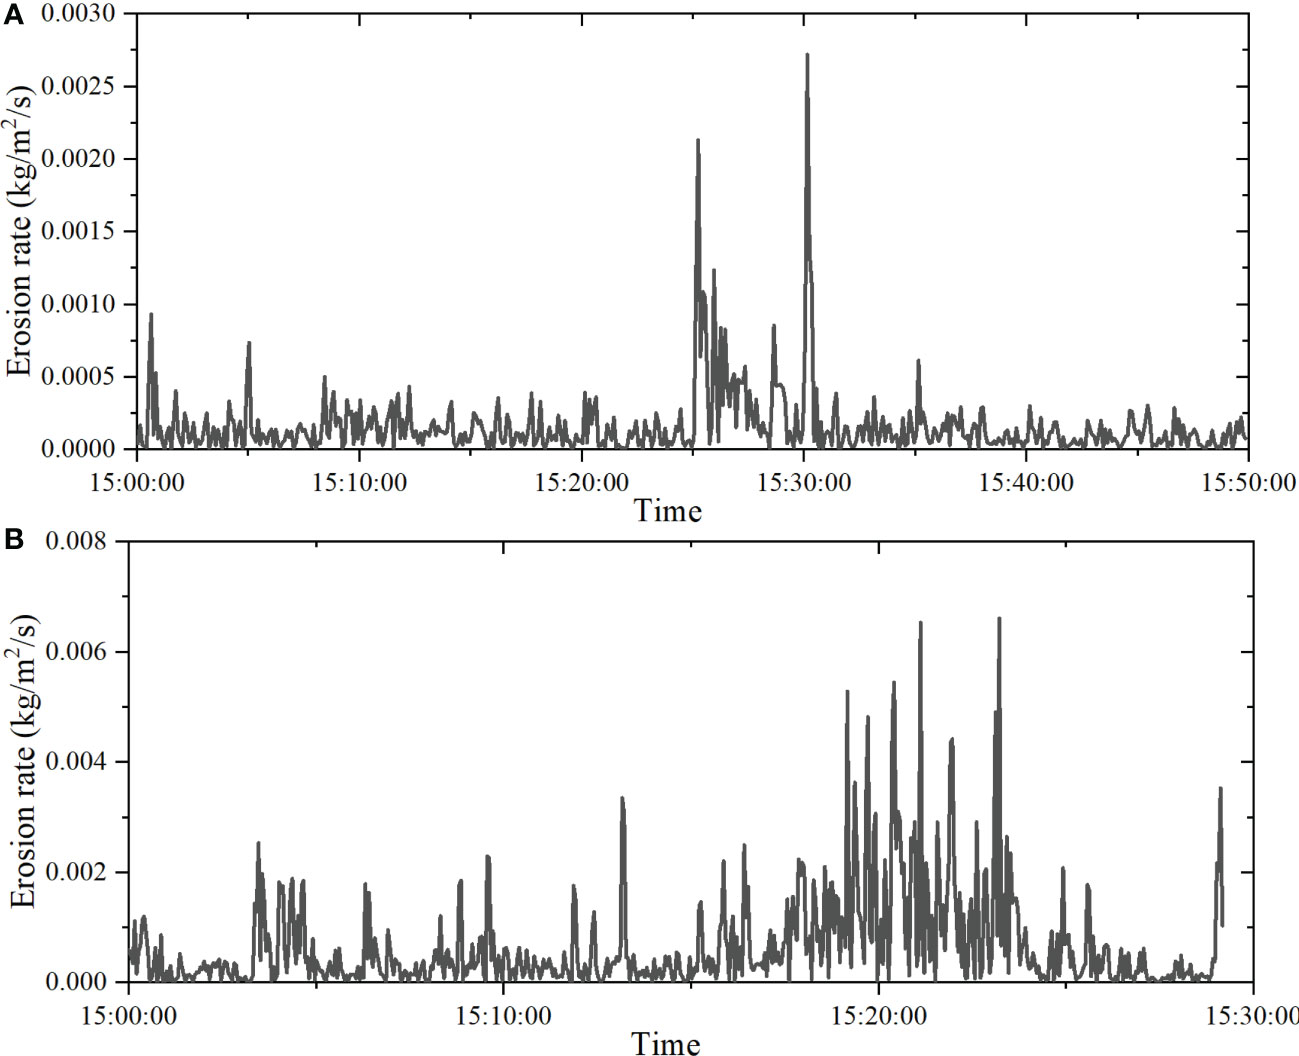
Figure 12 Erosion rates vary with time: (A) the erosion rate at site1, corresponding to (A) in Figure 8; (B) the erosion rate at site2, corresponding to b in Figure 10.
4.3 Influence of wave-seabed interaction on the critical shear stresses
Based on power-rate erosion models of sediments (Maa et al., 1998; Sanford and Maa, 2001), the erosion coefficient (Me) of the seabed can be obtained from a series of linear regressions of the erosion rate (Er) on the excess shear stress (τb) for known bottom bed parameters (φ) (Maa and Lee, 1997).
The erosion coefficient of sediments is not a constant value, but a function of various factors. One such factor is the degree of liquefaction of the sediment, which affects the erosion coefficient significantly. Zhang S. et al. (2018) demonstrated that the erosion coefficient of a sediment decreases with increasing liquefaction (residual excess pore pressure). Additionally, Green and Black (1999) observed that the erosion coefficient is a complex function of surface friction and is sensitive to changes in the critical erosion shear stress (τcr). Thus, the erosion coefficient is influenced by changes in erosion resistance, which can vary depending on the sediment properties and conditions.
The erosion resistance of sediments can be affected by the degree of seabed liquefaction, and a key indicator of the degree of liquefaction is the excess pore pressure. When the wave-induced pore pressure is equal to the overlying effective stress, the sediments undergo liquefaction and are then easily mixed vertically into the overlying water column by tidal start (Mehta et al., 1989; Wolanski and Spagnol, 2003; Tzang et al., 2009). According to the experimental results of Zhang S. et al. (2018), the erosion coefficient of the Yellow River Delta sediments can increase 6-7 times, from 8.27 E-05 to 5.44 E-04 kg m-2 s-1, by gradually transforming from normal consolidation to a fully liquefied state. As the degree of liquefaction increases, the erosion constant follows a power-law increase in accordance with the mathematical relationship by Zhang S. et al. (2018):
The seabed is considered to be a homogeneous poro-elastic medium of finite depth exposed to dynamic and spatially variable forcing at its horizontal surface due to wave-induced excess pressures (Hsu and Jeng, 1994; Jeng, 2017). Further, a dimensionless liquefaction degree fd can be calculated according to the following equation (Jia et al., 2014),
where is the degree of seabed liquefaction; is the overlying seabed effective stress when the sediment is in normal consolidation; =1 kN/m3 is the effective capacity of normally consolidated sediment; z is the calculated depth (assumed to be 0.25 m).
The wave-induced sediment pore pressure pp can be calculated by equations (Jeng, 2017):
where is horizontal effective stress, σ is vertical effective stress, is shear stress (Hsu and Jeng, 1994; Klammler et al., 2021).
According to the data presented in Figure 13, liquefaction at site 1 and site 2 during the experiment reached 0.035 and 0.057, respectively, with corresponding average values of 0.0036 and 0.0062. Notably, the overall liquefaction at site 1 was smaller than that observed at site 2. This finding is in line with the trend of wave height variation shown in Figure 10.
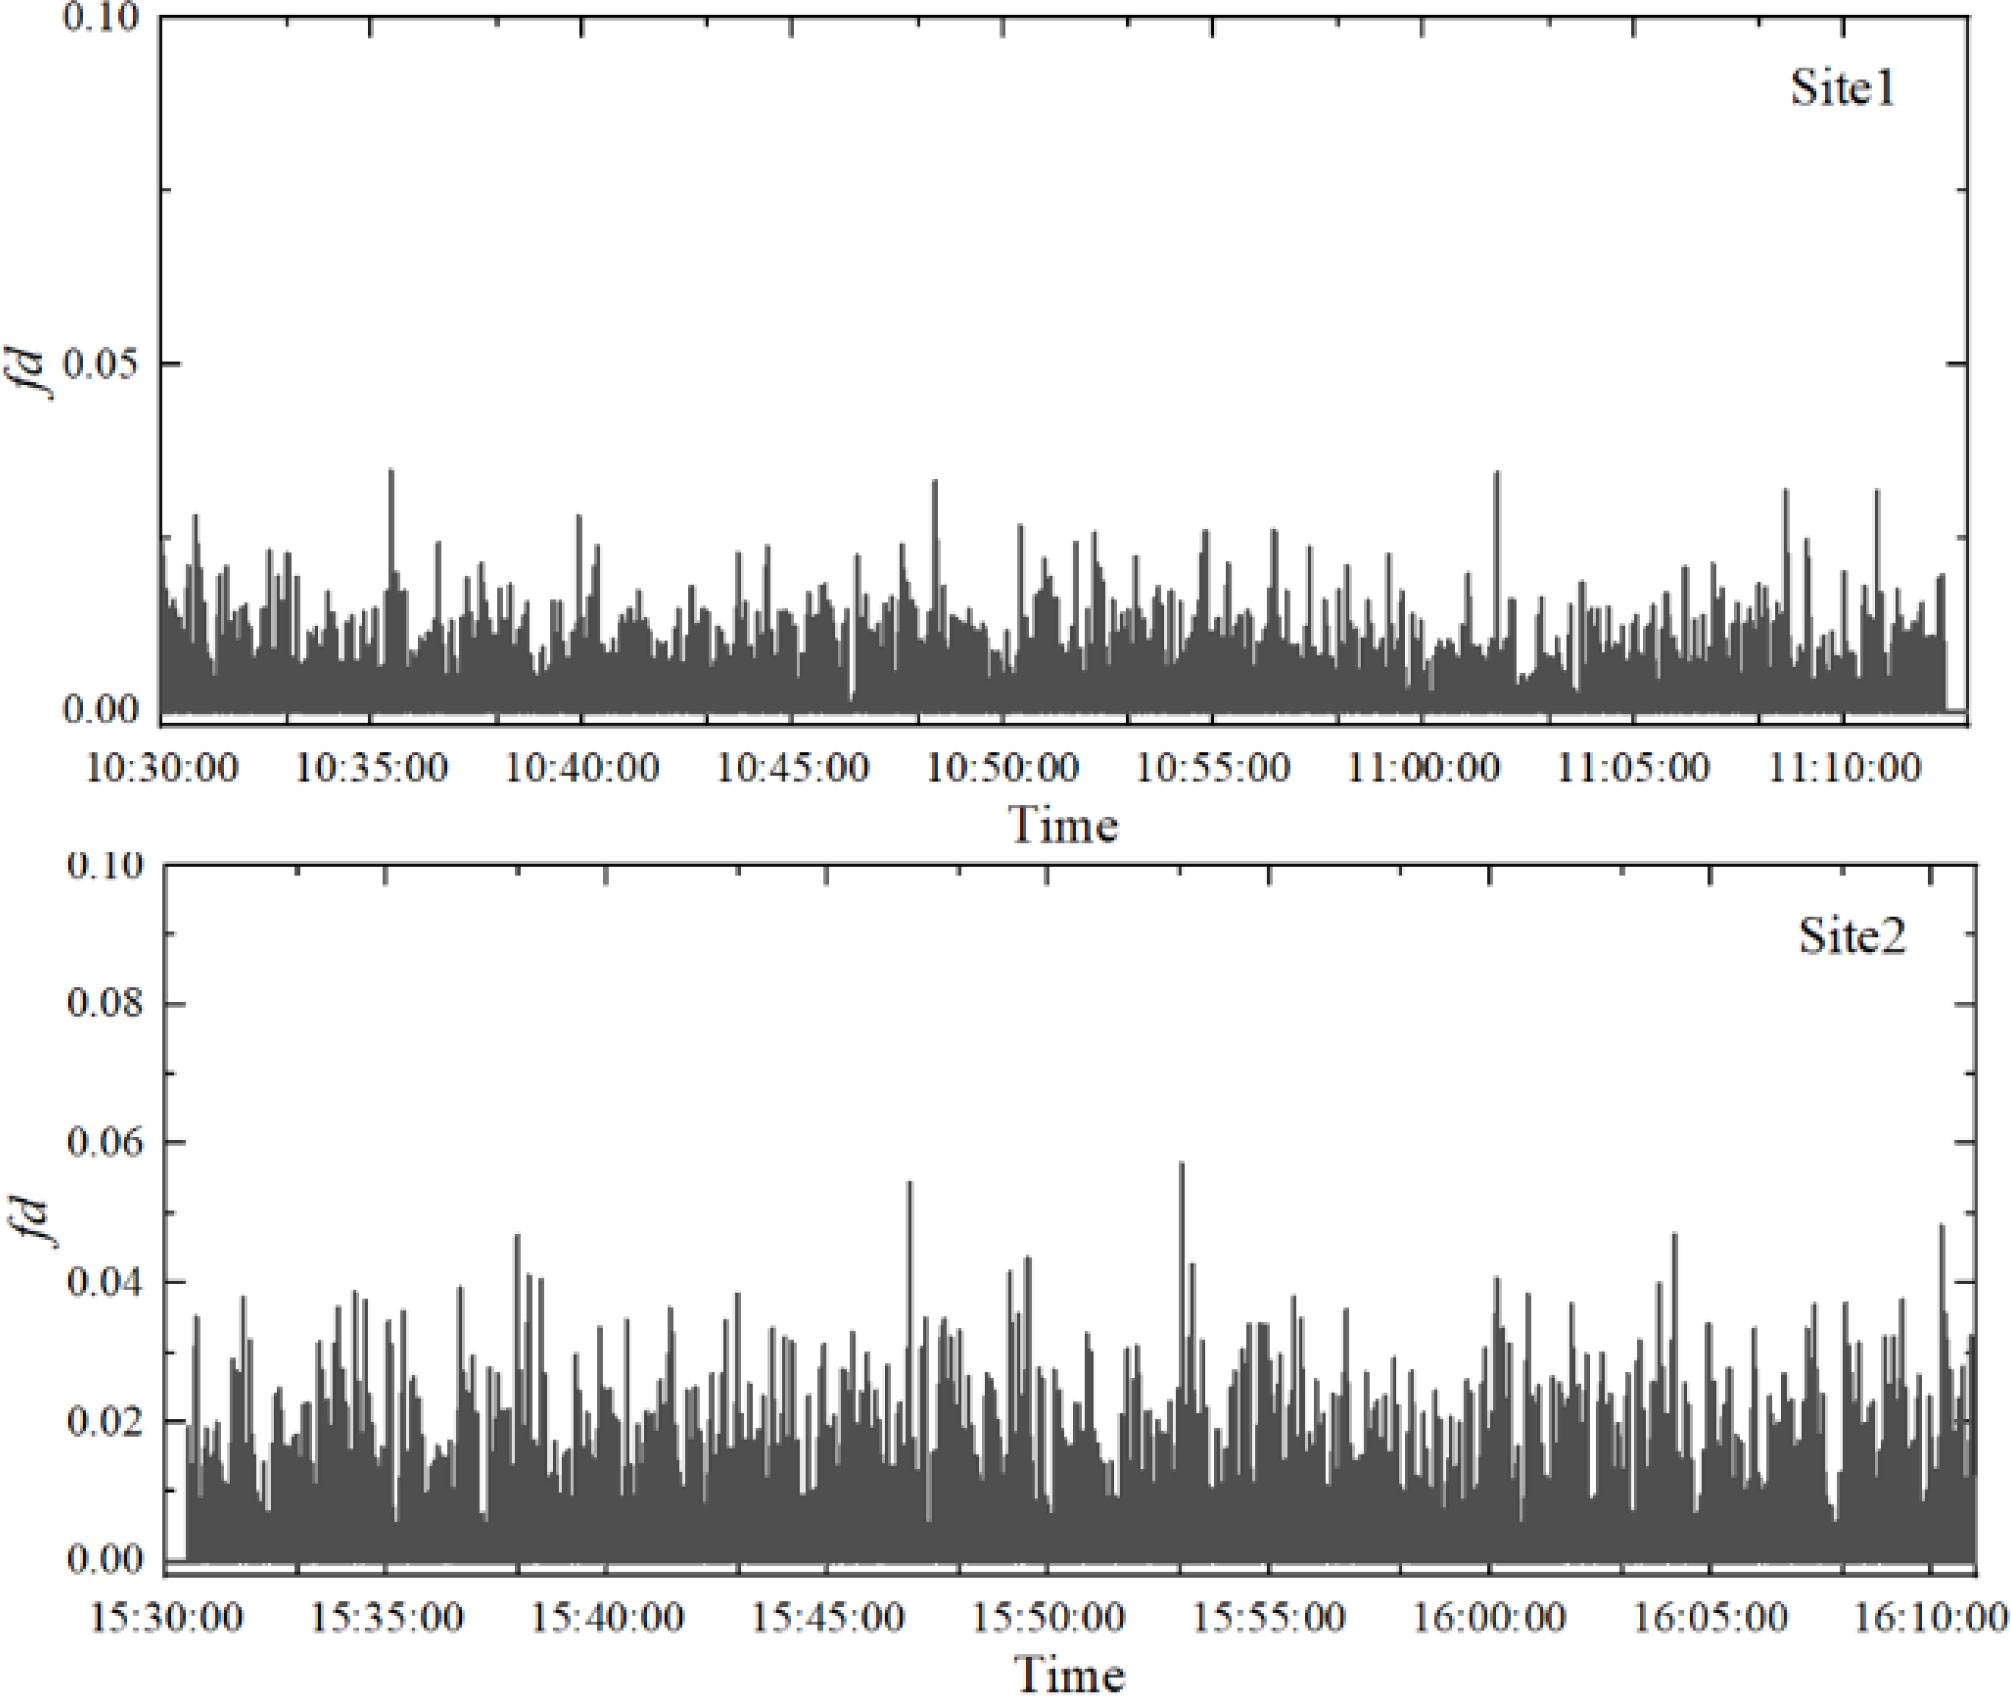
Figure 13 Variation of seabed liquefaction with time during the experiment.
The value of Me in site1 and site2, under the influence of waves, were calculated from the liquefaction degree depicted in Figure 13, with corresponding average values of 2.63E-05 and 3.48E-05, respectively. In the field environment, information on Me is relatively scarce, and it is often considered a calibration parameter (Wolanski and Spagnol, 2003). Typical values are generally taken to be 5E-05 kg m-2 s-1 (Mulder and Udink, 1991). Previous studies have reported erosion constants ranging from E-05 to E-04 (Green and Black, 1999), 1.5E-05 to 3E-04 (Drake and Cacchione, 1989; Vincent and Downing, 1994; Guillén et al., 2002), with higher and lower values also reported (e.g.,Wiberg and Dungan Smith, 1983; Bedford and Lee, 1994). The erosion constants obtained in this experiment are fall within the above normal range and are consistent with numerical calculations.
5 Conclusions
This paper presents the deployment of a new, large in-situ annular flume to measure the erosion threshold and rate of sediment in the intertidal of the Yellow River Delta. The effect of wave-seabed interactions on sediment erosion resistance was also analyzed.
The ADV measurement data in the flume were used to calibrate current velocities in different steps, and the TKE, COV, and LP methods were applied to calculate bed shear stress. The TKE method was found to be the most accurate method, as it was relatively insensitive to the uncertainty of near-stratigraphic structure, stratigraphic position, and roughness.
For the first time, the critical shear stress of sediment in the intertidal zone of the Yellow River Delta was measured in-situ using the newly developed flume. At site 1, the critical shear stress was 0.10 Pa, and at site 2, it was 0.19 Pa. Type Ia erosion (Sanford and Maa, 2001) was observed at both sites.
The liquefaction degree of seabed at site 1 and site 2 during the experiment reached 0.035 and 0.057, respectively, with corresponding average values of erosion coefficient Me 2.63E-05 kg m-2s-1 and 3.48E-05 kg m-2s-1 in this experiment. The measurements of the influence of wave-seabed interaction on erosion resistance were found to be consistent with numerical calculations.
Data availability statement
The original contributions presented in the study are included in the article/supplementary material. Further inquiries can be directed to the corresponding authors.
Author contributions
HL conducted field experiments, developed the observed data processing method, analyzed and interpreted the data, and wrote the manuscript. YJ contributed to the central ideas, discussed the results, provided suggestions for the manuscript, and approved the submitted version. SZ proposed the central idea, developed the device, discussed the results, revised the manuscript, and approved the submitted version. HS discussed the results and provided suggestions for the manuscript. LX, ZS and YQ participated in field experiments and sampling, and provided suggestions for the manuscript. ZL, ZT and ZW contributed to the analysis of some of the data, discussed the results, and provided suggestions for the manuscript. All authors have made significant contributions to the article and approved the submitted version.
Funding
This work was supported by the Shandong Provincial Postdoctoral Program for Innovative Talents (grantee S. Zhang), National Natural Science Foundation of China [grant number 42277137, 41877223]; the Natural Science Foundation of Shandong Province [grant number ZR2019BD009].
Conflict of interest
The authors declare that the research was conducted in the absence of any commercial or financial relationships that could be construed as a potential conflict of interest.
Publisher’s note
All claims expressed in this article are solely those of the authors and do not necessarily represent those of their affiliated organizations, or those of the publisher, the editors and the reviewers. Any product that may be evaluated in this article, or claim that may be made by its manufacturer, is not guaranteed or endorsed by the publisher.
References
Aberle J., Nikora V., Mclean S., Doscher C., Mcewan I., Green M., et al. (2003). Straight benthic flow-through flume for in situ measurement of cohesive sediment dynamics. J. Hydraul Eng-Asce. 129 (1), 63–67. doi: 10.1061/(ASCE)0733-9429(2003)129:1(63)
Amos C. L., Bergamasco A., Umgiesser G., Cappucci S., Cloutier D., Denat L., et al. (2004). The stability of tidal flats in Venice lagoon–the results of in-situ measurements using two benthic, annular flumes. J. Mar. Syst. 51 (1-4), 211–241. doi: 10.1016/j.jmarsys.2004.05.013
Amos C. L., Daborn G. R., Christian H. A., Atkinson A., Robertson A. (1992b). In situ erosion measurements on fine-grained sediments from the bay of fundy. Mar. Geol. 108 (2), 175–196. doi: 10.1016/0025-3227(92)90171-D
Amos C. L., Droppo I. G., Gomez E. A., Murphy T. P. (2003). The stability of a remediated bed in Hamilton harbour, lake Ontario, Canada. Sedimentology 50 (1), 149–168. doi: 10.1046/j.1365-3091.2003.00542.x
Amos C. L., Feeney T., Sutherland T. F., Luternauer J. L. (1997). The stability of fine-grained sediments from the Fraser river delta. Estuarine Coast. shelf science. 45 (4), 507–524. doi: 10.1006/ecss.1996.0193
Amos C. L., Grant J., Daborn G. R., Black K. (1992a). Sea Carousel–a benthic, annular flume. Estuarine Coast. Shelf Science. 34 (6), 557–577. doi: 10.1016/S0272-7714(05)80062-9
Amos C. L., Umgiesser G., Ferrarin C., Thompson C. E. L., Whitehouse R. J. S., Sutherland T. F., et al. (2010). The erosion rates of cohesive sediments in Venice lagoon, Italy. Cont Shelf Res. 30 (8), 859–870. doi: 10.1016/j.csr.2009.12.001
Andersen T. J., Fredsoe J., Pejrup M. (2007). In situ estimation of erosion and deposition thresholds by acoustic Doppler velocimeter (Adv). Estuarine Coast. Shelf Science. 75 (3), 327–336. doi: 10.1016/j.ecss.2007.04.039
Baar A. W., de Smit J., Uijttewaal W. S. J., Kleinhans M. G. (2018). Sediment transport of fine sand to fine gravel on transverse bed slopes in rotating annular flume experiments. Water Resour Res. 54 (1), 19–45. doi: 10.1002/2017WR020604
Beckers F., Inskeep C., Haun S., Schmid G., Wieprecht S., Noack M. (2020). High spatio-temporal resolution measurements of cohesive sediment erosion. Earth Surf. Process. Landforms. 45 (11), 2432–2449. doi: 10.1002/esp.4889
Bedford K. W., Lee J. (1994). Near-bottom sediment response to combined wave-current conditions, mobile bay, gulf of Mexico. J. Geophys. Res. 99 (C8), 16161. doi: 10.1029/94JC01226
Black K., Cramp A. (1995). A device to examine the in situ response of intertidal cohesive sediment deposits to fluid shear. Cont Shelf Res. 15 (15), 1945–1954. doi: 10.1016/0278-4343(95)00003-J
Bolaños R., Wolf J. (2012). Comparison of measurements and models of bed stress, bedforms and suspended sediments under combined currents and waves. Coast. Eng. (Amsterdam). 62, 19–30. doi: 10.1016/j.coastaleng.2011.12.005
Brand A., Lacy J. R., Hsu K., Hoover D., Gladding S., Stacey M. T. (2010). Wind-enhanced resuspension in the shallow waters of south San Francisco bay: mechanisms and potential implications for cohesive sediment transport. J. Geophysical Research: Oceans 115 (C11). doi: 10.1029/2010JC006172
Briaud J., Ting F. C. K., Chen H. C., Gudavalli R., Perugu S., Wei G. (1999). Sricos: prediction of scour rate in cohesive soils at bridge piers. J. Geotech Geoenviron Eng. 125 (4), 237–246. doi: 10.1061/(ASCE)1090-0241(1999)125:4(237)
Crowley R. W., Bloomquist D., Hayne J. R., Holst C. M., Shah F. D. (2012). Estimation and measurement of bed material shear stresses in erosion rate testing devices. J. hydraulic Eng. (New York N.Y.). 138 (11), 990–994. doi: 10.1061/(ASCE)HY.1943-7900.0000608
Dai X., Jia Y., Zhang S., Zhang S. H., Hongxian. S. (2020). Influence of salinity on sediment erosion-resistance: evidence from annular flume studies. Mar. Geology Quaternary Geology. 40 (03), 222–230. doi: 10.16562/j.cnki.0256-1492.2019032401
Danielsson Å., Jönsson A., Rahm L. (2007). Resuspension patterns in the baltic proper. J. Sea Res. 57 (4), 257–269. doi: 10.1016/j.seares.2006.07.005
Dou G. (1999). Incipient motion of coarse and fine sediment. J. Sediment Res. 6), 1–9. doi: 10.16239/j.cnki.0468-155x.1999.06.001
Drake D. E., Cacchione D. A. (1989). Estimates of the suspended sediment reference concentration (Ca) and resuspension coefficient (Γ0) from near-bottom observations on the California shelf. Cont Shelf Res. 9 (1), 51–64. doi: 10.1016/0278-4343(89)90082-4
Dyer K. R. (1980). Velocity profiles over a rippled bed and the threshold of movement of sand. Estuar. Coast. Mar. Science. 10 (2), 181–199. doi: 10.1016/S0302-3524(80)80057-0
Foda M. A., Huang C. (2002). Fluidization model for cross-shore sediment transport by water waves. Ocean Wave Measurement Anal. 1356–65. doi: 10.1061/40604(273)137
Gao W., Liu S., Liu J., Xu Y., Li P. (2018). The sedimentary facies and dynamic environment of the diaokou lobe in the modern huanghe river delta of China. Hai Yang Xue Bao. 37 (11), 40–52. doi: 10.1007/s13131-018-1332-z
Green M. O., Black K. P. (1999). Suspended-sediment reference concentration under waves: field observations and critical analysis of two predictive models. Coast. Eng. 38 (3), 115–141. doi: 10.1016/S0378-3839(99)00044-7
Guillén J., Jiménez J. A., Palanques A., Gracia V., Puig P., Sánchez-Arcilla A. (2002). Sediment resuspension across a microtidal, low-energy inner shelf. Cont Shelf Res. 22 (2), 305–325. doi: 10.1016/S0278-4343(01)00059-0
He C., Taylor J. N., Rochfort Q., Nguyen D. (2021). A new portable in situ flume for measuring critical shear stress on river beds. Int. J. Sediment Res. 36 (2), 235–242. doi: 10.1016/j.ijsrc.2020.08.004
Heathershaw A. D., Simpson J. H. (1978). The sampling variability of the reynolds stress and its relation to boundary shear stress and drag coefficient measurements. Estuar. Coast. Mar. Science. 6 (3), 263–274. doi: 10.1016/0302-3524(78)90015-4
Houwing E. J. (1999). Determination of the critical erosion threshold of cohesive sediments on intertidal mudflats along the Dutch wadden Sea coast. Estuarine Coast. Shelf Science. 49 (4), 545–555. doi: 10.1006/ecss.1999.0518
Hsu J. R. C., Jeng D. S. (1994). Wave-induced soil response in an unsaturated anisotropic seabed of finite thickness. Int. J. Numer Anal. Methods Geomech. 18 (11), 785–807. doi: 10.1002/nag.1610181104
Islam M. R., Zhu D. Z. (2013). Kernel density–based algorithm for despiking adv data. J. Hydraul. Eng. 139 (7), 785–793. doi: 10.1061/(ASCE)HY.1943-7900.0000734
Jeng D. (2017). Porous models for wave-induced seabed liquefaction. 969–97. doi: 10.1142/9789813204027_0034
Jia Y., Zhang L., Zheng J., Liu X., Jeng D., Shan H. (2014). Effects of wave-induced seabed liquefaction on sediment re-suspension in the yellow river delta. Ocean Eng. 89, 146–156. doi: 10.1016/j.oceaneng.2014.08.004
Johnson B. A., Cowen E. A. (2020). Sediment suspension and bed morphology in a mean shear free turbulent boundary layer. J. Fluid Mech. 894. doi: 10.1017/jfm.2020.222
Joshi S., Duffy G. P., Brown C. (2017). Critical bed shear stress and threshold of motion of maerl biogenic gravel. Estuarine Coast. Shelf Science. 194, 128–142. doi: 10.1016/j.ecss.2017.06.010
Kassem H., Sutherland T. F., Amos C. L. (2021). Hydrodynamic controls on the particle size of resuspended sediment from sandy and muddy substrates in british columbia, canada. J. Coast. Res. 37 (4), 691–707. doi: 10.2112/JCOASTRES-D-20-00135.1
Kim S. C., Friedrichs C. T., Maa J. P. Y., Wright L. D. (2000). Estimating bottom stress in tidal boundary layer from acoustic Doppler velocimeter data. J. Hydraul Eng-Asce. 126 (6), 399–406. doi: 10.1061/(ASCE)0733-9429(2000)126:6(399)
Klammler H., Penko A. M., Staples T., Sheremet A., Calantoni J. (2021). Observations and modeling of wave-induced burial and sediment entrainment: likely importance of degree of liquefaction. J. Geophys. Res. Oceans. 126, e2021JC017378. doi: 10.1029/2021JC017378
Krishnappan B. G. (1993). Rotating circular flume. J. Hydraul Eng-Asce. 119 (6), 758–767. doi: 10.1061/(ASCE)0733-9429(1993)119:6(758)
Li B., Jia Y., Liu J. P., Su J., Liu X., Wen M. (2020). The controlling factors of high suspended sediment concentration in the intertidal flat off the huanghe river estuary. Hai Yang Xue Bao. 39 (10), 96–106. doi: 10.1007/s13131-020-1679-9
Li J., Wang Y. P., Du J., Luo F., Xin P., Gao J., et al. (2021). Effects of meretrix meretrix on sediment thresholds of erosion and deposition on an intertidal flat. Ecohydrol Hydrobiol. 21 (1), 129–141. doi: 10.1016/j.ecohyd.2020.07.002
Lick W., McNeil J. (2001). Effects of sediment bulk properties on erosion rates. Sci. total environment. 266 (1-3), 41–48. doi: 10.1016/S0048-9697(00)00747-6
Liu J., Shan H., Wang W., Zhang S., Liu X., Jia Y. (2016). Influence of water salinity on critical shear stress of fine-grained sediment. Mar. Geology Quaternary Geology 36 (5), 35–41. doi: 10.16562/j.cnki.0256-1492.2016.05.004
Liu X., Zhang H., Zheng J., Guo L., Jia Y., Bian C., et al. (2020). Critical role of wave–seabed interactions in the extensive erosion of yellow river estuarine sediments. Mar. Geol. 426, 106208. doi: 10.1016/j.margeo.2020.106208
Liu L., Wang H., Yang Z., Fan Y., Wu X., Hu L., et al. (2022). Coarsening of sediments from the huanghe (Yellow river) delta-coast and its environmental implications. Geomorphology (Amsterdam Netherlands) 401. doi: 10.1016/j.geomorph.2021.108105
Lu J., Qiao F. L., Wang X. H., Wang Y. G., Teng Y., Xia C. S. (2011). A numerical study of transport dynamics and seasonal variability of the yellow river sediment in the bohai and yellow seas. Estuarine Coast. shelf science. 95 (1), 39–51. doi: 10.1016/j.ecss.2011.08.001
Maa J. P. Y. (1990). The bed shear stress of an annular sea-bed flume. Estuarine Water Quality Management, 271–275. doi: 10.1007/978-3-642-75413-5_41
Maa J. P. Y. (1993). Vims Sea carousel: its hydrodynamic characteristics. Nearshore Estuar. cohesive sediment transport. 42, 265–280.
Maa J. P. Y. (2008). Sediment erosion characteristics in the anacostia river. J. Hydraul Eng-Asce. 134 (8), 1102–1109. doi: 10.1061/(ASCE)0733-9429(2008)134:8(1102)
Maa J. P. Y., Kim S. C. (2001). A constant erosion rate model for fine sediment in the y ork river, Virginia. Environ. Fluid Mech. (Dordr). 1 (4), 345–360. doi: 10.1023/A:1015799926777
Maa J. P. Y., Lee C. H., Chen F. J. (1995). Bed shear stress measurements for vims Sea carousel. Mar. Geol. 129 (1), 129–136. doi: 10.1016/0025-3227(95)00102-6
Maa J. P. Y., Sanford L., Halka J. P. (1998). Sediment resuspension characteristics in Baltimore harbor, Maryland. Mar. Geol. 146 (1-4), 137–145. doi: 10.1016/S0025-3227(97)00120-5
Maa J. P. Y., Wright L. D., Lee C. H., Shannon T. W. (1993). Vims Sea carousel: a field instrument for studying sediment transport. Mar. Geol. 115 (3), 271–287. doi: 10.1016/0025-3227(93)90056-2
Maa J. P. Y., Lee C. H. (1997). Variation of the resuspension coefficients in the lower chesapeake bay. J. Coast. Res., 63–74.
McNeil J., Taylor C., Lick W. (1996). Measurements of erosion of undisturbed bottom sediments with Depth. J. Hydraul. Eng. 122 (6), 316–324. doi: 10.1061/(ASCE)0733-9429(1996)122:6(316)
Mehta A. J., Hayter E. J., Parker W. R., Krone R. B., Teeter A. M. (1989). Cohesive sediment transport; I, process description. J. hydraulic Eng. (New York N.Y.). 115 (8), 1076–1093. doi: 10.1061/(ASCE)0733-9429(1989)115:8(1076)
Meng X., Jia Y., Shan H., Yang Z., Zheng J. (2012). An experimental study on erodibility of intertidal sediments in the yellow river delta. Int. J. Sediment Res. 27 (2), 240–249. doi: 10.1016/S1001-6279(12)60032-8
Mulder H. P. J., Udink C. (1991). Modelling of cohesive sediment transport. a case study: The Western Scheldt Estuary. Coastal Engineering 1990. doi: 10.1061/9780872627765.230
Noack M., Gerbersdorf S., Hillebrand G., Wieprecht S. (2015). Combining field and laboratory measurements to determine the erosion risk of cohesive sediments best. Water (Basel). 7 (9), 5061–5077. doi: 10.3390/w7095061
Nowell A. R. M., Hollister C. D. (1985). The objectives and reationale of hebble. Mar. Geol. 66 (1-4), 1–11. doi: 10.1016/0025-3227(85)90019-2
Paphitis D., Collins M. B. (2005). Sediment resuspension events within the (microtidal) coastal waters of thermaikos gulf, northern greece. Cont Shelf Res. 25 (19-20), 2350–2365. doi: 10.1016/j.csr.2005.08.028
Parchure T. M., Mehta A. J. (1985). Erosion of soft cohesive sediment deposits. J. Hydraul Eng-Asce. 111 (10), 1308–1326. doi: 10.1061/(ASCE)0733-9429(1985)111:10(1308)
Pieterse A., Puleo J. A., Mckenna T. E., Aiken R. A. (2015). Near-bed shear stress, turbulence production and dissipation in a shallow and narrow tidal channel. Earth Surf. Process. Landforms. 40 (15), 2059–2070. doi: 10.1002/esp.3782
Pope N. D., Widdows J., Brinsley M. D. (2006). Estimation of bed shear stress using the turbulent kinetic energy approach–a comparison of annular flume and field data. Cont Shelf Res. 26 (8), 959–970. doi: 10.1016/j.csr.2006.02.010
Ravens T. M. (2007). Comparison of two techniques to measure sediment erodibility in the fox river, Wisconsin. J. Hydraul. Eng. 133 (1), 111–115. doi: 10.1061/(ASCE)0733-9429(2007)133:1(111)
Ravens T. M., Gschwend P. M. (1999). Flume measurements of sediment erodibility in Boston harbor. J. Hydraul Eng-Asce. 125 (10), 998–1005. doi: 10.1061/(ASCE)0733-9429(1999)125:10(998)
Roberts J., Jepsen R., Gotthard D., Lick W. (1998). Effects of particle size and bulk density on erosion of quartz particles. J. Hydraul Eng-Asce. 124 (12), 1261–1267. doi: 10.1061/(ASCE)0733-9429(1998)124:12(1261)
Roberts J. D., Jepsen R. A., James S. C. (2003). Measurements of sediment erosion and transport with the adjustable shear stress erosion and transport flume. J. Hydraul. Eng. 129 (11), 862–871. doi: 10.1061/(ASCE)0733-9429(2003)129:11(862)
Salehi M., Strom K. (2012). Measurement of critical shear stress for mud mixtures in the San jacinto estuary under different wave and current combinations. Cont Shelf Res. 47, 78–92. doi: 10.1016/j.csr.2012.07.004
Sanford L. P., Maa J. P. Y. (2001). A unified erosion formulation for fine sediments. Mar. Geol. 179 (1), 9–23. doi: 10.1016/S0025-3227(01)00201-8
Shi L., Dong P., Ying M., Li W., Chen S. (2007). An experiment study of erosion characteristics of sediment bed at the yellow river delta. Coast. Eng. J. 49 (1), 25–43. doi: 10.1142/S0578563407001526
Shi B., Wang Y. P., Wang L. H., Li P., Gao J., Xing F., et al. (2018). Great differences in the critical erosion threshold between surface and subsurface sediments: a field investigation of an intertidal mudflat, jiangsu, China. Estuarine Coast. Shelf Science. 206, 76–86. doi: 10.1016/j.ecss.2016.11.008
Smith A. J., Herne D. E., Turner J. V. (2009). Wave effects on submarine groundwater seepage measurement. Adv. Water Resour. 32 (6), 820–833. doi: 10.1016/j.advwatres.2009.02.003
Soulsby R. L. (1983). Chapter 5 the bottom boundary layer of shelf seas. Elsevier oceanography series. 35, 189–266. doi: 10.1016/S0422-9894(08)70503-8
Soulsby R. L., Dyer K. R. (1981). The form of the near-bed velocity profile in a tidally accelerating flow. J. Geophysical Res. 86 (C9), 8067–8074. doi: 10.1029/JC086iC09p08067
Soulsby R. (1997). Dynamics of marine sands a manual for practicalapplications [M] (London: Thomas Telford Publication).
Sutherland T. F., Amos C. L., Grant J. (1998). The erosion threshold of biotic sediments: a comparison of methods. Geological Society London Special Publications. 139 (1), 295–307. doi: 10.1144/GSL.SP.1998.139.01.24
Tang M., Jia Y., Zhang S., Wang C., Liu H. (2021). Impacts of consolidation time on the critical hydraulic gradient of newly deposited silty seabed in the yellow river delta. J. Mar. Sci. Eng. 9 (3), 270. doi: 10.3390/jmse9030270
Thompson C. E. L., Amos C. L., Angelaki M., Jones T. E. R., Binks C. E. (2006). An evaluation of bed shear stress under turbid flows. J. Geophys. Res. 111 (C4). doi: 10.1029/2005JC003287
Thompson C. E. L., Amos C. L., Jones T. E. R., Chaplin J. (2003). The manifestation of fluid-transmitted bed shear stress in a smooth annular flume-a comparison of methods. J. Coast. Res. 19 (4), 1094–1103.
Thompson C. E. L., Amos C. L., Umgiesser G. (2004). A comparison between fluid shear stress reduction by halophytic plants in Venice lagoon, Italy and rustico bay, Canada–analyses of in situ measurements. J. Mar. Syst. 51 (1), 293–308. doi: 10.1016/j.jmarsys.2004.05.017
Thompson C. E. L., Couceiro F., Fones G. R., Helsby R., Amos C. L., Black K., et al. (2011). In situ flume measurements of resuspension in the north Sea. Estuarine Coast. Shelf Science. 94 (1), 77–88. doi: 10.1016/j.ecss.2011.05.026
Thompson C. E. L., Williams M. E., Amoudry L., Hull T., Reynolds S., Panton A., et al. (2019). Benthic controls of resuspension in uk shelf seas: implications for resuspension frequency. Cont Shelf Res. 185, 3–15. doi: 10.1016/j.csr.2017.12.005
Tzang S., Ou S., Hsu T. (2009). Laboratory flume studies on monochromatic wave-fine sandy bed interactions part 2. Sediment Suspensions. Coast. Eng. 56 (3), 230–243. doi: 10.1016/j.coastaleng.2008.07.005
Van Prooijen B. C., Winterwerp J. C. (2010). A stochastic formulation for erosion of cohesive sediments. J. Geophysical Research: Oceans 115 (C1). doi: 10.1029/2008JC005189
van Rijn L. C. (2007). Unified view of sediment transport by currents and waves. I: initiation of motion, bed roughness, and bed-load transport. J. hydraulic Eng. (New York N.Y.). 133 (6), 649–667.
Verney R., Brun-Cottan J. C., Lafite R., Deloffre J., Taylor J. A. (2006). Tidally-induced shear stress variability above intertidal mudflats in the macrotidal seine estuary. Estuaries Coast. 29 (4), 653–664. doi: 10.1007/BF02784290
Vincent C. E., Downing A. (1994). Variability of suspended sand concentrations, transport and eddy diffusivity under non-breaking waves on the shoreface. Cont Shelf Res. 14 (2-3), 223–250. doi: 10.1016/0278-4343(94)90014-0
Wang Y., Yu Q., Gao S. (2011). Relationship between bed shear stress and suspended sediment concentration: annular flume experiments. Int. J. Sediment Res. 26 (4), 513–523. doi: 10.1016/S1001-6279(12)60009-2
Wen M., Shan H., Zhang S., Liu X., Jia Y. (2019). Contribution of waves and currents to sediment resuspension in the yellow river delta. Mar. Geores Geotechnol. 37 (1), 96–102. doi: 10.1080/1064119X.2018.1452084
Wiberg P., Dungan Smith J. (1983). A comparison of field data and theoretical models for wave-current interactions at the bed on the continental shelf. Cont Shelf Res. 2 (2), 147–162. doi: 10.1016/0278-4343(83)90013-4
Widdows J., Friend P. L., Bale A. J., Brinsley M. D., Pope N. D., Thompson C. E. L. (2007). Inter-comparison between five devices for determining erodability of intertidal sediments. Cont Shelf Res. 27 (8), 1174–1189. doi: 10.1016/j.csr.2005.10.006
Winterwerp J. C., van Kesteren W. G. M., van Prooijen B., Jacobs W. (2012). A conceptual framework for shear flow-induced erosion of soft cohesive sediment beds. J. Geophysical Research: Oceans 117 (C10).
Wolanski E., Spagnol S. (2003). Dynamics of the turbidity maximum in king sound, tropical Western Australia. Estuarine Coast. shelf science. 56 (5), 877–890. doi: 10.1016/S0272-7714(02)00214-7
Yang S., Im I., Hwang K., Cho Y., Ryu H. (2015). A numerical study on optimal rotation ratio and bottom shear stress in the counter-rotation mode of an annular flume. J. Hydro-Environ. Res. 9 (4), 473–481. doi: 10.1016/j.jher.2015.02.002
Young R. N., Southard J. B. (1978). Erosion of fine-grained marine sediments: Sea-floor and laboratory experiments. Geol Soc. Am. Bull. 89 (5), 663. doi: 10.1130/0016-7606(1978)89<663:EOFMSS>2.0.CO;2
Zhang Q., Gong Z., Zhang C., Lacy J. R., Jaffe B. E., Xu B. (2018). Bed shear stress estimation under wave conditions using near-bottom measurements: comparison of methods. J. Coast. Res. 85 (sp1), 241–245. doi: 10.2112/SI85-049.1
Zhang Y., Han L., Chen L., Wang C., Chen B., Jiang A. (2021). Study on the 3D hydrodynamic characteristics and velocity uniformity of a gravity flow circular flume. Water (Basel). 13 (7), 927. doi: 10.3390/w13070927
Zhang S., Jia Y., Zhang Y., Shan H. (2018). Influence of seepage flows on the erodibility of fluidized silty sediments; parameterization and mechanisms. J. geophysical Res. Oceans. 123 (5), 3307–3321. doi: 10.1002/2018JC013805
Zhang S., Nielsen P., Perrochet P., Jia Y. (2021). Multiscale superposition and decomposition of field-measured suspended sediment concentrations: implications for extending 1Dv models to coastal oceans with advected fine sediments. J. geophysical Res. Oceans 126 (3). doi: 10.1029/2020JC016474
Zheng J., Jia Y., Liu X., Shan H., Zhang M. (2013). Experimental study of the variation of sediment erodibility under wave-loading conditions. Ocean Eng. 68, 14–26. doi: 10.1016/j.oceaneng.2013.04.010
Zheng G., Quan G., Beibei X. U., Qian Z., Kun Z., Changkuan Z. (2019). An in situ measurement device for sediment critical shear stress in intertidal zone. Adv. Sci. Technol. Water Resources. 39 (3), 74. doi: 10.3880/j.issn.1006-7647.2019.03.010
Keywords: in-situ, erosion experiment, bed shear stress, critical shear stress, Yellow River delta
Citation: Liu H, Jia Y, Zhang S, Shan H, Xue L, Sun Z, Quan Y, Li Z, Chen T, Tian Z and Wang Z (2023) Field measurement of the erosion threshold of silty seabed in the intertidal flat of the Yellow River Delta with a newly-developed annular flume. Front. Mar. Sci. 10:1177241. doi: 10.3389/fmars.2023.1177241
Received: 01 March 2023; Accepted: 17 May 2023;
Published: 07 June 2023.
Edited by:
Shunqi Pan, Cardiff University, United KingdomCopyright © 2023 Liu, Jia, Zhang, Shan, Xue, Sun, Quan, Li, Chen, Tian and Wang. This is an open-access article distributed under the terms of the Creative Commons Attribution License (CC BY). The use, distribution or reproduction in other forums is permitted, provided the original author(s) and the copyright owner(s) are credited and that the original publication in this journal is cited, in accordance with accepted academic practice. No use, distribution or reproduction is permitted which does not comply with these terms.
*Correspondence: Yonggang Jia, eW9uZ2dhbmdAb3VjLmVkdS5jbg==; Shaotong Zhang, c2hhb3RvbmcuemhhbmdAb3VjLmVkdS5jbg==