 Sunghan Kim1*
 Young-Suk Bak2Joseph G. Prebble3Myung-Il Kang1
 Sookwan Kim4
 Jinku Park1
 Min Kyung Lee1Jae Il Lee1Kyu-Cheul Yoo1Heung Soo Moon1
- 1Korea Polar Research Institute, Incheon, Republic of Korea
- 2Department of Earth and Environmental Sciences, Jeonbuk National University, Jeonju, Republic of Korea
- 3Department of Surface Geosciences, GNS Science, Lower Hutt, New Zealand
- 4Korea Institute of Ocean Science and Technology, Busan, Republic of Korea
Antarctic continental margin sediments are eroded from the shelf and transported to the slope/rise in association with changing ice sheet configuration. Understanding the dynamics of this transport pathway is important for utilizing distal deep-sea sedimentary archives to determine past changes in the Antarctic ice sheet. However, these connections are poorly understood. Here we present multi-proxy records of two sediment cores (BS17-GC01 and BS17-GC02) from the Bellingshausen Sea continental rise, to explore relationships between depositional regime and ice sheet dynamics. Two cores show depositional/sedimentological variations on glacial-interglacial scales. Biogenic sediments were deposited during MIS 1, 5, and 7 under open ocean conditions. Glacial to deglacial sediments were laminated as a result of varying intensity of bottom currents. Terrestrially derived sediments are inferred to be transported from shelf both as grounded ice advanced during glacial expansion, and as ice retreated during deglacial periods. Sediment color shifted to brown after deglacial periods with high Mn/Ti and occurrence of bioturbation, indicating increasing bottom water oxygenation in the study area. Since surface water production started to increase from deglacial periods, we infer increased bottom water oxygenation in this setting is due to ventilation (i.e., Antarctic Bottom Water (AABW) formation), implying that AABW formation was increased during interglacial periods from deglacial period whereas was decreased during glacial periods. Thus, sedimentary/depositional changes in BS17-GC01 and BS17-GC02 are closely linked to ice sheet dynamics during the late Quaternary.
1 Introduction
The stability of the West Antarctic Ice Sheet (WAIS) is strongly influenced by variability of the surrounding ocean (Golledge et al., 2012; Pritchard et al., 2012; De Conto and Pollard, 2016). The spatial and temporal pattern of ice sheet advance/retreat across the continental shelf is largely a function of ocean water mass exchange along the glacial front. On glacial/interglacial timescales, this water mass exchange is influenced by the geomorphology (e.g., Dinniman et al., 2011; Lavoie et al., 2015), which is in turn influenced by tectonic process, glacier dynamics, bottom currents, and sediment input. However, sedimentary deposits that could be used to reconstruct glacial dynamics on glacial/interglacial timescales are fragmentary and cryptic in this setting. Although the Antarctic continental shelf contains a valuable record of deglacial to recent ice dynamics (e.g., De Santis et al., 1995; Domack et al., 1999), the advance of erosional ice sheets to the shelf break during the Last Glacial Maximum (LGM) (Anderson et al., 2002; Ó Cofaigh et al., 2014; The RAISED Consortium et al., 2014) means that LGM and older archives are rare on the continental shelf. For the most part, LGM and older sediments have been eroded and transported to the upper slope and continental rise (e.g., Anderson, 1999; Dowdeswell et al., 2002; Dowdeswell et al., 2008; Noormets et al., 2009). It is these deep-sea archives we must interpret, to understand ice dynamics during the LGM and older times.
It is normally recognized that dense shelf water formation, occurred by brine rejection in association with high sea ice formation in Antarctic coastal polynyas, is related to the formation of Antarctic Bottom Water (AABW), which is the densest water mass (Tamura et al., 2008). As a result, AABW is characterized by high oxygen concentration (Gordon, 2009). It is reported that AABW formation restarted or intensified at the end of glacial periods, that is deglacial periods, when grounded ice began to retreat on the shelf (Wu et al., 2018; Jimenez-Espejo et al., 2020). Since the production of AABW is related to shelf cavities (Wu et al., 2018; Jimenez-Espejo et al., 2020), these deep-sea archives will provide information on bottom water redox condition variations on glacial-interglacial time scale.
In this study, we use two sedimentary records from the continental rise of the Bellingshausen Sea, to infer changes in oceanographic conditions and sediment depositional process, in response to ice sheet variation on the Bellingshausen Sea continental shelf. To do this, we analyze lithology, physical properties (magnetic susceptibility (MS), grain density, and color reflectance), geochemical proxies (CaCO3, total organic carbon (TOC), biogenic opal concentrations, and C/N ratio), paleontological records (diatoms and palynomorphs), manganese/titanium (Mn/Ti) ratio, zirconium/rubidium (Zr/Rb) ratio, and grain size records with grains >1 mm.
2 Depositional setting
In the Bellingshausen Sea, a wide sediment fan is formed directly seaward of the shelf break (Figure 1), reflecting the large amount of sediment that has been transported from the shelf to slope and rise areas by this pathway (Dowdeswell et al., 2008). Because of intermittent and erosional sediment input (i.e., gravity flows), the sample sites on the fan are not an ideal archive infer paleoenvironmental changes associated with the neighboring ice sheet. Moreover, application of environmental proxies from this upper- to middle-slope depositional environment is hampered by the coarse sediment originating from the ice margin during glacial periods (e.g., Dowdeswell et al., 2008 and references therein). Because drift sediments are well developed from the western Antarctic Peninsula to Bellingshausen Sea sector of the Antarctic margin (Rebesco et al., 2002; Hillenbrand et al., 2008a), previous studies have focused on the influence of bottom currents on this region and depositional environment, with a particular emphasis on interpreting cores collected from close to the shelf break (Pudsey and Camerlenghi, 1998; Lucchi et al., 2002; Lucchi and Rebesco, 2007; Hillenbrand et al., 2021).
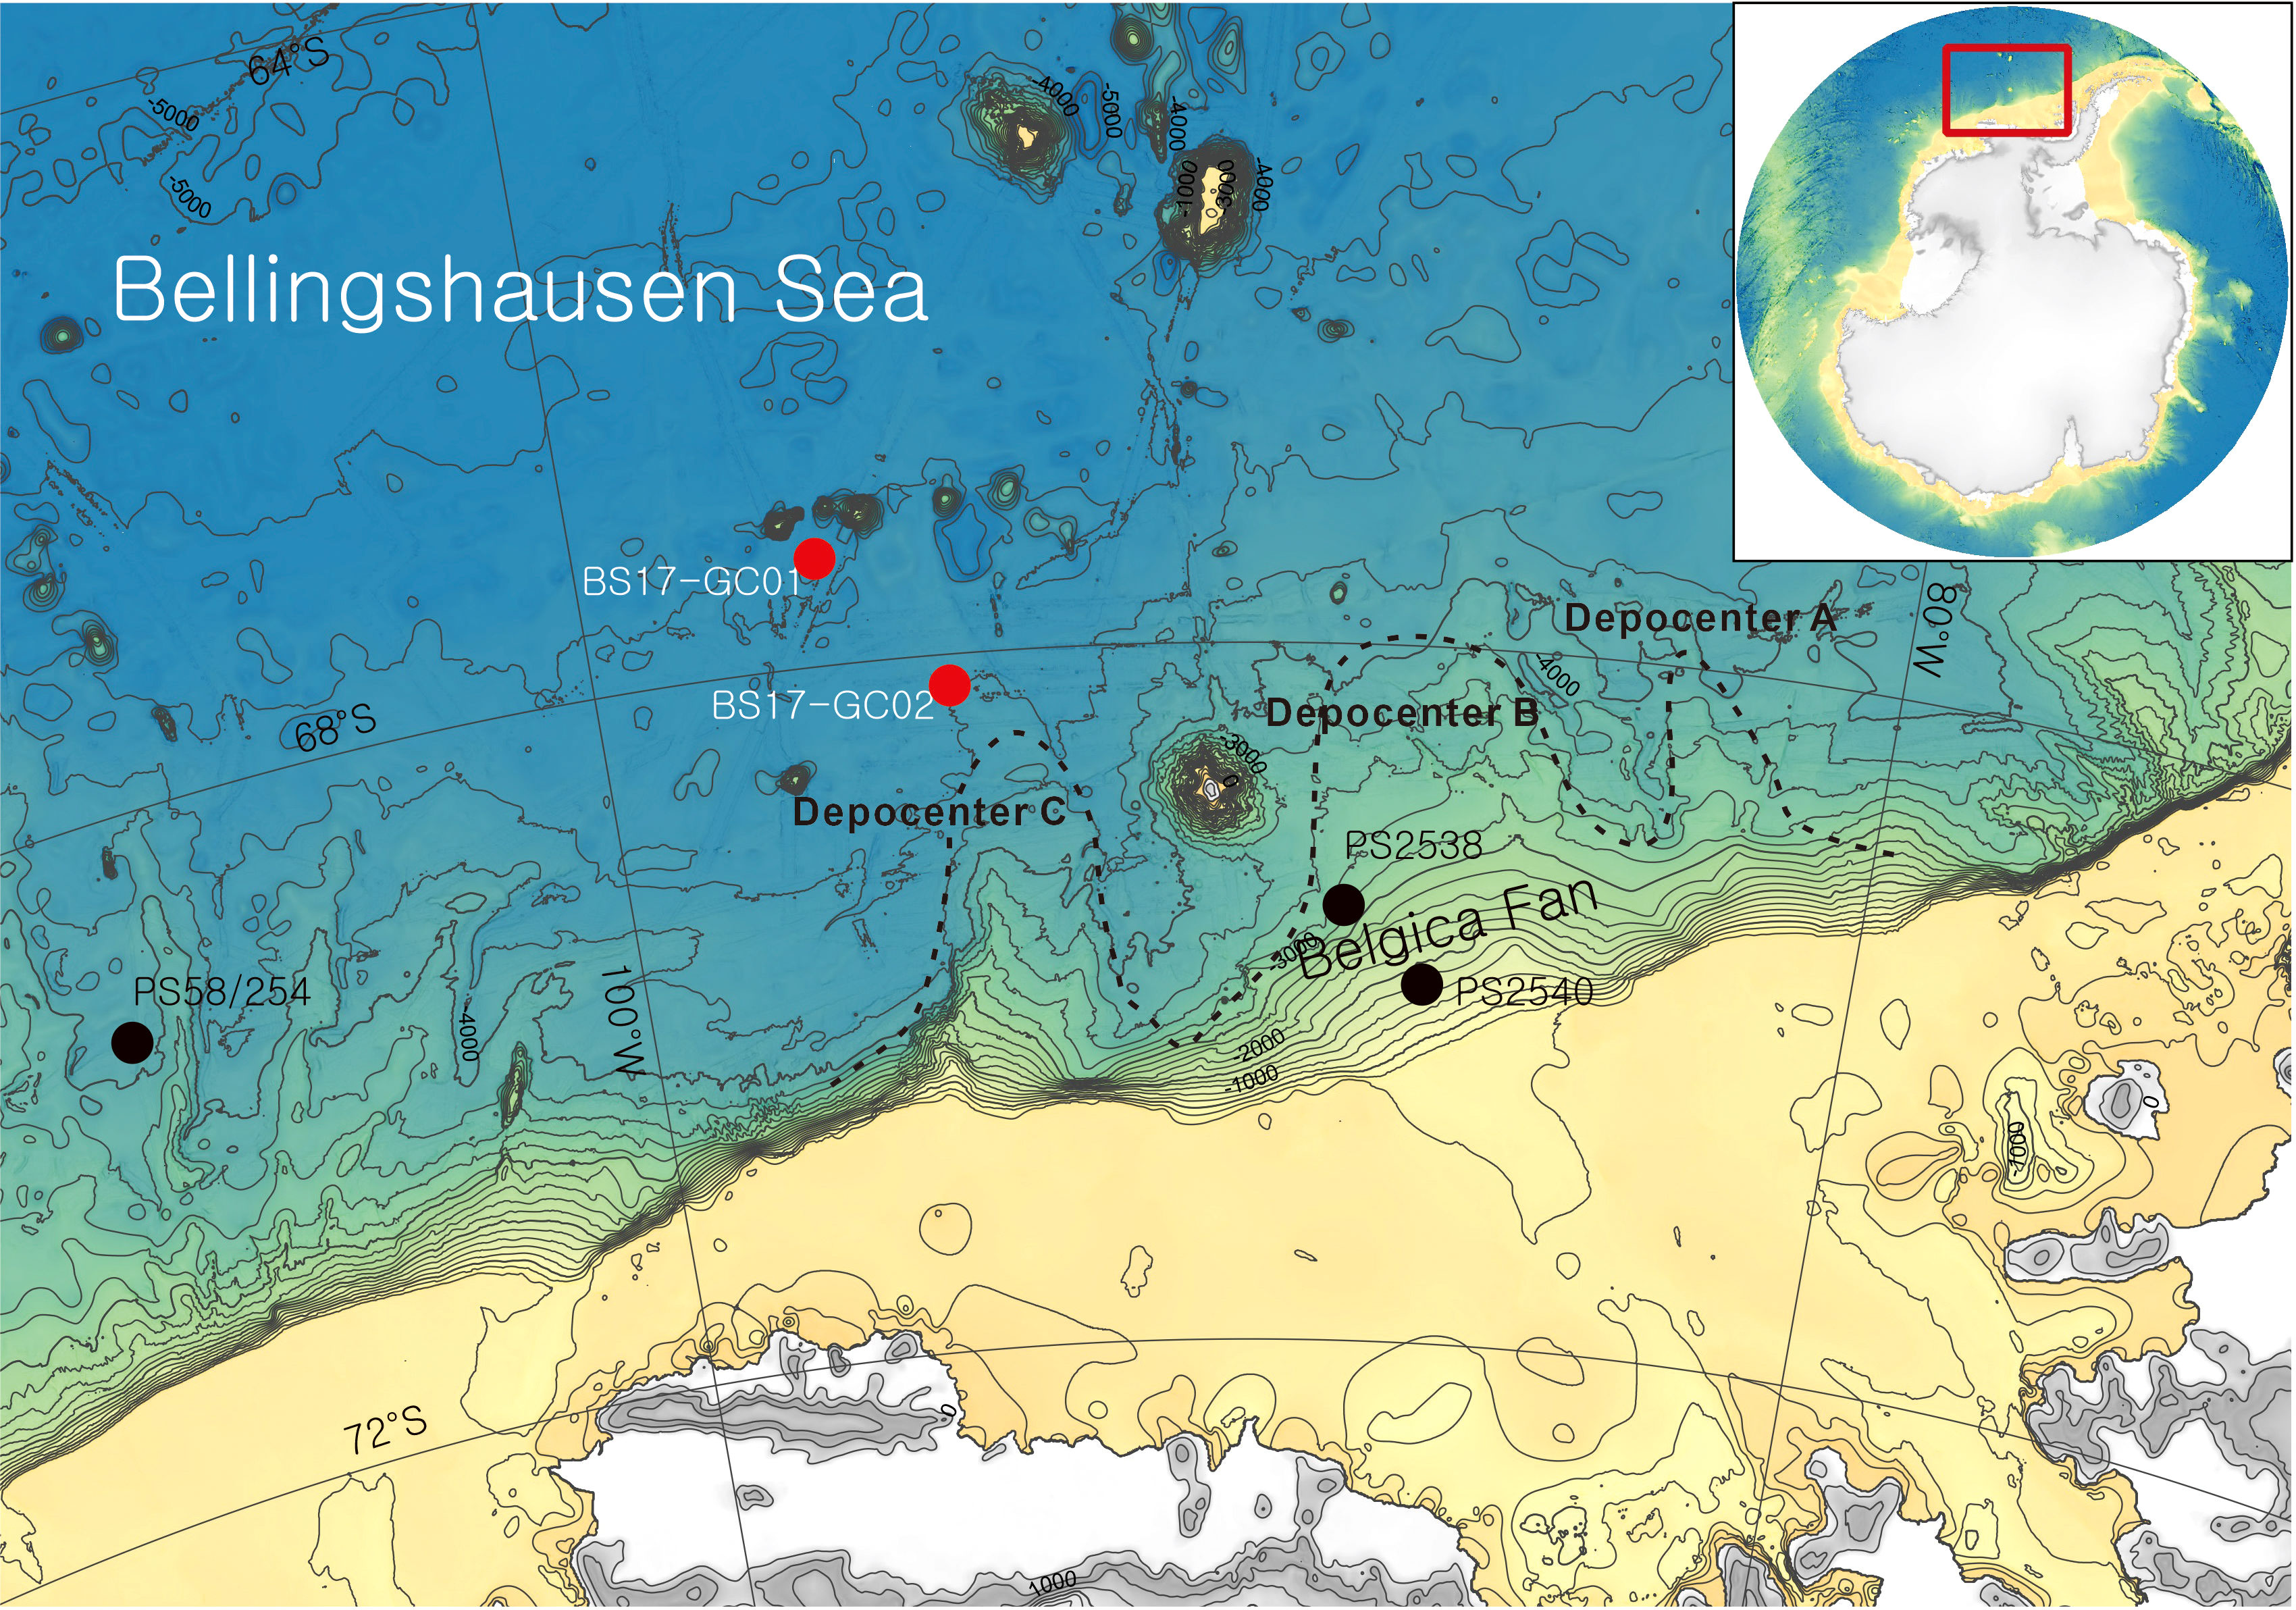
Figure 1 Location map of the study area in the Bellingshausen Sea continental margin, West Antarctica, with core locations for BS17-GC01 and BS17-GC02 (red circles) and previously reported cores (black circles). Dashed lines indicate sediment depocenters from Scheuer et al. (2006).
Along western Antarctic Peninsula to Bellingshausen Sea sector of the Antarctic margin, sedimentation during glacial periods includes, (faintly) laminated sediments with less biogenic components, deposited by a combination of contourite, meltwater plumite, and distal turbidite mechanisms (Hillenbrand et al., 2021 and references therein). The northern extent of these glacial facies is not yet established, due to lack of distal, deep water core records from the Bellingshausen Sea.
Surface sediments of the nearby sea, Amundsen Sea, shows a regional variability; most notably difference between east and west (Hillenbrand et al., 2003). To date, most research effort has been on the area east of the Peter I. Island (e.g., Pudsey and Camerlenghi, 1998; Lucchi et al., 2002; Hillenbrand et al., 2003; Hillenbrand et al., 2009; Hillenbrand et al., 2021). Understanding the accumulation of sedimentary records from the west, which are likely to represent a different mode of deposition given the distinct surficial sediments, is necessary to obtain a complete picture of paleoceanographic evolution of the Bellingshausen Sea region during the late Quaternary.
3 Material and methods
Two gravity cores were collected from the continental rise of the Bellingshausen Sea by IBR/V Araon during the ANA07D cruise in 2017; 217 cm-long BS17-GC01 (67°22.8947′S, 96°23.2464′W, 4627 m water depth) and 846 cm-long BS17-GC02 (68°09.4940′S, 94°34.7988′W, 4361 m water depth) (Figure 1). The two cores were stored cold before being opened, described, and sub-sampled at the Korea Polar Research Institute (KOPRI). Core photos and chemical elements were measured by ITRAX core scanner at KOPRI. X-radiographs were taken from 8 cm x 30 cm x 1 cm slabs at KOPRI. Physical properties, geochemical proxies, and grain size analysis were performed at KOPRI. Analysis of diatom assemblages was performed at Jeonbuk National University and palynology analysis was performed at GNS Science. All data for BS17-GC01 and BS17-GC02 are in Supplementary Tables 1, 2, respectively.
3.1 Physical properties (magnetic susceptibility, color reflectance, and grain density)
The Magnetic Susceptibility (MS) for BS17-GC01 and BS17-GC02 was measured at 1 cm-intervals on split half core sections using a Bartington MS-2B susceptibility meter. The MS values for BS17-GC01 was reported in Kim et al. (2022a). Color reflectances a* and b*, which reflect the balance between red (+) and green (-) and yellow (+) and blue (-), respectively, were measured at 1 cm intervals on split half core sections of two cores by spectrophotometry. The grain density was measured at 10 cm intervals for BS17-GC02 and 4 cm intervals for BS17-GC01 using a gas pycnometer (AccuPyc II 1340). All physical properties were measured at KOPRI.
3.2 Geochemical proxies (biogenic opal, TOC, and CaCO3 concentrations)
All geochemical proxies for BS17-GC01 and BS17-GC02 were measured at 2 cm intervals on 1 cm thick sub-samples at KOPRI. Biogenic silica concentration was measured using a Continuous Flow Analyzer (SKALAR SANplus Analyzer) with wet-alkaline extraction method modified from DeMaster (1981) following the method of Kim et al. (2018a). Biogenic opal concentration was calculated by multiplying biogenic silica concentration by 2.4 (Mortlock and Froelich, 1989). The relative error of biogenic silica concentration in sediment samples is less than 1%. Total inorganic carbon (TIC) concentration was measured using UIC CO2 coulometer (Model CM5240). CaCO3 concentration was calculated by multiplying TIC concentration by 8.333. The relative standard deviation for CaCO3 concentration is ±1%. Total carbon (TC) and total nitrogen (TN) concentrations were measured by an Organic Elemental Analyzer (FLASH 2000 NC Analyzer) with an analytical precision less than ±0.1% and ±0.16%, respectively. TOC concentration was calculated by the difference between TC and TIC. C/N ratio was calculated as TOC/TN.
3.3 Diatom assemblage analysis
Fifty samples were analyzed at 10 cm intervals for brown units and 50 cm intervals for gray units for BS17-GC02 and twenty-two samples were analyzed at 10 cm intervals for BS17-GC01. Due to the predominant occurrence of Fragilariopsis kerguelensis, in the intervals of high biogenic opal concentration, up to 200 diatom specimens were counted. The other intervals had extremely low diatom abundances due to poor preservation, 200 microscope fields of view were observed and counted. The sample preparation and diatom counting methods followed Bak et al. (2018). The quantitative analysis of the diatom slides followed the procedures described in Scherer (1994). Absolute abundance was calculated using the following equation: abundance = ((A × B)/(C × D))/E, where A is the number of specimens counted, B is the area of the settling chamber, C is the number of microscope fields of view, D is the area of the field of view, and E is the sample mass.
3.4 Palynology analysis
Because both cores have brown-gray color alterations and BS17-GC02 has more color cycles, only core BS17-GC02 was examined for palynology. 13 samples were selected from dark brown, brown, and gray units. Samples were dried and weighed. Cold 10% HCl was added to the dried sample to remove carbonates, followed by 24 hours in cold 52% HF and a second cold wash in 10% HCl. Samples were placed in an ultrasonic bath for up to a minute, sieved through a 6 μm mesh to remove small particulate material, and mounted on glass slides in glycerine jelly. A single lycopodium tablet (batch 1061) was introduced during processing to determine absolute palynomorph abundance. Palynology was performed at the GNS Science palynology laboratory.
All counts were completed on a light microscope at 400x magnification. For this study, 100 palynomorph specimens were counted for each sample where possible. The entire slide was scanned for samples in which palynomorphs were rare.
3.5 Grain size analysis and count of grains >1 mm
After removing biogenic components (organic matter, biogenic silica, CaCO3) from bulk sediments using 34% H2O2, 2N NaOH, and 10% HCl, respectively, grain size was analyzed at 8 cm intervals for BS17-GC02 and at 4 cm intervals for BS17-GC01. Grain size was analyzed using a laser diffraction instrument (Mastersizer 3000, Malvern) at KOPRI. The classification of sediments follows that of Folk and Ward (1957).
X-radiographs of center slices (1 cm thick x 8 cm width x 30 cm length) removed from each core section. Then, grains >1 mm in diameter were manually counted every 1 cm on the X-radiograph images.
3.6 Mn/Ti and Zr/Rb ratios
The distribution of chemical elements for both cores was determined non-destructively using an ITRAX core scanner at KOPRI. Following the procedure of Croudace et al. (2006), we analyzed at 5 mm intervals with a 3 kW Mo X-ray tube under 30 kV and 30 mA with a dwell time of 5 seconds. In this study, we focus on Mn, Ti, Zr, and Rb elemental XRF peak area intensities measured in total counts per second (CPS). The elemental data are presented as Mn/Ti and Zr/Rb ratios to account for changes in water content or physical properties.
4 Chronology
4.1 BS17-GC02
Previous studies of sediment accumulation in the Western Antarctic Peninsula region have aligned high MS intervals containing low biological production with glacial periods and assigned low MS intervals containing high biological production to interglacial periods (e.g., Pudsey and Camerlenghi, 1998; Pudsey, 2000; Hillenbrand et al., 2009; Hillenbrand et al., 2021). BS17-GC02 showed a similar lithologic pattern to previous cores collected from the western Antarctic Peninsula (e.g., Pudsey and Camerlenghi, 1998; Pudsey, 2000; Lucchi et al., 2002; Hillenbrand et al., 2009). Recently, Hillenbrand et al. (2021) established age models for cores from the study area by a combination of correlating δ18O data of planktonic foraminifera with LR04 (Lisiecki and Raymo, 2005), Marine Tephra B (MIS 5/6 boundary at ~130 ka; Hillenbrand et al., 2008b), and accelerator mass spectrometry (AMS) 14C dates. This chronological result was consistent with previous chronological frames. Thus, we apply the chronological scheme in Hillenbrand et al. (2021) for the BS17-GC02 age model. A bioturbated biogenic interval at core top (0–35 cm) likely corresponds to interglacial MIS 1, the next biogenic interval (348–398 cm) likely corresponds to interglacial MIS 5, and the deeper biogenic interval (660–698 cm) likely corresponds to interglacial MIS 7. We infer the intervening intervals correspond to the glacial periods MIS 2–4, 6, and 8. However, as it is acknowledged in Hillenbrand et al. (2021), it is not established that the biogenic interval spans the entire MIS 5 and MIS 7 intervals, (or represent only MIS 5e MIS 7e, respectively). We also acknowledge that there is some uncertainty in MIS boundaries in this study due to gradational/bioturbated contacts.
AMS 14C dates were obtained using planktonic foraminifera, Neogloboquadrina pachyderma (sin.), at 354 cm and 372 cm (Kim et al., 2022b). The two radiocarbon ages were calibrated using CALIB 7.1 (Stuiver and Reimer, 1993) with the MARINE13 dataset (Reimer et al., 2013) using a constant marine reservoir effect of 1300 years, consistent with previous Southern Ocean and Western Antarctic Peninsula studies (e.g., Domack et al., 2001; Pugh et al., 2009; Kilfeather et al., 2011; Xiao et al., 2016). The calibrated ages were 20.6 ka at 354 cm and 37.5 ka at 372 cm. These carbon dates are inconsistent with the chronological scheme described above, which assigns the interval 354–372 cm to interglacial MIS 5. Although planktonic foraminifera 14C dates have been previously reported from cores collected from the western Antarctic Peninsula region, (Hillenbrand et al., 2021), we note our dates are the first reported from the first sub-surface CaCO3 interval. As a result, we have limited opportunity to assess the reliability and lateral reproducibility of the two AMS 14C dates we report. Thus, in this study, we follow the established regional chronology by ignoring the two AMS 14C dates for BS17-GC02 we obtained, but note that further investigation of the regional-scale chronological scheme of the western Antarctic Peninsula may be warranted, along with further investigation using radiometric dating approaches (Pudsey and Camerlenghi, 1998; Lucchi et al., 2002; Lucchi and Rebesco, 2007; Hillenbrand et al., 2021).
4.2 BS17-GC01
The correlation between MS values and the European Project for Ice Coring in Antarctica (EPICA) Dronning Maud Land (EDML) ice core dust record (Fischer et al., 2007) has been used for age establishment of Scotia Sea sediment cores, although there has been debate about the causal mechanisms that isochronously connect the two settings (e.g., Pugh et al., 2009; Weber et al., 2012; Xiao et al., 2016; Kim et al., 2018b; Shin et al., 2020). Kim et al. (2022a) established an age model for BS17-GC01 by correlating MS values to EDML ice core dust record. In that scheme, the biogenic interval at the upper part of the core (0–35 cm) corresponded to MIS 1, the 35–217 cm interval corresponded to MIS 2–4; 35–78 cm for MIS 2, 78–189 cm for MIS 3, and 189–217 cm for MIS 4.
5 Results
5.1 Lithology and physical properties
5.1.1 BS17-GC02
BS17-GC02 sediments alternated between decimeter-scale bioturbated diatom-bearing mud with foraminifera (interglacial MIS 1, 5, and 7), and meter-scale laminated mud inferred to be of terrestrial origin (MIS 2–4, 6, and 8). The biogenic intervals were composed of dark brown diatom-bearing mud, overlain by gray mud with foraminifera. These intervals are characterized by decreasing biogenic opal concentration up-section, with a gradual/bioturbated contact (Figure 2). The laminated intervals can be divided into two units; a gray unit, overlain by a brown unit (Figure 2). We infer gray intervals correspond to glacial periods and brown intervals were likely deposited during periods of ice retreat (i.e., deglacial period) (Figure 2).
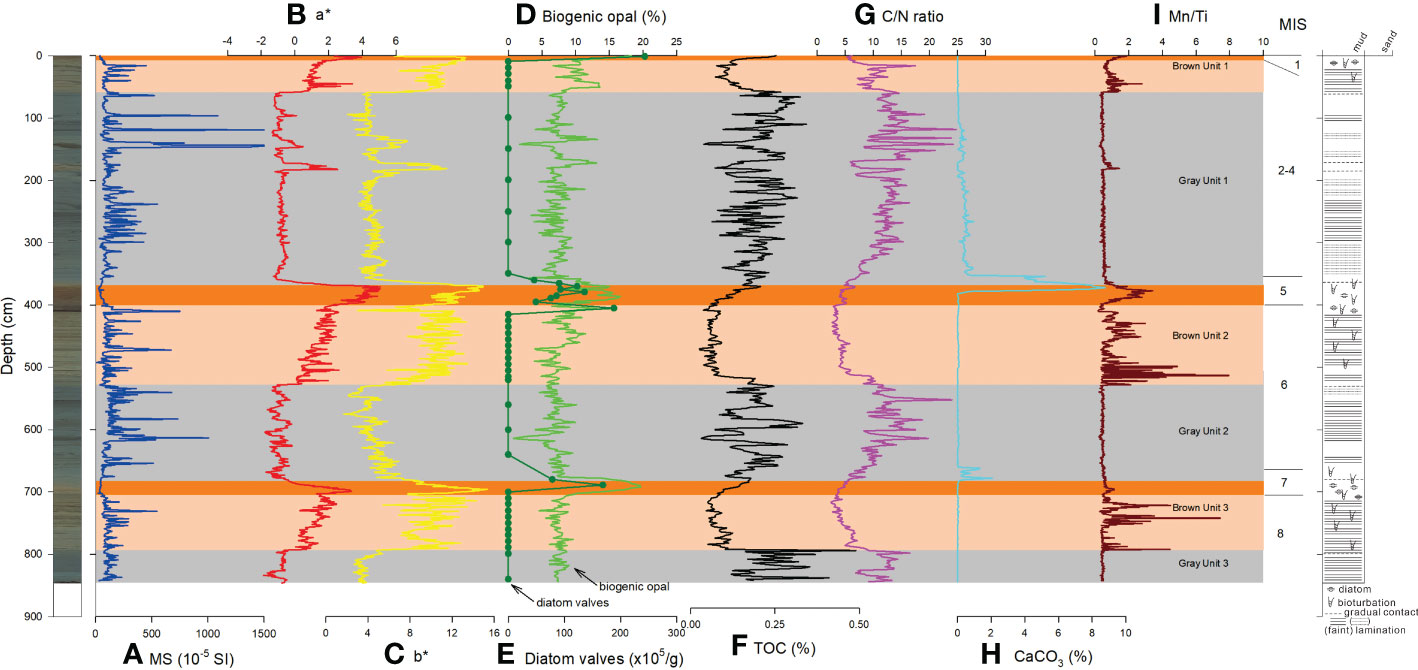
Figure 2 Downcore variations of (A) MS, (B) a*, (C) b*, (D) biogenic opal concentration, (E) diatom valves, (F) TOC concentration, (G) C/N ratio, (H) CaCO3 concentration, (I) Mn/Ti ratio of BS17-GC02. Core photo image and lithologic log are shown on the left and right, respectively. MIS: Marine Isotope Stage.
MS values at BS17-GC02 show fluctuating values from 20 to 1500 10-5 SI (Figure 2A). MS values were constantly low (<100 10-5 SI) during interglacial MIS 1, 5, and 7. In contrast, MS values were high and variable during MIS 2–4, 6, and 8 (Figure 2A). In spite of color difference between the brown and gray units, there was no significant difference in MS values during MIS 2–4, 6, and 8 (Figure 2A).
Grain density (g/cm3) of BS17-GC02 ranges mostly from 2.4 to 2.7 (Figure 3E). Grain density values were noticeably low during interglacial MIS 1, 5, and 7 (Figure 3E).
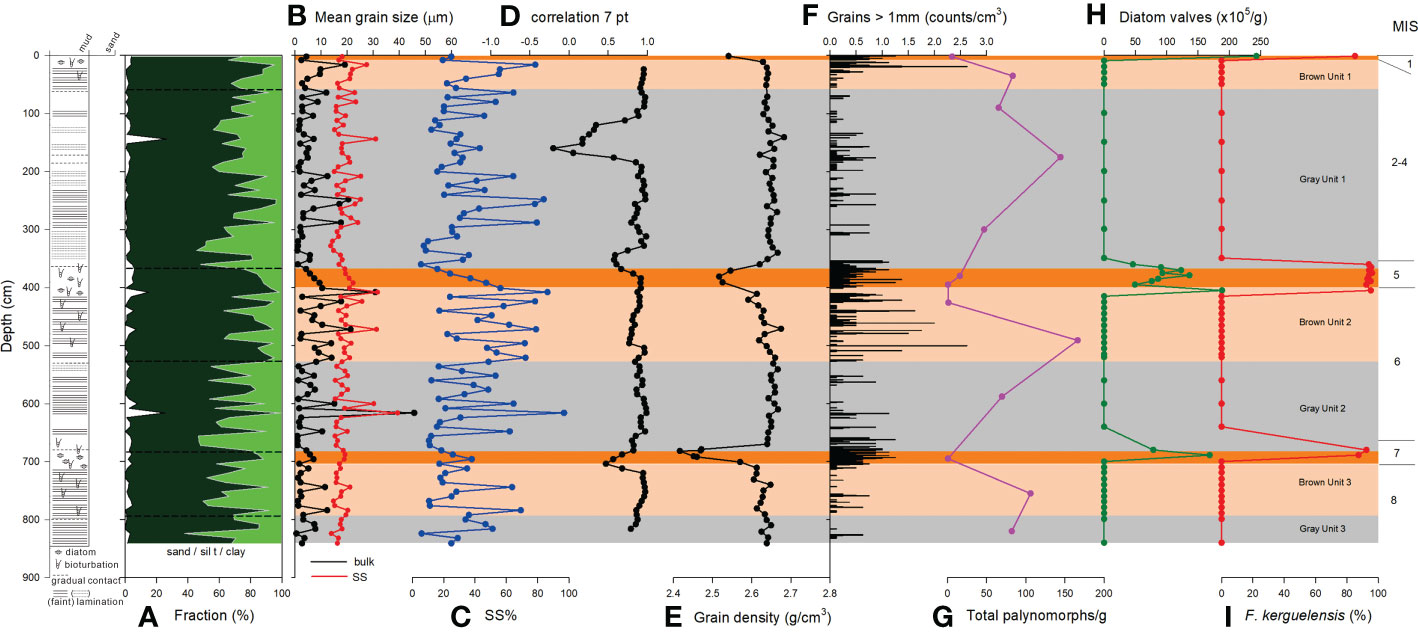
Figure 3 Downcore variations of (A) fraction of sand (white), silt (dark green), and clay (green), (B) MGS of bulk sediment (black) and SS (red), (C) SS% in mud fraction, (D) 7 point-running correlation between SS MGS and SS%, (E) grain density, (F) grains >1 mm, (G) total palynomorphs, (H) total diatom valves, and (I) relative abundance of F. kerguelensis of BS17-GC02. Lithologic log is shown on the left. MIS, Marine Isotope Stage.
Color reflectance (a* and b* values) of BS17-GC02 was high in the brown intervals inferred to have been deposited under deglacial to interglacial conditions, and low in the gray intervals inferred to have been deposited under glacial conditions (Figures 2B, C). Maximum a* and b* values were found in the dark brown intervals (interglacial MIS 1, 5, and 7) (Figure 2). Mn/Ti ratios showed increased values from deglacial to interglacial periods (Figure 2I). However, Mn/Ti ratios from interglacial MIS 1, 5, and 7 were not higher than those observed during deglacial periods (Figure 2I).
5.1.2 BS17-GC01
BS17-GC01 showed alternating deposition between bioturbated (diatom-bearing) mud (corresponding to MIS 1 and 3) and faintly laminated/structureless sandy mud (corresponding to MIS 2 and 4) (Figure 4). The brown units are composed of bioturbated mud overlying intermittently laminated mud. In contrast to BS17-GC02, diatom frustules were found during MIS 1 only (Figure 4). The gray units are composed of structureless sandy mud, overlying faintly laminated mud (Figure 4).
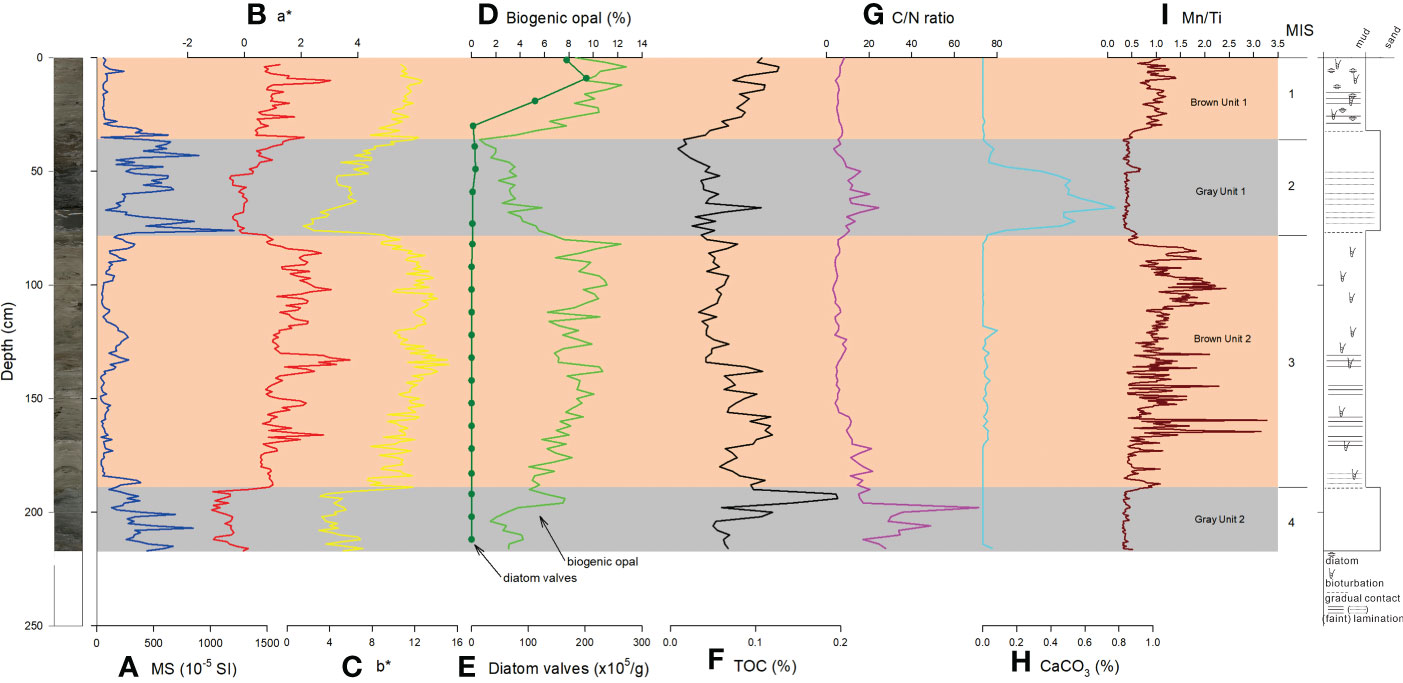
Figure 4 Downcore variations of (A) MS (Kim et al., 2022a), (B) a*, (C) b*, (D) biogenic opal concentration, (E) diatom valves, (F) TOC concentration, (G) C/N ratio, (H) CaCO3 concentration, (I) Mn/Ti ratio of BS17-GC01. Core photo image and lithologic log are shown on the left and right, respectively. MIS, Marine Isotope Stage.
MS values from BS17-GC01 were also constantly low (<100 10-5 SI) during interglacial MIS 1 and MIS 3 (Figure 4A), but were high during MIS 2 and 4.
Grain density (g/cm3) of BS17-GC01 ranges mostly from 2.6 to 2.7 (Figure 5F). Grain density showed relatively low values during MIS 1 and 3 (Figure 5F).
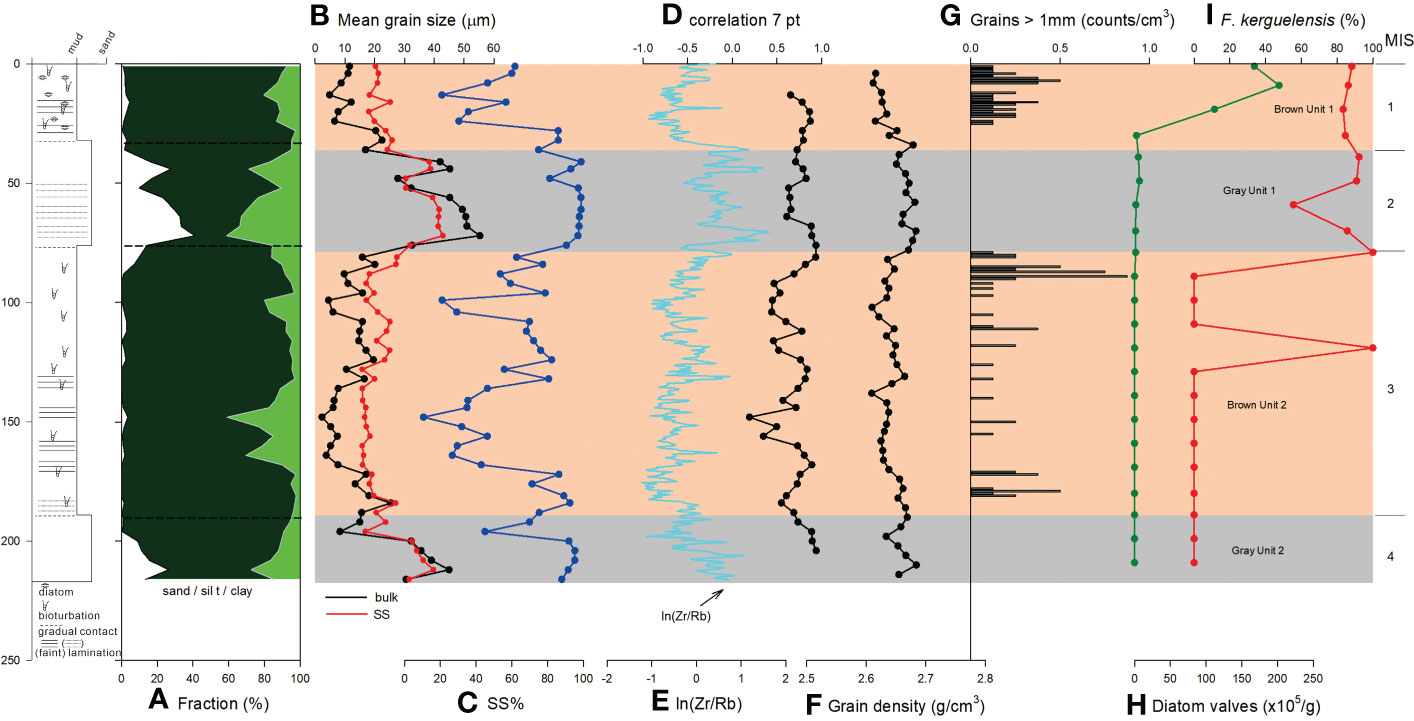
Figure 5 Downcore variations of (A) fraction of sand (white), silt (dark green), and clay (green), (B) MGS of bulk sediment (black) and SS (red), (C) SS% in mud fraction, (D) 7 point-running correlation between SS MGS and SS%, (E) ln(Zr/Rb), (F) grain density, (G) grains >1 mm, (H) total diatom valves, and (I) relative abundance of F. kerguelensis of BS17-GC01. Lithologic log is shown on the left. MIS, Marine Isotope Stage.
Color reflectance (a* and b* values) from BS17-GC01 showed high values in brown intervals (inferred to be deposited during deglacial to interglacial periods) and low values in gray intervals inferred to represent deposition under glacial conditions (Figures 4B, C). Maximum a* and b* values were recorded at the upper part of brown intervals (Figures 4B, C). Mn/Ti ratios showed increased values during MIS 1 and 3, relative to sediment deposited during MIS 2 and 4 time (Figure 4I).
5.2 Geochemical measurements (biogenic opal, TOC, CaCO3, and C/N ratio)
5.2.1 BS17-GC02
In BS17-GC02, biogenic opal concentrations showed high values (15–20%) during interglacial MIS 1, 5, and 7, and low values (<10%) during MIS 2–4, 6, and 8 (Figure 2D). TOC values were high, though variable, (0.3%) in the gray laminated glacial intervals (Figure 2F). TOC concentrations showed minimum values during deglacial periods, and increased during interglacial MIS 1, 5, and 7 (Figure 2F). In general, C/N ratios co-varied with TOC; high during glacial MIS 2–4, 6, and 8, low/moderate during deglacial periods, and low/increasing during interglacial MIS 1, 5, and 7 (Figure 2G). CaCO3 concentrations were generally very low (~0%), but increased CaCO3 concentrations were observed occurred right above biogenic opal peaks of interglacial MIS 5 and 7 (Figure 2H).
5.2.2 BS17-GC01
In BS17-GC01, elevated concentrations of biogenic opal were observed in sediments deposited during interglacial MIS 1 (10–12%) and MIS 3 (8–10%), whereas low concentrations (<5%) were observed during MIS 2 and 4 (Figure 4D). TOC concentrations were generally lower than BS17-GC02 (<0.2%). Except for a brief peak (0.2%) in MIS 4, TOC concentrations were relatively increased during MIS 1 and 3, compared to MIS 2 and 4 (Figure 4F). C/N ratios were lower during MIS 1 and 3, than MIS 2 and 4 (Figure 4G). CaCO3 was generally absent in the core, but a trace amount (0.6–0.8%) was observed in sediments deposited during MIS 2 (Figure 4H).
5.3 Diatom and palynology record
5.3.1 BS17-GC02
Twenty-four diatom species belonging to 10 genera were identified in BS17-GC02. Diatoms were abundant (46–243 105 valves/g) during interglacial MIS 1, 5, and 7, and were absent in other lithologies (Figure 3H). Fragilariopsis kerguelensis, an open ocean species (Crosta et al., 2005; Xiao et al., 2016), dominated the assemblages (85–95%) (Figure 3I). Other minor species were found together with F. kerguelensis during interglacial MIS 1, 5, and 7 and were absent in the other intervals (Table S2).
Palynomorphs concentrations of BS17-GC02 are very low (<165 palynomorphs/g sediment) in all 13 samples examined (Figure 3G). Although the palynomorph abundance was extremely low (~10 specimens/g) in the dark brown units, these samples contained Impagidinium pallidum. This is one of the few forms of dinoflagellate cyst observed in modern high southern latitudes core top samples, and is inferred to be in situ (Esper and Zonneveld, 2007; Prebble et al., 2013). Intervals with a palynomorph concentration of >45 palynomorphs/g contains a mixture of dinoflagellate cyst and pollen forms characteristic of pre-Quaternary Antarctic Sediments of Eocene-Miocene age (Truswell, 1983; Askin, 2000; Askin and Raine, 2000). These dinoflagellate cysts include Hystrichosphaeridium spp., Enneadocysta, Operculodinium spp., and Spinidinium spp., while pollen includes various types of Nothofagidites, Podocarpidites spp., trilete, and monolete spores (Table S2).
5.3.2 BS17-GC01
Eighteen diatom species belonging to 12 genera were identified in BS17-GC01. Diatoms were abundant (112–202 x105/g) during MIS 1, and were very rare to absent during MIS 2–4 (Figure 5H). During MIS 3, biogenic opal concentration was relatively high. In contrast, diatoms samples from sediments of MIS 3 were barren. F. kerguelensis was dominant (83–100%) in most samples were diatoms were present (Figure 5I). At 59 cm, the relative abundance of F. kerguelensis was reduced to 55%. In that sample, Dactyliosolen antarcticus (22%), Eucampia antarctica sp. (11%), and Paralia sulcata (11%) were more common (Figure 5I, Table S1).
5.4 Grain size analysis and grains >1 mm
5.4.1 BS17-GC02
Sediments of BS17-GC02 are dominated by mud fraction (Figure 3A), with silt fraction higher than clay fraction (Figure 3A). Laminated intervals are characterized by a marked increase in mean grain size (MGS), driven by an increase in silt fraction. The MGS was generally less than 20 μm (Figure 3B). In addition, sortable silt (SS: 10–63 μm) MGS showed a consistent variation pattern with MGS (Figure 3B).
Grains >1 mm are found throughout BS17-GC02 (Figure 3F), and occur more frequently during deglacial periods, with highest frequency during interglacial MIS 1, 5, and 7 (Figure 3).
5.4.2 BS17-GC01
The mud fraction is dominant (>95%) during MIS 1 and 3, whereas sand content sharply increased (up to 40%) during MIS 2 and 4 (Figure 5A). As a result, MGS increased during MIS 2 and 4. SS MGS also showed consistent pattern with MGS variation (Figure 5B).
Interestingly, grains >1 mm were found during MIS 1 and 3, but not found during MIS 2 and 4 (Figure 5G).
6 Discussion
6.1 Glacial periods
6.1.1 Deep-water site BS17-GC02 ice covered and likely anoxic during glacials
During glacial periods gray laminated mud was deposited at BS17-GC02. This mud was characterized by fluctuating MS values, low a* and b* values, low biogenic opal concentration, high but fluctuating TOC concentration, high C/N ratios, low CaCO3 concentration, low Mn/Ti, fluctuating MGS, high grain density, dispersed grains >1 mm, increased total palynomorphs represented by reworked species, and an absence of diatoms (Figures 2, 3). These characteristics are very similar to sediments deposited on the western Antarctic Peninsula continental slope/rise during glacial periods (Pudsey and Camerlenghi, 1998; Lucchi et al., 2002; Lucchi and Rebesco, 2007; Hillenbrand et al., 2021). In the western Antarctic Peninsula region, laminated sediments, with reduced biogenic component deposited during glacial periods have previously been interpreted as being deposited by a combination of contourite, meltwater plumite, and distal turbidites (Hillenbrand et al., 2021 and references therein). We infer broadly similar deposition mechanisms for BS17-GC02, although since this site is located further north (~300 km from shelf break) than other previously reported cores on the drift, we infer influence from meltwater plumite to be low.
Sortable Silt MGS has previously been used as a proxy for bottom current speed in a range of deep water settings (e.g., McCave and Hall, 2006; McCave et al., 2017; Wu et al., 2018; McCave and Andrews, 2019; Hillenbrand et al., 2021). Since SS MGS and percentage of sortable silt in mud generally covaries in the core (r > 0.5) (Figure 3D), we follow the approach of previous authors in this region and apply SS MGS as a proxy for bottom current speed at BS17-GC02 (McCave and Andrews, 2019; Hillenbrand et al., 2021). Recently, modified sediment grain size distributions free of IRD influence to recalculate SS MGS have been introduced to sediments including IRDs in the polar regions (Stevenard et al., 2023). The ln(Zr/Rb) ratio is considered and is used as a grain-size proxy free of sandy IRD influence in Antarctic sediment cores (Wu et al., 2020; Stevenard et al., 2023). Since ln(Zr/Rb) ratio of BS17-GC01 showed a good consistence with SS MGS (Figure 5), we did not recalculate SS MGS free of IRD influence in this study. SS MGS data showed a mean value of 19 μm with standard deviation of 4 μm, indicating a relatively small glacial-interglacial changes in bottom-current velocity (Figure 3B). This is consistent with previous study results (Pudsey and Camerlenghi, 1998; Vautravers et al., 2013; Hillenbrand et al., 2021).
TOC concentrations at BS17-GC02 increased during glacial periods (Figure 2F). Hillenbrand et al. (2021) reported increased refractory TOC during glacial periods in the glacial sediments in the western Antarctic Peninsula. C/N ratios are indicative of the degree of marine vs terrestrial organic matter because marine organic matter has lower C/N ratios than those of terrestrial organic matter (Lamb et al., 2006 and references therein). Despite the lack of extant terrestrial vegetation and unique soils on present day Antarctica, this relationship has also been used to infer changes in organic matter source on glacial-interglacial time scales in the Ross Sea and the Scotia Sea, where analysis of sediment cores showed high C/N ratios during glacial periods (Kim et al., 2020a; Kim et al., 2020b; Ha et al., 2022). In addition, high C/N ratios are found in subglacial to proximal depositional environments in the Antarctic sediments (Smith et al., 2019). Thus, high C/N ratios in laminated gray mud at BS17-GC02 suggest that the high TOC concentration is related to the reworked TOC from shelf regions during advance of grounded ice. Palynomorph assemblages also support down slope reworking (Figure 3G). MS values are commonly observed to correlate to proxies of terrestrial input in the Antarctic sediment cores, often showing high values during glacial periods (Leventer et al., 1996; Pudsey and Camerlenghi, 1998; Hillenbrand and Cortese, 2006; Hillenbrand et al., 2009; Kim et al., 2020a; Kim et al., 2020b; Hillenbrand et al., 2021). We infer this relationship is also likely to hold in the present setting, and interpret intervals of increased and fluctuating MS values to indicate terrestrial sediment input from the shelf region (Figure 2A).
In the modern Southern Ocean south of the Polar Front, biogenic opal production is controlled by sea ice (Chase et al., 2015). During glacial periods, a northward expansion of both summer and winter sea ice coverage around the Antarctic margin has been proposed (Gersonde et al., 2005), along with northward migration of oceanic fronts (Kemp et al., 2010; Manoj and Thamban, 2015; Roberts et al., 2017). The sedimentary signature of these glacial sediments is terrigenous laminated/stratified mud with rare IRD, and a low proportion of biogenic components (biogenic opal and CaCO3) (Hillenbrand et al., 2021). We infer the low biological productivity of surface waters during glacial periods in our study area is likely related to extended sea ice conditions coinciding with northward front migration. Lucchi and Rebesco (2007) and Hillenbrand et al. (2021) also proposed that perennial sea ice condition in the south of BS17-GC02 during glacial periods.
Normalized Mn/Ti ratios in marine sediments have been used as an indicator of relative bottom water oxygenation in deep ocean settings (e.g., Jaccard et al., 2016; Wagner and Hendy, 2017; Wu et al., 2018). Mn/Ti was constantly low during glacial periods, consistent with low oxygen conditions (Figure 2I). Although Hillenbrand et al. (2021) proposed progressively decreasing bottom water oxygenation in glacial-aged sediment cores on the drift off the western Antarctic Peninsula, they inferred conditions remained oxic throughout. We acknowledge that Mn/Ti is uncalibrated, and because other redox sensitive elements were not measured in this study and by Hillenbrand et al. (2021), it is difficult to be confident about the exact oxygenation state of the bottom water during glacial periods. However, we note that in our cores, laminations deposited during glacial periods were well preserved without bioturbation, suggesting that the bottom water oxygen may have been too low to support benthic organisms. We infer that bottom water oxygen concentration was low during glacial periods in our study area (dysoxic to anoxic), consistent with conclusions of other workers from around the Antarctic continent supporting ceased/decreased AABW formation (e.g., Jaccard and Galbraith, 2012; Galbraith and Jaccard, 2015; Jaccard et al., 2016; Wagner and Hendy, 2017; Wu et al., 2018). Bottom water oxygenation is related to ventilation and export production (Kim et al., 2011; Jaccard and Galbraith, 2012; Galbraith and Jaccard, 2015; Jaccard et al., 2016; Kim et al., 2017; Wagner and Hendy, 2017; Wu et al., 2018). Although increased TOC is refractory, the relatively high TOC concentration has potential to draw down bottom water oxygen in the study area. The decomposition of the elevated TOC input may additionally draw down dissolved oxygen concentration of the bottom water during glacial periods. Thus, the dysoxic to anoxic bottom water condition was ascribed to ceased/decreased oxygen-rich AABW formation and additional decomposition of elevated organic matter during glacial periods.
A schematic of the inferred depositional environments during the interglacial phase is shown in Figure 6A.
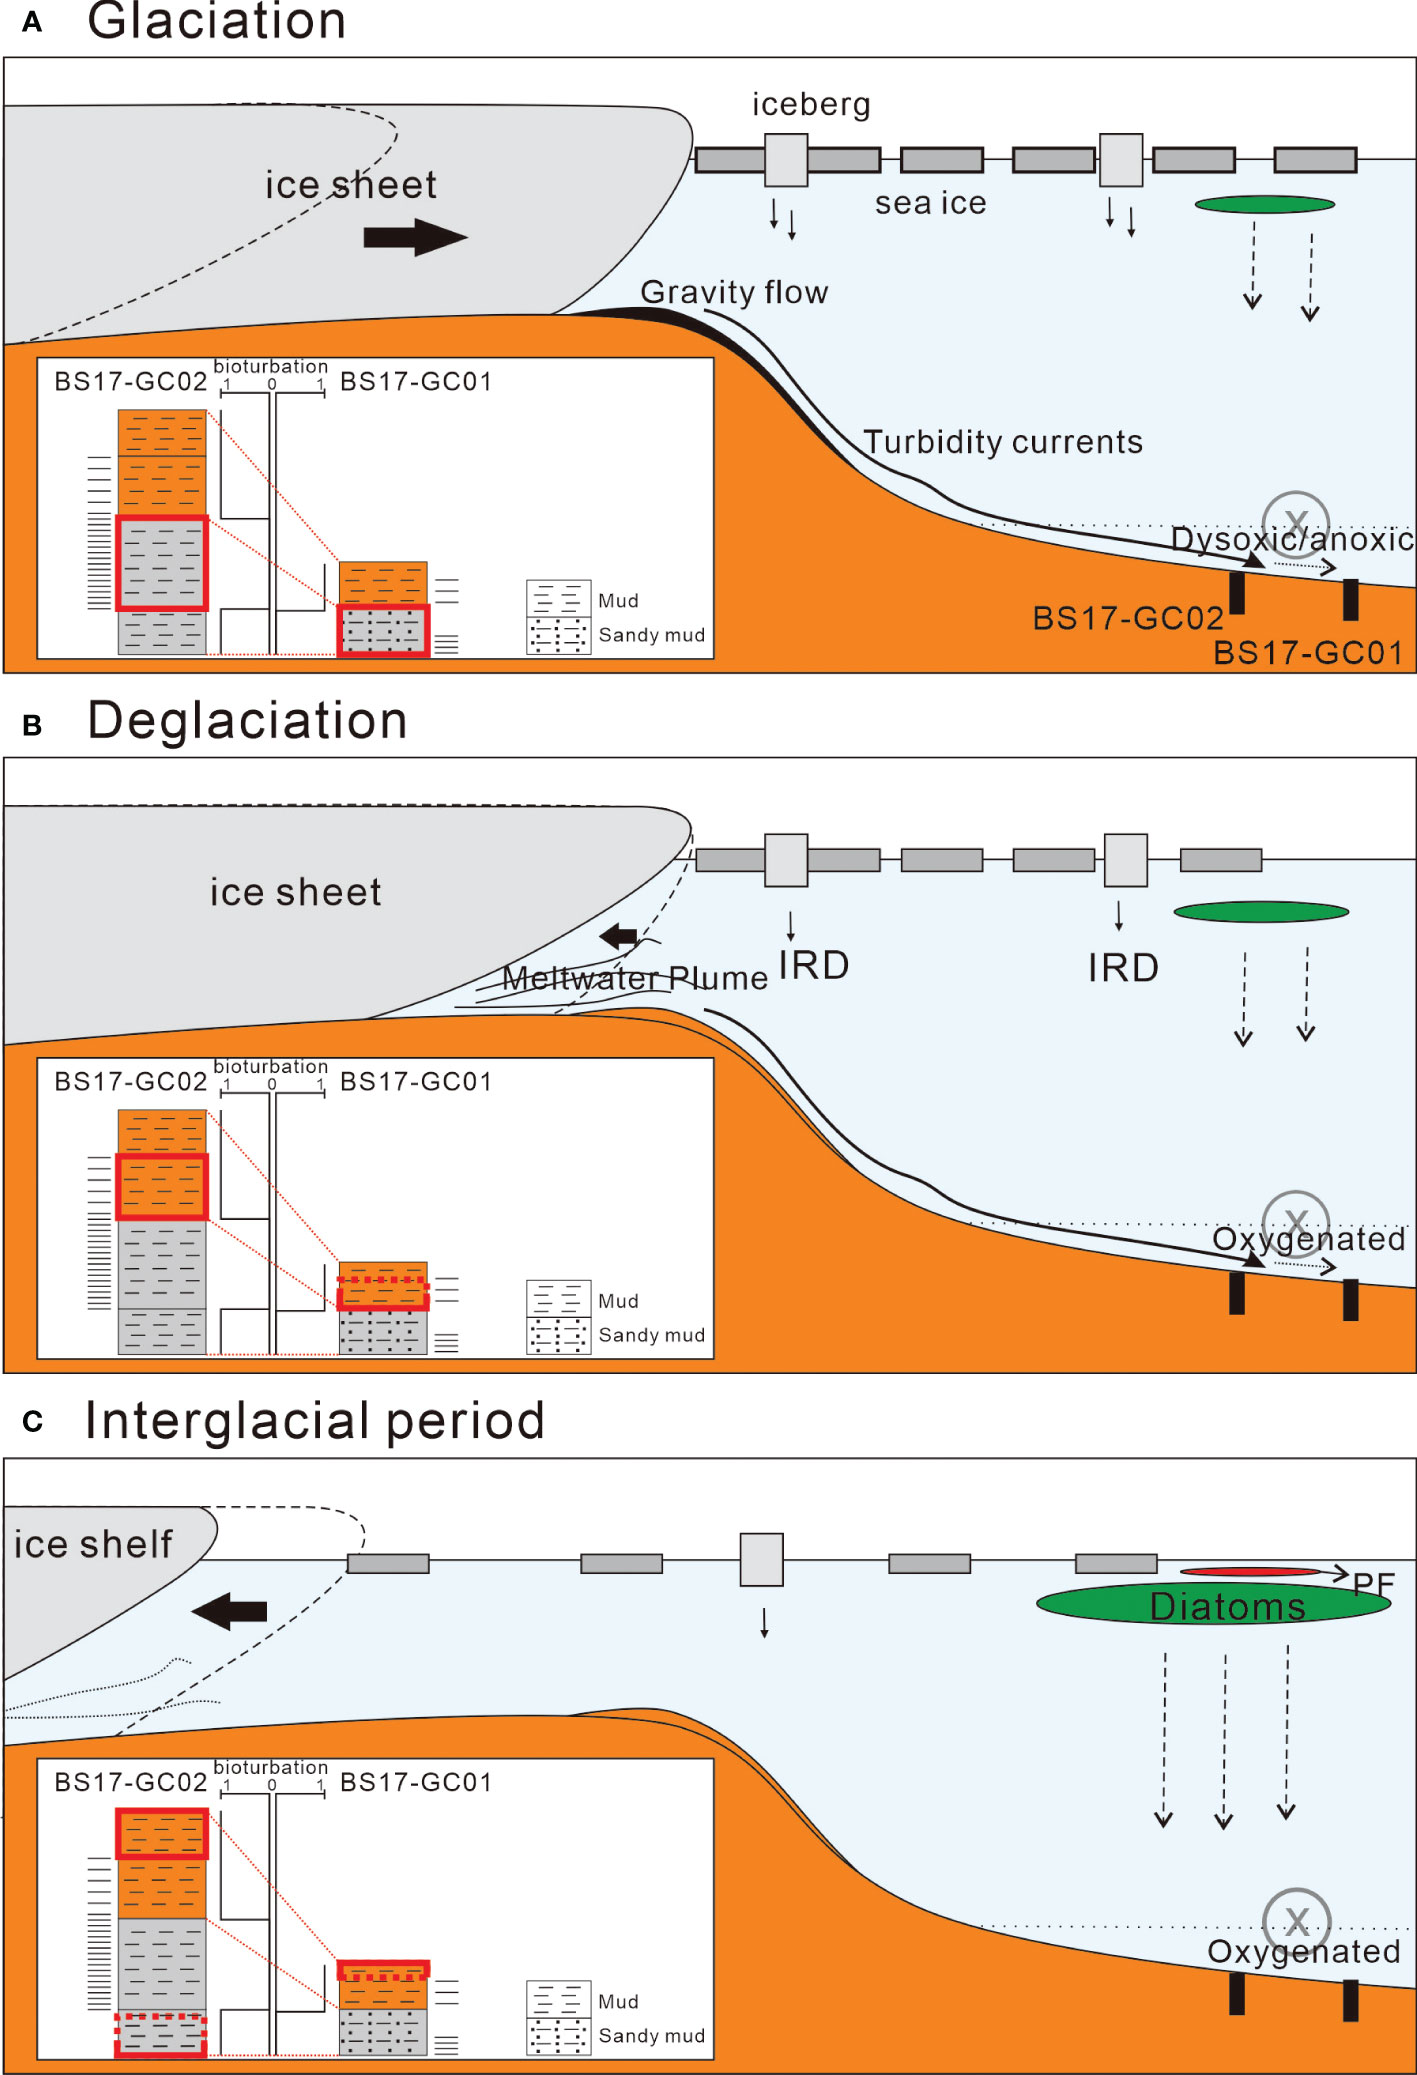
Figure 6 Schematic depositional models of (A) glaciation phase, (B) deglaciation phase, and (C) fully retreated phase (late/warm interglacial period) in the Bellingshausen Sea continental rise. PF, planktonic foraminifers and IRD, ice rafted debris.
6.1.2 Glacial deposition at BS17-GC01
There is a brown interval, corresponding to MIS 3, at BS17-GC01. Mn/Ti ratio showed high values in both brown intervals (MIS 1 and 3) (Figure 4I). We infer these ratio values are consistent with oxic bottom water condition at BS17-GC01 site during MIS 3, coinciding with increased opal concentrations during this time. However, no diatoms or other bio-siliceous fragments were observed (Figure 7). However, due to the presence of black colored volcanic sand sized grains we infer the origin of the opal is volcanic. Volcanic grains are vitric in BS17-GC01 (Figure S1). This means that they are volcanic glass shards which are amorphous and uncrystallized product of rapidly cooling magma. As a result, they may have low MS values (Li and Fu, 2019) and tend to be extracted by we-alkaline method. In addition, Zulaikah and Nurlaily (2018) reported volcanic ash has lower MS values than classic sand and/or silt. High C/N ratios also indicate that reworked sediments are dominant.
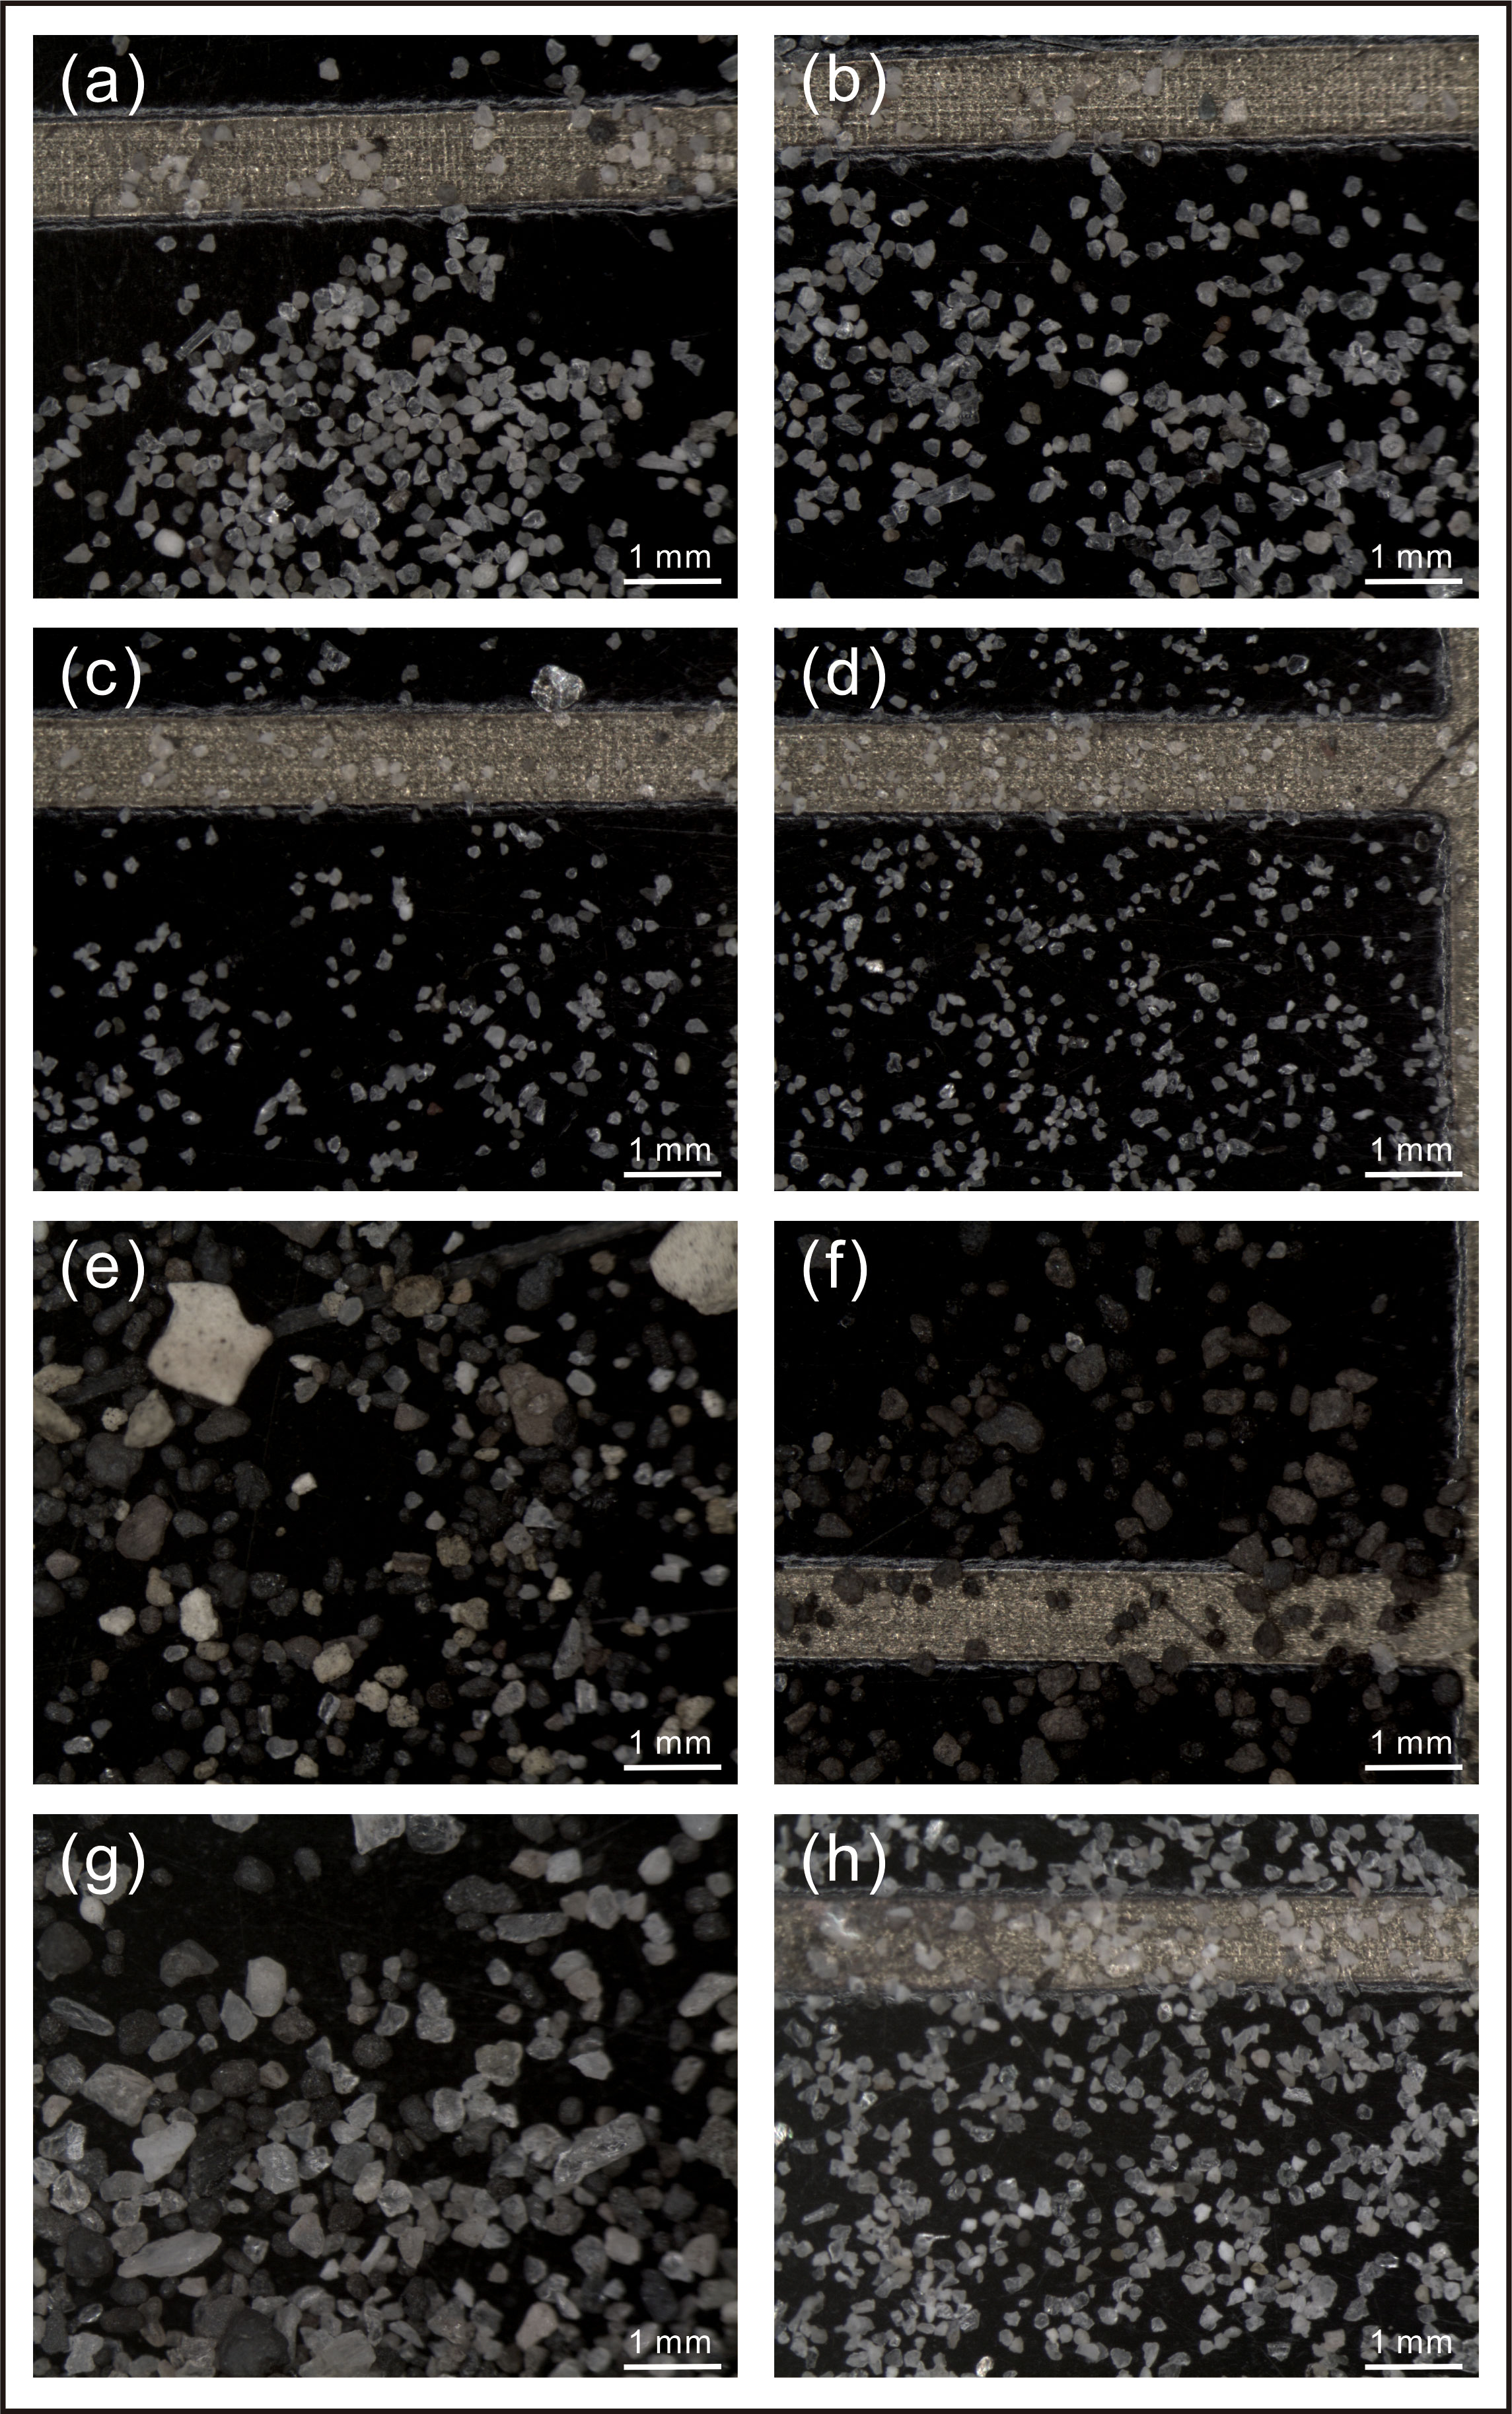
Figure 7 Microscopic photos of grains >63 μm of BS17-GC01 at (A) 0 cm, (B) 20 cm, (C) 50 cm, (D) 70 cm, (E) 110 cm, (F) 140 cm, (G) 170 cm, and (H) 200 cm. 0 cm and 20 cm belong to MIS 1, 50 cm and 70 cm belong to MIS 2, 110 cm, 140 cm, and 170 cm belong to MIS 3, and 200 cm belongs to MIS 4.
During MIS 2, diatom production was low, but the assemblage was dominated by F. kerguelensis (Figures 5H, I), with occurrences of Eucampia antarctica sp., an indicator BS17-GC01 probably covered by seasonal, but not perennial, sea ice during that time (Crosta et al., 2005; Xiao et al., 2016) (Table S1). Increased gravelly IRDs (grains >1 mm) were observed only during MIS 3 which is relatively warmer climate during the last glacial period MIS 2 and MIS 4 (Figure 5G). The absence of gravelly IRDs at BS17-GC01 indicates that gravelly IRDs were probably limited to BS17-GC02 site during MIS 2 and 4.
SS MGS showed increased values up to 40 μm during MIS 2 and 4 (Figure 5B). This indicates that the bottom current intensified during MIS 2 and 4 at distal continental rise site. That is, bottom current speed was higher at BS17-GC01 than that at BS17-GC02 during MIS 2 and 4. ln(Zr/Rb) data are largely in agreement with SS MGS data, supporting stronger bottom current at BS17-GC01 site.
In both the Scotia and Bellingshausen Seas, the increased MS values during glacial periods are related to sand- to coarse silt-sized grains (16–250 μm) having high MS values, implying that MS could be used to infer IRD transport in this setting (Kim et al., 2018b; Kim et al., 2020b; Shin et al., 2020; Kim et al., 2022a). Kim et al. (2020b) proposed that different source regions between glacial and deglacial/interglacial periods could result in different IRD with different characteristics deposited at the sites. Kim et al. (2022a) proposed that sand- to coarse silt-sized grains, entrapped into grounded ice while advancing, were mainly deposited on the continental shelf during ice shelf development during deglacial to interglacial periods by sub ice shelf melting. In contrast, icebergs during glacial periods still contains the sand- to coarse silt-sized grains and were drifted into the deep basin. We infer that IRD was delivered to BS17-GC01 throughout the last glacial period, but the size characteristics if the IRD was unique during MIS 3. However, it was reported that very fine sands can be sorted by bottom current in the Drake Passage where (Wu et al., 2021). Nonetheless, sand sized grains are difficult to be transported from source areas considering the directions of currents and sinking rate of sand grains. SS MGS values during MIS 2 and 4 are ~40 μm (Figure 5B), which is similar to those reported in the Drake Passage (Wu et al., 2021). Thus, possibility of sorting sand sized grains by bottom current cannot be ruled out.
A schematic of the inferred depositional environments during the glaciation phase is shown in Figure 7A.
6.2 Deglacial periods
6.2.1 BS17-GC02
During deglacial periods, brown laminated mud was deposited at BS17-GC02. This mud was characterized by fluctuating MS values, high a* and b* values, low/decreased C/N ratios, high Mn/Ti, fluctuating MGS, high grain density, and disperse grains >1 mm. Biological characteristics of the interval included low biogenic opal, TOC, CaCO3, an absence of diatoms, and increased total palynomorphs represented by reworked species (Figures 2, 3). These characteristics are similar to those observed in other deglacial settings (Hillenbrand et al., 2021).
The overall sedimentary characteristics between glacial and deglacial periods in this setting are quite similar (Hillenbrand et al., 2021; this study). Thus, deglacial brown laminated mud at BS17-GC02 is considered mainly contourites as well. However, we infer that the down-slope sediment transportation mechanism is different between glacial and deglacial periods. Down-slope sediment transportation occurred by the advance of grounded ice across the shelf during glacial periods (Hillenbrand et al., 2021), but occurred by sediment-rich subglacial melt water out as grounded ice retreats across the shelf during deglacial periods.
Other outstanding difference between the two periods are sediment color and elemental composition; gray with low Mn/Ti during glacial periods vs brown with high Mn/Ti during deglacial periods (Figure 2I). Elevated Mn has been widely reported from the Southern Ocean during deglacial periods, and attributed to high-oxygen conditions (Jaccard and Galbraith, 2012; Galbraith and Jaccard, 2015; Jaccard et al., 2016; Wagner and Hendy, 2017; Wu et al., 2018): we infer the increased Mn/Ti rations during deglacials at BS17-GC02 arises from increased bottom water oxygenation. This is consistent with observations of rapidly increasing bottom-water oxygen oxygenation during glacial termination at other sites along the western Antarctic Peninsula (Hillenbrand et al., 2021) and in Prydz Bay (Wu et al., 2018).
We are intrigued by the constantly low TOC concentrations (Figure 2F). It has previously been suggested that TOC minima in these settings could imply low (1–2 cm/kyr) sedimentation rates or minimum input of refractory organic material (Hillenbrand et al., 2021). A few deci-meter to meter scale deposits during deglacial periods implies that high sedimentation rates although we cannot define the glacial-deglacial-interglacial boundary precisely in this study. The thickness of glacial terminations of previously reported cores also showed similar sedimentation (Hillenbrand et al., 2021). In the Scotia Sea surface diatom production started to increase from deglacial periods with sea ice retreat (Sprenk et al., 2013; Xiao et al., 2016; Kim et al., 2020b). As sea ice is the main controlling factor for surface diatom production in the Southern Ocean (Chase et al., 2015), surface diatom production should have increased during deglacial periods with sea ice decrease although the signal of increased production is not clear in sediments. This is supported by C/N ratios. The last deglacial period showed TOC minima with low to moderate C/N ratios indicating some sediment input from the shelf region (Figures 2F, G). However, the two previous deglacial intervals showed low C/N ratios indicating that organic carbon relatively more originates from surface water by biological production. However, decomposition of non-refractory organic matter under oxic bottom water conditions can draw down TOC concentration (Hillenbrand et al., 2021). This likely results in low TOC concentrations in the sediment. Thus, TOC minima with low to moderate C/N ratios indicates increased proportion of marine organic matter and increased decomposition of the organic matter under oxic bottom water conditions during deglacial periods. Co-occurrence of bioturbation and laminated mud during deglacial periods suggests depositional alternation between lamination as a combination of distal turbidite and contourite leaving high sedimentation and bioturbated hemipelagic deposition leaving low sedimentation. This seems to be related to discontinuous retreat of ice sheet/shelf on the shelf.
A schematic of the inferred depositional environments during the interglacial phase is shown in Figure 6B.
6.2.2 BS17-GC01
The faintly laminated, bioturbated brown interval at BS17-GC01 is considered to represent deposition during the last deglacial period (Figure 4). MS values sharply decreased into the last deglacial, accompanied by an increase in biogenic opal concentration (Figures 4A, D). We infer this represents an increase in diatom production, while the assemblage contains increasing frequency of the (mainly) open water species F. kerguelensis (Figure 5H). Although C/N ratios of BS17-GC02 showed moderate values, those of BS17-GC01 showed low values (Figures 2G, 4G). This means that BS17-GC01 site became open ocean condition earlier than BS17-GC02, as expected. The long distance of BS17-GC01 from the shelf break can additionally result in less terrestrial influence than BS17-GC02. Mn/Ti started to increase with a* and b* increases, indicating oxygenated bottom water condition at BS17-GC01 site (Figures 4B, C, I).
A schematic of the inferred depositional environments during the deglaciation phase is shown in Figure 6B.
6.3 Interglacial periods
6.3.1 Interglacial periods from site BS17-GC02
During interglacial periods, dark brown to gray biogenic bearing mud is deposited at BS17-GC02. It is characterized by minimum of MS values, high a* and b* values, increased biogenic opal concentration, increasing TOC concentration, increasing C/N ratios (but still low), increased CaCO3 concentration (right after biogenic opal), high Mn/Ti, fluctuating MGS, low grain density, abundant grains >1 mm, decreased total palynomorphs represented by modern like species, and increased diatoms consisting mainly of F. kerguelenesis (Figures 2, 3). These characteristics are similar to those of peak to moderate (late) interglacial periods in the western Antarctic Peninsula (Hillenbrand et al., 2021).
As previous studies in the Amundsen and Bellingshausen Seas reported increased surface diatom productivity during interglacial periods (Hillenbrand et al., 2009; Hillenbrand et al., 2021), biogenic opal concentration showed its maxima within dark brown intervals, indicated by the maxima of a* and b* (Figures 2B, C). TOC concentration increased but C/N ratio was still low, implying that export production increase is related to increased surface water diatom production (Figures 2F, G). Total diatom valves also significantly increased during interglacial periods (Figure 2I). The dominant species is F. kerguelensis, an open ocean species indicating Antarctic Circumpolar Current influence (Zielinski and Gersonde, 1997; Abelmann et al., 2006; Xiao et al., 2016). In addition, total palynomorph, composed of reworked species, is significantly reduced but few species living modern like open ocean conditions was observed (Figure 3G). MS values were constantly low and grain density decreased, implying less terrestrial input and increased biogenic component under open ocean conditions during interglacial periods.
Occurrence of grains >1 mm was focused on the interglacial periods implying that gravelly IRD input likely increased during interglacial periods in the Bellingshausen Sea (Figure 3F). Mn/Ti ratio was also elevated, but not higher than those during deglacial periods despite its darker brown color (Figure 2I). Although TOC concentrations were similar to those observed during glacial periods, interglacial sediments are characterized by brown color, bioturbation, and high Mn/Ti (Figure 2I). These characteristics suggest bottom water at BS17-GC02 remained oxygenated during interglacial periods. We conclude that the main factor to control bottom water oxygenation in this setting is bottom water formation, not surface production, which draws down dissolved oxygen by decomposition, in the Bellingshausen Sea. An increase in CaCO3 concentration, mainly composed of planktonic foraminifera N. pachyderma, overlies biogenic opal maxima at BS17-GC02 during MIS 5 and 7 coincident with change of sediment color changed into gray across a gradual bioturbated boundary (Figure 2). However, neither CaCO3 peak nor gray colored sediment were observed in MIS 1. This suggests that increased CaCO3 intervals may include also the early part of glacial periods. This is consistent with previous reports that high biogenic intervals correspond to glacial to early part of glacial periods (Hillenbrand et al., 2021).
A schematic of the inferred depositional environments during the interglacial phase is shown in Figure 6C.
6.3.2 Interglacial periods from site BS17-GC01
Although biogenic opal concentration maxima occurred in peak interglacial periods of BS17-GC01, marked by dark brown intervals corresponding maximum of a* and b*, dark brown intervals were not observed in the core (Figure 4). Biogenic opal concentration showed high values and total diatom valves, consisting of mainly F. kerguelensis (~90%), were outstandingly high, indicating increased surface diatom production under open ocean conditions (Figures 4D, 5H, and 5I). Grain density showed decreased values, also supporting increased biological composition at BS17-GC01. Biogenic opal and TOC concentration at BS17-GC01 was lower than BS17-GC02. This is consistent with lower grain density values at BS17-GC02 than those at BS17-GC01 (Figures 3E, 5F). CaCO3 concentrations of BS17-GC01 and BS17-GC02 during MIS 1 were very low although those of BS17-GC02 during MIS 5 and 7 were relatively high (Figures 2H, 4H). Since core top CaCO3 concentration increase was found from some cores not all, indicating some local effect (Hillenbrand et al., 2021).
Decreased SS MGS values and ln(Zr/Rb) during MIS 1 indicates that bottom current was intensified during MIS 2 and 4 at BS17-GC01 site. The last glacial-Holocene Antarctic Circumpolar Current flow speed differences in the Drake Passages showed different pattern according to its latitude (McCave et al., 2014). In addition, glacial-interglacial frontal migration in the Southern Ocean was reported (Kemp et al., 2010; Manoj and Thamban, 2015; Roberts et al., 2017). Thus, the bottom water intensity change on glacial-interglacial scale at the study site is also considered to be related to glacial-interglacial frontal migration. As McCave et al. (2014) and Kim et al. (2020b) reported increased SS MGS from the south of the Polar Front close to slope/rise boundary, BS17-GC01 record might reflect intensified southwestward flowing bottom current influence.
A schematic of the inferred depositional environments during the interglacial phase is shown in Figure 6C.
7 Conclusions
In this study, we documented glacial-interglacial succession from two sediment cores from the Bellingshausen Sea continental rise to understand glacial-interglacial changes in oceanographic conditions and depositional process in response to ice sheet dynamics. The followings are the main conclusions:
1. Surface diatom production started to increase from deglacial periods as ice sheet/shelf retreated, reaching a maximum during interglacials MIS 1, 5, and 7. In MIS 5 and MIS 7, the maxima of diatom productivity was overlain by a CaCO3 peak (but not in MIS 1). Low diatom production is thought to be related to the influence of extensive sea ice. Low MS values also indicate that input of terrestrial material was lowest during MIS 1, 5, and 7. However, frequent occurrence of IRD grains indicate active ice shelf calving on the shelf during interglacial periods.
2. Terrestrially-derived, laminated mud was dominant during glacial and deglacial periods. During glacial periods, gray laminated mud was observed, with increased refractory TOC, low Mn/Ti, and lacking bioturbation, implying dysoxic bottom water conditions. In contrast, we infer, brown laminated mud with increased Mn/Ti and intermittent bioturbation observed in sediments deposited during deglacial periods, implies oxic bottom water conditions.
3. Increased bottom water oxygenation endured during interglacial periods until surface diatom production increased. Thus, we infer the main factor controlling bottom water oxygenation in this setting is the degree of AABW formation; increased during interglacial and decreased during glacial periods.
4. A strong correlation between SS MGS and %SS imply that SS at two cores can be used as a proxy for bottom current intensity, despite IRD influence. Laminated mud during glacial to deglacial periods is likely a result of varying bottom current intensity.
Data availability statement
The original contributions presented in the study are included in the article/Supplementary Material. Further inquiries can be directed to the corresponding author.
Author contributions
The co-authors’ contributions are the following: ML and HM helped to obtain two cores and data interpretation. Y-SB conducted diatom analysis. JoP conducted palynology record. M-IK conducted IRD counting. JiP helped interpretation of the modern oceanographic conditions. JL, K-CY, and SuK helped data interpretation and result discussion. All authors reviewed the manuscript.
Funding
This research was supported by KOPRI grant funded by the Ministry of Oceans and Fisheries (PE23090). JP was supported by the New Zealand Government MBIE Antarctic Science Platform contract ID ANTA1801. This work was also supported by the National Research of Korea (NRF) grant funded by the Korea government (MSIT) (No. 2022R1A2C1091796).
Acknowledgments
We would like to thank the crew and scientific party of the IBR/V Araon for all their help during the gravity coring on board. We would like to thank KOPRI laboratory members for all their help during experimental measurements. We appreciate the handling editor ZX and two reviewers for their important and constructive comments to improve data interpretation and manuscript structure. This research was supported by KOPRI grant funded by the Ministry of Oceans and Fisheries (PE23090). JP was supported by the New Zealand Government MBIE Antarctic Science Platform contract ID ANTA1801. This work was also supported by the National Research of Korea (NRF) grant funded by the Korea government (MSIT) (No. 2022R1A2C1091796).
Conflict of interest
The authors declare that the research was conducted in the absence of any commercial or financial relationships that could be construed as a potential conflict of interest.
Publisher’s note
All claims expressed in this article are solely those of the authors and do not necessarily represent those of their affiliated organizations, or those of the publisher, the editors and the reviewers. Any product that may be evaluated in this article, or claim that may be made by its manufacturer, is not guaranteed or endorsed by the publisher.
Supplementary material
The Supplementary Material for this article can be found online at: https://www.frontiersin.org/articles/10.3389/fmars.2023.1183516/full#supplementary-material
Supplementary Figure 1 | Microscopic images of (A) BS17-GC01 1cm (x400), (B) BS17-GC02 1 cm (x400), (C) BS17-GC01 109 cm (x200), and (D) BS17-GC01 109 cm (x400). (A) and (B) belong to MIS 1 showing biogenic components. (C) and (D) belong to MIS 3 showing volcanic shards.
Supplementary Table 1 | physical properties (magnetic susceptibility (MS), grain density, and color reflectance), geochemical proxies (CaCO3, total organic carbon (TOC), biogenic opal concentrations, and C/N ratio), paleontological record (diatoms), and grain size records with grains >1 mm for BS17-GC01.
Supplementary Table 2 | physical properties (magnetic susceptibility (MS), grain density, and color reflectance), geochemical proxies (CaCO3, total organic carbon (TOC), biogenic opal concentrations, and C/N ratio), paleontological records (diatoms and palynomorphs), and grain size records with grains >1 mm for BS17-GC02.
References
Abelmann A., Gersonde R., Cortese G., Kuhn G., Smetacek V. (2006). Extensive phytoplankton blooms in the Atlantic sector of the glacial southern ocean. Paleoceanography 21, PA1013. doi: 10.1029/2005PA001199
Anderson J. B., Shipp S. S., Lowe A. L., Wellner J. S., Mosola A. B. (2002). The Antarctic ice sheet during the last glacial maximum and its subsequent retreat history: a review. Quat. Sci. Rev. 21, 49–70. doi: 10.1016/S0277-3791(01)00083-X
Askin R. A. (2000). Spores and pollen from the McMurdo sound erratics, Antarctica. Antarct. Res. Ser. 76, 161–181. doi: 10.1029/AR076p0161
Askin R. A., Raine J. I. (2000). Oligocene and early Miocene terrestrial palynology of the cape roberts drillhole CRP-2/2A, Victoria land basin, Antarctica. Terra Antarctica 7, 493–501. doi: 10.1029/AR076p0161
Bak Y.-S., Yoo K.-C., Lee J. I., Yoon H. I. (2018). Glacial-interglacial records from sediments in Powell basin, Antarctica. Antarct. Sci. 30, 371–378. doi: 10.1017/S0954102018000408
Chase Z., Kohfeld K. E., Matsumoto K. (2015). Controls on biogenic silica burial in the southern ocean. Global Biogeochm. Cycles 29, 1599–1616. doi: 10.1002/2015GB005186
Crosta X., Romero O., Armand L. K., Pichon J. J. (2005). The biogeography of major diatom taxa in southern ocean sediments: 2. open ocean related species. Palaeogeogr. Palaeoclimatol. Palaeoecol. 223, 66–92. doi: 10.1016/j.palaeo.2005.03.028
Croudace I. W., Rindby A., Rothwell R. G. (2006). “ITRAX: description and evaluation of a new multi-function X-ray core scanner,” in Geological society, vol. 267. (London: Special Publicatios), 51–63.
De Conto R. M., Pollard D. (2016). Contribution of Antarctica to past and future sea level rise. Nature 531, 591–597. doi: 10.1038/nature17145
DeMaster D. J. (1981). The supply and accumulation of silica in the marine environment. Geochim. Cosmochim. Acta 5, 1715–1732. doi: 10.1016/0016-7037(81)90006-5
De Santis L., Anderson J. B., Brancolini G., Zayatz I. (1995). “Seismic record of late oligocene through Miocene glaciation on the central and Eastern continental shelf of the Ross Sea,” in Geology and seismic stratigraphy of the Antarctic margin, vol. 68 . Eds. Cooper A. K., Barker P. F., Brancolini G. (American Geophysical Union Antarctic Research Series), 235–260.
Dinniman M. S., Klinck J. M., Smith W. O. Jr. (2011). A model study of circumpolar deep water on the West Antarctic peninsula and Ross Sea continental shelves. Deep-Sea Res. II 58, 1508–1523. doi: 10.1016/j.dsr2.2010.11.013
Domack E. W., Jacobson E. A., Shipp S., Anderson J. B. (1999). Late pleistocene–Holocene retreat of the West Antarctic ice-sheet system in the Ross Sea: part 2–sedimentologic and stratigraphic signature. GSA Bull. 111, 1517–1536. doi: 10.1130/0016-7606(1999)111<1517:LPHROT>2.3.CO;2
Domack E. W., Leventer A., Dunbar R., Taylor F., Brachfeld S., Sjunneskog C., et al. (2001). Chronology of the palmer deep site, Antarctic peninsula: a Holocene palaeoenvironmental reference for the circum-Antarctic. Holocene 11, 1–9. doi: 10.1191/095968301673881493
Dowdeswell J. A., Ó Cofaigh C., Noormets R., Larter R. D., Hillenbrand C.-D., Benetti S., et al. (2008). A major trough-mouth fan on the continental margin of the bellingshausen Sea, West Antarctica: the belgica fan. Mar. Geol. 252, 129–140. doi: 10.1016/j.margeo.2008.03.017
Dowdeswell J. A., Ó Cofaigh C., Taylor J., Kenyon N. H., Mienert J., Wilken M. (2002). “On the architecture of high-latitude continental margins: the influence of ice-sheet and sea-ice processes in the polar north Atlantic,” in Glacier-influenced sedimentation on high-latitude continental margins, vol. 203 . Eds. Dowdeswell J. A., Ó Cofaigh C. (London: Geological Society, Special Publication), 33–54.
Esper O., Zonneveld K. A. F. (2007). The potential of organic-walled dinoflagellate cysts for the reconstruction of past sea-surface conditions in the southern ocean. Mar. Micropaleontol. 65, 185–212. doi: 10.1016/j.marmicro.2007.07.002
Fischer H., Fundel F., Ruth U., Twarloh B., Wegner A., Udisti R., et al. (2007). Reconstruction of millennial changes in dust emission, transport and regional sea ice coverage using the deep EPICA ice cores from the Atlantic and Indian ocean sector of Antarctica. Earth Planet. Sci. Lett. 260, 340–354. doi: 10.1016/j.epsl.2007.06.014
Folk R. L., Ward W. C. (1957). Brazos river bar [Texax]; a study in the significance of grain size parameters. J. Sediment. Res. 27, 3–26. doi: 10.1306/74D70646-2B21-11D7-8648000102C1865D
Galbraith E. D., Jaccard S. L. (2015). Deglacial weakening of the oceanic soft tissue pump: global constraints from sedimentary nitrogen isotopes and oxygenation proxies. Quat. Sci. Rev. 109, 38–48. doi: 10.1016/j.quascirev.2014.11.012
Gersonde R., Crosta X., Abelmann A., Armand L. (2005). Sea-Surface temperature and sea ice distribution of the southern ocean at the EPILOG last glacial maximum – a circum-Antarctic view based on siliceous microfossil records. Quat. Sci. Rev. 24, 869–896. doi: 10.1016/j.quascirev.2004.07.015
Golledge N. R., Fogwill C. J., Mackintosh A. N., Buckley K. M. (2012). Dynamics of the last glacial maximum Antarctic ice sheet and its response to ocean forcing. Proc. Natl. Acad. Sci. 109, 16052-16056 doi: 10.1073/pnas.1205385109
Gordon A. L. (2009). “Bottom water formation,” in Ocean currents. Eds. Steele J. H., Thorpe S. A., Turekian K. K. (Associated Press), 263–269.
Ha S., Colizza E., Torricella F., Langone L., Giglio F., Kuhn G., et al. (2022). Glaciomarine sediment deposition on the continental slope and rise of the central Ross Sea since the last glacial maximum. Mar. Geol. 445, 106752. doi: 10.1016/j.margeo.2022.106752
Hillenbrand C.-D., Camerlenghi A., Cowan E. A., Hernández-Molina F. J., Lucchi R. G., Rebesco M., et al. (2008a). The present and past bottom-current flow regime around the sediment drifts on the continental rise west of the Antarctic peninsula. Mar. Geol. 255, 55–63. doi: 10.1016/j.margeo.2008.07.004
Hillenbrand C.-D., Cortese G. (2006). Polar stratification: a critical view from the southern ocean. Palaeogeogr. Palaeoclimatol. Palaeoecol. 242, 240–252. doi: 10.1016/j.palaeo.2006.06.001
Hillenbrand C.-D., Crowhurst S. J., Williams M., Hodell D. A., McCave I. N., Ehrmann W., et al. (2021). New insights from multi-proxy data from the West Antarctic continental rise: implications for dating and interpreting late quaternary paleoenvironmental records. Quat. Sci. Rev. 257, 106842. doi: 10.1016/j.quascirev.2021.106842
Hillenbrand C.-D., Grobe H., Diekmann B., Kuhn G., Fütterer D. J. (2003). Distribution of clay minerals and proxies for productivity in surface sediments of the bellingshausen and amundsen seas (West Antarctica) – relation to modern environmental conditions. Mar. Geol. 193, 253–271. doi: 10.1016/S0025-3227(02)00659-X
Hillenbrand C.-D., Kuhn G., Frederichs T. (2009). Record of a mid-pleistocene depositional anomaly in West Antarctic continental margin sediments: an indicator for ice-sheet collapse? Quat. Sci. Rev. 28, 1147–1159. doi: 10.1016/j.quascirev.2008.12.010
Hillenbrand C.-D., Moreton S. G., Caburlotto A., Pudsey C. J., Lucchi R. G., Smellie J. L., et al. (2008b). Volcanic time-markers for marine isotopic stages 6 and 5 in southern ocean sediments and Antarctic ice cores: implications for tephra correlations between palaeoclimatic records. Quat. Sci. Rev. 27, 518–540. doi: 10.1016/j.quascirev.2007.11.009
Jaccard S. L., Galbraith E. D. (2012). Large Climate-driven changes of oceanic oxygen concentrations during the last deglaciation. Nat. Geosci. 5, 151–156. doi: 10.1038/ngeo1352
Jaccard S. L., Galbraith E. D., Martínez-García A., Anderson R. F. (2016). Covariation of deep southern ocean oxygenation and atmospheric CO2 through the last ice age. Nature 530, 207–210. doi: 10.1038/nature16514
Jimenez-Espejo F. J., Presti M., Kuhn G., McKay R., Crosta X., Escutia C., et al. (2020). Late pleistocene oceanographic and depositional variations along the Wilkes land margin (East Antarctica) reconstructed with geochemical proxies in deep-sea sediments. Glob. Planet. Change 184, 103045. doi: 10.1016/j.gloplacha.2019.103045
Kemp A. E. S., Grigorov I., Pearce R. B., Naveira Garabato A. C. (2010). Migration of the Antarctic polar front through the mid-pleistocene transition: evidence and climatic implications. Quat. Sci. Rev. 29, 1993–2009. doi: 10.1016/j.quascirev.2010.04.027
Kilfeather A. A., Ó Cofaigh C., Lloyd J. M., Dowdeswell J. A., Xu S., Moreton S. G. (2011). Ice-stream retreat and ice-shelf history in Marguerite trough, Antarctic peninsula: sedimentological and foraminiferal signatures. Geol. Soc Am. Bull. 123, 997–1015. doi: 10.1130/B30282.1
Kim S., Khim B.-K., Ikehara K., Itaki T., Shibahara A., Yamamoto M. (2017). Millennial-scale changes of surface and bottom water conditions in the northwestern pacific during the last deglaciation. Glob. Planet. Change 154, 33–43. doi: 10.1016/j.gloplacha.2017.04.009
Kim S., Khim B.-K., Uchida M., Itaki T., Tada R. (2011). Millennial-scale paleoceanographic events and implication for the intermediate-water ventilation in the northern slope area of the Bering Sea during the last 71 kyrs. Global. Planet. Change 79, 89–98. doi: 10.1016/j.gloplacha.2011.08.004
Kim S., Lee J. I., McKay R. M., Yoo K. C., Bak Y. S., Lee M. K., et al. (2020a). Late pleistocene paleoceanographic changes in the Ross Sea – glacial-interglacial variations in paleoproductivity, nutrient utilization, and deep-water formation. Quat. Sci. Rev. 239, 106356. doi: 10.1016/j.quascirev.2020.106356
Kim S., Lee M. K., Shin J. Y., Yoo K. C., Lee J. I., Kang M. I., et al. (2022a). Variation in magnetic susceptibility in the bellingshausen Sea continental rise since the last glacial period and implications for terrigenous material input mechanisms. Palaeogeogr. Palaeoclimatol. Palaeoecol. 594, 110948. doi: 10.1016/j.palaeo.2022.110948
Kim S., McKay R. M., Lee J. I., Yoo K. C., Lee M. K., Moon H. S. (2022b). Bioturbation supplying young carbon into West Antarctic continental margin sediment. Palaeogeogr. Palaeoclimatol. Palaeoecol. 602, 111161 doi: 10.1016/j.palaeo.2022.111161
Kim S., Yoo K. C., Lee J. I., Khim B. K., Bak Y. S., Lee M. K., et al. (2018a). Holocene Paleoceanography of bigo bay, west Antarctic peninsula: connections between surface water productivity and nutrient utilization and its implication for surface-deep water mass exchange. Quat. Sci. Rev. 192, 59–70. doi: 10.1016/j.quascirev.2018.05.028
Kim S., Yoo K. C., Lee J. I., Lee M. K., Kim K., Yoon H. I. (2018b). Relationship between magnetic susceptibility and sediment grain size since the last glacial period in the southern ocean off the northern Antarctic peninsula – linkages between the cryosphere and atmospheric circulation. Palaeogeogr. Palaeoclimatol. Palaeoecol. 505, 359–370. doi: 10.1016/j.palaeo.2018.06.016
Kim S., Yoo K. C., Lee J. I., Roh Y. H., Bak Y. S., Um I. K., et al. (2020b). Paleoceanographic changes in the southern ocean off elephant island since the last glacial period: links between surface water productivity, nutrient utilization, bottom water currents, and ice-rafted debris. Quat. Sci. Rev. 249, 106563. doi: 10.1016/j.quascirev.2020.106563
Lamb A. L., Wilson G. P., Leng M. J. (2006). A review of coastal palaeoclimate and relative sea-level reconstructions using δ13C and C/N ratios in organic material. Earth Sci. Rev. 75, 29–57. doi: 10.1016/j.earscirev.2005.10.003
Lavoie C., Domack E. W., Pettit E. C., Scambos T. A., Larter R. D., Schenke H.-W., et al. (2015). Configuration of the northern Antarctic peninsula ice sheet at LGM based on a new synthesis of seabed imagery. Cryosphere 9, 613–629. doi: 10.5194/tc-9-613-2015
Leventer A., Domack E. W., Ishman S. E., Brachfeld S., McClennen C. E., Manley P. (1996). Productivity cycles of 200–300 years in the Antarctic peninsula region: understanding linkages among the sun, atmosphere, oceans, sea ice, and biota. Geol. Soc Am. Bull. 108, 1626–1644. doi: 10.1130/0016-7606(1996)108<1626:PCOYIT>2.3.CO;2
Li Z., Fu G. (2019). Application of magnetic susceptibility parameters in research of igneous rock in chepaizi. J. Phys. Conf. Ser. 1176, 42068. doi: 10.1088/1742-6596/1176/042068
Lisiecki L. E., Raymo M. E. (2005). A pliocene-pleistocene stack of 57 globally distributed benthic δ18O records. Paleoceanography 20, PA1003. doi: 10.1029/2004PA001071
Lucchi R. G., Rebesco M. (2007). “Glacial contourites on the Antarctic peninsula margin: insight for palaeoenvironmental and palaeoclimatic conditions,” in Economic and palaeoceanographic significance of contourite deposits, vol. 276 . Eds. Viana A. R., Rebesco M. (London: Geological Society, Special Publications), 111–127.
Lucchi R. G., Rebesco M., Camerlenghi A., Busetti M., Tomadin L., Villa G., et al. (2002). Mid-late pleistocene glacimarine sedimentary processes of a high-latitude, deep-sea sediment drift (Antarctic peninsula pacific margin). Mar. Geol. 189, 343–370. doi: 10.1016/S0025-3227(02)00470-X
Manoj M. C., Thamban M. (2015). Shifting frontal regimes and its influence on bioproductivity variations during the late quaternary in the Indian sector of southern ocean. Deep-Sea Res. II 118, 261–274. doi: 10.1016/j.dsr2.2015.03.011
McCave I. N., Andrews J. T. (2019). Distinguishing current effects in sediments delivered to the ocean by ice. i. principles, methods and examples. Quat. Sci. Rev. 212, 92–107. doi: 10.1016/j.quascirev.2019.03.031
McCave I. N., Crowhurst S. J., Kuhn G., Hillenbrand C.-D., Meredith M. P. (2014). Minimal change in Antarctic circumpolar current flow speed between the last glacial and Holocene. Nat. Geosci 7, 113-116. doi: 10.1038/NGEO2037
McCave I. N., Hall I. R. (2006). Size sorting in marine muds: processes, pitfalls and prospects for palaeoflow-speed proxies. Geochem. Geophys. Geosyst 7, Q10N05. doi: 10.1029/2006GC001284
McCave I. N., Thornalley D. J. R., Hall I. R. (2017). Relation of sortable silt grain size to deep-sea current speeds: calibration of the 'Mud current meter'. Deep-Sea Res. Part I 127, 1–12. doi: 10.1016/j.dsr.2017.07.003
Mortlock R. A., Froelich P. N. (1989). A simple method for the rapid determination of opal in pelagic marine sediments. Deep-Sea Res. 36, 1415–1426. doi: 10.1016/0198-0149(89)90092-7
Noormets R., Dowdeswell J. A., Larter R. D., Ó Cofaigh C., Evans J. (2009). Morphology of the upper continental slope in the bellingshausen and amundsen seas – implications for sedimentary processes at the shelf edge of West Antarctica. Mar. Geol. 258, 100–114. doi: 10.1016/j.margeo.2008.11.011
Ó Cofaigh C., Davies B. J., Livingstone S. J., Smith J. A., Johnson J. S., Hocking E. P., et al. (2014). Reconstruction of ice-sheet changes in the Antarctic peninsula since the last glacial maximum. Quat. Sci. Rev. 100, 87–110. doi: 10.1016/j.quascirev.2014.06.023
Prebble J. G., Crouch E. M., Carter L., Cortese G., Bostock H., Neil H. (2013). An expanded modern dinoflagellate cyst dataset for the southwest pacific and southern hemisphere with environmental associations. Mar. Micropaleontol. 101, 33–48. doi: 10.1016/j.marmicro.2013.04.004
Pritchard H. D., Ligtenberg S. R. M., Fricker H. A., Vaughan D. G., Broeke M. R., van den, Padman L. (2012). Antarctic Ice sheet loss driven by basal melting of ice shelves. Nature 484, 502–505. doi: 10.1038/nature10968
Pudsey C. J. (2000). Sedimentation on the continental rise west of the Antarctic peninsula over the last three glacial cycles. Mar. Geol. 167, 313–338. doi: 10.1016/S0025-3227(00)00039-6
Pudsey C. J., Camerlenghi A. (1998). Glacial-interglacial deposition on a sediment drift on the pacific margin of the Antarctic peninsula. Antarct. Sci. 10, 286–308. doi: 10.1017/S0954102098000376
Pugh R. S., MaCave I. N., Hillenbrand C.-D., Kuhn G. (2009). Circum-Antarctic age modeling of quaternary marine cores under the Antarctic circumpolar current: ice core dust-magnetic correlation. Earth Planet. Sci. Lett. 284, 113–123. doi: 10.1016/j.epsl.2009.04.016
Rebesco M., Pudsey C., Canals M., Camerlenghi A., Barker P., Estrada F., et al. (2002). “Sediment drift and deep-sea channel systems, Antarctic peninsula pacific margin,” in Deep-water contourite systmes: modern drifts and ancient series, seismic and sedimentary characteristics, vol. 22 . Eds. Stow D. A. V., Pudsy C. J., Howe J. A., Faugères. J. C., Viana A. R. (London, Memoirs: Geological Society), 353–371.
Reimer P. J., Bard E., Bayliss A., Beck J. W., Blackwell P. G., Ramsey C. B., et al. (2013). IntCal13 and Marine13 radiocarbon age calibration curves 0-50,000 years cal BP. Radiocarbon 55, 1869–1887. doi: 10.2458/azu_js_rc.55.16947
Roberts J., McCave I. N., McClymont E. L., Kender S., Hillenbrand C. D., Matano R., et al. (2017). Earth planet. Sci. Lett. 474, 397–408. doi: 10.1016/j.epsl.2017.07.004
Scherer R. P. (1994). A new method for the determination of absolute abundance of diatoms and other silt-sized sedimentary particles. J. Paleolimnol. 12, 171–180. doi: 10.1007/BF00678093
Scheuer C., Gohl K., Larter R. D., Rebesco M., Udintsev G. (2006). Variability in Cenozoic sedimentation along the continental rise of the Bellingshausen Sea, West Antarctica. Mar. Geol. 227, 279–298.
Shin J. Y., Kim S., Zhao X., Yoo K. C., Yu Y., Lee J. I., et al. (2020). Particle-size dependent magnetic properties of Scotia Sea sediments since the last glacial maximum: glacial ice-sheet discharge controlling magnetic proxeis. Palaeogeogr. Palaeoclimatol. Palaeoecol. 557, 109906. doi: 10.1016/j.palaeo.2020.109906
Smith J. A., Graham A. G. C., Post A. L., Hillenbrand C.-D., Bart P. J., Powell R. D. (2019). The marine geological imprint of Antarctic ice shelves. Nat. Commun. 10, 5635. doi: 10.1038/s41467-019-1349605
Sprenk D., Weber M. E., Kuhn G., Rosén P., Frank M., Molina-Kescher M., et al. (2013). Southern ocean bioproductivity during the last glacial cycle–new detection method and decadal-scale insight from the Scotia Sea. Geol. Soc London. Spec. Publ. 381, 245–261. doi: 10.1144/SP381.17
Stevenard N., Govin A., Kissel C., Toer A. (2023). Correction of the IRD influence for paleo-current flow speed reconstructions in hemipelagic sediments. Paleoceanography Paleoclimatology 38, e2022PA004500. doi: 10.1029/2022PA004500
Stuiver M., Reimer P. J. (1993). Extended 14C data base and revised CALIB 3.0 14C age calibration program. Radiocarbon 35, 215–230. doi: 10.1017/S0033822200013904
Tamura T., Ohshima K. I., Nihashi S. (2008). Mapping of sea ice production for Antarctic coastal polynyas. Geophys. Res. Lett. 35, L07606. doi: 10.1029/2007/GL032903
The RAISED Consortium, Bentley M. J., Ó Cofaigh C., Anderson J. B., Conway H., Davies B., et al. (2014). A community-based geological reconstruction of Antarctic ice sheet deglaciation since the last glacial maximum. Quat. Sci. Rev. 100, 1–9. doi: 10.1016/j.quascirev.2014.06.025
Truswell E. M. (1983). Recycled Cretaceous and tertiary pollen and spores in Antarctic marine sediments: a catalogue. Palaeontogr. Abt. B. 186, 121–174.
Vautravers M. J., Hodell D. A., Channell J. E. T., Hillenbrand C.-D., Hall M., Smith J. A., et al. (2013). “Palaeoenvironmental records from the West Antarctic peninsula drift sediments over the last 75 ka,” in Antarctic Palaeoenvironmnets and earth-surface processes, vol. 318 . Eds. Hambrey M. J., Barker P. F., Barrett P. J., Bowman V., Davies B., Smellie J. L., Tranter M. (Geol. Soc. London Special Publ), 263–276. doi: 10.1144/SP381.12
Wagner M., Hendy I. L. (2017). Trace metal evidence for a poorly ventilated glacial southern ocean. Quat. Sci. Rev. 170, 109–120. doi: 10.1016/j.quascirev.2017.06.014
Weber M. E., Kuhn G., Sprenk D., Rolf C., Ohlwein C., Ricken W. (2012). Dust transport from Patagonia to Antarctica–a new stratigraphic approach from the Scotia Sea and its implications for the last glacial cycle. Quat. Sci. Rev. 36, 177–188. doi: 10.1016/j.quascirev.2012.01.016
Wu S., Lembke-Jene L., Lamy F., Arz H. W., Nowaczyk N., Xiao W., et al. (2021). Orbital- and millennial-scale Antarctic circumpolar current variability in drake passage over the past 140,000 years. Nat. Commun. 12, 3948. doi: 10.1038/s41467-021-24264-9
Wu L., Wang R., Xiao W., Krijgsman W., Li Q., Ge S., et al. (2018). Late quaternary deep stratification-climate coupling in the southern ocean: implications for changes in abyssal carbon storage. Geochem. Geophys. Geosyst 19, 379-395. doi: 10.1002/2017GC007250
Wu L., Wilson D. J., Wang R., Yin X., Chen Z., Xiao W., et al. (2020). Evaluating Zr/Rb ratio from XRF scanning as an indicator of grain-size variations of glaciomarine sediments in the southern ocean. Geochem. Geophys. Geosyst 21, e2020GC009350. doi: 10.1029/2020GC009350
Xiao W., Frederichs T., Gersonde R., Kuhn G., Esper O., Zhang X. (2016). Constraining the dating of late quaternary marine sediment records from the Scotia Sea (Southern ocean). Quat. Geochronol. 31, 97–118. doi: 10.1016/j.quageo.2015.11.003
Zielinski U., Gersonde R. (1997). Diatom distribution in southern ocean surface sediments (Atlantic sector): implications for paleoenvironmental reconstructions. Palaeogeogr. Palaeoclimatol. Palaeoecol. 129, 213–250. doi: 10.1016/S0031-0182(96)00130-7
Keywords: Bellingshausen Sea, surface diatom production, contourite, lamination, ice sheet variation
Citation: Kim S, Bak Y-S, Prebble JG, Kang M-I, Kim S, Park J, Lee MK, Lee JI, Yoo K-C and Moon HS (2023) Glacial-interglacial changes in oceanic conditions and depositional process in the continental rise in response to ice sheet (shelf) variation in Bellingshausen Sea, Antarctica. Front. Mar. Sci. 10:1183516. doi: 10.3389/fmars.2023.1183516
Received: 10 March 2023; Accepted: 02 May 2023;
Published: 15 May 2023.
Edited by:
Zhifang Xiong, Ministry of Natural Resources, ChinaReviewed by:
Li Wu, Guangdong Ocean University, ChinaShuzhuang Wu, Université de Lausanne, Switzerland
Copyright © 2023 Kim, Bak, Prebble, Kang, Kim, Park, Lee, Lee, Yoo and Moon. This is an open-access article distributed under the terms of the Creative Commons Attribution License (CC BY). The use, distribution or reproduction in other forums is permitted, provided the original author(s) and the copyright owner(s) are credited and that the original publication in this journal is cited, in accordance with accepted academic practice. No use, distribution or reproduction is permitted which does not comply with these terms.
*Correspondence: Sunghan Kim, ZGVsb25na3NoQGtvcHJpLnJlLmty