 Tonggang Han
 Jiangxin Chen
 Bingshou He
 Leonardo Azevedo4
- 1Key Lab of Submarine Geosciences and Prospecting Techniques, Ministry of Education, Ocean University of China, Qingdao, China
- 2Key Laboratory of Gas Hydrate, Ministry of Natural Resources, Qingdao Institute of Marine Geology, Qingdao, China
- 3Laboratory for Marine Mineral Resources, National Laboratory for Marine Science and Technology, Qingdao, China
- 4Instituto Superior Técnico, University of Lisbon, Lisbon, Portugal
Introduction: The seafloor is an important interface between the lithosphere and the hydrosphere, where processes related to circulation and energy exchange happen along with various marine processes widely developed in the water column near the seafloor. These processes are still not yet completely understood as there are constraints of submarine detection technology and the interdisciplinary nature of these complex environments. Seismic reflection data have been a preferable tool to study and image these processes due to their characteristics in terms of spatial resolution. In seismic reflection data, submarine sand waves show hair-like reflection configurations with low continuity and wearing-hair style, appearing with an angle with the seafloor. Investigation of the relationship between the characteristics of submarine sand waves induced hair-like reflection configuration and hydrodynamics is crucial for understanding hair-like reflection configuration generation and spatiotemporal evolution.
Methods: This study combines fluid dynamics numerical simulation and seismic oceanography to discuss the seismic response characteristics and formation mechanisms of the hair-like reflection configuration. First, we create a seawater time-variant fluid-dynamical model followed by the numerical simulation of seismic oceanography data. This procedure results in seismic oceanography numerical simulation sections with hair-like reflection configurations for different constant flow conditions forced on the boundary. Optimal matching method is then applied to interpret field seismic reflection sections given the results obtained with the numerical experiments.
Results and discussion: As consequence, the fluid dynamic explanation for the formation mechanism of the hair-like reflection configuration due to differences in seawater thermohaline is proposed. The study provides additional comprehension and further insights into the dynamic process of submarine sand waves induced hair-like reflection configuration using the seismic oceanography method.
1 Introduction
The seafloor, as interpreted as the intersection between the lithosphere and the hydrosphere, is where substance circulation and energy exchange take place (Shaw et al., 1996; Fang and Hao, 2019; Qian et al., 2022). This region is also a significant interdisciplinary research field for both physical oceanography and marine geology due to, for example, the interaction between submarine topography and multiscale ocean dynamics; the effects of turbidity and ocean bottom currents; cold seep and hydrothermal activity; biology; and marine sedimentary processes. Nevertheless, it is challenging to continuously observe and study dynamic processes happening close to or at the seafloor (Perlin et al., 2005; Jazi et al., 2020). Chen et al. (2016) defined various marine processes widely developed in the water column near the seafloor as “seafloor processes,” including seabed fluid flow, sedimentary processes, tectonic processes, biological processes, and submarine dynamic processes, which cannot be studied intensively due to the constraints of submarine detection technology and interdisciplinary nature. Seafloor processes have been subject to intensive research about their horizontal scale and the location of the oceanic bottom boundary to get a systematic understanding of the evolution of the seafloor.
Compared with traditional geophysical methods of seafloor survey, seismic oceanography can image not only oceanographic phenomena in seawater, but also the important marine processes happening near the seafloor (Song et al., 2021a). Seismic oceanography (Holbrook et al., 2003) has been applied to study various oceanographic phenomena, including fronts (Holbrook et al., 2003; Tsuji et al., 2005), water mass boundaries (Nandi et al., 2004), mesoscale eddies (Biescas et al., 2008; Ménesguen et al., 2009; Song et al., 2009; Pinheiro et al., 2010; Quentel et al., 2010; Tang et al., 2014), internal waves (Holbrook and Fer, 2005; Krahmann et al., 2008; Song et al., 2009; Song et al., 2021b), submesoscale processes (Sallares et al., 2016; Tang et al., 2020; Yang et al., 2021), and seafloor processes (Vsemironva et al., 2012; Chen et al., 2016; Chen et al., 2017; Chen et al., 2018; Geng et al., 2019; Yin et al., 2021). More recently, seismic reflection studies have now been used to look at the evolution of marine processes over time (Dickinson et al., 2020; Gunn et al., 2020; Zou et al., 2021; Dickinson and Gunn, 2022). Seismic oceanography has been used to preliminarily analyze some significant images of fluid-solid interactions near the seafloor, such as submarine sand waves induced hair-like reflection configuration (Chen et al., 2016). The seismic images of submarine dynamic processes are of considerable significance, but identified phenomena have been simply analyzed and interpreted from a qualitative perspective, without detailed quantitative modeling to study the origin of the seismic response and the dynamic processes. Nevertheless, the relevant preliminary results have demonstrated that statistical models and numerical simulation can be jointly applied in the quantitative calculation of seismic oceanography (Huang et al., 2018; Chen et al., 2020). However, the currently available work, related to this topic, does not compare the results of the numerical simulation with field seismic data. Further analysis and research in this field will certainly provide a deeper understanding and further insight into not yet-known seafloor processes.
Submarine sand waves, sometimes referred to as submarine sand dunes, are simultaneously a sediment transport mechanism and a dynamic morphologic feature in subaqueous environments that are commonly found in submarine canyons and continental shelves worldwide (Flemming, 1980; Ashley, 1990; Viana et al., 1998; Wynn and Stow, 2002; Stow et al., 2009; Cukur et al., 2022; Yang et al., 2022). These sedimentary features are dynamic rhythmic bedforms with wavelengths that might have hundreds of meters and heights of several meters. Their crests are nearly perpendicular to the direction of the primary tidal current (Mccave, 1971; Terwindt, 1971; Besio et al., 2008; Campans et al., 2017). Many observations, such as the Acoustic Doppler Current Profiler (ADCP), indicate that the morphological patterns are developed in response to complex hydrodynamical conditions, sediment transport, and geomorphology (Dodd et al., 2003; Borsje et al., 2014). However, compared with other observation methods, seismic oceanography method can provide more direct images of the interaction between seafloor and seawater movement. The fluid dynamics numerical simulation is an important method to study the evolution of seafloor processes, which combined with seismic oceanography method might be used to study key dynamic parameters of the seafloor processes and the essential dynamic information reflected by the seismic dataset. Investigating the relationship between the characteristics of submarine sand waves induced hair-like reflection configuration and hydrodynamics is crucial for understanding hair-like reflection configuration generation and evolution.
Seismic events related to submarine sand waves are characterized by low continuity and wearing-hair style (Chen et al., 2016). Seismic reflection configurations of submarine sand waves had a blanket drape, higher amplitude than the surrounding seawater, and medium-high apparent frequency. The amplitude diminishes with higher height and converges with the surrounding seawater. The abnormal seismic reflection characteristic is called a hair-like reflection configuration (Chen et al., 2016), and its development characteristics are similar to those of Carr et al. (2010) and Reeder et al. (2011). The formation of the hair-like reflection configuration is significantly influenced by the submarine topography, whose dynamic process has yet to be illustrated. Additionally, the strong amplitude is due to the seawater thermohaline feature or oceanic sediment resuspension, lacking the constraint of a quantitative relationship. Chen et al. (2016) have speculated that the hair-like reflection configuration reflects the seismic response to the flow pattern and the distribution of oceanic suspended sediment caused by the interaction between the rugged seafloor, such as sand waves, and the bottom current according to simulation results of a discrete vortex model in Hansen et al. (1994). A preliminary study of the turbidity layer found that oceanic suspended sediments could be identified, and the quantitative relationships could be analyzed (Vsemironva et al., 2012), which lays a foundation for further discussion on the quantitative interpretation of the seismic response of the hair-like reflection configuration. The interaction between the bottom current and the rugged seafloor especially develops in areas with complex submarine topography and active bottom current. The seismic reflection characteristics vary with different seawater flow velocities, possibly caused by oceanic sediment resuspension and movement (Chen et al., 2016). Under the constraint of rugged submarine topography, the following scientific questions remain unanswered: what are the reasons for the formation of diverse morphology of high-frequency small vertical offsets, high-frequency fluctuations, or hair-like reflection configurations (Song et al., 2020)? What is the correlation between the scale of submarine topography and the controlling factors such as seawater flow velocity, and is there a critical threshold to control the formation of different reflection configurations? The above questions require validation through additional observational data and numerical simulation and establishing a quantitative relationship model.
The work presented herein discusses the seismic response characteristic and the formation mechanism of hair-like reflection configuration using fluid dynamics numerical simulation and seismic oceanography method as the primary numerical tools. The optimal matching method is performed for fusion calculation to investigate the relationship between numerical simulation results and the field seismic dataset. Simultaneously, the seawater time-variant fluid-dynamical model computed from the fluid dynamics numerical simulation is compared with the seismic oceanography section to analyze the similarity between the two specific areas. If the seawater thermohaline feature, the seismic oceanography section obtained via numerical simulation, and the field seismic reflection section are similar in morphology at a certain time during the numerical simulation process, it is likely that the field seismic reflection section event characteristics in the region are subject to similar conditions to those set by the fluid dynamics numerical simulation. As consequence, it is possible to study the dynamic characteristics of seawater, interpret the feature of seawater reflection layers on the seismic section and the formation of the seawater seismic facies, and discuss the important parameter relations and dynamic information of the submarine sand waves induced hair-like reflection configuration, which lay a foundation for further research on the dynamic process of the hair-like reflection configuration using seismic oceanography method.
2 Materials and methods
Seawater flow near the seafloor is primarily influenced by submarine topography, such as submarine sand waves induced hair-like reflection configuration, but it has been preliminary analyzed and interpreted from a qualitative perspective, without detailed quantitative calculations about the formation mechanism and dynamic process. This study uses oceanic numerical models and seawater-related equations to construct the seismic oceanographic simulation technology, carry out the seismic oceanography mathematical modeling and numerical simulation of the hair-like reflection configuration, and apply the optimal matching method to discuss its fluid dynamic environment and formation mechanism (Figure 1).
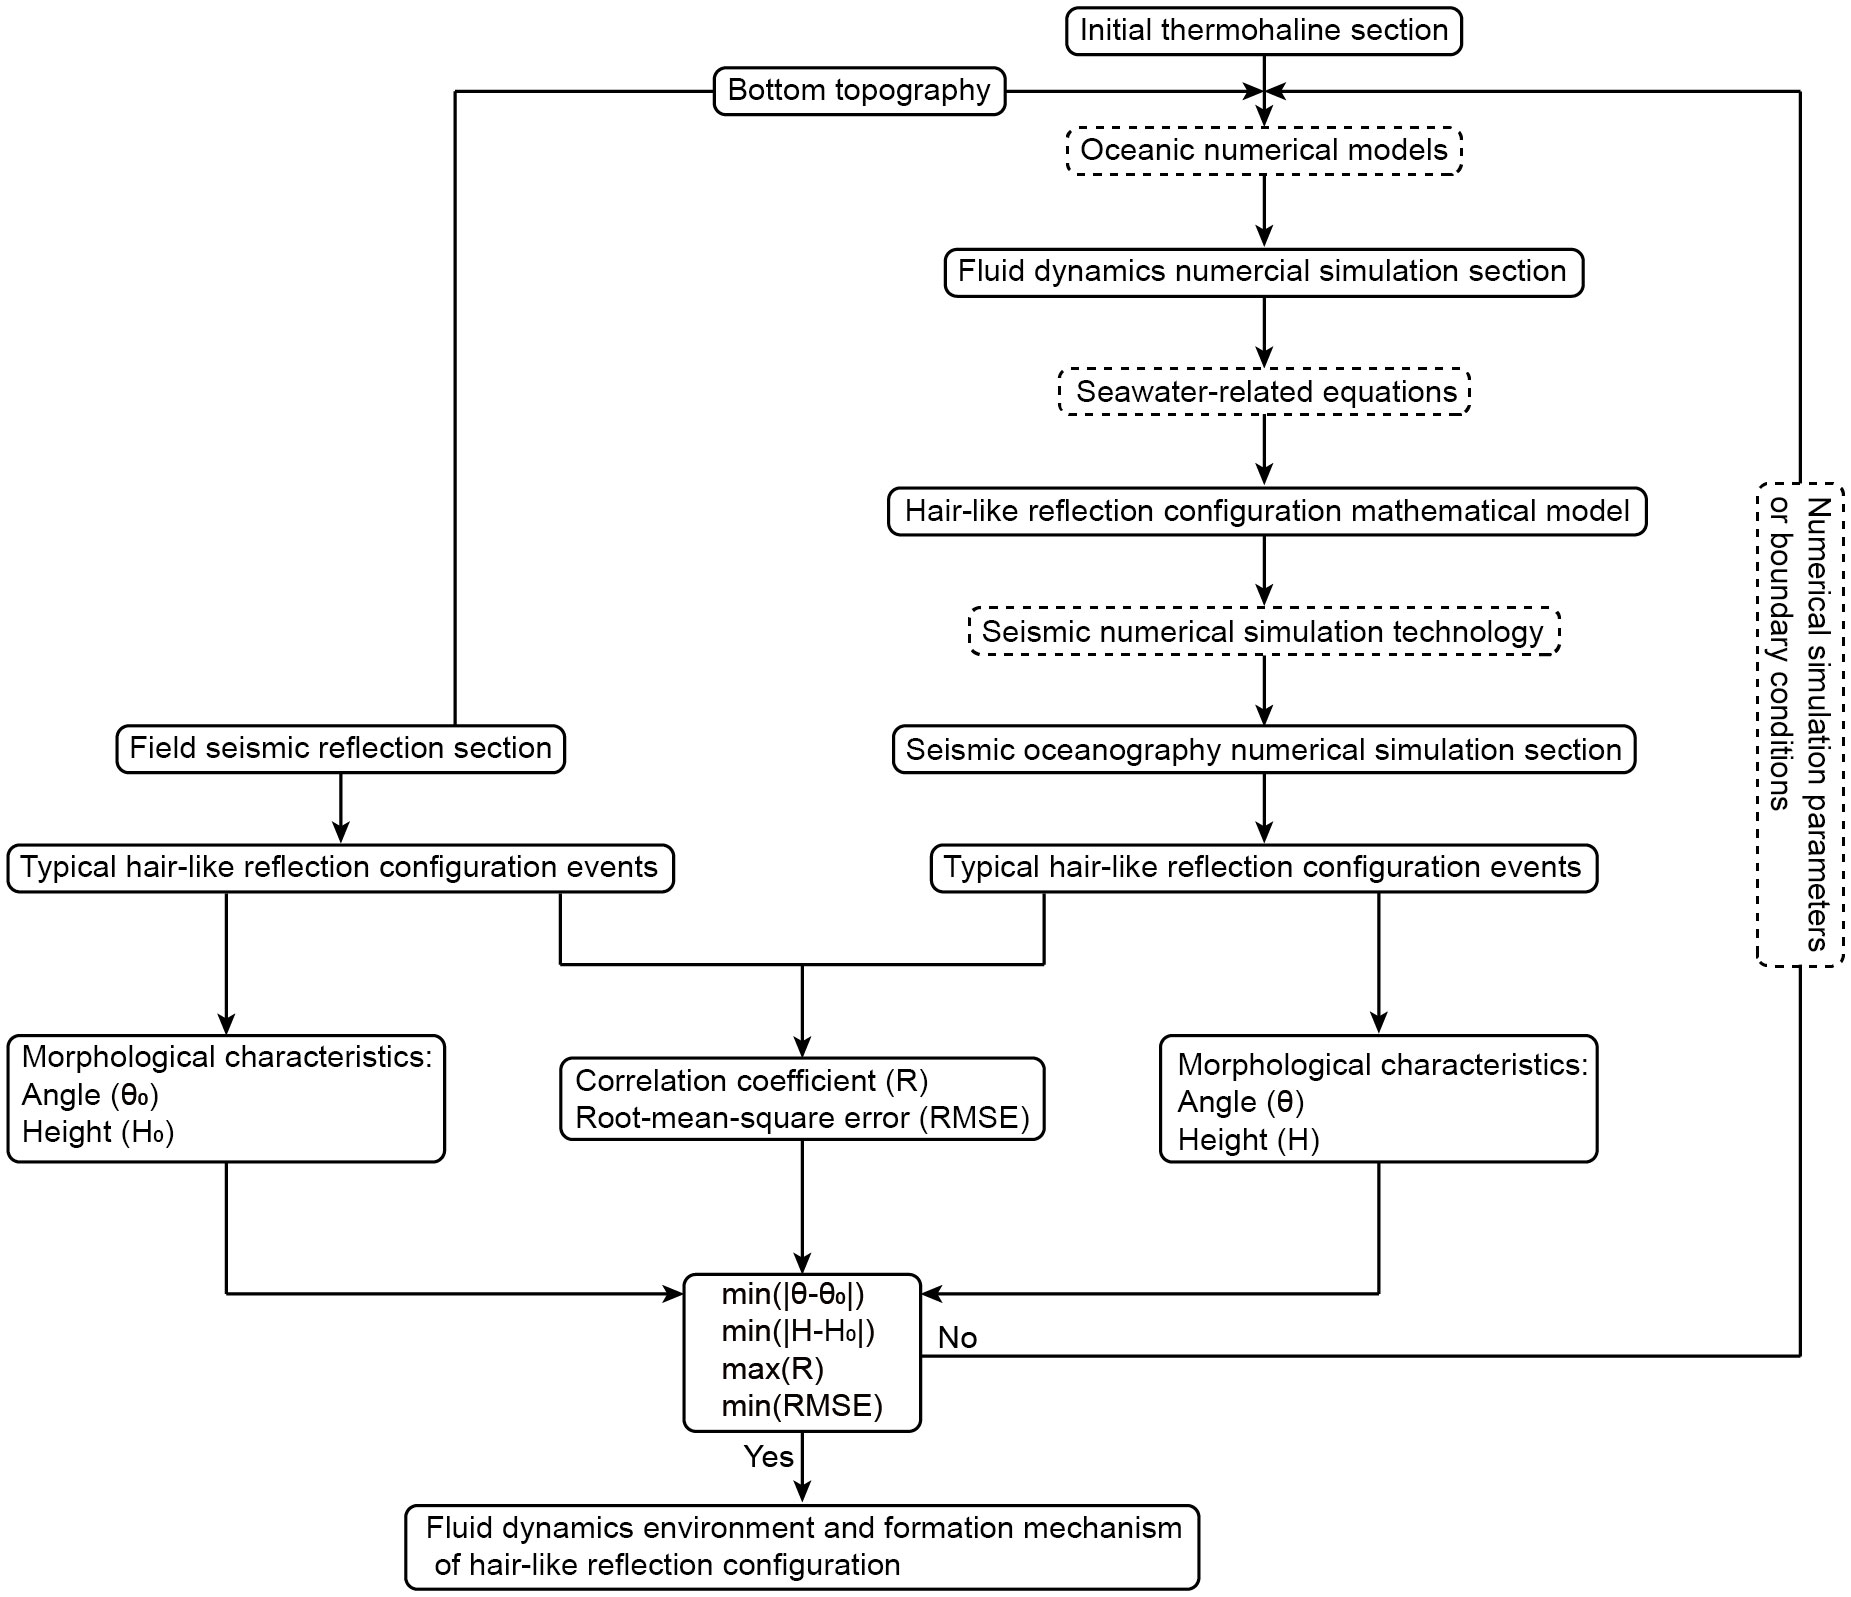
Figure 1 Schematic representation of the workflow followed in this work to link quantitatively hair-like reflection configuration and dynamic parameters.
2.1 Fluid dynamics numerical simulation
We performed numerical experiments with a two-dimensional numerical simulation of the ocean dynamics using the Massachusetts Institute of Technology general circulation model (MITgcm; Marshall et al., 1997a; Marshall et al., 1997b; Legg and Adcroft, 2003; Legg and Klymak, 2008; Klymak and Legg, 2010; Klymak et al., 2010a; Klymak et al., 2010b) to investigate the formation and dynamic process of submarine sand waves induced hair-like reflection configuration. This model solves the fully nonlinear, non-hydrostatic Navier-Stokes equations under the Boussinesq approximation for an incompressible fluid with a spatial finite-volume discretization on a curvilinear computation grid.
2.1.1 Model configuration
The study uses a two-dimensional submarine topography, with a stretched horizontal coordinate system (Klymak and Legg, 2010; Klymak et al., 2010b) of variable resolution in the horizontal direction, and a uniform vertical resolution (Δz = 2m ) of 382 points. The horizontal domain was 23.5km over 1600 grid cells. The inner 850 grid cells have a horizontal width (Δx) of 10m to investigate submarine sand waves induced hair-like reflection configuration in detail, and then the grid was telescoped linearly so that for the outer cells Δx = 30m to produce a sponge layer on each side of the domain for preventing waves from being reflected back into the interior. The simulation was run in non-hydrostatic mode as the condition for hydrostatic approximation with horizontal length scales much larger than vertical scales is violated both in model setup and observed flow response. The boundaries were forced with a constant inflow/outflow condition of Uo (Uo = 0.70, 0.75, 0.80, 0.85, 0.90, 0.95ms-1). A no-slip bottom boundary condition is used. The Coriolis frequency of f = 5×10⁻⁵s-1 is used. Horizontal and vertical Laplacian eddy viscosity and diffusivity are set to Ah = kh = 2×10⁻²m2s-1 and Av = kv = 2×10⁻³m-2s-1, respectively. All simulations are initialized from the state of rest and run for ~10 hours to a statistically steady state (Figure 2).
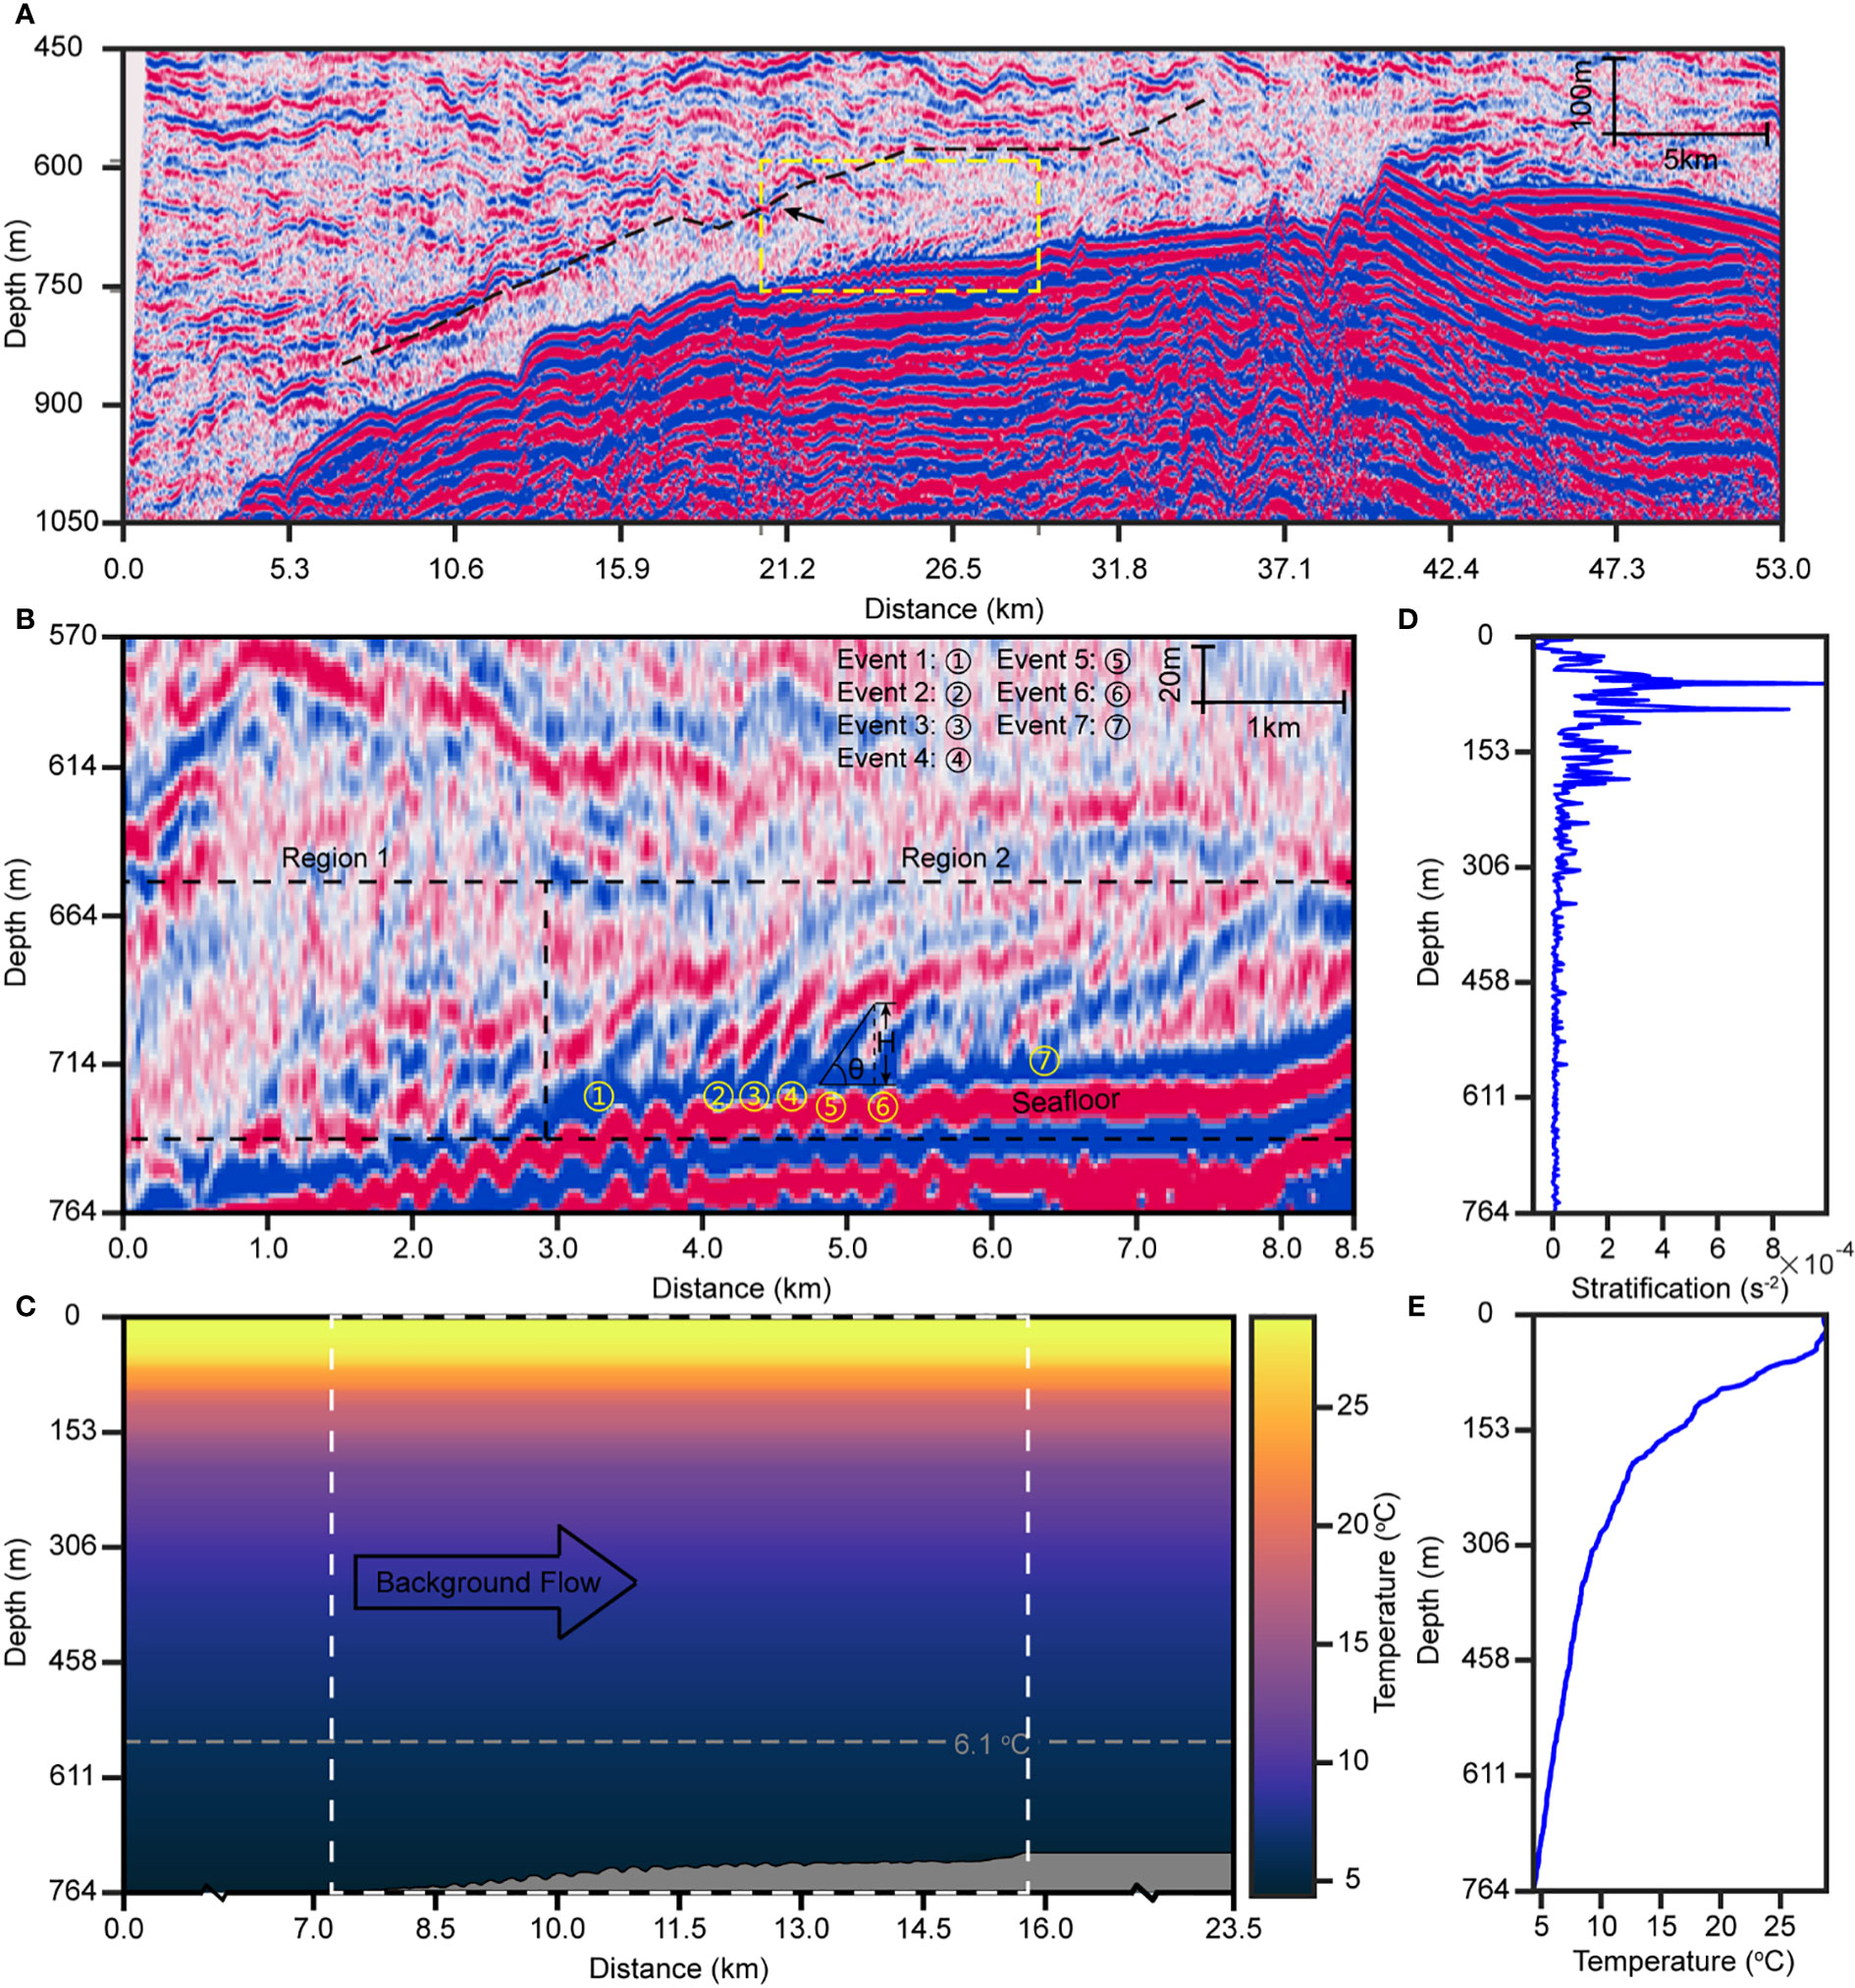
Figure 2 (A) The sheet drape seismic facies unit develops between the seafloor and the black dashed line, which indicates the turbulent bottom boundary layer. Black arrow indicates that there is an internal solitary wave. (B) Zoom-in of the yellow dashed rectangle in Figure (A). Submarine sand waves develop on the seafloor and hair-like reflection configuration grows above them. Region 1: Submarine turbulent region; Region 2: The region of quantitative hair-like reflection configuration; Events 1-7: The selection of hair-like reflection configuration seismic events. (C) Schematic of fluid dynamics numerical simulation configuration. The depth-independent background flow interacts with the realistic bottom topography from (B) in initial stratification expressed in temperature. White dashed box indicates a region used for investigating the dynamics of submarine sand waves induced hair-like configuration. (D) The vertical profile of stratification observed in the Northern South China Sea, which were obtained from the National Centers for Environment Information (NCEI). (E) The vertical profile of initial temperature observed in the Northern South China Sea, which were obtained from the National Centers for Environment Information (NCEI).
2.1.2 Bottom topography and stratification
Hair-like reflection configurations, associated with submarine sand waves, were observed on a seismic oceanography section with high spatial resolution, which was acquired from the multi-channel seismic reflection survey within a region of the northern South China Sea (Figure 2A). The northern South China Sea is part of the natural extension of the South China Sea Block to the sea. The water depth of the continental slope is generally 200-3400m, forming a gentle upper continental slope, a steep mid-continental slope, and a gentle lower continental slope (Zhang and Luan, 2012). The Dongsha Uplift is located southeast of the Pearl River estuary, the most prominent submarine topography on the continental shelf/slope of the northern South China Sea. The water depth is 0-1000m deep, mainly composed of two submarine plateaus, one is circular and the other is diamond-shaped (Chen et al., 2016). There is extensive seafloor erosion in the Dongsha Uplift, which is mainly influenced by currents of a branch of Kuroshio Current from the Luzon strait, tides, and the Pearl River, such as seafloor erosion trenches and submarine sand waves. The large amplitude internal solitary waves that appear in the form of wave packet or wave train and primarily originate from the middle Luzon Strait is able to strong tide-topography interactions (Guo and Chen, 2014; Alford et al., 2015; Huang et al., 2016). The internal solitary waves are generated diurnally during an ~8 days period centered on the new and full moon in the northern South China Sea. There is approximately one internal solitary wave per day yearly during the tidal period and up to twice a day in the summer (Reeder et al., 2011; Huang et al., 2014). Here, as interval solitary waves propagate in the WNW direction from the Luzon Strait, they steepen dramatically and exhibit periodic or quasi-periodic features of internal solitary wave packets across the basin (Alford et al., 2015). The internal solitary waves are well developed around the Dongsha Uplift of the northern South China Sea. The propagation velocity of internal solitary waves in the vicinity of the Dongsha Uplift calculated by MODIS, ACDP, X-band radar, and multi-channel seismic reflection data is usually 0.55-3.0m/s, and the maximum wave height can exceed 100m (Lv et al., 2010; Fu et al., 2012; Zhao et al., 2012). Observations and analyses of oceanic sediment suspension events under various environmental conditions reveal that oceanic sediment suspension requires bottom current velocities from ~0.10m/s up to ~0.80m/s (Xu et al., 2008; Reeder et al., 2011; Tian et al., 2021) to form submarine sand waves.
The oceanic bottom boundary layer shows vertical water column features. The sheet drape seismic facies unit develops between the seafloor and the black dashed line, which indicates the turbulent bottom boundary layer. Seismic reflection presents weak amplitude, chaotic reflection characteristic on the left of the yellow dotted rectangle, and weak amplitude, turbid reflection characteristic in the middle and to the right part (Chen et al., 2016). This near-seafloor water column shows weak seismic reflections and reduced apparent frequency. Sand waves ca. 200m in wavelength develop in the zone of ca. 5km long along the seafloor, and hair-like reflection configuration grows above them, which is the research area of fluid dynamics numerical simulation in this study (Figure 2A). The model utilizes realistic bottom topography merged from Figure 2B to investigate the formation and dynamic process of submarine sand waves induced hair-like reflection configuration.
The initial stratification is horizontally uniform in the fluid dynamics numerical simulation, where the model is initialized with realistic conductivity-temperature-depth (CTD) profiles (Figures 2D, E). The seawater physical property related to seismic reflection includes density and acoustic velocity, mainly determined by seawater temperature and depth. Based on the seawater state equation, the seawater acoustic velocity and density are primarily controlled by temperature, salinity, and seawater pressure at different depths. Compared to salinity, the density is primarily (but not completely) associated with seawater temperature variations (Ruddick et al., 2009). The study merely discusses the changes in seawater density and acoustic velocity caused by temperature and depth and sets the seawater salinity as a constant value of 35psu.
2.2 Seismic oceanography mathematical model and numerical simulation
The field seismic reflection section is significantly different from fluid dynamics numerical simulation results in the physical meaning, reflection the seawater wave impedance contrasts and the distribution of thermohaline, respectively. As a consequence, a mutual conversion method is required between the two as the objective of this work intends to convert fluid dynamics numerical simulation results into seismic oceanography numerical simulation sections. The seismic response characteristic of submarine sand waves induced hair-like reflection configuration is computed numerically by solving the two-dimensional acoustic wave equation with the finite-difference method (Madariaga, 1976; Frankel and Clayton, 1984; Frankel and Clayton, 1986). This numerical wave simulator models the high-order wave phenomena associated with complex velocity and density structures (Kelly et al., 1976; Swift et al., 1990). Reverse-time migration has been applied to synthetic seismic shot records of the submarine sand waves induced hair-like reflection configuration model to obtain seismic oceanography numerical simulation sections reflecting the characteristic of the water column and similar to the field seismic reflection section (Baysal et al., 1983; Chattopadhyday and McMechan, 2008; Deng and McMechan, 2008).
Based on fluid dynamics numerical simulation results, a mathematical model (acoustic velocity and density) that can be used for seismic oceanography numerical simulation is established using the seawater state equation and the acoustic velocity empirical equation (Figures 3A, B). The mathematical model is a critical data foundation for computing synthetic seismic reflection data (Kormann et al., 2010), which mimics real seismic oceanography data to analyze the seismic response characteristics of hair-like reflection configuration. Subsequently, the fluid dynamics numerical simulation parameters are adjusted appropriately according to the field seismic reflection section, and the seismic response characteristics under different numerical simulation conditions are analyzed. To simulate the source wavelet we have chosen a Ricker wavelet with a dominant frequency of 45Hz, which is close to the central frequency of the real data acquired. The space and time discretization are 2m and 0.4ms, respectively. An 8.5km-long section reaching up to 764m-depth section has been simulated (Figure 3C). The length of each shot-record simulation is 1.2s, enough to cover the model completely. The seismic line includes 340 shot records, that is, one shot every 25m.
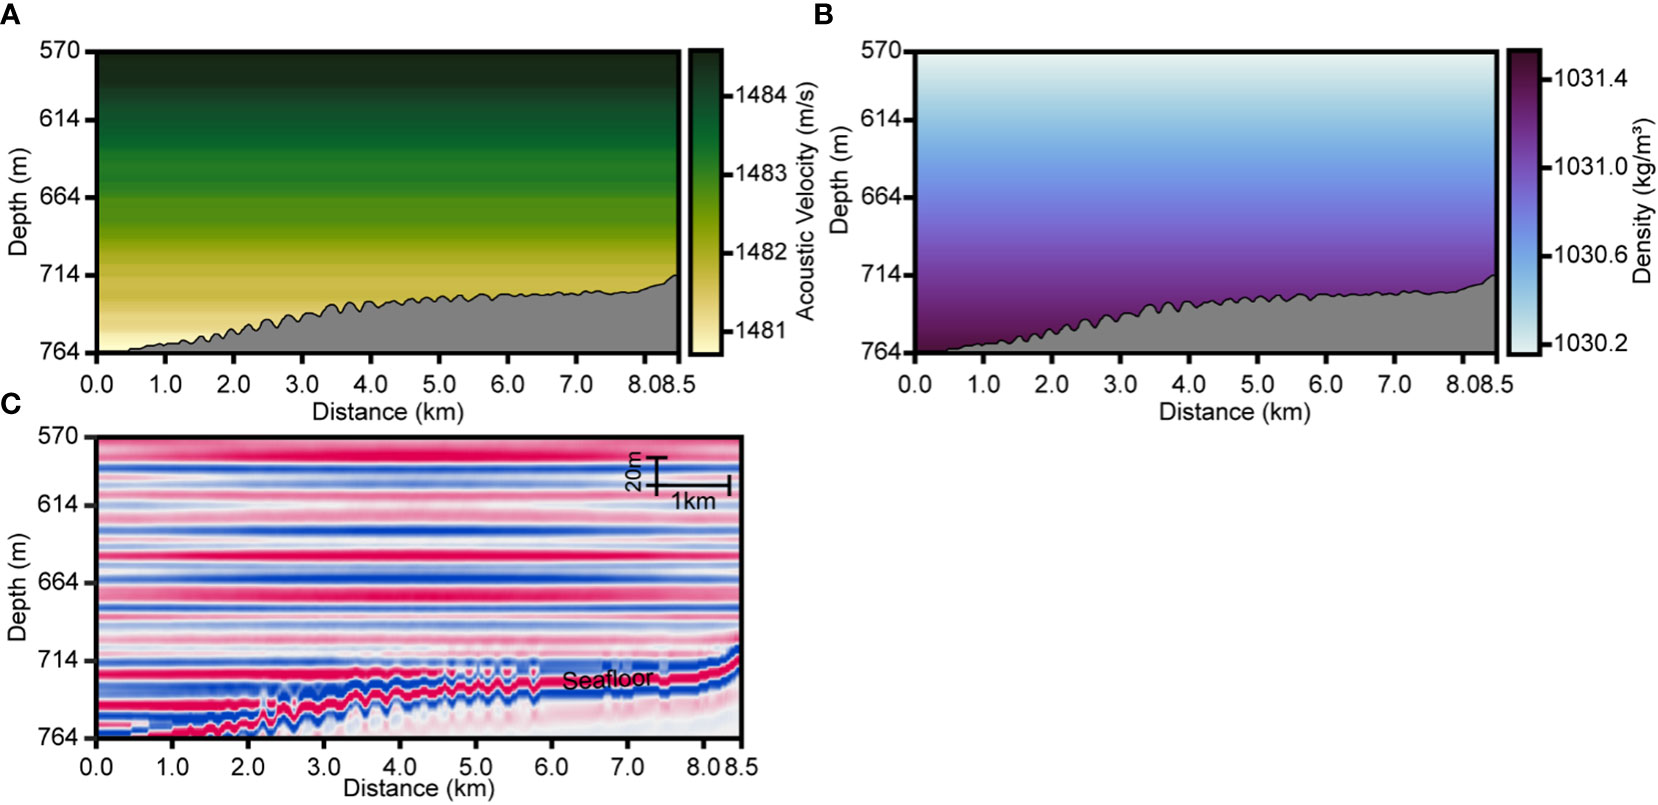
Figure 3 Seismic oceanography mathematical model at initial moment, (A) seawater acoustic velocity model, and (B) seawater density model. (C) Seismic oceanography numerical simulation section with the dominant frequency of 45Hz.
2.3 Fusion computation and optimal matching
The seismic oceanography numerical simulation section and the field seismic reflection section are performed for fusion computation, and the key dynamic parameters of hair-like reflection configuration and the important dynamic information reflected by the seismic dataset are fitted and analyzed by the optimal matching method. The study investigates the relationship between the seismic oceanography numerical simulation section and the field seismic reflection section and analyzes the similarity between the two in a specific area. If the morphological characteristics of typical events on the seismic section are similar, it means that the ocean fluid dynamics environment in this area is consistent with the conditions set by the fluid dynamics numerical simulation, so as to deduce the seawater movement.
Based on the morphological characteristics of the hair-like reflection configuration, it is proposed to apply parameters such as the angle with the seafloor (θ) and the height from the seafloor (H) (Figure 2B) to describe it quantitatively. Two evaluation indexes, root-mean-square error (RMSE) and correlation coefficient (R), are used to quantify the similarity between the seismic oceanography numerical simulation with different fluid dynamics numerical simulation conditions and the field seismic reflection section, in order to obtain the optimization results of the dynamic parameters of hair-like reflection configuration. Under different fluid dynamics numerical simulation conditions, we plotted the angle and height of the hair-like reflection configuration seismic events (Events 1-7) and flow conditions in a two-dimensional domain where the horizontal axis is the flow conditions, and the left vertical one is the angle, and the right vertical one is the height. In the two-dimensional domain, we plotted the height and angle of the hair-like reflection configuration seismic events (Events 1-7) obtained under different fluid dynamics numerical simulation conditions into graphs, and took the height and angle of the hair-like reflection configuration on the field seismic reflection section as the baseline. Then the optimal matching method is carried out according to the distance between the two. Based on the matching principle, the smaller the distance between the two, which illustrates that the higher the similarity. Therefore, the seismic oceanography numerical simulation section is closer to the field seismic reflection section. We developed the optimal quantitative relationship between the field seismic reflection section and the seismic oceanography numerical simulation section using the optimal matching method from these two-dimensional domains, and then the dynamic parameters and fluid dynamics environment of the hair-like reflection configuration on the field seismic reflection section are deduced from the fluid dynamics numerical simulation. Suppose the difference of angle and height between the seismic oceanography numerical simulation section and the field seismic reflection section is minimum, the root-mean-square error is minimum, and the correlation coefficient is maximum, which means that the matching between the two is optimal and the similarity is the highest (Figure 1). To improve the accuracy, the morphological characteristics of the submarine sand waves induced hair-like reflection configuration is the average value of the multiple calculation results.
3 Results
3.1 Seismic oceanography numerical simulation section of hair-like reflection configuration
The morphological characteristics of the hair-like reflection configuration can be identified on the synthetic seismic oceanography section resulting from numerical simulation (Figure 4). The thickness of the area affected by the interaction between seawater movement and submarine topography can reach a height of 120m, which is consistent with the characteristics of the field seismic reflection section (Figure 2B). Region 1 (0-3km) is a submarine turbulent region with relatively chaotic internal reflections, and the seismic reflection characteristics vary with different seawater flow velocities. The polarity of the seismic reflection event matches well with the field seismic reflection section, and the turbulent region (Region 1 in Figure 4) gradually decreases with the increase of seawater flow velocity. Moreover, when the boundary force with a constant flow condition of U0 is less than 0.70m/s or greater than 0.90m/s, the submarine turbulent characteristics in Region 1 are not obvious. The hair-like reflection configuration generally develops above submarine sand waves in Region 2, with low continuity of seismic events and at an angle with the seafloor. The vertical thickness is about 30m, and the polarity variation is consistent with the field seismic reflection section. The characteristics of hair-like reflection configuration in the range of 4.0-5.5km are more distinct and easier to distinguish than those in other areas.
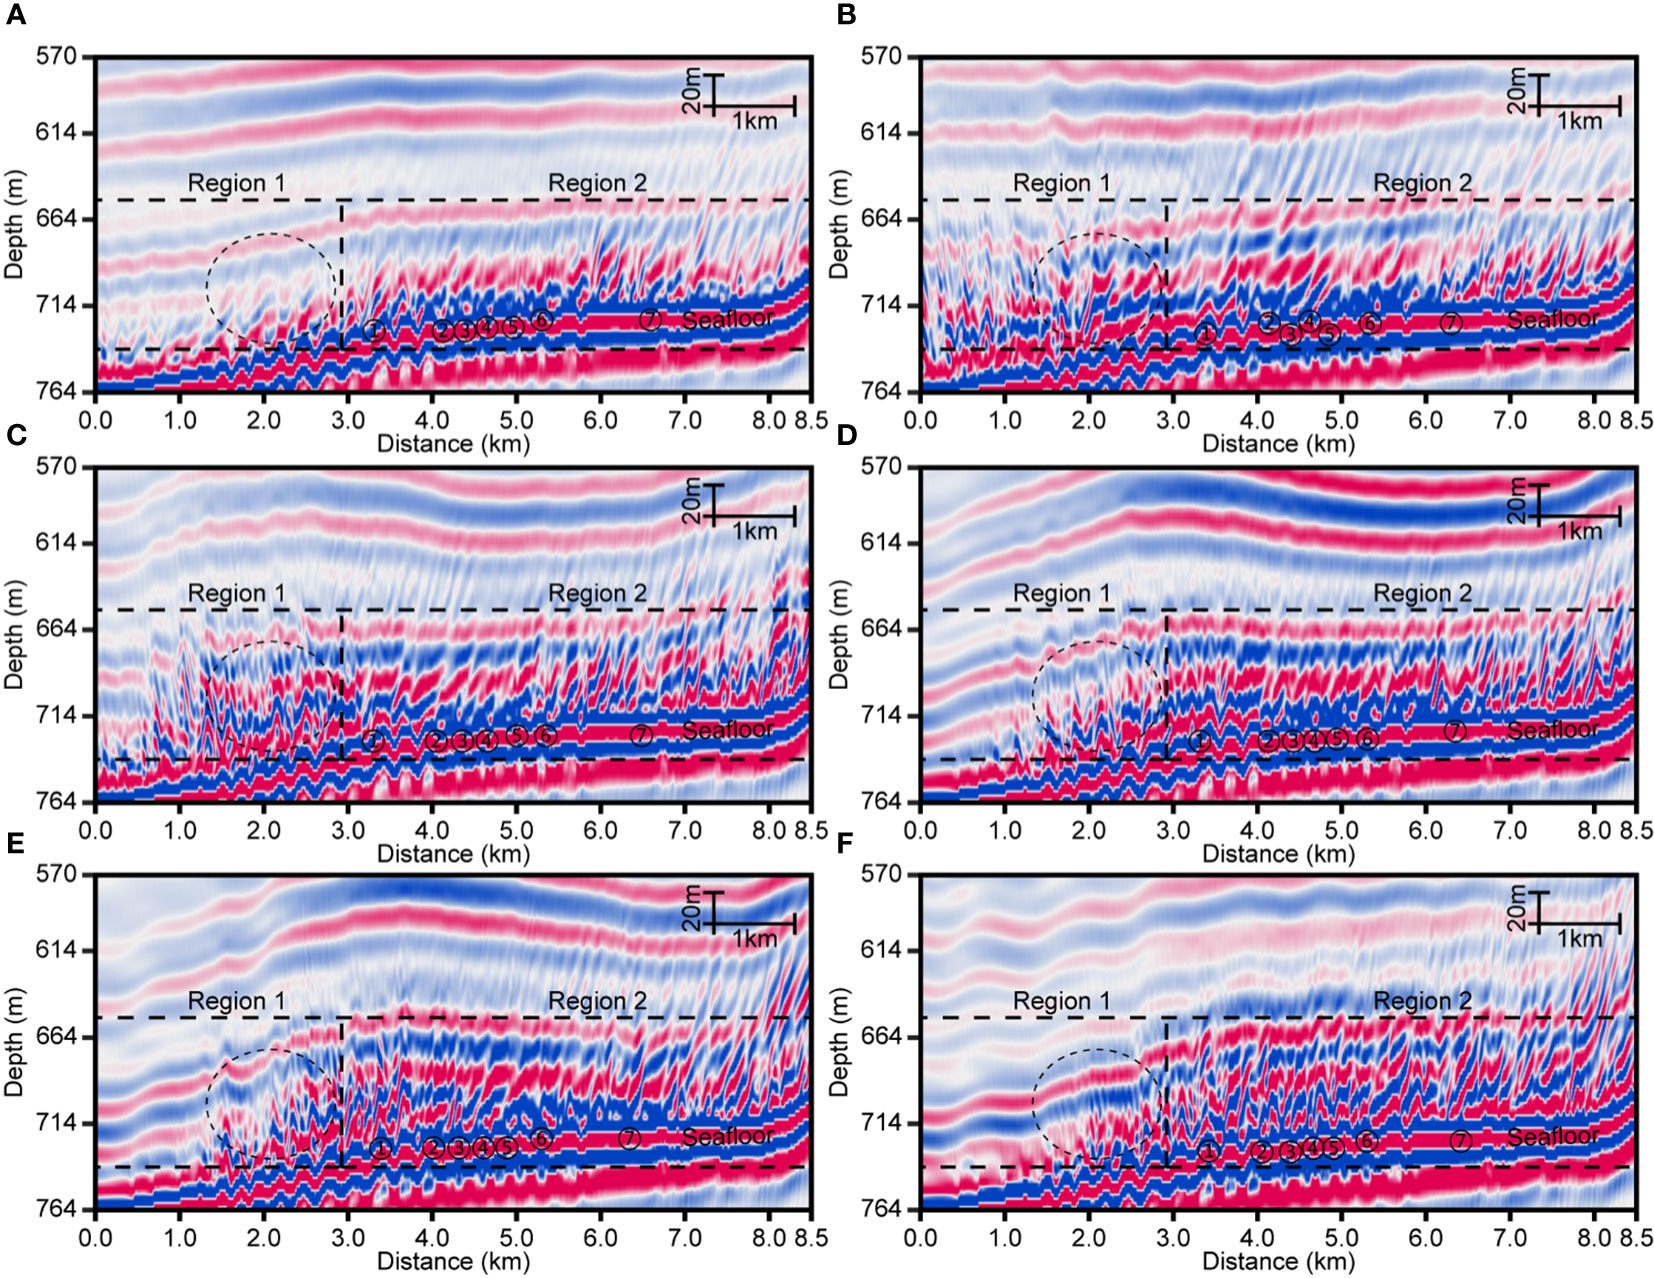
Figure 4 Seismic oceanography numerical simulation section of hair-like reflection configuration with the flow conditions of (A) 0.70m/s, (B) 0.75m/s, (C) 0.80m/s, (D) 0.85m/s, (E) 0.90m/s and (F) 0.95m/s. Region 1: Submarine turbulent region; Region 2: The region of quantitative hair-like reflection configuration; ①-⑦: The selection of hair-like reflection configuration seismic events with the same meaning as that in Figure 2B.
Submarine topography plays a crucial role in seawater flow near the seafloor. Therefore, it is essential to investigate the impact of deviations in submarine topography on the numerical simulation results. To this end, we smoothed the realistic bottom topography to obtain the submarine sand wave topography whose morphology characteristics are similar and amplitude is approximately half that of the realistic submarine sand wave topography (Figure 5A). The fluid dynamics numerical simulation was carried out with a constant flow condition of 0.80m/s, and other parameters were consistent, with the only variable being the difference in submarine topography. Comparing Figure 4C and Figure 5B, it is found that the differences in the thickness of the area affected by the interaction between seawater movement and submarine topography and the submarine turbulent region of Region 1 (0-3km) are slightly small. However, there are significant differences in hair-like reflection configuration in Region 2, making it difficult to identify their events, especially in Events 4-7.
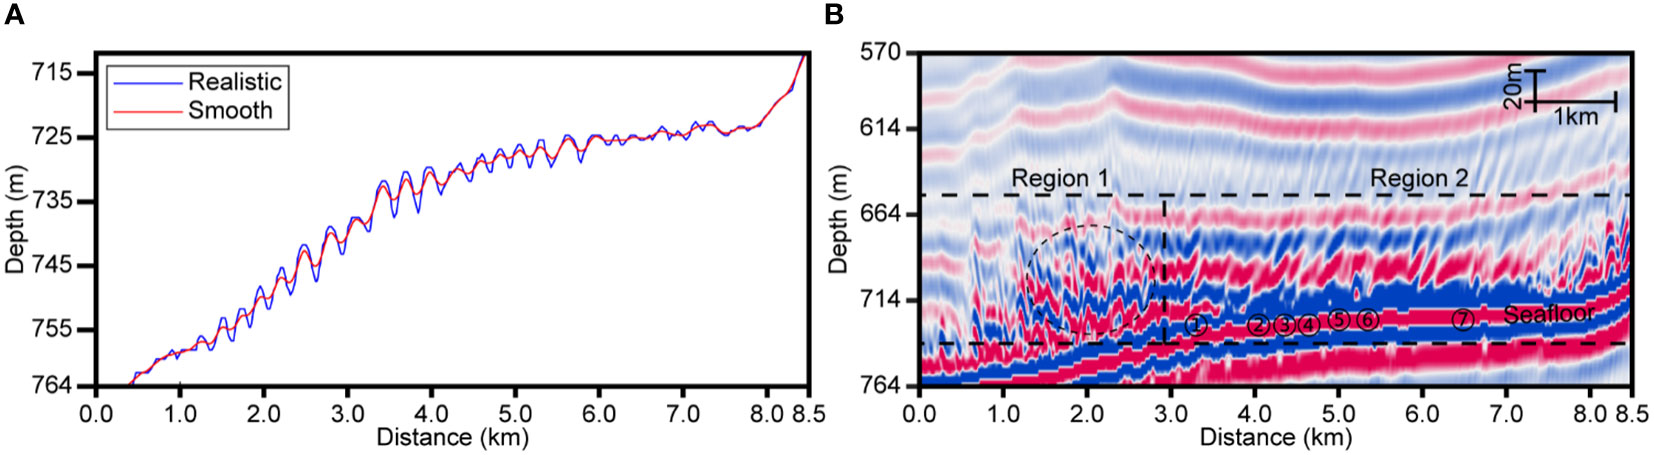
Figure 5 (A) The realistic submarine sand wave topography (blue line) and smooth submarine sand wave topography (red line). (B) Seismic oceanography numerical simulation section of hair-like reflection configuration with the flow conditions of 0.80m/s for smooth submarine sand wave topography.
3.2 Morphological characteristics parameters of hair-like reflection configuration
By comparing the hair-like reflection configuration seismic event on the field seismic reflection section and the seismic oceanography numerical simulation section, it is found that the morphological characteristics between the two have good correspondence (Figure 6). Hair-like reflection configuration seismic events tilt to the right, appearing with an angle with the seafloor and gradually decreasing with the direction of the seawater flow. There is a greater horizontal continuity, with a thickness of 30m, and submarine topography plays a crucial role in the development of hair-like reflection configuration. The difference between the hair-like reflection configuration seismic event on the field seismic reflection section and the seismic oceanography numerical simulation section of Event 1 is larger than that of other events. The angle and height can be used to describe the development scale of the hair-like reflection configuration quantitatively. The analysis shows that the angle of the hair-like reflection configuration on the field seismic reflection section is between 49.31° and 69.22°, and the height is between 9.46m and 31.43m. In comparison, the angle of the hair-like reflection configuration on the seismic oceanography numerical simulation section is 47.26-79.50°, and the height is 13.00-31.73m. The correlation coefficient between the hair-like reflection configuration seismic events (Events 1-7) on the field seismic reflection section and the seismic oceanography numerical simulation section under different fluid dynamics numerical simulation conditions is greater than 0.96, and the root-mean-square error between the two is 0.6391-7.9294.
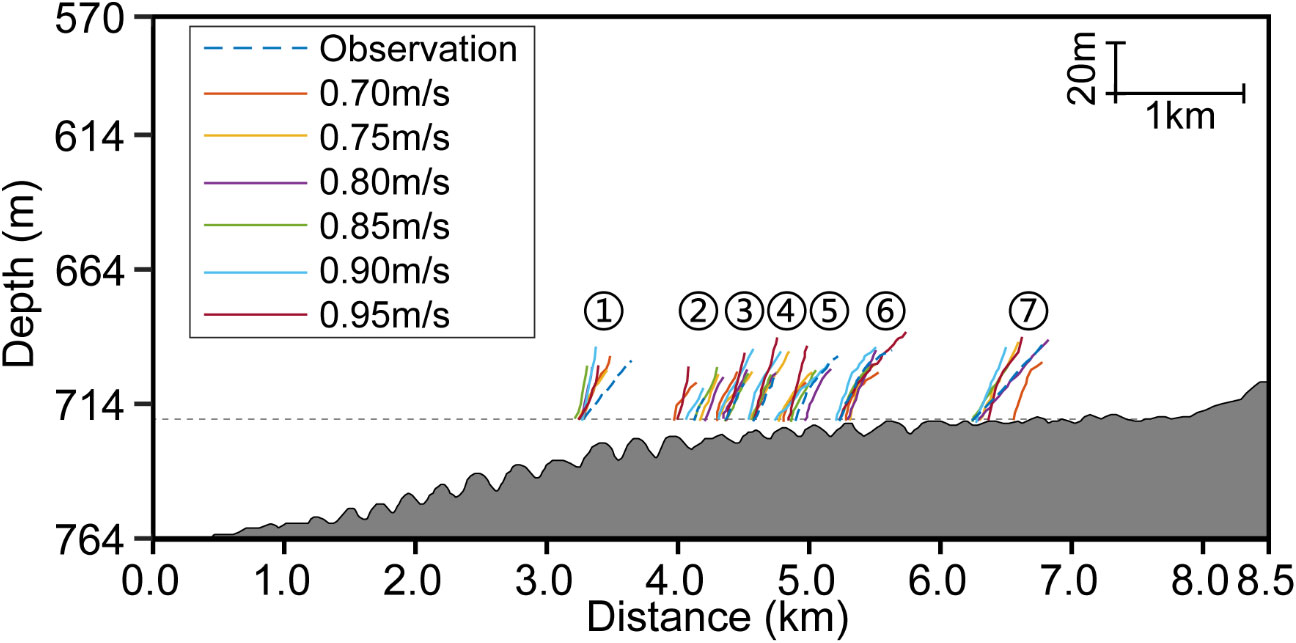
Figure 6 Interpretation diagram of the hair-like reflection configuration seismic events on the field seismic reflection section (Observation) and the seismic oceanography numerical simulation section under different fluid dynamics numerical simulation conditions of 0.70m/s, 0.75m/s, 0.80m/s, 0.85m/s, 0.90m/s and 0.95m/s. ①-⑦: The selection of hair-like reflection configuration seismic events with the same meaning as that in Figure 2B.
4 Discussion
4.1 Model validation
The simulated results are validated by comparing with the field seismic reflection section. The two-dimensional model utilizes realistic bottom topography merged from the field seismic reflection section and nearby hydrological information to investigate the fluid dynamics environment and formation mechanism of submarine sand waves induced hair-like reflection configuration. Although the physical meaning of the fluid dynamics numerical simulation section (seawater thermohaline distribution) differs from that of the field seismic reflection section (seawater wave impedance), it can conduct a comparative analysis simply through conversion due to the same research objectives. The conversion of the fluid dynamics numerical simulation section into the seismic oceanography numerical simulation section is similar to the principle of high-frequency acoustics in oceanography (Reeder et al., 2011). Therefore, the simulated results can be verified on the basis of the field seismic reflection section, and the degree of matching between the two is related to the accuracy of the two-dimensional model. It is found that the seismic oceanography numerical simulation section has similar structural characteristics to the field seismic reflection section (Figure 2B and Figure 4) according to the seismic oceanography mathematical model and numerical simulation, which implies the accuracy of fluid dynamics numerical simulation results.
The simulated background flow currents are validated by comparing with those from the morphological characteristics of seismic events on the field seismic reflection section. As shown in Figure 2B, according to the slope of submarine topography, the tendency of hair-like reflection configurations, and the morphological characteristics of submarine sand waves, it can be determined that the direction of seawater flow on the field seismic reflection section is from left to right. Consequently, the two-dimensional model we constructed with the direction of seawater flow for fluid dynamics numerical simulation is from left to right (Figure 2C), and the seismic oceanography numerical simulation section agrees well with the field seismic reflection section. Cacchione and Drake (1986) demonstrated theoretically that linear internal waves of 5m amplitude propagating over a typical continental slope could generate bottom current velocities of more than 0.5m/s. An internal solitary wave with an amplitude of approximately 30m was identified near the research area of submarine sand waves induced hair-like reflection configuration (black arrow in Figure 2A), so it indicates that the bottom boundary layer has a strong bottom current velocity and the flow conditions used in this study are reasonable. Based on the above results, we believe the simulated results are reasonable and can be used to investigate the fluid dynamics environment and formation mechanism of hair-like reflection configuration.
4.2 Fluid dynamics environment of hair-like reflection configuration
Submarine sand waves induced hair-like reflection configuration develops above the seafloor, where fluid dynamics processes are extremely complicated. There is no matching seismic model of fluid dynamics for interpreting and analyzing seafloor processes, and the seismic reflection characteristics vary with different seawater flow velocities. In our numerical examples of the fluid dynamics, when the boundary force with a constant flow condition of U0 is less than 0.70m/s or greater than 0.90m/s, the submarine turbulent characteristics in Region 1 are not obvious. The reason is that when the boundary force with a constant flow condition of U0 is less than 0.70m/s, the flow field intensity generated by the interaction with the submarine topography is insufficient to cause the turbulence process to occur (Figure 4A). When the boundary force with a constant flow condition of U0 is greater than 0.90m/s, the quasi-steady stratified flow dominates, making the oceanic stratification characteristics obvious (Figures 4E, F).
Under different fluid dynamics numerical simulation conditions, there is diversity in the hair-like reflection configuration seismic event characteristics on the seismic oceanography numerical simulation section, which can reflect the distinct fluid dynamic environment in the region. Through comparative analysis of Figures 7A-G, it is found that under the different fluid dynamics numerical simulation conditions, the hair-like reflection configuration computed from fluid dynamics numerical simulation and seismic oceanography method are significantly different, indicating that the vital dynamic information reflected by the field seismic dataset is sensitive enough to be used to invert the flow field characteristics. And it can be inferred that there is a coincident position between the graph and the baseline, so the seawater flow velocity corresponding to this position is the optimization result of the dynamic parameters of the ocean environment (Figures 7A–G). Under different fluid dynamics numerical simulation conditions used in this study, the minimum height error of each hair-like reflection configuration seismic event is 0.08m, and the minimum angle error is 0.23°, which is in good agreement with a constant flow condition of U0 is 0.80m/s. It is reasonable to use the flow condition of 0.70-0.95m/s for fluid dynamics numerical simulation from the relationship between the graph and the baseline in Figures 7A–G. It is found that when the boundary force with a constant flow condition of U0 is 0.80m/s, the angle and height of the hair-like reflection configuration on the field seismic reflection section match well with the seismic oceanography numerical simulation section, which demonstrates that the development scale of the hair-like reflection configuration obtained by numerical simulation under this flow condition is similar to that on the filed seismic reflection section. Simultaneously, comparing the weighted average of root-mean-square error between the hair-like reflection configuration computed under different fluid dynamics numerical simulation conditions and that on the field seismic reflection section, it is found that when the boundary force with a constant flow condition of U0 is 0.80m/s, the weighted average of root-mean-square error is the smallest, indicating that the fitting between the two is optimal (Figure 7H). Consequently, it can be inferred that the seawater flow velocity here is about 0.80m/s. Simultaneously, interval solitary waves are well developed in the Dongsha Uplift of the northern South China Sea and the hydrodynamics conditions are sufficient, resulting in strong bottom current velocities in this area. One more piece of evidence for our numerical simulation results is that interval solitary waves induced the bottom current velocity reached 0.596-0.793m/s (Jia et al., 2019), even exceeding 1.0m/s (Lien et al., 2014) and reached a maximum of 2.0m/s (Geng et al., 2017). It is found that submarine sand waves primarily develop in the hydrodynamics environment with a bottom current velocity of 0.2-1.0m/s, and the best development is under the condition of a bottom current velocity of 0.4-0.8m/s (Zhuang et al., 2004). When the bottom current velocity exceeds the critical incipient velocity, the submarine sandy sediments begin to move and form small sand ripples, which gradually increase to form submarine sand waves. The calculation and analysis of the formation mechanism and mathematical model of submarine sand waves show that the incipient velocity of medium sand forming submarine sand waves is 0.507m/s. Therefore, the bottom current velocity in this area is sufficient to shape the seabed topography by forming submarine sand waves (Reeder et al., 2011; Belde et al., 2015; Ribó et al., 2016). Consequently, based on previous studies of the hydrodynamic environment around the Dongsha Uplift of the northern South China Sea and the development of submarine sand waves, it is reasonable to estimate the seawater flow velocity of 0.80m/s by fluid dynamics numerical simulation and seismic oceanography method. Inversely, the difference between the hair-like reflection configuration seismic event on the field seismic reflection section and the seismic oceanography numerical simulation section of Event 1 is larger than that of other events. It is inferred that Event 1 is located at the boundary of the submarine turbulent region and is greatly affected by turbulence. Additionally, the slope of the submarine topography at Event 1 is larger than that of others, resulting in a more obvious interaction between seawater movement and submarine topography, which is another reason for poor stability and drastic changes in the morphological characteristics of the seismic event.
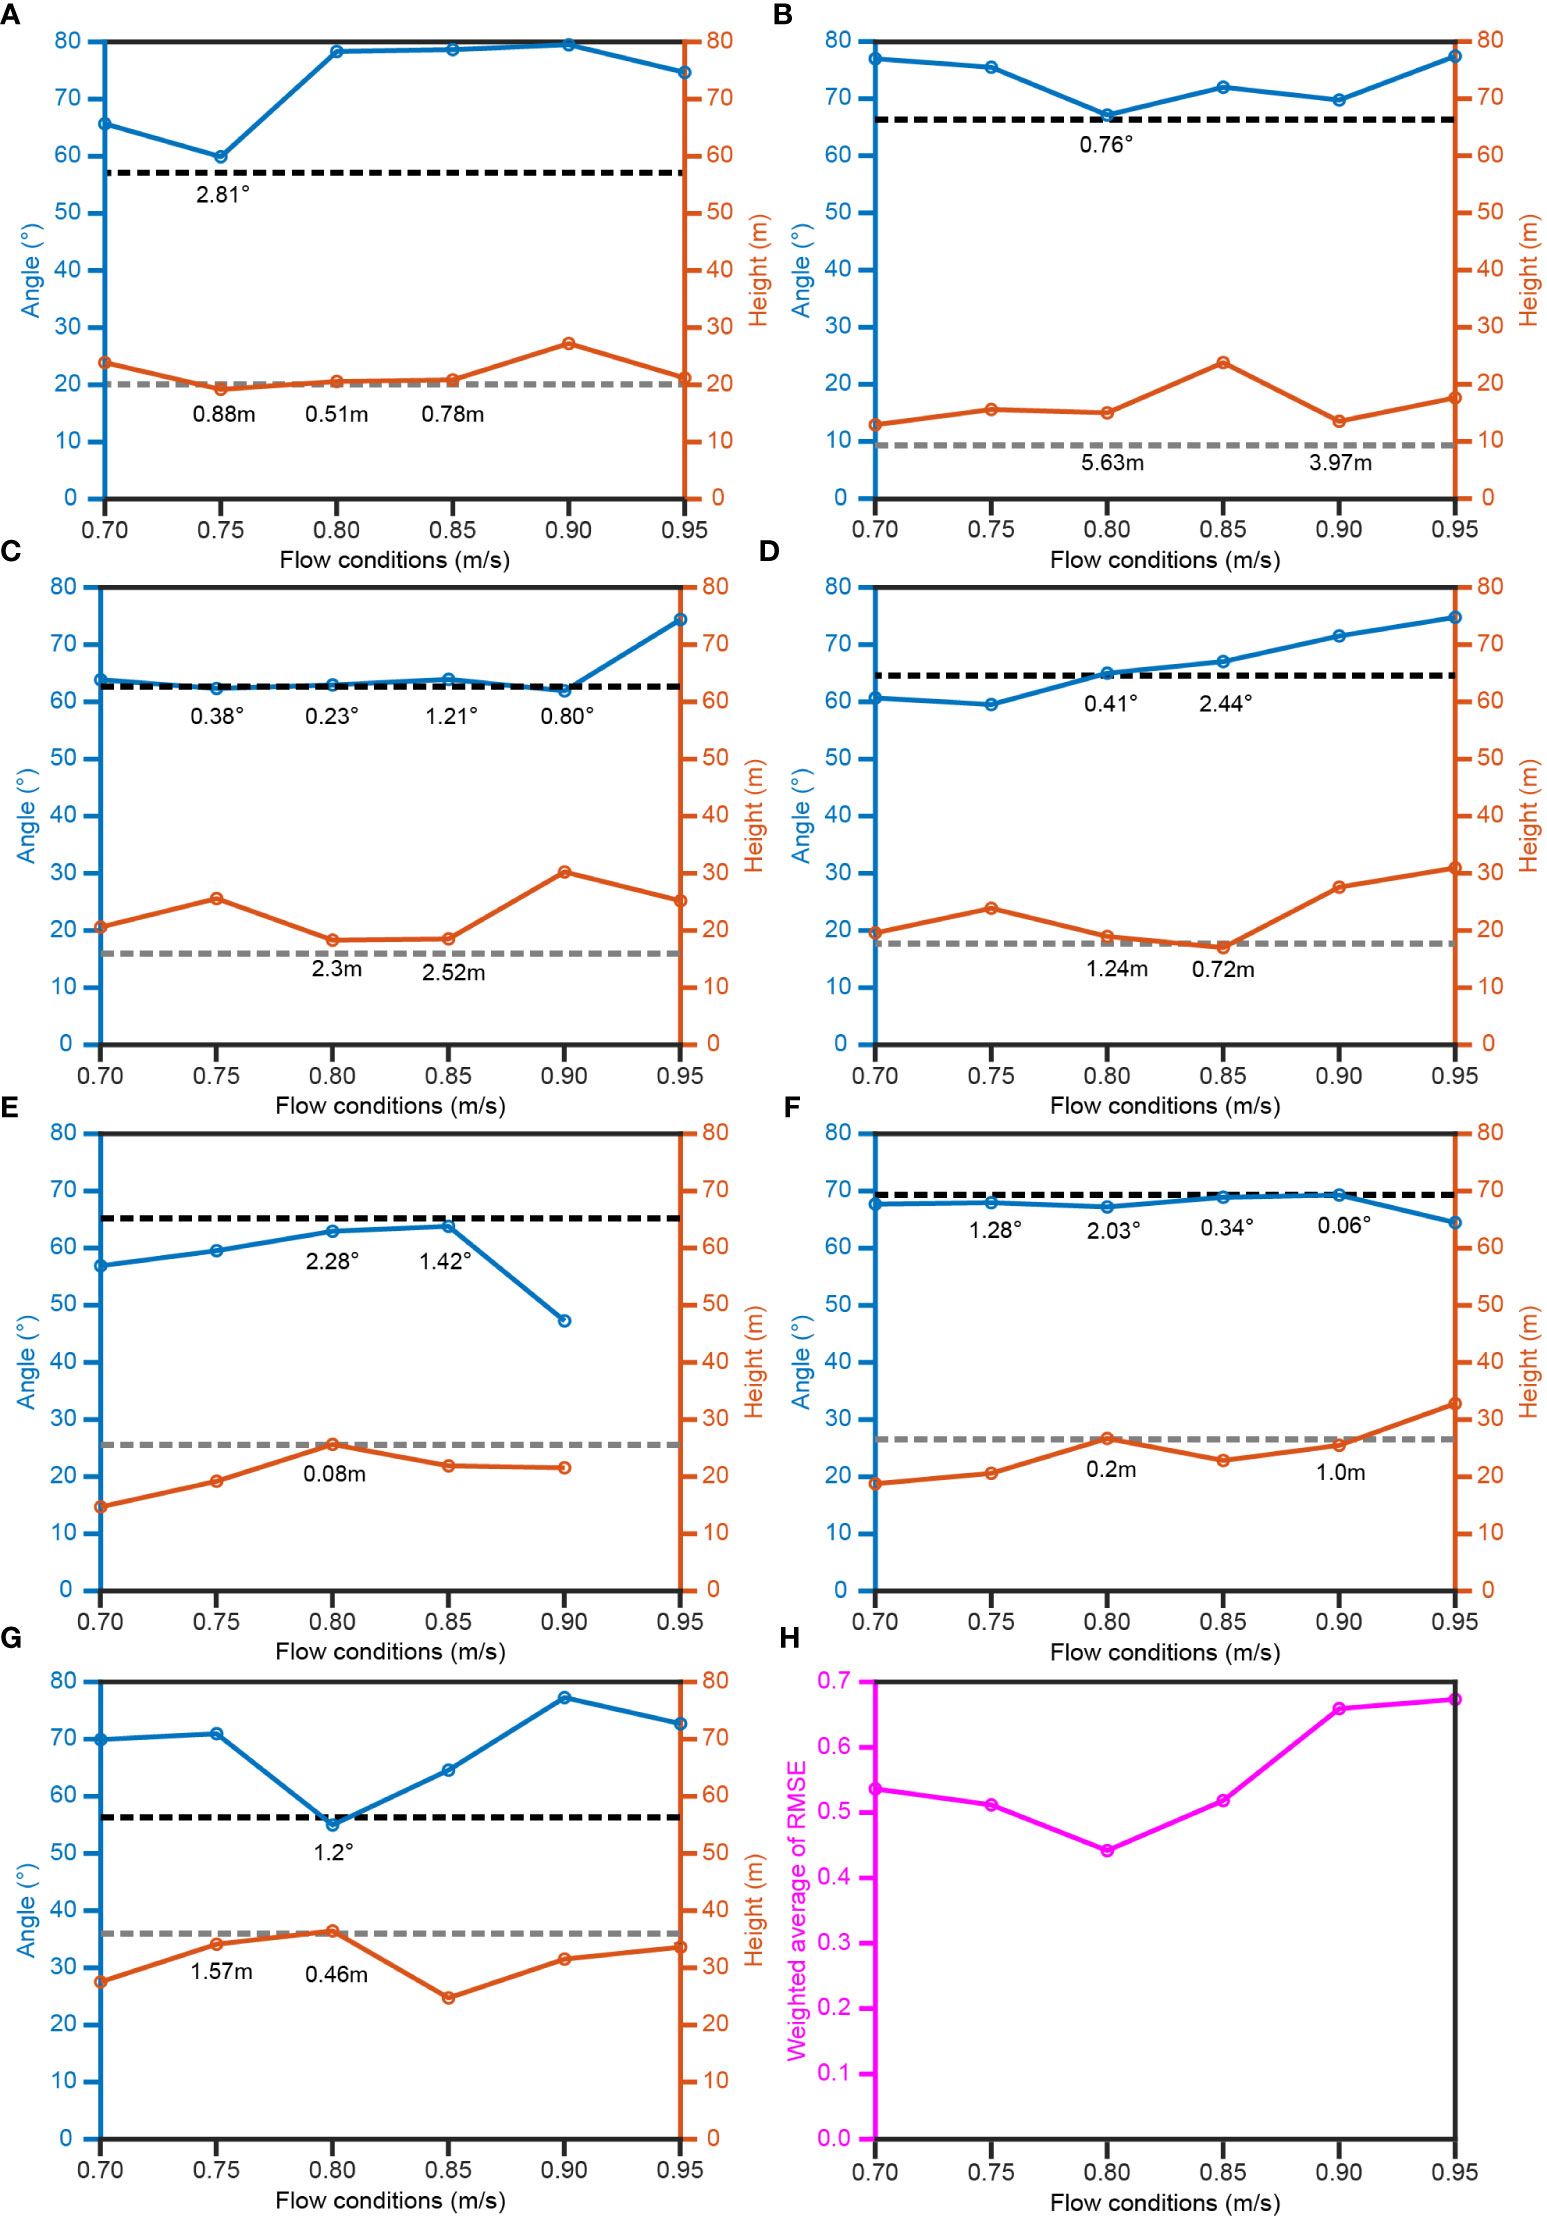
Figure 7 The angle and height of the typical seismic event of (A) Event 1, (B) Event 2, (C) Event 3, (D) Event 4, (E) Event 5, (F) Event 6, (G) Event 7 on the field seismic reflection section and the seismic oceanography numerical simulation section under different fluid dynamics numerical simulation conditions of 0.70m/s, 0.75m/s, 0.80m/s, 0.85m/s, 0.90m/s and 0.95m/s. (H) Relationship between seismic events on the field seismic reflection section and the seismic oceanography numerical simulation section under different fluid dynamics numerical simulation conditions. The black dashed line indicates the angle of the seismic event on the field seismic reflection section, and the gray dashed line indicates the height of the seismic event on the field seismic reflection section. The text inside the figure represents the absolute value of the error between the field seismic reflection section and the seismic oceanography numerical simulation section under different fluid dynamics numerical simulation conditions. When the boundary force with a constant condition of U0 is 0.95m/s, the continuity of Event 5 is low, so the height and angle at 0.95m/s are not plotted in (E).
The fluid dynamics numerical simulation can provide abundant information on the kinematics of seawater layers and obtain the comprehensive fluid dynamics environment characteristics of submarine sand waves induced hair-like reflection configuration, that is, the flow field section, which can accurately describe its dynamic evolution process. When the boundary force with a constant flow condition of U0 is 0.80m/s, the flow field characteristics distribution of the oceanic bottom boundary layer is shown in Figure 8. The horizontal velocity presents a wavy variation similar to that of submarine sand waves (Figure 8A). Due to the non-hydrostatic effect and the friction between seawater movement and submarine topography, the vertical velocity appears in the seawater layer, with the upwelling and downwelling alternating (Figure 8B), which affects the characteristics of ocean stratification. Additionally, the vertical velocity within the range of 0-3.5km and 5.0-8.5km can affect the larger area above the seafloor. It is speculated that it is related to the slope of the submarine topography, which in turn causes the horizontal velocity to change at the same location.
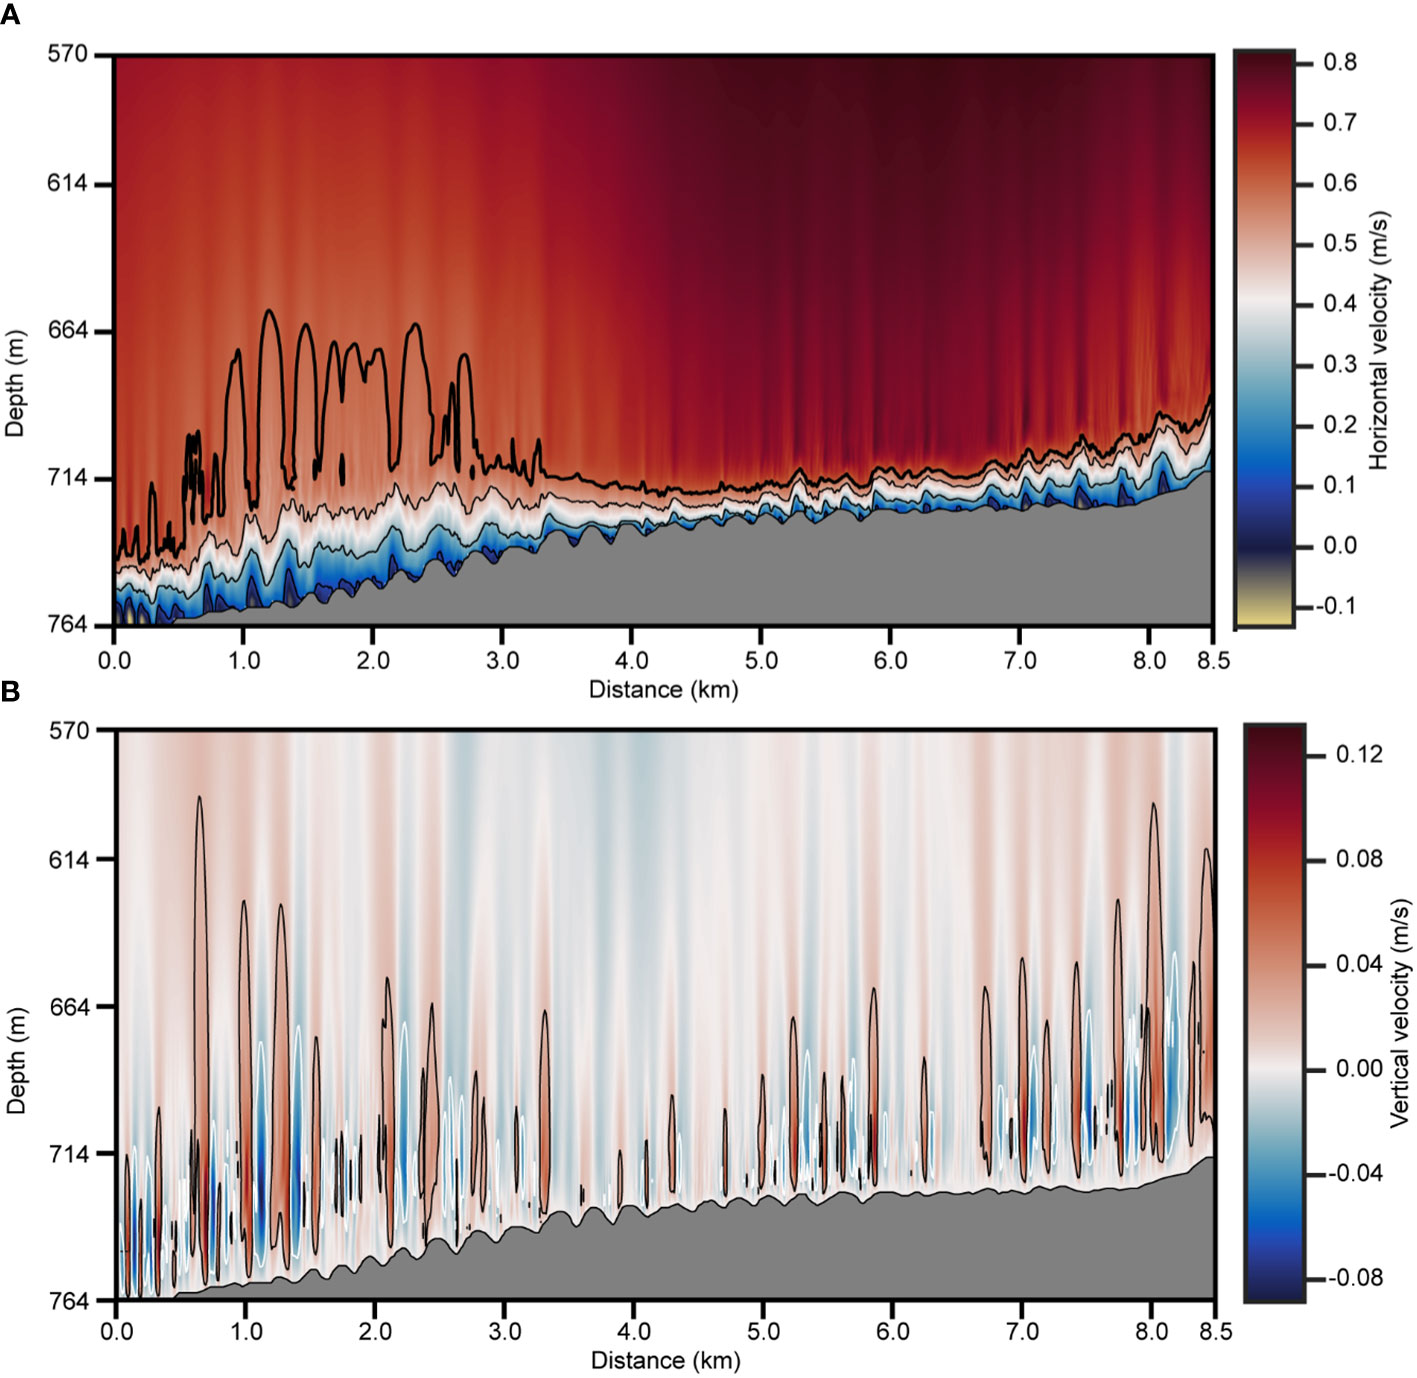
Figure 8 Fluid dynamics environment of hair-like reflection configuration with a constant flow condition forced on the boundary of 0.80m/s. (A) Horizontal velocity field section. Velocity is contoured in 0.2m/s intervals starting at 0.1m/s. Thicker contour shows the 0.6m/s isovelocity. (B) Vertical velocity field section. The white contour isovelocity is -0.02m/s and the black isovelocity is 0.02m/s.
4.3 Formation mechanism analysis of hair-like reflection configuration
Based on the fluid dynamics environment of the hair-like reflection configuration, we can investigate its formation mechanism and dynamically analyze the fluid dynamics origin of the seismic event characteristics near the oceanic bottom boundary layer. Under the constraints of the submarine sand wave topography, the seafloor of Region 1 (0-3.0km) does not develop a hair-like reflection configuration, but forms a turbulent region. The phenomenon can be explained by the temperature field, which shows the apparent vortex shape in the temperature field near the position (Hu et al., 2021), destroying the seawater layer feature. The hair-like reflection configuration within the range of 4.0-5.5km in Region 2 is better as well for this reason. The overlying water column of the submarine sand waves does not form a vortex shape, which enables the hair-like reflection configuration to develop normally (Figure 9).
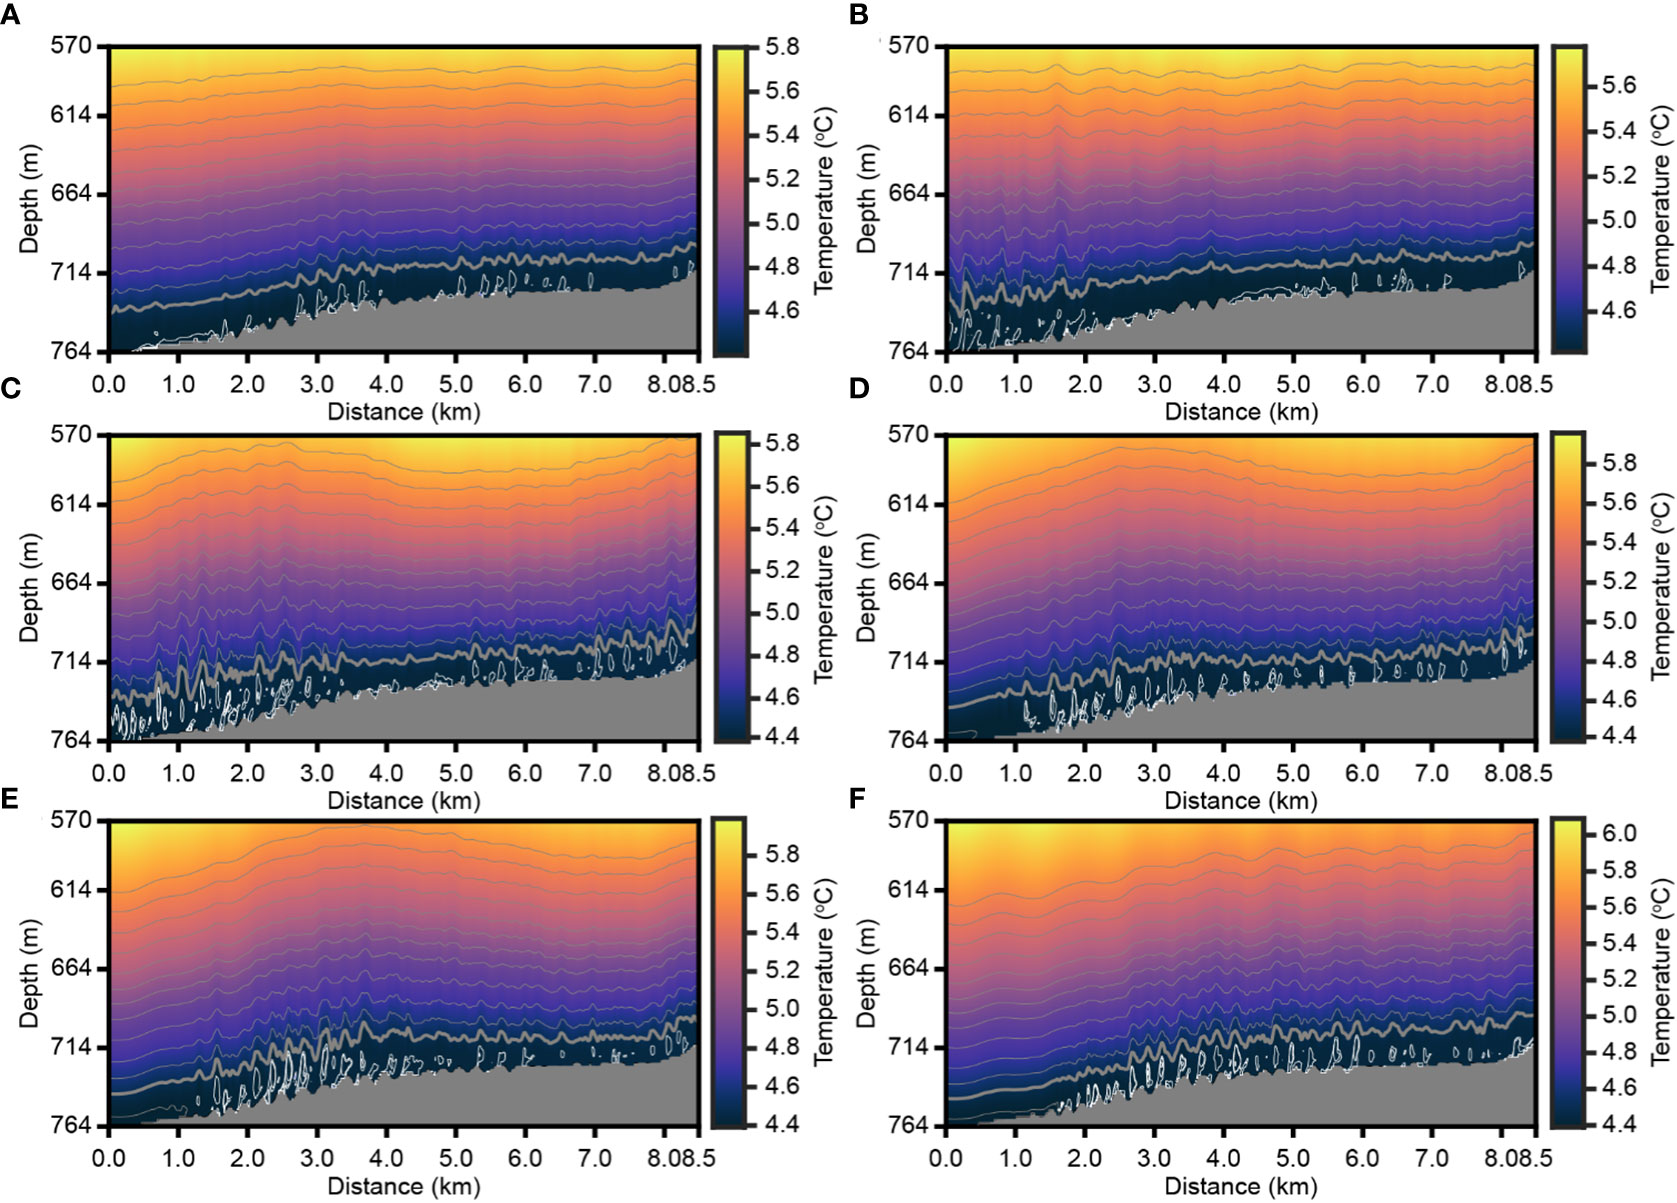
Figure 9 Temperature field section of hair-like reflection configuration with constant flow conditions forced on the boundary of (A) 0.70m/s, (B) 0.75m/s, (C) 0.80m/s, (D) 0.85m/s, (E) 0.90m/s and (F) 0.95m/s. Temperature is contoured in 0.1°C intervals starting at 4.39°C with grey isotherms. Thicker contour shows the 4.39°C isotherm. The white isotherms are below 4.39°C.
The deviations in submarine sand wave topography have little effect on the thickness of the area affected by the interaction between seawater movement and submarine topography and the submarine turbulent region of Region 1 (0-3km) (Figure 4C and Figure 5B). It is speculated that the reason for its formation is mainly restricted by the slope of submarine topography, and is independent of the scale of submarine sand waves. There are significant differences in the hair-like reflection configuration of Region 2 (Figure 4C and Figure 5B). The reason is that with the decrease of the amplitude of submarine sand waves, the interaction between seawater movement and submarine topography cannot form vortex shapes at the position of submarine sand waves troughs, resulting in limited development of hair-like reflection configuration. The amplitude of the smooth submarine sand waves corresponding to Events 4-7 is approximately 1m, indicating that the hair-like reflection configuration cannot develop above submarine sand waves at this scale. Consequently, we can determine whether the overlying water column develops hair-like reflection configurations by the scale of submarine sand waves.
The interaction between seawater movement and submarine topography results in the formation of vortex shapes at the position of submarine sand wave troughs (Carr et al., 2010), which destroy the ocean stratification feature, leads to the redistribution of seawater thermohaline, and then develops a hair-like reflection configuration. The range between the isoline of 0.5m/s and the seafloor in the horizontal velocity section is the area where seawater movement interacts with submarine topography, and the hair-like reflection configuration is also developed in this range (Figure 8). Within the range of 6.5-8.5km in Region 2, the amplitude of submarine sand waves is small, whose trough position does not form a vortex shape. Consequently, there is no hair-like reflection configuration in this area, and the seawater layer seismic event presents chaotic reflection characteristics due to the vortex shape of the overlying water column at the height of approximately 3m above the seafloor. There are vortex shapes in the overlying water column above the seafloor of Region 1 and Region 2 (6.5-8.5km), while there is no vortex shape in the overlying water column above the seafloor of Region 2 (4.5-5.5km). It is speculated that it is caused by changes in the slope of the submarine topography. Due to the topographic acceleration effect, the flow field intensity in the overlying water column at this position is greater than that at other positions. It can be concluded that under the same seawater flow velocity, the change of submarine topography scale also affects the development of hair-like reflection configuration. It is found that the slope of the submarine topography in Region 1 is about 13°, while that in Region 2 (4.0-5.0km) is about 3° in the study. Consequently, we demonstrated that as the slope of the submarine topography varies, under the constraint of the submarine sand wave topography, the oceanic bottom boundary layer will also develop different morphological characteristics of reflection configuration. With the increase of submarine topography slope, the morphological characteristics of submarine sand waves induced hair-like reflection configuration will be affected. For instance, when the slope of the submarine topography increases to 13°, the hair-like reflection configuration will not develop above the submarine sand waves, but the submarine turbulent region will be formed. When the boundary force with a constant condition of U0 is 0.95m/s, the flow field intensity generated by the interaction between seawater movement and submarine topography is large enough to produce vortex shapes in the overlying water column of Region 2 (4.0-5.5km), which will affect the development of the hair-like reflection configuration under this seawater flow velocity. It is concluded that the change in the temperature field is consistent with the change in the seawater flow field according to comprehensive analysis. Consequently, it is inferred that without the influence of oceanic suspended sediments, the change of seawater layer features caused only by the interaction between seawater movement and submarine topography, that is, the difference of seawater thermohaline, can form hair-like reflection configuration.
5 Conclusions
This study proposes a method to discuss the fluid dynamics environment and formation mechanism of hair-like reflection configuration by using fluid dynamics numerical simulation and seismic oceanography technology. The fluid dynamics numerical simulation provides a basis for the dynamic analysis of the evolution process of the hair-like reflection configuration. Combined with the seismic oceanography numerical simulation and the optimal matching method, the seawater flow velocity in this study is estimated to be approximately 0.80m/s. Simultaneously, we obtain the flow field characteristics of the water column above submarine sand waves and deeply understand the fluid dynamics environment. Moreover, the deviations in submarine topography (amplitude of submarine sand waves) have significant impact on the development of the hair-like reflection configuration. Based on the constructed fluid dynamics seismic reflection model, the fluid dynamics formation mechanism of the submarine sand waves induced hair-like reflection configuration is proposed. Without the influence of oceanic suspended sediments, the change of seawater layer features caused only by the interaction between seawater movement and submarine topography, that is, the difference of seawater thermohaline, can form a hair-like reflection configuration.
Consequently, it is possible to discuss the fluid dynamics environment and formation mechanism of submarine sand waves induced hair-like reflection configuration, which lays a foundation for further research on dynamic processes of hair-like reflection configuration using the seismic oceanography method. This work provides a new research perspective for interpreting complex seismic oceanography images, deepens understanding of the interaction process between multiscale ocean dynamics and submarine bottom topography, and can further quantify the dynamic process.
Data availability statement
The raw data supporting the conclusions of this article will be made available by the authors, without undue reservation.
Author contributions
TH performed the numerical simulation and wrote the manuscript. JC contributed to the conception of the study. BH and LA contributed significantly to analysis and manuscript preparation. All authors contributed to the article and approved the submitted version.
Funding
This work is financially supported by the National Natural Science Foundation of China [Grant No. 42274149]. JC is funded by the Shandong Province “Taishan Scholar” Construction Project.
Acknowledgments
The CTD data used in this study were provided by the National Centers for Environment Information (https://www.ncei.noaa.gov/products/world-ocean-database).
Conflict of interest
The authors declare that the research was conducted in the absence of any commercial or financial relationships that could be construed as a potential conflict of interest.
Publisher’s note
All claims expressed in this article are solely those of the authors and do not necessarily represent those of their affiliated organizations, or those of the publisher, the editors and the reviewers. Any product that may be evaluated in this article, or claim that may be made by its manufacturer, is not guaranteed or endorsed by the publisher.
References
Alford M. H., Peacock T., MacKinnon J. A., Nash J. D., Buijsman M. C., Centuroni L. R., et al. (2015). The formation and fate of internal waves in the south China Sea. Nature 521 (7550), 65–69. doi: 10.1038/nature14399
Ashley G. M. (1990). Classification of large-scale subaqueous bedforms: a new look at an old problem. SEPM bedforms and bedding structure research symposium. J. Sediment. Petrology 60 (1), 160–172. doi: 10.2110/jsr.60.160
Baysal E., Kosloff D. D., Sherwoods J. W. C. (1983). Reverse time migration. Geophysics 48 (11), 1514–1524. doi: 10.1190/1.1441434
Belde J., Back S., Reuning L. (2015). Three-dimensional seismic analysis of sediment waves and related geomorphological features on a carbonate shelf exposed to large amplitude internal waves. Sedimentology 62 (1), 87–109. doi: 10.1111/sed.12141
Besio G., Blondeaux P., Brocchini M., Hulscher S. J. M. H., Idier D., Knaapen M. A. F., et al. (2008). The morphodynamics of tidal sand waves: a model overview. Coast. Eng. 55 (7-8), 657–670. doi: 10.1016/j.coastaleng.2007.11.004
Biescas B., Sallarès V., Pelegrí J. L., Machín F., Carbonell R., Buffett G., et al. (2008). Imaging meddy finestructure using multichannel seismic reflection data. Geophys. Res. Lett. 35 (11), L11609. doi: 10.1029/2008GL033971
Borsje B. W., Kranenburg W. M., Roos P. C., Matthieu J., Hulscher J. M. H. (2014). The role of suspended load transport in the occurrence of tidal sand waves. J. Geophys. Res. Earth Surface 119, 701–716. doi: 10.1002/2013JF002828
Cacchione D. A., Drake D. E. (1986). Nepheloid layers and internal waves over continental shelves and slopes. Geo-Mar. Lett. 6, 147–152. doi: 10.1007/BF02238085
Campans G. H. P., Roos P. C., de Vriend H. J., Hulshcher S. J. M. H. (2017). Modeling the influence of storms on sand wave formation: a linear stability approach. Cont. Shelf Res. 137 (1), 103–116. doi: 10.1016/j.csr.2017.02.002
Carr M., Stastna M., Davies P. A. (2010). Internal solitary wave-induced flow over a corrugated bed. Ocean Dynam. 60, 1007–1025. doi: 10.1007/s10236-010-0286-2
Chattopadhyday S., McMechan G. A. (2008). Imaging conditions for prestack reverse-time migration. Geophysics 73 (3), S81–S89. doi: 10.1190/1.2903822
Chen J., Bai Y., Guan Y., Yang S., Song H., Liu B. (2016). Geophysical analysis of abnormal seismic (oceanography) reflection characteristics of ocean bottom boundary layer. Chin. J. Geophys. 59 (5), 573–586. doi: 10.6038/cjg20160620
Chen J., Song H., Guan Y., Pinheiro L. M., Geng M. (2018). Geological and oceanographic controls on seabed fluid escape structures in the northern zhongjiannan basin, south China Sea. J. Asian Earth Sci. 168, 38–47. doi: 10.1016/j.jseaes.2018.04.027
Chen J., Song H., Guan Y., Yang S., Bai Y., Geng M. (2017). A preliminary study of submarine cold seeps by seismic oceanography techniques. Chin. J. Geophys. (in Chin. English abstract) 60 (1), 117–129. doi: 10.1002/cjg2.30032
Chen J., Tong S., Han T., Song H., Pinheiro L., Xu H., et al. (2020). Modelling and detection of submarine bubble plumes using seismic oceanography. J. Mar. Syst. 209, 103375. doi: 10.1016/j.jmarsys.2020.103375
Cukur D., Kong G. S., Buchs D. M., Lee G. S., Kim S. P., Um I. K., et al. (2022). Upslope migrating sand waves on sediment-starved shelves: an example from the southeastern continental margin of the Korean peninsula. Mar. Geol. 444, 106728. doi: 10.1016/j.margeo.2021.106728
Deng F., McMechan G. A. (2008). Viscoelastic true-amplitude prestack reverse-time depth migration. Geophysics 73 (4), S143–S155. doi: 10.1190/1.2938083
Dickinson A., Gunn K. L. (2022). The next decade of seismic oceanography: possibilities, challenges and solutions. Front. Mar. Sci. 9. doi: 10.3389/fmars.2022.736693
Dickinson A., White N. J., Caulfield C. P. (2020). Time-lapse acoustic imaging of mesoscale and fine-scale variability within the faroe-Shetland channel. J. Geophys. Res. Oceans 125, e2019JC015861. doi: 10.1029/2019JC015861
Dodd H., Blondeaux P., Calvete D., Swart H. E. D., Falqués A., Hulscher S. J. M. H., et al. (2003). Understanding coastal morphodynamics using stability methods. J. Coast. Res. 19 (4), 849–865.
Fang C., Hao J. (2019). Research progress of turbulence characteristic parameters in bottom boundary layer. IOP Conf. Series: Earth Environ. Sci. 330, 32005. doi: 10.1088/1755-1315/330/3/032005
Flemming B. W. (1980). Sand transport and bedform patterns on the continental shelf between Durban and port Elizabeth (southeast African continental margin). Sediment. Geol. 26 (1-3), 179–205. doi: 10.1016/0037-0738(80)90011-1
Frankel A., Clayton R. W. (1984). A finite-difference simulation of wave propagation in two-dimensional random media. B. Seismol. Soc Am. 74 (6), 2167–2186. doi: 10.1785/bssa0740062167
Frankel A., Clayton R. W. (1986). Finite difference simulations of seismic scattering: implications for the propagation of short-period seismic waves in the crust and models of crustal heterogeneity. J. Geophys. Re. Sol. Ea. 91 (B6), 6465–6489. doi: 10.1029/JB091iB06p06465
Fu K. H., Wang Y., Laurent L. S., Simmons H., Wang D. (2012). Shoaling of large amplitude nolinear internal waves at dongsha atoll in the northern south China Sea. Cont. Shelf Res. 37, 1–7. doi: 10.1016/j.csr.2012.01.010
Geng M., Song H., Guan Y., Bai Y. (2019). Analyzing amplitudes of internal solitary waves in the northern south China Sea by use of seismic oceanography data. Deep-Sea Res. I Oceanogr. Res. Pap. 146, 1–10. doi: 10.1016/j.dsr.2019.02.005
Geng M., Song H., Guan Y., Bai Y., Liu S., Chen Y. (2017). The distribution and characteristics of very large subaqueous sand dunes in the dongsha region of the northern south China Sea. Chin. J. Geophys. (in Chin. English abstract) 60 (2), 628–638. doi: 10.6038/cjg20170217
Gunn K. L., White N., Caulfield C. P. (2020). Time-lapse seismic imaging of oceanic fronts and transient lenses within south Atlantic ocean. J. Geophys. Res. Oceans 125, e2020JC016293. doi: 10.1029/2020JC016293
Guo C., Chen X. (2014). A review of internal solitary wave dynamics in the northern south China Sea. Prog. Oceanogr. 121, 7–23. doi: 10.1016/j.pocean.2013.04.002
Hansen E. A., Fredsøe F., Deigaard R. (1994). Distribution of suspended sediment over wave-generated ripples. J. Waterw. Port Coast. 120 (1), 37–55. doi: 10.1061/(ASCE)0733-950X(1994)120:1(37)
Holbrook W. S., Fer I. (2005). Ocean internal wave spectra inferred from seismic reflection transects. Geophys. Res. Lett. 32, L15604. doi: 10.1029/2005GL023733
Holbrook W. S., Páramo P., Pearse S., Schmitt R. W. (2003). Thermohaline fine structure in an oceanographic front from seismic reflection profiling. Science 301, 821–824. doi: 10.1126/science.1085116
Hu X., Zhang X., Lin L., Zhang L., Wang S. (2021). Effects of a two-equation turbulence model on the simulation of the internal lee waves. Atmos. Ocean. Sci. Lett. 14, 100020. doi: 10.1016/j.aosl.2020.100020
Huang X., Chen Z., Zhao W., Zhang Z., Zhou C., Yang Q., et al. (2016). An extreme internal solitary wave event observed in the northern south China Sea. Sci. Rep. 6 (1), 30041. doi: 10.1038/srep30041
Huang X., Song H., Guan Y., Geng M., Wang Y. (2018). Study of seawater seismic facies based on computational fluid dynamics. Chin. J. Geophys. (in Chin. English abstract) 61 (7), 2892–2904. doi: 10.6038/cjg2018L0382
Huang X., Zhao W., Tian J., Yang Q. (2014). Mooring observations of internal solitary waves in the deep basin west of Luzon strait. Acta Oceanol. Sin. 33 (3), 82–89. doi: 10.1007/s13131-014-0417-7
Jazi S. D., Wells M. G., Peakall J., Dorrell R. M., Thomas R. E., Keevil G. M., et al. (2020). Influence of Coriolis force upon bottom boundary layers in a large-scale gravity current experiment: implications for evolution of sinuous deep-water channel systems. J. Geophys. Res. Oceans 125, e2019JC015284. doi: 10.1029/2019JC015284
Jia Y., Tian Z., Shi X., Liu J. P., Chen J., Liu X., et al. (2019). Deep-sea sediment resuspension by internal solitary waves in the northern south China Sea. Sci. Rep. 9, 12137. doi: 10.1038/s41598-019-47886-y
Kelly K. R., Ward R. W., Treitel S. (1976). Synthetic seismograms: a finite-difference approach. Geophysics 41 (1), 2–27. doi: 10.1190/1.1440605
Klymak J. M., Legg S. M. (2010). A simple mixing scheme for models that resolve breaking internal waves. Ocean Modell. 33, 224–234. doi: 10.1016/j.ocemod.2010.02.005
Klymak J. M., Legg S. M., Pinkel R. (2010a). A simple parameterization of turbulent tidal mixing near supercritical topography. J. Phys. Oceanogr. 40, 2059–2074. doi: 10.1175/2010jpo4396.1
Klymak J. M., Legg S. M., Pinkel R. (2010b). High-mode stationary waves in stratified flow over large obstacles. J. Fluid Mech. 644, 321–336. doi: 10.1017/S0022112009992503
Kormann J., Cobo P., Biescas B., Sallarés V., Papenberg C., Recuero M., et al. (2010). Synthetic modelling of acoustic propagation applied to seismic oceanography experiments. Geophys. Res. Lett. 37, L00D90. doi: 10.1029/2009GL041763
Krahmann G., Brandt P., Klaeschen D., Reston T. (2008). Mid-depth internal wave energy off the Iberian peninsula estimated from seismic reflection data. J. Geophys. Res. 113 (C12), C12016. doi: 10.1029/2007JC004678
Legg S., Adcroft A. (2003). Internal wave breaking at concave and convex continental slopes. J. Phys. Oceanogr. 33, 2224–2246. doi: 10.1175/1520-0485(2003)033<2224:iwbaca>2.0.co;2
Legg S., Klymak J. M. (2008). Internal hydraulic jumps and overturning generated by tidal flow over a tall steep ridge. J. Phys. Oceanogr. 38, 1949–1964. doi: 10.1175/2008JPO3777.1
Lien R. C., Henyey F., Ma B., Yang Y. J. (2014). Large-Amplitude internal solitary waves observed in the northern south China Sea: properties and energetics. J. Phys. Oceanogr. 44 (4), 1095–1115. doi: 10.1175/JPO-D-13-088.1
Lv H., He Y., Shen H., Cui L., Dou C. (2010). “The propagation speed of internal solitary waves investigated by X-band radar near dongsha island,” in Proceedings of the 2010 IEEE International Geoscience and Remote Sensing Symposium. Honolulu, HI, USA: IEEE 4705–4708. doi: 10.1109/IGARSS.2010.5654467
Madariaga R. (1976). Dynamics of an expanding circular fault. B. Seismol. Soc Am. 66 (3), 639–666. doi: 10.1785/BSSA0660030639
Marshall J., Adcroft A., Hill C., Perelman L., Heisey C. (1997a). A finite-volume, incompressible navier stokes model for studies of the ocean on parallel computers. J. Geophys. Res. Oceans 103, 5753–5766. doi: 10.1029/96JC02775
Marshall J., Hill C., Perelman L., Adcroft A. (1997b). Hydrostatic, quasi-hydrostatic, and nonhydrostatic ocean modeling. J. Geophys. Res. Oceans 102, 5733–5752. doi: 10.1029/96JC02776
Mccave I. N. (1971). Sand waves in the north Sea off the coast of Holland. Mar. Geol. 10 (3), 199–225. doi: 10.1016/0025-3227(71)90063-6
Ménesguen C. L., Hua B. L., Papenberg C., Klaeschen D., Géli L., Hobbs R. (2009). Effect of bandwith on seismic imaging of rotating stratified turbulence surrounding an anticyclonic eddy from field data and numerical simulations. Geophys. Res. Lett. 36, L00D05. doi: 10.1029/2009GL039951
Nandi P., Holbrook W. S., Pearse S., Páramo P., Schmitt R. W. (2004). Seismic reflection imaging of water mass boundaries in the Norwegian Sea. Geophys. Res. Lett. 31, 345–357. doi: 10.1029/2004GL021325
Perlin A., Moum J. N., Klymak J. M. (2005). Response of the bottom boundary layer over a sloping shelf to variations in alongshore wind. J. Geophys. Res. 110, C10S09. doi: 10.1029/2004JC002500
Pinheiro L. M., Song H., Ruddick B., Dubert J., Ambar I., Mustafa K., et al. (2010). Detailed 2-d imaging of the Mediterranean outflow and meddies off wiberia from multichannel seismic data. J. Mar. Syst. 79, 89–100. doi: 10.106/j.jmarsys.2009.07.004
Qian S., Zhang J., Wang D., Wang Y. (2022). Observational study on drag reduction of continental-shelf bottom boundary layer. Phys. Fluids 34, 055127. doi: 10.1063/5.0091335
Quentel E., Carton X., Gutscher M. A., Hobbs R. (2010). Detecting and characterizing mesoscale and submesoscale structures of Mediterranean water from joint seismic and hydrographic measurements in the gulf of cadiz. Geophys. Res. Lett. 37 (6), L06604. doi: 10.1029/2010GL042766
Reeder D. B., Ma B. B., Yang Y. J. (2011). Very large subaqueous sand waves on the upper continental slope in the south China Sea generated by episodic, shoaling deep-water internal solitary waves. Mar. Geol. 279, 12–18. doi: 10.1016/j.margeo.2010.10.009
Ribó M., Puig P., Muñoz A., Lo lacono C., Masque P., Palanques A., et al. (2016). Morphobathymetric analysis of the large fine-grained sediment waves over the gulf of Valencia continental slope (NW Mediterranean). Geomorphology 253, 22–37. doi: 10.1016/j.geomorph.2015.09.027
Ruddick B., Song H., Dong C., Pinheiro L. (2009). Water column seismic images as map of temperature gradient. Oceanography 22 (1), 192–205. doi: 10.5670/oceanog.2009.19
Sallares V., Mojica J. F., Biescas B., Klaeschen D., Gràcia E. (2016). Characterization of the submesoscale energy cascade in the alboran Sea thermocline from spectral analysis of high-resolution MCS data. Geophys. Res. Lett. 43, 6461–6468. doi: 10.1002/2016GL069782
Shaw W. J., Williams A. J. III, Trobridge J. H. (1996)Measurement of turbulent sound speed fluctuations with an acoustic travel-time meter (Accessed OCEANS 96 MTS/IEEE Conference Proceedings. The Coastal Ocean - Prospects for the 21st Century).
Song H., Chen J., Pinheiro L. M., Ruddick B., Fan W., Gong Y., et al. (2021a). Progress and prospects of seismic oceanography. Deep-Sea Res. Part I 177, 103631. doi: 10.1016/j.dsr.2021.103631
Song H., Fan W., Sun S., Guan Y., Zhang K., Gong Y., et al. (2020)Features of internal solitary waves revealed by seismic oceanography data (Accessed EGU General Assembly 2020 EGU2020).
Song H., Gong Y., Yang S., Guan Y. (2021b). Observations of interval structure changes in shoaling internal solitary waves based on seismic oceanography method. Front. Mar. Sci. 8. doi: 10.3389/fmars.2021.733959
Song H., Pinheiro L. M., Wang D., Dong C., Song Y., Bai Y. (2009). Seismic images of ocean meso-scale eddies and internal waves. Chin. J. Geophys. 52 (6), 1251–1257. doi: 10.1002/cjg2.1451
Stow D. A. W., Hernández-Molina F. J., Llave E., Sayago-Gil M., del Río V. D., Branson A. (2009). Bedform-velocity matrix: the estimation of bottom current velocity from bedform observations. Geology 37 (4), 327–330. doi: 10.1130/G25259A.1
Swift S. A., Dougherty M. E., Stephen R. A. (1990). Finite difference seismic modeling of axial magma chambers. Geophys. Res. Lett. 17 (12), 2105–2108. doi: 10.1029/GL017i012p02105
Tang Q., Gulick S. P., Sun L. (2014). Seismic observations from a yakutat eddy in the northern gulf of Alaska. J. Geophys. Res. Oceans 119 (6), 3535–3547. doi: 10.1002/2004JC009938
Tang Q., Gulick S. P. S., Sun J., Sun L., Jing Z. (2020). Submesoscale features and turbulent mixing of an oblique anticyclonic eddy in the gulf of Alaska investigated by marine seismic survey data. J. Geophys. Res. Oceans 125 (1), e2019JC015393. doi: 10.1029/2019JC015393
Terwindt J. H. J. (1971). Sand waves in the southern bight of the north Sea. Mar. Geol. 10 (1), 51–67. doi: 10.1016/0025-3227(71)90076-4
Tian Z., Jia Y., Chen J., Liu J. P., Zhang S., Ji C., et al. (2021). Internal solitary waves induced deep-water nepheloid layers and seafloor geomorphic changes on the continental slope of the northern south China Sea. Phys. Fluids 33, 053312. doi: 10.1063/5.0045124
Tsuji T., Noguchi T., Niino H., Matsuoka T., Nakamura Y., Tokuyama H., et al. (2005). Two-dimensional mapping of fine structures in the kuroshio current using seismic reflection data. Geophys. Res. Lett. 32, L14609. doi: 10.1029/2005g1023095
Viana A. R., Faugeres J. C., Stow D. A. V. (1998). Bottom-current-controlled sand deposits - a review of modern shallow- to deep-water environments. Sediment. Geol. 115 (1-4), 53–80. doi: 10.1016/s0037-0738(97)00087-0
Vsemironva E. A., Hobbs R. W., Housegood P. (2012). Mapping turbidity layers using seismic oceanography methods. Ocean Sci. 8, 11–18. doi: 10.5194/os-8-11-2012
Wynn R. B., Stow D. A. (2002). Classification and characterization of deep-water sediment waves. Mar. Geol. 193 (1-3), 7–22. doi: 10.1016/S0025-3227(02)00547-9
Xu J., Wong F., Kvitek R., Smith D. P., Paull C. K. (2008). Sandwave migration in Monterey submarine canyon, central California. Mar. Geol. 248, 193–212. doi: 10.1016/j.margeo.2007.11.005
Yang Y., Liu M., Xu J., Xu W. (2022). Migrating sandwaves riding on relict dunes of Taiwan shoal, northern south China Sea. Front. Earth Sc. 10. doi: 10.3389/feart.2022.975220
Yang S., Song H., Fan W., Wu D. (2021). Submesoscale features of a cyclonic eddy in the gulf of papagayo, central America. Chin. J. Geophys. (in Chin. English abstract) 64 (4), 1328–1340. doi: 10.6038/cjg2021O02024
Yin S., Hernández-Molina F. J., Lin L., Chen J., Ding W., Li J. (2021). Isolation of the south China sea from the north pacific subtropical gyre since the latest Miocene due to formation of the Luzon strait. Sci. Rep. 11 (1), 1562. doi: 10.1038/s41598-020-79941-4
Zhang L., Luan X. (2012). Quantitative analysis of submarine slope stability on the northern slooe of the south China Sea. Prog. Geophys. (in Chin. English abstract) 27 (4), 1443–1453. doi: 10.6038/j.issn.1004-2903.2012.04.019
Zhao W., Huang X., Tian J. (2012). A new method to estimate phase speed and vertical velocity of internal solitary waves in the south China Sea. J. Geophys. Res. 68 (5), 761–769. doi: 10.1007/s10872-012-0132-x
Zhuang Z., Lin Z., Zhou J., Liu Z., Liu Y. (2004). Environment conditions for the formation and development of sand dunes (waves) in the continental shelf. Mar. Geol. Lett. (in Chin. English abstract) 20 (4), 5–10. doi: 10.16028/j.1009-2722.2004.04.002
Keywords: seismic oceanography, fluid dynamics, numerical simulation, hair-like reflection configuration, formation mechanism
Citation: Han T, Chen J, He B and Azevedo L (2023) Research on the fluid dynamics interaction between submarine sand waves and seawater by seismic oceanography. Front. Mar. Sci. 10:1184787. doi: 10.3389/fmars.2023.1184787
Received: 12 March 2023; Accepted: 24 April 2023;
Published: 12 May 2023.
Edited by:
Dong Feng, Shanghai Ocean University, ChinaReviewed by:
Yuncheng Cao, Shanghai Ocean University, ChinaDuanxin Chen, Chinese Academy of Sciences (CAS), China
Copyright © 2023 Han, Chen, He and Azevedo. This is an open-access article distributed under the terms of the Creative Commons Attribution License (CC BY). The use, distribution or reproduction in other forums is permitted, provided the original author(s) and the copyright owner(s) are credited and that the original publication in this journal is cited, in accordance with accepted academic practice. No use, distribution or reproduction is permitted which does not comply with these terms.
*Correspondence: Jiangxin Chen, amlhbmd4aW5fY2hlbkBzaW5hLmNvbQ==; Bingshou He, aGViaW5zaG91QG91Yy5lZHUuY24=