 Huizhu Pan
 Mingben Xu1,2
 Jie Li
 Jiachang Lu
- 1Guangxi Key Laboratory of Marine Environmental Science, Guangxi Academy of Marine Sciences, Guangxi Academy of Sciences, Nanning, Guangxi, China
- 2Beibu Gulf Marine Industry Research Institute, Fangchenggang, Guangxi, China
The Qinzhou Bay, a typical semi-enclosed bay, is facing environmental pressure from local fast-growing industrial and aquacultural development. Dominant species of phytoplankton community (based on microscopic examination) show a trend of miniaturization, while pico-phytoplankton (based on CHEMTAX analysis) is widely distributed in Qinzhou Bay. However, most previous investigations of phytoplankton community based on microscopic method that undetected small-sized cell (< 3 μm), and limited by scarce studies on CHEMTAX analysis, the long-term dynamic data of small-size phytoplankton are lacking in Qinzhou Bay. It is recognized that combining microscopic examination with CHEMTAX analysis could provide a good taxonomic reliability for large cells and valuable information about small-size groups. In this study, microscopic examination and High Performance Liquid Chromatography (HPLC)-CHEMTAX analysis were employed to characterize the spatiotemporal variability of the phytoplankton community structure in Qinzhou Bay in winter and summer of 2021. The results of microscopic observations showed that the phytoplankton community was characterized by diatoms and dinoflagellates mainly. Diatoms dominated in both seasons, of which Skeletonema costatum bloom occurred in the summer. CHEMTAX analysis not only agreed well with microscopy data for diatoms and dinoflagellates, but also helped identification of other small-sized flagellates and cyanobacteria that hard to observe by microscope. The results of CHEMTAX analysis found that diatoms, prasinophytes and cryptophytes co-dominated the total chlorophyll a in winter while diatoms became the dominant group in summer. In addition, our results indicate that the proportion of small-sized flagellates has increased in the past decade in Qinzhou Bay, especially for cryptophytes. Temperature, nutrient availability, and selective grazing of oyster affected the succession of phytoplankton community from co-dominance of diatoms and flagellates in winter to absolute diatoms dominance in summer. The distribution of prasinophytes and cryptophytes on a spatial scale were related to the location of shellfish culture area and estuary, respectively, rather than by nutrients. Eutrophication, selective grazing of oyster and warming were the driving factors of long-term changes in phytoplankton composition in Qinzhou Bay. This study enhanced our understanding of entire phytoplankton community dynamics and its relationship with environmental factors in Qinzhou Bay.
1 Introduction
Phytoplankton acts as a primary producer in marine ecosystems and maintains the balance of the global ecosystem by supplying organic matter to higher trophic levels (Paerl et al., 2003). Phytoplankton community reflects environmental changes sensitively and rapidly, and variation in the structure of phytoplankton community could affect the global climate in terms of carbon flux (Sarmiento et al., 1988), cloud albedo (Charlson et al., 1987), light flux, and heat flux (Sathyendranath et al., 1991). Therefore, quantifying the variations in phytoplankton biomass and taxonomic composition and analyzing the relationship between phytoplankton and the environment are important for the evaluation of ecosystem function and status, as well as for the study of global biogeochemical cycles (Eker-Develi et al., 2008).
The widespread techniques regarding phytoplankton monitoring are morphological observation, pigment analysis, and high throughput sequencing analysis (Egge et al., 2015; Pan et al., 2020). The traditional identification and quantification of phytoplankton via microscopy techniques can provide accurate taxonomical information (at species or genus) of phytoplankton (Brito et al., 2015b). However, phytoplankton cells in small size (<3 μm) and unobvious morphological characteristics are difficult to identify accurately, which restricts the application to the species of small size group, such as prasinophytes and cyanobacteria (Chen et al., 2016). In addition to morphological characteristics, some photosynthetic pigments (such as fucoxanthin, peridinin, zeaxanthin and alloxanthin), determined by high-performance liquid chromatography (HPLC), can also be used as taxonomic indicators for phytoplankton classification (Zapata et al., 2000). The contribution of different phytoplankton groups to the total chlorophyll a can be estimated by combining the photosynthetic pigment data with CHEMTAX, a mathematical program, based on the ratios of mark pigments to Chl a (Mackey et al., 1996). This technology overcomes the drawback of the microscopy method. However, the CHEMTAX estimates can only classify phytoplankton into classes or phyla. Many studies have proposed a combination of the two approaches for better understanding of phytoplankton community structures (Agirbas et al., 2015; Brito et al., 2015b; Pan et al., 2020).
Qinzhou Bay (QZB) is a semi-enclosed subtropical bay located in Qinzhou, China. It receives a considerable amount of chemicals, organic matter, and nutrients from Maoling River, Qinjiang River, and Jingu River (Luo et al., 2019). Nutrients usually increased in gradient from south to north and exhibit significant seasonal change in QZB, which reflects the dominant control role of land runoff (Lai et al., 2013). QZB is an important oyster aquaculture area in Guangxi Zhuang Autonomous Region, in-bay oyster farming area has expanded from inner bay (Maowei Sea) to the Qinzhou Port coastal area in recent decades. With accelerated expansion of port transportation, aquaculture industry, and coastal industry in the local rim region, the QZB has undergone a shift from oligotrophic to mild, moderate and even heavy (Maowei Sea) eutrophication status from 1980s to the 2010s (Wei et al., 2002; Lan, 2012; Yang et al., 2012; Lai et al., 2013), inorganic nitrogen showed an obvious increasing trend (Wei et al., 2002; Wei and He, 2008). In addition, the Guangxi Fangchenggang Nuclear Power Plant located in the west coast of QZB (Figure 1) began operating in January 2016, the thermal discharge causes sea surface temperature increase near the water outlet (Pan et al., 2022).
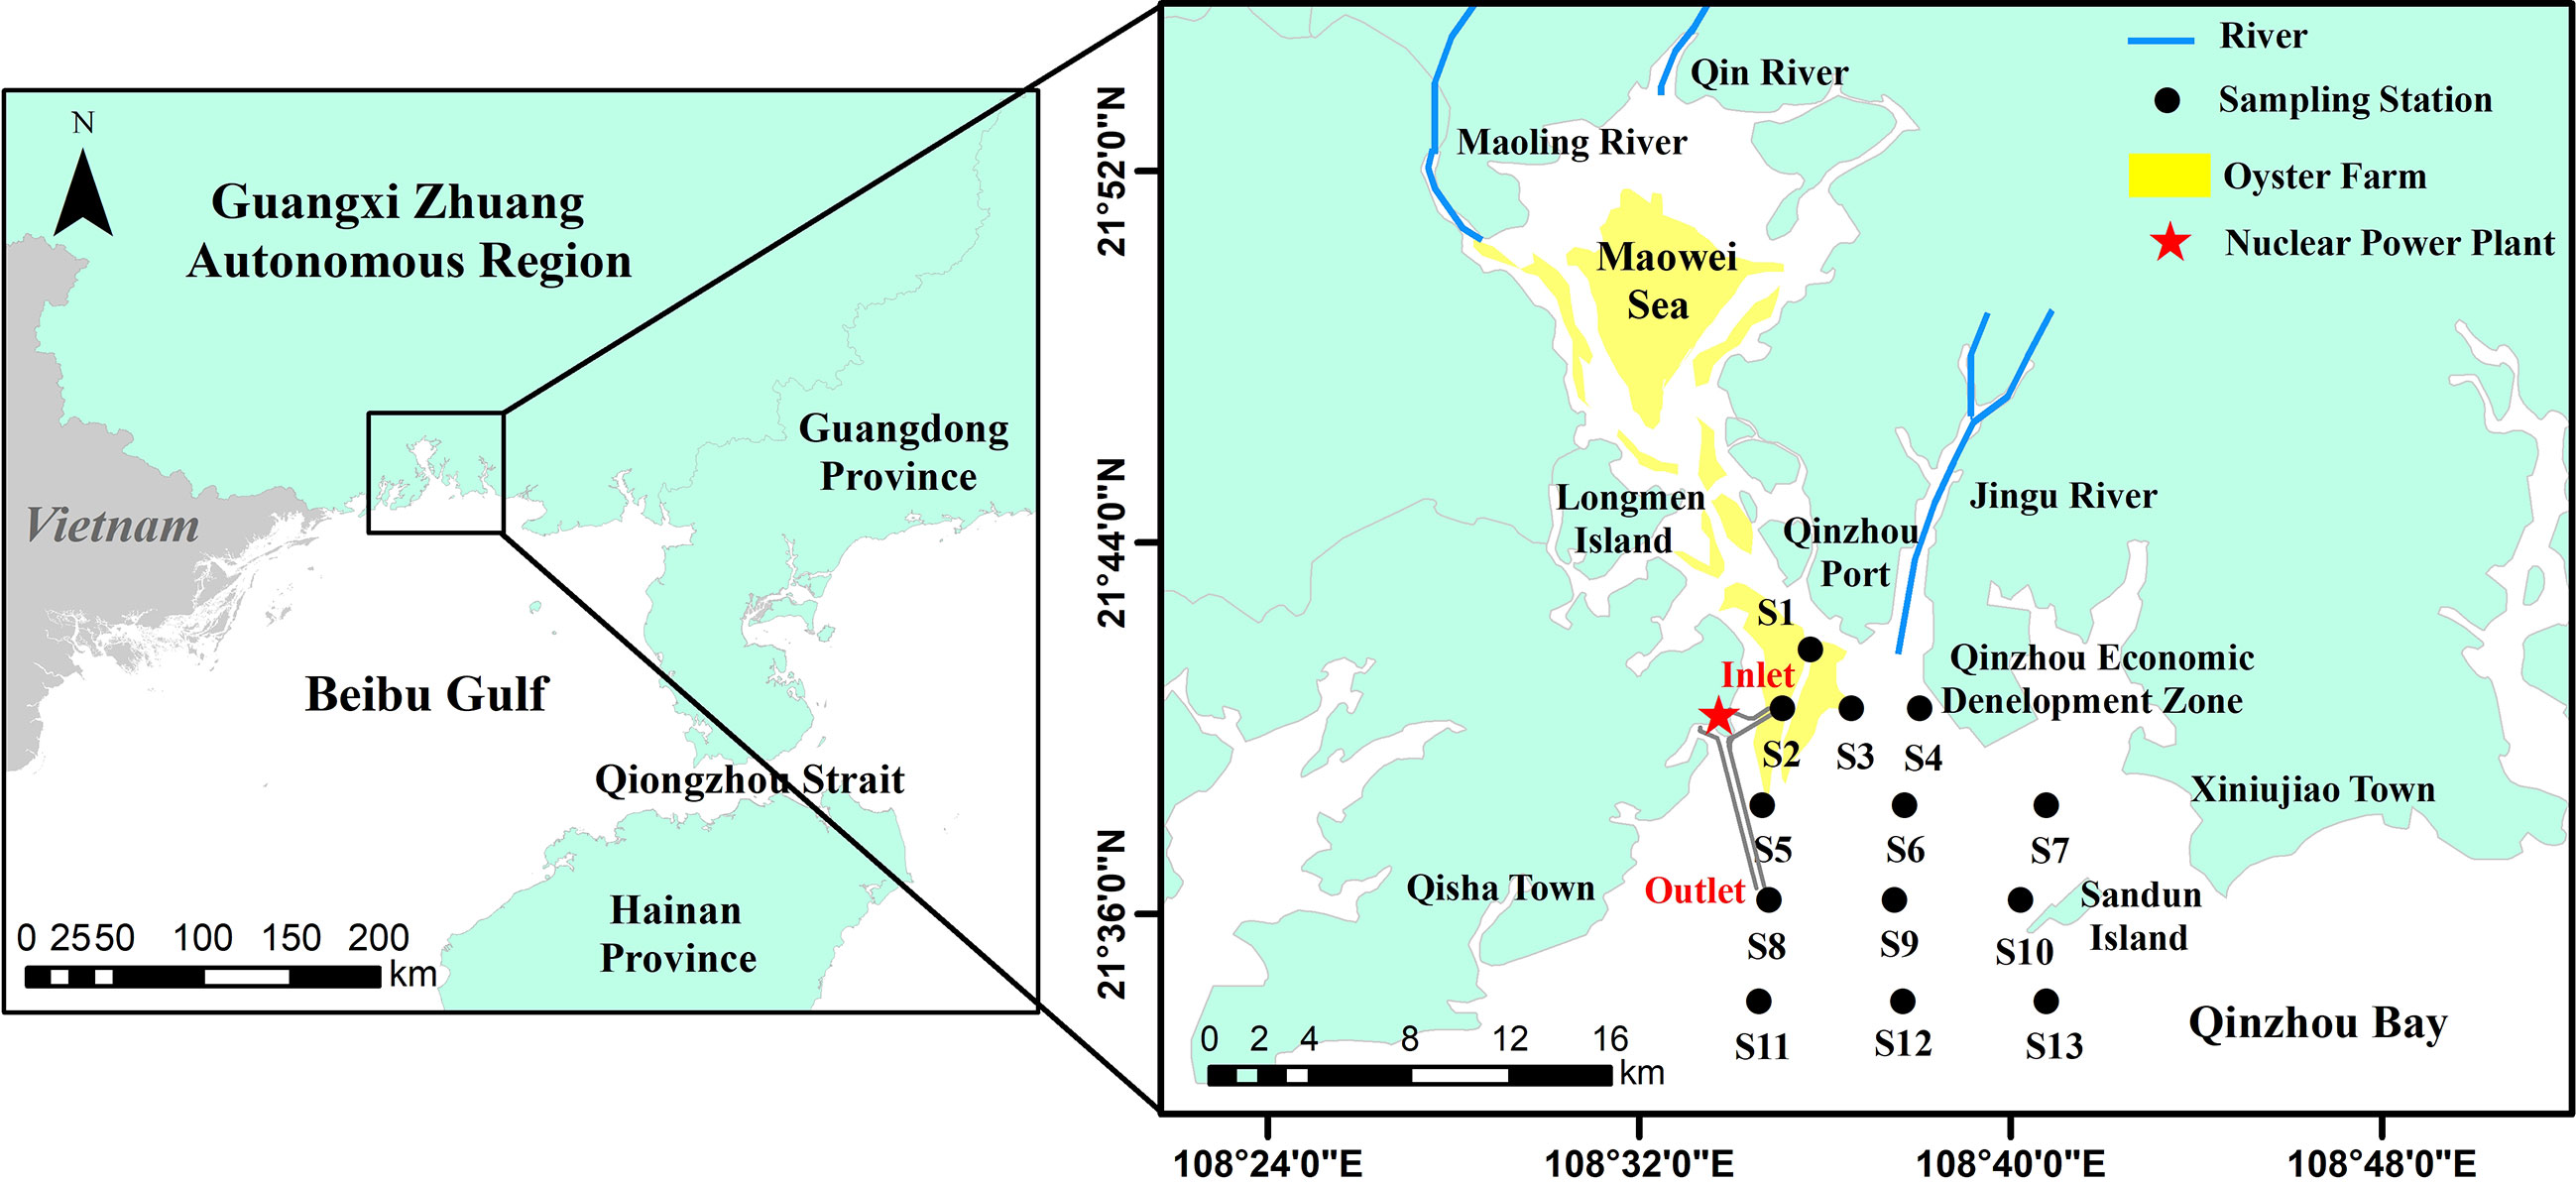
Figure 1 Deployment of sampling stations in QZB, the Beibu Gulf, China.
Phytoplankton in terms of biomass, abundance and species information, have been measured in QZB over many decades, many studies have shown that the phytoplankton dynamics is closely related to environmental physical and chemical factors (Wei and He, 2008; Wang et al., 2013; Liu et al., 2020). Under the background of environmental changes over the past decades, phytoplankton responded to qualitative and quantitative changes in community structure; for example, intensified blooms (Qin et al., 2016; Shen et al., 2018; Liu et al., 2020; Su et al., 2022), small-sized diatoms become dominant group and the contribution of non-diatom (especially dinoflagellates) to total species number increased significantly (Jiang et al., 2012; Wang et al., 2013; Luo et al., 2019; Liu et al., 2020). Furthermore, several studies used HPLC-CHEMTAX revealed that smaller phytoplankton groups (pico- or nano-sized), including prasinophytes, cryptophytes, and cyanobacteria, contributed greatly to the total Chl a in QZB (Lan et al., 2011; Lan et al., 2013; Lan et al., 2014; Pan et al., 2022). The feeding pressure on oysters is an important factor in the prevalence of nano- and pico-phytoplankton in QZB (Lan et al., 2011; Lan et al., 2013; Lan et al., 2014; Pan et al., 2022), as shellfish mainly filter larger phytoplankton group (>3 μm) (Ward and Shumway, 2004). We hypothesized that seasonal and spatial changes in phytoplankton biomass and structure in QZB are largely regulated by size-selective grazing of shellfish, nutrients, and temperature, and the long-term size-selective filtration of shellfish may increase the contribution of small-sized phytoplankton groups.
Many previous studies on phytoplankton were based on microscopy examination and small-sized cells were undetected in QZB. However, the studies using HPLC-CHEMTAX to analyze phytoplankton biomass and community in QZB are few (Lan et al., 2011; Lan et al., 2013; Lan et al., 2014), and lack of information on the long-term dynamics of small-sized phytoplankton in this area. To test our hypothesis, we combined microscopic counting (provides information on species and abundance of large cells) and HPLC-CHEMTAX analysis (provides information on classes or phyla and biomass of full-size cells) to investigate the whole phytoplankton community in winter and summer in QZB, and subsequently compared with historical data. Our objectives were: (i) to add to the knowledge on the distribution and structure of phytoplankton community in QZB; (ii) to analyze the leading factors affecting the succession of various phytoplankton groups from summer to winter based on the environmental data; (iii) to explore driving factors of the long-term changes in phytoplankton community structure. Our work is useful to understand the seasonal succession and long-term changes in whole phytoplankton community structure and its controlling factors in this semi-enclosed culture bay of the South China Sea.
2 Materials and methods
2.1 Study area and sampling strategy
QZB (108.45°–18.95°E, 21.50°–21.90°N), a semi-enclosed bay located in the north of the Beibu Gulf, covers an area of 380 km2 and characterized by a southern subtropical oceanic monsoon climate (Jiang et al., 2012). Recent studies had found that the circulation in north of the Beibu Gulf is mainly counterclockwise all year round (Xia et al., 2001; Cao Z et al., 2019; Li et al., 2022), and the water masses were classified into three types, i.e., the bottom mixed shelf water with low temperature and high salinity, the surface mixed shelf water, and the coastal water with low salinity (Cao Z et al., 2019). QZB is affected by the westward coastal current (Chen and Shi, 2019) and the coastal water masses (Cao Z et al., 2019) in the Beibu Gulf both in winter and summer. The tide in QZB belongs to diurnal tide type, and the tidal current is dominated by reciprocating flow. The flood current enters QZB from south to north, and the velocity of flood current is generally smaller than that of ebb current (Dong et al., 2014; Lyu et al., 2021). Tidal current are stronger in summer than in winter in QZB (Dong et al., 2014).The inflow rivers include Maoling River, Qinjiang River, and Jingu River, with average annual runoff of 2.61×10⁹ m3, 2.47×10⁹ m3 (Lyu et al., 2021), and 1.50×10⁸ m3 (Chen et al., 2016), respectively, which bring in large nutrient loads into QZB. Influenced by runoff, tide and wave (Cao X et al., 2019), sea water exchange capacity in the estuary area of Maowei Sea and offshore area is stronger than that in coastal area. There is a large area of shellfish culture (mainly Crassostrea rivularis) in QZB (Lan et al., 2014) (Figure 1).
Two in-bay cruises were conducted at 13 stations in the winter (January 27) and summer (June 23) in 2021. At each sampling station, 2.0-L seawater was collected from near surface (0.5 m in depth) with Niskin bottle, from which 1.0-L seawater was fixed in acidic Lugol’s solution for microscopic identification, and the rest 1.0-L seawater was filtered through GF/F filters (0.7 μm, Whatman). The filters were immediately deep-frozen in liquid nitrogen and maintained at −80°C for HPLC analyses, and 100 mL filtrate was stored at –20°C for nutrient analysis. Hydrographic (water temperature and salinity) measurements were performed using AAQ-RINKO (JFE, Japanese).
2.2 Nutrient analysis
Dissolved reactive phosphate (DRP), dissolved inorganic nitrogen (DIN), and dissolved silicate (DSi) were determined with a SKALAR flow analyzer in methodological standard (Strickland and Parsons, 1972). DIN is to the sum of nitrite (NO2−), nitrate (NO3−), and ammonium (NH4+) contents.
2.3 Microscopical detection of phytoplankton
The samples fixed with Lugol’s solution were concentrated to 5–15 mL via sedimentation, after which the supernatants were discarded. Identification and quantification were conducted under an inverted microscope (Nikon ECLIPSE Ti-S) according to the method of Utermöhl (1958).
2.4 HPLC-pigment analysis
The frozen filters were cut into pieces and then placed in a screw-cap centrifuge tube with 3-5 mL of 95% cold-buffered methanol. The filters were sonicated for 5 min in ice-water bath, and the extracted solution were filtered through PTFE membrane filters (0.2 mm pore size) to remove filter and cell debris. Prior to injection, 200 μL of sample was mixed in 67-μL Milli-Q water in 2.0-mL amber glass sample vials. The procedures of HPLC analyses using an Agilent series 1200 HPLC system fitted with Waters C8 column fully followed the work of Zapata et al. (2000). Standard curves were established using standard pigments from DHI (Institute for Water and Environment, Denmark). The standard pigments included Chl a, chlorophyll b (Chl b), chlorophyll c2 (Chl c2), chlorophyll c3 (Chl c3), divinyl chlorophyll a (divinyl Chl a), fucoxanthin (Fuco), 19′-hex-fucoxanthin (Hex-Fuco), 19′-butfucoxanthin (But-Fuco), 19’-Hexanoyloxy-4-ketofucoxanthin (Hex-kfuco), peridinin (Peri), prasinoxanthin (Pras), alloxanthin (Allo), zeaxanthin (Zea), neoxanthin (Neo), lutein (Lut), diatoxanthin (Diato), diadinoxanthin (Diadino), violaxanthin (Viol), Mg-2,4-divinylpheoporphyrin (MgDVP), pheophorbide a (Pheide a), β,ϵ-Carotene (βϵ-Car) and β, β-Carotene (ββ-Car).
2.5 CHEMTAX analysis
The relative contribution of different phytoplankton groups to the total Chl a biomass was estimated from pigment data using CHEMTAX (version 1.95) (Mackey et al., 1996; Wright et al., 1996; Wright et al., 2009). The input pigment ratios were obtained from Wang et al. (2015) and Mackey et al. (1996). To optimize the input ratios for our data set, a series of 60 derivative pigment ratio matrices were built by multiplying each ratio of the initial matrix using a random function. The best 10% of results were considered as the optimized results. Data from the winter and summer were run separately into 2 bins to consider the potential variations with irradiance and/or nutrient availability in the optimization of CHEMTAX procedures. The initial and final ratios are presented in Table S1. We present the output data as absolute concentrations (μg/L) of Chl a and relative proportions attributed to each phytoplankton group.
2.6 Statistical analysis
To test the significant difference of physical, chemical, and biological variables between the two seasons, Student’s t-test was conducted using the SPSS Statistics (version 23). A redundancy analysis (RDA) was performed using software CANOCO 5 (Lai, 2013) to explore the relationships between the environmental parameters and phytoplankton data. Correlation between phytoplankton cell abundances and CHEMTAX results was evaluated by regression analyses using the Origin 2017 software.
3 Results
3.1 Oceanographic conditions
In winter, the sea surface temperature ranged from 15.41 to 17.69°C, with an average of 16.15°C, and it showed a trend of high in the west and low in the east, with the maximum in the southwest stations (Table 1; Figure 2A). In summer, the surface temperature significantly increased (with an average of 28.07°C), and it decreased in gradient from south to north in the sampling area (Table 1; Figure 2B). Due to the influence of the fresh water input from Qinjiang River, Maoling River, and Jingu River (Figure 1), sea surface salinity decreased from south to north in the study area in the two cruises (Figures 2C, D). The sea surface salinity in summer (with an average of 28.07) was significantly lower than that in winter (with an average of 30.55) (P<0.01; Table 1) because the influence of the runoff was relatively large in summer.
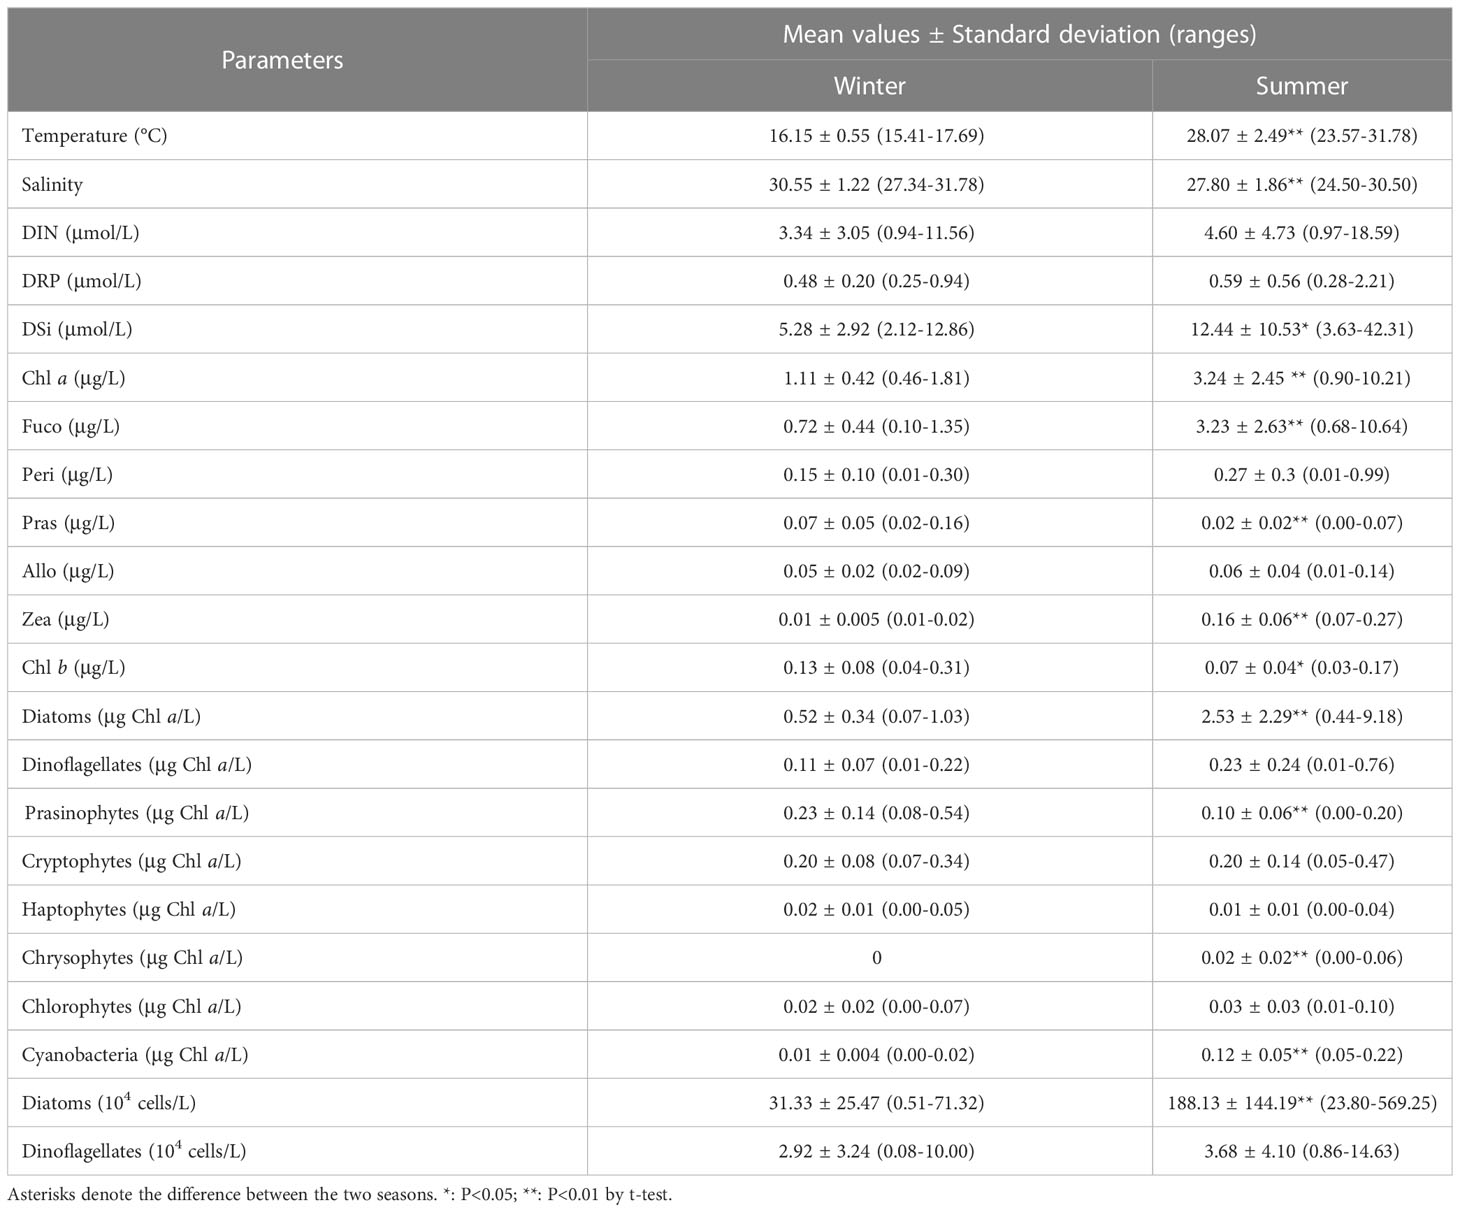
Table 1 Mean values of physical, chemical, and biological variables during winter and summer.
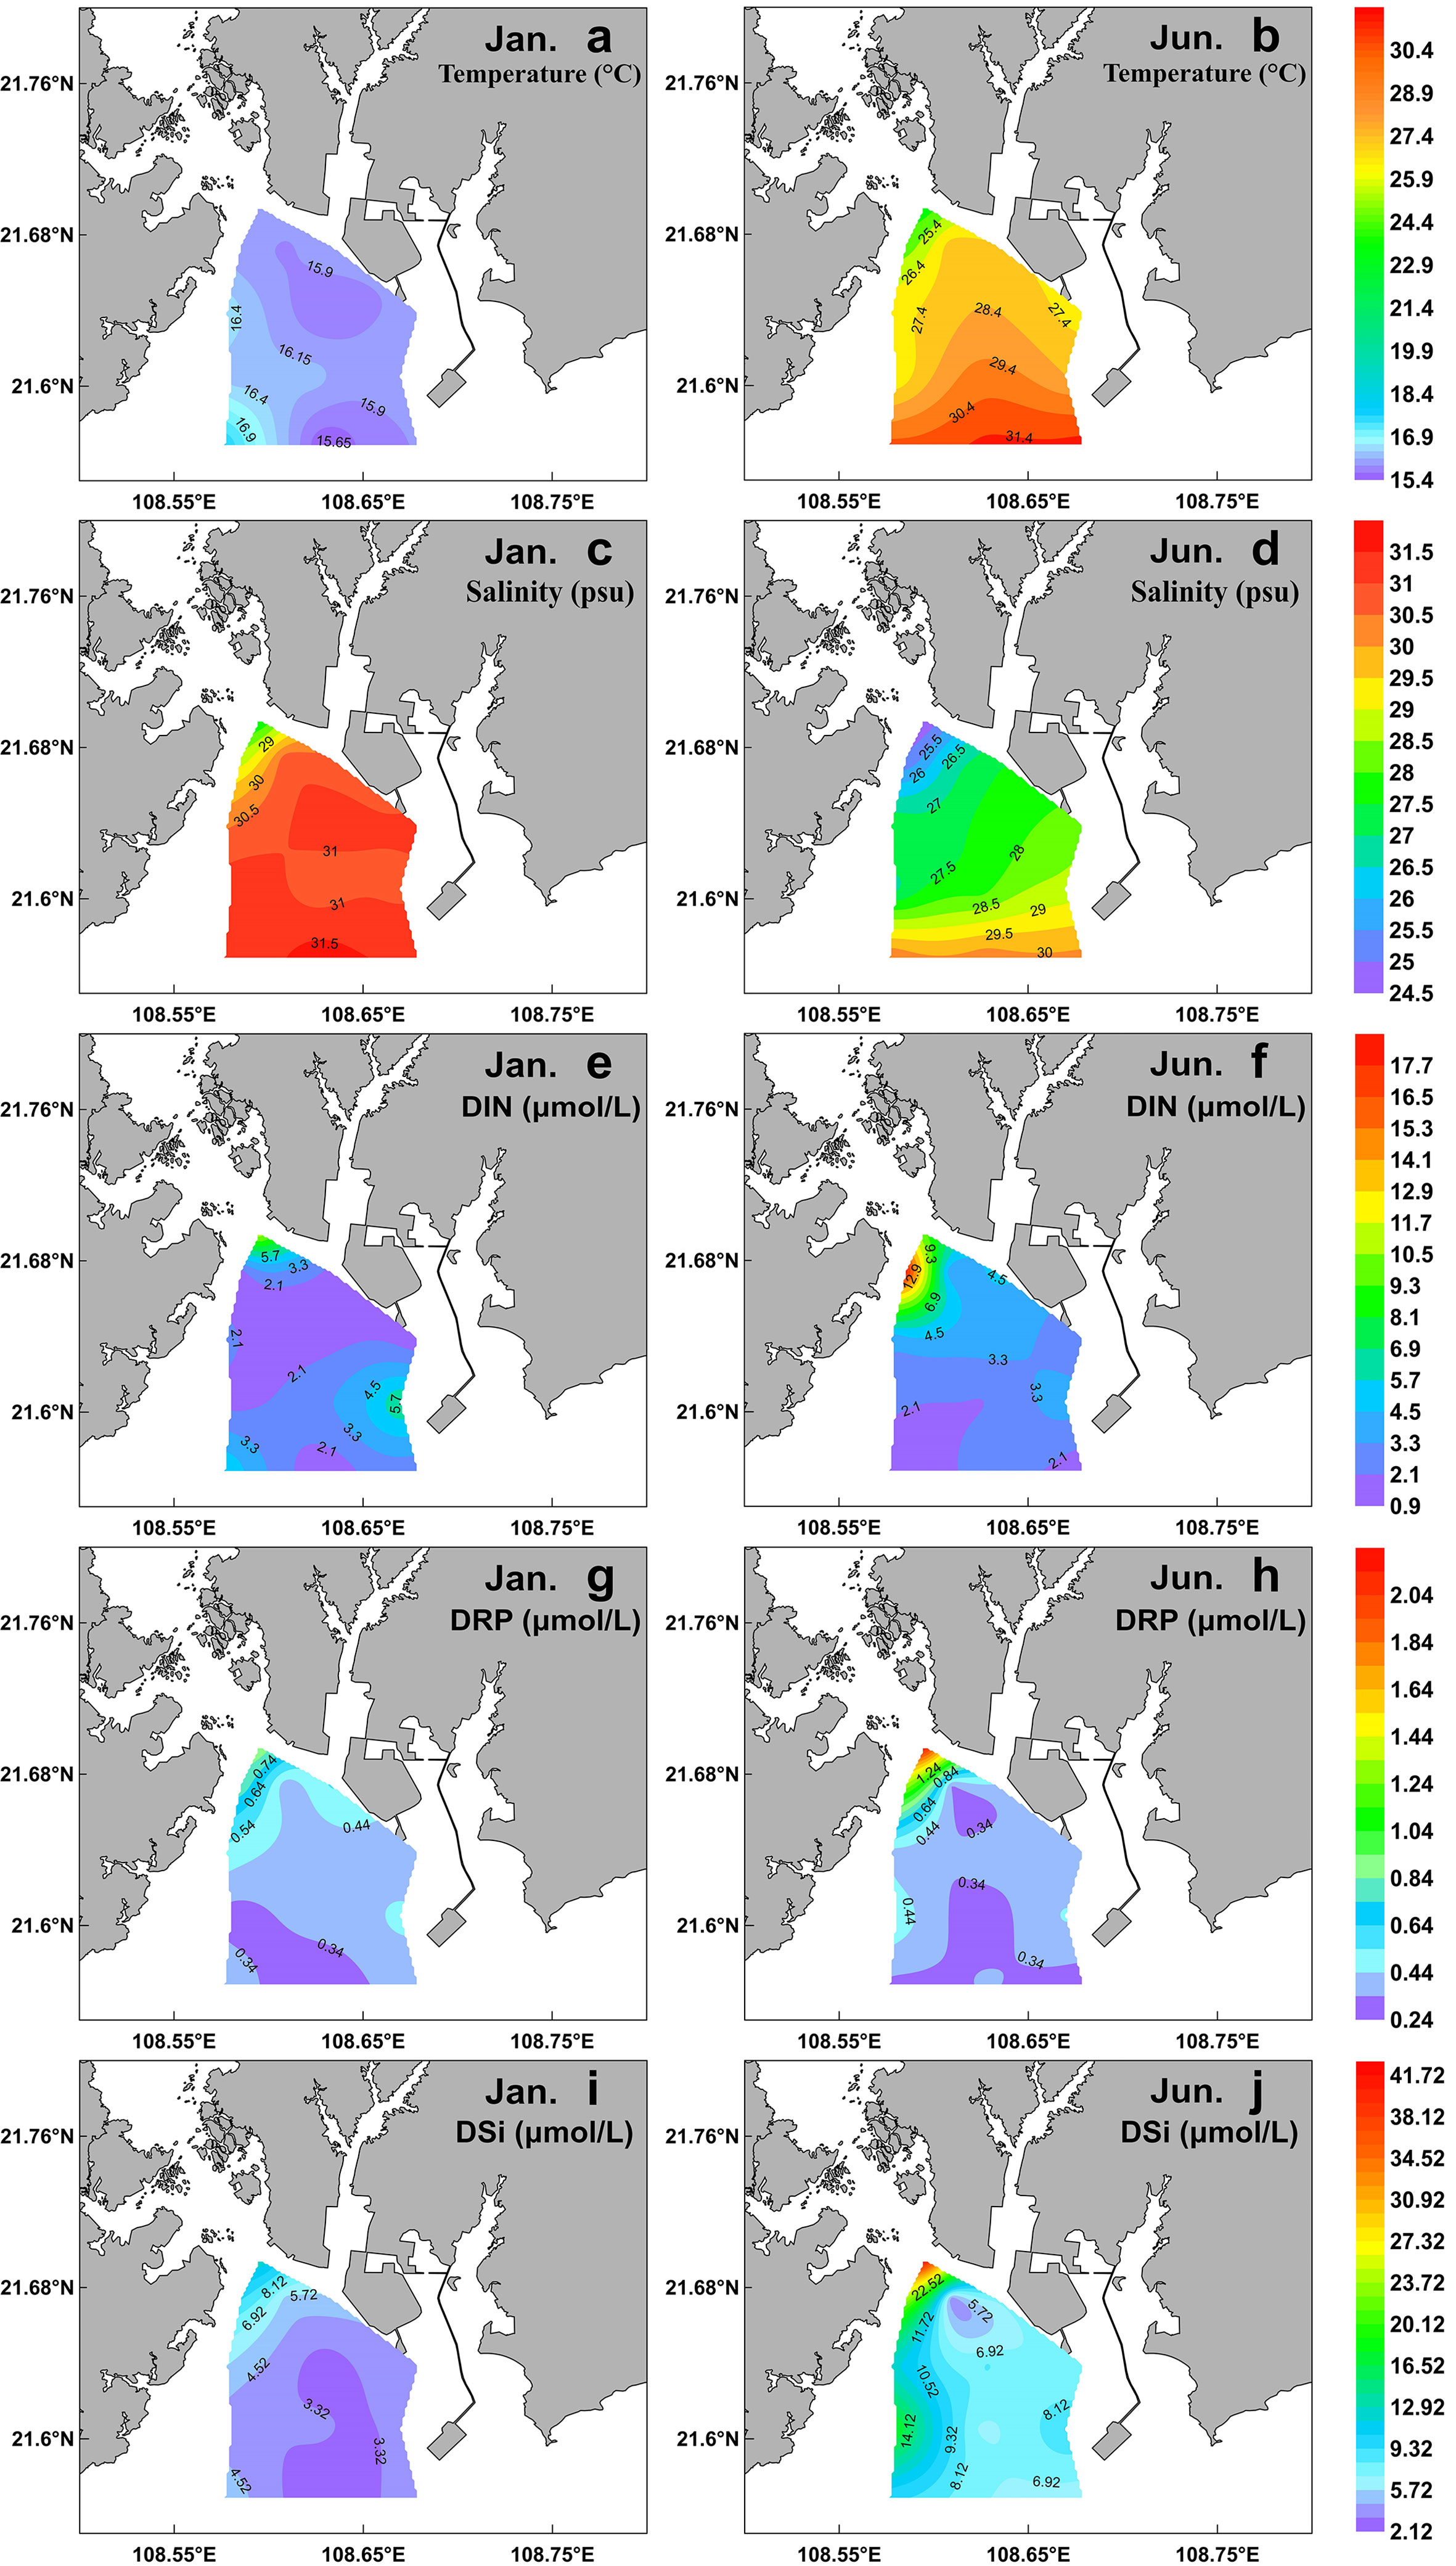
Figure 2 Spatial distribution of surface temperature (A, B), salinity (C, D), DIN (E, F), DRP (G, H), and DSi (I, J) during winter (left) and summer (right) in the QZB.
DIN, DRP, and DSi exhibited a similar distribution pattern that increased northward in the study area in both cruises due to influence of terrigenous input (Figures 2E–J). The highest nutrients concentrations were recorded at the northwest stations during both cruises. Although the nutrients concentrations in summer were higher than those of winter, only the differences of DSi between the two seasons was statistically significant (P<0.05; Table 1).
3.2 Phytoplankton assemblages
3.2.1 HPLC pigments
The spatio-temporal variability of Chl a and generally-used accessory pigment proxies of biomass for diatoms (Fuco), dinoflagellates (Peri), prasinophytes (Pras), cyanophytes (Zea), and cryptophytes (Allo) are showed in Figure 3. Other pigments (e.g. Lut, Hex-Fuco, But-Fuco, etc.) detected in situ at stations were minor and ignorable, and thus were not presented here.
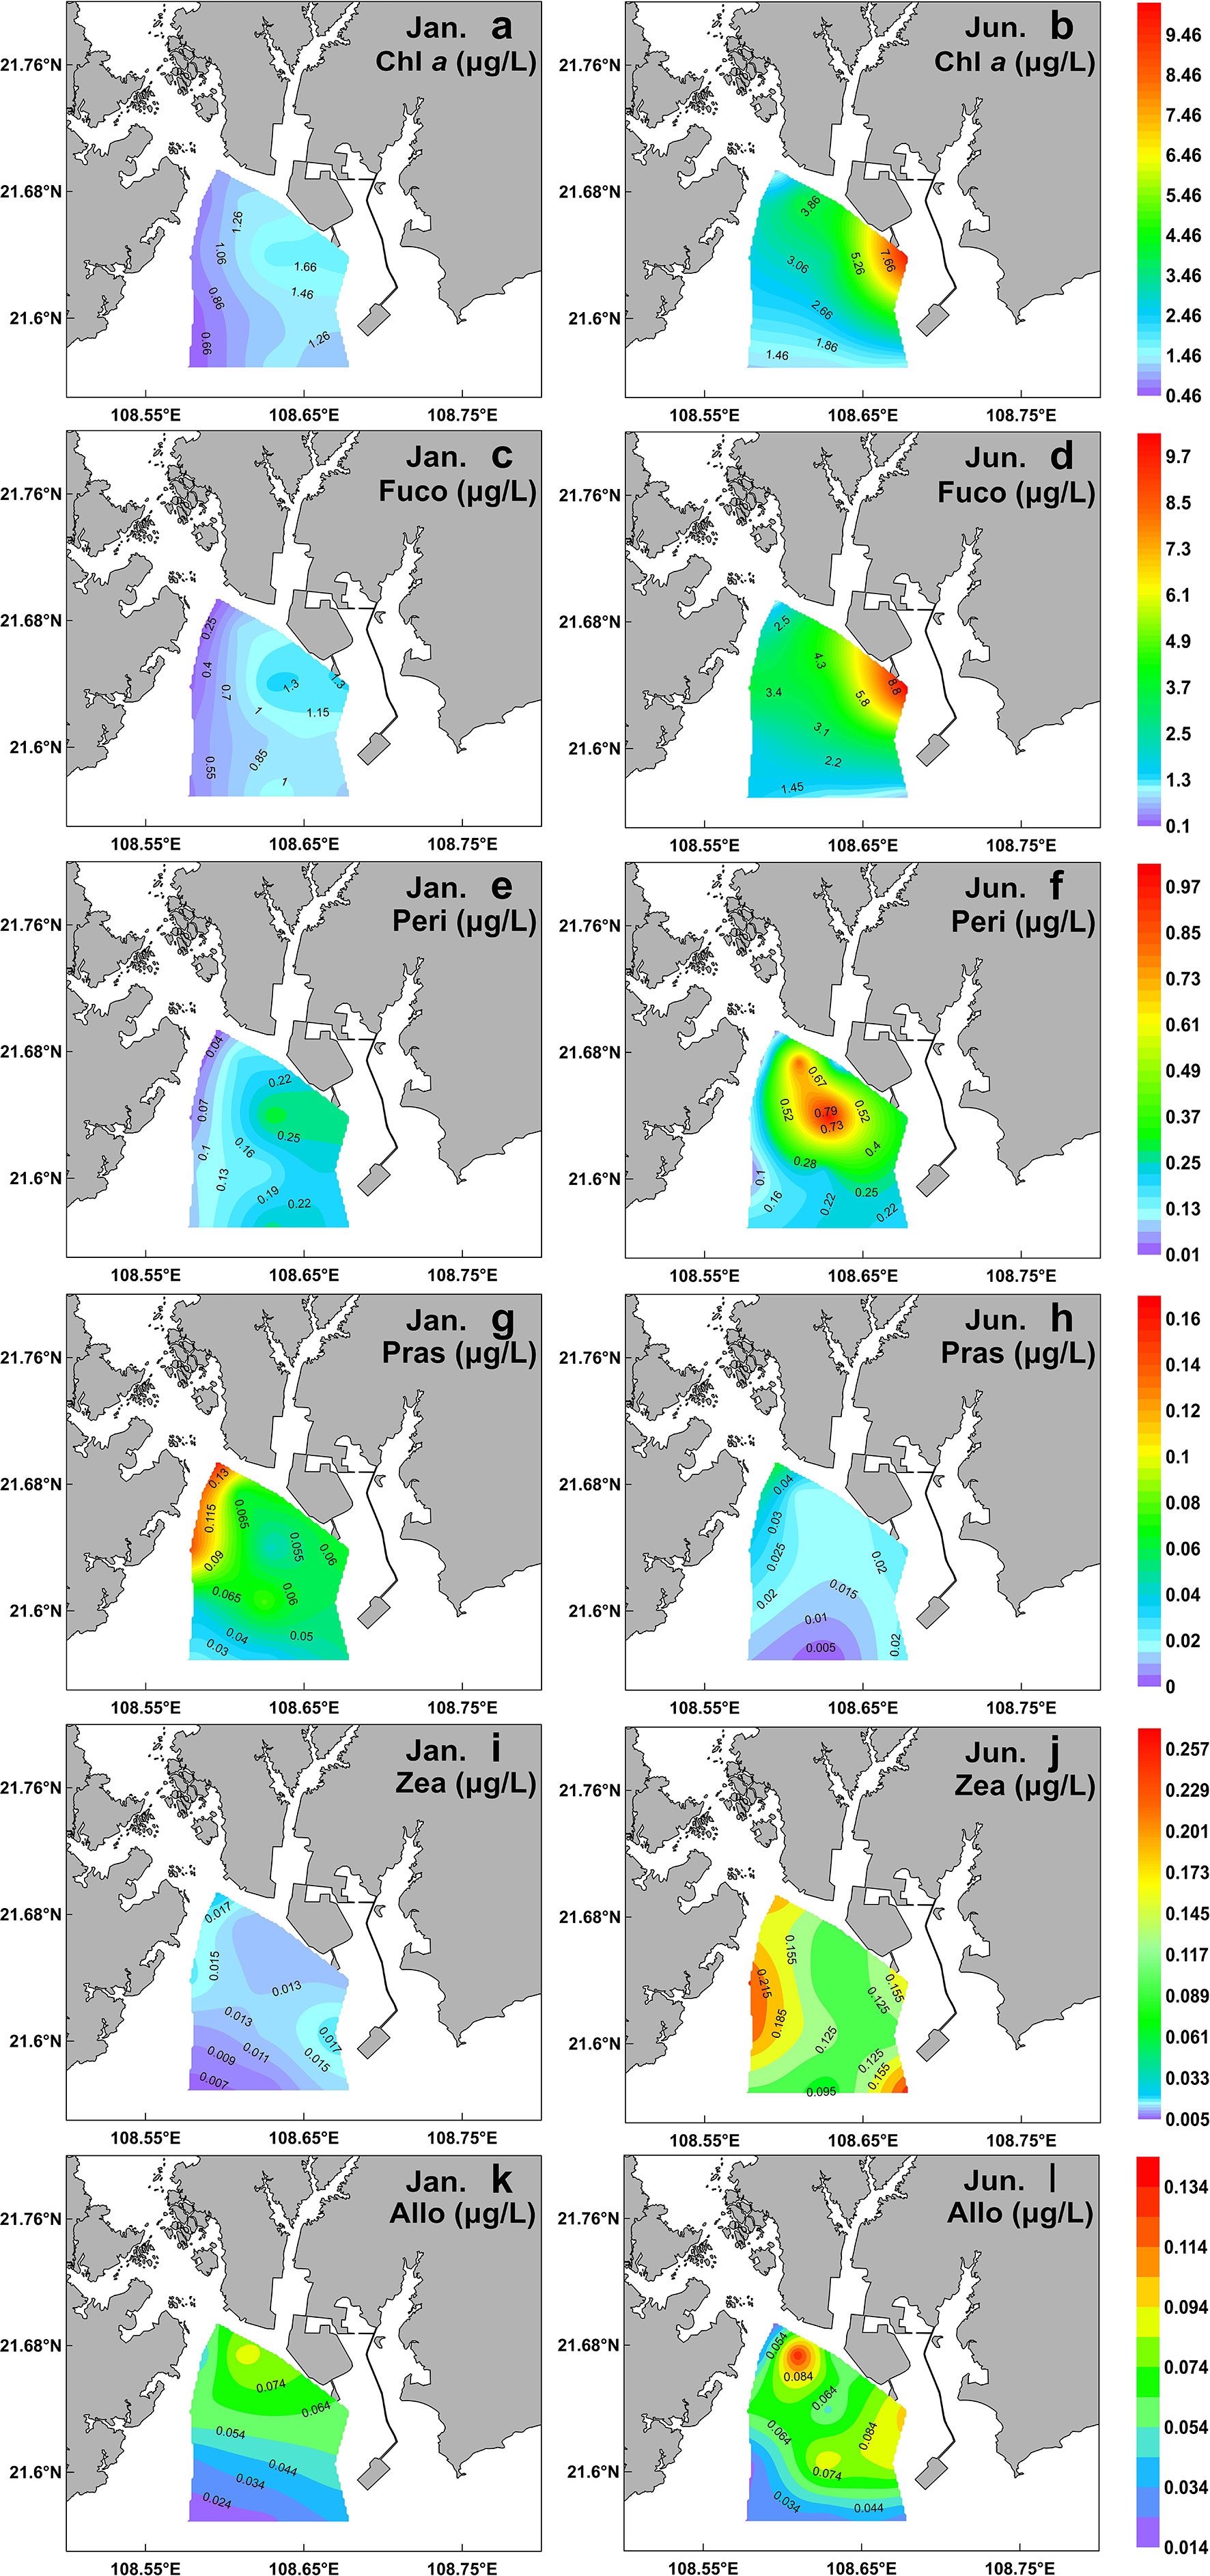
Figure 3 Spatial distribution of main surface pigments during winter (left) and summer (right) in the QZB. Chl a (A, B); Fuco (C, D); Peri (E, F); Pras (G, H); Zea (I, J); Allo (K, L).
A high-Chl a region was noted at the eastern part of the sampling region in a clear gradient of decrease southwestward in the two cruises (Figures 3A, B). Fuco was the dominant accessory pigment at all stations, showing a similar distribution pattern to Chl a (Figures 3C, D). The mean concentrations of Chl a and Fuco in the summer were significantly higher than those in the winter (P<0.01; Table 1). The third accessory pigment was Peri showing no significant seasonal variation (P<0.01; Table 1). The peak Pras level was recorded in the northwest part of QZB, and high-Zea region was noted in the northwestern and southeastern parts of QZB in the two seasons (Figures 3G–J). The mean Pras and Zea concentrations varied significantly between the two seasons (P<0.01; Table 1). Allo presented a peak in the estuaries zone (Figures 3K, L), which was not significantly different between the two cruises (P>0.05; Table 1).
3.2.2 CHEMTAX results
CHEMTAX analysis identified eight major phytoplankton groups (Table 1). Although the relative contribution of the different phytoplankton groups to the total Chl a biomass was variable, diatoms were generally the dominant group (Figure 4). This dominance was accentuated in the summer (Figure 4B). In the winter, on average, the diatoms contributed 43.12% to the total phytoplankton biomass, followed by the prasinophytes (24.18%), cryptophytes (18.54%), and dinoflagellates (9.17%) (Figure 5A). Prasinophytes dominated in the northwest part of the study area (Stations S1, S2, and S5) (Figure 4A). In the summer, a sharp increase was observed in diatom biomass (P<0.01; Table 1), which accounted for up to 72.12% of total biomass (Figure 5A). In contrast, the contributions of prasinophytes and cryptophytes decreased significantly from winter to summer (P<0.01). The dinoflagellates showed similar relative contributions during both cruises (accounting for 9.17% and 8.03% in the winter and summer respectively). The contribution of cyanobacteria increased significantly from 1.21% in the winter to 5.80% in the summer (P<0.01; Figure 5A).
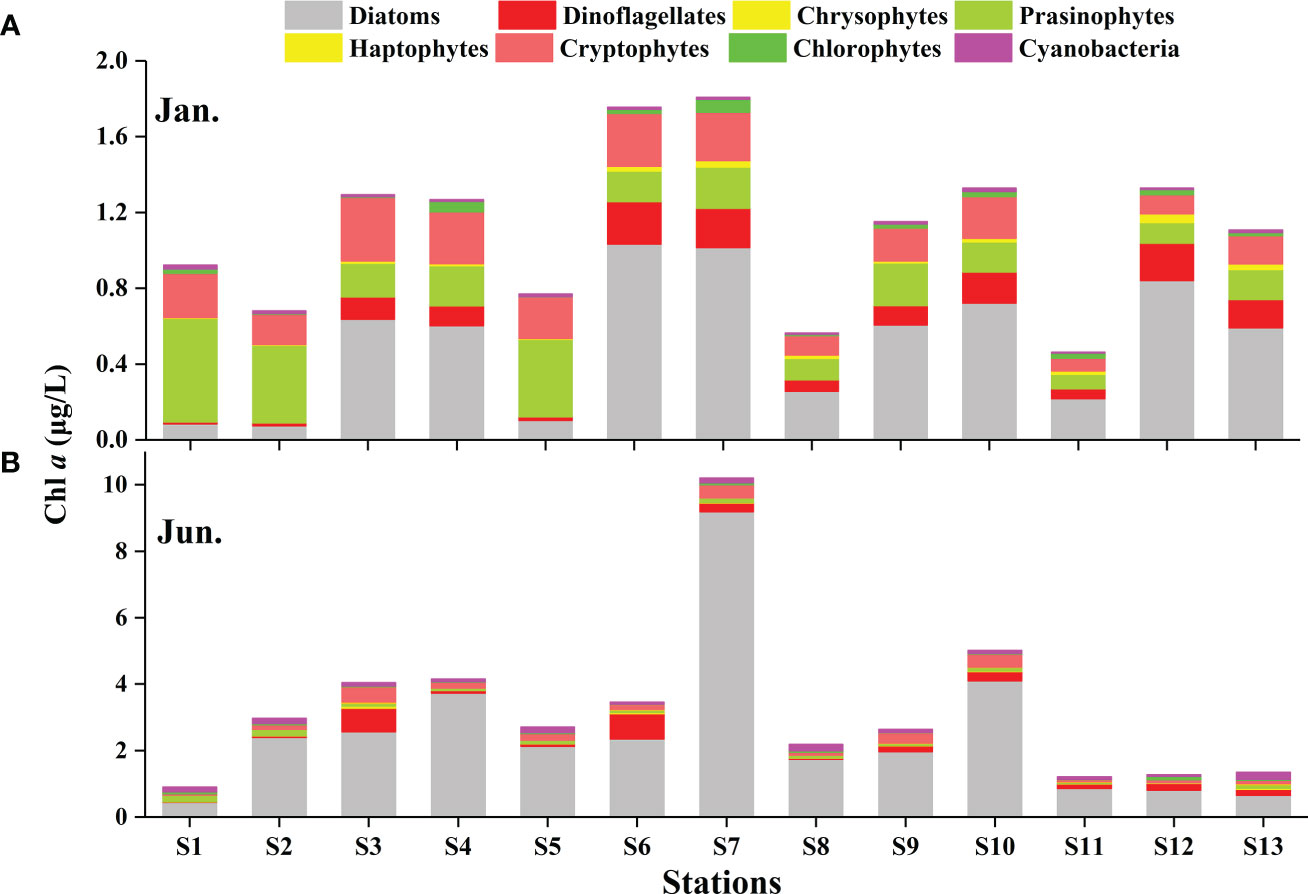
Figure 4 The absolute contributions of eight taxonomic groups to Chl a (obtained by HPLC-CHEMTAX) in the winter (A) and summer (B) in the QZB.
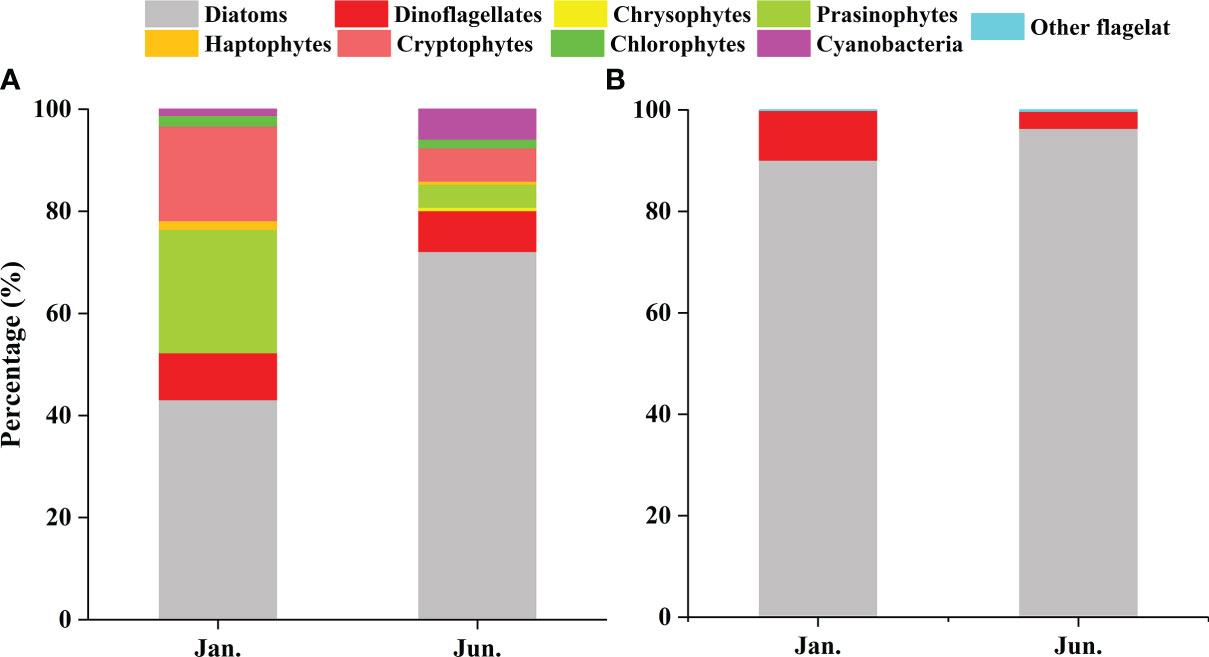
Figure 5 The relative contributions of various taxonomic groups in the QZB: CHEMTAX-derived Chl a (A) and cell abundances (B).
3.2.3 Phytoplankton community: microscope observation
A total of 99 species were identified in both cruises (Table S2), of which 73.7% were diatom species, 22.2% were dinoflagellate species, and 4% were other flagellates. In terms of cell number, diatoms contributed over 90% of total phytoplankton abundance in both the seasons (Figure 5B). Diatoms and dinoflagellates exhibited a similar distribution pattern to those of Fuco and Peri (or to diatoms and dinoflagellates biomass using CHEMTAX) in the two seasons, respectively (Figures 6A–D). In the winter, diatoms were composed mostly of Asterionella glacialis, Rhizosolenia sinensis, Synedra sp., Guinardia delicatula, and Skeletonema costatum (Figure 7A), of which Asterionella glacialis was the most dominant species in the winter and concentrated in the eastern part (Figure 6A). Dinoflagellates were composed mainly of Prorocentrum minimum (Figure 7A), and was abundant in the eastern part of the study area (Figure 6C). In the summer, the first diatoms dominant species of Skeletonema costatum (Figure 7B) concentrated in the eastern part of the study area (Figure 6B), followed by other Chaetoceros minutissismus, Chaetoceros curvisetus, Guinardia delicatula, and Leptocylindrus danicus (Figure 7B). The dinoflagellates peaked in the northern part of the study area (Figure 6D).
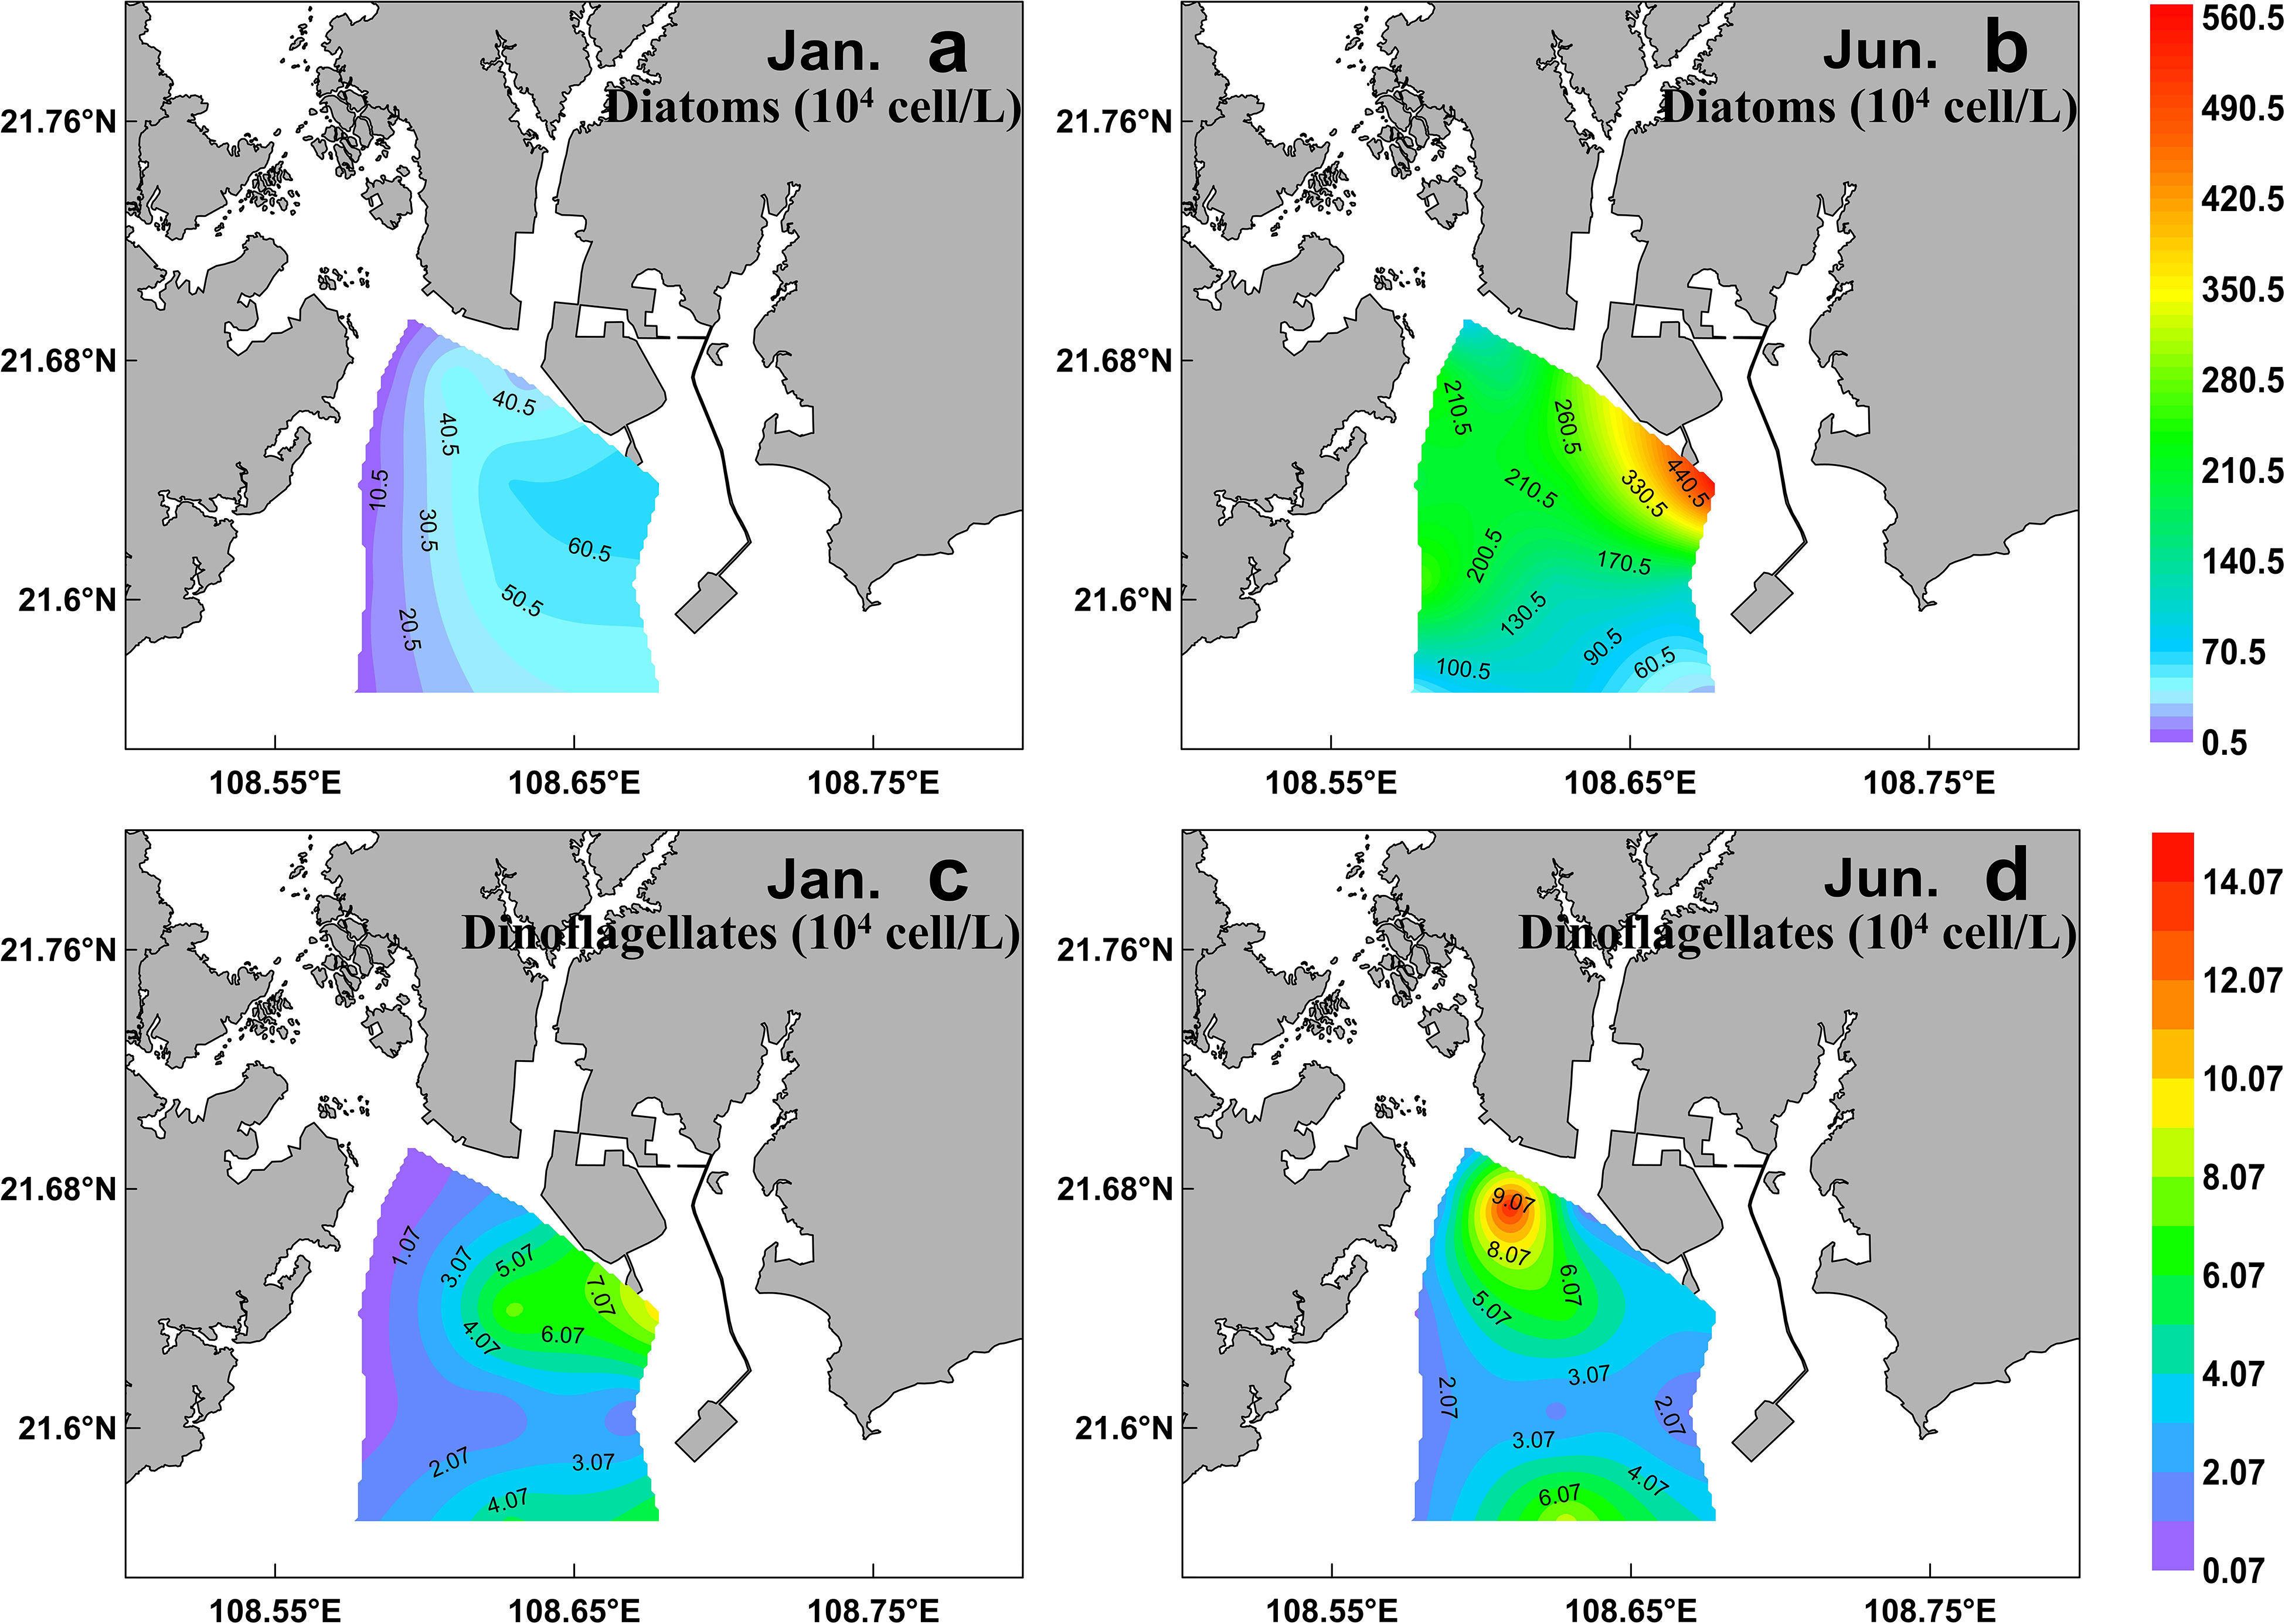
Figure 6 Spatial distribution of cell abundance of diatom (A, B) and dinoflagellates (C, D) (determined by microscope) during winter (right) and summer (left) in the QZB.
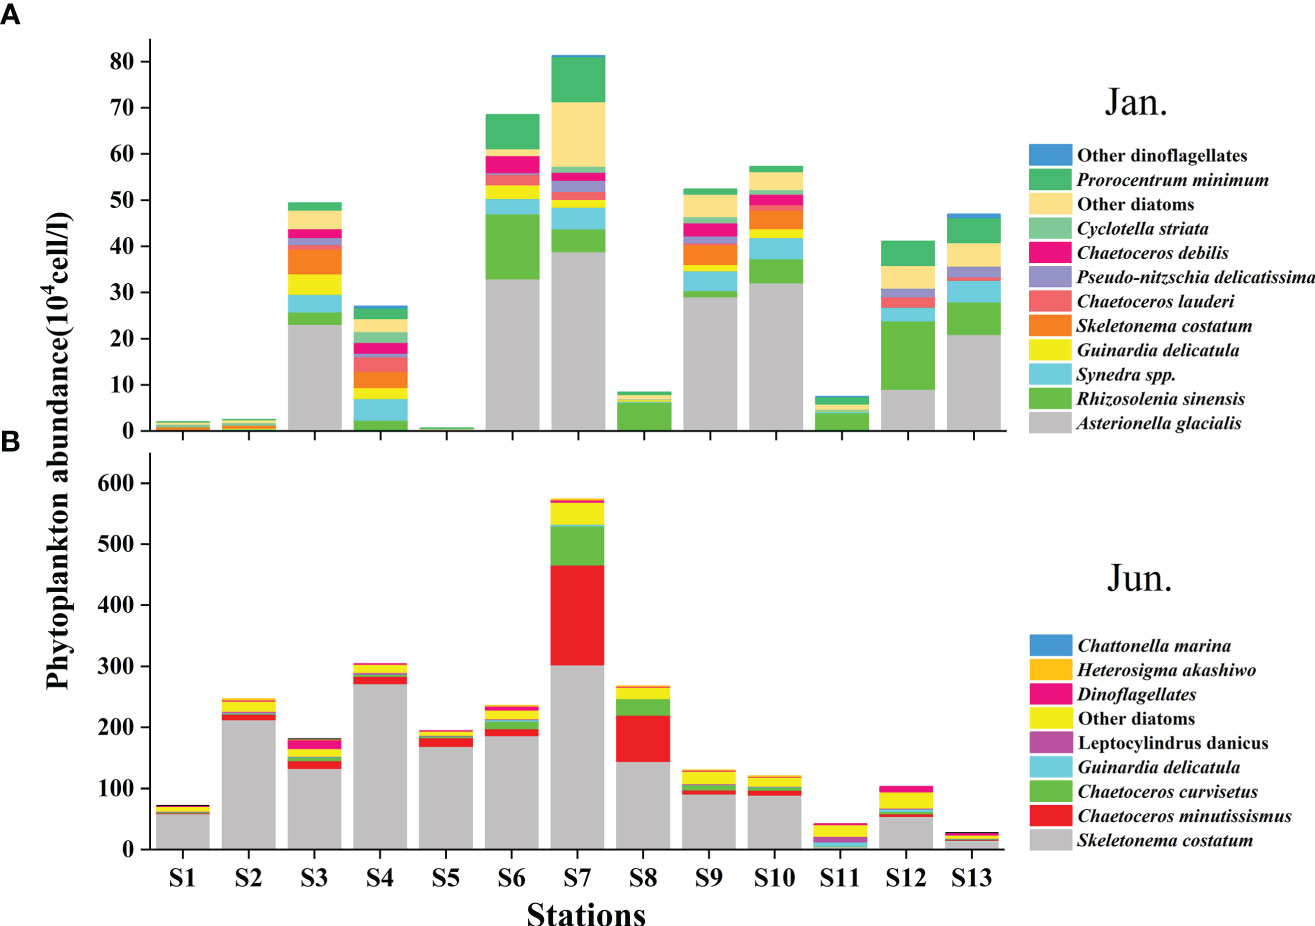
Figure 7 Distribution of main phytoplankton species (determined by microscope) during the winter (A) and summer (B) in the QZB.
The abundance of diatoms increased significantly from the winter to summer (P<0.01; Table 1). The abundance of dinoflagellates was not significantly different between the two seasons (P>0.05; Table 1). A high abundant of diatom was observed in the summer, during which the mean phytoplankton abundance was 191.81×10⁴ cell/L, which was 5.6 times higher than in the winter (Table 1).
3.3 Cell counting vs. CHEMTAX estimates
Good agreement was shown between cell counting (abundance) with microscope and CHEMTAX-derived Chl a for both diatoms and dinoflagellates (P<0.01; Figure 8).
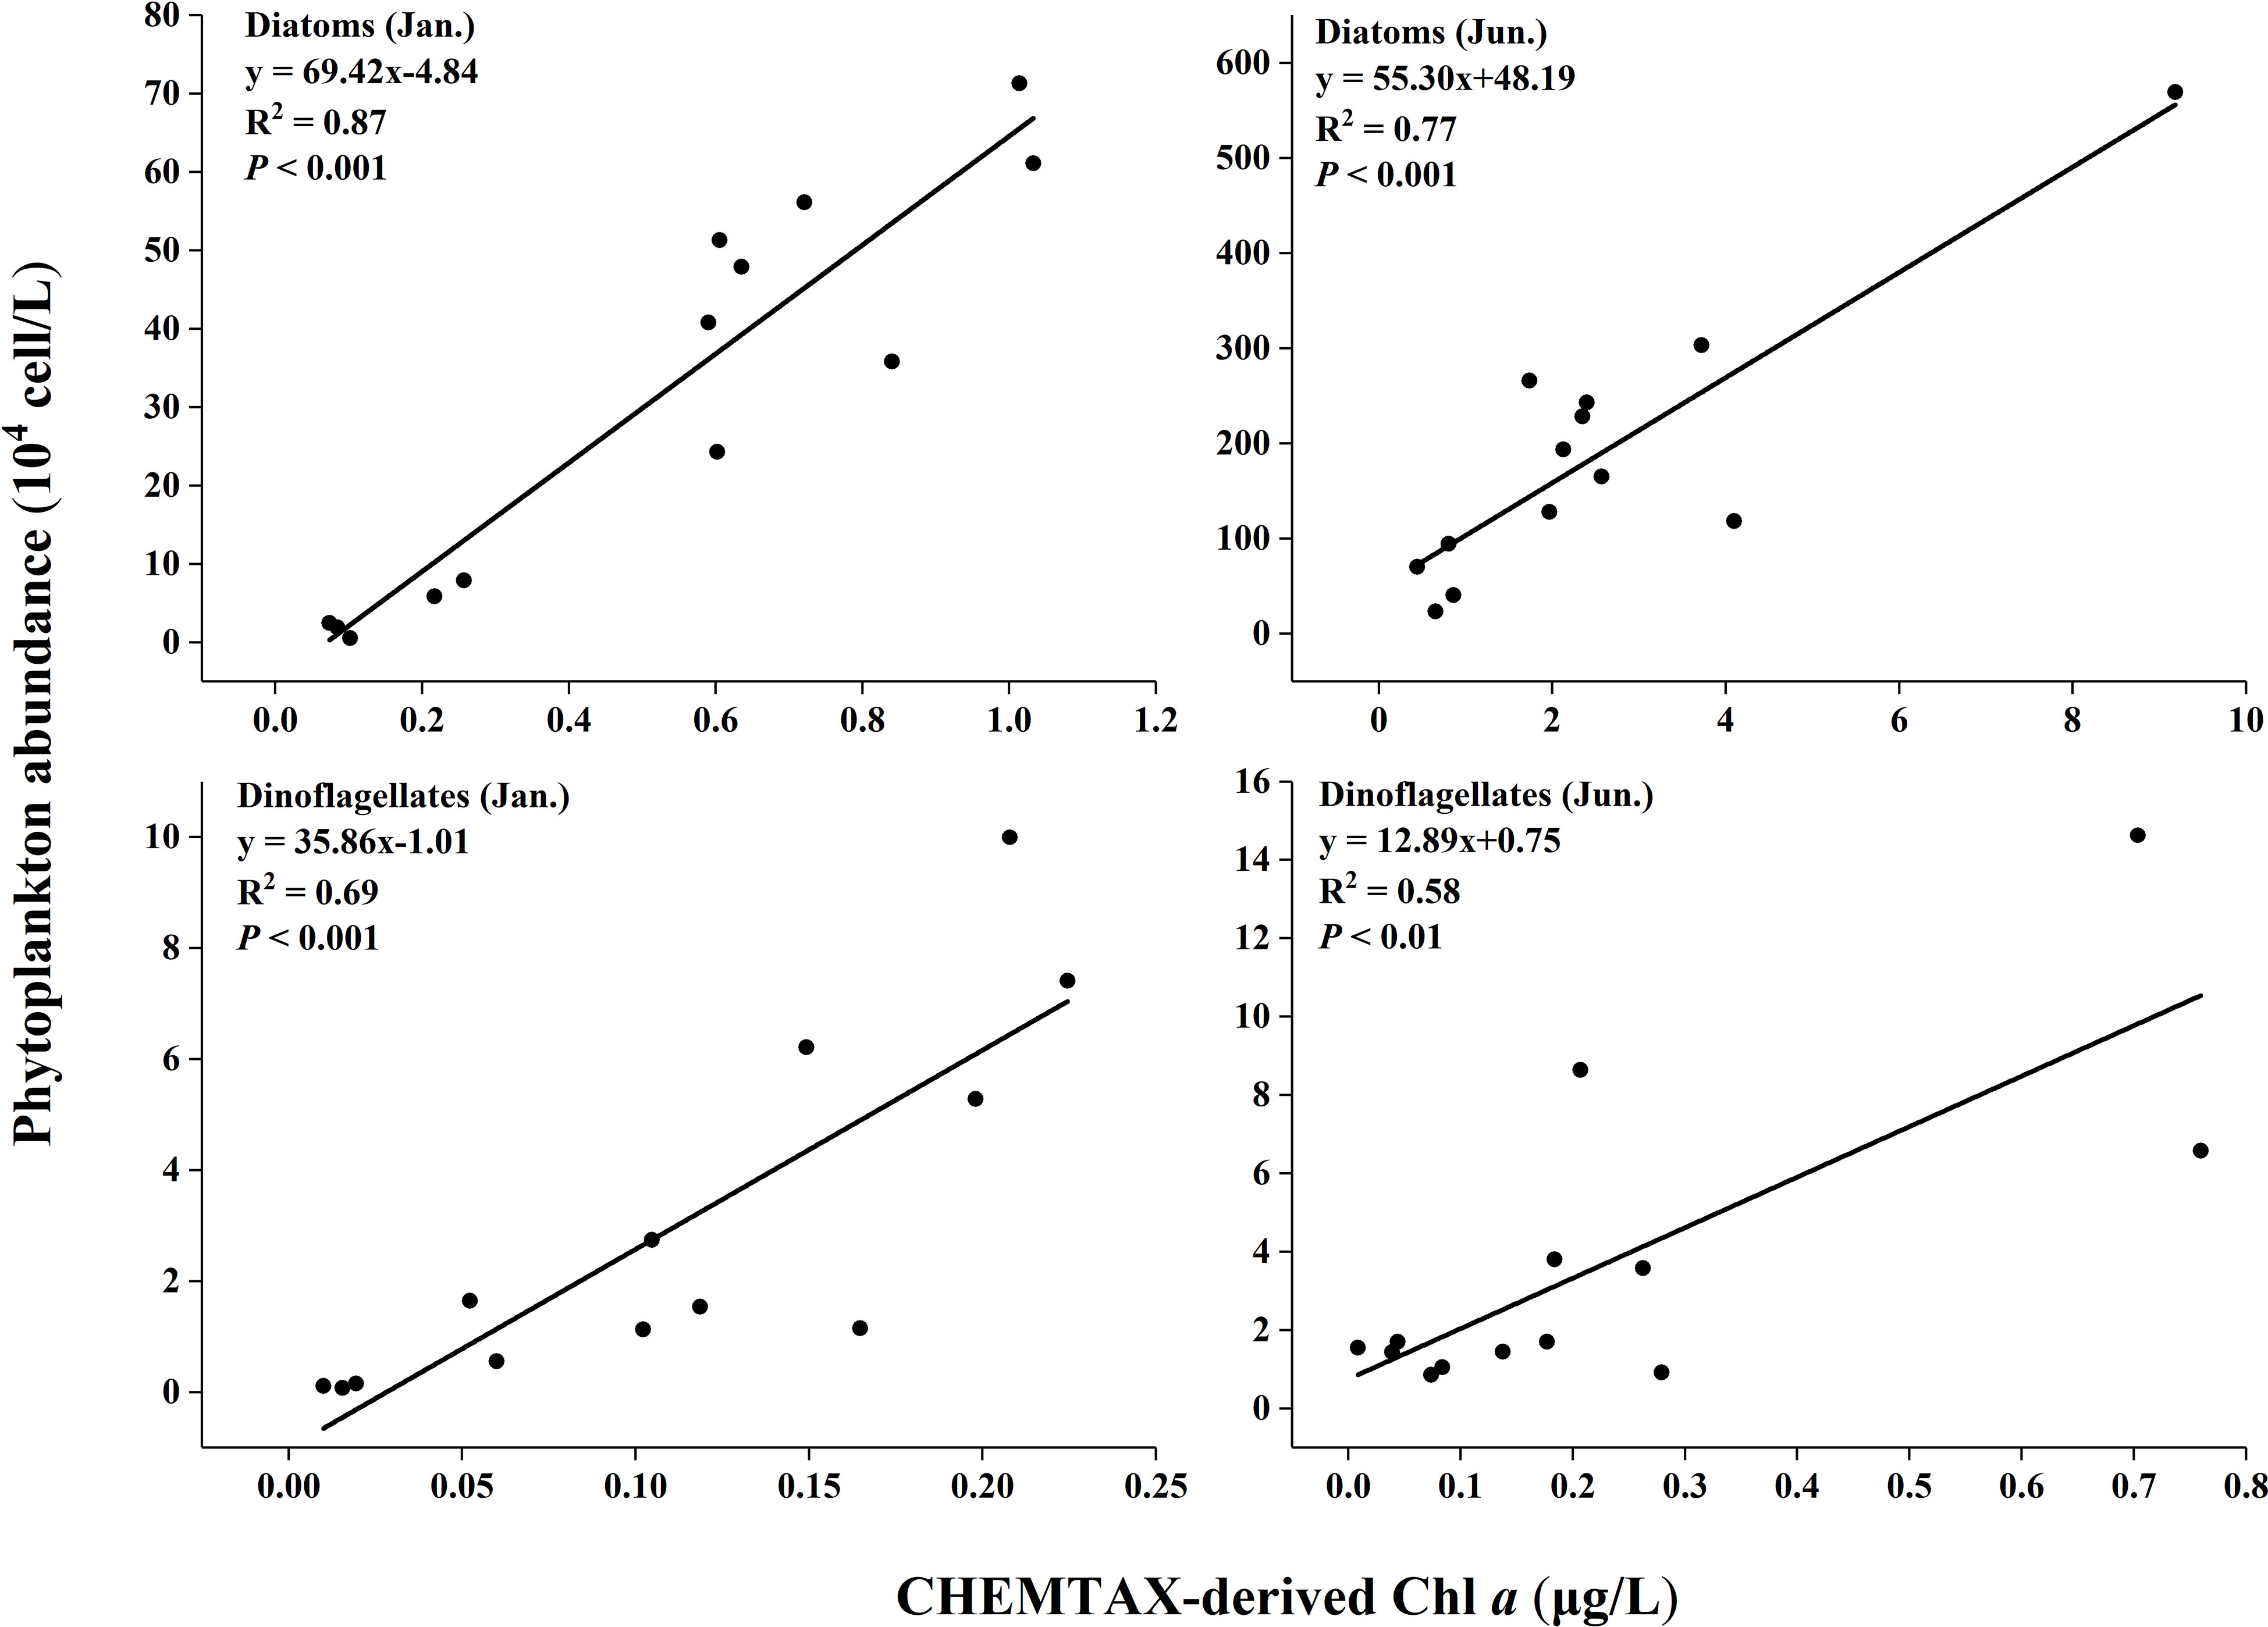
Figure 8 Phytoplankton abundance (determined by microscopic counting) against CHEMTAX-derived Chl a.
All the coefficients of correlation were above 0.55 (e.g. R2 = 0.58 for dinoflagellates in the summer). The highest coefficients were from diatoms in the winter (R2 = 0.87). The coefficients for diatoms were better than dinoflagellates in both seasons.
3.4 Relationships between phytoplankton composition and environmental factors
A redundancy analysis (RDA) was used to investigate the response of the phytoplankton community (the CHEMTAX) to the environmental variables observed in this study (Figure 9). Results of the Monte Carlo test show that five environmental variables explained significantly the variability of phytoplankton data (P<0.01).
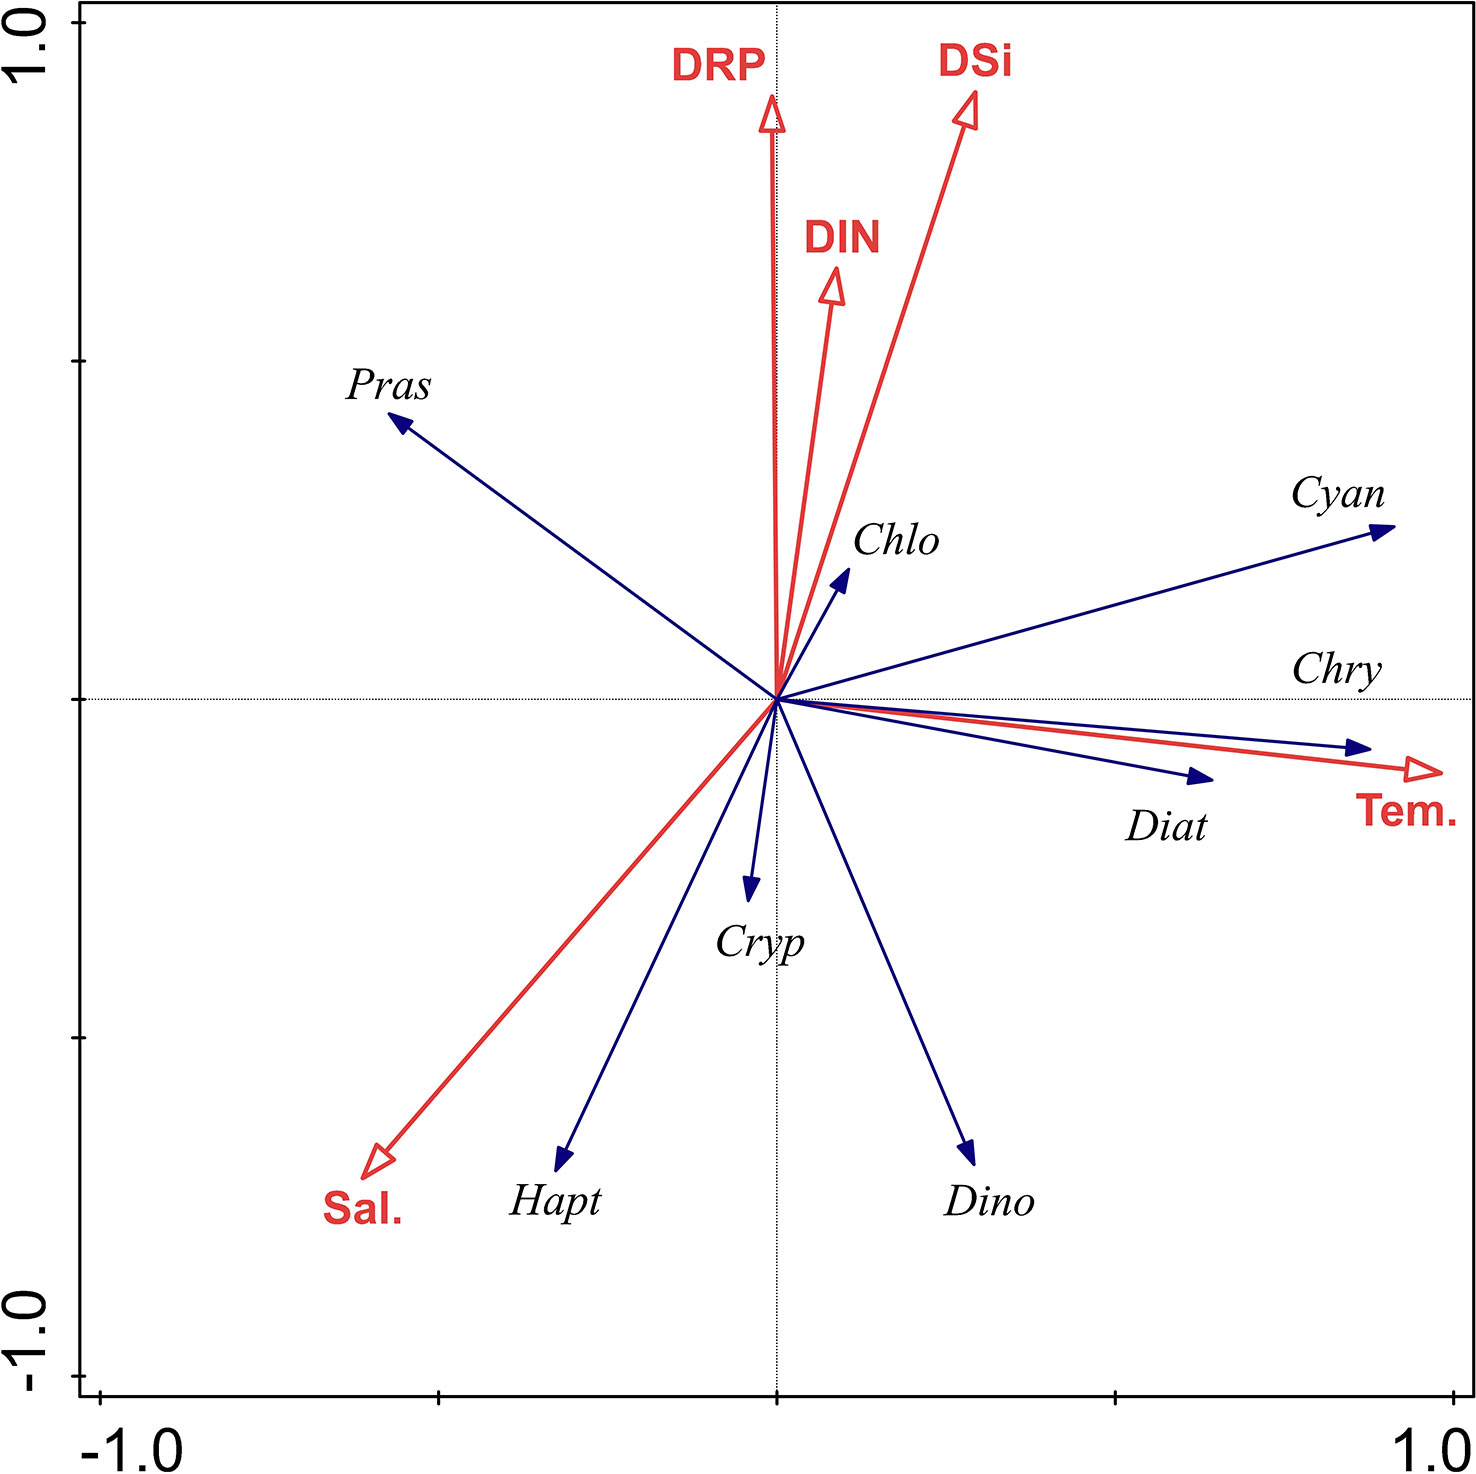
Figure 9 Ordination diagram of redundancy analysis for major environmental parameters and phytoplankton groups in the QZB. Red arrows refer to environmental variables. Sal, salinity; Tem, temperature; DIN: DRP and DSi. Variables used: Diat, diatoms; Cryp, cryptophytes; Pras, prasinophytes; Dino, dinoflagellates; Cyan, cyanobacteria; Chlo, chlorophytes; Hapt, haptophytes; Chry, chrysophytes.
For both the cruises together, the RDA explained 52.9% of the variance associated with the phytoplankton environment relationship. The first canonical axis alone explained 33.71% of the variance. Cyanobacteria, chrysophytes and diatoms correlated positively with temperature. Prasinophytes correlated negatively with temperature. Cryptophytes, haptophytes, and dinoflagellates were strongly associated with lower concentrations of nutrients, and were positively associated with salinity. Chlorophytes biomass increased with nutrients concentrations but decreased with salinity (Figure 9).
4 Discussion
4.1 Phytoplankton community structure as revealed by microscopic methods and CHEMTAX analysis in QZB
Previous investigations on phytoplankton community in QZB using microscopic method showed that diatoms were always the dominant group accounting for over 90% of the total abundance, except during Phaeocystis globosa bloom (Jiang et al., 2012; Wang et al., 2013; Luo et al., 2019; Liu et al., 2020). In our study, based on microscopic examination, similar high contribution rate of diatoms for abundances was observed in both the seasons, followed by dinoflagellates (Figure 5B). However, CHEMTAX estimates found that diatom was the most advantageous group during the investigation, but its importance decreased in winter (Figures 4, 5A). Compared to microscopic method, CHEMTAX estimates recognized the important contribution of small-sized flagellates and cyanobacteria to the total phytoplankton biomass, especially during winter period (Figure 5). In fact, due to the limitation of microscopic method, pico- and nano-phytoplankton could not be completely identified for a long time, and it was not until the application of CHEMTAX estimates found that prasinophytes and cyanobacteria had ubiquitous distribution in QZB (Lan et al., 2011; Lan et al., 2013; Lan et al., 2014). A study conducted on January 13, 2021 showed that cryptophytes had the secondly higher contribution (20.25%) to the total biomass in QZB (Pan et al., 2022). Given that the small-sized phytoplankton is responsible for the recycling of the organic matter within the euphotic layer (Seoane et al., 2011) and the partitioning between pico-phytoplankton and larger cells affects the pathway of material transfer to higher trophic levels (Vaquer et al., 1996), we support the use of CHEMTAX as a suitable tool to assess the long-term changes of these small-sized groups in QZB.
Former investigations performed in different seas suggested that the Chl a allocation to certain algal groups (e.g., diatoms and dinoflagellates) by CHEMTAX are consistent with those of microscopy (Agirbas et al., 2015; Brito et al., 2015b; Wang et al., 2018). In this study, the correlation between algal cell abundance and CHEMTAX biomass was significant for diatoms and dinoflagellates in both cruises (Figure 8). CHEMTAX estimates is an essential method to identify fragile or small cells (such as prasinophytes, cryptophytes, and cyanobacteria) that would be neglected by microscopic method as shown in Figure 5. Nevertheless, CHEMTAX estimates blind analyses may produce a distorted picture of phytoplankton communities. Irigoien et al. (2004) reported that the dinoflagellates bloom in summer and the haptophytes bloom in spring were interpreted as being composed of diatoms due to the high concentration of fucoxanthin. Furthermore, dinoflagellates might not contain Peri because they are often heterotrophic in summer (Xu et al., 2017). Therefore, it is necessary to understand the species level by microscopic analysis before applying CHEMTAX estimates. In this study, CHEMTAX estimates provided a clear picture of the whole phytoplankton community, especially that of small-sized organisms, whereas microscopy presented accurate taxonomical information (of species or genus) of large-sized phytoplankton, such as diatoms and dinoflagellates.
4.2 Phytoplankton groups response to environmental factors
The distributions of physical indicators and nutrients demonstrate that, as a typical estuarine bay, the QZB is vulnerable to terrigenous input and anthropogenic activity whether in dry or wet season (Figure 2). The nutrient concentration in summer is usually much higher than that in winter as terrigenous input spikes in summer. Therefore, phytoplankton biomass is generally greater in summer than in winter in the QZB (Wei and He, 2008; Lai et al., 2013; Wang et al., 2013), the similar seasonal changes in phytoplankton biomass were also revealed by this study (Figure 4, 7). The high biomass of diatoms (Figure 6B) was associated with the bloom of Skeletonema costatum in summer (Figure 7B). As a common bloom species in QZB, Skeletonema costatum prefer to a warm environment (Chin et al., 1965; Brito et al., 2015b), and usually prevails in summer (Jiang et al., 2012; Wang et al., 2013; Luo et al., 2019; Liu et al., 2020). Temperature played an important role in the variation of diatoms from winter to summer as revealed by RDA (Figure 9). Moreover, diatoms are opportunistic organisms and often show a quick response to nutrient enrichments (Barlow et al., 2004), the DSi in surface seawater replenished by summer runoff may be one of the reasons for the abundant growth of Skeletonema costatum (Table 1; Figure 7B) (Brito et al., 2015b). Although the differences of DIN and DRP between the two seasons were not statistically significant (P>0.05; Table 1), it is important to keep in mind that phytoplankton response may be delayed for certain days, when a high abundance of phytoplankton was observed, the nutrients had already been depleted by cells (Davidson et al., 1992; Davidson et al., 1993; Brito et al., 2015b).
Prasinophytes, a group common in temperate and cold waters (Not et al., 2004), were highly abundant during winter in this study (Figures 4A, 5A). The RDA analysis presenting a negative correlation between prasinophytes and temperature, indicateing temperature is one of the main factors affecting the seasonal distribution of prasinophytes (Figure 9). In spatial distribution, prasinophytes concentrated in the oyster culture area in both the seasons (Figures 3G, H). Shellfish preferentially filter larger cells (>3μm) (Ward and Shumway, 2004), thus encouraging the development of the small-size phytoplankton (such as prasinophytes) in shellfish culture area (Dupuy et al., 2000; Jiang et al., 2019; Jiang et al., 2019a). Pico-phytoplankton constitutes an important abundant component of the phytoplankton community in other shellfish aquaculture areas in the world (Safi and Gibbs, 2003; Cranford et al., 2008), which is also mainly ascribed to size-selective grazing of shellfish. Lan et al. (2013); Lan et al. (2014) reported that prasinophytes were mainly distributed in oyster culture area during cold seasons. In this study, prasinophytes dominated in oyster culture area (Stations S1, S2, and S5) during winter, where the biomass of larger-size diatoms was very low under the feeding pressure on oyster (Figure 4A). To summarize, oyster aquaculture could stimulate prasinophyte growth, and the seasonal variations are mainly controlled by the water temperature in QZB as shown in the two cruises, which consistent with the results of Jiang et al. (2016).
As a mixotrophic organism, cryptophytes can obtain nutrition through photosynthesis and phagocytosis, especially during the periods of low nutrient concentrations (Lee, 2008). In general, cryptophytes respond to the input of freshwater (Mendes et al., 2013; Brito et al., 2015a) rather than to nutrient enrichment (Balode et al., 1998; Arhonditsis et al., 2007; Mendes et al., 2013). High abundances of cryptophytes were revealed in the Jingu River estuary in both seasons (Figures 3K, L, 4A). Moreover, cryptophytes are an important phytoplankton group in China’s coastal waters, such as Jiaozhou Bay (Peng et al., 2010) and Daya Bay (Wang et al., 2018).
The previous study shows that Synechococcus and Prochlorococcus were common groups of cyanobacteria in the Beibu Gulf (Zhao et al., 2019). In this study, the abundance of cyanobacteria was related to the abundance of Synechococcus because divinyl Chl a, the exclusive marker pigment of Prochlorococcus, was not detected. Although cyanobacteria (mainly Synechococcus) were a minority group in terms of average contribution to total Chl a, they exhibited strong seasonal fluctuation that thriving in summer and declining in winter (Figures 3I, J, 4). It is known that cyanobacteria are thermophilic (Seoane et al., 2011), and the optimum water temperature range for Synechococcus is 27–30°C (Rajaneesh and Mitbavkar, 2013), which is close to the summer water temperature in QZB (Figure 2B). This finding gains support from the RDA analysis presenting a positive correlation between temperature and cyanobacteria (Figure 9).
Nuclear power plant located in the west coast of QZB (Figure 1). According to the horizontal distribution of temperature, the southwestern part of the study area was more affected by the thermal effluent of the nuclear power plant in winter than in summer (Figures 2A, B), which may be related to the strong water exchange capacity during summer in QZB (Dong et al., 2014). Jiang et al. (2019) reported that the thermal discharge from power plants stimulated phytoplankton growth in Xiangshan Bay, China, particularly in cold seasons. However, Pan et al. (2022) found that Chl a concentrations were lower in the areas affected by thermal discharge, similar to the results of this study. It is noteworthy that, in addition to thermal pollution, the residual chlorine of the thermal effluent also affects phytoplankton growth (Jiang et al., 2008). Therefore, further attention should be paid to research the response of phytoplankton community structure and biomass to thermal discharge from nuclear power plant in QZB and its mechanism.
4.3 The long-term change in phytoplankton composition and driving factors
The contribution of diatoms to total species number decreased from 90.2% in 1984-1985 (Chen, 1989) to 67.1% in 2014 (annual average), and the proportion of dinoflagellates increased to 28.8% in the same period, so did other groups including haptophytes, chrysophytes, and cyanobacteria etc. (Jiang et al., 2012; Wang et al., 2013; Luo et al., 2019; Liu et al., 2020). On the other hand, the dominant species of phytoplankton in QZB were relatively monotonous, and large-size Rhizosolenia spp. were the absolutely dominant species during 1984-1985 (Liu et al., 2020). However, small-sized diatoms, dinoflagellates, and haptophytes gradually were added to the list of dominant species over the last decade (Jiang et al., 2012; Wang et al., 2013; Luo et al., 2019) (Table 2). Our research shows a similar phenomenon that the contribution of dinoflagellates to total species number were 22.2%, small-sized diatoms (Skeletonema costatum) and dinoflagellates (Prorocentrum minimum) became dominant species (Figure 7). Furthermore, we found that prasinophytes and cryptophytes acted alternatively as the second dominant group during cold season in QZB, and the proportion of small-sized flagellates has been increased since 2010 (excluding data from the Maowei Sea), especially cryptophytes (Table 3). In addition, a study on size-fractionated Chl a showed that pico- and nano-phytoplankton were major contributors to Chl a in QZB (Mo et al., 2017). These studies suggest that the phytoplankton community of the QZB was developing towards diversification and miniaturization.
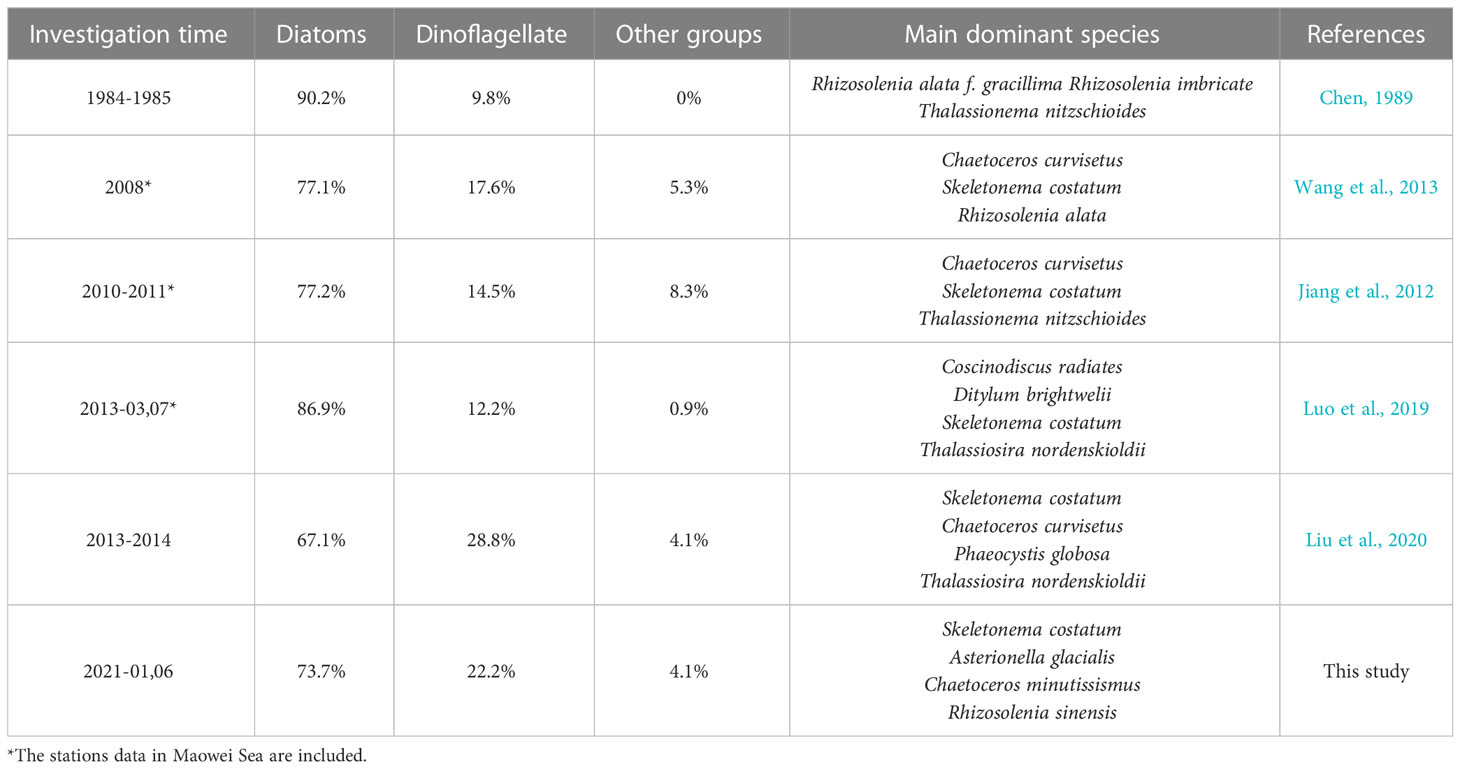
Table 2 Long-term variation in dominant species and various taxonomic groups contribution (%) to total species number in QZB.
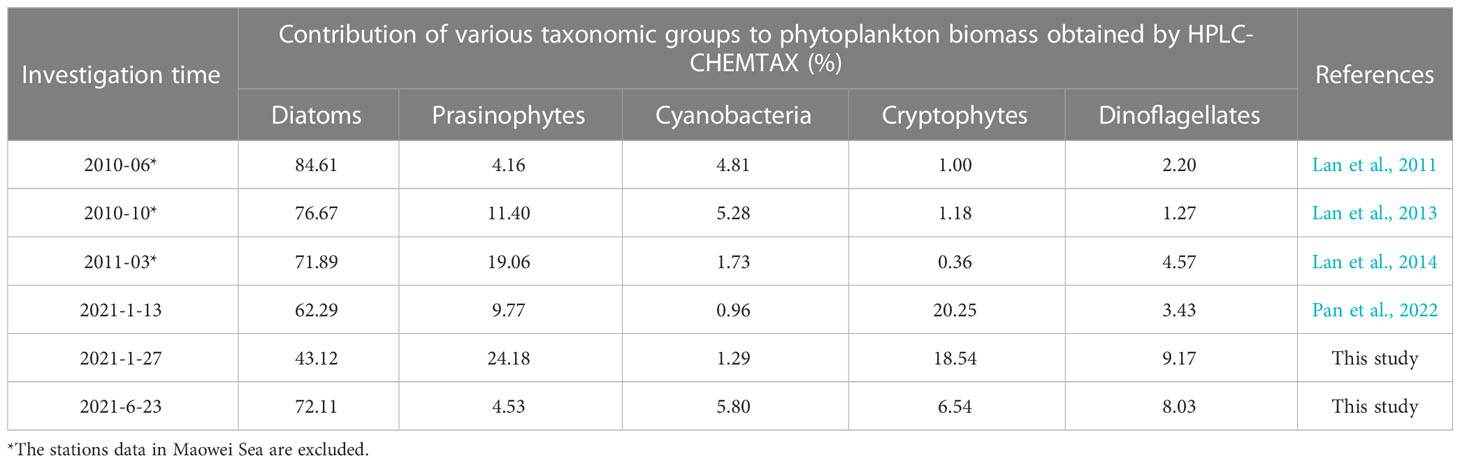
Table 3 Long-term variation in various taxonomic groups contribution (%) to phytoplankton biomass in the QZB.
The eutrophication of QZB (Wei et al., 2002; Lan, 2012; Yang et al., 2012; Lai et al., 2013) played an important role in the changes of phytoplankton class structure. Generally, increased nitrogen and phosphorus in the areas of eutrophication often leads to excessive phytoplankton growth, however, diatoms require silica for their shells in addition to these nutrients. For this reason, non-diatom phytoplankton groups increase in species number and biomass in eutrophic waters; for example, the species number of dinoflagellates were obviously dominant compared to diatoms in the south-eastern Black Sea (Agirbas et al., 2015) and the phytoplankton community changed from the diatoms dominance to co-dominance of diatoms and dinoflagellates in the Bohai Sea (Pan et al., 2020). According to the statistics, several bloom of haptophytes (Phaeocystis globosa) and dinoflagellates (e.g. Noctiluca scintillans, Gymnodinium sanguineum, and Gymnodinium catenatum and so on) occurred in QZB over the past decade (Qin et al., 2016; Shen et al., 2018; Liu et al., 2020; Su et al., 2022).
Variation in phytoplankton size scaling usually related to temperature and nutrients (Jiang et al., 2019b). It is widely recognized that small-sized phytoplankton have been considered an indicator to stressful environments, they tend to dominate in oligotrophic sea area because of its large relative surface area and high utilization rate of nutrients (Sabetta et al., 2008), whereas large-celled phytoplankton benefit from a eutrophic environment (González-García et al., 2018). However, in this study, prasinophytes were concentrated in the northwest of the study area where nutrient was enriched the most in both the seasons (Figures 2E–J, 3G, H). As described in section 4.2, in addition to nutrients, phytoplankton community structure also depends on biological factors (grazing of shellfish) in high-density shellfish culture area. Cloern (1982) suggested that phytoplankton is much more controlled by shellfish feeding than by nutrients concentration, indicating that the phytoplankton community structure in oyster culture area of QZB was mainly affected by oyster feeding rather than by high nutrient concentration. Therefore, the long-term size-selective filtration of shellfish stimulated the small-size phytoplankton growth in QZB.
Mesocosm experiments (Yvon-Durocher et al., 2011; Peter and Sommer, 2015) and field investigations (Morán et al., 2010) have confirmed a tendency toward smaller size at higher temperatures for different phytoplankton groups, include diatoms, picophytoplankton (Prochlorococcus, Synechococcus, and picoeukaryotes), and chlorophytes. The water temperature in QZB was up from 1983 to 2003 (He and Wei, 2010), possibly indicating warming in QZB as well under climate change. Moreover, thermal discharge may potentially accelerated the warming trend in QZB. We inferred that increased dominance of small-sized diatoms in QZB is closely related to size-selective grazing of oyster and increased warming. It is noteworthy that the biomass and proportion of cyanobacteria may also increase in the future driven by these two factors. Overall, size-selective grazing of oyster farming and warming might the main reasons causing phytoplankton miniaturization in QZB, especially in oyster culture area.
5 Conclusions
The microscopy and HPLC-CHEMTAX was combined to obtain complete information about species composition and spatial distribution of entire phytoplankton community in QZB. Microscopy analysis revealed that diatoms were absolute dominant group in summer and winter, 2021, followed by dinoflagellates. As a complementary method, HPLC-CHEMTAX detected other small-size flagellates and cyanobacteria, of which prasinophytes and cryptophytes were important groups in winter. This study confirms our hypothesis that the spatiotemporal distributions of various phytoplankton groups were affected by physicochemical factor and size-selective grazing of shellfish. High temperature and adequate nutrients in summer could promote the algal blooms of Skeletonema costatum. A high grazing pressure of shellfish and low temperature were the driving force to the prevalence of prasinophytes in the winter. The distribution of cryptophytes was related to the location of estuary. Driven by high temperature, cyanobacteria (mainly Synechococcus) thrived in summer while declined in winter. In addition, the negative impact of thermal discharge on phytoplankton occurred mainly in winter. Compared with previous reports, the proportion of small-sized flagellates has been increased over the past decade. The change of phytoplankton taxonomic structure may be related to the eutrophication of QZB, phytoplankton miniaturization was largely regulated by grazing of oyster and climate warming. The microscopy derived cell abundances and CHEMTAX analysis information for diatoms and dinoflagellates were in good agreement. Microscopy provided accurate species information for large cells, while HPLC-CHEMTAX provided detailed data of small-sized phytoplankton groups. However, no single technique is ideal for the investigation of the structure and dynamics of phytoplankton community. We suggest that in future, research should combine CHEMTAX estimates with microscopic counting to improve the long-term understanding of phytoplankton community dynamic in QZB.
Data availability statement
The raw data supporting the conclusions of this article will be made available by the authors, without undue reservation.
Author contributions
HP, MX and JLai wrote the original manuscript. CL, JM, JLi and JLu attended the experiments and took part in the data analysis. All authors contributed to the article and approved the submitted version.
Funding
This study was funded by the Guangxi Special Fund Project for Local Science and Technology Development Guided by the Central Government (No.ZY21195027) and the Science and Technology Major Project of Guangxi (No. AA17202020).
Acknowledgments
The authors wish to thank Mr. B. J. Meng and Miss L. T. Huang, L. W. Chen, Q. Q. Liang who provide assistance in sample collection during field investigations.
Conflict of interest
The authors declare that the research was conducted in the absence of any commercial or financial relationships that could be construed as a potential conflict of interest.
Publisher’s note
All claims expressed in this article are solely those of the authors and do not necessarily represent those of their affiliated organizations, or those of the publisher, the editors and the reviewers. Any product that may be evaluated in this article, or claim that may be made by its manufacturer, is not guaranteed or endorsed by the publisher.
Supplementary material
The Supplementary Material for this article can be found online at: https://www.frontiersin.org/articles/10.3389/fmars.2023.1186106/full#supplementary-material
References
Agirbas E., Feyzioglu A. M., Kopuz U., Llewellyn C. A. (2015). Phytoplankton community composition in the south-eastern black Sea determined with pigments measured by HPLC-CHEMTAX analyses and microscopy cell counts. J. Mar. Biol. Assoc. United Kingdom 95 (1), 35–52. doi: 10.1017/S0025315414001040
Arhonditsis G. B., Stow C. A., Paerl H. W., Valdes-Weaver L. M., Steinberg L. J., Reckhow K. H. (2007). Delineation of the role of nutrient dynamics and hydrologic forcing on phytoplankton patterns along a freshwater-marine continuum. Ecol. Model. 208 (2-4), 230–246. doi: 10.1016/J.ECOLMODEL.2007.06.010
Balode M., Purina I., Beéchemin C. H., Maestrini S. (1998). Effects of nutrient enrichment on the growth rates and community structure of summer phytoplankton from the gulf of Riga, Baltic Sea. J. Plankton Res. 20 (12), 2251–2272. doi: 10.1093/PLANKT/20.12.2251
Barlow R. G., Aiken J., Moore G. F., Holligan P. M., Lavender S. (2004). Pigment adaptations in surface phytoplankton along the eastern boundary of the Atlantic ocean. Mar. Ecol. Prog. Ser. 281, 13–26. doi: 10.3354/MEPS281013
Brito A. C., Moita T., Gameiro C., Silva T., Anselmo T., Brotas V. (2015a). Changes in the phytoplankton composition in a temperate estuarine system, (1960 to 2010). Estuaries Coasts 38 (5), 1678–1691. doi: 10.1007/s12237-014-9900-8
Brito A. C., Sá C., Mendes C. R., Brand T., Dias A. M., Brotas V., et al. (2015b). Structure of late summer phytoplankton community in the firth of lorn (Scotland) using microscopy and HPLC-CHEMTAX. Estuarine Coast. Shelf Sci. 167, 86–101. doi: 10.1016/J.ECSS.2015.07.006
Cao Z. Y., Bao M., Guan W. B., Chen Q. (2019). Water-mass evolution and the seasonal change in northeast of the beibu gulf, China. Oceanologia Limnologia Sin. 50 (3), 532–542. doi: 10.11693/hyhz20190100007
Cao X. F., Chen B., Xing C. X., Yu J. W., Gao J. S., Xu Z. X., et al. (2019). Study on the influence of summer wave on water exchange capacity in qinzhou bay of China. Guangxi Sci. 26 (6), 647–654. doi: 10.13656/j.cnki.gxkx.20191231.005
Charlson R. J., Lovelock J. E., Andreae M. O., Warren S. G. (1987). Oceanic phytoplankton, atmospheric sulphur, cloud albedo and climate. Nature 326 (6114), 655–661. doi: 10.1038/326655a0
Chen C. Y. (1989). Preliminary investigation of phytoplankton in qinzhou bay. Res. Dev. South China Sea (4), 32–37.
Chen Y., Gao Y., Chen C., Liang J., Sun L., Zhen Y, et al. (2016). Seasonal variations of phytoplankton assemblages and its relation to environmental variables in a scallop culture sea area of bohai bay, China. Mar. pollut. Bull. 113 (1-2), 362–370. doi: 10.1016/j.marpolbul.2016.10.025
Chen Q. M., Huang F. M., Lin J. (2016). Marine spatial planning for estuary of jingu river in guangxi. Ocean Dev. Manage. 2), 63–66. doi: 10.20016/j.cnki.hykfygl.2016.02.012
Chen B., Shi M. C. (2019). Advances in study of beibu gulf circulation. Guangxi Sciences 26 (6), 595–603. doi: 10.13656/j.cnki.gxkx.20200103.001
Chin T. G., Chen C. F., Liu S. C., Wu S. S. (1965). Influence of temperature and salinity on the growth of three species of planktonic diatoms. Oceanologia Et Limnologia Sin. 7 (4), 373–384
Cloern J. E. (1982). Does the benthos control phytoplankton biomass in south San Francisco bay? Mar. Ecol. Prog. Ser. 9 (2), 191–202. doi: 10.3354/meps009191
Cranford P. J., Li W., Strand Ø., Strohmeier T. (2008). Phytoplankton depletion by mussel aquaculture: high resolution mapping, ecosystem modeling and potential indicators of ecological carrying capacity. ICES CM Doc. H. 12, 1–5.
Davidson K., Cunningham A., Flynn K. J. (1993). Modelling temporal decoupling between biomass and numbers during the transient nitrogen-limited growth of a marine phytoflagellate. J. Plankton Res. 15 (3), 351–359. doi: 10.1093/PLANKT/15.3.351
Davidson K., Flynn K. J., Cunningham A. (1992). Non-steady state ammonium-limited growth of the marine phytoflagellate, isochrysis galbana parke. New Phytol. 122 (3), 433–438. doi: 10.1111/J.1469-8137.1992.TB00070.X
Dong D. X., Li Y., Chen X. Y., Chen B., Xu M. B. (2014). Characteristics of current seasonal changes in qinzhou bay. Guangxi Sci. 21 (4), 351–356. doi: 10.13656/j.cnki.gxkx.2014.04.006
Dupuy C., Vaquer A., Lam-Höai T., Rougier C., Mazouni N., Collos Y., et al. (2000). Feeding rate of the oyster crassostrea gigas in a natural planktonic community of the Mediterranean thau lagoon. Mar. Ecol. Prog. Ser. 205, 171–184. doi: 10.3354/MEPS205171
Egge E. S., Johannessen T. V., Andersen T., Eikrem W., Bittner L., Larsen A., et al. (2015). Seasonal diversity and dynamics of haptophytes in the s kagerrak, n orway, explored by high-throughput sequencing. Mol. Ecol. 24 (12), 3026–3042. doi: 10.1111/mec.13160
Eker-Develi E., Berthon J. F., Linde D. V. D. (2008). Phytoplankton class determination by microscopic and HPLC-CHEMTAX analyses in the southern Baltic Sea. Mar. Ecol. Prog. Ser. 359 (1), 69–87. doi: 10.3354/MEPS07319
González-García C., Forja J. M., González-Cabrera M. C., Jiménez M. P., Lubián L. M. (2018). Annual variations of total and fractionated chlorophyll and phytoplankton groups in the gulf of cadiz. Sci. total Environ. 613-614, 1551–1565. doi: 10.1016/j.scitotenv.2017.08.292
He B. M., Wei M. X. (2010). Change trend of water environment indices in qinzhou bay in 20 years VII:Quantitative change of water temperature,salinity and pH and effect of entironment. Mar. Environ. Sci. 29 (1), 51–55. doi: 10.3969/j.issn.1007-6336.2010.01.011
Irigoien X., Meyer B., Harris R., Harbour D. (2004). Using HPLC pigment analysis to investigate phytoplankton taxonomy: the importance of knowing your species. Helgoland Mar. Res. 58 (2), 77–82. doi: 10.1007/s10152-004-0171-9
Jiang F. J., Chen B., He B. J., Xu M. B., Zhuang J. L., Zhang R. C., et al. (2012). Phytoplankton community in coastal waters of qinzhou bay in guangxi. Guangxi Sci. 19 (3), 268–275. doi: 10.13656/j.cnki.gxkx.2012.03.023
Jiang T., Chen F., Yu Z., Lu L., Wang Z. (2016). Size-dependent depletion and community disturbance of phytoplankton under intensive oyster mariculture based on HPLC pigment analysis in daya bay, south China Sea. Environ. pollut. 219, 804–814. doi: 10.1016/j.envpol.2016.07.058
Jiang Z., Du P., Liao Y., Liu Q., Chen Q., Shou L., et al. (2019a). Oyster farming control on phytoplankton bloom promoted by thermal discharge from a power plant in a eutrophic, semi-enclosed bay. Water Res. 159, 1–9. doi: 10.1016/J.WATRES.2019.04.023
Jiang Z., Du P., Liu J., Chen Y., Zhu Y., Shou L., et al. (2019b). Phytoplankton biomass and size structure in xiangshan bay, China: current state and historical comparison under accelerated eutrophication and warming. Mar. pollut. Bull. 142, 119–128. doi: 10.1016/J.MARPOLBUL.2019.03.013
Jiang T., Wang L., Zhang F., Fang X. (2019). Selective feeding of bay scallop argopecten irradians on phytoplankton community revealed by HPLC analysis of phytopigments in bohai Sea, China. J. Oceanol Limnol 37 (5), 1747–1755. doi: 10.1007/s00343-019-8280-0
Jiang Z. B., Zeng J. N., Chen Q. Z., Liao Y. B., Shou L., Xu X. Q., et al. (2008). Dynamic change of phytoplankton cell density after thermal shock and chlorination in a subtropical bay in China. J. Plant Ecol. 32 (6), 1386–1396. doi: 10.3773/j.issn.1005-264x.2008.06.020
Lai J. S. (2013). Canoco 5: a new version of an ecological multivariate data ordination program. Biodiversity Sci. 21 (6), 765–768. doi: 10.3724/SP.J.1003.2013.04133
Lai J. X., Ke K., Jiang F. J., Xu M. B., Chen X. Y., Chen B. (2013). Nutrient distribution and eutrophication assessment in qinzhou bay and its adjacent areas guangxi, China. Mar. Environ. Sci. 32 (6), 860–866
Lan W. L. (2012). Eutrophication assessment and its variation trends during dry season of last five years in the qinzhou bay. Environ. Monit. China 28 (5), 40–44. doi: 10.19316/j.issn.1002-6002.2012.05.009
Lan W. L., Li M. M., Li T. S. (2013). Phytoplankton community structure based on pigment composition in qinzhou bay during average water period. Acta Ecologica Sin. 33 (20), 6595–6603. doi: 10.5846/stxb201302260301
Lan W. L., Li T. S., Zheng X. Q., Shi X. F., Li M. M., Lu J. J., et al. (2014). The structure and distribution of phytoplankton community in the qinzhou bay during dry season. Acta Oceanologica Sin. 36 (8), 122–129. doi: 10.3969/j.issn.0253-4193.2014.08.014
Lan W. L., Wang X. H., Li M. M. (2011). Phytoplankton community structure in qinzhou bay during flood season by analysis of HPLC photosynthetic pigment signatures. Acta Ecologica Sin. 31 (13), 3601–3608.
Li M. M., Tan K. Y., Huang J. H., Xie L. L. (2022). Seasonal variation of water masses and current field in the northeastern beibu gulf based on observations in 2018-2019. J. Mar. Sci. 40 (3), 73–85. doi: 10.3969/j.issn.1001-909X.2022.03.007
Liu L., Li Y., Sun P., Wang Z. L., Xin M. (2020). Seasonal changes of phytoplankton community structure and its influencing factors in qinzhou bay. Mar. Environ. Sci. 39 (5), 776–790. doi: 10.13634/j.cnki.mes.2020.05.017
Luo X., Lan W. L., Li T. S., Li M. M. (2019). Distribution of phytoplankton and its relationship with environmental factors in the qinzhou bay in spring and summer. Acta Ecologica Sin. 39 (7), 2603–2613. doi: 10.13656/j.cnki.gxkx.2012.03.023
Lyu H., Zhang S. F., Song D. H., Bao X. W. (2021). The cummulative effect of land reclamation on hydrodynamics in qinzhou bay. Oceanologia Limnologia Sin. 52 (4), 823–833. doi: 10.11693/hyhz20201200342
Mackey M. D., Mackey D. J., Higgins H. W., Wright S. W. (1996). CHEMTAX-a program for estimating class abundances from chemical markers: application to HPLC measurements of phytoplankton. Mar. Ecol. Prog. Ser. 144 (1), 265–283. doi: 10.3354/meps144265
Mendes C. R. B., Tavano V. M., Leal M. C., de Souza M. S., Brotas V., Garcia C. A. E. (2013). Shifts in the dominance between diatoms and cryptophytes during three late summers in the bransfield strait (Antarctic peninsula). Polar Biol. 36 (4), 537–547. doi: 10.1007/s00300-012-1282-4
Mo Y., Long H., Lan W. L., Xu S. L., Li T. S. (2017). Distribution of size-fractional chlorophyll a and its controlling factors during dry and wet seasons in qinzhou bay. Mar. Environ. Sci. 36 (3), 434–440. doi: 10.13634/j.cnki.mes.2017.03.018
Morán X. A., Lopez-Urrutia A., Calvo-Díaz A., Li W. (2010). Increasing importance of small phytoplankton in a warmer ocean. Global Change Biol. 16, 1137–1144. doi: 10.1111/j.1365-2486.2009.01960.x
Not F., Latasa M., Marie D., Cariou T., Vaulot D., Simon N. (2004). A single species, Micromonas pusilla (Prasinophyceae), dominates the eukaryotic picoplankton in the Western English channel. Appl. Environ. Microbiol. 70 (7), 4064–4072. doi: 10.1128/AEM.70.7.4064-4072.2004
Paerl H. W., Valdes L. M., Pinckney J. L., Piehler M. F., Dyble J., Moisander P. H. (2003). Phytoplankton photopigments as indicators of estuarine and coastal eutrophication. Bioscience 53 (10), 953–964. doi: 10.1641/0006-3568(2003)053[0953:PPAIOE]2.0.CO;2
Pan H., Li A., Cui Z., Ding D., Qu K., Zheng Y., et al. (2020). A comparative study of phytoplankton community structure and biomass determined by HPLC-CHEMTAX and microscopic methods during summer and autumn in the central bohai Sea, China. Mar. pollut. Bull. 155, 111172. doi: 10.1016/j.marpolbul.2020.111172
Pan H. Z., Xu M. B., Lai J. J., Lan C. B., Ma J. X. (2022). Phytoplankton community structure based on HPLC pigment analysis in qinzhou bay during winter. Guangxi Sci. doi: 10.13656/j.cnki.gxkx.20220609.001
Peng Y., Yu Z., Deng C., Liu S., Zhen Y. (2010). Spatialtemporal distribution of phytoplankton pigments in relation to nutrient status in jiaozhou bay, China. Estuarine Coast. Shelf Sci. 89 (3), 234–244. doi: 10.1016/J.ECSS.2010.07.003
Peter K. H., Sommer U. (2015). Interactive effect of warming, nitrogen and phosphorus limitation on phytoplankton cell size. Ecol. Evol. 5, 1011–1024. doi: 10.1002/ece3.1241
Qin X. L., Lai J. X., Chen B., Jiang F. J., Xu M. B. (2016). Molecular identification of phaeocystis from beibu gulf based on 18S rDNA sequences. J. Trop. Subtropical Bot. 24 (2), 176–181. doi: 10.11926/j.issn.1005-3395.2016.02.008
Rajaneesh K. M., Mitbavkar S. (2013). Factors controlling the temporal and spatial variations in synechococcus abundance in a monsoonal estuary. Mar. Environ. Res. 92, 133–143. doi: 10.1016/j.marenvres.2013.09.010
Sabetta L., Basset A., Spezie G. (2008). Marine phytoplankton size-frequency distributions: spatial patterns and decoding mechanisms. Estuarine Coast. Shelf Sci. 80 (1), 181–192. doi: 10.1016/J.ECSS.2008.07.021
Safi K. A., Gibbs M. M. (2003). Importance of different size classes of phytoplankton in beatrix bay, Marlborough sounds, new Zealand, and the potential implications for the aquaculture of the mussel, perna canaliculus. New Z. J. Mar. Freshw. Res. 37, 267–272. doi: 10.1080/00288330.2003.9517164
Sarmiento J. L., Toggweiler J. R., Najjar R. (1988). Ocean carbon-cycle dynamics and atmospheric pCO2. Philos. Trans. R. Soc. London. Ser. A Math. Phys. Sci. 325 (1583), 3–21. doi: 10.1098/rsta.1988.0039
Sathyendranath S., Gouveia A. D., Shetye S. R., Ravindran P., Platt T. (1991). Biological control of surface temperature in the Arabian Sea. Nature 349 (6304), 54–56. doi: 10.1038/349054A0
Seoane S., Garmendia M., Revilla M., Borja Á., Franco J., Orive E., et al. (2011). Phytoplankton pigments and epifluorescence microscopy as tools for ecological status assessment in coastal and estuarine waters, within the water framework directive. Mar. pollut. Bull. 62 (7), 1484–1497. doi: 10.1016/j.marpolbul.2011.04.010
Shen P. P., Qi Y. Z., Ou L. J. (2018). Phaeocystis globosa in coastal China: taxonomy, distribution, and its blooms. Mar. Sci. 42 (10), 146–162. doi: 10.11759/hykx20171225004
Strickland J. D. H., Parsons T. R. (1972). A practical handbook of seawater analysis. Bulletin 167, 45–131.
Su Q. Z., Lei X. T., Liu G. Q., Sun Y., Lao Q. B., Sun T. L. (2022). Characteristics of red tide disaster in coastal waters of beibu gulf of guangxi in recent 20 years. Guangxi Sci. 29 (3), 552–557. doi: 10.13656/j.cnki.gxkx.20220720.018
Utermöhl H. (1958). Zur vervollkommnung der quantitativen phytoplankton-methodik. Mitt. Internat. Verein. Limnol. 9, 1–38. doi: 10.1080/05384680.1958.11904091
Vaquer A., Troussellier M., Courties C., Bident B. (1996). Standing stock and dynamics of picophytoplankton in the thau lagoon (northwest Mediterranean coast). Limnol Oceanography 41 (8), 1821–1828. doi: 10.4319/LO.1996.41.8.1821
Wang D., Chen P. M., Lu J. J., Ma Y. (2013). Annual changes of phytoplankton's ecological features in qinzhou bay of south China. Chin. J. Appl. Ecol. 24 (6), 1686–1692. doi: 10.13287/j.1001-9332.2013.0360
Wang L., Huang B., Liu X., Xiao W. (2015). The modification and optimizing of the CHEMTAX running in the south China Sea. Acta Oceanologica Sin. 34 (2), 124–131. doi: 10.1007/s13131-015-0621-z
Wang L., Ou L., Huang K., Chai C., Wang Z., Wang X., et al. (2018). Determination of the spatial and temporal variability of phytoplankton community structure in daya bay via HPLC-CHEMTAX pigment analysis. J. Oceanol Limnol 36 (3), 750–760. doi: 10.1007/s00343-018-7103-z
Ward J. E., Shumway S. E. (2004). Separating the grain from the chaff: particle selection in suspension- and deposit-feeding bivalves. J. Exp. Mar. Biol. Ecol. 300 (1-2), 83–130. doi: 10.1016/J.JEMBE.2004.03.002
Wei M. X., He B. M. (2008). Change trend of water environmental index in last 20 a of qinzhou bay V.Biomass distribution of phytoplankton and effect factors. Mar. Environ. Sci. 27 (3), 253–257. doi: 10.3969/j.issn.1007-6336.2008.03.014
Wei M. X., Lai T. H., Mao H. B. (2002). Change trend of the chemical items in qinzhou bay in the last twenty years I nutrient condition in usual discharged period. Mar. Environ. Sci. 21 (3), 49–52. doi: 10.3969/j.issn.1007-6336.2002.03.011
Wright S. W., Ishikawa A., Marchant H. J., Davidson A. T., Enden R. L. V. D., Nash G. V. (2009). Composition and significance of picophytoplankton in Antarctic waters. Polar Biol. 32 (5), 797–808. doi: 10.1007/s00300-009-0582-9
Wright S. W., Thomas D. P., Marchant H. J., Higgins H. W., Mackey M. D., Mackey D. J. (1996). Analysis of phytoplankton of the Australian sector of the southern ocean: comparisons of microscopy and size frequency data with interpretations of pigment HPLC data using the\'CHEMTAX\'matrix factorisation program. Mar. Ecol. Prog. Ser. 144, 285–298. doi: 10.3354/MEPS144285
Xia H. Y., Li S. H., Shi M. C. (2001). A 3-d numerical simulation of wind-driven currents in the beibu gulf. Acta Oceanologica Sin. 23 (6), 11–23. doi: 10.3321/j.issn:0253-4193.2001.06.002
Xu X., Yu Z., He L., Cheng F., Cao X., Song X. (2017). Nano- and microphytoplankton community characteristics in brown tide bloom-prone waters of the qinhuangdao coast, bohai Sea, China. Sci. China Earth Sci. 60 (6), 1189–1200. doi: 10.1007/s11430-017-9036-0
Yang B., Fang H. Y., Zhong Q. P., Zhang C., Li S. P. (2012). Distribution characteristics of nutrients and eutrophication assessment in summer in qinzhou bay. Mar. Sci. Bull. 31 (6), 640–645. doi: 10.11840/j.issn.1001-6392.2012.6.007
Yvon-Durocher G., Montoya J. M., Trimmer M., Woodward G. (2011). Warming alters the size spectrum and shifts the distribution of biomass in freshwater ecosystems. Global Change Biol. 17, 1681–1694. doi: 10.1111/j.1365-2486.2010.02321.x
Zapata M., Rodríguez F., Garrido J. L. (2000). Separation of chlorophylls and carotenoids from marine phytoplankton: a new HPLC method using a reversed phase C8 column and pyridine-containing mobile phases. Mar. Ecol. Prog. Ser. 195, 29–45. doi: 10.3354/MEPS195029
Keywords: phytoplankton, pigments, environmental factor, HPLC-CHEMTAX, microscopy, Qinzhou Bay
Citation: Pan H, Xu M, Lan C, Ma J, Li J, Lu J and Lai J (2023) Determination of phytoplankton community structure and biomass with HPLC-CHEMTAX and microscopic methods during winter and summer in the Qinzhou Bay of the Beibu Gulf. Front. Mar. Sci. 10:1186106. doi: 10.3389/fmars.2023.1186106
Received: 14 March 2023; Accepted: 28 April 2023;
Published: 15 May 2023.
Edited by:
Peng Lin, University of Georgia, United StatesReviewed by:
Zhibing Jiang, Ministry of Natural Resources, ChinaYongquan Yuan, Chinese Academy of Sciences (CAS), China
Copyright © 2023 Pan, Xu, Lan, Ma, Li, Lu and Lai. This is an open-access article distributed under the terms of the Creative Commons Attribution License (CC BY). The use, distribution or reproduction in other forums is permitted, provided the original author(s) and the copyright owner(s) are credited and that the original publication in this journal is cited, in accordance with accepted academic practice. No use, distribution or reproduction is permitted which does not comply with these terms.
*Correspondence: Junxiang Lai, anhsYWlAZ3hhcy5jbg==